california department of insurance data analytics and ... · discontinuance of a particular...
TRANSCRIPT
California Department of Insurance Data Analytics and Reporting
2015 Commissioner’s Report on Underserved Communities
Experience Years 2010 - 2014
CONTENTS
Introduction i
About this Report 1-5
Contact/Definitions 6
Table A - ZIP Codes in “Underserved” Communities 7-10
Table B - Summary Statistics
• Real & Personal Property 11 • Private Passenger Auto 12
Table C - Total Earned Exposure
• Section 1 – Real & Personal Property 13-27• Section 2 – Private Passenger Auto 28-41
Table D - Service Office Data
• Personal Business Data 42-53
2015 Commissioner’s Report on “Underserved” Communities California Department of Insurance Data Analytics and Reporting Experience Years 2010 - 2014
i INTRODUCTION
The Community Service Statement under California Code of Regulations (CCR) Section 2646.6 has the purpose of addressing the issue of insurance availability in “underserved” communities and of promoting anti-discrimination so that all have equal access to insurance coverage in California.
The regulations require the California Department of Insurance to collect and analyze data from home, personal auto, commercial multiple peril and commercial fire insurers that write in California for all ZIP codes and report on those that are considered as “underserved”. However, due to changes in reporting methodology that caused inconsistencies, the commercial data was excluded from this report.
The reports included herein only focused on the lines of business listed below:
1) Line 1- Fire2) Line 4- Homeowners Multiple Peril3) Line 19.2 - Private Passenger Automobile Liability
The report is a 5-year compilation of “earned exposures” and the number of service offices that includes the number of Claims, Sales and/or Agency offices by individual or group insurer in the “underserved” areas. It measures the percentage that the “underserved” represents to the total for the state.
There are 145 communities in California that are considered “underserved” as defined herein.
2015 Commissioner’s Report on “Underserved” Communities California Department of Insurance Data Analytics and Reporting Experience Years 2010 - 2014
1 ABOUT THIS REPORT
This report consists of four tables (Tables A through D):
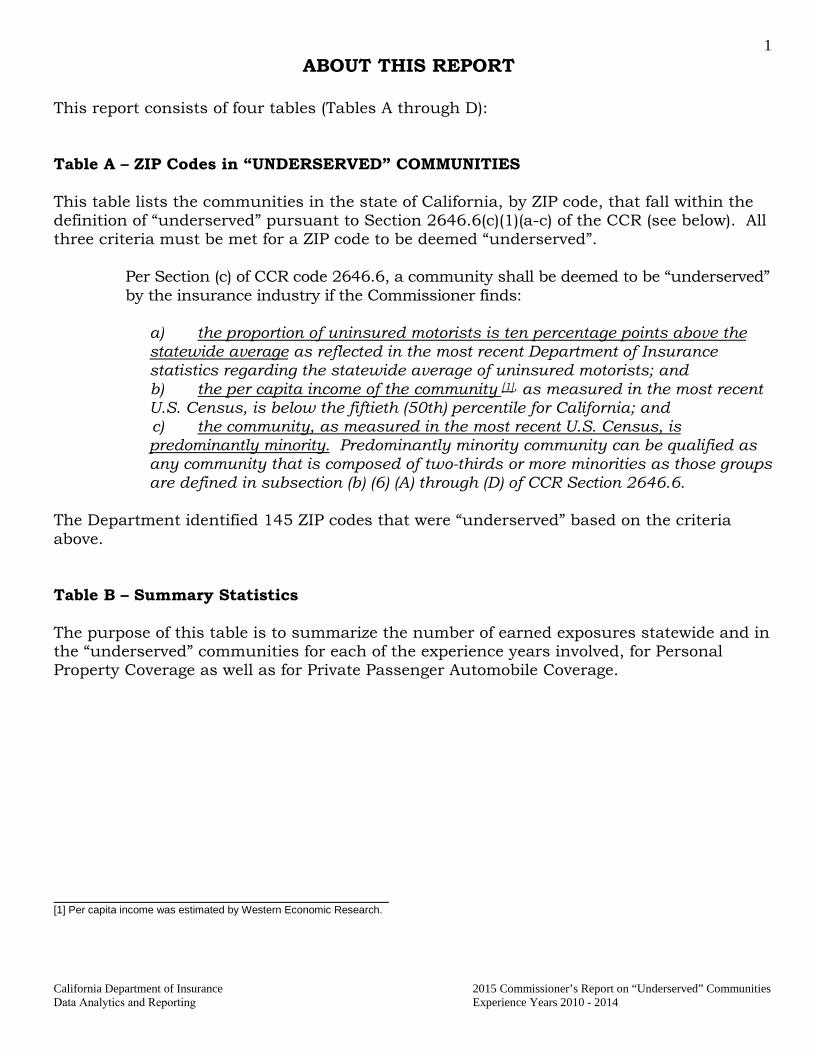
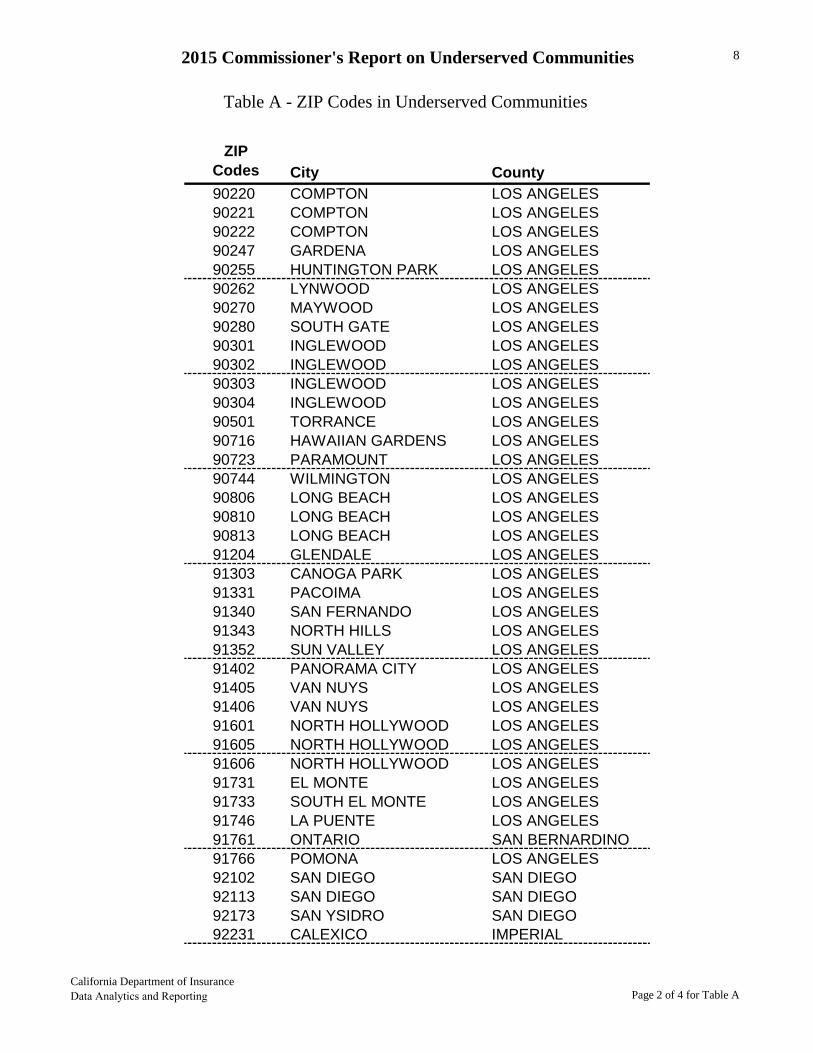
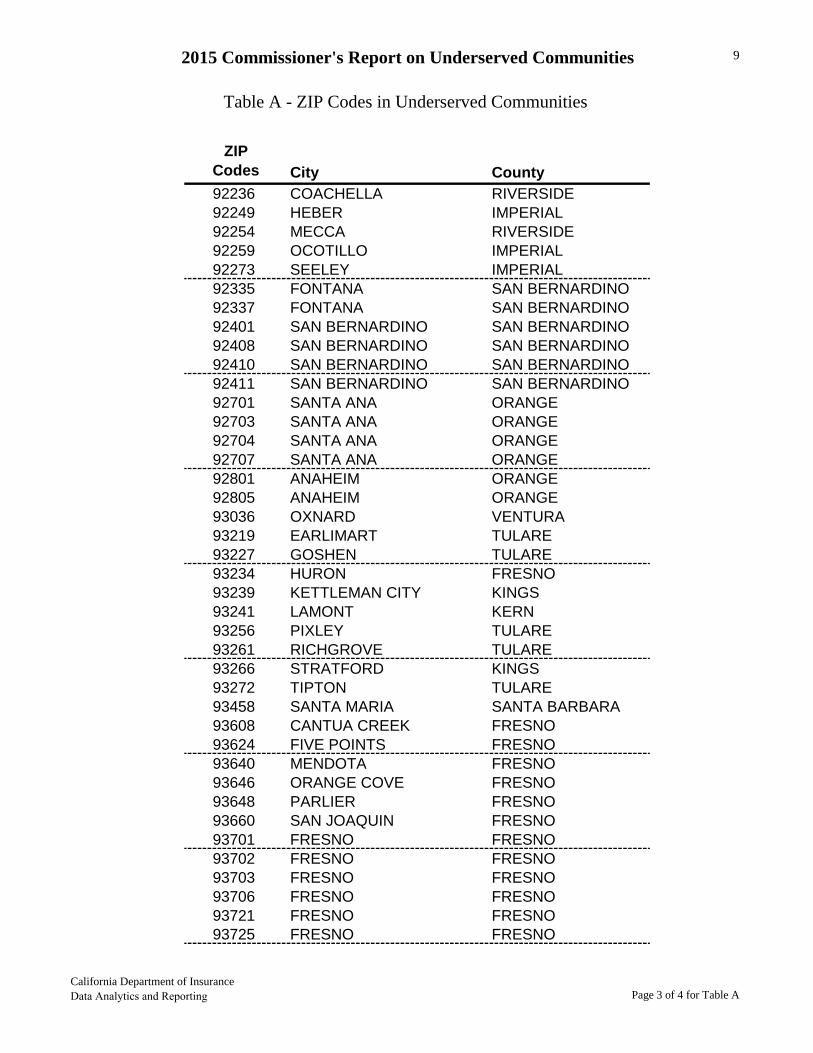
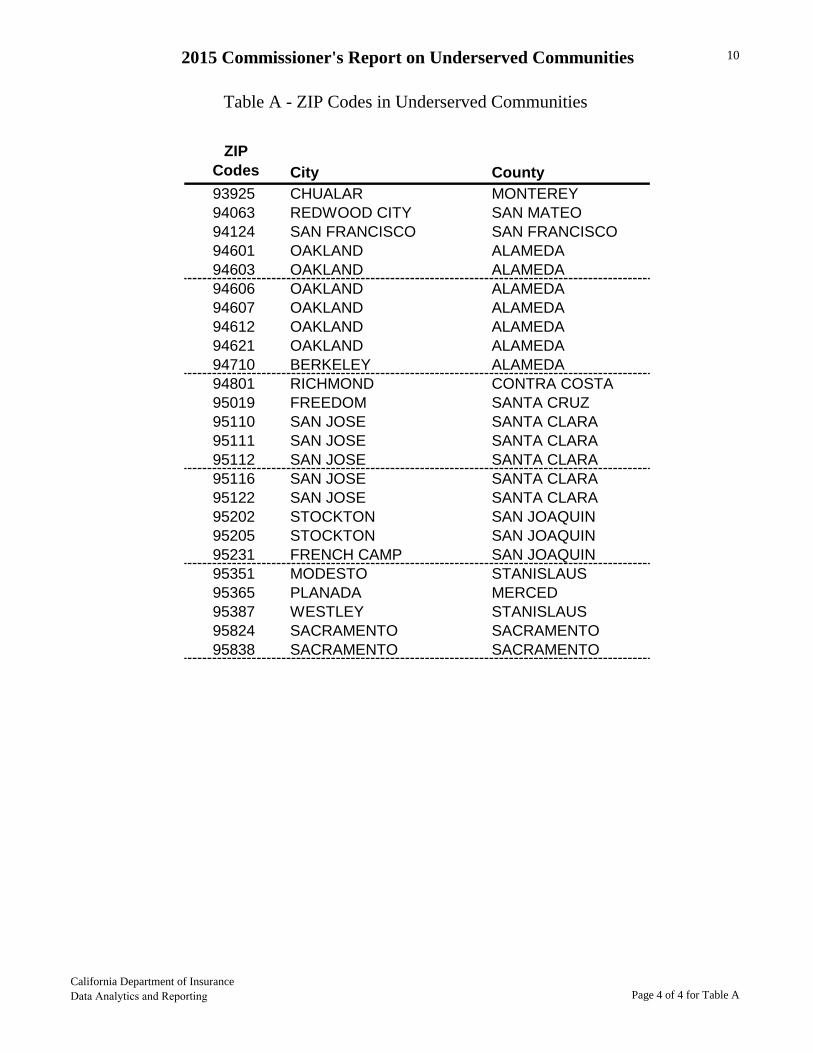
Table A – ZIP Codes in “UNDERSERVED” COMMUNITIES
This table lists the communities in the state of California, by ZIP code, that fall within the definition of “underserved” pursuant to Section 2646.6(c)(1)(a-c) of the CCR (see below). All three criteria must be met for a ZIP code to be deemed “underserved”.
Per Section (c) of CCR code 2646.6, a community shall be deemed to be “underserved” by the insurance industry if the Commissioner finds:
a) the proportion of uninsured motorists is ten percentage points above the statewide average as reflected in the most recent Department of Insurance statistics regarding the statewide average of uninsured motorists; andb) the per capita income of the community [1], as measured in the most recent U.S. Census, is below the fiftieth (50th) percentile for California; andc) the community, as measured in the most recent U.S. Census, is predominantly minority. Predominantly minority community can be qualified as any community that is composed of two-thirds or more minorities as those groups are defined in subsection (b) (6) (A) through (D) of CCR Section 2646.6.
The Department identified 145 ZIP codes that were “underserved” based on the criteria above.
Table B – Summary Statistics
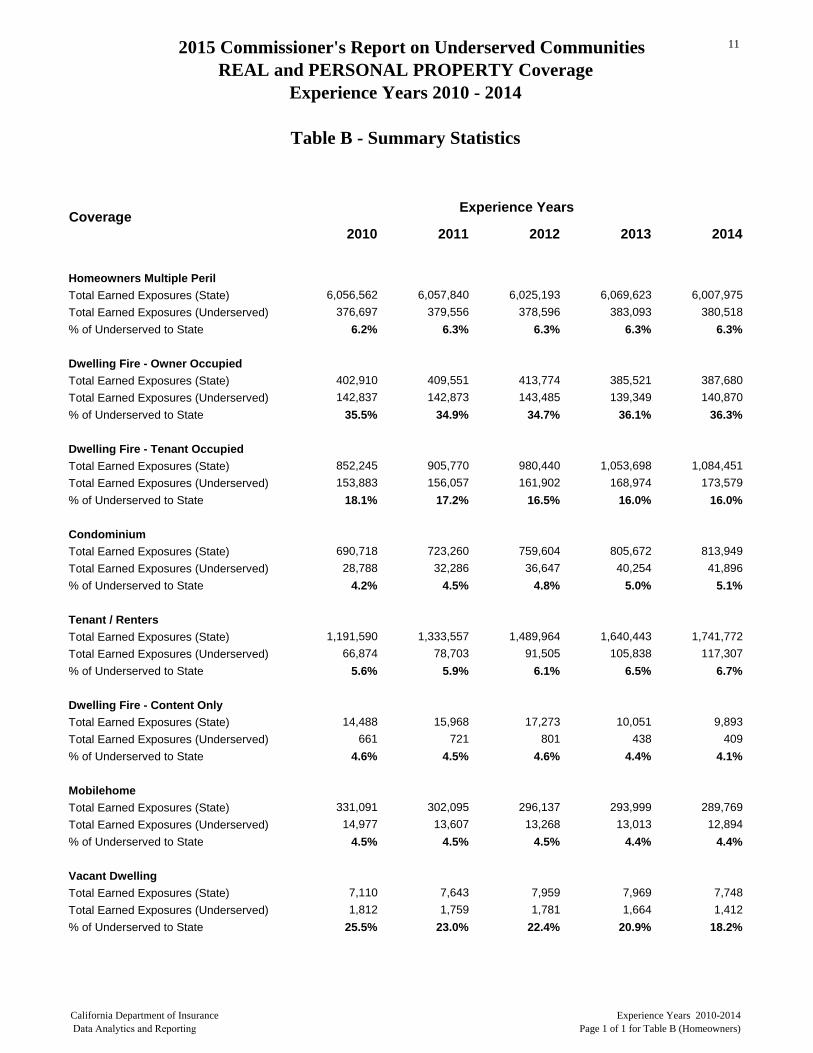
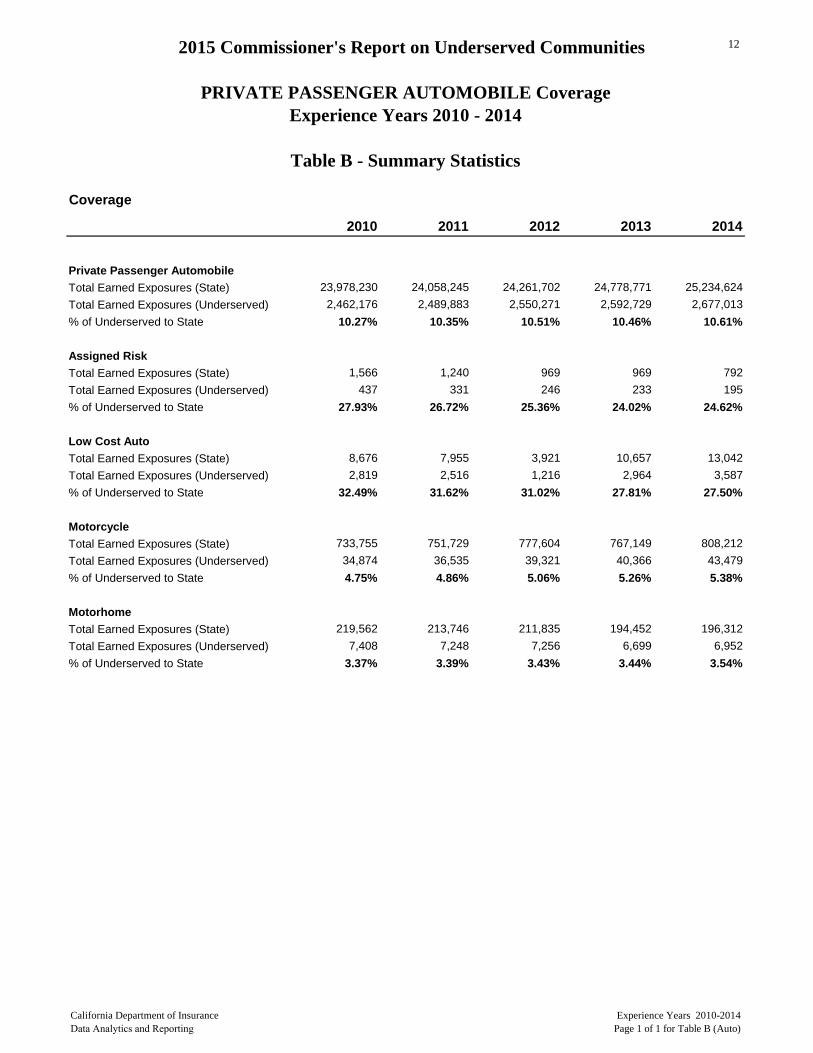
The purpose of this table is to summarize the number of earned exposures statewide and in the “underserved” communities for each of the experience years involved, for Personal Property Coverage as well as for Private Passenger Automobile Coverage.
[1] Per capita income was estimated by Western Economic Research.
2015 Commissioner’s Report on “Underserved” Communities California Department of Insurance Data Analytics and Reporting Experience Years 2010 - 2014
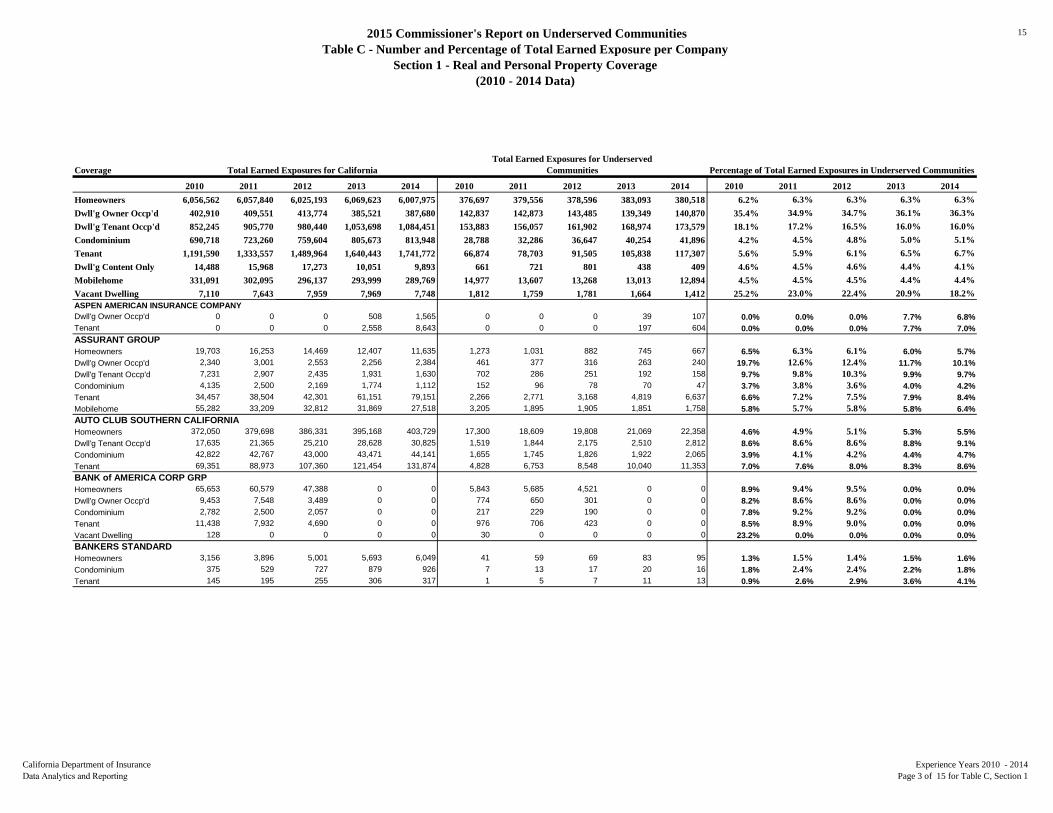
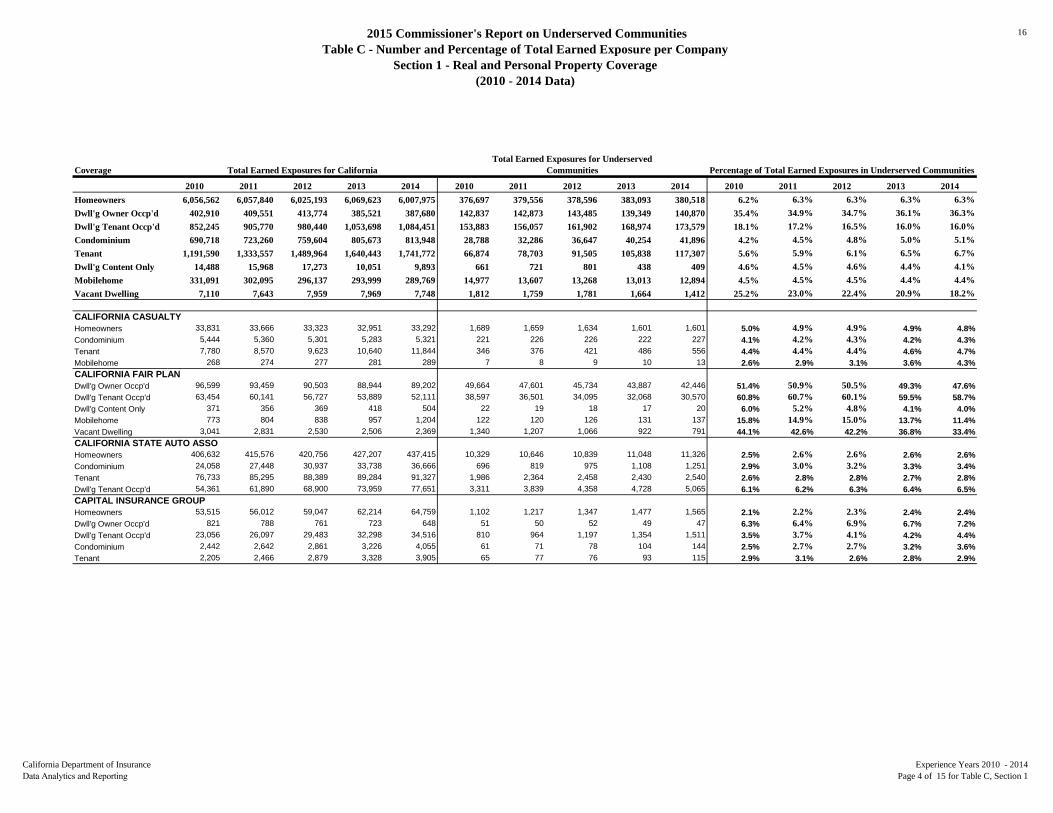
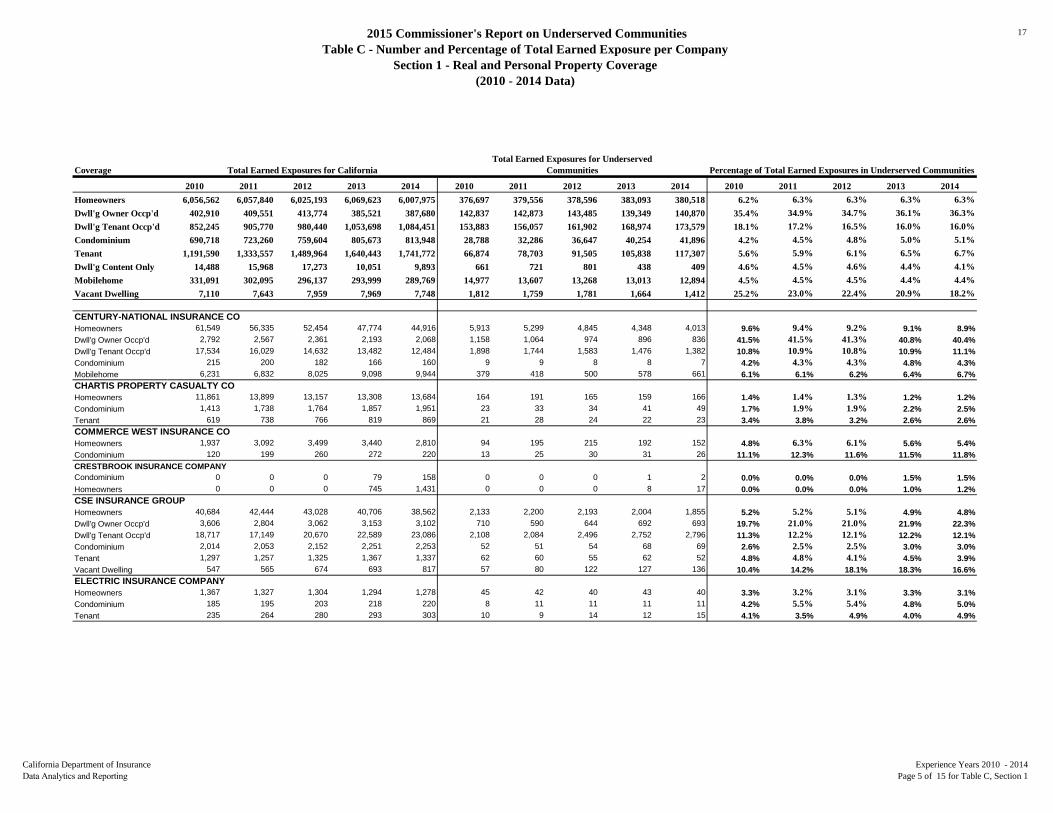
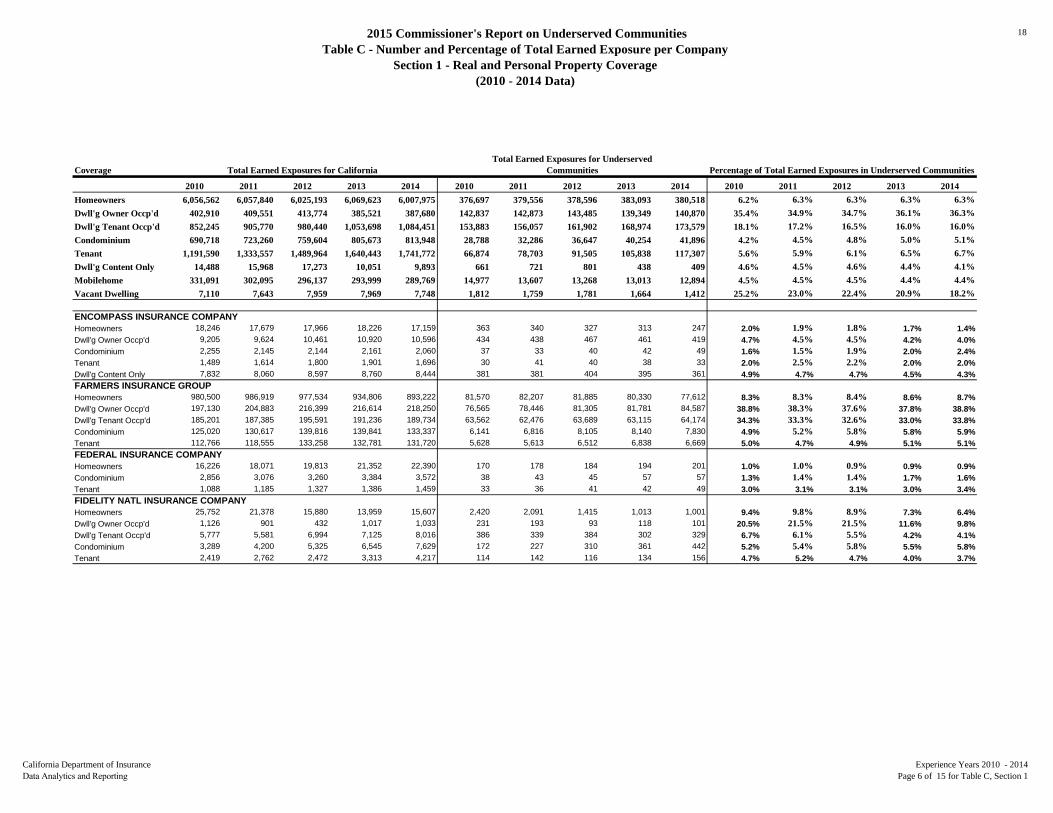
2 Table C – Number and Percentage of Total Earned Exposure per Company
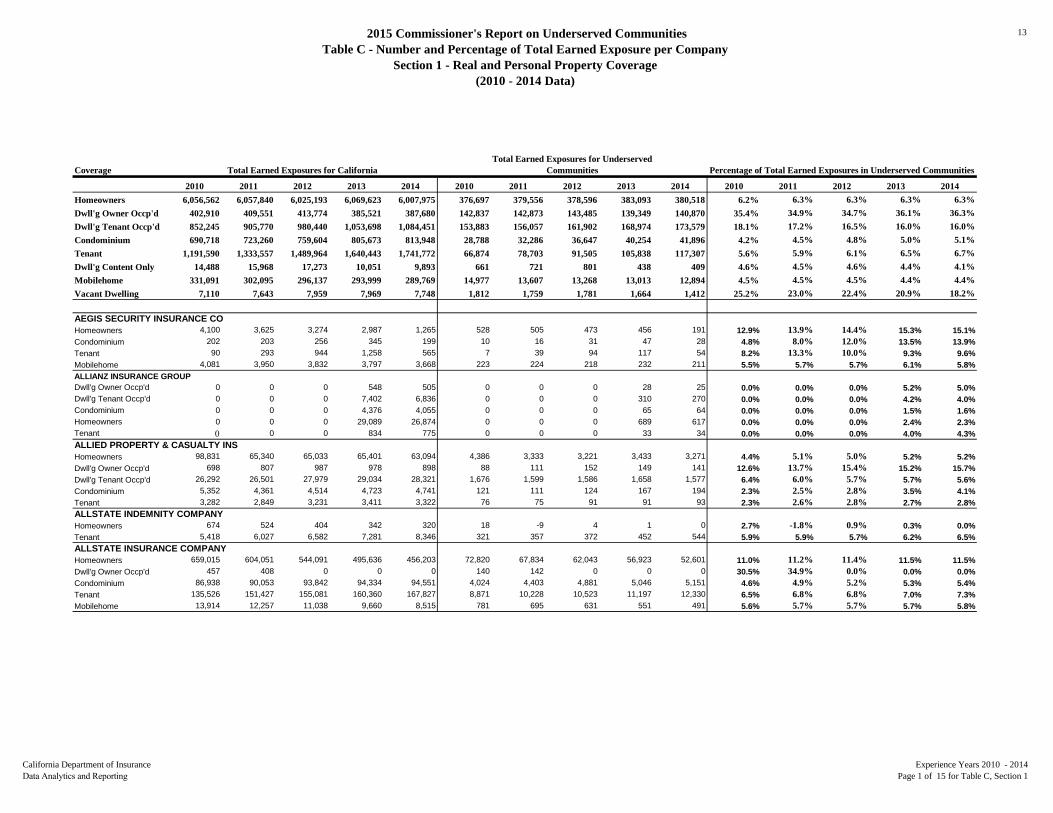
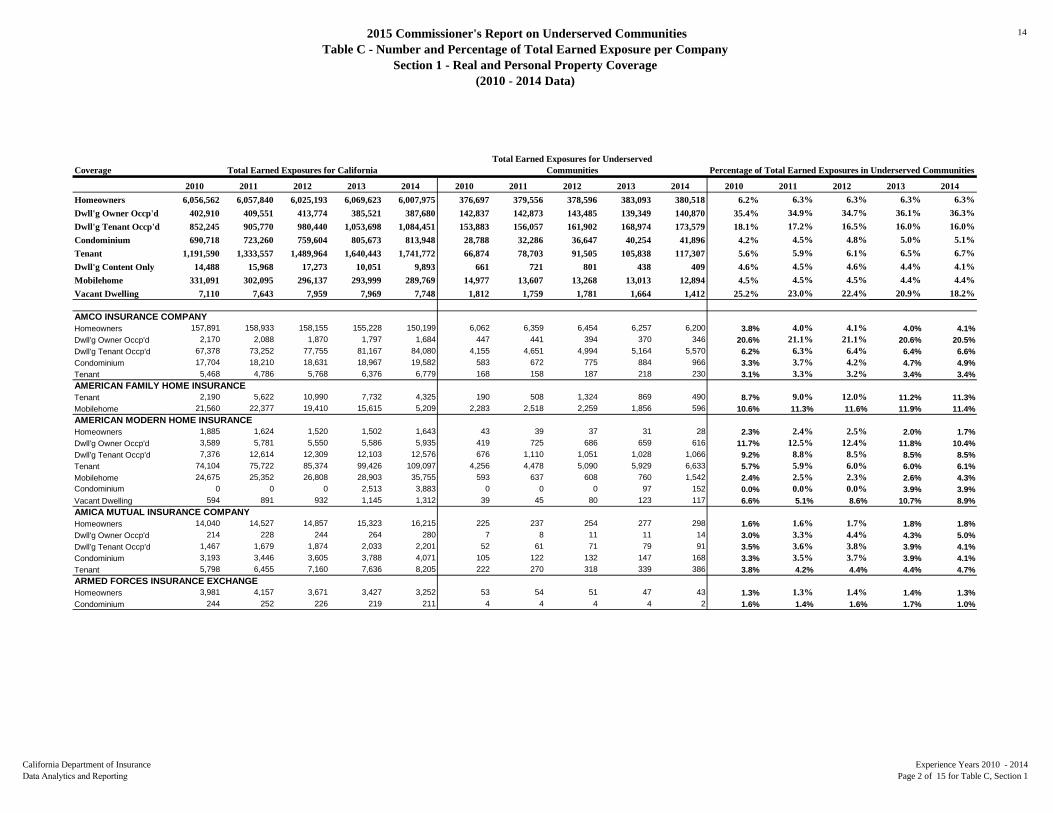
The purpose of this table is to provide total earned exposures statewide and in the “underserved” communities per company for each of the experience years involved, including the percentage of total earned exposures in the “underserved” communities to statewide data. This report represents about 99% of the insurance market for the lines of business considered under the Community Service Statement. This table is comprised of two sections, with one section for each category of insurance business - Real and Personal Property and Private Passenger Auto. Each section consists of aggregate totals for the 5 experience years and reports the coverages that were written by companies that were required to submit the data.
Table D - Service Office Data per Company
The purpose of this table is to provide the number of service offices per company in California and in the “underserved” communities, for each of the experience years involved, including the percentage of service offices in the “underserved” communities to statewide data. The table lists the companies required to submit the data, and reports the largest number of service offices reported under the lines of business considered in the Community Service Statement.The service offices shown in this report are broken down into the numberof sales/marketing, claims offices and agencies (broken down into Captive and/or Independentagency) a company had in the year/s reported. Note that a service office can manage bothbusiness types and that a service office can represent multiple individual companies within thesame parent company. In addition, companies using a different marketing system other thanagencies,such as a direct marketing system or having brokers to market their products, were not to report these as agencies.
Data Differences:
Any data differences from year to year can be attributed, but not limited to the following:
companies’ confirmation of the increase/decrease in business that consequentlychanged their marketing strategies as far as the number of service offices isconcerned
discontinuance of a particular business line/program or if a book of business was inrun off
addition of a business line from one year to the other
a group submission with an additional (or deletion) company’s data for a particularexperience year
a change in reporting status; i.e., was required to submit data for a specific year butnot in another year due to threshold requirement guidelines
2015 Commissioner’s Report on “Underserved” Communities California Department of Insurance Data Analytics and Reporting Experience Years 2010 - 2014
3
Conclusion
Communities that are considered “underserved” are with no or little insurance protection. Absence of or inadequate insurance protection can be detrimental to people’s lives. To ensure that all individuals and families as well as businesses or organizations get the insurance protection they need against the adverse financial consequences of losses, is one of the goals of California Department of Insurance. California Code of Regulations (CCR) Section 2646.6 paves the way for the department in its strong mission to continually identify these “underserved” communities, so they too, can acquire the insurance protection they need.
This report cannot address the issue as to why some people do not have insurance. It is up to the community, insurance industry and the Department to make sure adequate coverage can be made available to all people. However, with this report, it is with hope that it can continue to encourage the insurance industry to invest and to make insurance accessible in the “underserved” communities, while the California Department of Insurance, continues with its utmost goal of trying to educate and help everyone benefit the protection and the peace of mind that insurance can offer.
Below are examples of how the department and the State tackled or is dealing with the “underserved” communities:
What have the California Department of Insurance (CDI) and the State done or is still doing to address these “underserved” or uninsured communities?
1) California Low Cost Automobile Insurance (CLCA) Program was established by theLegislature in 1999 and exists pursuant to California Insurance Code Section 11629.7 as a program designed to provide income eligible persons with auto liability insurance protection at affordable rates as a way to meet California’s financial responsibility laws.
Low cost auto insurance policies in force have increased by 36% since 2011. At the end of 2015, 15,404 active policies were in force. During the course of the year, 1,610 policies were cancelled and 2,010 policies were written as new business. Since January 1 of 2015, undocumented immigrants with AB 60 driver licenses are now eligible for the program.
In 2014, California Senate Bill 1273 (Lara) was signed into law and became effective January 1, 2015. This legislation expands CLCA eligibility and allows more income eligible drivers to participate in the program. In 2015, CDI approved proposals submitted by the California Automobile Assigned Risk Plan (CAARP) that will impact the CLCA program in 2016.
2015 Commissioner’s Report on “Underserved” Communities California Department of Insurance Data Analytics and Reporting Experience Years 2010 - 2014
4
The changes include the following:
• Adopting a new 30% surcharge, effective January 1, 2015, for drivers without threeyears of documented driving history.
• Moving the (mylowcostauto.com) website from CAARP to the CDI contractor, to bemore consumer-centric, and meet SB 1273 requirements.
• Allowing credit/debit cards for initial payment and setting up the process forcredit/debit cards to be accepted for installment payments.
• Updating reporting methods to better distinguish between cancellations, new polices,and re-writes.
The California Department of Insurance has an aggressive public relations campaign, including a website at www.mylowcostauto.com and paid advertising and related publicity in targeted areas. This website serves as the primary source of information and education about the CLCA program for consumers and producers. The CLCA program meets the success standards established under law for 2015 because:
• The rates generate sufficient premiums to cover losses and expenses incurred byCLCA policies issued under each respective county program.
• It benefits underserved communities throughout California. Nearly 87% of thepolicies issued in 2015 were to applicants with household income at or below$20,000 per year.
• It reduces the number of uninsured motorists. Approximately 96% of new policiesassigned were to applicants who were uninsured at the time of application.
CLCA causes motorists to purchase a policy, other than CLCA, which meets therequirements of California law. At least 703 motorists visited a producer because ofthe program’s advertising and left with a higher coverage automobile policy.
1) Source: “Report to the Legislature & Consumer Education and Outreach Plan 2016”, Low Cost Auto Website
2) COIN (CALIFORNIA ORGANIZED INVESTMENT NETWORK) was established in 1996 andis a collaborative effort among the California Department of Insurance, the insuranceindustry and the community. Its goal is to provide leadership in increasing insuranceindustry investment in “underserved” and rural communities throughout California. It hasits shares of successes with insurance companies investing in California urban and ruralcommunities with low-income families.
2015 Commissioner’s Report on “Underserved” Communities California Department of Insurance Data Analytics and Reporting Experience Years 2010 - 2014
5 The latest high-level findings show that the total COIN qualified investment holdings more than tripled from $6.6 billion at the beginning of 2011 to $21.85 billion at the end of 2015.The amount of community investment held by insurers has continually increased and is expected to continue to increase, despite severe limitations on access to capital in the financial markets created during the last economic downturn. COIN has also grown in scope to include green investments (AB 1011, Jones, 2010), an advisory board (AB624, Pérez, 2011) and quintupled the annual available amount of COIN CDFI Tax Credits (AB 32, Pérez, 2013)
2) Source: “Community Investment Survey (CIS) 2016 Data Call, COIN Website
3) In January 2012, the formation of an Insurance Diversity Task Force was made toconsider and make recommendations about diversity in the insurance industry. One of themissions is to identify and promote insurance companies that are actively engaged indiversity issues. This is in connection to the Assembly Bill 53 that was signed into law andrequires insurers to report to the California Insurance Commissioner their procurementefforts with minority, women and disabled veteran-owned businesses. It was noted in thisBill that it is in the state's interest to encourage competitive business opportunities for allof its people.
Included are the goals to increase procurement from Diverse Suppliers and to increase Diversity on Governing Boards
Current results: 63% INCREASE IN DIVERSE SPEND SINCE 2012 Former Insurance Commissioner Dave Jones had increased the amount of dollars insurance companies spent with California's diverse businesses by $586 Million through his Insurance Diversity Initiative, a 63% increase since 2012. The Initiative creates more jobs and economic opportunities in California's diverse communities.
3) Source: www.insurance.ca.gov/Diversity Website
2015 Commissioner’s Report on “Underserved” Communities California Department of Insurance Data Analytics and Reporting Experience Years 2010 - 2014
6 Contact Information
Any questions or comments regarding the methodology of the data collection presented in this report may be forwarded to:
Luciano Gobbo, Division Chief Data Analytics and Reporting e-mail: Luciano.Gobbo @ insurance.ca.gov
DEFINITIONS
According to CCR, Section 2646.6(b), the following coverages are to be provided:
Personal Lines: Line 1P Dwelling Fire – Non-Commercial (including policies
issued through the California FAIR Plan); Line 4 Homeowners Multiple Peril; Line 19.2 Private Passenger Automobile Liability (including
policies assigned by the California Automobile Assigned Risk Plan);
Earned Exposure - The term earned is defined as a condition where the exposure is recognized by the insurance company after time has passed and the insurance company has delivered the services promised under the insurance policy. Furthermore, an exposure is defined as the risk or loss potential an insurance company assumes from its policyholder in exchange for premium (an automobile or home are examples of exposures).
Servicing Offices - Servicing offices consist of claim office, marketing/sales office, and/or agencies.
Agencies - The number of agencies in this report represents the two marketing systems available (independent or captive).

2015 Commissioner's Report on Underserved Communities
Table A - ZIP Codes in Underserved Communities
7
California Department of Insurance Data Analytics and Reporting Page 1 of 4 for Table A
ZIPCodes City County90001 LOS ANGELES LOS ANGELES90002 LOS ANGELES LOS ANGELES90003 LOS ANGELES LOS ANGELES90004 LOS ANGELES LOS ANGELES90005 LOS ANGELES LOS ANGELES90006 LOS ANGELES LOS ANGELES90007 LOS ANGELES LOS ANGELES90010 LOS ANGELES LOS ANGELES90011 LOS ANGELES LOS ANGELES90012 LOS ANGELES LOS ANGELES90013 LOS ANGELES LOS ANGELES90014 LOS ANGELES LOS ANGELES90015 LOS ANGELES LOS ANGELES90016 LOS ANGELES LOS ANGELES90017 LOS ANGELES LOS ANGELES90018 LOS ANGELES LOS ANGELES90019 LOS ANGELES LOS ANGELES90020 LOS ANGELES LOS ANGELES90021 LOS ANGELES LOS ANGELES90022 LOS ANGELES LOS ANGELES90023 LOS ANGELES LOS ANGELES90026 LOS ANGELES LOS ANGELES90029 LOS ANGELES LOS ANGELES90031 LOS ANGELES LOS ANGELES90032 LOS ANGELES LOS ANGELES90033 LOS ANGELES LOS ANGELES90037 LOS ANGELES LOS ANGELES90038 LOS ANGELES LOS ANGELES90040 LOS ANGELES LOS ANGELES90043 LOS ANGELES LOS ANGELES90044 LOS ANGELES LOS ANGELES90047 LOS ANGELES LOS ANGELES90057 LOS ANGELES LOS ANGELES90058 LOS ANGELES LOS ANGELES90059 LOS ANGELES LOS ANGELES90061 LOS ANGELES LOS ANGELES90062 LOS ANGELES LOS ANGELES90063 LOS ANGELES LOS ANGELES90065 LOS ANGELES LOS ANGELES90201 BELL LOS ANGELES
2015 Commissioner's Report on Underserved Communities
Table A - ZIP Codes in Underserved Communities
8
California Department of Insurance Data Analytics and Reporting Page 2 of 4 for Table A
ZIPCodes City County90220 COMPTON LOS ANGELES90221 COMPTON LOS ANGELES90222 COMPTON LOS ANGELES90247 GARDENA LOS ANGELES90255 HUNTINGTON PARK LOS ANGELES90262 LYNWOOD LOS ANGELES90270 MAYWOOD LOS ANGELES90280 SOUTH GATE LOS ANGELES90301 INGLEWOOD LOS ANGELES90302 INGLEWOOD LOS ANGELES90303 INGLEWOOD LOS ANGELES90304 INGLEWOOD LOS ANGELES90501 TORRANCE LOS ANGELES90716 HAWAIIAN GARDENS LOS ANGELES90723 PARAMOUNT LOS ANGELES90744 WILMINGTON LOS ANGELES90806 LONG BEACH LOS ANGELES90810 LONG BEACH LOS ANGELES90813 LONG BEACH LOS ANGELES91204 GLENDALE LOS ANGELES91303 CANOGA PARK LOS ANGELES91331 PACOIMA LOS ANGELES91340 SAN FERNANDO LOS ANGELES91343 NORTH HILLS LOS ANGELES91352 SUN VALLEY LOS ANGELES91402 PANORAMA CITY LOS ANGELES91405 VAN NUYS LOS ANGELES91406 VAN NUYS LOS ANGELES91601 NORTH HOLLYWOOD LOS ANGELES91605 NORTH HOLLYWOOD LOS ANGELES91606 NORTH HOLLYWOOD LOS ANGELES91731 EL MONTE LOS ANGELES91733 SOUTH EL MONTE LOS ANGELES91746 LA PUENTE LOS ANGELES91761 ONTARIO SAN BERNARDINO91766 POMONA LOS ANGELES92102 SAN DIEGO SAN DIEGO92113 SAN DIEGO SAN DIEGO92173 SAN YSIDRO SAN DIEGO92231 CALEXICO IMPERIAL
2015 Commissioner's Report on Underserved Communities
Table A - ZIP Codes in Underserved Communities
9
California Department of Insurance Data Analytics and Reporting Page 3 of 4 for Table A
ZIPCodes City County92236 COACHELLA RIVERSIDE92249 HEBER IMPERIAL92254 MECCA RIVERSIDE92259 OCOTILLO IMPERIAL92273 SEELEY IMPERIAL92335 FONTANA SAN BERNARDINO92337 FONTANA SAN BERNARDINO92401 SAN BERNARDINO SAN BERNARDINO92408 SAN BERNARDINO SAN BERNARDINO92410 SAN BERNARDINO SAN BERNARDINO92411 SAN BERNARDINO SAN BERNARDINO92701 SANTA ANA ORANGE92703 SANTA ANA ORANGE92704 SANTA ANA ORANGE92707 SANTA ANA ORANGE92801 ANAHEIM ORANGE92805 ANAHEIM ORANGE93036 OXNARD VENTURA93219 EARLIMART TULARE93227 GOSHEN TULARE93234 HURON FRESNO93239 KETTLEMAN CITY KINGS93241 LAMONT KERN93256 PIXLEY TULARE93261 RICHGROVE TULARE93266 STRATFORD KINGS93272 TIPTON TULARE93458 SANTA MARIA SANTA BARBARA93608 CANTUA CREEK FRESNO93624 FIVE POINTS FRESNO93640 MENDOTA FRESNO93646 ORANGE COVE FRESNO93648 PARLIER FRESNO93660 SAN JOAQUIN FRESNO93701 FRESNO FRESNO93702 FRESNO FRESNO93703 FRESNO FRESNO93706 FRESNO FRESNO93721 FRESNO FRESNO93725 FRESNO FRESNO
2015 Commissioner's Report on Underserved Communities
Table A - ZIP Codes in Underserved Communities
10
California Department of Insurance Data Analytics and Reporting Page 4 of 4 for Table A
ZIPCodes City County93925 CHUALAR MONTEREY94063 REDWOOD CITY SAN MATEO94124 SAN FRANCISCO SAN FRANCISCO94601 OAKLAND ALAMEDA94603 OAKLAND ALAMEDA94606 OAKLAND ALAMEDA94607 OAKLAND ALAMEDA94612 OAKLAND ALAMEDA94621 OAKLAND ALAMEDA94710 BERKELEY ALAMEDA94801 RICHMOND CONTRA COSTA95019 FREEDOM SANTA CRUZ95110 SAN JOSE SANTA CLARA95111 SAN JOSE SANTA CLARA95112 SAN JOSE SANTA CLARA95116 SAN JOSE SANTA CLARA95122 SAN JOSE SANTA CLARA95202 STOCKTON SAN JOAQUIN95205 STOCKTON SAN JOAQUIN95231 FRENCH CAMP SAN JOAQUIN95351 MODESTO STANISLAUS95365 PLANADA MERCED95387 WESTLEY STANISLAUS95824 SACRAMENTO SACRAMENTO95838 SACRAMENTO SACRAMENTO
2015 Commissioner's Report on Underserved CommunitiesREAL and PERSONAL PROPERTY Coverage
Experience Years 2010 - 2014
Table B - Summary Statistics
11
Experience Years 2010-2014Page 1 of 1 for Table B (Homeowners)
2010 2011 2012 2013 2014
6,056,562 6,057,840 6,025,193 6,069,623 6,007,975376,697 379,556 378,596 383,093 380,518
6.2% 6.3% 6.3% 6.3% 6.3%
402,910 409,551 413,774 385,521 387,680142,837 142,873 143,485 139,349 140,870
35.5% 34.9% 34.7% 36.1% 36.3%
852,245 905,770 980,440 1,053,698 1,084,451153,883 156,057 161,902 168,974 173,579
18.1% 17.2% 16.5% 16.0% 16.0%
690,718 723,260 759,604 805,672 813,94928,788 32,286 36,647 40,254 41,896
4.2% 4.5% 4.8% 5.0% 5.1%
1,191,590 1,333,557 1,489,964 1,640,443 1,741,77266,874 78,703 91,505 105,838 117,307
5.6% 5.9% 6.1% 6.5% 6.7%
14,488 15,968 17,273 10,051 9,893661 721 801 438 409
4.6% 4.5% 4.6% 4.4% 4.1%
331,091 302,095 296,137 293,999 289,76914,977 13,607 13,268 13,013 12,894
4.5% 4.5% 4.5% 4.4% 4.4%
7,110 7,643 7,959 7,969 7,7481,812 1,759 1,781 1,664 1,412
25.5% 23.0% 22.4% 20.9% 18.2%
Coverage
Homeowners Multiple PerilTotal Earned Exposures (State)Total Earned Exposures (Underserved) % of Underserved to State
Dwelling Fire - Owner Occupied Total Earned Exposures (State)Total Earned Exposures (Underserved) % of Underserved to State
Dwelling Fire - Tenant Occupied Total Earned Exposures (State)Total Earned Exposures (Underserved) % of Underserved to State
CondominiumTotal Earned Exposures (State)Total Earned Exposures (Underserved) % of Underserved to State
Tenant / RentersTotal Earned Exposures (State)Total Earned Exposures (Underserved) % of Underserved to State
Dwelling Fire - Content OnlyTotal Earned Exposures (State)Total Earned Exposures (Underserved) % of Underserved to State
MobilehomeTotal Earned Exposures (State)Total Earned Exposures (Underserved) % of Underserved to State
Vacant DwellingTotal Earned Exposures (State)Total Earned Exposures (Underserved) % of Underserved to State
California Department of Insurance Data Analytics and Reporting
Experience Years
2015 Commissioner's Report on Underserved Communities
PRIVATE PASSENGER AUTOMOBILE CoverageExperience Years 2010 - 2014
Table B - Summary Statistics
12
Experience Years 2010-2014Page 1 of 1 for Table B (Auto)
2010 2011 2012 2013 2014
23,978,230 24,058,245 24,261,702 24,778,771 25,234,6242,462,176 2,489,883 2,550,271 2,592,729 2,677,013
10.27% 10.35% 10.51% 10.46% 10.61%
1,566 1,240 969 969 792437 331 246 233 195
27.93% 26.72% 25.36% 24.02% 24.62%
8,676 7,955 3,921 10,657 13,0422,819 2,516 1,216 2,964 3,587
32.49% 31.62% 31.02% 27.81% 27.50%
733,755 751,729 777,604 767,149 808,21234,874 36,535 39,321 40,366 43,4794.75% 4.86% 5.06% 5.26% 5.38%
219,562 213,746 211,835 194,452 196,3127,408 7,248 7,256 6,699 6,952
Private Passenger Automobile Total Earned Exposures (State)Total Earned Exposures (Underserved) % of Underserved to State
Assigned RiskTotal Earned Exposures (State)Total Earned Exposures (Underserved) % of Underserved to State
Low Cost AutoTotal Earned Exposures (State)Total Earned Exposures (Underserved) % of Underserved to State
MotorcycleTotal Earned Exposures (State)Total Earned Exposures (Underserved) % of Underserved to State
MotorhomeTotal Earned Exposures (State)Total Earned Exposures (Underserved) % of Underserved to State
California Department of InsuranceData Analytics and Reporting
3.37% 3.39% 3.43% 3.44% 3.54%
Coverage
2015 Commissioner's Report on Underserved CommunitiesTable C - Number and Percentage of Total Earned Exposure per Company
Section 1 - Real and Personal Property Coverage(2010 - 2014 Data)
13
California Department of Insurance Data Analytics and Reporting
Experience Years 2010 - 2014Page 1 of 15 for Table C, Section 1
Coverage
2010 2011 2012 2013 2014 2010 2011 2012 2013 2014 2010 2011 2012 2013 2014Homeowners 6,056,562 6,057,840 6,025,193 6,069,623 6,007,975 376,697 379,556 378,596 383,093 380,518 6.2% 6.3% 6.3% 6.3% 6.3%Dwll'g Owner Occp'd 402,910 409,551 413,774 385,521 387,680 142,837 142,873 143,485 139,349 140,870 35.4% 34.9% 34.7% 36.1% 36.3%Dwll'g Tenant Occp'd 852,245 905,770 980,440 1,053,698 1,084,451 153,883 156,057 161,902 168,974 173,579 18.1% 17.2% 16.5% 16.0% 16.0%Condominium 690,718 723,260 759,604 805,673 813,948 28,788 32,286 36,647 40,254 41,896 4.2% 4.5% 4.8% 5.0% 5.1%Tenant 1,191,590 1,333,557 1,489,964 1,640,443 1,741,772 66,874 78,703 91,505 105,838 117,307 5.6% 5.9% 6.1% 6.5% 6.7%Dwll'g Content Only 14,488 15,968 17,273 10,051 9,893 661 721 801 438 409 4.6% 4.5% 4.6% 4.4% 4.1%Mobilehome 331,091 302,095 296,137 293,999 289,769 14,977 13,607 13,268 13,013 12,894 4.5% 4.5% 4.5% 4.4% 4.4%Vacant Dwelling 7,110 7,643 7,959 7,969 7,748 1,812 1,759 1,781 1,664 1,412 25.2% 23.0% 22.4% 20.9% 18.2%
AEGIS SECURITY INSURANCE CO Homeowners 4,100 3,625 3,274 2,987 1,265 528 505 473 456 191 12.9% 13.9% 14.4% 15.3% 15.1%Condominium 202 203 256 345 199 10 16 31 47 28 4.8% 8.0% 12.0% 13.5% 13.9%Tenant 90 293 944 1,258 565 7 39 94 117 54 8.2% 13.3% 10.0% 9.3% 9.6%Mobilehome 4,081 3,950 3,832 3,797 3,668 223 224 218 232 211 5.5% 5.7% 5.7% 6.1% 5.8%ALLIANZ INSURANCE GROUPDwll'g Owner Occp'd 0 0 0 548 505 0 0 0 28 25 0.0% 0.0% 0.0% 5.2% 5.0%Dwll'g Tenant Occp'd 0 0 0 7,402 6,836 0 0 0 310 270 0.0% 0.0% 0.0% 4.2% 4.0%Condominium 0 0 0 4,376 4,055 0 0 0 65 64 0.0% 0.0% 0.0% 1.5% 1.6%Homeowners 0 0 0 29,089 26,874 0 0 0 689 617 0.0% 0.0% 0.0% 2.4% 2.3%Tenant 0 0 0 834 775 0 0 0 33 34 0.0% 0.0% 0.0% 4.0% 4.3%ALLIED PROPERTY & CASUALTY INSHomeowners 98,831 65,340 65,033 65,401 63,094 4,386 3,333 3,221 3,433 3,271 4.4% 5.1% 5.0% 5.2% 5.2%Dwll'g Owner Occp'd 698 807 987 978 898 88 111 152 149 141 12.6% 13.7% 15.4% 15.2% 15.7%Dwll'g Tenant Occp'd 26,292 26,501 27,979 29,034 28,321 1,676 1,599 1,586 1,658 1,577 6.4% 6.0% 5.7% 5.7% 5.6%Condominium 5,352 4,361 4,514 4,723 4,741 121 111 124 167 194 2.3% 2.5% 2.8% 3.5% 4.1%Tenant 3,282 2,849 3,231 3,411 3,322 76 75 91 91 93 2.3% 2.6% 2.8% 2.7% 2.8%ALLSTATE INDEMNITY COMPANY Homeowners 674 524 404 342 320 18 -9 4 1 0 2.7% -1.8% 0.9% 0.3% 0.0%Tenant 5,418 6,027 6,582 7,281 8,346 321 357 372 452 544 5.9% 5.9% 5.7% 6.2% 6.5%ALLSTATE INSURANCE COMPANY Homeowners 659,015 604,051 544,091 495,636 456,203 72,820 67,834 62,043 56,923 52,601 11.0% 11.2% 11.4% 11.5% 11.5%Dwll'g Owner Occp'd 457 408 0 0 0 140 142 0 0 0 30.5% 34.9% 0.0% 0.0% 0.0%Condominium 86,938 90,053 93,842 94,334 94,551 4,024 4,403 4,881 5,046 5,151 4.6% 4.9% 5.2% 5.3% 5.4%Tenant 135,526 151,427 155,081 160,360 167,827 8,871 10,228 10,523 11,197 12,330 6.5% 6.8% 6.8% 7.0% 7.3%Mobilehome 13,914 12,257 11,038 9,660 8,515 781 695 631 551 491 5.6% 5.7% 5.7% 5.7% 5.8%
Total Earned Exposures for CaliforniaTotal Earned Exposures for Underserved
Communities Percentage of Total Earned Exposures in Underserved Communities
2015 Commissioner's Report on Underserved CommunitiesTable C - Number and Percentage of Total Earned Exposure per Company
Section 1 - Real and Personal Property Coverage(2010 - 2014 Data)
14
California Department of Insurance Data Analytics and Reporting
Experience Years 2010 - 2014Page 2 of 15 for Table C, Section 1
Coverage
2010 2011 2012 2013 2014 2010 2011 2012 2013 2014 2010 2011 2012 2013 2014Homeowners 6,056,562 6,057,840 6,025,193 6,069,623 6,007,975 376,697 379,556 378,596 383,093 380,518 6.2% 6.3% 6.3% 6.3% 6.3%Dwll'g Owner Occp'd 402,910 409,551 413,774 385,521 387,680 142,837 142,873 143,485 139,349 140,870 35.4% 34.9% 34.7% 36.1% 36.3%Dwll'g Tenant Occp'd 852,245 905,770 980,440 1,053,698 1,084,451 153,883 156,057 161,902 168,974 173,579 18.1% 17.2% 16.5% 16.0% 16.0%Condominium 690,718 723,260 759,604 805,673 813,948 28,788 32,286 36,647 40,254 41,896 4.2% 4.5% 4.8% 5.0% 5.1%Tenant 1,191,590 1,333,557 1,489,964 1,640,443 1,741,772 66,874 78,703 91,505 105,838 117,307 5.6% 5.9% 6.1% 6.5% 6.7%Dwll'g Content Only 14,488 15,968 17,273 10,051 9,893 661 721 801 438 409 4.6% 4.5% 4.6% 4.4% 4.1%Mobilehome 331,091 302,095 296,137 293,999 289,769 14,977 13,607 13,268 13,013 12,894 4.5% 4.5% 4.5% 4.4% 4.4%Vacant Dwelling 7,110 7,643 7,959 7,969 7,748 1,812 1,759 1,781 1,664 1,412 25.2% 23.0% 22.4% 20.9% 18.2%
Total Earned Exposures for CaliforniaTotal Earned Exposures for Underserved
Communities Percentage of Total Earned Exposures in Underserved Communities
AMCO INSURANCE COMPANY Homeowners 157,891 158,933 158,155 155,228 150,199 6,062 6,359 6,454 6,257 6,200 3.8% 4.0% 4.1% 4.0% 4.1%Dwll'g Owner Occp'd 2,170 2,088 1,870 1,797 1,684 447 441 394 370 346 20.6% 21.1% 21.1% 20.6% 20.5%Dwll'g Tenant Occp'd 67,378 73,252 77,755 81,167 84,080 4,155 4,651 4,994 5,164 5,570 6.2% 6.3% 6.4% 6.4% 6.6%Condominium 17,704 18,210 18,631 18,967 19,582 583 672 775 884 966 3.3% 3.7% 4.2% 4.7% 4.9%Tenant 5,468 4,786 5,768 6,376 6,779 168 158 187 218 230 3.1% 3.3% 3.2% 3.4% 3.4%AMERICAN FAMILY HOME INSURANCETenant 2,190 5,622 10,990 7,732 4,325 190 508 1,324 869 490 8.7% 9.0% 12.0% 11.2% 11.3%Mobilehome 21,560 22,377 19,410 15,615 5,209 2,283 2,518 2,259 1,856 596 10.6% 11.3% 11.6% 11.9% 11.4%AMERICAN MODERN HOME INSURANCEHomeowners 1,885 1,624 1,520 1,502 1,643 43 39 37 31 28 2.3% 2.4% 2.5% 2.0% 1.7%Dwll'g Owner Occp'd 3,589 5,781 5,550 5,586 5,935 419 725 686 659 616 11.7% 12.5% 12.4% 11.8% 10.4%Dwll'g Tenant Occp'd 7,376 12,614 12,309 12,103 12,576 676 1,110 1,051 1,028 1,066 9.2% 8.8% 8.5% 8.5% 8.5%Tenant 74,104 75,722 85,374 99,426 109,097 4,256 4,478 5,090 5,929 6,633 5.7% 5.9% 6.0% 6.0% 6.1%Mobilehome 24,675 25,352 26,808 28,903 35,755 593 637 608 760 1,542 2.4% 2.5% 2.3% 2.6% 4.3%Condominium 0 0 0 2,513 3,883 0 0 0 97 152 0.0% 0.0% 0.0% 3.9% 3.9%Vacant Dwelling 594 891 932 1,145 1,312 39 45 80 123 117 6.6% 5.1% 8.6% 10.7% 8.9%AMICA MUTUAL INSURANCE COMPANYHomeowners 14,040 14,527 14,857 15,323 16,215 225 237 254 277 298 1.6% 1.6% 1.7% 1.8% 1.8%Dwll'g Owner Occp'd 214 228 244 264 280 7 8 11 11 14 3.0% 3.3% 4.4% 4.3% 5.0%Dwll'g Tenant Occp'd 1,467 1,679 1,874 2,033 2,201 52 61 71 79 91 3.5% 3.6% 3.8% 3.9% 4.1%Condominium 3,193 3,446 3,605 3,788 4,071 105 122 132 147 168 3.3% 3.5% 3.7% 3.9% 4.1%Tenant 5,798 6,455 7,160 7,636 8,205 222 270 318 339 386 3.8% 4.2% 4.4% 4.4% 4.7%ARMED FORCES INSURANCE EXCHANGEHomeowners 3,981 4,157 3,671 3,427 3,252 53 54 51 47 43 1.3% 1.3% 1.4% 1.4% 1.3%Condominium 244 252 226 219 211 4 4 4 4 2 1.6% 1.4% 1.6% 1.7% 1.0%
2015 Commissioner's Report on Underserved CommunitiesTable C - Number and Percentage of Total Earned Exposure per Company
Section 1 - Real and Personal Property Coverage(2010 - 2014 Data)
15
California Department of Insurance Data Analytics and Reporting
Experience Years 2010 - 2014Page 3 of 15 for Table C, Section 1
Coverage
2010 2011 2012 2013 2014 2010 2011 2012 2013 2014 2010 2011 2012 2013 2014Homeowners 6,056,562 6,057,840 6,025,193 6,069,623 6,007,975 376,697 379,556 378,596 383,093 380,518 6.2% 6.3% 6.3% 6.3% 6.3%Dwll'g Owner Occp'd 402,910 409,551 413,774 385,521 387,680 142,837 142,873 143,485 139,349 140,870 35.4% 34.9% 34.7% 36.1% 36.3%Dwll'g Tenant Occp'd 852,245 905,770 980,440 1,053,698 1,084,451 153,883 156,057 161,902 168,974 173,579 18.1% 17.2% 16.5% 16.0% 16.0%Condominium 690,718 723,260 759,604 805,673 813,948 28,788 32,286 36,647 40,254 41,896 4.2% 4.5% 4.8% 5.0% 5.1%Tenant 1,191,590 1,333,557 1,489,964 1,640,443 1,741,772 66,874 78,703 91,505 105,838 117,307 5.6% 5.9% 6.1% 6.5% 6.7%Dwll'g Content Only 14,488 15,968 17,273 10,051 9,893 661 721 801 438 409 4.6% 4.5% 4.6% 4.4% 4.1%Mobilehome 331,091 302,095 296,137 293,999 289,769 14,977 13,607 13,268 13,013 12,894 4.5% 4.5% 4.5% 4.4% 4.4%Vacant Dwelling 7,110 7,643 7,959 7,969 7,748 1,812 1,759 1,781 1,664 1,412 25.2% 23.0% 22.4% 20.9% 18.2%
Total Earned Exposures for CaliforniaTotal Earned Exposures for Underserved
Communities Percentage of Total Earned Exposures in Underserved Communities
ASPEN AMERICAN INSURANCE COMPANYDwll'g Owner Occp'd 0 0 0 508 1,565 0 0 0 39 107 0.0% 0.0% 0.0% 7.7% 6.8%Tenant 0 0 0 2,558 8,643 0 0 0 197 604 0.0% 0.0% 0.0% 7.7% 7.0%ASSURANT GROUPHomeowners 19,703 16,253 14,469 12,407 11,635 1,273 1,031 882 745 667 6.5% 6.3% 6.1% 6.0% 5.7%Dwll'g Owner Occp'd 2,340 3,001 2,553 2,256 2,384 461 377 316 263 240 19.7% 12.6% 12.4% 11.7% 10.1%Dwll'g Tenant Occp'd 7,231 2,907 2,435 1,931 1,630 702 286 251 192 158 9.7% 9.8% 10.3% 9.9% 9.7%Condominium 4,135 2,500 2,169 1,774 1,112 152 96 78 70 47 3.7% 3.8% 3.6% 4.0% 4.2%Tenant 34,457 38,504 42,301 61,151 79,151 2,266 2,771 3,168 4,819 6,637 6.6% 7.2% 7.5% 7.9% 8.4%Mobilehome 55,282 33,209 32,812 31,869 27,518 3,205 1,895 1,905 1,851 1,758 5.8% 5.7% 5.8% 5.8% 6.4%AUTO CLUB SOUTHERN CALIFORNIA Homeowners 372,050 379,698 386,331 395,168 403,729 17,300 18,609 19,808 21,069 22,358 4.6% 4.9% 5.1% 5.3% 5.5%Dwll'g Tenant Occp'd 17,635 21,365 25,210 28,628 30,825 1,519 1,844 2,175 2,510 2,812 8.6% 8.6% 8.6% 8.8% 9.1%Condominium 42,822 42,767 43,000 43,471 44,141 1,655 1,745 1,826 1,922 2,065 3.9% 4.1% 4.2% 4.4% 4.7%Tenant 69,351 88,973 107,360 121,454 131,874 4,828 6,753 8,548 10,040 11,353 7.0% 7.6% 8.0% 8.3% 8.6%BANK of AMERICA CORP GRP Homeowners 65,653 60,579 47,388 0 0 5,843 5,685 4,521 0 0 8.9% 9.4% 9.5% 0.0% 0.0%Dwll'g Owner Occp'd 9,453 7,548 3,489 0 0 774 650 301 0 0 8.2% 8.6% 8.6% 0.0% 0.0%Condominium 2,782 2,500 2,057 0 0 217 229 190 0 0 7.8% 9.2% 9.2% 0.0% 0.0%Tenant 11,438 7,932 4,690 0 0 976 706 423 0 0 8.5% 8.9% 9.0% 0.0% 0.0%Vacant Dwelling 128 0 0 0 0 30 0 0 0 0 23.2% 0.0% 0.0% 0.0% 0.0%BANKERS STANDARDHomeowners 3,156 3,896 5,001 5,693 6,049 41 59 69 83 95 1.3% 1.5% 1.4% 1.5% 1.6%Condominium 375 529 727 879 926 7 13 17 20 16 1.8% 2.4% 2.4% 2.2% 1.8%Tenant 145 195 255 306 317 1 5 7 11 13 0.9% 2.6% 2.9% 3.6% 4.1%
2015 Commissioner's Report on Underserved CommunitiesTable C - Number and Percentage of Total Earned Exposure per Company
Section 1 - Real and Personal Property Coverage(2010 - 2014 Data)
16
California Department of Insurance Data Analytics and Reporting
Experience Years 2010 - 2014Page 4 of 15 for Table C, Section 1
Coverage
2010 2011 2012 2013 2014 2010 2011 2012 2013 2014 2010 2011 2012 2013 2014Homeowners 6,056,562 6,057,840 6,025,193 6,069,623 6,007,975 376,697 379,556 378,596 383,093 380,518 6.2% 6.3% 6.3% 6.3% 6.3%Dwll'g Owner Occp'd 402,910 409,551 413,774 385,521 387,680 142,837 142,873 143,485 139,349 140,870 35.4% 34.9% 34.7% 36.1% 36.3%Dwll'g Tenant Occp'd 852,245 905,770 980,440 1,053,698 1,084,451 153,883 156,057 161,902 168,974 173,579 18.1% 17.2% 16.5% 16.0% 16.0%Condominium 690,718 723,260 759,604 805,673 813,948 28,788 32,286 36,647 40,254 41,896 4.2% 4.5% 4.8% 5.0% 5.1%Tenant 1,191,590 1,333,557 1,489,964 1,640,443 1,741,772 66,874 78,703 91,505 105,838 117,307 5.6% 5.9% 6.1% 6.5% 6.7%Dwll'g Content Only 14,488 15,968 17,273 10,051 9,893 661 721 801 438 409 4.6% 4.5% 4.6% 4.4% 4.1%Mobilehome 331,091 302,095 296,137 293,999 289,769 14,977 13,607 13,268 13,013 12,894 4.5% 4.5% 4.5% 4.4% 4.4%Vacant Dwelling 7,110 7,643 7,959 7,969 7,748 1,812 1,759 1,781 1,664 1,412 25.2% 23.0% 22.4% 20.9% 18.2%
Total Earned Exposures for CaliforniaTotal Earned Exposures for Underserved
Communities Percentage of Total Earned Exposures in Underserved Communities
CALIFORNIA CASUALTY Homeowners 33,831 33,666 33,323 32,951 33,292 1,689 1,659 1,634 1,601 1,601 5.0% 4.9% 4.9% 4.9% 4.8%Condominium 5,444 5,360 5,301 5,283 5,321 221 226 226 222 227 4.1% 4.2% 4.3% 4.2% 4.3%Tenant 7,780 8,570 9,623 10,640 11,844 346 376 421 486 556 4.4% 4.4% 4.4% 4.6% 4.7%Mobilehome 268 274 277 281 289 7 8 9 10 13 2.6% 2.9% 3.1% 3.6% 4.3%CALIFORNIA FAIR PLAN Dwll'g Owner Occp'd 96,599 93,459 90,503 88,944 89,202 49,664 47,601 45,734 43,887 42,446 51.4% 50.9% 50.5% 49.3% 47.6%Dwll'g Tenant Occp'd 63,454 60,141 56,727 53,889 52,111 38,597 36,501 34,095 32,068 30,570 60.8% 60.7% 60.1% 59.5% 58.7%Dwll'g Content Only 371 356 369 418 504 22 19 18 17 20 6.0% 5.2% 4.8% 4.1% 4.0%Mobilehome 773 804 838 957 1,204 122 120 126 131 137 15.8% 14.9% 15.0% 13.7% 11.4%Vacant Dwelling 3,041 2,831 2,530 2,506 2,369 1,340 1,207 1,066 922 791 44.1% 42.6% 42.2% 36.8% 33.4%CALIFORNIA STATE AUTO ASSOHomeowners 406,632 415,576 420,756 427,207 437,415 10,329 10,646 10,839 11,048 11,326 2.5% 2.6% 2.6% 2.6% 2.6%Condominium 24,058 27,448 30,937 33,738 36,666 696 819 975 1,108 1,251 2.9% 3.0% 3.2% 3.3% 3.4%Tenant 76,733 85,295 88,389 89,284 91,327 1,986 2,364 2,458 2,430 2,540 2.6% 2.8% 2.8% 2.7% 2.8%Dwll'g Tenant Occp'd 54,361 61,890 68,900 73,959 77,651 3,311 3,839 4,358 4,728 5,065 6.1% 6.2% 6.3% 6.4% 6.5%CAPITAL INSURANCE GROUP Homeowners 53,515 56,012 59,047 62,214 64,759 1,102 1,217 1,347 1,477 1,565 2.1% 2.2% 2.3% 2.4% 2.4%Dwll'g Owner Occp'd 821 788 761 723 648 51 50 52 49 47 6.3% 6.4% 6.9% 6.7% 7.2%Dwll'g Tenant Occp'd 23,056 26,097 29,483 32,298 34,516 810 964 1,197 1,354 1,511 3.5% 3.7% 4.1% 4.2% 4.4%Condominium 2,442 2,642 2,861 3,226 4,055 61 71 78 104 144 2.5% 2.7% 2.7% 3.2% 3.6%Tenant 2,205 2,466 2,879 3,328 3,905 65 77 76 93 115 2.9% 3.1% 2.6% 2.8% 2.9%
2015 Commissioner's Report on Underserved CommunitiesTable C - Number and Percentage of Total Earned Exposure per Company
Section 1 - Real and Personal Property Coverage(2010 - 2014 Data)
17
California Department of Insurance Data Analytics and Reporting
Experience Years 2010 - 2014Page 5 of 15 for Table C, Section 1
Coverage
2010 2011 2012 2013 2014 2010 2011 2012 2013 2014 2010 2011 2012 2013 2014Homeowners 6,056,562 6,057,840 6,025,193 6,069,623 6,007,975 376,697 379,556 378,596 383,093 380,518 6.2% 6.3% 6.3% 6.3% 6.3%Dwll'g Owner Occp'd 402,910 409,551 413,774 385,521 387,680 142,837 142,873 143,485 139,349 140,870 35.4% 34.9% 34.7% 36.1% 36.3%Dwll'g Tenant Occp'd 852,245 905,770 980,440 1,053,698 1,084,451 153,883 156,057 161,902 168,974 173,579 18.1% 17.2% 16.5% 16.0% 16.0%Condominium 690,718 723,260 759,604 805,673 813,948 28,788 32,286 36,647 40,254 41,896 4.2% 4.5% 4.8% 5.0% 5.1%Tenant 1,191,590 1,333,557 1,489,964 1,640,443 1,741,772 66,874 78,703 91,505 105,838 117,307 5.6% 5.9% 6.1% 6.5% 6.7%Dwll'g Content Only 14,488 15,968 17,273 10,051 9,893 661 721 801 438 409 4.6% 4.5% 4.6% 4.4% 4.1%Mobilehome 331,091 302,095 296,137 293,999 289,769 14,977 13,607 13,268 13,013 12,894 4.5% 4.5% 4.5% 4.4% 4.4%Vacant Dwelling 7,110 7,643 7,959 7,969 7,748 1,812 1,759 1,781 1,664 1,412 25.2% 23.0% 22.4% 20.9% 18.2%
Total Earned Exposures for CaliforniaTotal Earned Exposures for Underserved
Communities Percentage of Total Earned Exposures in Underserved Communities
CENTURY-NATIONAL INSURANCE COHomeowners 61,549 56,335 52,454 47,774 44,916 5,913 5,299 4,845 4,348 4,013 9.6% 9.4% 9.2% 9.1% 8.9%Dwll'g Owner Occp'd 2,792 2,567 2,361 2,193 2,068 1,158 1,064 974 896 836 41.5% 41.5% 41.3% 40.8% 40.4%Dwll'g Tenant Occp'd 17,534 16,029 14,632 13,482 12,484 1,898 1,744 1,583 1,476 1,382 10.8% 10.9% 10.8% 10.9% 11.1%Condominium 215 200 182 166 160 9 9 8 8 7 4.2% 4.3% 4.3% 4.8% 4.3%Mobilehome 6,231 6,832 8,025 9,098 9,944 379 418 500 578 661 6.1% 6.1% 6.2% 6.4% 6.7%CHARTIS PROPERTY CASUALTY COHomeowners 11,861 13,899 13,157 13,308 13,684 164 191 165 159 166 1.4% 1.4% 1.3% 1.2% 1.2%Condominium 1,413 1,738 1,764 1,857 1,951 23 33 34 41 49 1.7% 1.9% 1.9% 2.2% 2.5%Tenant 619 738 766 819 869 21 28 24 22 23 3.4% 3.8% 3.2% 2.6% 2.6%COMMERCE WEST INSURANCE COHomeowners 1,937 3,092 3,499 3,440 2,810 94 195 215 192 152 4.8% 6.3% 6.1% 5.6% 5.4%Condominium 120 199 260 272 220 13 25 30 31 26 11.1% 12.3% 11.6% 11.5% 11.8%CRESTBROOK INSURANCE COMPANYCondominium 0 0 0 79 158 0 0 0 1 2 0.0% 0.0% 0.0% 1.5% 1.5%Homeowners 0 0 0 745 1,431 0 0 0 8 17 0.0% 0.0% 0.0% 1.0% 1.2%CSE INSURANCE GROUP Homeowners 40,684 42,444 43,028 40,706 38,562 2,133 2,200 2,193 2,004 1,855 5.2% 5.2% 5.1% 4.9% 4.8%Dwll'g Owner Occp'd 3,606 2,804 3,062 3,153 3,102 710 590 644 692 693 19.7% 21.0% 21.0% 21.9% 22.3%Dwll'g Tenant Occp'd 18,717 17,149 20,670 22,589 23,086 2,108 2,084 2,496 2,752 2,796 11.3% 12.2% 12.1% 12.2% 12.1%Condominium 2,014 2,053 2,152 2,251 2,253 52 51 54 68 69 2.6% 2.5% 2.5% 3.0% 3.0%Tenant 1,297 1,257 1,325 1,367 1,337 62 60 55 62 52 4.8% 4.8% 4.1% 4.5% 3.9%Vacant Dwelling 547 565 674 693 817 57 80 122 127 136 10.4% 14.2% 18.1% 18.3% 16.6%ELECTRIC INSURANCE COMPANY Homeowners 1,367 1,327 1,304 1,294 1,278 45 42 40 43 40 3.3% 3.2% 3.1% 3.3% 3.1%Condominium 185 195 203 218 220 8 11 11 11 11 4.2% 5.5% 5.4% 4.8% 5.0%Tenant 235 264 280 293 303 10 9 14 12 15 4.1% 3.5% 4.9% 4.0% 4.9%
2015 Commissioner's Report on Underserved CommunitiesTable C - Number and Percentage of Total Earned Exposure per Company
Section 1 - Real and Personal Property Coverage(2010 - 2014 Data)
18
California Department of Insurance Data Analytics and Reporting
Experience Years 2010 - 2014Page 6 of 15 for Table C, Section 1
Coverage
2010 2011 2012 2013 2014 2010 2011 2012 2013 2014 2010 2011 2012 2013 2014Homeowners 6,056,562 6,057,840 6,025,193 6,069,623 6,007,975 376,697 379,556 378,596 383,093 380,518 6.2% 6.3% 6.3% 6.3% 6.3%Dwll'g Owner Occp'd 402,910 409,551 413,774 385,521 387,680 142,837 142,873 143,485 139,349 140,870 35.4% 34.9% 34.7% 36.1% 36.3%Dwll'g Tenant Occp'd 852,245 905,770 980,440 1,053,698 1,084,451 153,883 156,057 161,902 168,974 173,579 18.1% 17.2% 16.5% 16.0% 16.0%Condominium 690,718 723,260 759,604 805,673 813,948 28,788 32,286 36,647 40,254 41,896 4.2% 4.5% 4.8% 5.0% 5.1%Tenant 1,191,590 1,333,557 1,489,964 1,640,443 1,741,772 66,874 78,703 91,505 105,838 117,307 5.6% 5.9% 6.1% 6.5% 6.7%Dwll'g Content Only 14,488 15,968 17,273 10,051 9,893 661 721 801 438 409 4.6% 4.5% 4.6% 4.4% 4.1%Mobilehome 331,091 302,095 296,137 293,999 289,769 14,977 13,607 13,268 13,013 12,894 4.5% 4.5% 4.5% 4.4% 4.4%Vacant Dwelling 7,110 7,643 7,959 7,969 7,748 1,812 1,759 1,781 1,664 1,412 25.2% 23.0% 22.4% 20.9% 18.2%
Total Earned Exposures for CaliforniaTotal Earned Exposures for Underserved
Communities Percentage of Total Earned Exposures in Underserved Communities
ENCOMPASS INSURANCE COMPANY Homeowners 18,246 17,679 17,966 18,226 17,159 363 340 327 313 247 2.0% 1.9% 1.8% 1.7% 1.4%Dwll'g Owner Occp'd 9,205 9,624 10,461 10,920 10,596 434 438 467 461 419 4.7% 4.5% 4.5% 4.2% 4.0%Condominium 2,255 2,145 2,144 2,161 2,060 37 33 40 42 49 1.6% 1.5% 1.9% 2.0% 2.4%Tenant 1,489 1,614 1,800 1,901 1,696 30 41 40 38 33 2.0% 2.5% 2.2% 2.0% 2.0%Dwll'g Content Only 7,832 8,060 8,597 8,760 8,444 381 381 404 395 361 4.9% 4.7% 4.7% 4.5% 4.3%FARMERS INSURANCE GROUP Homeowners 980,500 986,919 977,534 934,806 893,222 81,570 82,207 81,885 80,330 77,612 8.3% 8.3% 8.4% 8.6% 8.7%Dwll'g Owner Occp'd 197,130 204,883 216,399 216,614 218,250 76,565 78,446 81,305 81,781 84,587 38.8% 38.3% 37.6% 37.8% 38.8%Dwll'g Tenant Occp'd 185,201 187,385 195,591 191,236 189,734 63,562 62,476 63,689 63,115 64,174 34.3% 33.3% 32.6% 33.0% 33.8%Condominium 125,020 130,617 139,816 139,841 133,337 6,141 6,816 8,105 8,140 7,830 4.9% 5.2% 5.8% 5.8% 5.9%Tenant 112,766 118,555 133,258 132,781 131,720 5,628 5,613 6,512 6,838 6,669 5.0% 4.7% 4.9% 5.1% 5.1%FEDERAL INSURANCE COMPANY Homeowners 16,226 18,071 19,813 21,352 22,390 170 178 184 194 201 1.0% 1.0% 0.9% 0.9% 0.9%Condominium 2,856 3,076 3,260 3,384 3,572 38 43 45 57 57 1.3% 1.4% 1.4% 1.7% 1.6%Tenant 1,088 1,185 1,327 1,386 1,459 33 36 41 42 49 3.0% 3.1% 3.1% 3.0% 3.4%FIDELITY NATL INSURANCE COMPANYHomeowners 25,752 21,378 15,880 13,959 15,607 2,420 2,091 1,415 1,013 1,001 9.4% 9.8% 8.9% 7.3% 6.4%Dwll'g Owner Occp'd 1,126 901 432 1,017 1,033 231 193 93 118 101 20.5% 21.5% 21.5% 11.6% 9.8%Dwll'g Tenant Occp'd 5,777 5,581 6,994 7,125 8,016 386 339 384 302 329 6.7% 6.1% 5.5% 4.2% 4.1%Condominium 3,289 4,200 5,325 6,545 7,629 172 227 310 361 442 5.2% 5.4% 5.8% 5.5% 5.8%Tenant 2,419 2,762 2,472 3,313 4,217 114 142 116 134 156 4.7% 5.2% 4.7% 4.0% 3.7%
2015 Commissioner's Report on Underserved CommunitiesTable C - Number and Percentage of Total Earned Exposure per Company
Section 1 - Real and Personal Property Coverage(2010 - 2014 Data)
19
California Department of Insurance Data Analytics and Reporting
Experience Years 2010 - 2014Page 7 of 15 for Table C, Section 1
Coverage
2010 2011 2012 2013 2014 2010 2011 2012 2013 2014 2010 2011 2012 2013 2014Homeowners 6,056,562 6,057,840 6,025,193 6,069,623 6,007,975 376,697 379,556 378,596 383,093 380,518 6.2% 6.3% 6.3% 6.3% 6.3%Dwll'g Owner Occp'd 402,910 409,551 413,774 385,521 387,680 142,837 142,873 143,485 139,349 140,870 35.4% 34.9% 34.7% 36.1% 36.3%Dwll'g Tenant Occp'd 852,245 905,770 980,440 1,053,698 1,084,451 153,883 156,057 161,902 168,974 173,579 18.1% 17.2% 16.5% 16.0% 16.0%Condominium 690,718 723,260 759,604 805,673 813,948 28,788 32,286 36,647 40,254 41,896 4.2% 4.5% 4.8% 5.0% 5.1%Tenant 1,191,590 1,333,557 1,489,964 1,640,443 1,741,772 66,874 78,703 91,505 105,838 117,307 5.6% 5.9% 6.1% 6.5% 6.7%Dwll'g Content Only 14,488 15,968 17,273 10,051 9,893 661 721 801 438 409 4.6% 4.5% 4.6% 4.4% 4.1%Mobilehome 331,091 302,095 296,137 293,999 289,769 14,977 13,607 13,268 13,013 12,894 4.5% 4.5% 4.5% 4.4% 4.4%Vacant Dwelling 7,110 7,643 7,959 7,969 7,748 1,812 1,759 1,781 1,664 1,412 25.2% 23.0% 22.4% 20.9% 18.2%
Total Earned Exposures for CaliforniaTotal Earned Exposures for Underserved
Communities Percentage of Total Earned Exposures in Underserved Communities
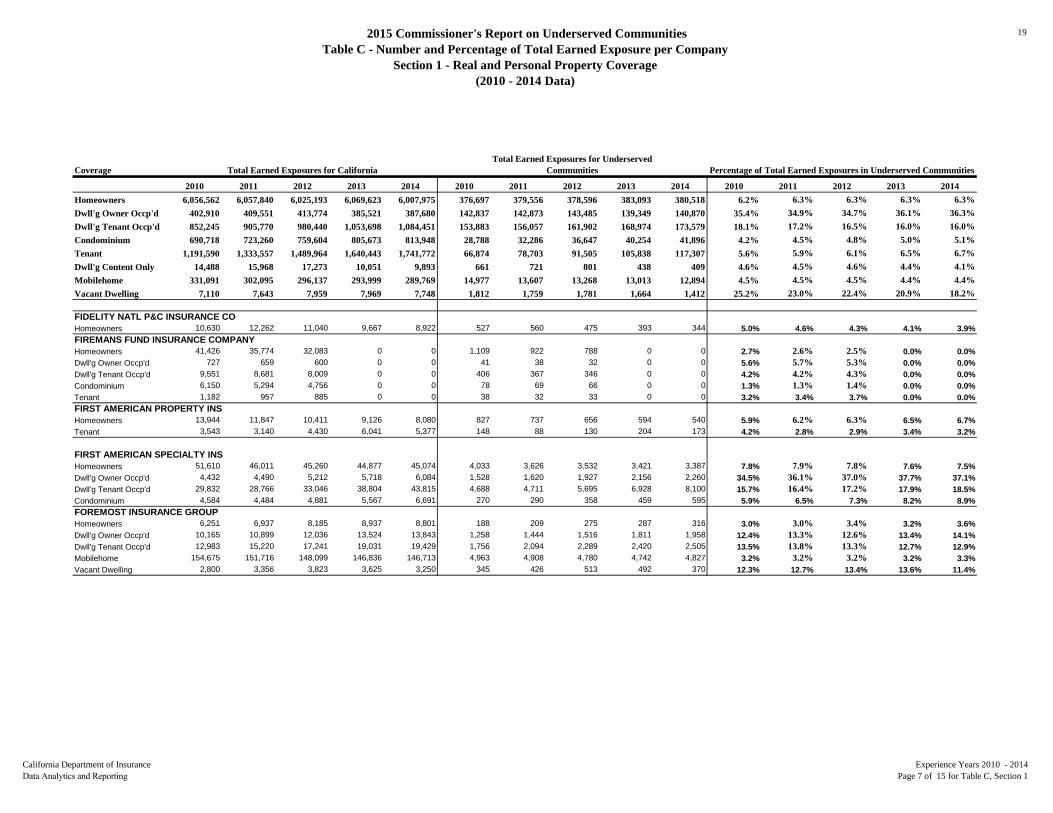
FIDELITY NATL P&C INSURANCE COHomeowners 10,630 12,262 11,040 9,667 8,922 527 560 475 393 344 5.0% 4.6% 4.3% 4.1% 3.9%FIREMANS FUND INSURANCE COMPANYHomeowners 41,426 35,774 32,083 0 0 1,109 922 788 0 0 2.7% 2.6% 2.5% 0.0% 0.0%Dwll'g Owner Occp'd 727 659 600 0 0 41 38 32 0 0 5.6% 5.7% 5.3% 0.0% 0.0%Dwll'g Tenant Occp'd 9,551 8,681 8,009 0 0 406 367 346 0 0 4.2% 4.2% 4.3% 0.0% 0.0%Condominium 6,150 5,294 4,756 0 0 78 69 66 0 0 1.3% 1.3% 1.4% 0.0% 0.0%Tenant 1,182 957 885 0 0 38 32 33 0 0 3.2% 3.4% 3.7% 0.0% 0.0%FIRST AMERICAN PROPERTY INS Homeowners 13,944 11,847 10,411 9,126 8,080 827 737 656 594 540 5.9% 6.2% 6.3% 6.5% 6.7%Tenant 3,543 3,140 4,430 6,041 5,377 148 88 130 204 173 4.2% 2.8% 2.9% 3.4% 3.2%
FIRST AMERICAN SPECIALTY INS Homeowners 51,610 46,011 45,260 44,877 45,074 4,033 3,626 3,532 3,421 3,387 7.8% 7.9% 7.8% 7.6% 7.5%Dwll'g Owner Occp'd 4,432 4,490 5,212 5,718 6,084 1,528 1,620 1,927 2,156 2,260 34.5% 36.1% 37.0% 37.7% 37.1%Dwll'g Tenant Occp'd 29,832 28,766 33,046 38,804 43,815 4,688 4,711 5,695 6,928 8,100 15.7% 16.4% 17.2% 17.9% 18.5%Condominium 4,584 4,484 4,881 5,567 6,691 270 290 358 459 595 5.9% 6.5% 7.3% 8.2% 8.9%FOREMOST INSURANCE GROUP Homeowners 6,251 6,937 8,185 8,937 8,801 188 209 275 287 316 3.0% 3.0% 3.4% 3.2% 3.6%Dwll'g Owner Occp'd 10,165 10,899 12,036 13,524 13,843 1,258 1,444 1,516 1,811 1,958 12.4% 13.3% 12.6% 13.4% 14.1%Dwll'g Tenant Occp'd 12,983 15,220 17,241 19,031 19,429 1,756 2,094 2,289 2,420 2,505 13.5% 13.8% 13.3% 12.7% 12.9%Mobilehome 154,675 151,716 148,099 146,836 146,713 4,963 4,908 4,780 4,742 4,827 3.2% 3.2% 3.2% 3.2% 3.3%Vacant Dwelling 2,800 3,356 3,823 3,625 3,250 345 426 513 492 370 12.3% 12.7% 13.4% 13.6% 11.4%

2015 Commissioner's Report on Underserved CommunitiesTable C - Number and Percentage of Total Earned Exposure per Company
Section 1 - Real and Personal Property Coverage(2010 - 2014 Data)
20
California Department of Insurance Data Analytics and Reporting
Experience Years 2010 - 2014Page 8 of 15 for Table C, Section 1
Coverage
2010 2011 2012 2013 2014 2010 2011 2012 2013 2014 2010 2011 2012 2013 2014Homeowners 6,056,562 6,057,840 6,025,193 6,069,623 6,007,975 376,697 379,556 378,596 383,093 380,518 6.2% 6.3% 6.3% 6.3% 6.3%Dwll'g Owner Occp'd 402,910 409,551 413,774 385,521 387,680 142,837 142,873 143,485 139,349 140,870 35.4% 34.9% 34.7% 36.1% 36.3%Dwll'g Tenant Occp'd 852,245 905,770 980,440 1,053,698 1,084,451 153,883 156,057 161,902 168,974 173,579 18.1% 17.2% 16.5% 16.0% 16.0%Condominium 690,718 723,260 759,604 805,673 813,948 28,788 32,286 36,647 40,254 41,896 4.2% 4.5% 4.8% 5.0% 5.1%Tenant 1,191,590 1,333,557 1,489,964 1,640,443 1,741,772 66,874 78,703 91,505 105,838 117,307 5.6% 5.9% 6.1% 6.5% 6.7%Dwll'g Content Only 14,488 15,968 17,273 10,051 9,893 661 721 801 438 409 4.6% 4.5% 4.6% 4.4% 4.1%Mobilehome 331,091 302,095 296,137 293,999 289,769 14,977 13,607 13,268 13,013 12,894 4.5% 4.5% 4.5% 4.4% 4.4%Vacant Dwelling 7,110 7,643 7,959 7,969 7,748 1,812 1,759 1,781 1,664 1,412 25.2% 23.0% 22.4% 20.9% 18.2%
Total Earned Exposures for CaliforniaTotal Earned Exposures for Underserved
Communities Percentage of Total Earned Exposures in Underserved Communities
GARRISON PROP & CASUALTY INS COHomeowners 5,806 7,516 9,540 11,855 14,287 141 191 235 287 341 2.4% 2.5% 2.5% 2.4% 2.4%Dwll'g Tenant Occp'd 1,370 1,866 2,476 2,970 3,349 57 77 103 120 142 4.1% 4.1% 4.2% 4.0% 4.2%Condominium 1,182 1,549 1,977 2,326 2,720 62 79 93 104 126 5.3% 5.1% 4.7% 4.5% 4.6%Tenant 11,604 15,124 19,108 22,754 26,140 516 703 912 1,107 1,359 4.4% 4.6% 4.8% 4.9% 5.2%GOLDEN BEAR INSHomeowners 0 3,176 3,566 3,915 5,314 0 202 212 223 307 0.0% 6.4% 5.9% 5.7% 5.8%Dwll'g Owner Occp'd 0 0 0 0 372 0 0 0 0 73 0.0% 0.0% 0.0% 0.0% 19.6%Dwll'g Tenant Occp'd 0 0 0 0 1,156 0 0 0 0 114 0.0% 0.0% 0.0% 0.0% 9.8%GRANGE INSURANCE GROUP Homeowners 6,879 6,781 6,765 6,784 6,937 55 56 48 38 39 0.8% 0.8% 0.7% 0.6% 0.6%Condominium 105 94 132 135 145 0 0 0 0 0 0.0% 0.0% 0.0% 0.0% 0.0%Tenant 669 441 901 968 1,024 6 7 8 8 9 0.9% 1.5% 0.8% 0.9% 0.9%Mobilehome 1,007 1,068 1,088 1,047 989 1 0 0 0 0 0.0% 0.0% 0.0% 0.0% 0.0%HOMESITE INS CO of CAHomeowners 18,543 19,515 20,936 25,692 33,170 1,004 1,067 1,134 1,306 1,597 5.4% 5.5% 5.4% 5.1% 4.8%Condominium 3,359 3,700 4,570 5,709 7,238 218 269 370 465 583 6.5% 7.3% 8.1% 8.2% 8.1%Tenant 10,817 12,774 20,353 28,875 41,518 652 779 1,343 1,965 2,948 6.0% 6.1% 6.6% 6.8% 7.1%HORACE MANN INSURANCE COMPANY Homeowners 12,431 12,698 13,122 13,455 13,537 586 572 584 607 606 4.7% 4.5% 4.5% 4.5% 4.5%Condominium 817 839 877 917 943 13 15 17 23 26 1.6% 1.8% 2.0% 2.5% 2.8%Tenant 995 1,069 1,287 1,651 1,856 39 33 54 79 90 3.9% 3.1% 4.2% 4.8% 4.8%HORACE MANN PROP & CAS INS CO Homeowners 6,144 5,597 5,070 4,775 4,674 494 459 409 372 349 8.0% 8.2% 8.1% 7.8% 7.5%Condominium 216 220 232 234 247 6 8 8 9 10 2.7% 3.7% 3.6% 3.9% 4.2%Tenant 457 497 668 857 946 17 27 45 56 76 3.7% 5.3% 6.7% 6.6% 8.0%
2015 Commissioner's Report on Underserved CommunitiesTable C - Number and Percentage of Total Earned Exposure per Company
Section 1 - Real and Personal Property Coverage(2010 - 2014 Data)
21
California Department of Insurance Data Analytics and Reporting
Experience Years 2010 - 2014Page 9 of 15 for Table C, Section 1
Coverage
2010 2011 2012 2013 2014 2010 2011 2012 2013 2014 2010 2011 2012 2013 2014Homeowners 6,056,562 6,057,840 6,025,193 6,069,623 6,007,975 376,697 379,556 378,596 383,093 380,518 6.2% 6.3% 6.3% 6.3% 6.3%Dwll'g Owner Occp'd 402,910 409,551 413,774 385,521 387,680 142,837 142,873 143,485 139,349 140,870 35.4% 34.9% 34.7% 36.1% 36.3%Dwll'g Tenant Occp'd 852,245 905,770 980,440 1,053,698 1,084,451 153,883 156,057 161,902 168,974 173,579 18.1% 17.2% 16.5% 16.0% 16.0%Condominium 690,718 723,260 759,604 805,673 813,948 28,788 32,286 36,647 40,254 41,896 4.2% 4.5% 4.8% 5.0% 5.1%Tenant 1,191,590 1,333,557 1,489,964 1,640,443 1,741,772 66,874 78,703 91,505 105,838 117,307 5.6% 5.9% 6.1% 6.5% 6.7%Dwll'g Content Only 14,488 15,968 17,273 10,051 9,893 661 721 801 438 409 4.6% 4.5% 4.6% 4.4% 4.1%Mobilehome 331,091 302,095 296,137 293,999 289,769 14,977 13,607 13,268 13,013 12,894 4.5% 4.5% 4.5% 4.4% 4.4%Vacant Dwelling 7,110 7,643 7,959 7,969 7,748 1,812 1,759 1,781 1,664 1,412 25.2% 23.0% 22.4% 20.9% 18.2%
Total Earned Exposures for CaliforniaTotal Earned Exposures for Underserved
Communities Percentage of Total Earned Exposures in Underserved Communities
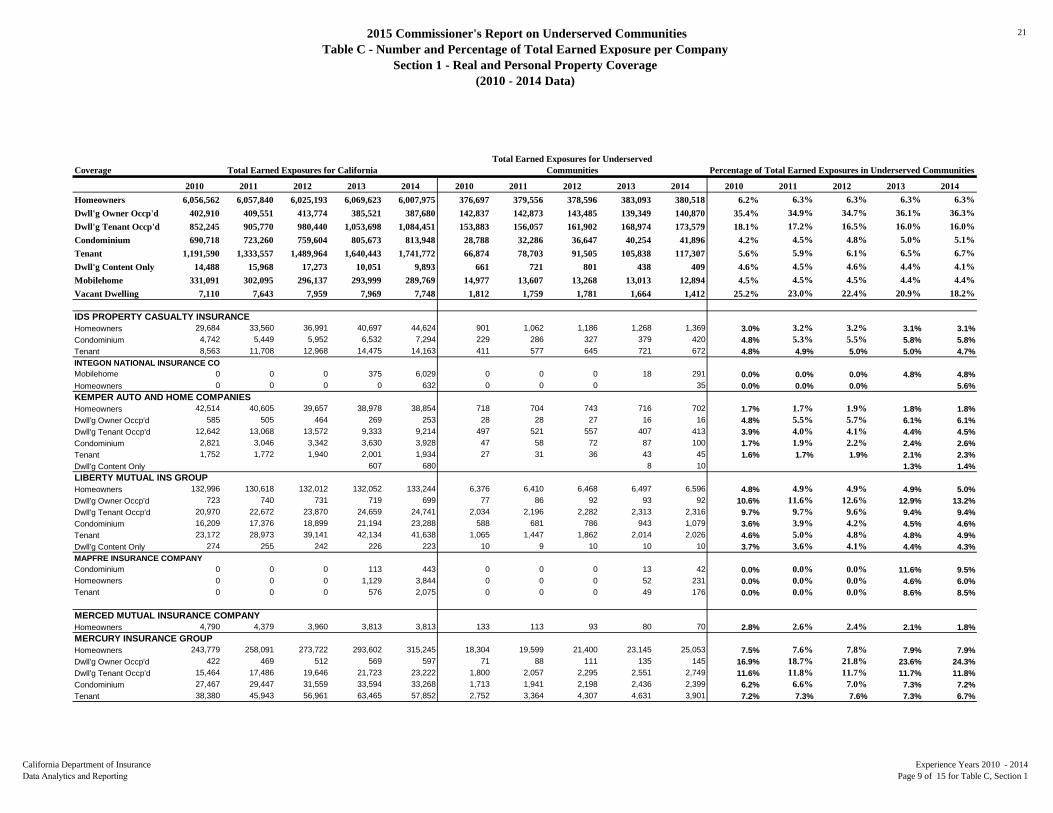
IDS PROPERTY CASUALTY INSURANCEHomeowners 29,684 33,560 36,991 40,697 44,624 901 1,062 1,186 1,268 1,369 3.0% 3.2% 3.2% 3.1% 3.1%Condominium 4,742 5,449 5,952 6,532 7,294 229 286 327 379 420 4.8% 5.3% 5.5% 5.8% 5.8%Tenant 8,563 11,708 12,968 14,475 14,163 411 577 645 721 672 4.8% 4.9% 5.0% 5.0% 4.7%INTEGON NATIONAL INSURANCE COMobilehome 0 0 0 375 6,029 0 0 0 18 291 0.0% 0.0% 0.0% 4.8% 4.8%Homeowners 0 0 0 0 632 0 0 0 35 0.0% 0.0% 0.0% 5.6%KEMPER AUTO AND HOME COMPANIESHomeowners 42,514 40,605 39,657 38,978 38,854 718 704 743 716 702 1.7% 1.7% 1.9% 1.8% 1.8%Dwll'g Owner Occp'd 585 505 464 269 253 28 28 27 16 16 4.8% 5.5% 5.7% 6.1% 6.1%Dwll'g Tenant Occp'd 12,642 13,068 13,572 9,333 9,214 497 521 557 407 413 3.9% 4.0% 4.1% 4.4% 4.5%Condominium 2,821 3,046 3,342 3,630 3,928 47 58 72 87 100 1.7% 1.9% 2.2% 2.4% 2.6%Tenant 1,752 1,772 1,940 2,001 1,934 27 31 36 43 45 1.6% 1.7% 1.9% 2.1% 2.3%Dwll'g Content Only 607 680 8 10 1.3% 1.4%LIBERTY MUTUAL INS GROUP Homeowners 132,996 130,618 132,012 132,052 133,244 6,376 6,410 6,468 6,497 6,596 4.8% 4.9% 4.9% 4.9% 5.0%Dwll'g Owner Occp'd 723 740 731 719 699 77 86 92 93 92 10.6% 11.6% 12.6% 12.9% 13.2%Dwll'g Tenant Occp'd 20,970 22,672 23,870 24,659 24,741 2,034 2,196 2,282 2,313 2,316 9.7% 9.7% 9.6% 9.4% 9.4%Condominium 16,209 17,376 18,899 21,194 23,288 588 681 786 943 1,079 3.6% 3.9% 4.2% 4.5% 4.6%Tenant 23,172 28,973 39,141 42,134 41,638 1,065 1,447 1,862 2,014 2,026 4.6% 5.0% 4.8% 4.8% 4.9%Dwll'g Content Only 274 255 242 226 223 10 9 10 10 10 3.7% 3.6% 4.1% 4.4% 4.3%MAPFRE INSURANCE COMPANYCondominium 0 0 0 113 443 0 0 0 13 42 0.0% 0.0% 0.0% 11.6% 9.5%Homeowners 0 0 0 1,129 3,844 0 0 0 52 231 0.0% 0.0% 0.0% 4.6% 6.0%Tenant 0 0 0 576 2,075 0 0 0 49 176 0.0% 0.0% 0.0% 8.6% 8.5%
MERCED MUTUAL INSURANCE COMPANYHomeowners 4,790 4,379 3,960 3,813 3,813 133 113 93 80 70 2.8% 2.6% 2.4% 2.1% 1.8%MERCURY INSURANCE GROUP Homeowners 243,779 258,091 273,722 293,602 315,245 18,304 19,599 21,400 23,145 25,053 7.5% 7.6% 7.8% 7.9% 7.9%Dwll'g Owner Occp'd 422 469 512 569 597 71 88 111 135 145 16.9% 18.7% 21.8% 23.6% 24.3%Dwll'g Tenant Occp'd 15,464 17,486 19,646 21,723 23,222 1,800 2,057 2,295 2,551 2,749 11.6% 11.8% 11.7% 11.7% 11.8%Condominium 27,467 29,447 31,559 33,594 33,268 1,713 1,941 2,198 2,436 2,399 6.2% 6.6% 7.0% 7.3% 7.2%Tenant 38,380 45,943 56,961 63,465 57,852 2,752 3,364 4,307 4,631 3,901 7.2% 7.3% 7.6% 7.3% 6.7%
2015 Commissioner's Report on Underserved CommunitiesTable C - Number and Percentage of Total Earned Exposure per Company
Section 1 - Real and Personal Property Coverage(2010 - 2014 Data)
22
California Department of Insurance Data Analytics and Reporting
Experience Years 2010 - 2014Page 10 of 15 for Table C, Section 1
Coverage
2010 2011 2012 2013 2014 2010 2011 2012 2013 2014 2010 2011 2012 2013 2014Homeowners 6,056,562 6,057,840 6,025,193 6,069,623 6,007,975 376,697 379,556 378,596 383,093 380,518 6.2% 6.3% 6.3% 6.3% 6.3%Dwll'g Owner Occp'd 402,910 409,551 413,774 385,521 387,680 142,837 142,873 143,485 139,349 140,870 35.4% 34.9% 34.7% 36.1% 36.3%Dwll'g Tenant Occp'd 852,245 905,770 980,440 1,053,698 1,084,451 153,883 156,057 161,902 168,974 173,579 18.1% 17.2% 16.5% 16.0% 16.0%Condominium 690,718 723,260 759,604 805,673 813,948 28,788 32,286 36,647 40,254 41,896 4.2% 4.5% 4.8% 5.0% 5.1%Tenant 1,191,590 1,333,557 1,489,964 1,640,443 1,741,772 66,874 78,703 91,505 105,838 117,307 5.6% 5.9% 6.1% 6.5% 6.7%Dwll'g Content Only 14,488 15,968 17,273 10,051 9,893 661 721 801 438 409 4.6% 4.5% 4.6% 4.4% 4.1%Mobilehome 331,091 302,095 296,137 293,999 289,769 14,977 13,607 13,268 13,013 12,894 4.5% 4.5% 4.5% 4.4% 4.4%Vacant Dwelling 7,110 7,643 7,959 7,969 7,748 1,812 1,759 1,781 1,664 1,412 25.2% 23.0% 22.4% 20.9% 18.2%
Total Earned Exposures for CaliforniaTotal Earned Exposures for Underserved
Communities Percentage of Total Earned Exposures in Underserved Communities
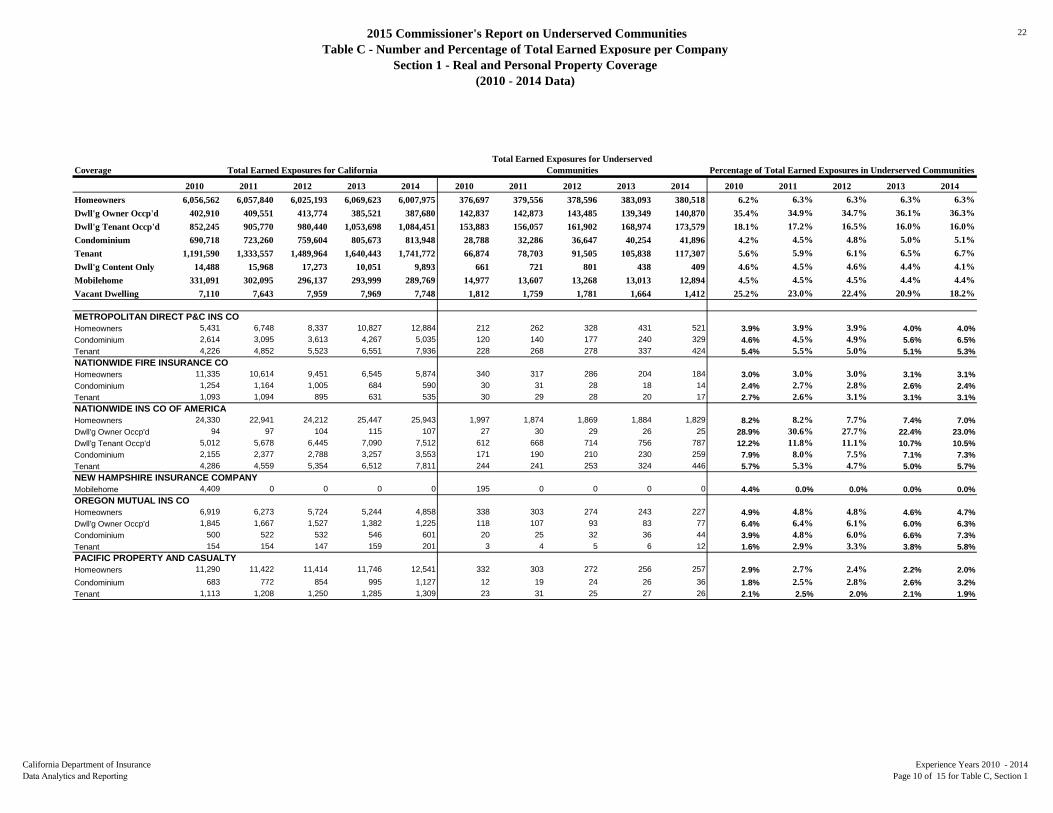
METROPOLITAN DIRECT P&C INS COHomeowners 5,431 6,748 8,337 10,827 12,884 212 262 328 431 521 3.9% 3.9% 3.9% 4.0% 4.0%Condominium 2,614 3,095 3,613 4,267 5,035 120 140 177 240 329 4.6% 4.5% 4.9% 5.6% 6.5%Tenant 4,226 4,852 5,523 6,551 7,936 228 268 278 337 424 5.4% 5.5% 5.0% 5.1% 5.3%NATIONWIDE FIRE INSURANCE COHomeowners 11,335 10,614 9,451 6,545 5,874 340 317 286 204 184 3.0% 3.0% 3.0% 3.1% 3.1%Condominium 1,254 1,164 1,005 684 590 30 31 28 18 14 2.4% 2.7% 2.8% 2.6% 2.4%Tenant 1,093 1,094 895 631 535 30 29 28 20 17 2.7% 2.6% 3.1% 3.1% 3.1%NATIONWIDE INS CO OF AMERICA Homeowners 24,330 22,941 24,212 25,447 25,943 1,997 1,874 1,869 1,884 1,829 8.2% 8.2% 7.7% 7.4% 7.0%Dwll'g Owner Occp'd 94 97 104 115 107 27 30 29 26 25 28.9% 30.6% 27.7% 22.4% 23.0%Dwll'g Tenant Occp'd 5,012 5,678 6,445 7,090 7,512 612 668 714 756 787 12.2% 11.8% 11.1% 10.7% 10.5%Condominium 2,155 2,377 2,788 3,257 3,553 171 190 210 230 259 7.9% 8.0% 7.5% 7.1% 7.3%Tenant 4,286 4,559 5,354 6,512 7,811 244 241 253 324 446 5.7% 5.3% 4.7% 5.0% 5.7%NEW HAMPSHIRE INSURANCE COMPANYMobilehome 4,409 0 0 0 0 195 0 0 0 0 4.4% 0.0% 0.0% 0.0% 0.0%OREGON MUTUAL INS COHomeowners 6,919 6,273 5,724 5,244 4,858 338 303 274 243 227 4.9% 4.8% 4.8% 4.6% 4.7%Dwll'g Owner Occp'd 1,845 1,667 1,527 1,382 1,225 118 107 93 83 77 6.4% 6.4% 6.1% 6.0% 6.3%Condominium 500 522 532 546 601 20 25 32 36 44 3.9% 4.8% 6.0% 6.6% 7.3%Tenant 154 154 147 159 201 3 4 5 6 12 1.6% 2.9% 3.3% 3.8% 5.8%PACIFIC PROPERTY AND CASUALTY Homeowners 11,290 11,422 11,414 11,746 12,541 332 303 272 256 257 2.9% 2.7% 2.4% 2.2% 2.0%Condominium 683 772 854 995 1,127 12 19 24 26 36 1.8% 2.5% 2.8% 2.6% 3.2%Tenant 1,113 1,208 1,250 1,285 1,309 23 31 25 27 26 2.1% 2.5% 2.0% 2.1% 1.9%
2015 Commissioner's Report on Underserved CommunitiesTable C - Number and Percentage of Total Earned Exposure per Company
Section 1 - Real and Personal Property Coverage(2010 - 2014 Data)
23
California Department of Insurance Data Analytics and Reporting
Experience Years 2010 - 2014Page 11 of 15 for Table C, Section 1
Coverage
2010 2011 2012 2013 2014 2010 2011 2012 2013 2014 2010 2011 2012 2013 2014Homeowners 6,056,562 6,057,840 6,025,193 6,069,623 6,007,975 376,697 379,556 378,596 383,093 380,518 6.2% 6.3% 6.3% 6.3% 6.3%Dwll'g Owner Occp'd 402,910 409,551 413,774 385,521 387,680 142,837 142,873 143,485 139,349 140,870 35.4% 34.9% 34.7% 36.1% 36.3%Dwll'g Tenant Occp'd 852,245 905,770 980,440 1,053,698 1,084,451 153,883 156,057 161,902 168,974 173,579 18.1% 17.2% 16.5% 16.0% 16.0%Condominium 690,718 723,260 759,604 805,673 813,948 28,788 32,286 36,647 40,254 41,896 4.2% 4.5% 4.8% 5.0% 5.1%Tenant 1,191,590 1,333,557 1,489,964 1,640,443 1,741,772 66,874 78,703 91,505 105,838 117,307 5.6% 5.9% 6.1% 6.5% 6.7%Dwll'g Content Only 14,488 15,968 17,273 10,051 9,893 661 721 801 438 409 4.6% 4.5% 4.6% 4.4% 4.1%Mobilehome 331,091 302,095 296,137 293,999 289,769 14,977 13,607 13,268 13,013 12,894 4.5% 4.5% 4.5% 4.4% 4.4%Vacant Dwelling 7,110 7,643 7,959 7,969 7,748 1,812 1,759 1,781 1,664 1,412 25.2% 23.0% 22.4% 20.9% 18.2%
Total Earned Exposures for CaliforniaTotal Earned Exposures for Underserved
Communities Percentage of Total Earned Exposures in Underserved Communities
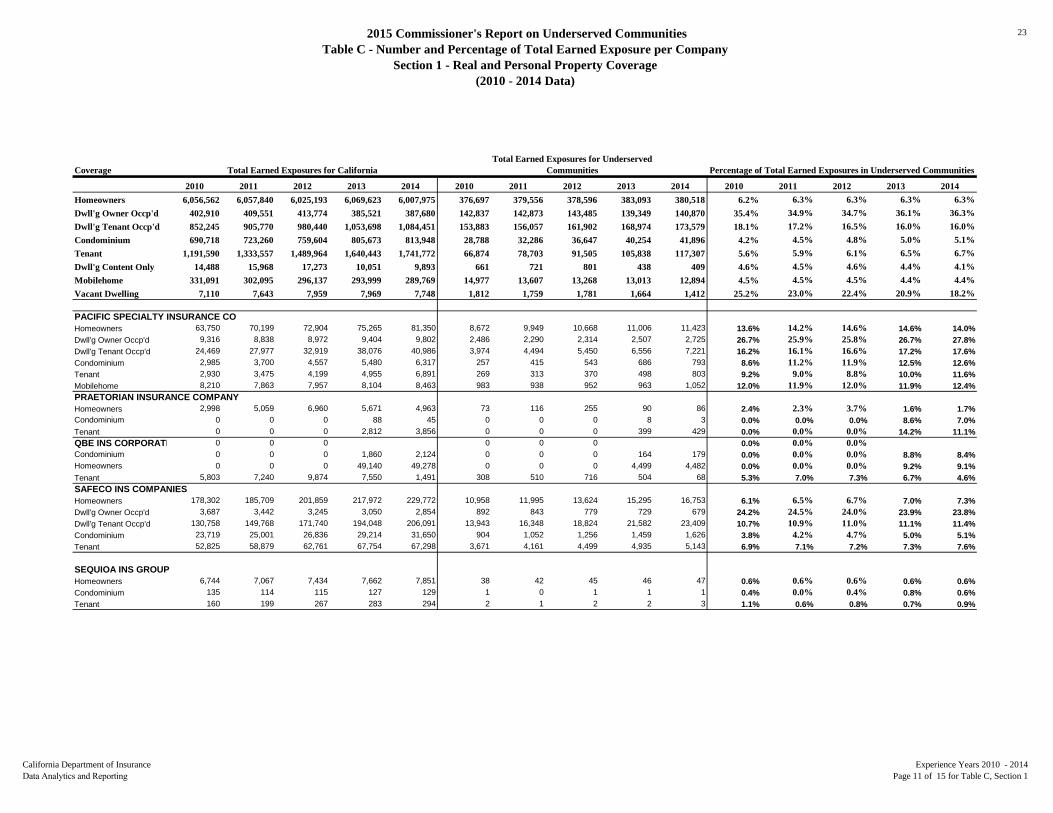
PACIFIC SPECIALTY INSURANCE COHomeowners 63,750 70,199 72,904 75,265 81,350 8,672 9,949 10,668 11,006 11,423 13.6% 14.2% 14.6% 14.6% 14.0%Dwll'g Owner Occp'd 9,316 8,838 8,972 9,404 9,802 2,486 2,290 2,314 2,507 2,725 26.7% 25.9% 25.8% 26.7% 27.8%Dwll'g Tenant Occp'd 24,469 27,977 32,919 38,076 40,986 3,974 4,494 5,450 6,556 7,221 16.2% 16.1% 16.6% 17.2% 17.6%Condominium 2,985 3,700 4,557 5,480 6,317 257 415 543 686 793 8.6% 11.2% 11.9% 12.5% 12.6%Tenant 2,930 3,475 4,199 4,955 6,891 269 313 370 498 803 9.2% 9.0% 8.8% 10.0% 11.6%Mobilehome 8,210 7,863 7,957 8,104 8,463 983 938 952 963 1,052 12.0% 11.9% 12.0% 11.9% 12.4%PRAETORIAN INSURANCE COMPANY Homeowners 2,998 5,059 6,960 5,671 4,963 73 116 255 90 86 2.4% 2.3% 3.7% 1.6% 1.7%Condominium 0 0 0 88 45 0 0 0 8 3 0.0% 0.0% 0.0% 8.6% 7.0%Tenant 0 0 0 2,812 3,856 0 0 0 399 429 0.0% 0.0% 0.0% 14.2% 11.1%QBE INS CORPORATI 0 0 0 0 0 0 0.0% 0.0% 0.0%Condominium 0 0 0 1,860 2,124 0 0 0 164 179 0.0% 0.0% 0.0% 8.8% 8.4%Homeowners 0 0 0 49,140 49,278 0 0 0 4,499 4,482 0.0% 0.0% 0.0% 9.2% 9.1%Tenant 5,803 7,240 9,874 7,550 1,491 308 510 716 504 68 5.3% 7.0% 7.3% 6.7% 4.6%SAFECO INS COMPANIESHomeowners 178,302 185,709 201,859 217,972 229,772 10,958 11,995 13,624 15,295 16,753 6.1% 6.5% 6.7% 7.0% 7.3%Dwll'g Owner Occp'd 3,687 3,442 3,245 3,050 2,854 892 843 779 729 679 24.2% 24.5% 24.0% 23.9% 23.8%Dwll'g Tenant Occp'd 130,758 149,768 171,740 194,048 206,091 13,943 16,348 18,824 21,582 23,409 10.7% 10.9% 11.0% 11.1% 11.4%Condominium 23,719 25,001 26,836 29,214 31,650 904 1,052 1,256 1,459 1,626 3.8% 4.2% 4.7% 5.0% 5.1%Tenant 52,825 58,879 62,761 67,754 67,298 3,671 4,161 4,499 4,935 5,143 6.9% 7.1% 7.2% 7.3% 7.6%
SEQUIOA INS GROUPHomeowners 6,744 7,067 7,434 7,662 7,851 38 42 45 46 47 0.6% 0.6% 0.6% 0.6% 0.6%Condominium 135 114 115 127 129 1 0 1 1 1 0.4% 0.0% 0.4% 0.8% 0.6%Tenant 160 199 267 283 294 2 1 2 2 3 1.1% 0.6% 0.8% 0.7% 0.9%
2015 Commissioner's Report on Underserved CommunitiesTable C - Number and Percentage of Total Earned Exposure per Company
Section 1 - Real and Personal Property Coverage(2010 - 2014 Data)
24
California Department of Insurance Data Analytics and Reporting
Experience Years 2010 - 2014Page 12 of 15 for Table C, Section 1
Coverage
2010 2011 2012 2013 2014 2010 2011 2012 2013 2014 2010 2011 2012 2013 2014Homeowners 6,056,562 6,057,840 6,025,193 6,069,623 6,007,975 376,697 379,556 378,596 383,093 380,518 6.2% 6.3% 6.3% 6.3% 6.3%Dwll'g Owner Occp'd 402,910 409,551 413,774 385,521 387,680 142,837 142,873 143,485 139,349 140,870 35.4% 34.9% 34.7% 36.1% 36.3%Dwll'g Tenant Occp'd 852,245 905,770 980,440 1,053,698 1,084,451 153,883 156,057 161,902 168,974 173,579 18.1% 17.2% 16.5% 16.0% 16.0%Condominium 690,718 723,260 759,604 805,673 813,948 28,788 32,286 36,647 40,254 41,896 4.2% 4.5% 4.8% 5.0% 5.1%Tenant 1,191,590 1,333,557 1,489,964 1,640,443 1,741,772 66,874 78,703 91,505 105,838 117,307 5.6% 5.9% 6.1% 6.5% 6.7%Dwll'g Content Only 14,488 15,968 17,273 10,051 9,893 661 721 801 438 409 4.6% 4.5% 4.6% 4.4% 4.1%Mobilehome 331,091 302,095 296,137 293,999 289,769 14,977 13,607 13,268 13,013 12,894 4.5% 4.5% 4.5% 4.4% 4.4%Vacant Dwelling 7,110 7,643 7,959 7,969 7,748 1,812 1,759 1,781 1,664 1,412 25.2% 23.0% 22.4% 20.9% 18.2%
Total Earned Exposures for CaliforniaTotal Earned Exposures for Underserved
Communities Percentage of Total Earned Exposures in Underserved Communities
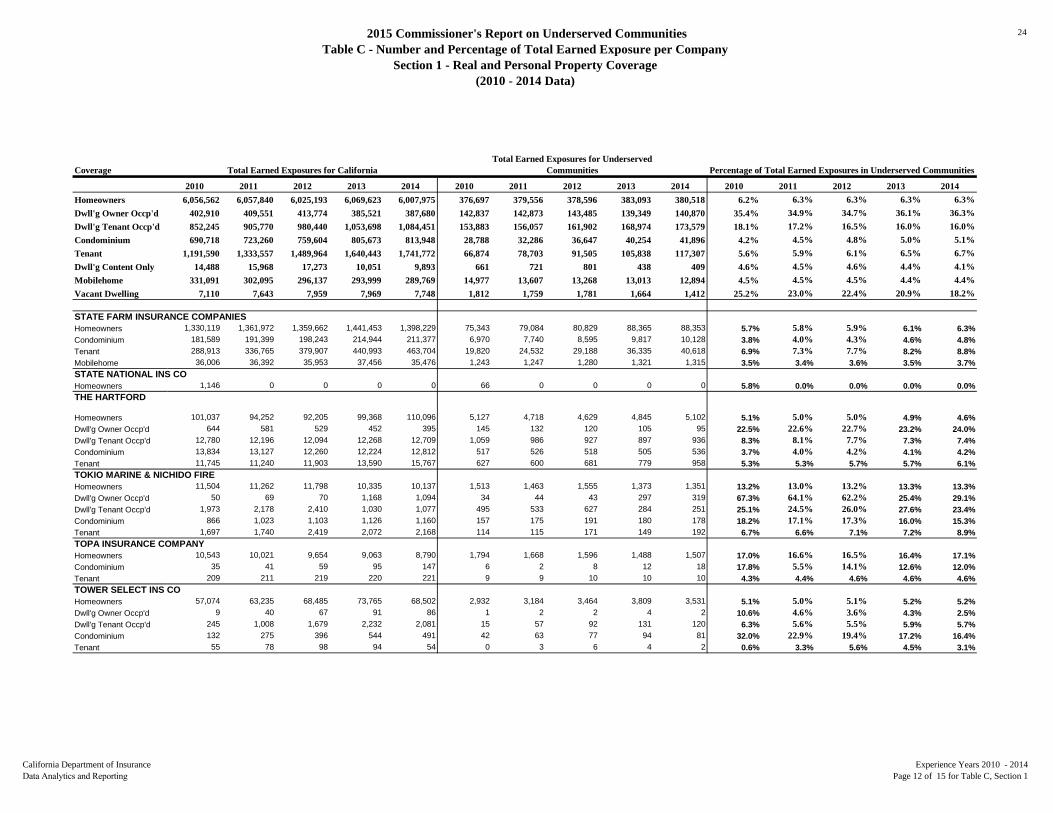
STATE FARM INSURANCE COMPANIESHomeowners 1,330,119 1,361,972 1,359,662 1,441,453 1,398,229 75,343 79,084 80,829 88,365 88,353 5.7% 5.8% 5.9% 6.1% 6.3%Condominium 181,589 191,399 198,243 214,944 211,377 6,970 7,740 8,595 9,817 10,128 3.8% 4.0% 4.3% 4.6% 4.8%Tenant 288,913 336,765 379,907 440,993 463,704 19,820 24,532 29,188 36,335 40,618 6.9% 7.3% 7.7% 8.2% 8.8%Mobilehome 36,006 36,392 35,953 37,456 35,476 1,243 1,247 1,280 1,321 1,315 3.5% 3.4% 3.6% 3.5% 3.7%STATE NATIONAL INS CO Homeowners 1,146 0 0 0 0 66 0 0 0 0 5.8% 0.0% 0.0% 0.0% 0.0%THE HARTFORD
Homeowners 101,037 94,252 92,205 99,368 110,096 5,127 4,718 4,629 4,845 5,102 5.1% 5.0% 5.0% 4.9% 4.6%Dwll'g Owner Occp'd 644 581 529 452 395 145 132 120 105 95 22.5% 22.6% 22.7% 23.2% 24.0%Dwll'g Tenant Occp'd 12,780 12,196 12,094 12,268 12,709 1,059 986 927 897 936 8.3% 8.1% 7.7% 7.3% 7.4%Condominium 13,834 13,127 12,260 12,224 12,812 517 526 518 505 536 3.7% 4.0% 4.2% 4.1% 4.2%Tenant 11,745 11,240 11,903 13,590 15,767 627 600 681 779 958 5.3% 5.3% 5.7% 5.7% 6.1%TOKIO MARINE & NICHIDO FIRE Homeowners 11,504 11,262 11,798 10,335 10,137 1,513 1,463 1,555 1,373 1,351 13.2% 13.0% 13.2% 13.3% 13.3%Dwll'g Owner Occp'd 50 69 70 1,168 1,094 34 44 43 297 319 67.3% 64.1% 62.2% 25.4% 29.1%Dwll'g Tenant Occp'd 1,973 2,178 2,410 1,030 1,077 495 533 627 284 251 25.1% 24.5% 26.0% 27.6% 23.4%Condominium 866 1,023 1,103 1,126 1,160 157 175 191 180 178 18.2% 17.1% 17.3% 16.0% 15.3%Tenant 1,697 1,740 2,419 2,072 2,168 114 115 171 149 192 6.7% 6.6% 7.1% 7.2% 8.9%TOPA INSURANCE COMPANY Homeowners 10,543 10,021 9,654 9,063 8,790 1,794 1,668 1,596 1,488 1,507 17.0% 16.6% 16.5% 16.4% 17.1%Condominium 35 41 59 95 147 6 2 8 12 18 17.8% 5.5% 14.1% 12.6% 12.0%Tenant 209 211 219 220 221 9 9 10 10 10 4.3% 4.4% 4.6% 4.6% 4.6%TOWER SELECT INS COHomeowners 57,074 63,235 68,485 73,765 68,502 2,932 3,184 3,464 3,809 3,531 5.1% 5.0% 5.1% 5.2% 5.2%Dwll'g Owner Occp'd 9 40 67 91 86 1 2 2 4 2 10.6% 4.6% 3.6% 4.3% 2.5%Dwll'g Tenant Occp'd 245 1,008 1,679 2,232 2,081 15 57 92 131 120 6.3% 5.6% 5.5% 5.9% 5.7%Condominium 132 275 396 544 491 42 63 77 94 81 32.0% 22.9% 19.4% 17.2% 16.4%Tenant 55 78 98 94 54 0 3 6 4 2 0.6% 3.3% 5.6% 4.5% 3.1%
2015 Commissioner's Report on Underserved CommunitiesTable C - Number and Percentage of Total Earned Exposure per Company
Section 1 - Real and Personal Property Coverage(2010 - 2014 Data)
25
California Department of Insurance Data Analytics and Reporting
Experience Years 2010 - 2014Page 13 of 15 for Table C, Section 1
Coverage
2010 2011 2012 2013 2014 2010 2011 2012 2013 2014 2010 2011 2012 2013 2014Homeowners 6,056,562 6,057,840 6,025,193 6,069,623 6,007,975 376,697 379,556 378,596 383,093 380,518 6.2% 6.3% 6.3% 6.3% 6.3%Dwll'g Owner Occp'd 402,910 409,551 413,774 385,521 387,680 142,837 142,873 143,485 139,349 140,870 35.4% 34.9% 34.7% 36.1% 36.3%Dwll'g Tenant Occp'd 852,245 905,770 980,440 1,053,698 1,084,451 153,883 156,057 161,902 168,974 173,579 18.1% 17.2% 16.5% 16.0% 16.0%Condominium 690,718 723,260 759,604 805,673 813,948 28,788 32,286 36,647 40,254 41,896 4.2% 4.5% 4.8% 5.0% 5.1%Tenant 1,191,590 1,333,557 1,489,964 1,640,443 1,741,772 66,874 78,703 91,505 105,838 117,307 5.6% 5.9% 6.1% 6.5% 6.7%Dwll'g Content Only 14,488 15,968 17,273 10,051 9,893 661 721 801 438 409 4.6% 4.5% 4.6% 4.4% 4.1%Mobilehome 331,091 302,095 296,137 293,999 289,769 14,977 13,607 13,268 13,013 12,894 4.5% 4.5% 4.5% 4.4% 4.4%Vacant Dwelling 7,110 7,643 7,959 7,969 7,748 1,812 1,759 1,781 1,664 1,412 25.2% 23.0% 22.4% 20.9% 18.2%
Total Earned Exposures for CaliforniaTotal Earned Exposures for Underserved
Communities Percentage of Total Earned Exposures in Underserved Communities
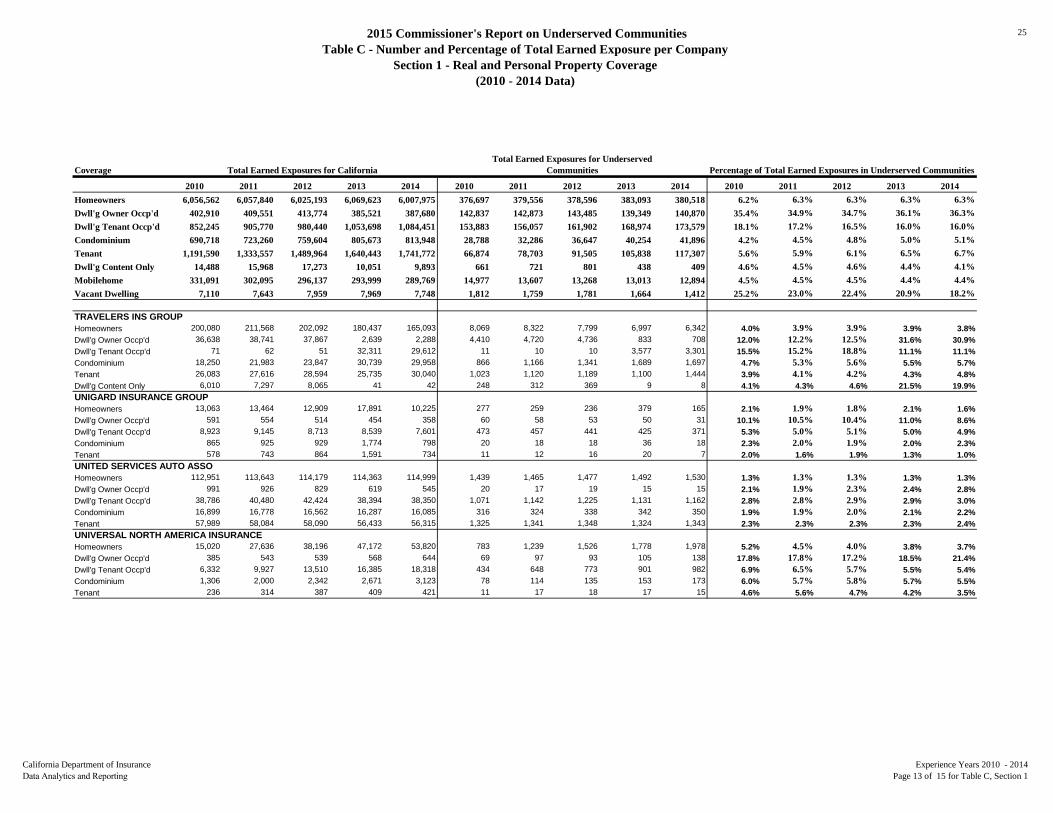
TRAVELERS INS GROUP Homeowners 200,080 211,568 202,092 180,437 165,093 8,069 8,322 7,799 6,997 6,342 4.0% 3.9% 3.9% 3.9% 3.8%Dwll'g Owner Occp'd 36,638 38,741 37,867 2,639 2,288 4,410 4,720 4,736 833 708 12.0% 12.2% 12.5% 31.6% 30.9%Dwll'g Tenant Occp'd 71 62 51 32,311 29,612 11 10 10 3,577 3,301 15.5% 15.2% 18.8% 11.1% 11.1%Condominium 18,250 21,983 23,847 30,739 29,958 866 1,166 1,341 1,689 1,697 4.7% 5.3% 5.6% 5.5% 5.7%Tenant 26,083 27,616 28,594 25,735 30,040 1,023 1,120 1,189 1,100 1,444 3.9% 4.1% 4.2% 4.3% 4.8%Dwll'g Content Only 6,010 7,297 8,065 41 42 248 312 369 9 8 4.1% 4.3% 4.6% 21.5% 19.9%UNIGARD INSURANCE GROUP Homeowners 13,063 13,464 12,909 17,891 10,225 277 259 236 379 165 2.1% 1.9% 1.8% 2.1% 1.6%Dwll'g Owner Occp'd 591 554 514 454 358 60 58 53 50 31 10.1% 10.5% 10.4% 11.0% 8.6%Dwll'g Tenant Occp'd 8,923 9,145 8,713 8,539 7,601 473 457 441 425 371 5.3% 5.0% 5.1% 5.0% 4.9%Condominium 865 925 929 1,774 798 20 18 18 36 18 2.3% 2.0% 1.9% 2.0% 2.3%Tenant 578 743 864 1,591 734 11 12 16 20 7 2.0% 1.6% 1.9% 1.3% 1.0%UNITED SERVICES AUTO ASSOHomeowners 112,951 113,643 114,179 114,363 114,999 1,439 1,465 1,477 1,492 1,530 1.3% 1.3% 1.3% 1.3% 1.3%Dwll'g Owner Occp'd 991 926 829 619 545 20 17 19 15 15 2.1% 1.9% 2.3% 2.4% 2.8%Dwll'g Tenant Occp'd 38,786 40,480 42,424 38,394 38,350 1,071 1,142 1,225 1,131 1,162 2.8% 2.8% 2.9% 2.9% 3.0%Condominium 16,899 16,778 16,562 16,287 16,085 316 324 338 342 350 1.9% 1.9% 2.0% 2.1% 2.2%Tenant 57,989 58,084 58,090 56,433 56,315 1,325 1,341 1,348 1,324 1,343 2.3% 2.3% 2.3% 2.3% 2.4%UNIVERSAL NORTH AMERICA INSURANCEHomeowners 15,020 27,636 38,196 47,172 53,820 783 1,239 1,526 1,778 1,978 5.2% 4.5% 4.0% 3.8% 3.7%Dwll'g Owner Occp'd 385 543 539 568 644 69 97 93 105 138 17.8% 17.8% 17.2% 18.5% 21.4%Dwll'g Tenant Occp'd 6,332 9,927 13,510 16,385 18,318 434 648 773 901 982 6.9% 6.5% 5.7% 5.5% 5.4%Condominium 1,306 2,000 2,342 2,671 3,123 78 114 135 153 173 6.0% 5.7% 5.8% 5.7% 5.5%Tenant 236 314 387 409 421 11 17 18 17 15 4.6% 5.6% 4.7% 4.2% 3.5%
2015 Commissioner's Report on Underserved CommunitiesTable C - Number and Percentage of Total Earned Exposure per Company
Section 1 - Real and Personal Property Coverage(2010 - 2014 Data)
26
California Department of Insurance Data Analytics and Reporting
Experience Years 2010 - 2014Page 14 of 15 for Table C, Section 1
Coverage
2010 2011 2012 2013 2014 2010 2011 2012 2013 2014 2010 2011 2012 2013 2014Homeowners 6,056,562 6,057,840 6,025,193 6,069,623 6,007,975 376,697 379,556 378,596 383,093 380,518 6.2% 6.3% 6.3% 6.3% 6.3%Dwll'g Owner Occp'd 402,910 409,551 413,774 385,521 387,680 142,837 142,873 143,485 139,349 140,870 35.4% 34.9% 34.7% 36.1% 36.3%Dwll'g Tenant Occp'd 852,245 905,770 980,440 1,053,698 1,084,451 153,883 156,057 161,902 168,974 173,579 18.1% 17.2% 16.5% 16.0% 16.0%Condominium 690,718 723,260 759,604 805,673 813,948 28,788 32,286 36,647 40,254 41,896 4.2% 4.5% 4.8% 5.0% 5.1%Tenant 1,191,590 1,333,557 1,489,964 1,640,443 1,741,772 66,874 78,703 91,505 105,838 117,307 5.6% 5.9% 6.1% 6.5% 6.7%Dwll'g Content Only 14,488 15,968 17,273 10,051 9,893 661 721 801 438 409 4.6% 4.5% 4.6% 4.4% 4.1%Mobilehome 331,091 302,095 296,137 293,999 289,769 14,977 13,607 13,268 13,013 12,894 4.5% 4.5% 4.5% 4.4% 4.4%Vacant Dwelling 7,110 7,643 7,959 7,969 7,748 1,812 1,759 1,781 1,664 1,412 25.2% 23.0% 22.4% 20.9% 18.2%
Total Earned Exposures for CaliforniaTotal Earned Exposures for Underserved
Communities Percentage of Total Earned Exposures in Underserved Communities
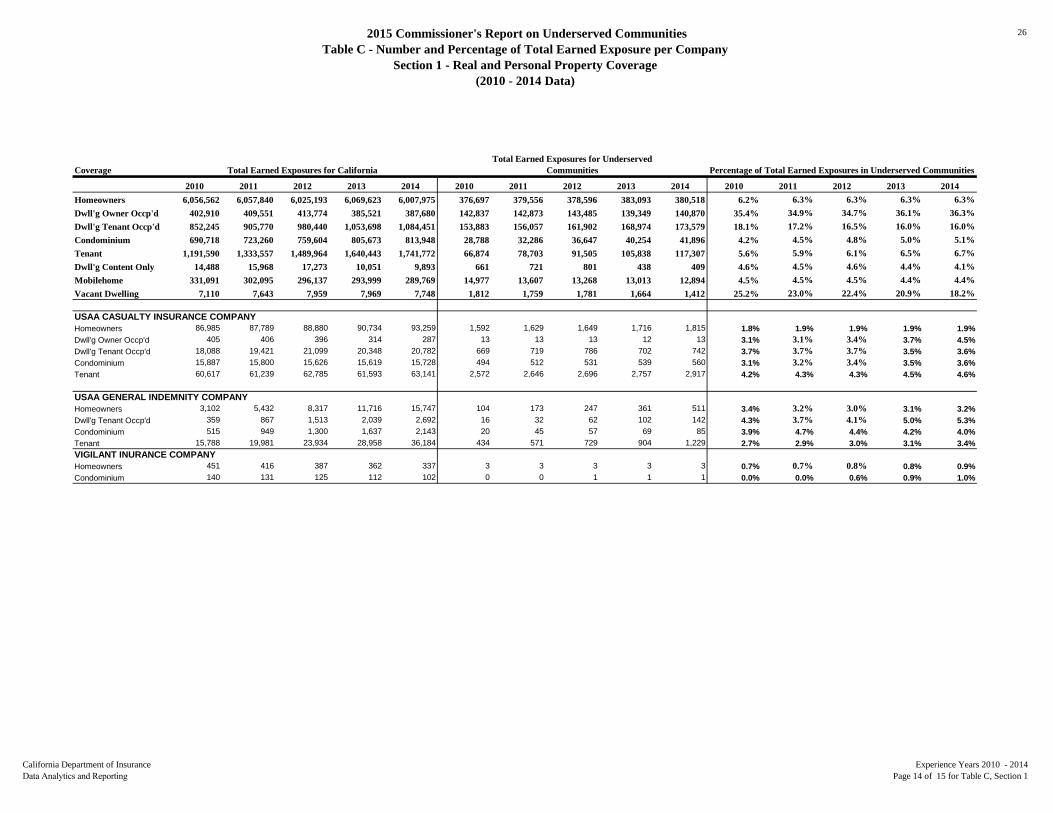
USAA CASUALTY INSURANCE COMPANYHomeowners 86,985 87,789 88,880 90,734 93,259 1,592 1,629 1,649 1,716 1,815 1.8% 1.9% 1.9% 1.9% 1.9%Dwll'g Owner Occp'd 405 406 396 314 287 13 13 13 12 13 3.1% 3.1% 3.4% 3.7% 4.5%Dwll'g Tenant Occp'd 18,088 19,421 21,099 20,348 20,782 669 719 786 702 742 3.7% 3.7% 3.7% 3.5% 3.6%Condominium 15,887 15,800 15,626 15,619 15,728 494 512 531 539 560 3.1% 3.2% 3.4% 3.5% 3.6%Tenant 60,617 61,239 62,785 61,593 63,141 2,572 2,646 2,696 2,757 2,917 4.2% 4.3% 4.3% 4.5% 4.6%
USAA GENERAL INDEMNITY COMPANYHomeowners 3,102 5,432 8,317 11,716 15,747 104 173 247 361 511 3.4% 3.2% 3.0% 3.1% 3.2%Dwll'g Tenant Occp'd 359 867 1,513 2,039 2,692 16 32 62 102 142 4.3% 3.7% 4.1% 5.0% 5.3%Condominium 515 949 1,300 1,637 2,143 20 45 57 69 85 3.9% 4.7% 4.4% 4.2% 4.0%Tenant 15,788 19,981 23,934 28,958 36,184 434 571 729 904 1,229 2.7% 2.9% 3.0% 3.1% 3.4%VIGILANT INURANCE COMPANY Homeowners 451 416 387 362 337 3 3 3 3 3 0.7% 0.7% 0.8% 0.8% 0.9%Condominium 140 131 125 112 102 0 0 1 1 1 0.0% 0.0% 0.6% 0.9% 1.0%

2015 Commissioner's Report on Underserved CommunitiesTable C - Number and Percentage of Total Earned Exposure per Company
Section 1 - Real and Personal Property Coverage(2010 - 2014 Data)
27
California Department of Insurance Data Analytics and Reporting
Experience Years 2010 - 2014Page 15 of 15 for Table C, Section 1
Coverage
2010 2011 2012 2013 2014 2010 2011 2012 2013 2014 2010 2011 2012 2013 2014Homeowners 6,056,562 6,057,840 6,025,193 6,069,623 6,007,975 376,697 379,556 378,596 383,093 380,518 6.2% 6.3% 6.3% 6.3% 6.3%Dwll'g Owner Occp'd 402,910 409,551 413,774 385,521 387,680 142,837 142,873 143,485 139,349 140,870 35.4% 34.9% 34.7% 36.1% 36.3%Dwll'g Tenant Occp'd 852,245 905,770 980,440 1,053,698 1,084,451 153,883 156,057 161,902 168,974 173,579 18.1% 17.2% 16.5% 16.0% 16.0%Condominium 690,718 723,260 759,604 805,673 813,948 28,788 32,286 36,647 40,254 41,896 4.2% 4.5% 4.8% 5.0% 5.1%Tenant 1,191,590 1,333,557 1,489,964 1,640,443 1,741,772 66,874 78,703 91,505 105,838 117,307 5.6% 5.9% 6.1% 6.5% 6.7%Dwll'g Content Only 14,488 15,968 17,273 10,051 9,893 661 721 801 438 409 4.6% 4.5% 4.6% 4.4% 4.1%Mobilehome 331,091 302,095 296,137 293,999 289,769 14,977 13,607 13,268 13,013 12,894 4.5% 4.5% 4.5% 4.4% 4.4%Vacant Dwelling 7,110 7,643 7,959 7,969 7,748 1,812 1,759 1,781 1,664 1,412 25.2% 23.0% 22.4% 20.9% 18.2%
Total Earned Exposures for CaliforniaTotal Earned Exposures for Underserved
Communities Percentage of Total Earned Exposures in Underserved Communities
WAWANESA INSURANCE GROUP Homeowners 30,944 30,074 29,164 28,231 27,642 1,411 1,418 1,398 1,360 1,334 4.6% 4.7% 4.8% 4.8% 4.8%Condominium 5,577 5,892 6,109 6,408 6,805 209 259 296 326 337 3.7% 4.4% 4.8% 5.1% 5.0%Tenant 0 0 0 1,485 2,630 0 0 0 39 83 0.0% 0.0% 0.0% 2.6% 3.1%WESTERN MUTUAL INSURANCE GROUPHomeowners 71,365 73,468 76,112 69,518 69,795 2,743 2,955 3,157 2,915 2,941 3.8% 4.0% 4.1% 4.2% 4.2%Dwll'g Owner Occp'd 1,003 999 892 917 817 411 383 357 337 315 41.0% 38.4% 40.0% 36.8% 38.5%Dwll'g Tenant Occp'd 6,160 6,715 7,427 7,543 7,650 422 444 475 456 449 6.8% 6.6% 6.4% 6.0% 5.9%Condominium 0 0 0 618 773 0 0 0 44 54 0.0% 0.0% 0.0% 7.1% 7.0%WORKMENS AUTO INS CO Homeowners 4,251 0 0 0 0 184 0 0 0 0 4.3% 0.0% 0.0% 0.0% 0.0%Condominium 68 0 0 0 0 7 0 0 0 0 10.3% 0.0% 0.0% 0.0% 0.0%Tenant 61 0 0 0 0 6 0 0 0 0 9.2% 0.0% 0.0% 0.0% 0.0%ZURICH NORTH AMERICA GROUP Homeowners 15,321 12,606 10,585 10,159 9,942 384 324 268 233 202 2.5% 2.6% 2.5% 2.3% 2.0%Dwll'g Owner Occp'd 0 0 0 8,050 7,184 0 0 0 633 569 0.0% 0.0% 0.0% 7.9% 7.9%Tenant 0 0 0 93 350 0 0 0 6 36 0.0% 0.0% 0.0% 6.6% 10.2%

2015 Commissioner's Report on Underserved CommunitiesTable C - Number and Percentage of Total Earned Exposure per Company
Section 2 - Private Passenger Automobile Coverage(2010 - 2014 Data)
28
California Department of Insurance Data Analytics and Reporting
Experience Years 2010 - 2014Page 1 of 14 for Table C, Section 2
Coverage2010 2011 2012 2013 2014 2010 2011 2012 2013 2014 2010 2011 2012 2013 2014
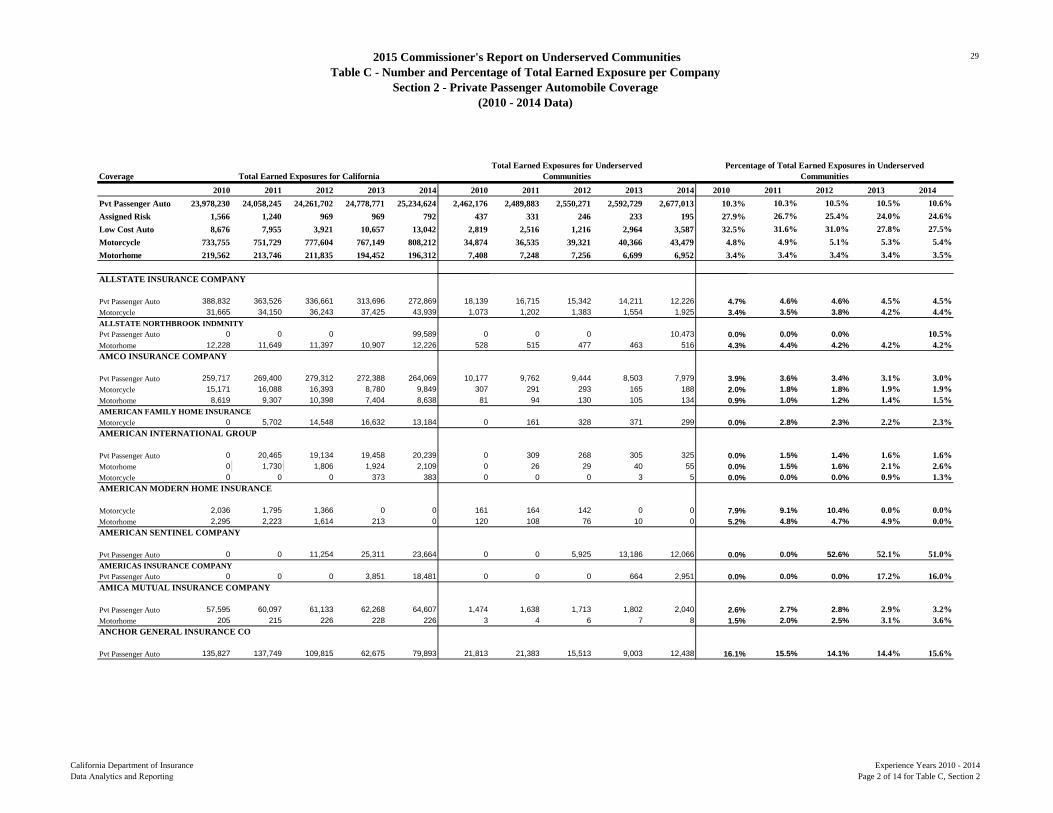
Pvt Passenger Auto 23,978,230 24,058,245 24,261,702 24,778,771 25,234,624 2,462,176 2,489,883 2,550,271 2,592,729 2,677,013 10.3% 10.3% 10.5% 10.5% 10.6%Assigned Risk 1,566 1,240 969 969 792 437 331 246 233 195 27.9% 26.7% 25.4% 24.0% 24.6%Low Cost Auto 8,676 7,955 3,921 10,657 13,042 2,819 2,516 1,216 2,964 3,587 32.5% 31.6% 31.0% 27.8% 27.5%Motorcycle 733,755 751,729 777,604 767,149 808,212 34,874 36,535 39,321 40,366 43,479 4.8% 4.9% 5.1% 5.3% 5.4%Motorhome 219,562 213,746 211,835 194,452 196,312 7,408 7,248 7,256 6,699 6,952 3.4% 3.4% 3.4% 3.4% 3.5%
21ST CENTURY INSURANCE GROUP
Pvt Passenger Auto 890,819 828,159 771,632 722,378 686,932 98,920 90,761 84,382 80,668 78,229 11.1% 11.0% 10.9% 11.2% 11.4%Motorcycle 5,173 209 0 0 0 305 4 0 0 0 5.9% 1.9% 0.0% 0.0% 0.0%Low Cost Auto 0 0 0 3,261 3,626 0 0 0 921 1,048 0.0% 0.0% 0.0% 28.2% 28.9%Assigned Risk 0 0 0 11 3 0 0 0 1 0 0.0% 0.0% 0.0% 6.1% 0.0%21ST CENTURY PREMIER INSURANCE
Pvt Passenger Auto 87,329 0 0 0 0 43,414 0 0 0 0 49.7% 0.0% 0.0% 0.0% 0.0%Motorcycle 1,855 0 0 0 0 440 0 0 0 0 23.7% 0.0% 0.0% 0.0% 0.0%Motorhome 224 0 0 0 0 77 0 0 0 0 34.2% 0.0% 0.0% 0.0% 0.0%ACCESS GENERAL INSURANCE COMPANY
Pvt Passenger Auto 409,791 498,664 485,317 376,378 322,206 133,236 171,241 177,037 144,443 136,889 32.5% 34.3% 36.5% 38.4% 42.5%AEGIS SECURITY INS
Pvt Passenger Auto 7,209 15,819 28,103 38,434 29,704 731 1,424 2,978 4,540 3,959 10.1% 9.0% 10.6% 11.8% 13.3%AFFIRMATIVE INSURANCE COMPANY
Pvt Passenger Auto 55,018 43,970 40,398 122,689 153,461 13,917 10,928 9,809 26,615 33,376 25.3% 24.9% 24.3% 21.7% 21.7%ALLIANZ INSURANCE GROUPPvt Passenger Auto 0 0 0 15,836 15,269 0 0 0 188 182 0.0% 0.0% 0.0% 1.2% 1.2%Motorcycle 0 0 0 118 131 0 0 0 2 2 0.0% 0.0% 0.0% 1.7% 1.7%Motorhome 0 0 0 149 154 0 0 0 0 0 0.0% 0.0% 0.0% 0.0% 0.1%ALLIANCE UNITED INS CO
Pvt Passenger Auto 235,172 275,399 346,425 475,520 648,368 86,359 98,118 117,815 160,060 222,484 36.7% 35.6% 34.0% 33.7% 34.3%ALLIED PROPERTY & CASUALTY INS
Pvt Passenger Auto 132,596 121,458 122,112 145,803 139,488 4,704 3,795 3,598 4,070 3,714 3.5% 3.1% 2.9% 2.8% 2.7%Motorhome 1,416 1,183 983 1,082 869 14 11 9 10 9 1.0% 0.9% 0.9% 0.9% 1.0%ALLSTATE INDEMNITY COMPANY
Pvt Passenger Auto 1,619,239 1,569,346 1,584,341 1,608,802 1,551,269 168,128 160,826 166,353 172,522 170,383 10.4% 10.2% 10.5% 10.7% 11.0%
Total Earned Exposures for CaliforniaTotal Earned Exposures for Underserved
CommunitiesPercentage of Total Earned Exposures in Underserved
Communities
2015 Commissioner's Report on Underserved CommunitiesTable C - Number and Percentage of Total Earned Exposure per Company
Section 2 - Private Passenger Automobile Coverage(2010 - 2014 Data)
29
California Department of Insurance Data Analytics and Reporting
Experience Years 2010 - 2014Page 2 of 14 for Table C, Section 2
Coverage2010 2011 2012 2013 2014 2010 2011 2012 2013 2014 2010 2011 2012 2013 2014
Pvt Passenger Auto 23,978,230 24,058,245 24,261,702 24,778,771 25,234,624 2,462,176 2,489,883 2,550,271 2,592,729 2,677,013 10.3% 10.3% 10.5% 10.5% 10.6%Assigned Risk 1,566 1,240 969 969 792 437 331 246 233 195 27.9% 26.7% 25.4% 24.0% 24.6%Low Cost Auto 8,676 7,955 3,921 10,657 13,042 2,819 2,516 1,216 2,964 3,587 32.5% 31.6% 31.0% 27.8% 27.5%Motorcycle 733,755 751,729 777,604 767,149 808,212 34,874 36,535 39,321 40,366 43,479 4.8% 4.9% 5.1% 5.3% 5.4%Motorhome 219,562 213,746 211,835 194,452 196,312 7,408 7,248 7,256 6,699 6,952 3.4% 3.4% 3.4% 3.4% 3.5%
Total Earned Exposures for CaliforniaTotal Earned Exposures for Underserved
CommunitiesPercentage of Total Earned Exposures in Underserved
Communities
ALLSTATE INSURANCE COMPANY
Pvt Passenger Auto 388,832 363,526 336,661 313,696 272,869 18,139 16,715 15,342 14,211 12,226 4.7% 4.6% 4.6% 4.5% 4.5%Motorcycle 31,665 34,150 36,243 37,425 43,939 1,073 1,202 1,383 1,554 1,925 3.4% 3.5% 3.8% 4.2% 4.4%ALLSTATE NORTHBROOK INDMNITYPvt Passenger Auto 0 0 0 99,589 0 0 0 10,473 0.0% 0.0% 0.0% 10.5%Motorhome 12,228 11,649 11,397 10,907 12,226 528 515 477 463 516 4.3% 4.4% 4.2% 4.2% 4.2%AMCO INSURANCE COMPANY
Pvt Passenger Auto 259,717 269,400 279,312 272,388 264,069 10,177 9,762 9,444 8,503 7,979 3.9% 3.6% 3.4% 3.1% 3.0%Motorcycle 15,171 16,088 16,393 8,780 9,849 307 291 293 165 188 2.0% 1.8% 1.8% 1.9% 1.9%Motorhome 8,619 9,307 10,398 7,404 8,638 81 94 130 105 134 0.9% 1.0% 1.2% 1.4% 1.5%AMERICAN FAMILY HOME INSURANCEMotorcycle 0 5,702 14,548 16,632 13,184 0 161 328 371 299 0.0% 2.8% 2.3% 2.2% 2.3%AMERICAN INTERNATIONAL GROUP
Pvt Passenger Auto 0 20,465 19,134 19,458 20,239 0 309 268 305 325 0.0% 1.5% 1.4% 1.6% 1.6%Motorhome 0 1,730 1,806 1,924 2,109 0 26 29 40 55 0.0% 1.5% 1.6% 2.1% 2.6%Motorcycle 0 0 0 373 383 0 0 0 3 5 0.0% 0.0% 0.0% 0.9% 1.3%AMERICAN MODERN HOME INSURANCE
Motorcycle 2,036 1,795 1,366 0 0 161 164 142 0 0 7.9% 9.1% 10.4% 0.0% 0.0%Motorhome 2,295 2,223 1,614 213 0 120 108 76 10 0 5.2% 4.8% 4.7% 4.9% 0.0%AMERICAN SENTINEL COMPANY
Pvt Passenger Auto 0 0 11,254 25,311 23,664 0 0 5,925 13,186 12,066 0.0% 0.0% 52.6% 52.1% 51.0%AMERICAS INSURANCE COMPANYPvt Passenger Auto 0 0 0 3,851 18,481 0 0 0 664 2,951 0.0% 0.0% 0.0% 17.2% 16.0%AMICA MUTUAL INSURANCE COMPANY
Pvt Passenger Auto 57,595 60,097 61,133 62,268 64,607 1,474 1,638 1,713 1,802 2,040 2.6% 2.7% 2.8% 2.9% 3.2%Motorhome 205 215 226 228 226 3 4 6 7 8 1.5% 2.0% 2.5% 3.1% 3.6%ANCHOR GENERAL INSURANCE CO
Pvt Passenger Auto 135,827 137,749 109,815 62,675 79,893 21,813 21,383 15,513 9,003 12,438 16.1% 15.5% 14.1% 14.4% 15.6%
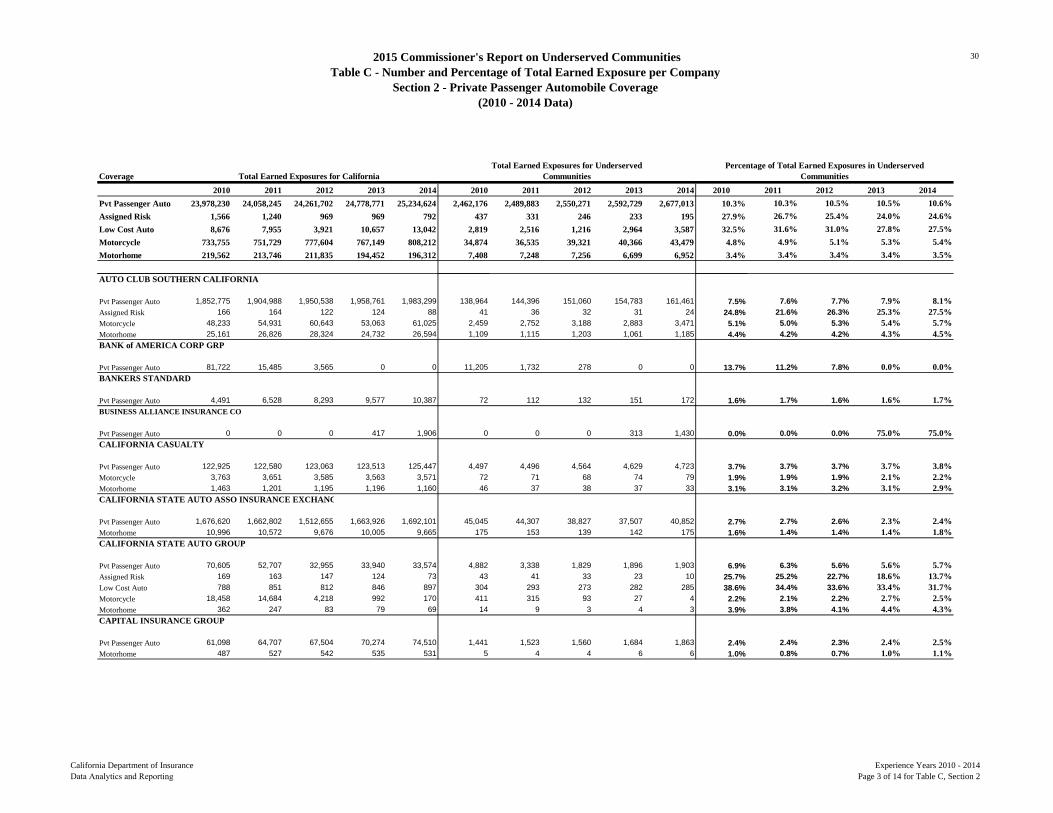
2015 Commissioner's Report on Underserved CommunitiesTable C - Number and Percentage of Total Earned Exposure per Company
Section 2 - Private Passenger Automobile Coverage(2010 - 2014 Data)
30
California Department of Insurance Data Analytics and Reporting
Experience Years 2010 - 2014Page 3 of 14 for Table C, Section 2
Coverage2010 2011 2012 2013 2014 2010 2011 2012 2013 2014 2010 2011 2012 2013 2014
Pvt Passenger Auto 23,978,230 24,058,245 24,261,702 24,778,771 25,234,624 2,462,176 2,489,883 2,550,271 2,592,729 2,677,013 10.3% 10.3% 10.5% 10.5% 10.6%Assigned Risk 1,566 1,240 969 969 792 437 331 246 233 195 27.9% 26.7% 25.4% 24.0% 24.6%Low Cost Auto 8,676 7,955 3,921 10,657 13,042 2,819 2,516 1,216 2,964 3,587 32.5% 31.6% 31.0% 27.8% 27.5%Motorcycle 733,755 751,729 777,604 767,149 808,212 34,874 36,535 39,321 40,366 43,479 4.8% 4.9% 5.1% 5.3% 5.4%Motorhome 219,562 213,746 211,835 194,452 196,312 7,408 7,248 7,256 6,699 6,952 3.4% 3.4% 3.4% 3.4% 3.5%
Total Earned Exposures for CaliforniaTotal Earned Exposures for Underserved
CommunitiesPercentage of Total Earned Exposures in Underserved
Communities
AUTO CLUB SOUTHERN CALIFORNIA
Pvt Passenger Auto 1,852,775 1,904,988 1,950,538 1,958,761 1,983,299 138,964 144,396 151,060 154,783 161,461 7.5% 7.6% 7.7% 7.9% 8.1%Assigned Risk 166 164 122 124 88 41 36 32 31 24 24.8% 21.6% 26.3% 25.3% 27.5%Motorcycle 48,233 54,931 60,643 53,063 61,025 2,459 2,752 3,188 2,883 3,471 5.1% 5.0% 5.3% 5.4% 5.7%Motorhome 25,161 26,826 28,324 24,732 26,594 1,109 1,115 1,203 1,061 1,185 4.4% 4.2% 4.2% 4.3% 4.5%BANK of AMERICA CORP GRP
Pvt Passenger Auto 81,722 15,485 3,565 0 0 11,205 1,732 278 0 0 13.7% 11.2% 7.8% 0.0% 0.0%BANKERS STANDARD
Pvt Passenger Auto 4,491 6,528 8,293 9,577 10,387 72 112 132 151 172 1.6% 1.7% 1.6% 1.6% 1.7%BUSINESS ALLIANCE INSURANCE CO
Pvt Passenger Auto 0 0 0 417 1,906 0 0 0 313 1,430 0.0% 0.0% 0.0% 75.0% 75.0%CALIFORNIA CASUALTY
Pvt Passenger Auto 122,925 122,580 123,063 123,513 125,447 4,497 4,496 4,564 4,629 4,723 3.7% 3.7% 3.7% 3.7% 3.8%Motorcycle 3,763 3,651 3,585 3,563 3,571 72 71 68 74 79 1.9% 1.9% 1.9% 2.1% 2.2%Motorhome 1,463 1,201 1,195 1,196 1,160 46 37 38 37 33 3.1% 3.1% 3.2% 3.1% 2.9%CALIFORNIA STATE AUTO ASSO INSURANCE EXCHANG
Pvt Passenger Auto 1,676,620 1,662,802 1,512,655 1,663,926 1,692,101 45,045 44,307 38,827 37,507 40,852 2.7% 2.7% 2.6% 2.3% 2.4%Motorhome 10,996 10,572 9,676 10,005 9,665 175 153 139 142 175 1.6% 1.4% 1.4% 1.4% 1.8%CALIFORNIA STATE AUTO GROUP
Pvt Passenger Auto 70,605 52,707 32,955 33,940 33,574 4,882 3,338 1,829 1,896 1,903 6.9% 6.3% 5.6% 5.6% 5.7%Assigned Risk 169 163 147 124 73 43 41 33 23 10 25.7% 25.2% 22.7% 18.6% 13.7%Low Cost Auto 788 851 812 846 897 304 293 273 282 285 38.6% 34.4% 33.6% 33.4% 31.7%Motorcycle 18,458 14,684 4,218 992 170 411 315 93 27 4 2.2% 2.1% 2.2% 2.7% 2.5%Motorhome 362 247 83 79 69 14 9 3 4 3 3.9% 3.8% 4.1% 4.4% 4.3%CAPITAL INSURANCE GROUP
Pvt Passenger Auto 61,098 64,707 67,504 70,274 74,510 1,441 1,523 1,560 1,684 1,863 2.4% 2.4% 2.3% 2.4% 2.5%Motorhome 487 527 542 535 531 5 4 4 6 6 1.0% 0.8% 0.7% 1.0% 1.1%

2015 Commissioner's Report on Underserved CommunitiesTable C - Number and Percentage of Total Earned Exposure per Company
Section 2 - Private Passenger Automobile Coverage(2010 - 2014 Data)
31
California Department of Insurance Data Analytics and Reporting
Experience Years 2010 - 2014Page 4 of 14 for Table C, Section 2
Coverage2010 2011 2012 2013 2014 2010 2011 2012 2013 2014 2010 2011 2012 2013 2014
Pvt Passenger Auto 23,978,230 24,058,245 24,261,702 24,778,771 25,234,624 2,462,176 2,489,883 2,550,271 2,592,729 2,677,013 10.3% 10.3% 10.5% 10.5% 10.6%Assigned Risk 1,566 1,240 969 969 792 437 331 246 233 195 27.9% 26.7% 25.4% 24.0% 24.6%Low Cost Auto 8,676 7,955 3,921 10,657 13,042 2,819 2,516 1,216 2,964 3,587 32.5% 31.6% 31.0% 27.8% 27.5%Motorcycle 733,755 751,729 777,604 767,149 808,212 34,874 36,535 39,321 40,366 43,479 4.8% 4.9% 5.1% 5.3% 5.4%Motorhome 219,562 213,746 211,835 194,452 196,312 7,408 7,248 7,256 6,699 6,952 3.4% 3.4% 3.4% 3.4% 3.5%
Total Earned Exposures for CaliforniaTotal Earned Exposures for Underserved
CommunitiesPercentage of Total Earned Exposures in Underserved
Communities
CENTURY-NATIONAL INSURANCE CO
Pvt Passenger Auto 11,492 14,625 16,270 19,367 25,052 1,097 2,308 2,950 4,258 6,054 9.5% 15.8% 18.1% 22.0% 24.2%COAST NATIONAL INSURANCE CO
Pvt Passenger Auto 338,916 461,169 453,119 339,159 364,579 73,119 105,206 104,041 81,790 93,649 21.6% 22.8% 23.0% 24.1% 25.7%COMMERCE WEST INSURANCE CO
Pvt Passenger Auto 196,270 244,910 174,480 159,702 111,196 15,381 19,861 13,179 11,535 8,149 7.8% 8.1% 7.6% 7.2% 7.3%Assigned Risk 35 17 24 22 0 10 5 4 3 0 27.0% 32.3% 17.4% 14.7% 0.0%COMMERCIAL ALLIANCE INSURANCE
Pvt Passenger Auto 0 3,678 7,978 19,057 0 0 1,495 3,088 7,458 0 0.0% 40.6% 38.7% 39.1% 0.0%COMPANION P&C INS COMPANY
Pvt Passenger Auto 0 19,328 135,758 89,773 0 0 4,414 27,658 16,301 0 0.0% 22.8% 20.4% 18.2% 0.0%CORNERSTONE NATIONAL INS CO
Pvt Passenger Auto 29,907 26,219 23,442 17,491 7,969 9,407 8,158 7,615 5,636 2,461 31.5% 31.1% 32.5% 32.2% 30.9%CSE INSURANCE GROUP
Pvt Passenger Auto 39,362 37,312 36,641 34,733 32,982 1,974 1,777 1,744 1,653 1,581 5.0% 4.8% 4.8% 4.8% 4.8%Motorhome 136 116 105 100 91 6 4 3 2 3 4.2% 3.5% 2.8% 2.1% 3.2%DANIELSON NATIONAL INSURANCE CO
Pvt Passenger Auto 9,963 5,465 3,289 0 0 3,792 2,048 1,185 0 0 38.1% 37.5% 36.0% 0.0% 0.0%
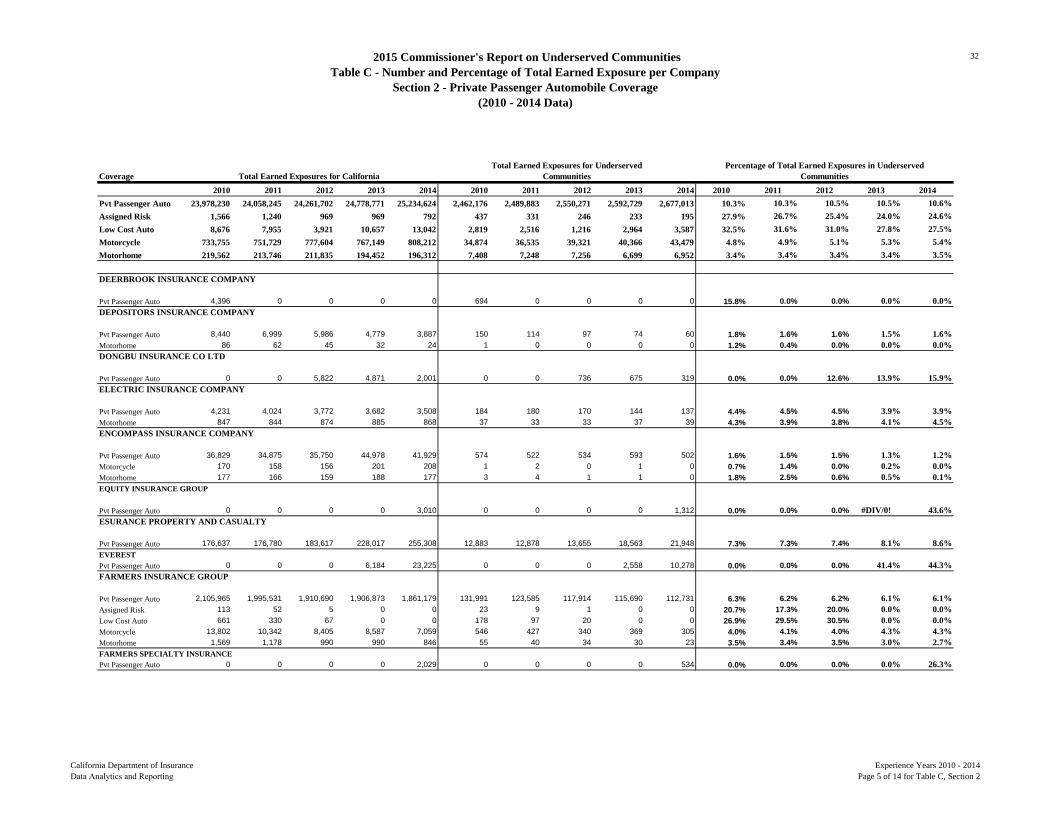
2015 Commissioner's Report on Underserved CommunitiesTable C - Number and Percentage of Total Earned Exposure per Company
Section 2 - Private Passenger Automobile Coverage(2010 - 2014 Data)
32
California Department of Insurance Data Analytics and Reporting
Experience Years 2010 - 2014Page 5 of 14 for Table C, Section 2
Coverage2010 2011 2012 2013 2014 2010 2011 2012 2013 2014 2010 2011 2012 2013 2014
Pvt Passenger Auto 23,978,230 24,058,245 24,261,702 24,778,771 25,234,624 2,462,176 2,489,883 2,550,271 2,592,729 2,677,013 10.3% 10.3% 10.5% 10.5% 10.6%Assigned Risk 1,566 1,240 969 969 792 437 331 246 233 195 27.9% 26.7% 25.4% 24.0% 24.6%Low Cost Auto 8,676 7,955 3,921 10,657 13,042 2,819 2,516 1,216 2,964 3,587 32.5% 31.6% 31.0% 27.8% 27.5%Motorcycle 733,755 751,729 777,604 767,149 808,212 34,874 36,535 39,321 40,366 43,479 4.8% 4.9% 5.1% 5.3% 5.4%Motorhome 219,562 213,746 211,835 194,452 196,312 7,408 7,248 7,256 6,699 6,952 3.4% 3.4% 3.4% 3.4% 3.5%
Total Earned Exposures for CaliforniaTotal Earned Exposures for Underserved
CommunitiesPercentage of Total Earned Exposures in Underserved
Communities
DEERBROOK INSURANCE COMPANY
Pvt Passenger Auto 4,396 0 0 0 0 694 0 0 0 0 15.8% 0.0% 0.0% 0.0% 0.0%DEPOSITORS INSURANCE COMPANY
Pvt Passenger Auto 8,440 6,999 5,986 4,779 3,887 150 114 97 74 60 1.8% 1.6% 1.6% 1.5% 1.6%Motorhome 86 62 45 32 24 1 0 0 0 0 1.2% 0.4% 0.0% 0.0% 0.0%DONGBU INSURANCE CO LTD
Pvt Passenger Auto 0 0 5,822 4,871 2,001 0 0 736 675 319 0.0% 0.0% 12.6% 13.9% 15.9%ELECTRIC INSURANCE COMPANY
Pvt Passenger Auto 4,231 4,024 3,772 3,682 3,508 184 180 170 144 137 4.4% 4.5% 4.5% 3.9% 3.9%Motorhome 847 844 874 885 868 37 33 33 37 39 4.3% 3.9% 3.8% 4.1% 4.5%ENCOMPASS INSURANCE COMPANY
Pvt Passenger Auto 36,829 34,875 35,750 44,978 41,929 574 522 534 593 502 1.6% 1.5% 1.5% 1.3% 1.2%Motorcycle 170 158 156 201 208 1 2 0 1 0 0.7% 1.4% 0.0% 0.2% 0.0%Motorhome 177 166 159 188 177 3 4 1 1 0 1.8% 2.5% 0.6% 0.5% 0.1%EQUITY INSURANCE GROUP
Pvt Passenger Auto 0 0 0 0 3,010 0 0 0 0 1,312 0.0% 0.0% 0.0% #DIV/0! 43.6%ESURANCE PROPERTY AND CASUALTY
Pvt Passenger Auto 176,637 176,780 183,617 228,017 255,308 12,883 12,878 13,655 18,563 21,948 7.3% 7.3% 7.4% 8.1% 8.6%EVERESTPvt Passenger Auto 0 0 0 6,184 23,225 0 0 0 2,558 10,278 0.0% 0.0% 0.0% 41.4% 44.3%FARMERS INSURANCE GROUP
Pvt Passenger Auto 2,105,965 1,995,531 1,910,690 1,906,873 1,861,179 131,991 123,585 117,914 115,690 112,731 6.3% 6.2% 6.2% 6.1% 6.1%Assigned Risk 113 52 5 0 0 23 9 1 0 0 20.7% 17.3% 20.0% 0.0% 0.0%Low Cost Auto 661 330 67 0 0 178 97 20 0 0 26.9% 29.5% 30.5% 0.0% 0.0%Motorcycle 13,802 10,342 8,405 8,587 7,059 546 427 340 369 305 4.0% 4.1% 4.0% 4.3% 4.3%Motorhome 1,569 1,178 990 990 846 55 40 34 30 23 3.5% 3.4% 3.5% 3.0% 2.7%FARMERS SPECIALTY INSURANCEPvt Passenger Auto 0 0 0 0 2,029 0 0 0 0 534 0.0% 0.0% 0.0% 0.0% 26.3%
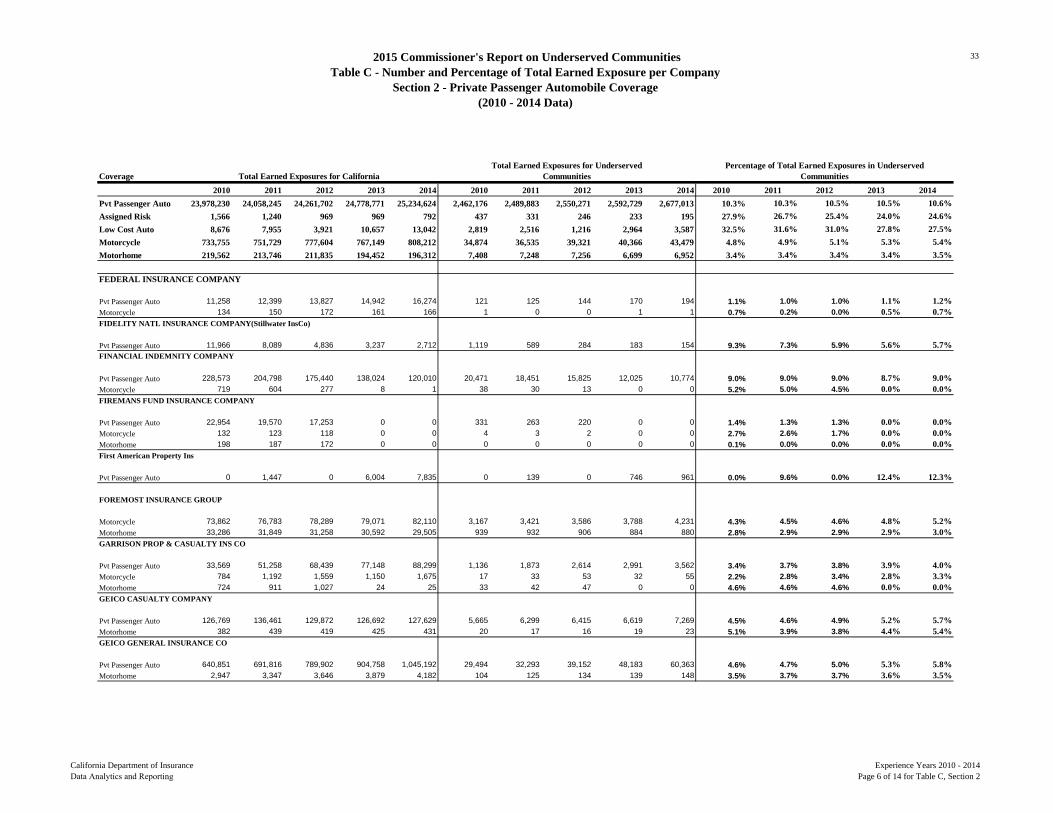
2015 Commissioner's Report on Underserved CommunitiesTable C - Number and Percentage of Total Earned Exposure per Company
Section 2 - Private Passenger Automobile Coverage(2010 - 2014 Data)
33
California Department of Insurance Data Analytics and Reporting
Experience Years 2010 - 2014Page 6 of 14 for Table C, Section 2
Coverage2010 2011 2012 2013 2014 2010 2011 2012 2013 2014 2010 2011 2012 2013 2014
Pvt Passenger Auto 23,978,230 24,058,245 24,261,702 24,778,771 25,234,624 2,462,176 2,489,883 2,550,271 2,592,729 2,677,013 10.3% 10.3% 10.5% 10.5% 10.6%Assigned Risk 1,566 1,240 969 969 792 437 331 246 233 195 27.9% 26.7% 25.4% 24.0% 24.6%Low Cost Auto 8,676 7,955 3,921 10,657 13,042 2,819 2,516 1,216 2,964 3,587 32.5% 31.6% 31.0% 27.8% 27.5%Motorcycle 733,755 751,729 777,604 767,149 808,212 34,874 36,535 39,321 40,366 43,479 4.8% 4.9% 5.1% 5.3% 5.4%Motorhome 219,562 213,746 211,835 194,452 196,312 7,408 7,248 7,256 6,699 6,952 3.4% 3.4% 3.4% 3.4% 3.5%
Total Earned Exposures for CaliforniaTotal Earned Exposures for Underserved
CommunitiesPercentage of Total Earned Exposures in Underserved
Communities
FEDERAL INSURANCE COMPANY
Pvt Passenger Auto 11,258 12,399 13,827 14,942 16,274 121 125 144 170 194 1.1% 1.0% 1.0% 1.1% 1.2%Motorcycle 134 150 172 161 166 1 0 0 1 1 0.7% 0.2% 0.0% 0.5% 0.7%FIDELITY NATL INSURANCE COMPANY(Stillwater InsCo)
Pvt Passenger Auto 11,966 8,089 4,836 3,237 2,712 1,119 589 284 183 154 9.3% 7.3% 5.9% 5.6% 5.7%FINANCIAL INDEMNITY COMPANY
Pvt Passenger Auto 228,573 204,798 175,440 138,024 120,010 20,471 18,451 15,825 12,025 10,774 9.0% 9.0% 9.0% 8.7% 9.0%Motorcycle 719 604 277 8 1 38 30 13 0 0 5.2% 5.0% 4.5% 0.0% 0.0%FIREMANS FUND INSURANCE COMPANY
Pvt Passenger Auto 22,954 19,570 17,253 0 0 331 263 220 0 0 1.4% 1.3% 1.3% 0.0% 0.0%Motorcycle 132 123 118 0 0 4 3 2 0 0 2.7% 2.6% 1.7% 0.0% 0.0%Motorhome 198 187 172 0 0 0 0 0 0 0 0.1% 0.0% 0.0% 0.0% 0.0%First American Property Ins
Pvt Passenger Auto 0 1,447 0 6,004 7,835 0 139 0 746 961 0.0% 9.6% 0.0% 12.4% 12.3%
FOREMOST INSURANCE GROUP
Motorcycle 73,862 76,783 78,289 79,071 82,110 3,167 3,421 3,586 3,788 4,231 4.3% 4.5% 4.6% 4.8% 5.2%Motorhome 33,286 31,849 31,258 30,592 29,505 939 932 906 884 880 2.8% 2.9% 2.9% 2.9% 3.0%GARRISON PROP & CASUALTY INS CO
Pvt Passenger Auto 33,569 51,258 68,439 77,148 88,299 1,136 1,873 2,614 2,991 3,562 3.4% 3.7% 3.8% 3.9% 4.0%Motorcycle 784 1,192 1,559 1,150 1,675 17 33 53 32 55 2.2% 2.8% 3.4% 2.8% 3.3%Motorhome 724 911 1,027 24 25 33 42 47 0 0 4.6% 4.6% 4.6% 0.0% 0.0%GEICO CASUALTY COMPANY
Pvt Passenger Auto 126,769 136,461 129,872 126,692 127,629 5,665 6,299 6,415 6,619 7,269 4.5% 4.6% 4.9% 5.2% 5.7%Motorhome 382 439 419 425 431 20 17 16 19 23 5.1% 3.9% 3.8% 4.4% 5.4%GEICO GENERAL INSURANCE CO
Pvt Passenger Auto 640,851 691,816 789,902 904,758 1,045,192 29,494 32,293 39,152 48,183 60,363 4.6% 4.7% 5.0% 5.3% 5.8%Motorhome 2,947 3,347 3,646 3,879 4,182 104 125 134 139 148 3.5% 3.7% 3.7% 3.6% 3.5%
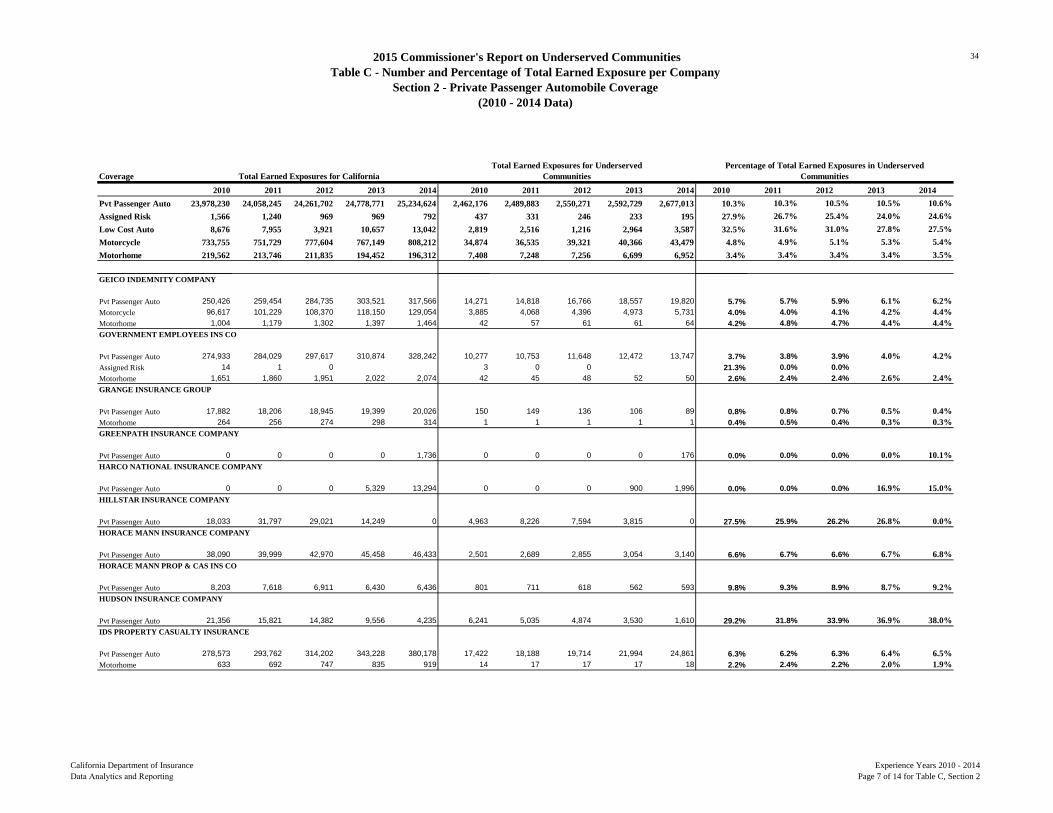
2015 Commissioner's Report on Underserved CommunitiesTable C - Number and Percentage of Total Earned Exposure per Company
Section 2 - Private Passenger Automobile Coverage(2010 - 2014 Data)
34
California Department of Insurance Data Analytics and Reporting
Experience Years 2010 - 2014Page 7 of 14 for Table C, Section 2
Coverage2010 2011 2012 2013 2014 2010 2011 2012 2013 2014 2010 2011 2012 2013 2014
Pvt Passenger Auto 23,978,230 24,058,245 24,261,702 24,778,771 25,234,624 2,462,176 2,489,883 2,550,271 2,592,729 2,677,013 10.3% 10.3% 10.5% 10.5% 10.6%Assigned Risk 1,566 1,240 969 969 792 437 331 246 233 195 27.9% 26.7% 25.4% 24.0% 24.6%Low Cost Auto 8,676 7,955 3,921 10,657 13,042 2,819 2,516 1,216 2,964 3,587 32.5% 31.6% 31.0% 27.8% 27.5%Motorcycle 733,755 751,729 777,604 767,149 808,212 34,874 36,535 39,321 40,366 43,479 4.8% 4.9% 5.1% 5.3% 5.4%Motorhome 219,562 213,746 211,835 194,452 196,312 7,408 7,248 7,256 6,699 6,952 3.4% 3.4% 3.4% 3.4% 3.5%
Total Earned Exposures for CaliforniaTotal Earned Exposures for Underserved
CommunitiesPercentage of Total Earned Exposures in Underserved
Communities
GEICO INDEMNITY COMPANY
Pvt Passenger Auto 250,426 259,454 284,735 303,521 317,566 14,271 14,818 16,766 18,557 19,820 5.7% 5.7% 5.9% 6.1% 6.2%Motorcycle 96,617 101,229 108,370 118,150 129,054 3,885 4,068 4,396 4,973 5,731 4.0% 4.0% 4.1% 4.2% 4.4%Motorhome 1,004 1,179 1,302 1,397 1,464 42 57 61 61 64 4.2% 4.8% 4.7% 4.4% 4.4%GOVERNMENT EMPLOYEES INS CO
Pvt Passenger Auto 274,933 284,029 297,617 310,874 328,242 10,277 10,753 11,648 12,472 13,747 3.7% 3.8% 3.9% 4.0% 4.2%Assigned Risk 14 1 0 3 0 0 21.3% 0.0% 0.0%Motorhome 1,651 1,860 1,951 2,022 2,074 42 45 48 52 50 2.6% 2.4% 2.4% 2.6% 2.4%GRANGE INSURANCE GROUP
Pvt Passenger Auto 17,882 18,206 18,945 19,399 20,026 150 149 136 106 89 0.8% 0.8% 0.7% 0.5% 0.4%Motorhome 264 256 274 298 314 1 1 1 1 1 0.4% 0.5% 0.4% 0.3% 0.3%GREENPATH INSURANCE COMPANY
Pvt Passenger Auto 0 0 0 0 1,736 0 0 0 0 176 0.0% 0.0% 0.0% 0.0% 10.1%HARCO NATIONAL INSURANCE COMPANY
Pvt Passenger Auto 0 0 0 5,329 13,294 0 0 0 900 1,996 0.0% 0.0% 0.0% 16.9% 15.0%HILLSTAR INSURANCE COMPANY
Pvt Passenger Auto 18,033 31,797 29,021 14,249 0 4,963 8,226 7,594 3,815 0 27.5% 25.9% 26.2% 26.8% 0.0%HORACE MANN INSURANCE COMPANY
Pvt Passenger Auto 38,090 39,999 42,970 45,458 46,433 2,501 2,689 2,855 3,054 3,140 6.6% 6.7% 6.6% 6.7% 6.8%HORACE MANN PROP & CAS INS CO
Pvt Passenger Auto 8,203 7,618 6,911 6,430 6,436 801 711 618 562 593 9.8% 9.3% 8.9% 8.7% 9.2%HUDSON INSURANCE COMPANY
Pvt Passenger Auto 21,356 15,821 14,382 9,556 4,235 6,241 5,035 4,874 3,530 1,610 29.2% 31.8% 33.9% 36.9% 38.0%IDS PROPERTY CASUALTY INSURANCE
Pvt Passenger Auto 278,573 293,762 314,202 343,228 380,178 17,422 18,188 19,714 21,994 24,861 6.3% 6.2% 6.3% 6.4% 6.5%Motorhome 633 692 747 835 919 14 17 17 17 18 2.2% 2.4% 2.2% 2.0% 1.9%
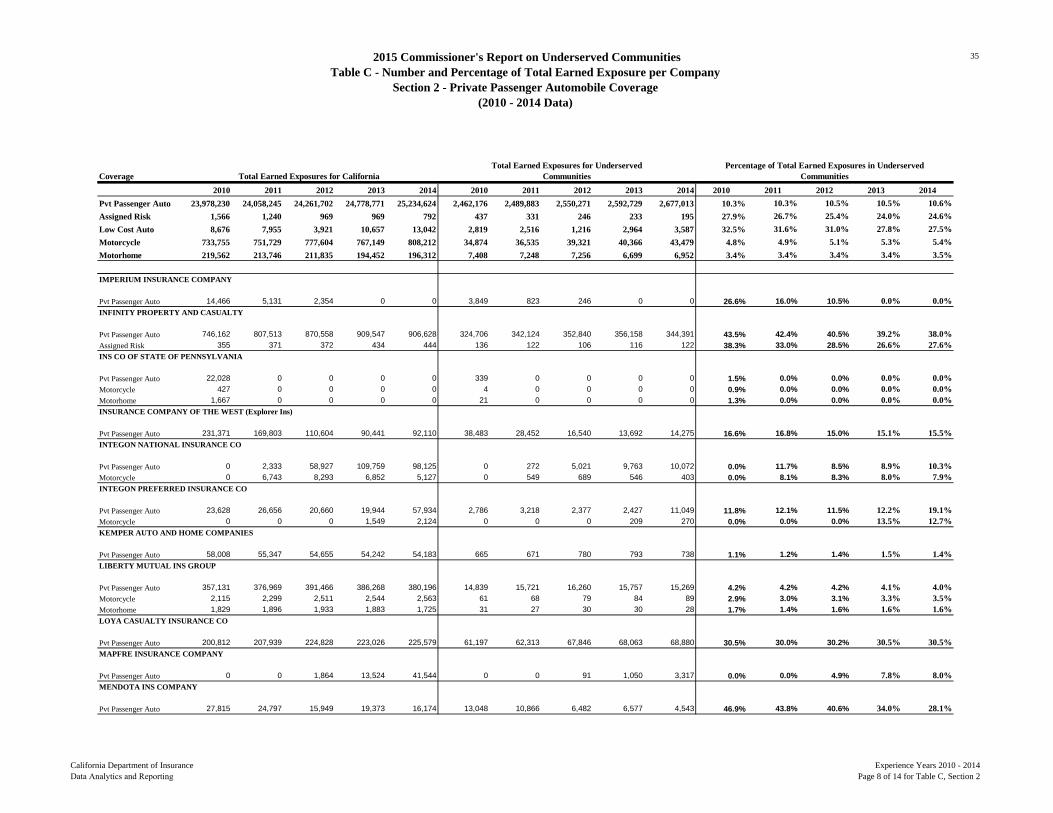
2015 Commissioner's Report on Underserved CommunitiesTable C - Number and Percentage of Total Earned Exposure per Company
Section 2 - Private Passenger Automobile Coverage(2010 - 2014 Data)
35
California Department of Insurance Data Analytics and Reporting
Experience Years 2010 - 2014Page 8 of 14 for Table C, Section 2
Coverage2010 2011 2012 2013 2014 2010 2011 2012 2013 2014 2010 2011 2012 2013 2014
Pvt Passenger Auto 23,978,230 24,058,245 24,261,702 24,778,771 25,234,624 2,462,176 2,489,883 2,550,271 2,592,729 2,677,013 10.3% 10.3% 10.5% 10.5% 10.6%Assigned Risk 1,566 1,240 969 969 792 437 331 246 233 195 27.9% 26.7% 25.4% 24.0% 24.6%Low Cost Auto 8,676 7,955 3,921 10,657 13,042 2,819 2,516 1,216 2,964 3,587 32.5% 31.6% 31.0% 27.8% 27.5%Motorcycle 733,755 751,729 777,604 767,149 808,212 34,874 36,535 39,321 40,366 43,479 4.8% 4.9% 5.1% 5.3% 5.4%Motorhome 219,562 213,746 211,835 194,452 196,312 7,408 7,248 7,256 6,699 6,952 3.4% 3.4% 3.4% 3.4% 3.5%
Total Earned Exposures for CaliforniaTotal Earned Exposures for Underserved
CommunitiesPercentage of Total Earned Exposures in Underserved
Communities
IMPERIUM INSURANCE COMPANY
Pvt Passenger Auto 14,466 5,131 2,354 0 0 3,849 823 246 0 0 26.6% 16.0% 10.5% 0.0% 0.0%INFINITY PROPERTY AND CASUALTY
Pvt Passenger Auto 746,162 807,513 870,558 909,547 906,628 324,706 342,124 352,840 356,158 344,391 43.5% 42.4% 40.5% 39.2% 38.0%Assigned Risk 355 371 372 434 444 136 122 106 116 122 38.3% 33.0% 28.5% 26.6% 27.6%INS CO OF STATE OF PENNSYLVANIA
Pvt Passenger Auto 22,028 0 0 0 0 339 0 0 0 0 1.5% 0.0% 0.0% 0.0% 0.0%Motorcycle 427 0 0 0 0 4 0 0 0 0 0.9% 0.0% 0.0% 0.0% 0.0%Motorhome 1,667 0 0 0 0 21 0 0 0 0 1.3% 0.0% 0.0% 0.0% 0.0%INSURANCE COMPANY OF THE WEST (Explorer Ins)
Pvt Passenger Auto 231,371 169,803 110,604 90,441 92,110 38,483 28,452 16,540 13,692 14,275 16.6% 16.8% 15.0% 15.1% 15.5%INTEGON NATIONAL INSURANCE CO
Pvt Passenger Auto 0 2,333 58,927 109,759 98,125 0 272 5,021 9,763 10,072 0.0% 11.7% 8.5% 8.9% 10.3%Motorcycle 0 6,743 8,293 6,852 5,127 0 549 689 546 403 0.0% 8.1% 8.3% 8.0% 7.9%INTEGON PREFERRED INSURANCE CO
Pvt Passenger Auto 23,628 26,656 20,660 19,944 57,934 2,786 3,218 2,377 2,427 11,049 11.8% 12.1% 11.5% 12.2% 19.1%Motorcycle 0 0 0 1,549 2,124 0 0 0 209 270 0.0% 0.0% 0.0% 13.5% 12.7%KEMPER AUTO AND HOME COMPANIES
Pvt Passenger Auto 58,008 55,347 54,655 54,242 54,183 665 671 780 793 738 1.1% 1.2% 1.4% 1.5% 1.4%LIBERTY MUTUAL INS GROUP
Pvt Passenger Auto 357,131 376,969 391,466 386,268 380,196 14,839 15,721 16,260 15,757 15,269 4.2% 4.2% 4.2% 4.1% 4.0%Motorcycle 2,115 2,299 2,511 2,544 2,563 61 68 79 84 89 2.9% 3.0% 3.1% 3.3% 3.5%Motorhome 1,829 1,896 1,933 1,883 1,725 31 27 30 30 28 1.7% 1.4% 1.6% 1.6% 1.6%LOYA CASUALTY INSURANCE CO
Pvt Passenger Auto 200,812 207,939 224,828 223,026 225,579 61,197 62,313 67,846 68,063 68,880 30.5% 30.0% 30.2% 30.5% 30.5%MAPFRE INSURANCE COMPANY
Pvt Passenger Auto 0 0 1,864 13,524 41,544 0 0 91 1,050 3,317 0.0% 0.0% 4.9% 7.8% 8.0%MENDOTA INS COMPANY
Pvt Passenger Auto 27,815 24,797 15,949 19,373 16,174 13,048 10,866 6,482 6,577 4,543 46.9% 43.8% 40.6% 34.0% 28.1%
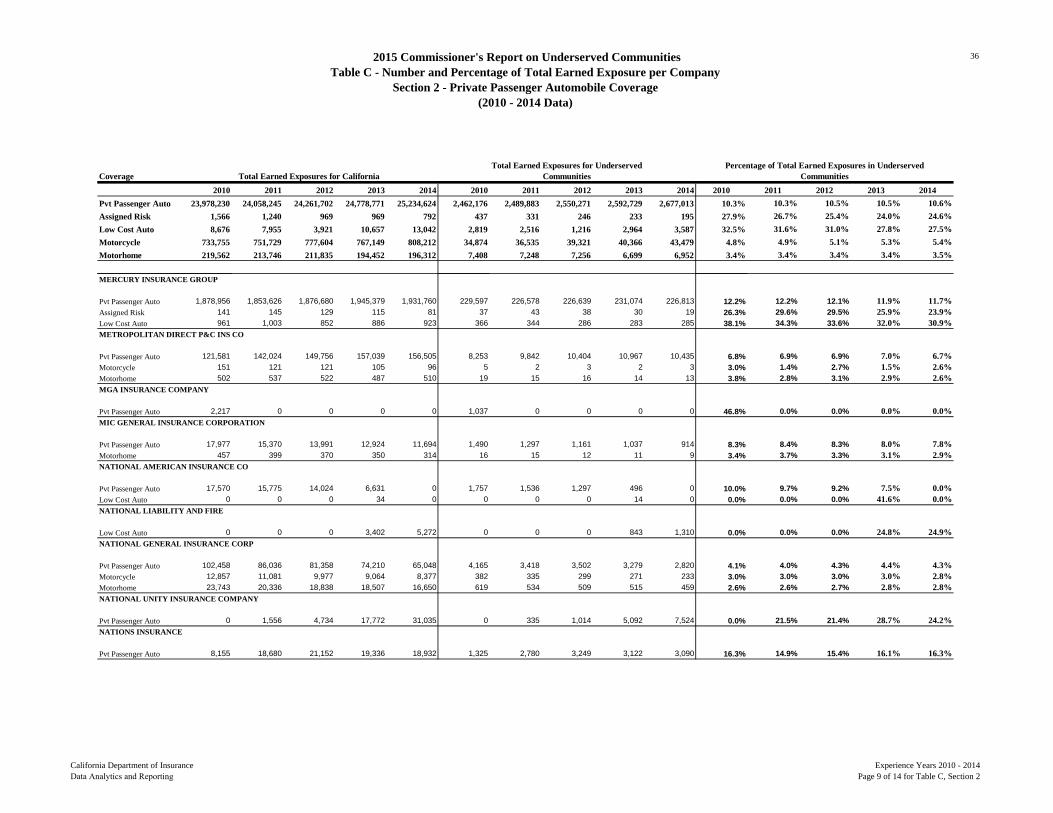
2015 Commissioner's Report on Underserved CommunitiesTable C - Number and Percentage of Total Earned Exposure per Company
Section 2 - Private Passenger Automobile Coverage(2010 - 2014 Data)
36
California Department of Insurance Data Analytics and Reporting
Experience Years 2010 - 2014Page 9 of 14 for Table C, Section 2
Coverage2010 2011 2012 2013 2014 2010 2011 2012 2013 2014 2010 2011 2012 2013 2014
Pvt Passenger Auto 23,978,230 24,058,245 24,261,702 24,778,771 25,234,624 2,462,176 2,489,883 2,550,271 2,592,729 2,677,013 10.3% 10.3% 10.5% 10.5% 10.6%Assigned Risk 1,566 1,240 969 969 792 437 331 246 233 195 27.9% 26.7% 25.4% 24.0% 24.6%Low Cost Auto 8,676 7,955 3,921 10,657 13,042 2,819 2,516 1,216 2,964 3,587 32.5% 31.6% 31.0% 27.8% 27.5%Motorcycle 733,755 751,729 777,604 767,149 808,212 34,874 36,535 39,321 40,366 43,479 4.8% 4.9% 5.1% 5.3% 5.4%Motorhome 219,562 213,746 211,835 194,452 196,312 7,408 7,248 7,256 6,699 6,952 3.4% 3.4% 3.4% 3.4% 3.5%
Total Earned Exposures for CaliforniaTotal Earned Exposures for Underserved
CommunitiesPercentage of Total Earned Exposures in Underserved
Communities
MERCURY INSURANCE GROUP
Pvt Passenger Auto 1,878,956 1,853,626 1,876,680 1,945,379 1,931,760 229,597 226,578 226,639 231,074 226,813 12.2% 12.2% 12.1% 11.9% 11.7%Assigned Risk 141 145 129 115 81 37 43 38 30 19 26.3% 29.6% 29.5% 25.9% 23.9%Low Cost Auto 961 1,003 852 886 923 366 344 286 283 285 38.1% 34.3% 33.6% 32.0% 30.9%METROPOLITAN DIRECT P&C INS CO
Pvt Passenger Auto 121,581 142,024 149,756 157,039 156,505 8,253 9,842 10,404 10,967 10,435 6.8% 6.9% 6.9% 7.0% 6.7%Motorcycle 151 121 121 105 96 5 2 3 2 3 3.0% 1.4% 2.7% 1.5% 2.6%Motorhome 502 537 522 487 510 19 15 16 14 13 3.8% 2.8% 3.1% 2.9% 2.6%MGA INSURANCE COMPANY
Pvt Passenger Auto 2,217 0 0 0 0 1,037 0 0 0 0 46.8% 0.0% 0.0% 0.0% 0.0%MIC GENERAL INSURANCE CORPORATION
Pvt Passenger Auto 17,977 15,370 13,991 12,924 11,694 1,490 1,297 1,161 1,037 914 8.3% 8.4% 8.3% 8.0% 7.8%Motorhome 457 399 370 350 314 16 15 12 11 9 3.4% 3.7% 3.3% 3.1% 2.9%NATIONAL AMERICAN INSURANCE CO
Pvt Passenger Auto 17,570 15,775 14,024 6,631 0 1,757 1,536 1,297 496 0 10.0% 9.7% 9.2% 7.5% 0.0%Low Cost Auto 0 0 0 34 0 0 0 0 14 0 0.0% 0.0% 0.0% 41.6% 0.0%NATIONAL LIABILITY AND FIRE
Low Cost Auto 0 0 0 3,402 5,272 0 0 0 843 1,310 0.0% 0.0% 0.0% 24.8% 24.9%NATIONAL GENERAL INSURANCE CORP
Pvt Passenger Auto 102,458 86,036 81,358 74,210 65,048 4,165 3,418 3,502 3,279 2,820 4.1% 4.0% 4.3% 4.4% 4.3%Motorcycle 12,857 11,081 9,977 9,064 8,377 382 335 299 271 233 3.0% 3.0% 3.0% 3.0% 2.8%Motorhome 23,743 20,336 18,838 18,507 16,650 619 534 509 515 459 2.6% 2.6% 2.7% 2.8% 2.8%NATIONAL UNITY INSURANCE COMPANY
Pvt Passenger Auto 0 1,556 4,734 17,772 31,035 0 335 1,014 5,092 7,524 0.0% 21.5% 21.4% 28.7% 24.2%NATIONS INSURANCE
Pvt Passenger Auto 8,155 18,680 21,152 19,336 18,932 1,325 2,780 3,249 3,122 3,090 16.3% 14.9% 15.4% 16.1% 16.3%

2015 Commissioner's Report on Underserved CommunitiesTable C - Number and Percentage of Total Earned Exposure per Company
Section 2 - Private Passenger Automobile Coverage(2010 - 2014 Data)
37
California Department of Insurance Data Analytics and Reporting
Experience Years 2010 - 2014Page 10 of 14 for Table C, Section 2
Coverage2010 2011 2012 2013 2014 2010 2011 2012 2013 2014 2010 2011 2012 2013 2014
Pvt Passenger Auto 23,978,230 24,058,245 24,261,702 24,778,771 25,234,624 2,462,176 2,489,883 2,550,271 2,592,729 2,677,013 10.3% 10.3% 10.5% 10.5% 10.6%Assigned Risk 1,566 1,240 969 969 792 437 331 246 233 195 27.9% 26.7% 25.4% 24.0% 24.6%Low Cost Auto 8,676 7,955 3,921 10,657 13,042 2,819 2,516 1,216 2,964 3,587 32.5% 31.6% 31.0% 27.8% 27.5%Motorcycle 733,755 751,729 777,604 767,149 808,212 34,874 36,535 39,321 40,366 43,479 4.8% 4.9% 5.1% 5.3% 5.4%Motorhome 219,562 213,746 211,835 194,452 196,312 7,408 7,248 7,256 6,699 6,952 3.4% 3.4% 3.4% 3.4% 3.5%
Total Earned Exposures for CaliforniaTotal Earned Exposures for Underserved
CommunitiesPercentage of Total Earned Exposures in Underserved
Communities
NATIONWIDE INS CO OF AMERICA
Pvt Passenger Auto 124,368 117,021 112,994 109,989 110,095 7,808 6,984 6,299 5,942 5,861 6.3% 6.0% 5.6% 5.4% 5.3%Motorcycle 6,844 3,486 3,573 4,245 4,630 197 105 113 138 175 2.9% 3.0% 3.1% 3.2% 3.8%Motorhome 2,428 1,617 1,605 1,077 1,114 64 44 42 31 34 2.6% 2.7% 2.6% 2.9% 3.1%OCCIDENTAL FIRE & CASUALTY CO
Pvt Passenger Auto 33,166 33,247 30,576 29,980 26,702 5,431 5,601 5,661 5,802 5,270 16.4% 16.8% 18.5% 19.4% 19.7%OCEAN HARBOR CASUALTY INS
Pvt Passenger Auto 20,189 21,879 18,356 24,252 32,445 7,732 8,211 6,468 8,746 11,318 38.3% 37.5% 35.2% 36.1% 34.9%ONE BEACON INS GROUP
Assigned Risk 240 113 11 0 0 69 22 1 0 0 28.8% 19.7% 13.4% 0.0% 0.0%Low Cost Auto 4,299 3,772 280 0 0 1,355 1,194 94 0 0 31.5% 31.7% 33.6% 0.0% 0.0%OREGON MUTUAL INS CO
Pvt Passenger Auto 4,920 4,899 4,639 4,021 4,451 327 350 374 325 439 6.6% 7.1% 8.1% 8.1% 9.9%PACIFIC PIONEER INSURANCE COMP
Pvt Passenger Auto 0 0 5,213 6,267 7,345 0 0 427 510 584 0.0% 0.0% 8.2% 8.1% 7.9%PACIFIC PROPERTY AND CASUALTY
Pvt Passenger Auto 21,980 23,057 23,667 24,649 26,182 548 530 498 479 499 2.5% 2.3% 2.1% 1.9% 1.9%Motorcycle 722 757 776 785 804 13 11 12 13 13 1.7% 1.4% 1.5% 1.6% 1.6%Motorhome 0 0 0 718 714 0 0 0 4 3 0.0% 0.0% 0.0% 0.5% 0.4%PACIFIC SPECIALTY INSURANCE CO
Pvt Passenger Auto 560 509 520 534 573 89 86 76 85 94 16.0% 16.8% 14.7% 15.9% 16.4%Low Cost Auto 59 71 51 34 25 15 16 11 8 7 25.6% 22.7% 21.5% 23.1% 28.4%Motorcycle 63,465 59,815 56,554 52,231 51,186 5,401 5,416 5,436 5,322 5,654 8.5% 9.1% 9.6% 10.2% 11.0%Motorhome 797 732 679 636 624 178 167 163 148 137 22.3% 22.9% 24.0% 23.2% 22.0%PERMANENT GENERAL ASSURANCE CO
Pvt Passenger Auto 59,914 57,554 55,958 53,670 52,628 6,735 6,220 6,351 6,042 5,374 11.2% 10.8% 11.3% 11.3% 10.2%PLAZA INDEMNITY INSURANCE COMPANY
Pvt Passenger Auto 0 0 0 20,679 32,363 0 0 0 2,921 4,855 0.0% 0.0% 0.0% 14.1% 15.0%
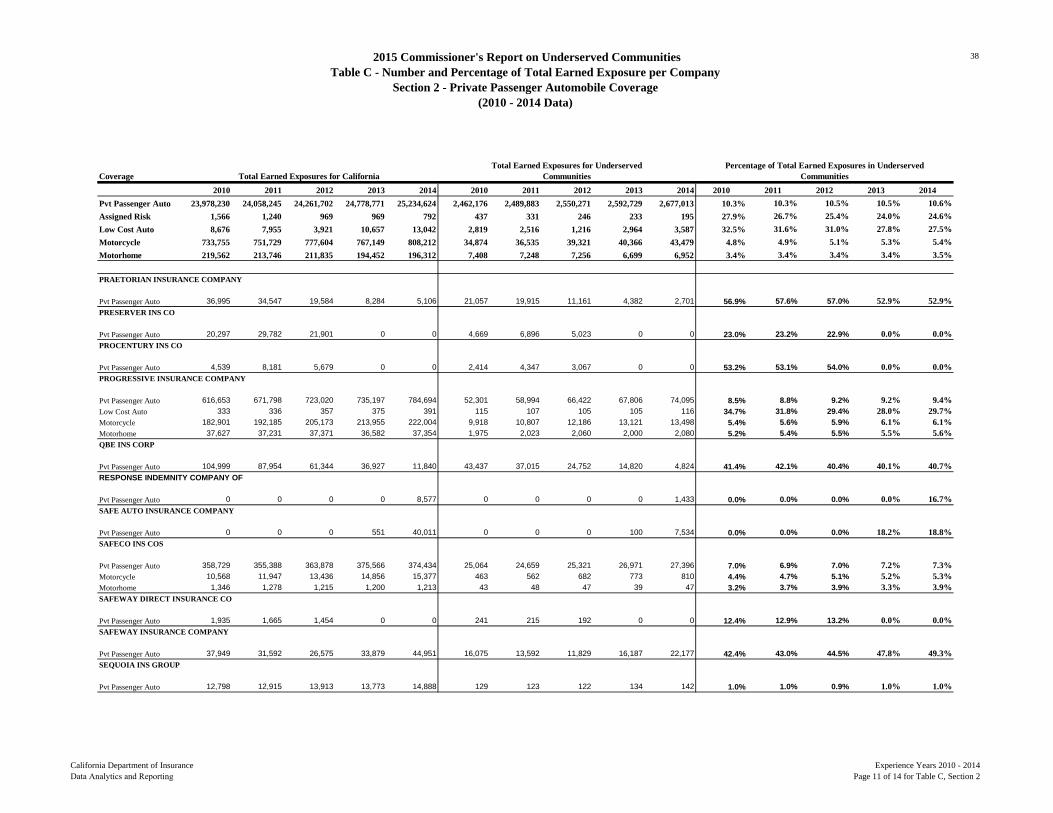
2015 Commissioner's Report on Underserved CommunitiesTable C - Number and Percentage of Total Earned Exposure per Company
Section 2 - Private Passenger Automobile Coverage(2010 - 2014 Data)
38
California Department of Insurance Data Analytics and Reporting
Experience Years 2010 - 2014Page 11 of 14 for Table C, Section 2
Coverage2010 2011 2012 2013 2014 2010 2011 2012 2013 2014 2010 2011 2012 2013 2014
Pvt Passenger Auto 23,978,230 24,058,245 24,261,702 24,778,771 25,234,624 2,462,176 2,489,883 2,550,271 2,592,729 2,677,013 10.3% 10.3% 10.5% 10.5% 10.6%Assigned Risk 1,566 1,240 969 969 792 437 331 246 233 195 27.9% 26.7% 25.4% 24.0% 24.6%Low Cost Auto 8,676 7,955 3,921 10,657 13,042 2,819 2,516 1,216 2,964 3,587 32.5% 31.6% 31.0% 27.8% 27.5%Motorcycle 733,755 751,729 777,604 767,149 808,212 34,874 36,535 39,321 40,366 43,479 4.8% 4.9% 5.1% 5.3% 5.4%Motorhome 219,562 213,746 211,835 194,452 196,312 7,408 7,248 7,256 6,699 6,952 3.4% 3.4% 3.4% 3.4% 3.5%
Total Earned Exposures for CaliforniaTotal Earned Exposures for Underserved
CommunitiesPercentage of Total Earned Exposures in Underserved
Communities
PRAETORIAN INSURANCE COMPANY
Pvt Passenger Auto 36,995 34,547 19,584 8,284 5,106 21,057 19,915 11,161 4,382 2,701 56.9% 57.6% 57.0% 52.9% 52.9%PRESERVER INS CO
Pvt Passenger Auto 20,297 29,782 21,901 0 0 4,669 6,896 5,023 0 0 23.0% 23.2% 22.9% 0.0% 0.0%PROCENTURY INS CO
Pvt Passenger Auto 4,539 8,181 5,679 0 0 2,414 4,347 3,067 0 0 53.2% 53.1% 54.0% 0.0% 0.0%PROGRESSIVE INSURANCE COMPANY
Pvt Passenger Auto 616,653 671,798 723,020 735,197 784,694 52,301 58,994 66,422 67,806 74,095 8.5% 8.8% 9.2% 9.2% 9.4%Low Cost Auto 333 336 357 375 391 115 107 105 105 116 34.7% 31.8% 29.4% 28.0% 29.7%Motorcycle 182,901 192,185 205,173 213,955 222,004 9,918 10,807 12,186 13,121 13,498 5.4% 5.6% 5.9% 6.1% 6.1%Motorhome 37,627 37,231 37,371 36,582 37,354 1,975 2,023 2,060 2,000 2,080 5.2% 5.4% 5.5% 5.5% 5.6%QBE INS CORP
Pvt Passenger Auto 104,999 87,954 61,344 36,927 11,840 43,437 37,015 24,752 14,820 4,824 41.4% 42.1% 40.4% 40.1% 40.7%RESPONSE INDEMNITY COMPANY OF
Pvt Passenger Auto 0 0 0 0 8,577 0 0 0 0 1,433 0.0% 0.0% 0.0% 0.0% 16.7%SAFE AUTO INSURANCE COMPANY
Pvt Passenger Auto 0 0 0 551 40,011 0 0 0 100 7,534 0.0% 0.0% 0.0% 18.2% 18.8%SAFECO INS COS
Pvt Passenger Auto 358,729 355,388 363,878 375,566 374,434 25,064 24,659 25,321 26,971 27,396 7.0% 6.9% 7.0% 7.2% 7.3%Motorcycle 10,568 11,947 13,436 14,856 15,377 463 562 682 773 810 4.4% 4.7% 5.1% 5.2% 5.3%Motorhome 1,346 1,278 1,215 1,200 1,213 43 48 47 39 47 3.2% 3.7% 3.9% 3.3% 3.9%SAFEWAY DIRECT INSURANCE CO
Pvt Passenger Auto 1,935 1,665 1,454 0 0 241 215 192 0 0 12.4% 12.9% 13.2% 0.0% 0.0%SAFEWAY INSURANCE COMPANY
Pvt Passenger Auto 37,949 31,592 26,575 33,879 44,951 16,075 13,592 11,829 16,187 22,177 42.4% 43.0% 44.5% 47.8% 49.3%SEQUOIA INS GROUP
Pvt Passenger Auto 12,798 12,915 13,913 13,773 14,888 129 123 122 134 142 1.0% 1.0% 0.9% 1.0% 1.0%

2015 Commissioner's Report on Underserved CommunitiesTable C - Number and Percentage of Total Earned Exposure per Company
Section 2 - Private Passenger Automobile Coverage(2010 - 2014 Data)
39
California Department of Insurance Data Analytics and Reporting
Experience Years 2010 - 2014Page 12 of 14 for Table C, Section 2
Coverage2010 2011 2012 2013 2014 2010 2011 2012 2013 2014 2010 2011 2012 2013 2014
Pvt Passenger Auto 23,978,230 24,058,245 24,261,702 24,778,771 25,234,624 2,462,176 2,489,883 2,550,271 2,592,729 2,677,013 10.3% 10.3% 10.5% 10.5% 10.6%Assigned Risk 1,566 1,240 969 969 792 437 331 246 233 195 27.9% 26.7% 25.4% 24.0% 24.6%Low Cost Auto 8,676 7,955 3,921 10,657 13,042 2,819 2,516 1,216 2,964 3,587 32.5% 31.6% 31.0% 27.8% 27.5%Motorcycle 733,755 751,729 777,604 767,149 808,212 34,874 36,535 39,321 40,366 43,479 4.8% 4.9% 5.1% 5.3% 5.4%Motorhome 219,562 213,746 211,835 194,452 196,312 7,408 7,248 7,256 6,699 6,952 3.4% 3.4% 3.4% 3.4% 3.5%
Total Earned Exposures for CaliforniaTotal Earned Exposures for Underserved
CommunitiesPercentage of Total Earned Exposures in Underserved
Communities
SOUTHERN INSURANCE CO
Pvt Passenger Auto 14,881 8,449 2,421 0 0 7,329 4,241 1,240 0 0 49.3% 50.2% 51.2% 0.0% 0.0%STARR INDEMNITY & LIABILITY CO
Pvt Passenger Auto 6,735 23,763 19,082 6,766 3,976 871 3,075 2,418 839 483 12.9% 12.9% 12.7% 12.4% 12.1%STATE FARM INSURANCE COMPANIES
Pvt Passenger Auto 3,117,050 3,194,587 3,289,628 3,378,402 3,472,535 195,033 204,877 218,116 235,954 249,301 6.3% 6.4% 6.6% 7.0% 7.2%Assigned Risk 198 157 127 131 96 44 33 20 27 19 22.0% 21.2% 15.4% 21.0% 19.7%Low Cost Auto 1,506 1,524 1,453 1,541 1,572 465 445 415 436 434 30.9% 29.2% 28.5% 28.3% 27.6%Motorcycle 103,464 105,058 106,974 108,362 109,180 3,951 4,058 4,195 4,401 4,567 3.8% 3.9% 3.9% 4.1% 4.2%Motorhome 27,099 26,876 26,401 25,948 25,327 654 647 628 602 570 2.4% 2.4% 2.4% 2.3% 2.3%STATE NATIONAL INS CO
Pvt Passenger Auto 22,748 17,867 16,784 0 0 3,173 2,566 2,362 0 0 13.9% 14.4% 14.1% 0.0% 0.0%STERLING CASUALTY INS CO
Pvt Passenger Auto 34,323 50,941 45,987 31,922 27,600 5,071 7,427 6,583 4,615 3,983 14.8% 14.6% 14.3% 14.5% 14.4%Low Cost Auto 0 0 0 107 147 0 0 0 30 51 0.0% 0.0% 0.0% 27.8% 34.5%THE HARTFORD
Pvt Passenger Auto 336,752 257,665 257,698 283,677 318,122 18,058 14,047 13,917 14,958 16,509 5.4% 5.5% 5.4% 5.3% 5.2%Motorhome 4,138 3,858 3,967 4,428 4,881 109 97 103 135 145 2.6% 2.5% 2.6% 3.0% 3.0%TOKIO MARINE & NICHIDO FIRE
Pvt Passenger Auto 13,292 14,733 16,873 9,441 9,416 1,310 1,390 1,623 993 1,014 9.9% 9.4% 9.6% 10.5% 10.8%
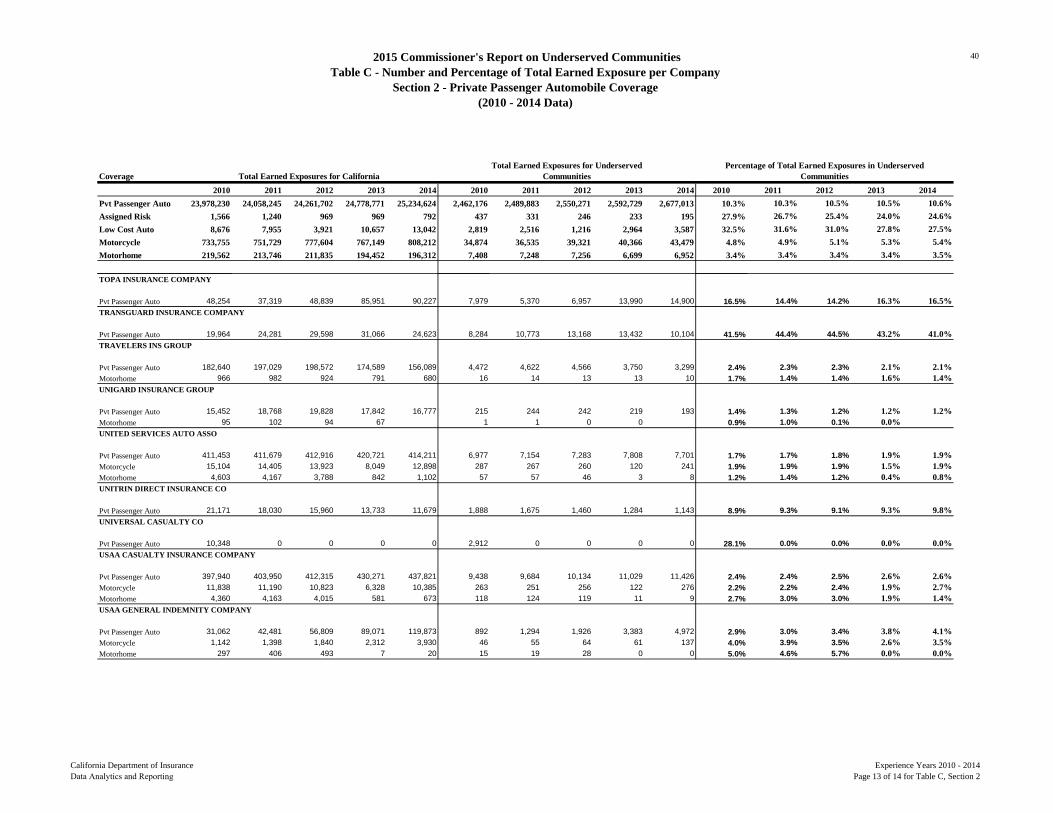
2015 Commissioner's Report on Underserved CommunitiesTable C - Number and Percentage of Total Earned Exposure per Company
Section 2 - Private Passenger Automobile Coverage(2010 - 2014 Data)
40
California Department of Insurance Data Analytics and Reporting
Experience Years 2010 - 2014Page 13 of 14 for Table C, Section 2
Coverage2010 2011 2012 2013 2014 2010 2011 2012 2013 2014 2010 2011 2012 2013 2014
Pvt Passenger Auto 23,978,230 24,058,245 24,261,702 24,778,771 25,234,624 2,462,176 2,489,883 2,550,271 2,592,729 2,677,013 10.3% 10.3% 10.5% 10.5% 10.6%Assigned Risk 1,566 1,240 969 969 792 437 331 246 233 195 27.9% 26.7% 25.4% 24.0% 24.6%Low Cost Auto 8,676 7,955 3,921 10,657 13,042 2,819 2,516 1,216 2,964 3,587 32.5% 31.6% 31.0% 27.8% 27.5%Motorcycle 733,755 751,729 777,604 767,149 808,212 34,874 36,535 39,321 40,366 43,479 4.8% 4.9% 5.1% 5.3% 5.4%Motorhome 219,562 213,746 211,835 194,452 196,312 7,408 7,248 7,256 6,699 6,952 3.4% 3.4% 3.4% 3.4% 3.5%
Total Earned Exposures for CaliforniaTotal Earned Exposures for Underserved
CommunitiesPercentage of Total Earned Exposures in Underserved
Communities
TOPA INSURANCE COMPANY
Pvt Passenger Auto 48,254 37,319 48,839 85,951 90,227 7,979 5,370 6,957 13,990 14,900 16.5% 14.4% 14.2% 16.3% 16.5%TRANSGUARD INSURANCE COMPANY
Pvt Passenger Auto 19,964 24,281 29,598 31,066 24,623 8,284 10,773 13,168 13,432 10,104 41.5% 44.4% 44.5% 43.2% 41.0%TRAVELERS INS GROUP
Pvt Passenger Auto 182,640 197,029 198,572 174,589 156,089 4,472 4,622 4,566 3,750 3,299 2.4% 2.3% 2.3% 2.1% 2.1%Motorhome 966 982 924 791 680 16 14 13 13 10 1.7% 1.4% 1.4% 1.6% 1.4%UNIGARD INSURANCE GROUP
Pvt Passenger Auto 15,452 18,768 19,828 17,842 16,777 215 244 242 219 193 1.4% 1.3% 1.2% 1.2% 1.2%Motorhome 95 102 94 67 1 1 0 0 0.9% 1.0% 0.1% 0.0%UNITED SERVICES AUTO ASSO
Pvt Passenger Auto 411,453 411,679 412,916 420,721 414,211 6,977 7,154 7,283 7,808 7,701 1.7% 1.7% 1.8% 1.9% 1.9%Motorcycle 15,104 14,405 13,923 8,049 12,898 287 267 260 120 241 1.9% 1.9% 1.9% 1.5% 1.9%Motorhome 4,603 4,167 3,788 842 1,102 57 57 46 3 8 1.2% 1.4% 1.2% 0.4% 0.8%UNITRIN DIRECT INSURANCE CO
Pvt Passenger Auto 21,171 18,030 15,960 13,733 11,679 1,888 1,675 1,460 1,284 1,143 8.9% 9.3% 9.1% 9.3% 9.8%UNIVERSAL CASUALTY CO
Pvt Passenger Auto 10,348 0 0 0 0 2,912 0 0 0 0 28.1% 0.0% 0.0% 0.0% 0.0%USAA CASUALTY INSURANCE COMPANY
Pvt Passenger Auto 397,940 403,950 412,315 430,271 437,821 9,438 9,684 10,134 11,029 11,426 2.4% 2.4% 2.5% 2.6% 2.6%Motorcycle 11,838 11,190 10,823 6,328 10,385 263 251 256 122 276 2.2% 2.2% 2.4% 1.9% 2.7%Motorhome 4,360 4,163 4,015 581 673 118 124 119 11 9 2.7% 3.0% 3.0% 1.9% 1.4%USAA GENERAL INDEMNITY COMPANY
Pvt Passenger Auto 31,062 42,481 56,809 89,071 119,873 892 1,294 1,926 3,383 4,972 2.9% 3.0% 3.4% 3.8% 4.1%Motorcycle 1,142 1,398 1,840 2,312 3,930 46 55 64 61 137 4.0% 3.9% 3.5% 2.6% 3.5%Motorhome 297 406 493 7 20 15 19 28 0 0 5.0% 4.6% 5.7% 0.0% 0.0%

2015 Commissioner's Report on Underserved CommunitiesTable C - Number and Percentage of Total Earned Exposure per Company
Section 2 - Private Passenger Automobile Coverage(2010 - 2014 Data)
41
California Department of Insurance Data Analytics and Reporting
Experience Years 2010 - 2014Page 14 of 14 for Table C, Section 2
Coverage2010 2011 2012 2013 2014 2010 2011 2012 2013 2014 2010 2011 2012 2013 2014
Pvt Passenger Auto 23,978,230 24,058,245 24,261,702 24,778,771 25,234,624 2,462,176 2,489,883 2,550,271 2,592,729 2,677,013 10.3% 10.3% 10.5% 10.5% 10.6%Assigned Risk 1,566 1,240 969 969 792 437 331 246 233 195 27.9% 26.7% 25.4% 24.0% 24.6%Low Cost Auto 8,676 7,955 3,921 10,657 13,042 2,819 2,516 1,216 2,964 3,587 32.5% 31.6% 31.0% 27.8% 27.5%Motorcycle 733,755 751,729 777,604 767,149 808,212 34,874 36,535 39,321 40,366 43,479 4.8% 4.9% 5.1% 5.3% 5.4%Motorhome 219,562 213,746 211,835 194,452 196,312 7,408 7,248 7,256 6,699 6,952 3.4% 3.4% 3.4% 3.4% 3.5%
Total Earned Exposures for CaliforniaTotal Earned Exposures for Underserved
CommunitiesPercentage of Total Earned Exposures in Underserved
Communities
VICTORIA FIRE & CAS INS CO
Pvt Passenger Auto 119,313 100,188 94,865 89,916 87,284 14,776 11,934 11,411 10,975 10,854 12.4% 11.9% 12.0% 12.2% 12.4%Motorcycle 319 743 912 606 1,045 38 83 117 75 147 11.9% 11.2% 12.8% 12.4% 14.1%Motorhome 249 404 411 229 252 6 23 26 18 25 2.3% 5.7% 6.4% 7.7% 10.1%VIKING INS CO of WI
Pvt Passenger Auto 262,019 253,849 259,386 255,086 213,922 53,149 52,666 55,391 54,724 40,287 20.3% 20.7% 21.4% 21.5% 18.8%Motorcycle 9,267 8,712 8,376 7,030 5,962 959 1,024 1,048 869 667 10.4% 11.8% 12.5% 12.4% 11.2%WAWANESA INSURANCE GROUP
Pvt Passenger Auto 462,342 464,191 460,200 464,208 472,015 33,151 33,098 32,070 32,115 32,656 7.2% 7.1% 7.0% 6.9% 6.9%WESTERN GENERAL INSURANCE CO
Pvt Passenger Auto 30,069 34,980 36,937 39,418 33,280 6,600 8,037 9,089 9,842 6,265 21.9% 23.0% 24.6% 25.0% 18.8%Assigned Risk 9 7 2 8 7 2 0 0 2 0 21.2% 5.0% 10.7% 19.1% 0.0%Low Cost Auto 70 68 50 171 190 20 20 13 41 50 29.1% 29.2% 25.7% 23.8% 26.5%WESTERN HOME INSURANCE COMPANY
Pvt Passenger Auto 0 7,142 39,907 63,798 56,986 0 3,503 22,345 34,309 29,123 0.0% 49.1% 56.0% 53.8% 51.1%WORKMENS AUTO INS CO
Pvt Passenger Auto 34,873 33,530 25,099 21,853 28,178 5,676 8,276 6,332 3,335 2,939 16.3% 24.7% 25.2% 15.3% 10.4%
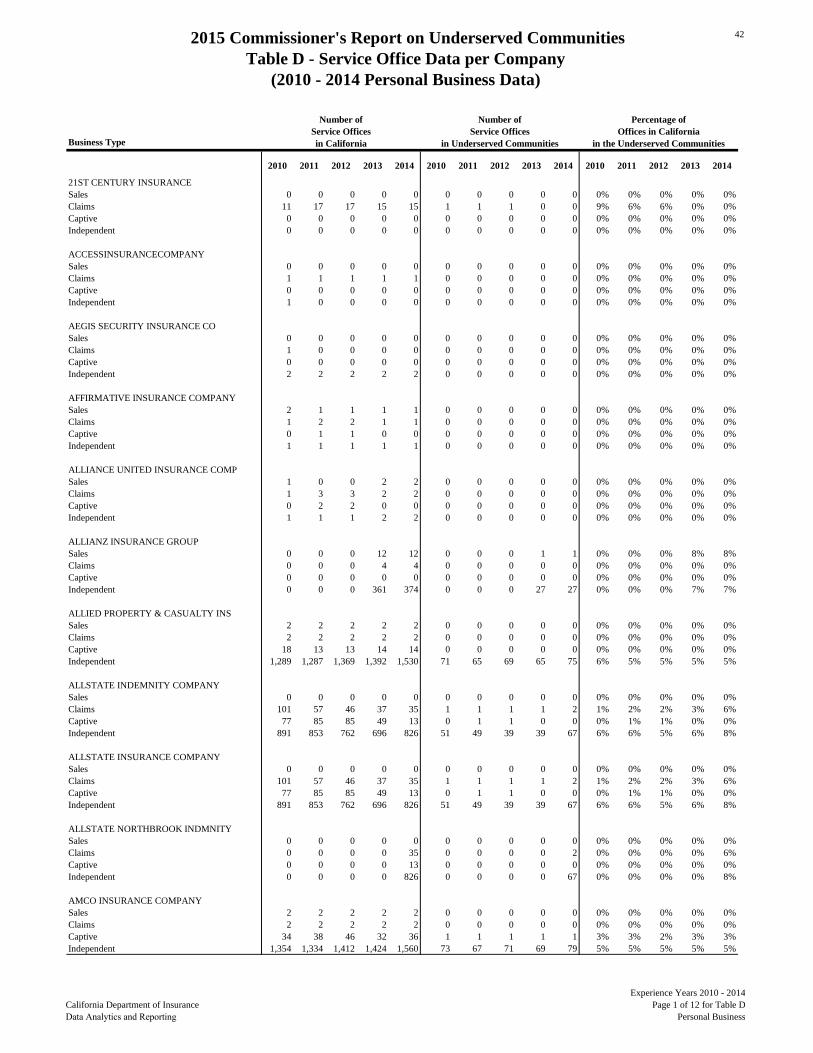
2015 Commissioner's Report on Underserved CommunitiesTable D - Service Office Data per Company
(2010 - 2014 Personal Business Data)
42
California Department of Insurance Data Analytics and Reporting
Experience Years 2010 - 2014Page 1 of 12 for Table D
Personal Business
Business Type
2010 2011 2012 2013 2014 2010 2011 2012 2013 2014 2010 2011 2012 2013 2014
21ST CENTURY INSURANCESales 0 0 0 0 0 0 0 0 0 0 0% 0% 0% 0% 0%Claims 11 17 17 15 15 1 1 1 0 0 9% 6% 6% 0% 0%Captive 0 0 0 0 0 0 0 0 0 0 0% 0% 0% 0% 0%Independent 0 0 0 0 0 0 0 0 0 0 0% 0% 0% 0% 0%
ACCESSINSURANCECOMPANYSales 0 0 0 0 0 0 0 0 0 0 0% 0% 0% 0% 0%Claims 1 1 1 1 1 0 0 0 0 0 0% 0% 0% 0% 0%Captive 0 0 0 0 0 0 0 0 0 0 0% 0% 0% 0% 0%Independent 1 0 0 0 0 0 0 0 0 0 0% 0% 0% 0% 0%
AEGIS SECURITY INSURANCE COSales 0 0 0 0 0 0 0 0 0 0 0% 0% 0% 0% 0%Claims 1 0 0 0 0 0 0 0 0 0 0% 0% 0% 0% 0%Captive 0 0 0 0 0 0 0 0 0 0 0% 0% 0% 0% 0%Independent 2 2 2 2 2 0 0 0 0 0 0% 0% 0% 0% 0%
AFFIRMATIVE INSURANCE COMPANYSales 2 1 1 1 1 0 0 0 0 0 0% 0% 0% 0% 0%Claims 1 2 2 1 1 0 0 0 0 0 0% 0% 0% 0% 0%Captive 0 1 1 0 0 0 0 0 0 0 0% 0% 0% 0% 0%Independent 1 1 1 1 1 0 0 0 0 0 0% 0% 0% 0% 0%
ALLIANCE UNITED INSURANCE COMPSales 1 0 0 2 2 0 0 0 0 0 0% 0% 0% 0% 0%Claims 1 3 3 2 2 0 0 0 0 0 0% 0% 0% 0% 0%Captive 0 2 2 0 0 0 0 0 0 0 0% 0% 0% 0% 0%Independent 1 1 1 2 2 0 0 0 0 0 0% 0% 0% 0% 0%
ALLIANZ INSURANCE GROUPSales 0 0 0 12 12 0 0 0 1 1 0% 0% 0% 8% 8%Claims 0 0 0 4 4 0 0 0 0 0 0% 0% 0% 0% 0%Captive 0 0 0 0 0 0 0 0 0 0 0% 0% 0% 0% 0%Independent 0 0 0 361 374 0 0 0 27 27 0% 0% 0% 7% 7%
ALLIED PROPERTY & CASUALTY INSSales 2 2 2 2 2 0 0 0 0 0 0% 0% 0% 0% 0%Claims 2 2 2 2 2 0 0 0 0 0 0% 0% 0% 0% 0%Captive 18 13 13 14 14 0 0 0 0 0 0% 0% 0% 0% 0%Independent 1,289 1,287 1,369 1,392 1,530 71 65 69 65 75 6% 5% 5% 5% 5%
ALLSTATE INDEMNITY COMPANYSales 0 0 0 0 0 0 0 0 0 0 0% 0% 0% 0% 0%Claims 101 57 46 37 35 1 1 1 1 2 1% 2% 2% 3% 6%Captive 77 85 85 49 13 0 1 1 0 0 0% 1% 1% 0% 0%Independent 891 853 762 696 826 51 49 39 39 67 6% 6% 5% 6% 8%
ALLSTATE INSURANCE COMPANYSales 0 0 0 0 0 0 0 0 0 0 0% 0% 0% 0% 0%Claims 101 57 46 37 35 1 1 1 1 2 1% 2% 2% 3% 6%Captive 77 85 85 49 13 0 1 1 0 0 0% 1% 1% 0% 0%Independent 891 853 762 696 826 51 49 39 39 67 6% 6% 5% 6% 8%
ALLSTATE NORTHBROOK INDMNITYSales 0 0 0 0 0 0 0 0 0 0 0% 0% 0% 0% 0%Claims 0 0 0 0 35 0 0 0 0 2 0% 0% 0% 0% 6%Captive 0 0 0 0 13 0 0 0 0 0 0% 0% 0% 0% 0%Independent 0 0 0 0 826 0 0 0 0 67 0% 0% 0% 0% 8%
AMCO INSURANCE COMPANYSales 2 2 2 2 2 0 0 0 0 0 0% 0% 0% 0% 0%Claims 2 2 2 2 2 0 0 0 0 0 0% 0% 0% 0% 0%Captive 34 38 46 32 36 1 1 1 1 1 3% 3% 2% 3% 3%Independent 1,354 1,334 1,412 1,424 1,560 73 67 71 69 79 5% 5% 5% 5% 5%
Number of Service Officesin California
Number of Service Offices
in Underserved Communities
Percentage of Offices in California
in the Underserved Communities
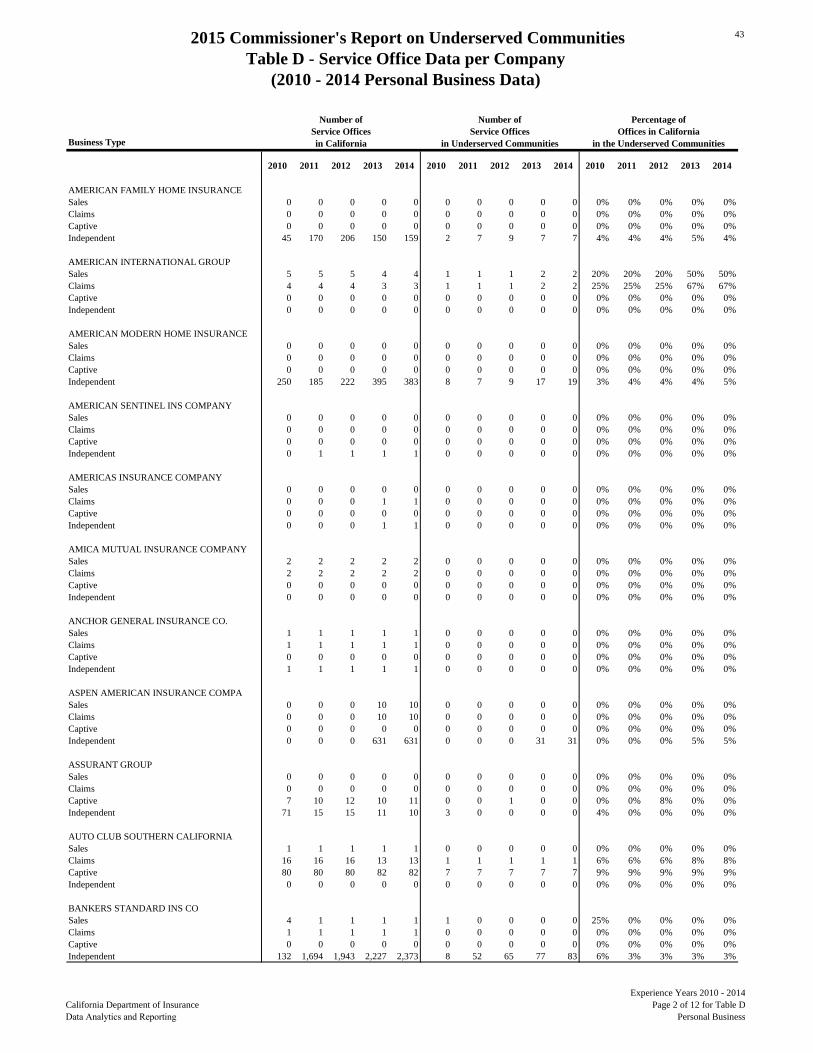
2015 Commissioner's Report on Underserved CommunitiesTable D - Service Office Data per Company
(2010 - 2014 Personal Business Data)
43
California Department of Insurance Data Analytics and Reporting
Experience Years 2010 - 2014Page 2 of 12 for Table D
Personal Business
Business Type
2010 2011 2012 2013 2014 2010 2011 2012 2013 2014 2010 2011 2012 2013 2014
Number of Service Officesin California
Number of Service Offices
in Underserved Communities
Percentage of Offices in California
in the Underserved Communities
AMERICAN FAMILY HOME INSURANCESales 0 0 0 0 0 0 0 0 0 0 0% 0% 0% 0% 0%Claims 0 0 0 0 0 0 0 0 0 0 0% 0% 0% 0% 0%Captive 0 0 0 0 0 0 0 0 0 0 0% 0% 0% 0% 0%Independent 45 170 206 150 159 2 7 9 7 7 4% 4% 4% 5% 4%
AMERICAN INTERNATIONAL GROUPSales 5 5 5 4 4 1 1 1 2 2 20% 20% 20% 50% 50%Claims 4 4 4 3 3 1 1 1 2 2 25% 25% 25% 67% 67%Captive 0 0 0 0 0 0 0 0 0 0 0% 0% 0% 0% 0%Independent 0 0 0 0 0 0 0 0 0 0 0% 0% 0% 0% 0%
AMERICAN MODERN HOME INSURANCESales 0 0 0 0 0 0 0 0 0 0 0% 0% 0% 0% 0%Claims 0 0 0 0 0 0 0 0 0 0 0% 0% 0% 0% 0%Captive 0 0 0 0 0 0 0 0 0 0 0% 0% 0% 0% 0%Independent 250 185 222 395 383 8 7 9 17 19 3% 4% 4% 4% 5%
AMERICAN SENTINEL INS COMPANYSales 0 0 0 0 0 0 0 0 0 0 0% 0% 0% 0% 0%Claims 0 0 0 0 0 0 0 0 0 0 0% 0% 0% 0% 0%Captive 0 0 0 0 0 0 0 0 0 0 0% 0% 0% 0% 0%Independent 0 1 1 1 1 0 0 0 0 0 0% 0% 0% 0% 0%
AMERICAS INSURANCE COMPANYSales 0 0 0 0 0 0 0 0 0 0 0% 0% 0% 0% 0%Claims 0 0 0 1 1 0 0 0 0 0 0% 0% 0% 0% 0%Captive 0 0 0 0 0 0 0 0 0 0 0% 0% 0% 0% 0%Independent 0 0 0 1 1 0 0 0 0 0 0% 0% 0% 0% 0%
AMICA MUTUAL INSURANCE COMPANYSales 2 2 2 2 2 0 0 0 0 0 0% 0% 0% 0% 0%Claims 2 2 2 2 2 0 0 0 0 0 0% 0% 0% 0% 0%Captive 0 0 0 0 0 0 0 0 0 0 0% 0% 0% 0% 0%Independent 0 0 0 0 0 0 0 0 0 0 0% 0% 0% 0% 0%
ANCHOR GENERAL INSURANCE CO.Sales 1 1 1 1 1 0 0 0 0 0 0% 0% 0% 0% 0%Claims 1 1 1 1 1 0 0 0 0 0 0% 0% 0% 0% 0%Captive 0 0 0 0 0 0 0 0 0 0 0% 0% 0% 0% 0%Independent 1 1 1 1 1 0 0 0 0 0 0% 0% 0% 0% 0%
ASPEN AMERICAN INSURANCE COMPASales 0 0 0 10 10 0 0 0 0 0 0% 0% 0% 0% 0%Claims 0 0 0 10 10 0 0 0 0 0 0% 0% 0% 0% 0%Captive 0 0 0 0 0 0 0 0 0 0 0% 0% 0% 0% 0%Independent 0 0 0 631 631 0 0 0 31 31 0% 0% 0% 5% 5%
ASSURANT GROUPSales 0 0 0 0 0 0 0 0 0 0 0% 0% 0% 0% 0%Claims 0 0 0 0 0 0 0 0 0 0 0% 0% 0% 0% 0%Captive 7 10 12 10 11 0 0 1 0 0 0% 0% 8% 0% 0%Independent 71 15 15 11 10 3 0 0 0 0 4% 0% 0% 0% 0%
AUTO CLUB SOUTHERN CALIFORNIASales 1 1 1 1 1 0 0 0 0 0 0% 0% 0% 0% 0%Claims 16 16 16 13 13 1 1 1 1 1 6% 6% 6% 8% 8%Captive 80 80 80 82 82 7 7 7 7 7 9% 9% 9% 9% 9%Independent 0 0 0 0 0 0 0 0 0 0 0% 0% 0% 0% 0%
BANKERS STANDARD INS COSales 4 1 1 1 1 1 0 0 0 0 25% 0% 0% 0% 0%Claims 1 1 1 1 1 0 0 0 0 0 0% 0% 0% 0% 0%Captive 0 0 0 0 0 0 0 0 0 0 0% 0% 0% 0% 0%Independent 132 1,694 1,943 2,227 2,373 8 52 65 77 83 6% 3% 3% 3% 3%
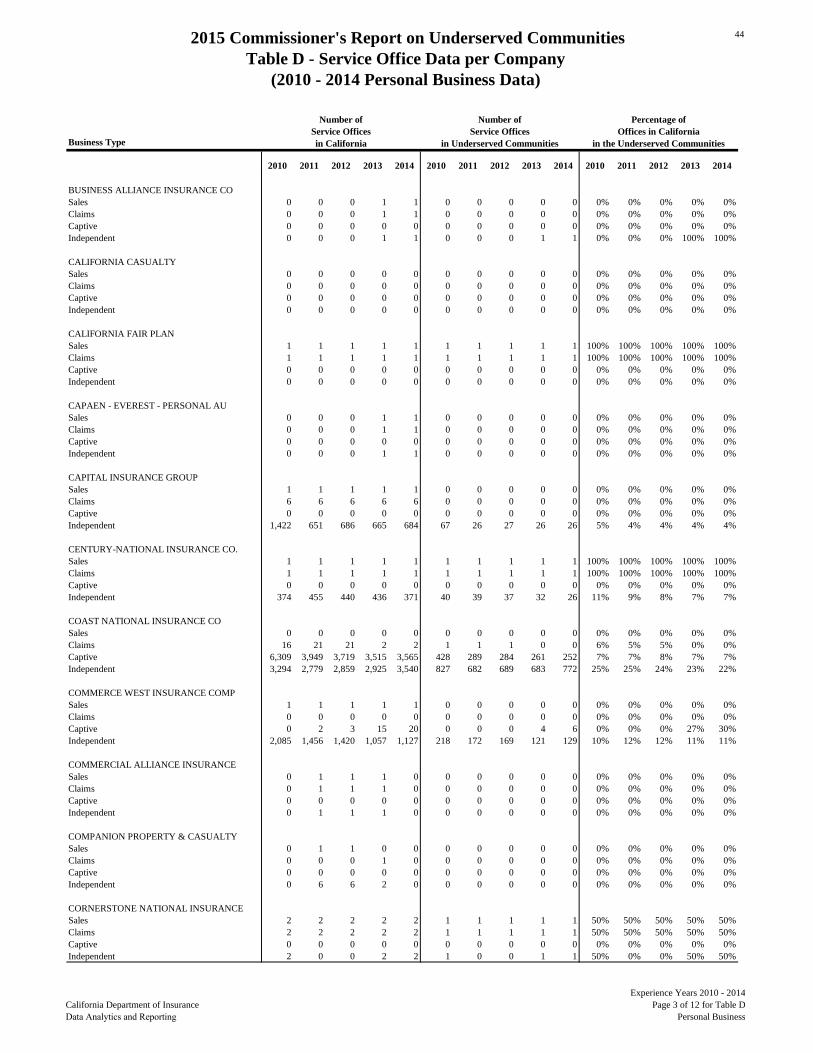
2015 Commissioner's Report on Underserved CommunitiesTable D - Service Office Data per Company
(2010 - 2014 Personal Business Data)
44
California Department of Insurance Data Analytics and Reporting
Experience Years 2010 - 2014Page 3 of 12 for Table D
Personal Business
Business Type
2010 2011 2012 2013 2014 2010 2011 2012 2013 2014 2010 2011 2012 2013 2014
Number of Service Officesin California
Number of Service Offices
in Underserved Communities
Percentage of Offices in California
in the Underserved Communities
BUSINESS ALLIANCE INSURANCE COSales 0 0 0 1 1 0 0 0 0 0 0% 0% 0% 0% 0%Claims 0 0 0 1 1 0 0 0 0 0 0% 0% 0% 0% 0%Captive 0 0 0 0 0 0 0 0 0 0 0% 0% 0% 0% 0%Independent 0 0 0 1 1 0 0 0 1 1 0% 0% 0% 100% 100%
CALIFORNIA CASUALTYSales 0 0 0 0 0 0 0 0 0 0 0% 0% 0% 0% 0%Claims 0 0 0 0 0 0 0 0 0 0 0% 0% 0% 0% 0%Captive 0 0 0 0 0 0 0 0 0 0 0% 0% 0% 0% 0%Independent 0 0 0 0 0 0 0 0 0 0 0% 0% 0% 0% 0%
CALIFORNIA FAIR PLANSales 1 1 1 1 1 1 1 1 1 1 100% 100% 100% 100% 100%Claims 1 1 1 1 1 1 1 1 1 1 100% 100% 100% 100% 100%Captive 0 0 0 0 0 0 0 0 0 0 0% 0% 0% 0% 0%Independent 0 0 0 0 0 0 0 0 0 0 0% 0% 0% 0% 0%
CAPAEN - EVEREST - PERSONAL AUSales 0 0 0 1 1 0 0 0 0 0 0% 0% 0% 0% 0%Claims 0 0 0 1 1 0 0 0 0 0 0% 0% 0% 0% 0%Captive 0 0 0 0 0 0 0 0 0 0 0% 0% 0% 0% 0%Independent 0 0 0 1 1 0 0 0 0 0 0% 0% 0% 0% 0%
CAPITAL INSURANCE GROUPSales 1 1 1 1 1 0 0 0 0 0 0% 0% 0% 0% 0%Claims 6 6 6 6 6 0 0 0 0 0 0% 0% 0% 0% 0%Captive 0 0 0 0 0 0 0 0 0 0 0% 0% 0% 0% 0%Independent 1,422 651 686 665 684 67 26 27 26 26 5% 4% 4% 4% 4%
CENTURY-NATIONAL INSURANCE CO.Sales 1 1 1 1 1 1 1 1 1 1 100% 100% 100% 100% 100%Claims 1 1 1 1 1 1 1 1 1 1 100% 100% 100% 100% 100%Captive 0 0 0 0 0 0 0 0 0 0 0% 0% 0% 0% 0%Independent 374 455 440 436 371 40 39 37 32 26 11% 9% 8% 7% 7%
COAST NATIONAL INSURANCE COSales 0 0 0 0 0 0 0 0 0 0 0% 0% 0% 0% 0%Claims 16 21 21 2 2 1 1 1 0 0 6% 5% 5% 0% 0%Captive 6,309 3,949 3,719 3,515 3,565 428 289 284 261 252 7% 7% 8% 7% 7%Independent 3,294 2,779 2,859 2,925 3,540 827 682 689 683 772 25% 25% 24% 23% 22%
COMMERCE WEST INSURANCE COMPSales 1 1 1 1 1 0 0 0 0 0 0% 0% 0% 0% 0%Claims 0 0 0 0 0 0 0 0 0 0 0% 0% 0% 0% 0%Captive 0 2 3 15 20 0 0 0 4 6 0% 0% 0% 27% 30%Independent 2,085 1,456 1,420 1,057 1,127 218 172 169 121 129 10% 12% 12% 11% 11%
COMMERCIAL ALLIANCE INSURANCESales 0 1 1 1 0 0 0 0 0 0 0% 0% 0% 0% 0%Claims 0 1 1 1 0 0 0 0 0 0 0% 0% 0% 0% 0%Captive 0 0 0 0 0 0 0 0 0 0 0% 0% 0% 0% 0%Independent 0 1 1 1 0 0 0 0 0 0 0% 0% 0% 0% 0%
COMPANION PROPERTY & CASUALTYSales 0 1 1 0 0 0 0 0 0 0 0% 0% 0% 0% 0%Claims 0 0 0 1 0 0 0 0 0 0 0% 0% 0% 0% 0%Captive 0 0 0 0 0 0 0 0 0 0 0% 0% 0% 0% 0%Independent 0 6 6 2 0 0 0 0 0 0 0% 0% 0% 0% 0%
CORNERSTONE NATIONAL INSURANCESales 2 2 2 2 2 1 1 1 1 1 50% 50% 50% 50% 50%Claims 2 2 2 2 2 1 1 1 1 1 50% 50% 50% 50% 50%Captive 0 0 0 0 0 0 0 0 0 0 0% 0% 0% 0% 0%Independent 2 0 0 2 2 1 0 0 1 1 50% 0% 0% 50% 50%

2015 Commissioner's Report on Underserved CommunitiesTable D - Service Office Data per Company
(2010 - 2014 Personal Business Data)
45
California Department of Insurance Data Analytics and Reporting
Experience Years 2010 - 2014Page 4 of 12 for Table D
Personal Business
Business Type
2010 2011 2012 2013 2014 2010 2011 2012 2013 2014 2010 2011 2012 2013 2014
Number of Service Officesin California
Number of Service Offices
in Underserved Communities
Percentage of Offices in California
in the Underserved Communities
CRESTBROOK INSURANCE COMPANYSales 0 2 2 2 0 0 0 0 0 0 0% 0% 0% 0% 0%Claims 0 2 2 2 2 0 0 0 0 0 0% 0% 0% 0% 0%Captive 0 0 0 0 0 0 0 0 0 0 0% 0% 0% 0% 0%Independent 0 789 888 885 185 0 32 38 37 9 0% 4% 4% 4% 5%
CSAA INSURANCE EXCHANGESales 0 1 1 1 1 0 0 0 0 0 0% 0% 0% 0% 0%Claims 3 3 1 1 1 0 0 0 0 0 0% 0% 0% 0% 0%Captive 87 84 83 78 78 2 1 1 1 1 2% 1% 1% 1% 1%Independent 0 0 0 0 0 0 0 0 0 0 0% 0% 0% 0% 0%
CSAA INSURANCE GROUPSales 0 1 1 1 1 0 0 0 0 0 0% 0% 0% 0% 0%Claims 3 3 1 1 1 0 0 0 0 0 0% 0% 0% 0% 0%Captive 87 84 83 78 78 2 1 1 1 1 2% 1% 1% 1% 1%Independent 0 0 0 0 0 0 0 0 0 0 0% 0% 0% 0% 0%
CSE INSURANCE GROUPSales 1 1 1 1 1 0 0 0 0 0 0% 0% 0% 0% 0%Claims 2 2 2 3 3 0 0 0 0 0 0% 0% 0% 0% 0%Captive 0 0 0 0 0 0 0 0 0 0 0% 0% 0% 0% 0%Independent 427 470 332 371 514 16 20 16 14 18 4% 4% 5% 4% 4%
DEPOSITORS INSURANCE COMPANYSales 2 2 2 2 2 0 0 0 0 0 0% 0% 0% 0% 0%Claims 2 2 2 2 2 0 0 0 0 0 0% 0% 0% 0% 0%Captive 5 27 73 52 63 0 2 3 3 3 0% 7% 4% 6% 5%Independent 1,354 1,334 1,412 1,424 1,560 73 67 71 69 79 5% 5% 5% 5% 5%
DONGBU INSURANCE CO LTDSales 0 1 1 1 1 0 0 0 1 1 0% 0% 0% 100% 100%Claims 0 1 1 1 1 0 0 0 0 0 0% 0% 0% 0% 0%Captive 0 0 0 0 0 0 0 0 0 0 0% 0% 0% 0% 0%Independent 0 0 0 1 1 0 0 0 0 0 0% 0% 0% 0% 0%
ELECTRIC INSURANCE COMPANYSales 0 0 0 0 0 0 0 0 0 0 0% 0% 0% 0% 0%Claims 0 0 0 0 0 0 0 0 0 0 0% 0% 0% 0% 0%Captive 0 0 0 0 0 0 0 0 0 0 0% 0% 0% 0% 0%Independent 0 0 0 0 0 0 0 0 0 0 0% 0% 0% 0% 0%
ENCOMPASS INSURANCE COMPANYSales 1 1 1 1 1 0 0 0 0 0 0% 0% 0% 0% 0%Claims 1 1 1 1 1 0 0 0 0 0 0% 0% 0% 0% 0%Captive 0 0 0 0 0 0 0 0 0 0 0% 0% 0% 0% 0%Independent 228 212 225 197 198 10 10 10 7 7 4% 5% 4% 4% 4%
EQUITY INSURANCE GROUPSales 0 0 0 1 1 0 0 0 0 0 0% 0% 0% 0% 0%Claims 0 0 0 1 1 0 0 0 0 0 0% 0% 0% 0% 0%Captive 0 0 0 0 0 0 0 0 0 0 0% 0% 0% 0% 0%Independent 0 0 0 1 1 0 0 0 0 0 0% 0% 0% 0% 0%
ESURANCE PROPERTY AND CASUALTYSales 2 2 2 3 3 0 0 0 0 0 0% 0% 0% 0% 0%Claims 2 2 2 2 2 0 0 0 0 0 0% 0% 0% 0% 0%Captive 0 0 0 1 1 0 0 0 0 0 0% 0% 0% 0% 0%Independent 1 1 1 0 0 0 0 0 0 0 0% 0% 0% 0% 0%
EXPLORER INSURANCE COMPANYSales 1 1 1 1 1 0 0 0 0 0 0% 0% 0% 0% 0%Claims 1 1 1 1 1 0 0 0 0 0 0% 0% 0% 0% 0%Captive 0 0 0 0 0 0 0 0 0 0 0% 0% 0% 0% 0%Independent 2,800 2,802 2,170 2,022 2,022 480 572 484 431 431 17% 20% 22% 21% 21%
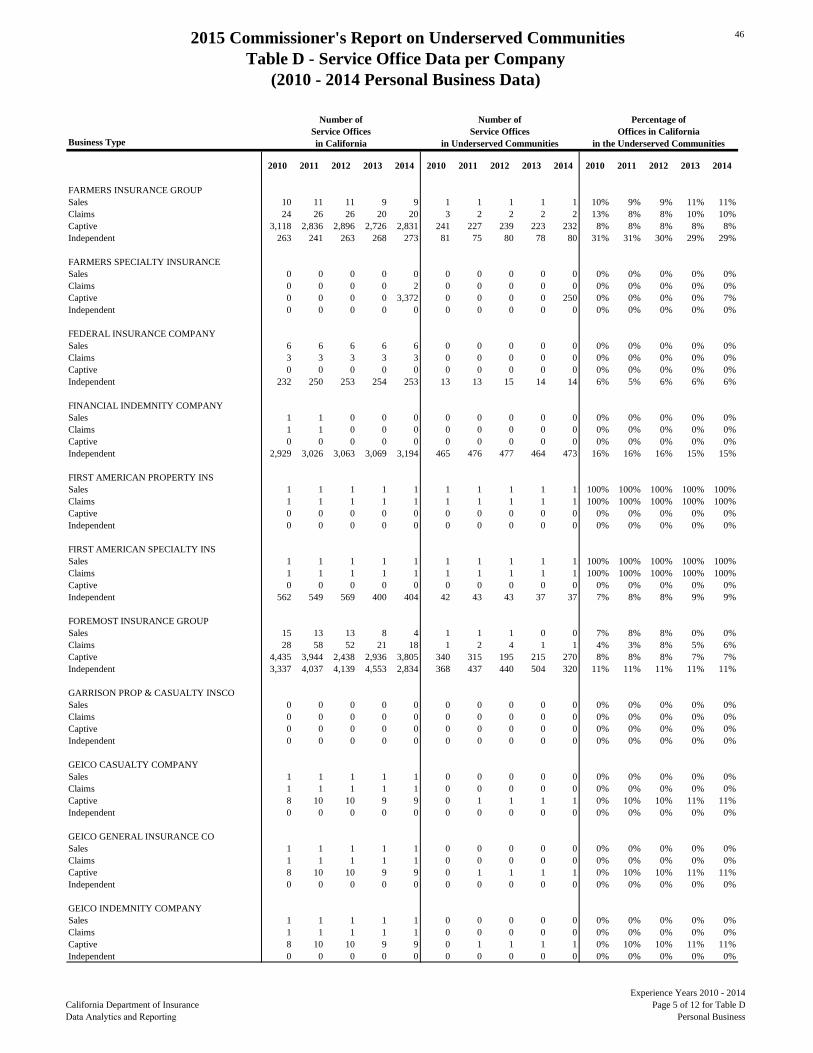
2015 Commissioner's Report on Underserved CommunitiesTable D - Service Office Data per Company
(2010 - 2014 Personal Business Data)
46
California Department of Insurance Data Analytics and Reporting
Experience Years 2010 - 2014Page 5 of 12 for Table D
Personal Business
Business Type
2010 2011 2012 2013 2014 2010 2011 2012 2013 2014 2010 2011 2012 2013 2014
Number of Service Officesin California
Number of Service Offices
in Underserved Communities
Percentage of Offices in California
in the Underserved Communities
FARMERS INSURANCE GROUPSales 10 11 11 9 9 1 1 1 1 1 10% 9% 9% 11% 11%Claims 24 26 26 20 20 3 2 2 2 2 13% 8% 8% 10% 10%Captive 3,118 2,836 2,896 2,726 2,831 241 227 239 223 232 8% 8% 8% 8% 8%Independent 263 241 263 268 273 81 75 80 78 80 31% 31% 30% 29% 29%
FARMERS SPECIALTY INSURANCESales 0 0 0 0 0 0 0 0 0 0 0% 0% 0% 0% 0%Claims 0 0 0 0 2 0 0 0 0 0 0% 0% 0% 0% 0%Captive 0 0 0 0 3,372 0 0 0 0 250 0% 0% 0% 0% 7%Independent 0 0 0 0 0 0 0 0 0 0 0% 0% 0% 0% 0%
FEDERAL INSURANCE COMPANYSales 6 6 6 6 6 0 0 0 0 0 0% 0% 0% 0% 0%Claims 3 3 3 3 3 0 0 0 0 0 0% 0% 0% 0% 0%Captive 0 0 0 0 0 0 0 0 0 0 0% 0% 0% 0% 0%Independent 232 250 253 254 253 13 13 15 14 14 6% 5% 6% 6% 6%
FINANCIAL INDEMNITY COMPANYSales 1 1 0 0 0 0 0 0 0 0 0% 0% 0% 0% 0%Claims 1 1 0 0 0 0 0 0 0 0 0% 0% 0% 0% 0%Captive 0 0 0 0 0 0 0 0 0 0 0% 0% 0% 0% 0%Independent 2,929 3,026 3,063 3,069 3,194 465 476 477 464 473 16% 16% 16% 15% 15%
FIRST AMERICAN PROPERTY INSSales 1 1 1 1 1 1 1 1 1 1 100% 100% 100% 100% 100%Claims 1 1 1 1 1 1 1 1 1 1 100% 100% 100% 100% 100%Captive 0 0 0 0 0 0 0 0 0 0 0% 0% 0% 0% 0%Independent 0 0 0 0 0 0 0 0 0 0 0% 0% 0% 0% 0%
FIRST AMERICAN SPECIALTY INSSales 1 1 1 1 1 1 1 1 1 1 100% 100% 100% 100% 100%Claims 1 1 1 1 1 1 1 1 1 1 100% 100% 100% 100% 100%Captive 0 0 0 0 0 0 0 0 0 0 0% 0% 0% 0% 0%Independent 562 549 569 400 404 42 43 43 37 37 7% 8% 8% 9% 9%
FOREMOST INSURANCE GROUPSales 15 13 13 8 4 1 1 1 0 0 7% 8% 8% 0% 0%Claims 28 58 52 21 18 1 2 4 1 1 4% 3% 8% 5% 6%Captive 4,435 3,944 2,438 2,936 3,805 340 315 195 215 270 8% 8% 8% 7% 7%Independent 3,337 4,037 4,139 4,553 2,834 368 437 440 504 320 11% 11% 11% 11% 11%
GARRISON PROP & CASUALTY INSCOSales 0 0 0 0 0 0 0 0 0 0 0% 0% 0% 0% 0%Claims 0 0 0 0 0 0 0 0 0 0 0% 0% 0% 0% 0%Captive 0 0 0 0 0 0 0 0 0 0 0% 0% 0% 0% 0%Independent 0 0 0 0 0 0 0 0 0 0 0% 0% 0% 0% 0%
GEICO CASUALTY COMPANYSales 1 1 1 1 1 0 0 0 0 0 0% 0% 0% 0% 0%Claims 1 1 1 1 1 0 0 0 0 0 0% 0% 0% 0% 0%Captive 8 10 10 9 9 0 1 1 1 1 0% 10% 10% 11% 11%Independent 0 0 0 0 0 0 0 0 0 0 0% 0% 0% 0% 0%
GEICO GENERAL INSURANCE COSales 1 1 1 1 1 0 0 0 0 0 0% 0% 0% 0% 0%Claims 1 1 1 1 1 0 0 0 0 0 0% 0% 0% 0% 0%Captive 8 10 10 9 9 0 1 1 1 1 0% 10% 10% 11% 11%Independent 0 0 0 0 0 0 0 0 0 0 0% 0% 0% 0% 0%
GEICO INDEMNITY COMPANYSales 1 1 1 1 1 0 0 0 0 0 0% 0% 0% 0% 0%Claims 1 1 1 1 1 0 0 0 0 0 0% 0% 0% 0% 0%Captive 8 10 10 9 9 0 1 1 1 1 0% 10% 10% 11% 11%Independent 0 0 0 0 0 0 0 0 0 0 0% 0% 0% 0% 0%
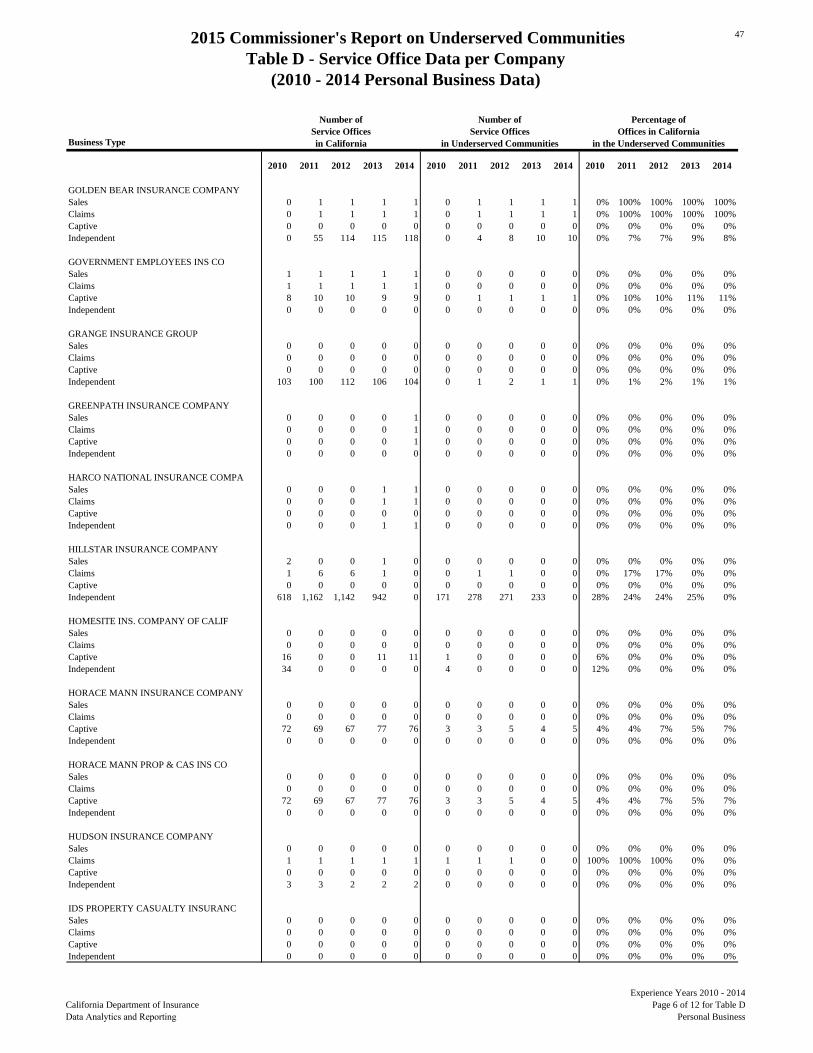
2015 Commissioner's Report on Underserved CommunitiesTable D - Service Office Data per Company
(2010 - 2014 Personal Business Data)
47
California Department of Insurance Data Analytics and Reporting
Experience Years 2010 - 2014Page 6 of 12 for Table D
Personal Business
Business Type
2010 2011 2012 2013 2014 2010 2011 2012 2013 2014 2010 2011 2012 2013 2014
Number of Service Officesin California
Number of Service Offices
in Underserved Communities
Percentage of Offices in California
in the Underserved Communities
GOLDEN BEAR INSURANCE COMPANYSales 0 1 1 1 1 0 1 1 1 1 0% 100% 100% 100% 100%Claims 0 1 1 1 1 0 1 1 1 1 0% 100% 100% 100% 100%Captive 0 0 0 0 0 0 0 0 0 0 0% 0% 0% 0% 0%Independent 0 55 114 115 118 0 4 8 10 10 0% 7% 7% 9% 8%
GOVERNMENT EMPLOYEES INS COSales 1 1 1 1 1 0 0 0 0 0 0% 0% 0% 0% 0%Claims 1 1 1 1 1 0 0 0 0 0 0% 0% 0% 0% 0%Captive 8 10 10 9 9 0 1 1 1 1 0% 10% 10% 11% 11%Independent 0 0 0 0 0 0 0 0 0 0 0% 0% 0% 0% 0%
GRANGE INSURANCE GROUPSales 0 0 0 0 0 0 0 0 0 0 0% 0% 0% 0% 0%Claims 0 0 0 0 0 0 0 0 0 0 0% 0% 0% 0% 0%Captive 0 0 0 0 0 0 0 0 0 0 0% 0% 0% 0% 0%Independent 103 100 112 106 104 0 1 2 1 1 0% 1% 2% 1% 1%
GREENPATH INSURANCE COMPANYSales 0 0 0 0 1 0 0 0 0 0 0% 0% 0% 0% 0%Claims 0 0 0 0 1 0 0 0 0 0 0% 0% 0% 0% 0%Captive 0 0 0 0 1 0 0 0 0 0 0% 0% 0% 0% 0%Independent 0 0 0 0 0 0 0 0 0 0 0% 0% 0% 0% 0%
HARCO NATIONAL INSURANCE COMPASales 0 0 0 1 1 0 0 0 0 0 0% 0% 0% 0% 0%Claims 0 0 0 1 1 0 0 0 0 0 0% 0% 0% 0% 0%Captive 0 0 0 0 0 0 0 0 0 0 0% 0% 0% 0% 0%Independent 0 0 0 1 1 0 0 0 0 0 0% 0% 0% 0% 0%
HILLSTAR INSURANCE COMPANYSales 2 0 0 1 0 0 0 0 0 0 0% 0% 0% 0% 0%Claims 1 6 6 1 0 0 1 1 0 0 0% 17% 17% 0% 0%Captive 0 0 0 0 0 0 0 0 0 0 0% 0% 0% 0% 0%Independent 618 1,162 1,142 942 0 171 278 271 233 0 28% 24% 24% 25% 0%
HOMESITE INS. COMPANY OF CALIFSales 0 0 0 0 0 0 0 0 0 0 0% 0% 0% 0% 0%Claims 0 0 0 0 0 0 0 0 0 0 0% 0% 0% 0% 0%Captive 16 0 0 11 11 1 0 0 0 0 6% 0% 0% 0% 0%Independent 34 0 0 0 0 4 0 0 0 0 12% 0% 0% 0% 0%
HORACE MANN INSURANCE COMPANYSales 0 0 0 0 0 0 0 0 0 0 0% 0% 0% 0% 0%Claims 0 0 0 0 0 0 0 0 0 0 0% 0% 0% 0% 0%Captive 72 69 67 77 76 3 3 5 4 5 4% 4% 7% 5% 7%Independent 0 0 0 0 0 0 0 0 0 0 0% 0% 0% 0% 0%
HORACE MANN PROP & CAS INS COSales 0 0 0 0 0 0 0 0 0 0 0% 0% 0% 0% 0%Claims 0 0 0 0 0 0 0 0 0 0 0% 0% 0% 0% 0%Captive 72 69 67 77 76 3 3 5 4 5 4% 4% 7% 5% 7%Independent 0 0 0 0 0 0 0 0 0 0 0% 0% 0% 0% 0%
HUDSON INSURANCE COMPANYSales 0 0 0 0 0 0 0 0 0 0 0% 0% 0% 0% 0%Claims 1 1 1 1 1 1 1 1 0 0 100% 100% 100% 0% 0%Captive 0 0 0 0 0 0 0 0 0 0 0% 0% 0% 0% 0%Independent 3 3 2 2 2 0 0 0 0 0 0% 0% 0% 0% 0%
IDS PROPERTY CASUALTY INSURANCSales 0 0 0 0 0 0 0 0 0 0 0% 0% 0% 0% 0%Claims 0 0 0 0 0 0 0 0 0 0 0% 0% 0% 0% 0%Captive 0 0 0 0 0 0 0 0 0 0 0% 0% 0% 0% 0%Independent 0 0 0 0 0 0 0 0 0 0 0% 0% 0% 0% 0%
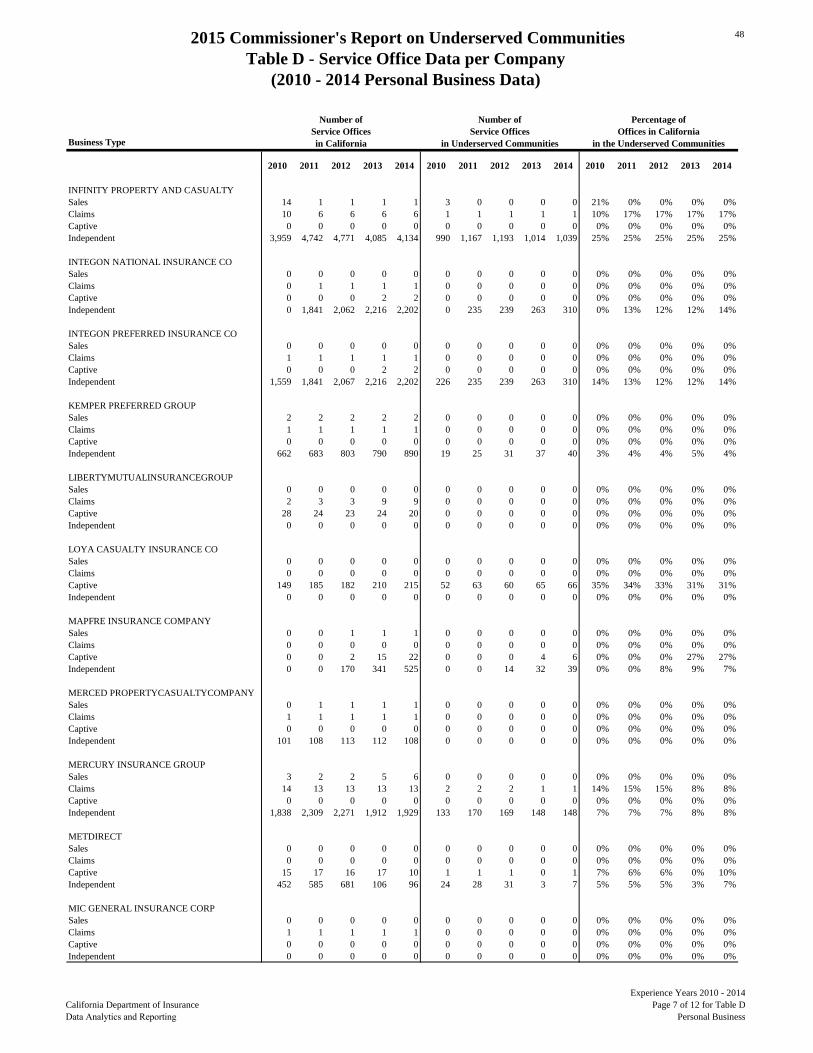
2015 Commissioner's Report on Underserved CommunitiesTable D - Service Office Data per Company
(2010 - 2014 Personal Business Data)
48
California Department of Insurance Data Analytics and Reporting
Experience Years 2010 - 2014Page 7 of 12 for Table D
Personal Business
Business Type
2010 2011 2012 2013 2014 2010 2011 2012 2013 2014 2010 2011 2012 2013 2014
Number of Service Officesin California
Number of Service Offices
in Underserved Communities
Percentage of Offices in California
in the Underserved Communities
INFINITY PROPERTY AND CASUALTYSales 14 1 1 1 1 3 0 0 0 0 21% 0% 0% 0% 0%Claims 10 6 6 6 6 1 1 1 1 1 10% 17% 17% 17% 17%Captive 0 0 0 0 0 0 0 0 0 0 0% 0% 0% 0% 0%Independent 3,959 4,742 4,771 4,085 4,134 990 1,167 1,193 1,014 1,039 25% 25% 25% 25% 25%
INTEGON NATIONAL INSURANCE COSales 0 0 0 0 0 0 0 0 0 0 0% 0% 0% 0% 0%Claims 0 1 1 1 1 0 0 0 0 0 0% 0% 0% 0% 0%Captive 0 0 0 2 2 0 0 0 0 0 0% 0% 0% 0% 0%Independent 0 1,841 2,062 2,216 2,202 0 235 239 263 310 0% 13% 12% 12% 14%
INTEGON PREFERRED INSURANCE COSales 0 0 0 0 0 0 0 0 0 0 0% 0% 0% 0% 0%Claims 1 1 1 1 1 0 0 0 0 0 0% 0% 0% 0% 0%Captive 0 0 0 2 2 0 0 0 0 0 0% 0% 0% 0% 0%Independent 1,559 1,841 2,067 2,216 2,202 226 235 239 263 310 14% 13% 12% 12% 14%
KEMPER PREFERRED GROUPSales 2 2 2 2 2 0 0 0 0 0 0% 0% 0% 0% 0%Claims 1 1 1 1 1 0 0 0 0 0 0% 0% 0% 0% 0%Captive 0 0 0 0 0 0 0 0 0 0 0% 0% 0% 0% 0%Independent 662 683 803 790 890 19 25 31 37 40 3% 4% 4% 5% 4%
LIBERTYMUTUALINSURANCEGROUPSales 0 0 0 0 0 0 0 0 0 0 0% 0% 0% 0% 0%Claims 2 3 3 9 9 0 0 0 0 0 0% 0% 0% 0% 0%Captive 28 24 23 24 20 0 0 0 0 0 0% 0% 0% 0% 0%Independent 0 0 0 0 0 0 0 0 0 0 0% 0% 0% 0% 0%
LOYA CASUALTY INSURANCE COSales 0 0 0 0 0 0 0 0 0 0 0% 0% 0% 0% 0%Claims 0 0 0 0 0 0 0 0 0 0 0% 0% 0% 0% 0%Captive 149 185 182 210 215 52 63 60 65 66 35% 34% 33% 31% 31%Independent 0 0 0 0 0 0 0 0 0 0 0% 0% 0% 0% 0%
MAPFRE INSURANCE COMPANYSales 0 0 1 1 1 0 0 0 0 0 0% 0% 0% 0% 0%Claims 0 0 0 0 0 0 0 0 0 0 0% 0% 0% 0% 0%Captive 0 0 2 15 22 0 0 0 4 6 0% 0% 0% 27% 27%Independent 0 0 170 341 525 0 0 14 32 39 0% 0% 8% 9% 7%
MERCED PROPERTYCASUALTYCOMPANYSales 0 1 1 1 1 0 0 0 0 0 0% 0% 0% 0% 0%Claims 1 1 1 1 1 0 0 0 0 0 0% 0% 0% 0% 0%Captive 0 0 0 0 0 0 0 0 0 0 0% 0% 0% 0% 0%Independent 101 108 113 112 108 0 0 0 0 0 0% 0% 0% 0% 0%
MERCURY INSURANCE GROUPSales 3 2 2 5 6 0 0 0 0 0 0% 0% 0% 0% 0%Claims 14 13 13 13 13 2 2 2 1 1 14% 15% 15% 8% 8%Captive 0 0 0 0 0 0 0 0 0 0 0% 0% 0% 0% 0%Independent 1,838 2,309 2,271 1,912 1,929 133 170 169 148 148 7% 7% 7% 8% 8%
METDIRECTSales 0 0 0 0 0 0 0 0 0 0 0% 0% 0% 0% 0%Claims 0 0 0 0 0 0 0 0 0 0 0% 0% 0% 0% 0%Captive 15 17 16 17 10 1 1 1 0 1 7% 6% 6% 0% 10%Independent 452 585 681 106 96 24 28 31 3 7 5% 5% 5% 3% 7%
MIC GENERAL INSURANCE CORPSales 0 0 0 0 0 0 0 0 0 0 0% 0% 0% 0% 0%Claims 1 1 1 1 1 0 0 0 0 0 0% 0% 0% 0% 0%Captive 0 0 0 0 0 0 0 0 0 0 0% 0% 0% 0% 0%Independent 0 0 0 0 0 0 0 0 0 0 0% 0% 0% 0% 0%
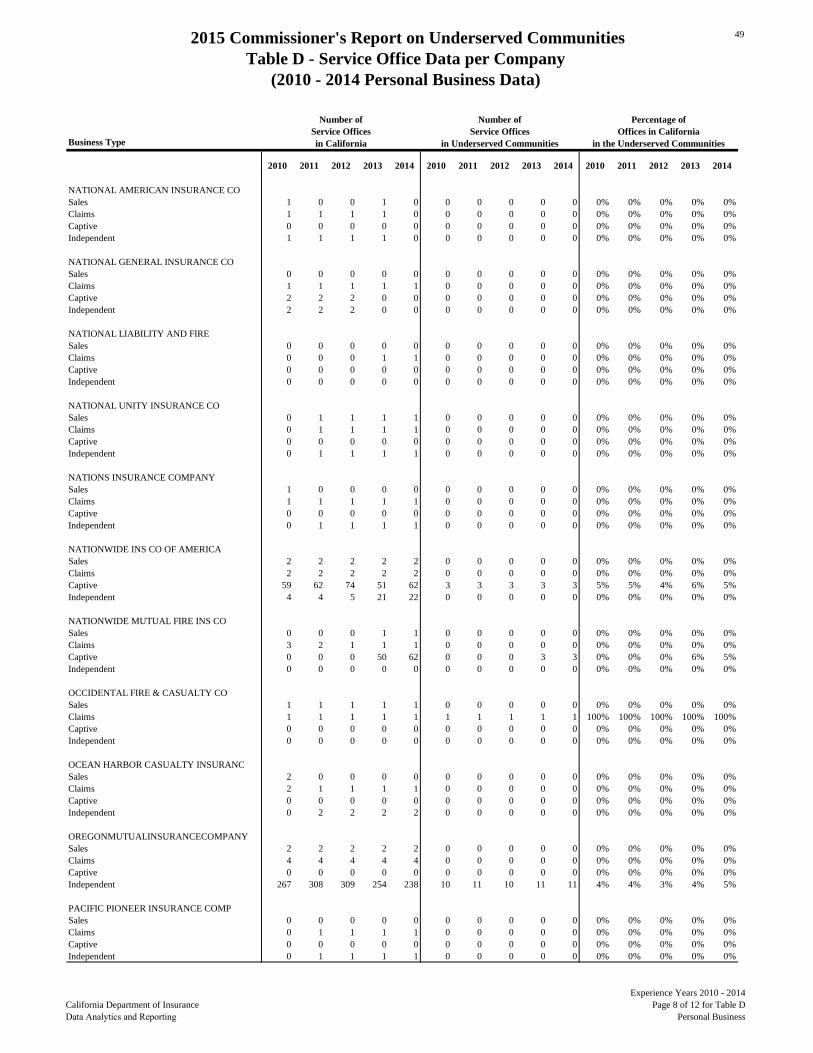
2015 Commissioner's Report on Underserved CommunitiesTable D - Service Office Data per Company
(2010 - 2014 Personal Business Data)
49
California Department of Insurance Data Analytics and Reporting
Experience Years 2010 - 2014Page 8 of 12 for Table D
Personal Business
Business Type
2010 2011 2012 2013 2014 2010 2011 2012 2013 2014 2010 2011 2012 2013 2014
Number of Service Officesin California
Number of Service Offices
in Underserved Communities
Percentage of Offices in California
in the Underserved Communities
NATIONAL AMERICAN INSURANCE COSales 1 0 0 1 0 0 0 0 0 0 0% 0% 0% 0% 0%Claims 1 1 1 1 0 0 0 0 0 0 0% 0% 0% 0% 0%Captive 0 0 0 0 0 0 0 0 0 0 0% 0% 0% 0% 0%Independent 1 1 1 1 0 0 0 0 0 0 0% 0% 0% 0% 0%
NATIONAL GENERAL INSURANCE COSales 0 0 0 0 0 0 0 0 0 0 0% 0% 0% 0% 0%Claims 1 1 1 1 1 0 0 0 0 0 0% 0% 0% 0% 0%Captive 2 2 2 0 0 0 0 0 0 0 0% 0% 0% 0% 0%Independent 2 2 2 0 0 0 0 0 0 0 0% 0% 0% 0% 0%
NATIONAL LIABILITY AND FIRESales 0 0 0 0 0 0 0 0 0 0 0% 0% 0% 0% 0%Claims 0 0 0 1 1 0 0 0 0 0 0% 0% 0% 0% 0%Captive 0 0 0 0 0 0 0 0 0 0 0% 0% 0% 0% 0%Independent 0 0 0 0 0 0 0 0 0 0 0% 0% 0% 0% 0%
NATIONAL UNITY INSURANCE COSales 0 1 1 1 1 0 0 0 0 0 0% 0% 0% 0% 0%Claims 0 1 1 1 1 0 0 0 0 0 0% 0% 0% 0% 0%Captive 0 0 0 0 0 0 0 0 0 0 0% 0% 0% 0% 0%Independent 0 1 1 1 1 0 0 0 0 0 0% 0% 0% 0% 0%
NATIONS INSURANCE COMPANYSales 1 0 0 0 0 0 0 0 0 0 0% 0% 0% 0% 0%Claims 1 1 1 1 1 0 0 0 0 0 0% 0% 0% 0% 0%Captive 0 0 0 0 0 0 0 0 0 0 0% 0% 0% 0% 0%Independent 0 1 1 1 1 0 0 0 0 0 0% 0% 0% 0% 0%
NATIONWIDE INS CO OF AMERICASales 2 2 2 2 2 0 0 0 0 0 0% 0% 0% 0% 0%Claims 2 2 2 2 2 0 0 0 0 0 0% 0% 0% 0% 0%Captive 59 62 74 51 62 3 3 3 3 3 5% 5% 4% 6% 5%Independent 4 4 5 21 22 0 0 0 0 0 0% 0% 0% 0% 0%
NATIONWIDE MUTUAL FIRE INS COSales 0 0 0 1 1 0 0 0 0 0 0% 0% 0% 0% 0%Claims 3 2 1 1 1 0 0 0 0 0 0% 0% 0% 0% 0%Captive 0 0 0 50 62 0 0 0 3 3 0% 0% 0% 6% 5%Independent 0 0 0 0 0 0 0 0 0 0 0% 0% 0% 0% 0%
OCCIDENTAL FIRE & CASUALTY COSales 1 1 1 1 1 0 0 0 0 0 0% 0% 0% 0% 0%Claims 1 1 1 1 1 1 1 1 1 1 100% 100% 100% 100% 100%Captive 0 0 0 0 0 0 0 0 0 0 0% 0% 0% 0% 0%Independent 0 0 0 0 0 0 0 0 0 0 0% 0% 0% 0% 0%
OCEAN HARBOR CASUALTY INSURANCSales 2 0 0 0 0 0 0 0 0 0 0% 0% 0% 0% 0%Claims 2 1 1 1 1 0 0 0 0 0 0% 0% 0% 0% 0%Captive 0 0 0 0 0 0 0 0 0 0 0% 0% 0% 0% 0%Independent 0 2 2 2 2 0 0 0 0 0 0% 0% 0% 0% 0%
OREGONMUTUALINSURANCECOMPANYSales 2 2 2 2 2 0 0 0 0 0 0% 0% 0% 0% 0%Claims 4 4 4 4 4 0 0 0 0 0 0% 0% 0% 0% 0%Captive 0 0 0 0 0 0 0 0 0 0 0% 0% 0% 0% 0%Independent 267 308 309 254 238 10 11 10 11 11 4% 4% 3% 4% 5%
PACIFIC PIONEER INSURANCE COMPSales 0 0 0 0 0 0 0 0 0 0 0% 0% 0% 0% 0%Claims 0 1 1 1 1 0 0 0 0 0 0% 0% 0% 0% 0%Captive 0 0 0 0 0 0 0 0 0 0 0% 0% 0% 0% 0%Independent 0 1 1 1 1 0 0 0 0 0 0% 0% 0% 0% 0%
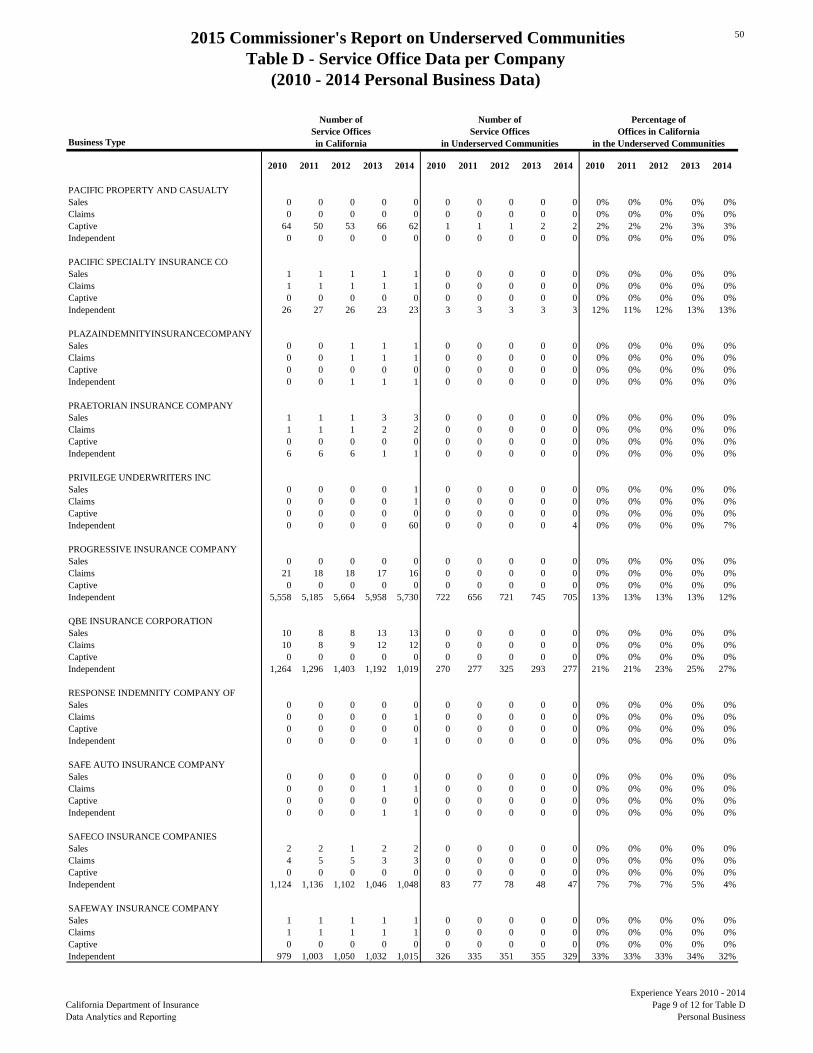
2015 Commissioner's Report on Underserved CommunitiesTable D - Service Office Data per Company
(2010 - 2014 Personal Business Data)
50
California Department of Insurance Data Analytics and Reporting
Experience Years 2010 - 2014Page 9 of 12 for Table D
Personal Business
Business Type
2010 2011 2012 2013 2014 2010 2011 2012 2013 2014 2010 2011 2012 2013 2014
Number of Service Officesin California
Number of Service Offices
in Underserved Communities
Percentage of Offices in California
in the Underserved Communities
PACIFIC PROPERTY AND CASUALTYSales 0 0 0 0 0 0 0 0 0 0 0% 0% 0% 0% 0%Claims 0 0 0 0 0 0 0 0 0 0 0% 0% 0% 0% 0%Captive 64 50 53 66 62 1 1 1 2 2 2% 2% 2% 3% 3%Independent 0 0 0 0 0 0 0 0 0 0 0% 0% 0% 0% 0%
PACIFIC SPECIALTY INSURANCE COSales 1 1 1 1 1 0 0 0 0 0 0% 0% 0% 0% 0%Claims 1 1 1 1 1 0 0 0 0 0 0% 0% 0% 0% 0%Captive 0 0 0 0 0 0 0 0 0 0 0% 0% 0% 0% 0%Independent 26 27 26 23 23 3 3 3 3 3 12% 11% 12% 13% 13%
PLAZAINDEMNITYINSURANCECOMPANYSales 0 0 1 1 1 0 0 0 0 0 0% 0% 0% 0% 0%Claims 0 0 1 1 1 0 0 0 0 0 0% 0% 0% 0% 0%Captive 0 0 0 0 0 0 0 0 0 0 0% 0% 0% 0% 0%Independent 0 0 1 1 1 0 0 0 0 0 0% 0% 0% 0% 0%
PRAETORIAN INSURANCE COMPANYSales 1 1 1 3 3 0 0 0 0 0 0% 0% 0% 0% 0%Claims 1 1 1 2 2 0 0 0 0 0 0% 0% 0% 0% 0%Captive 0 0 0 0 0 0 0 0 0 0 0% 0% 0% 0% 0%Independent 6 6 6 1 1 0 0 0 0 0 0% 0% 0% 0% 0%
PRIVILEGE UNDERWRITERS INCSales 0 0 0 0 1 0 0 0 0 0 0% 0% 0% 0% 0%Claims 0 0 0 0 1 0 0 0 0 0 0% 0% 0% 0% 0%Captive 0 0 0 0 0 0 0 0 0 0 0% 0% 0% 0% 0%Independent 0 0 0 0 60 0 0 0 0 4 0% 0% 0% 0% 7%
PROGRESSIVE INSURANCE COMPANYSales 0 0 0 0 0 0 0 0 0 0 0% 0% 0% 0% 0%Claims 21 18 18 17 16 0 0 0 0 0 0% 0% 0% 0% 0%Captive 0 0 0 0 0 0 0 0 0 0 0% 0% 0% 0% 0%Independent 5,558 5,185 5,664 5,958 5,730 722 656 721 745 705 13% 13% 13% 13% 12%
QBE INSURANCE CORPORATIONSales 10 8 8 13 13 0 0 0 0 0 0% 0% 0% 0% 0%Claims 10 8 9 12 12 0 0 0 0 0 0% 0% 0% 0% 0%Captive 0 0 0 0 0 0 0 0 0 0 0% 0% 0% 0% 0%Independent 1,264 1,296 1,403 1,192 1,019 270 277 325 293 277 21% 21% 23% 25% 27%
RESPONSE INDEMNITY COMPANY OFSales 0 0 0 0 0 0 0 0 0 0 0% 0% 0% 0% 0%Claims 0 0 0 0 1 0 0 0 0 0 0% 0% 0% 0% 0%Captive 0 0 0 0 0 0 0 0 0 0 0% 0% 0% 0% 0%Independent 0 0 0 0 1 0 0 0 0 0 0% 0% 0% 0% 0%
SAFE AUTO INSURANCE COMPANYSales 0 0 0 0 0 0 0 0 0 0 0% 0% 0% 0% 0%Claims 0 0 0 1 1 0 0 0 0 0 0% 0% 0% 0% 0%Captive 0 0 0 0 0 0 0 0 0 0 0% 0% 0% 0% 0%Independent 0 0 0 1 1 0 0 0 0 0 0% 0% 0% 0% 0%
SAFECO INSURANCE COMPANIESSales 2 2 1 2 2 0 0 0 0 0 0% 0% 0% 0% 0%Claims 4 5 5 3 3 0 0 0 0 0 0% 0% 0% 0% 0%Captive 0 0 0 0 0 0 0 0 0 0 0% 0% 0% 0% 0%Independent 1,124 1,136 1,102 1,046 1,048 83 77 78 48 47 7% 7% 7% 5% 4%
SAFEWAY INSURANCE COMPANYSales 1 1 1 1 1 0 0 0 0 0 0% 0% 0% 0% 0%Claims 1 1 1 1 1 0 0 0 0 0 0% 0% 0% 0% 0%Captive 0 0 0 0 0 0 0 0 0 0 0% 0% 0% 0% 0%Independent 979 1,003 1,050 1,032 1,015 326 335 351 355 329 33% 33% 33% 34% 32%
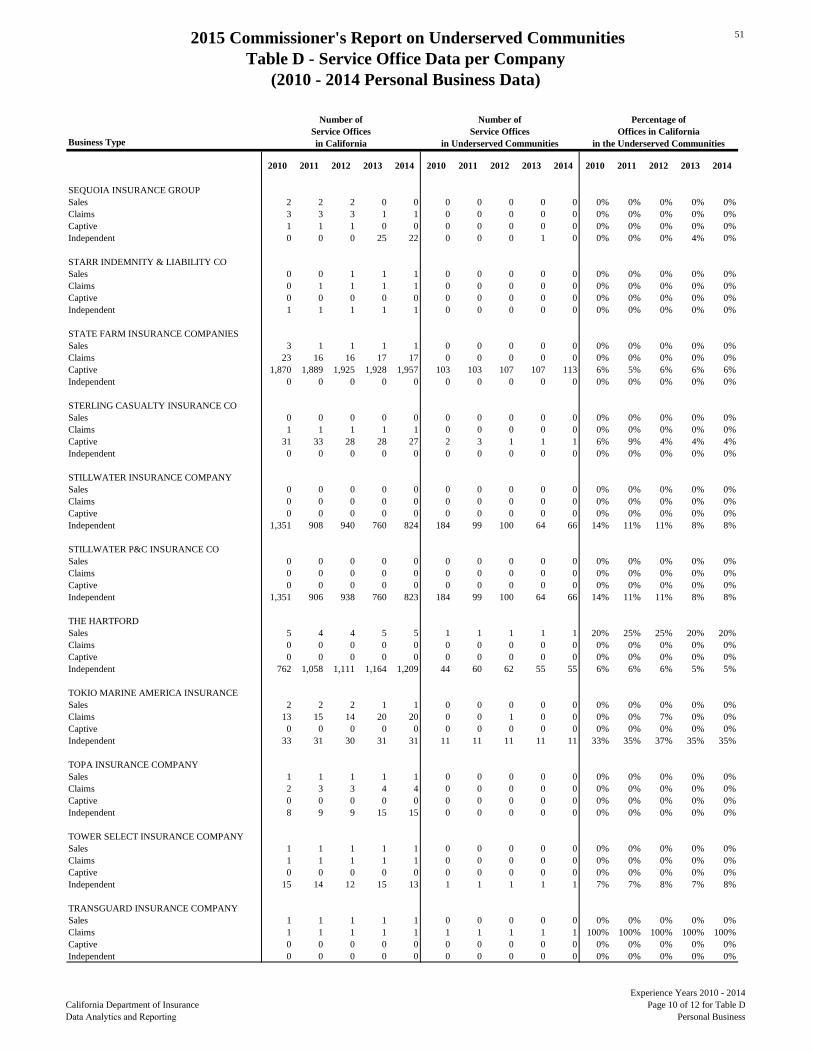
2015 Commissioner's Report on Underserved CommunitiesTable D - Service Office Data per Company
(2010 - 2014 Personal Business Data)
51
California Department of Insurance Data Analytics and Reporting
Experience Years 2010 - 2014Page 10 of 12 for Table D
Personal Business
Business Type
2010 2011 2012 2013 2014 2010 2011 2012 2013 2014 2010 2011 2012 2013 2014
Number of Service Officesin California
Number of Service Offices
in Underserved Communities
Percentage of Offices in California
in the Underserved Communities
SEQUOIA INSURANCE GROUPSales 2 2 2 0 0 0 0 0 0 0 0% 0% 0% 0% 0%Claims 3 3 3 1 1 0 0 0 0 0 0% 0% 0% 0% 0%Captive 1 1 1 0 0 0 0 0 0 0 0% 0% 0% 0% 0%Independent 0 0 0 25 22 0 0 0 1 0 0% 0% 0% 4% 0%
STARR INDEMNITY & LIABILITY COSales 0 0 1 1 1 0 0 0 0 0 0% 0% 0% 0% 0%Claims 0 1 1 1 1 0 0 0 0 0 0% 0% 0% 0% 0%Captive 0 0 0 0 0 0 0 0 0 0 0% 0% 0% 0% 0%Independent 1 1 1 1 1 0 0 0 0 0 0% 0% 0% 0% 0%
STATE FARM INSURANCE COMPANIESSales 3 1 1 1 1 0 0 0 0 0 0% 0% 0% 0% 0%Claims 23 16 16 17 17 0 0 0 0 0 0% 0% 0% 0% 0%Captive 1,870 1,889 1,925 1,928 1,957 103 103 107 107 113 6% 5% 6% 6% 6%Independent 0 0 0 0 0 0 0 0 0 0 0% 0% 0% 0% 0%
STERLING CASUALTY INSURANCE COSales 0 0 0 0 0 0 0 0 0 0 0% 0% 0% 0% 0%Claims 1 1 1 1 1 0 0 0 0 0 0% 0% 0% 0% 0%Captive 31 33 28 28 27 2 3 1 1 1 6% 9% 4% 4% 4%Independent 0 0 0 0 0 0 0 0 0 0 0% 0% 0% 0% 0%
STILLWATER INSURANCE COMPANYSales 0 0 0 0 0 0 0 0 0 0 0% 0% 0% 0% 0%Claims 0 0 0 0 0 0 0 0 0 0 0% 0% 0% 0% 0%Captive 0 0 0 0 0 0 0 0 0 0 0% 0% 0% 0% 0%Independent 1,351 908 940 760 824 184 99 100 64 66 14% 11% 11% 8% 8%
STILLWATER P&C INSURANCE COSales 0 0 0 0 0 0 0 0 0 0 0% 0% 0% 0% 0%Claims 0 0 0 0 0 0 0 0 0 0 0% 0% 0% 0% 0%Captive 0 0 0 0 0 0 0 0 0 0 0% 0% 0% 0% 0%Independent 1,351 906 938 760 823 184 99 100 64 66 14% 11% 11% 8% 8%
THE HARTFORDSales 5 4 4 5 5 1 1 1 1 1 20% 25% 25% 20% 20%Claims 0 0 0 0 0 0 0 0 0 0 0% 0% 0% 0% 0%Captive 0 0 0 0 0 0 0 0 0 0 0% 0% 0% 0% 0%Independent 762 1,058 1,111 1,164 1,209 44 60 62 55 55 6% 6% 6% 5% 5%
TOKIO MARINE AMERICA INSURANCESales 2 2 2 1 1 0 0 0 0 0 0% 0% 0% 0% 0%Claims 13 15 14 20 20 0 0 1 0 0 0% 0% 7% 0% 0%Captive 0 0 0 0 0 0 0 0 0 0 0% 0% 0% 0% 0%Independent 33 31 30 31 31 11 11 11 11 11 33% 35% 37% 35% 35%
TOPA INSURANCE COMPANYSales 1 1 1 1 1 0 0 0 0 0 0% 0% 0% 0% 0%Claims 2 3 3 4 4 0 0 0 0 0 0% 0% 0% 0% 0%Captive 0 0 0 0 0 0 0 0 0 0 0% 0% 0% 0% 0%Independent 8 9 9 15 15 0 0 0 0 0 0% 0% 0% 0% 0%
TOWER SELECT INSURANCE COMPANYSales 1 1 1 1 1 0 0 0 0 0 0% 0% 0% 0% 0%Claims 1 1 1 1 1 0 0 0 0 0 0% 0% 0% 0% 0%Captive 0 0 0 0 0 0 0 0 0 0 0% 0% 0% 0% 0%Independent 15 14 12 15 13 1 1 1 1 1 7% 7% 8% 7% 8%
TRANSGUARD INSURANCE COMPANYSales 1 1 1 1 1 0 0 0 0 0 0% 0% 0% 0% 0%Claims 1 1 1 1 1 1 1 1 1 1 100% 100% 100% 100% 100%Captive 0 0 0 0 0 0 0 0 0 0 0% 0% 0% 0% 0%Independent 0 0 0 0 0 0 0 0 0 0 0% 0% 0% 0% 0%

2015 Commissioner's Report on Underserved CommunitiesTable D - Service Office Data per Company
(2010 - 2014 Personal Business Data)
52
California Department of Insurance Data Analytics and Reporting
Experience Years 2010 - 2014Page 11 of 12 for Table D
Personal Business
Business Type
2010 2011 2012 2013 2014 2010 2011 2012 2013 2014 2010 2011 2012 2013 2014
Number of Service Officesin California
Number of Service Offices
in Underserved Communities
Percentage of Offices in California
in the Underserved Communities
TRAVELERS INSURANCE GROUPSales 6 6 6 10 10 1 1 1 1 1 17% 17% 17% 10% 10%Claims 4 4 4 3 3 0 0 0 0 0 0% 0% 0% 0% 0%Captive 0 0 0 0 0 0 0 0 0 0 0% 0% 0% 0% 0%Independent 2,455 2,003 2,587 2,544 2,556 177 130 172 175 169 7% 6% 7% 7% 7%
UNIGARD INDEMNITY COMPANYSales 3 3 3 3 3 0 0 0 0 0 0% 0% 0% 0% 0%Claims 3 3 3 3 3 0 0 0 0 0 0% 0% 0% 0% 0%Captive 0 0 0 0 0 0 0 0 0 0 0% 0% 0% 0% 0%Independent 181 181 154 165 165 6 6 5 6 6 3% 3% 3% 4% 4%
UNIGARD INSURANCE COMPANYSales 3 3 3 3 3 0 0 0 0 0 0% 0% 0% 0% 0%Claims 3 3 3 3 3 0 0 0 0 0 0% 0% 0% 0% 0%Captive 0 0 0 0 0 0 0 0 0 0 0% 0% 0% 0% 0%Independent 181 181 154 165 165 6 6 5 6 6 3% 3% 3% 4% 4%
UNITED SERVICES AUTO ASSOCIATIONSales 0 0 0 0 0 0 0 0 0 0 0% 0% 0% 0% 0%Claims 0 0 0 0 0 0 0 0 0 0 0% 0% 0% 0% 0%Captive 0 0 0 0 0 0 0 0 0 0 0% 0% 0% 0% 0%Independent 0 0 0 0 0 0 0 0 0 0 0% 0% 0% 0% 0%
UNITRIN DIRECT INSURANCE COSales 1 1 1 0 0 0 0 0 0 0 0% 0% 0% 0% 0%Claims 1 1 1 1 1 0 0 0 0 0 0% 0% 0% 0% 0%Captive 0 0 0 0 0 0 0 0 0 0 0% 0% 0% 0% 0%Independent 0 0 0 0 0 0 0 0 0 0 0% 0% 0% 0% 0%
UNIVERSAL NORTH AMERICA INSURASales 2 0 0 0 0 0 0 0 0 0 0% 0% 0% 0% 0%Claims 2 0 0 0 0 0 0 0 0 0 0% 0% 0% 0% 0%Captive 0 0 0 0 0 0 0 0 0 0 0% 0% 0% 0% 0%Independent 2 2 2 2 2 0 0 0 0 0 0% 0% 0% 0% 0%
USAA CASUALTY INSURANCE COMPANSales 0 0 0 0 0 0 0 0 0 0 0% 0% 0% 0% 0%Claims 0 0 0 0 0 0 0 0 0 0 0% 0% 0% 0% 0%Captive 0 0 0 0 0 0 0 0 0 0 0% 0% 0% 0% 0%Independent 0 0 0 0 0 0 0 0 0 0 0% 0% 0% 0% 0%
USAA GENERAL INDEMNITY COMPANYSales 0 0 0 0 0 0 0 0 0 0 0% 0% 0% 0% 0%Claims 0 0 0 0 0 0 0 0 0 0 0% 0% 0% 0% 0%Captive 0 0 0 0 0 0 0 0 0 0 0% 0% 0% 0% 0%Independent 0 0 0 0 0 0 0 0 0 0 0% 0% 0% 0% 0%
VICTORIA FIRE & CASUALTYSales 2 2 2 2 2 0 0 0 0 0 0% 0% 0% 0% 0%Claims 2 2 2 2 2 0 0 0 0 0 0% 0% 0% 0% 0%Captive 51 0 0 0 0 5 0 0 0 0 10% 0% 0% 0% 0%Independent 1,238 1,178 1,324 1,337 1,459 161 157 170 197 214 13% 13% 13% 15% 15%
VIGILANT INURANCE COMPANYSales 6 6 6 6 6 0 0 0 0 0 0% 0% 0% 0% 0%Claims 3 3 3 3 3 0 0 0 0 0 0% 0% 0% 0% 0%Captive 0 0 0 0 0 0 0 0 0 0 0% 0% 0% 0% 0%Independent 227 244 246 246 246 13 13 15 14 14 6% 5% 6% 6% 6%
VIKING INSURANCE COMPANY OF WISales 0 0 0 0 0 0 0 0 0 0 0% 0% 0% 0% 0%Claims 1 1 1 1 1 0 0 0 0 0 0% 0% 0% 0% 0%Captive 0 0 0 0 0 0 0 0 0 0 0% 0% 0% 0% 0%Independent 1,989 2,035 2,052 2,068 2,081 357 370 371 367 369 18% 18% 18% 18% 18%
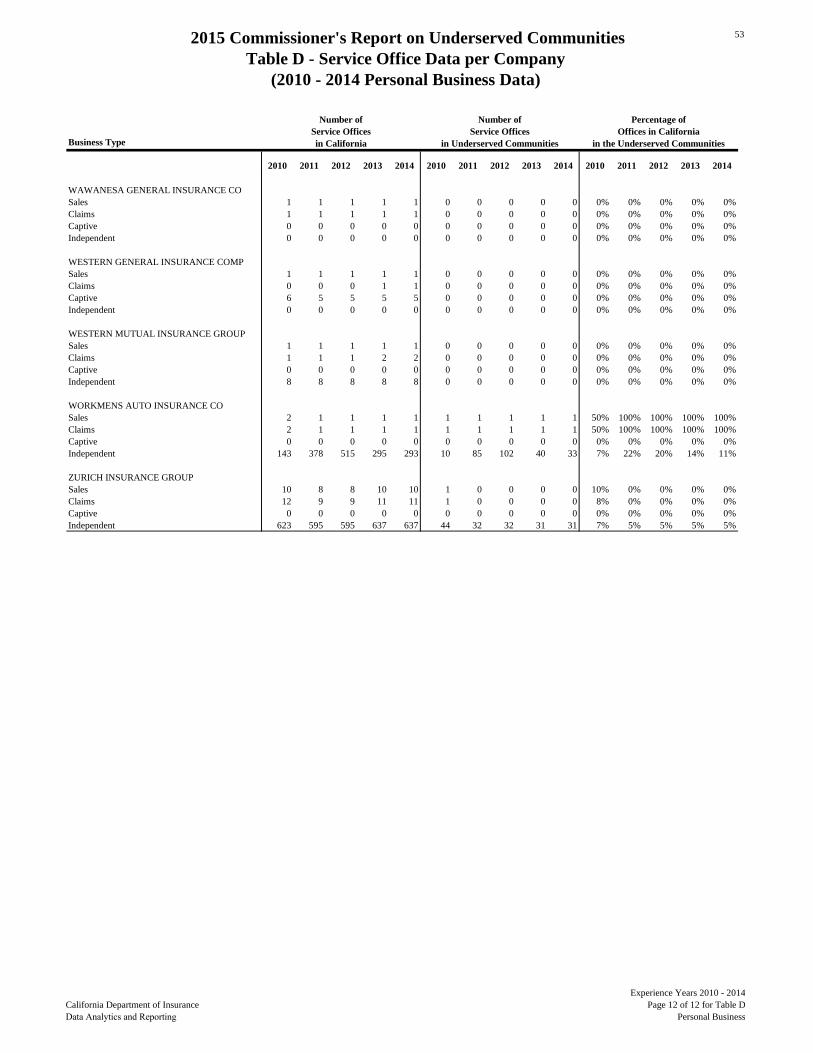
2015 Commissioner's Report on Underserved CommunitiesTable D - Service Office Data per Company
(2010 - 2014 Personal Business Data)
53
California Department of Insurance Data Analytics and Reporting
Experience Years 2010 - 2014Page 12 of 12 for Table D
Personal Business
Business Type
2010 2011 2012 2013 2014 2010 2011 2012 2013 2014 2010 2011 2012 2013 2014
Number of Service Officesin California
Number of Service Offices
in Underserved Communities
Percentage of Offices in California
in the Underserved Communities
WAWANESA GENERAL INSURANCE COSales 1 1 1 1 1 0 0 0 0 0 0% 0% 0% 0% 0%Claims 1 1 1 1 1 0 0 0 0 0 0% 0% 0% 0% 0%Captive 0 0 0 0 0 0 0 0 0 0 0% 0% 0% 0% 0%Independent 0 0 0 0 0 0 0 0 0 0 0% 0% 0% 0% 0%
WESTERN GENERAL INSURANCE COMPSales 1 1 1 1 1 0 0 0 0 0 0% 0% 0% 0% 0%Claims 0 0 0 1 1 0 0 0 0 0 0% 0% 0% 0% 0%Captive 6 5 5 5 5 0 0 0 0 0 0% 0% 0% 0% 0%Independent 0 0 0 0 0 0 0 0 0 0 0% 0% 0% 0% 0%
WESTERN MUTUAL INSURANCE GROUPSales 1 1 1 1 1 0 0 0 0 0 0% 0% 0% 0% 0%Claims 1 1 1 2 2 0 0 0 0 0 0% 0% 0% 0% 0%Captive 0 0 0 0 0 0 0 0 0 0 0% 0% 0% 0% 0%Independent 8 8 8 8 8 0 0 0 0 0 0% 0% 0% 0% 0%
WORKMENS AUTO INSURANCE COSales 2 1 1 1 1 1 1 1 1 1 50% 100% 100% 100% 100%Claims 2 1 1 1 1 1 1 1 1 1 50% 100% 100% 100% 100%Captive 0 0 0 0 0 0 0 0 0 0 0% 0% 0% 0% 0%Independent 143 378 515 295 293 10 85 102 40 33 7% 22% 20% 14% 11%
ZURICH INSURANCE GROUPSales 10 8 8 10 10 1 0 0 0 0 10% 0% 0% 0% 0%Claims 12 9 9 11 11 1 0 0 0 0 8% 0% 0% 0% 0%Captive 0 0 0 0 0 0 0 0 0 0 0% 0% 0% 0% 0%Independent 623 595 595 637 637 44 32 32 31 31 7% 5% 5% 5% 5%