california regional progress report regional blueprint
TRANSCRIPT
California Regional
Progress Report
Regional Blueprint Quality of Life Measures
“Defining, Measuring, and Evaluating Performance”
UCLA Lake Arrowhead Symposium
“Economic Crisis as Opportunity
for Reform”
Trish Kelly, October 19, 2009
OVERVIEW
2007 Progress Report – Integrated Quality of
Life Measures within the framework of the
Regional Blueprints, led by Caltrans
2009-2010 Progress Report – scoping process
underway to incorporate new policy issues
California Strategic Growth Council and other
State policy initiatives for sustainable
communities
PURPOSE OF THE 2007 REPORT
First baseline report for how California’s regions are doing across a range of integrated quality of life measures, within the framework of innovative regional planning led by the Metropolitan Planning Agencies (MPOs) and Councils of Governments (COGs), supported by Caltran’s California Regional Blueprint Planning Program
Develop a common framework to measure regional progress statewide – where to change course or address emerging challenges, and how the State can better support the regions and their communities
AUDIENCE
State, regional, and local decision makers and
stakeholders, including residents, business and
environmental interests, non-profits and other
civic leaders as they determine the policies
and investments that will shape the economic,
environmental and social well-being of
California’s regions and the State overall
2007 Partners and Sponsors
California Center for Regional Leadership
Caltrans
California Association of Councils of Government
(CALCOG) and member agencies
California Dept. of Housing and Community
Development
Information Center for the Environment, UC Davis
Morgan Family Foundation
California Regional Blueprint Planning Program
Built upon several regional long-term planning efforts
$20 million in federal regional transportation planning funded awarded by Caltrans since 2005; 18 Metropolitan Planning Agencies and 15 Rural Regional Transportation Planning Agencies
Public engagement to select community preferred growth scenarios, to balance transportation planning with land use planning, housing needs, resource protection and other issues to achieve more sustainable regional growth patterns and improve quality of life
http://www.dot.ca.gov/hq/tpp/offices/orip/blueprint/
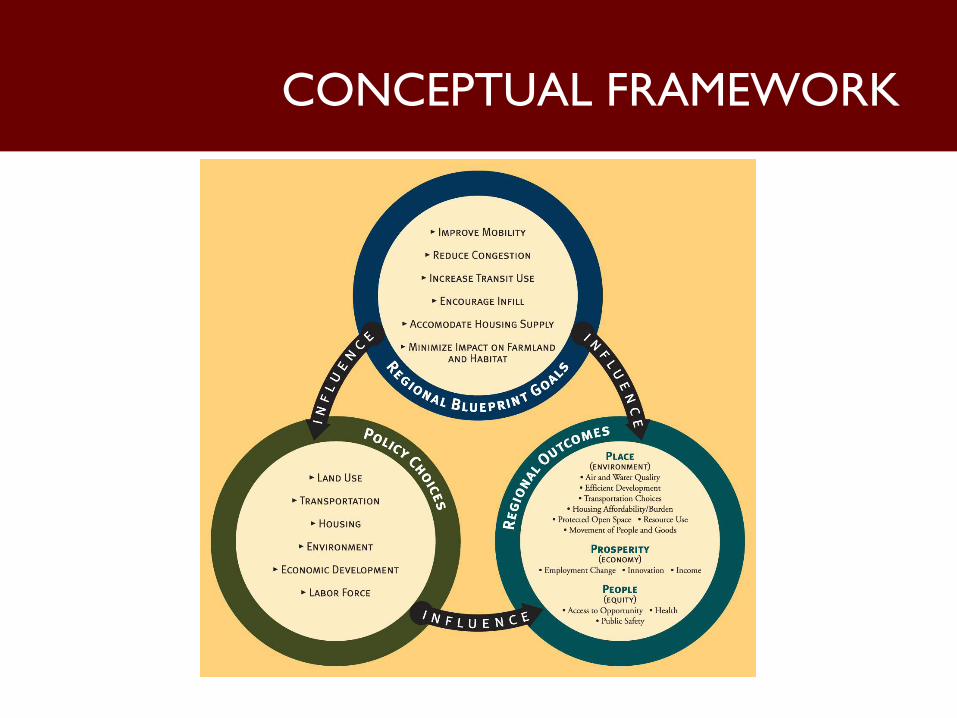
CONCEPTUAL FRAMEWORK
PERFORMANCE VS. PROGRESS MEASURES
Framework recognizes interdependence of
policy choices, Blueprint goals, desired
outcomes
To help understand the role of Blueprints in
the larger context of policy choices across
many areas, not direct evaluation
Focus on underlying patterns or overall
direction across indicators, within and across
diverse regions
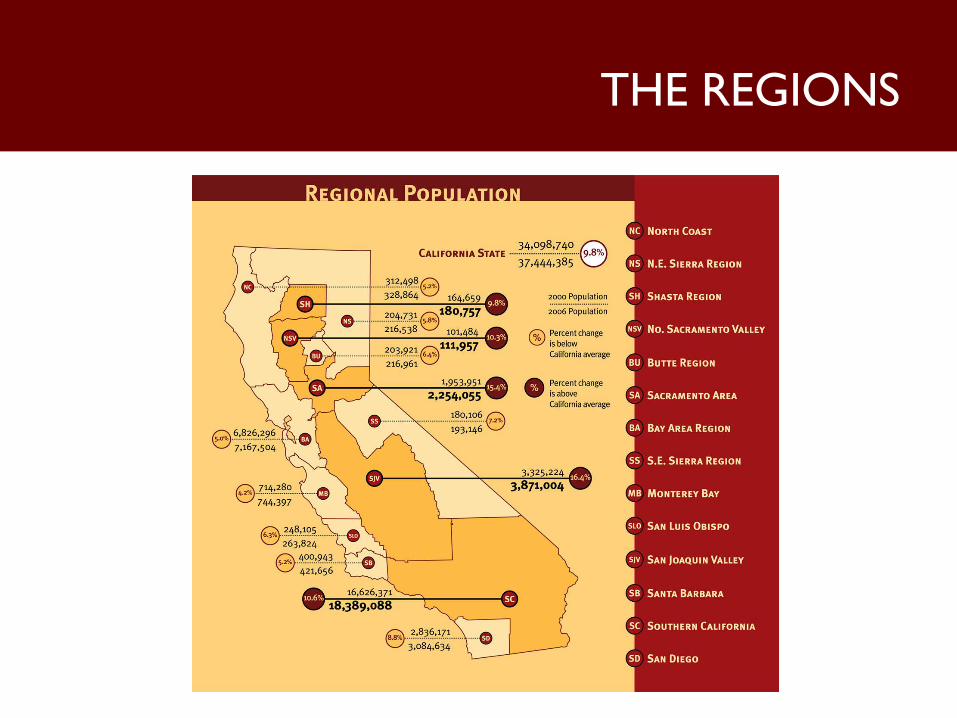
THE REGIONS
CONTEXT: IMPORTANCE OF
STATEWIDE CHALLENGES
Growing Population
Growing Diversity
Aging of Population
Growing Pressure on Agricultural Lands,
Open Space and Ecosystems
Increasing Housing Costs
Growing Global Competition
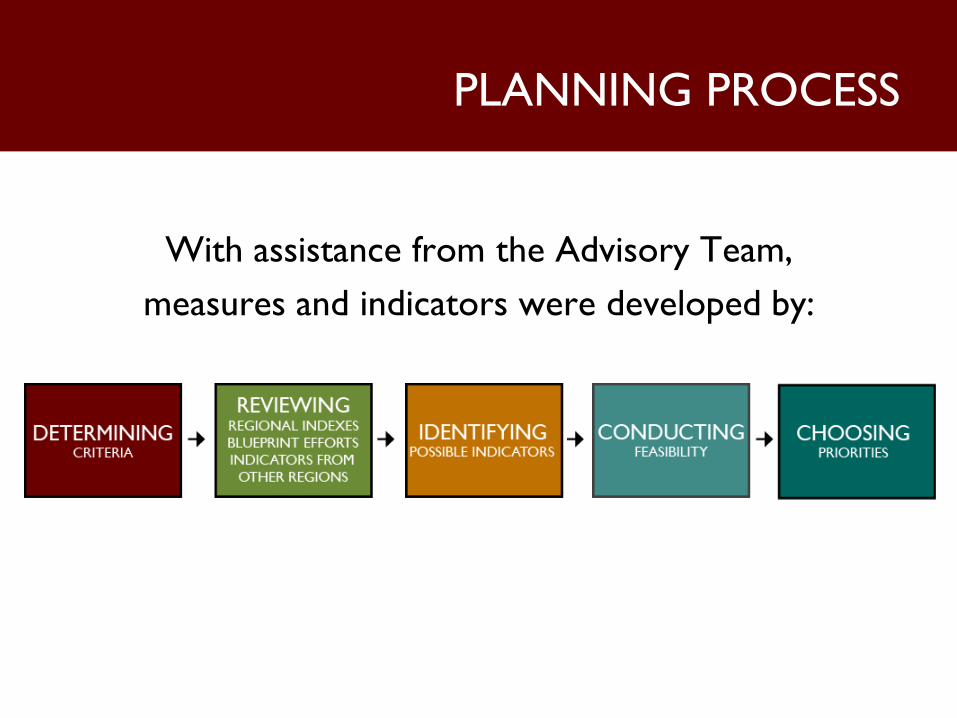
PLANNING PROCESS
With assistance from the Advisory Team,
measures and indicators were developed by:
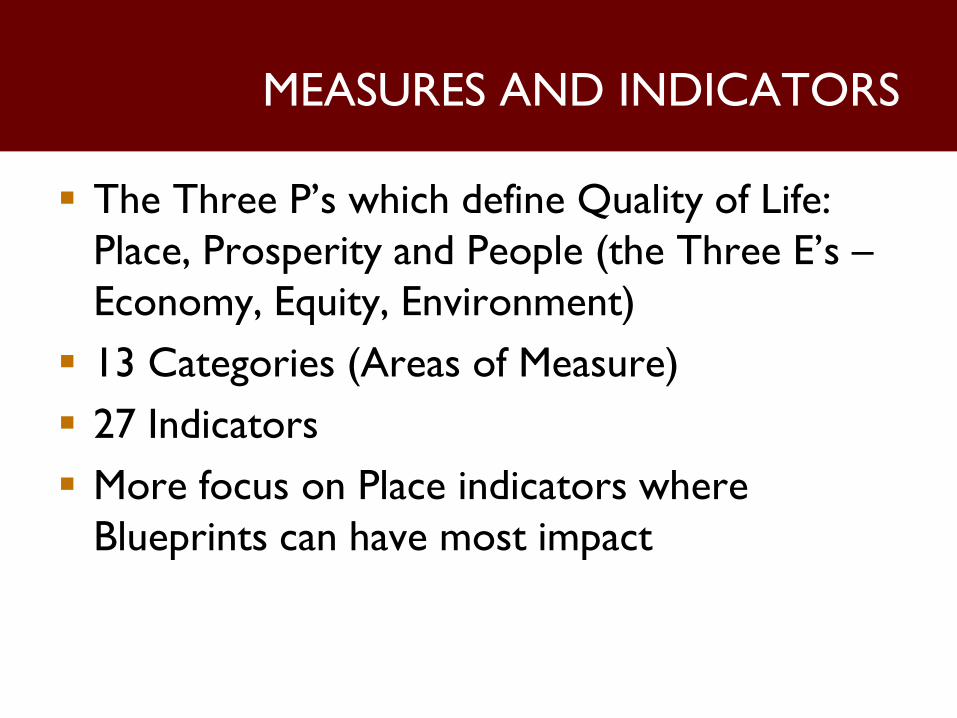
MEASURES AND INDICATORS
The Three P’s which define Quality of Life:
Place, Prosperity and People (the Three E’s –
Economy, Equity, Environment)
13 Categories (Areas of Measure)
27 Indicators
More focus on Place indicators where
Blueprints can have most impact
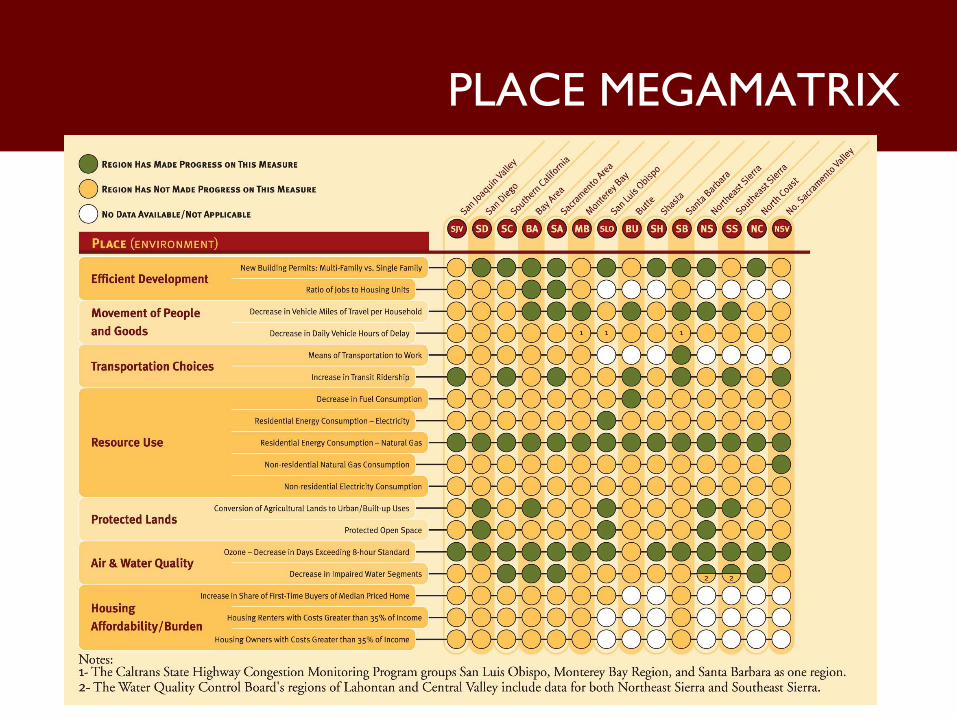
PLACE MEGAMATRIX
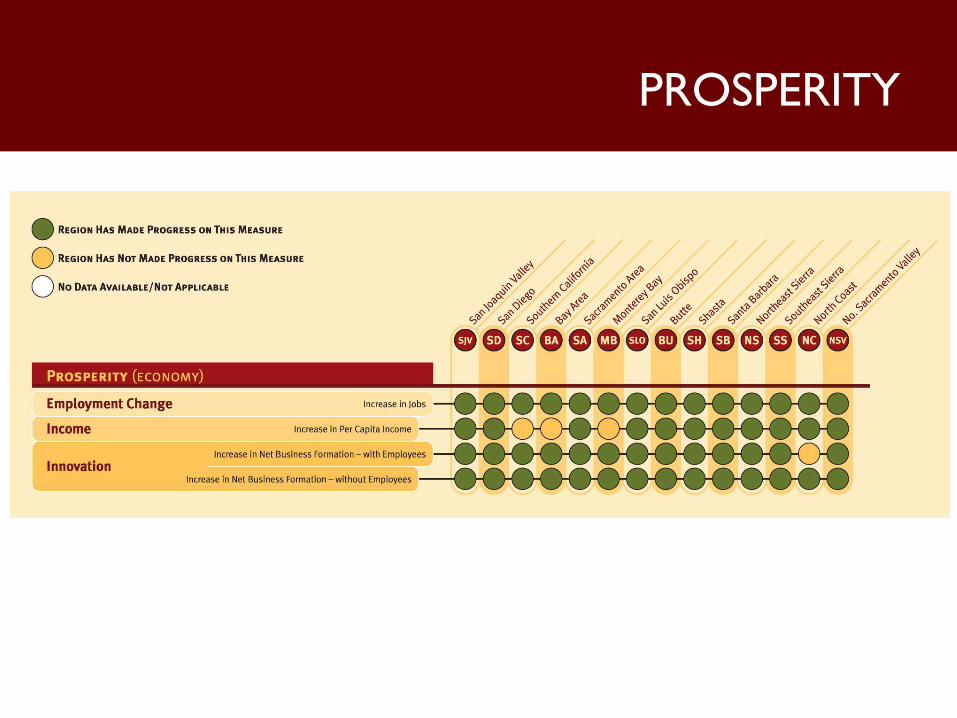
PROSPERITY
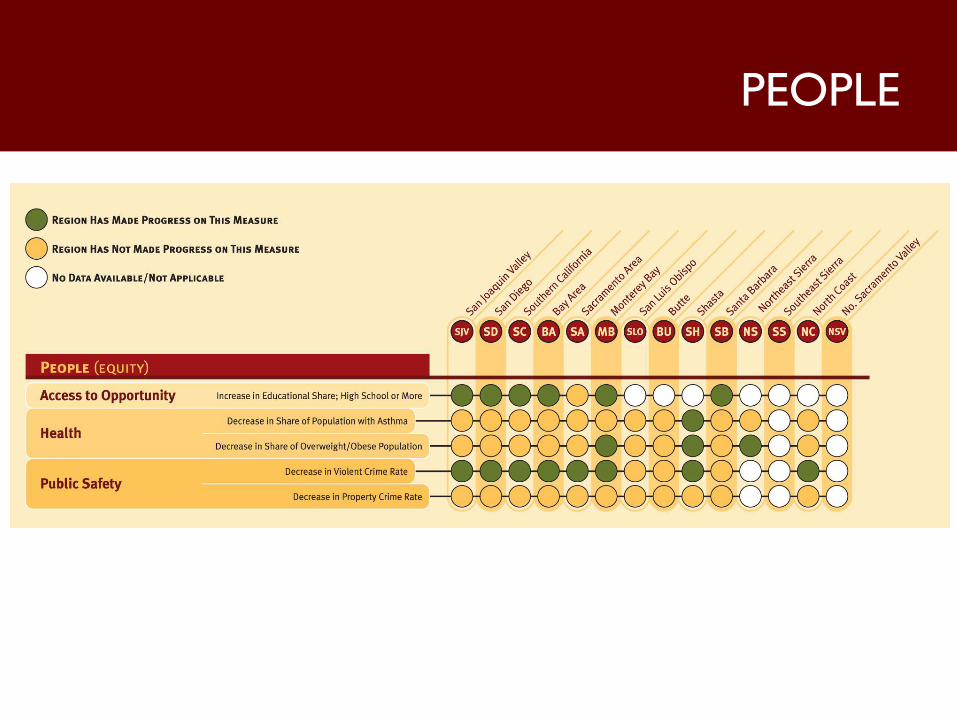
PEOPLE
OPPORTUNITIES & IMPLICATIONS FOR
DATA, INFORMATION AND POLICY
Create a priority list of new or refined indicators to “measure what matters most”
Commit to an ongoing flow of timely data between State Agencies & Regions
Expand data collection to address gaps, including for rural regions
Develop consistent definitions and standards across agencies
Support Adoption of best practices and new indicators; State can invest in new tools and methodologies for more accurate data
2009-2010 REPORT
Scoping process underway to identify new and emerging policy issues to be incorporated, potential revised or new indicators, data sources and methodologies
Planning and Technical Advisory Teams expanded with State partners and Blueprint affiliates
Conducted on-line survey
Opportunities to align with Strategic Growth Council
State Policy Initiatives
AB 32 Global Warming Solutions Act of 2006, sets greenhouse gas emissions (GHG) limits for 2020 at 1990 levels, and vision for beyond 2020
SB 375 (2008) – Requires California Resources Board to develop regional GHG emission reduction targets for cars and light trucks in each MPO region. Each MPO must develop plans to meet targets, either through sustainable communities strategy (as part of Regional Transportation Plan - RTP) or alternative planning strategy. Must address travel demand models and land use.

State Policy Initiatives
SB 732 (2008) – Strategic Growth Council –
Cabinet level council to coordinate state
agency activities to: improve air & water
quality, preserve natural resource and ag
lands, increase availability of affordable
housing, improve infrastructure systems,
promote public health, assist state and local
entities in planning of sustainable communities
& meeting AB 32 goals (www.sgc.ca.gov)
Strategic Growth Council
Charged to provide, fund and distribute data and
information to local governments and regional
agencies to plan and develop sustainable
communities, and award grants and loans
Allocated $12 million in bond funding to develop
regional transportation and land use modeling by
MPOs for the RTPS, to comply with GHG
requirements of SB 375 and promote Council goals;
should connect with Blueprints
ARB will adopt Regional GHG emissions targets
Progress Report Scoping Process Findings
Help establish consistency across agencies in a statewide set of measures for tracking sustainability and progress towards Regional Blueprint goals; align with current measurement efforts (e.g., Smart Mobility Framework, State Transportation Plan, Emerald Cities, Climate Action Plan)
Provide key information policy makers need to make decisions
Keep most all baseline indicators and add dynamic indicators for more recent areas
Priorities for Revised/New Indicators
Sustainable land use (infill development and
jobs/housing balance, housing affordability/burden,
green infrastructure); vehicle miles traveled (VMT);
GHG targets related to SB 375; public health
(determinants vs. outcomes); water
conservation/efficiencies; energy efficiencies; green
economy industry clusters and jobs
Infill development hard to quantify due to lack of
land use and infill data but critical; need to establish
GHG emissions baseline; need better economy data
Options for 2010 Report
8-10 core indicators aligned with cross-cutting state agency goals
Special features report to go deeper on selected issue
Full report: Preferred option - to foster ongoing policy discussion between state agencies and regional partners; set the stage for next Administration and Legislature; incorporate new data resources and methodologies
The Value of Progress Measures
Help identify integrated indicators of sustainability; benchmark our progress; and identify areas for course corrections
Provide information and context for data-driven public policy decisions and investments on shared priorities and goals, to help all regions improve
Increase understanding of complexity and interdependence of large-scale issues, and better engage the public in the long-term processes for improvement
Promote transparency through accountability for regional progress
Governance Issues and Challenges
Regions are the right scale for many issues
Blueprints are voluntary; land use authority is
local
MPOs have new statutory responsibilities with
SB 375
Resources are needed to plan for and
implement sustainable communities strategies,
develop better data and methodologies for
progress measures
Contacts
Trish Kelly, Project Director, California Regional Progress Report, Applied Development Economics, [email protected]
Garth Hopkins, Chief, Office of Regional and Interagency Planning, Caltrans [email protected]
Marilee Mortenson, Regional Blueprint Project Manager, Caltrans [email protected]