california regional progress report
TRANSCRIPT

o n e s t a t e
m a n y reg ions
o u r f u t u r e
c a l i f o r n i a r e g i o n a lp r o g r e s s r e p o r t
California Center for Regional Leadership in partnership withCaltrans • CALCOG • U.C. Davis
2 0 0 7

California Department of Transportation (Caltrans)
California Association of Councils of Governments (CALCOG)
calcog member agencies:Association of Bay Area Governments (ABAG)Association of Monterey Bay Area Governments (AMBAG)Fresno Council of GovernmentsKern Council of GovernmentsMetropolitan Transportation Commission (MTC)Sacramento Area Council of Governments (SACOG)San Diego Association of Governments (SANDAG)San Joaquin Council of GovernmentsSan Luis Obispo Council of Governments (SLOCOG)
The 2007 California Regional Progress Report is a collaborative effort between the regions,the State, university and philanthropic partners and the California Center for Regional Leadership,which is the manager for this project.
Ping ChangProgram Manager, Performance Assessment and Monitoring,Southern California Association of Governments
Coleen ClementsonSenior Regional Planner, San Diego Association of Governments
James CorlessSenior Planner, Metropolitan Transportation Commission
Cathy CreswellDeputy Director, Division of Housing Policy Development,California Department of Housing and Community Development
Randy DeshazoSenior Regional Planner, Association of Bay Area Governments
Steve DevencenziPlanning Director, San Luis Obispo County Council of Governments
Ted DroettboomJoint Policy Committee Staff Director, Association of Bay Area Governments
Christine EaryProject Manager, San Diego Association of Governments
Gordon GarryDirector, Research and Analysis, Sacramento Area Council of Governments
Marjorie KirnDeputy Executive Director, Merced County Association of Governments
Julia Lave JohnstonPlanner, State Clearinghouse, Governor’s Office of Planning and Research
Dan LittleChief Planner, Shasta County Regional Transportation Planning Agency
PROJECT SPONSORS
PROJECT ADVISORY TEAM
Santa Barbara County Association of GovernmentsShasta County Regional Transportation Planning AgencySouthern California Association of Governments (SCAG)Tahoe Regional Planning AgencyTulare County Association of Governments
California Department of Housingand Community Development
Information Center for the Environment,University of California, Davis
With generous support from the Morgan Family Foundation
Debbie MahChief, Director’s Office of Strategic Planning/Performance Measurement andPerformance Measures, Caltrans
Mahmoud MahdaviSenior Economist, Transportation Economics,Division of Transportation Planning, Caltrans
Mike McCoyPrincipal Investigator, Information Center for the Environment, U.C. Davis
Rusty SelixExecutive Director, CALCOG
Nathan SmithChief, Office of State Planning, Division of Transportation Planning, Caltrans
Barbara SteckSenior Transportation Planner, Fresno Council of Governments
Dan WayneSenior Planner, Shasta County Regional Transportation Planning Agency
Additional copies of the report may be downloaded at:
www.calregions.orgwww.calcog.orghttp://calblueprint.dot.ca.gov/
For individuals with sensory disabilities this documentis available in alternate formats. Please call or write to:
Marilee Mortenson, Task Order ManagerCalifornia Department of Transportation,Division of Transportation Planning,MS 32, P.O. Box 942874, Sacramento, CA 94274-0001916-653-3758
or use the CA Relay Service TTY number 1-800-735-2929

California Regional Progress R e p o r tJ u n e 2 0 0 7
The California Center for Regional Leadership is very pleased to introduce the inaugural California Regional Progress Report in collaboration with our regional, state, education and philanthropic partners. This report provides the baseline for how California’s regions are doing across a range of integrated quality of life measures within the framework of innovative regional planning led by the State’s Metropolitan Planning Agencies (MPOs) and Councils of Government (COGs), supported by Caltran’s California Regional Blueprint Planning Program, a process underway in most of the State’s regions.
California stands at a historic threshold – with 3.5 million new residents since 2000, a population nearing 38 million, and projections for continued growth and diversity which will dramatically shape the future of our regions and our state. The question is not whether we will grow but how and where we will grow, and what the impacts will be on our long-term prosperity and quality of life. What kind of future do we want, what do we need to do collectively to attain that reality, and how do we measure our progress toward achieving our goals?
The focus is of this report on the regions because they are the building blocks of the State – the scale at which the economy, transportation, labor market and natural systems function. Regions compete with other regions in the global economy, and all of our regions must have the capacity to do so. The regions are where collective solutions for our future can be created, and this is the genesis of “regional blueprint planning.”
While the Regional Blueprint Planning efforts are at varying stages of implementation across California, and while the State’s regions differ dramatically in many ways, they share the ever-increasing challenges of traffic congestion; sprawl; lack of housing affordability for large segments of the population; and uncertain ability to sustain a vibrant economy, preserve important farmlands and open space and maintain quality of life for their ever-increasing populations. These regional efforts have different visions and strategies but share the commitment and understanding that we need to grow better and smarter in the future, and that we need to link land use, transportation, housing, natural resources and economic development in holistic regional plans that create a more sustainable path to our shared future and equitable access to these assets.
Many regions are already monitoring their progress through indicator reports, but this Regional Progress Report is the first time all of the State’s regions are included in a comprehensive framework and with a common set of progress indicators and measures. We hope this report provides perspective and value to regional partners to assess progress toward regional visions and goals, and to state and local policy makers and residents so they can better support regional efforts. This report is a first step. We do not always have the data we need to measure what we want to understand better, but working together we can identify those needs and improve our ability to measure our progress and make mid-course corrections.
We applaud the visionary leadership and innovative actions of the regional, state, local and federal partners dedicated to the Regional Blueprint process and outcomes. We also wish to express our gratitude to Sunne Wright McPeak, former CCRL Board Chair and former Secretary of the Business, Transportation and Housing Agency, for her vision and leadership in imagining a path to a better future for all Californians.
As we look ahead, we see that regional planning and benchmarking will become even more important as regions begin to devise their strategies for achieving California’s ambitious climate change goals and investing the recent voter-approved $42.7 billion in infrastructure bond funds. Our challenges are many but our opportunities are great, and CCRL will continue in its mission to advance innovative regional strategies with all our partners throughout the State.
Dan MazmanianInterim Board Chair California Center for Regional Leadership

The purpose of the California Regional Progress Report is to develop a common framework and set of indicators to measure regional progress statewide and to help Californians improve their communities, with this first report as the baseline. The intent is to inform state, regional, and local decision makers about transportation, housing, land use, environmental resources, and other infrastructure in ways that lead to:
•A more efficient and effective transportation system and land use pattern
•A strong and sustainable economy
•Progress along the dimensions of place, prosperity, and people (i.e., the 3 “Ps”) which define quality of life for all Californians. The 3Ps fully incorporate and expand on the environmental, economic, and social equity dimensions (i.e., the “3Es”) that have been widely used by the regions of California, Caltrans, and many others as a conceptual foundation for policy and planning
The Report is intended not as an evaluation of specific policies or planning efforts, but rather a recognition that Californians are coming together across the State and working in new ways to improve the quality of life of their regions. This process is occurring through “regional blueprint planning,” a new and innovative mechanism that moves beyond “business as usual” as we plan for our future to address the challenges and opportunities of growth.
As such, the California Regional Progress Report is intended to be a resource for regional, state and local decision makers and critical stakeholders, including residents, business and environmental interests, non-profits and other civic leaders as they determine the policies and investments that will shape the economic, social, and environmental well-being of California’s regions and thus the State overall. It has been created as a means to help them better understand how their regions are evolving, in what areas they are making progress, where they may need to change course or address emerging challenges, and how the State can better support the regions and their communities.
Every region is a work in progress; this Report offers an objective source of information on how the journey is going.
Regional Blueprint Planning
The selection of the indicators has been guided by the comprehensive, long-term regional planning and visioning efforts of the State’s eighteen federally designated Metropolitan Planning Agencies (MPOs) and Councils of Governments (COGs) which are responsible for transportation planning and investments of federal and other resources. COGs also are responsible for identifying the share of the region’s housing needs for each community (see www.calcog.org).
These efforts, known under various names within the regions but referred to generally as “Blueprint Planning,” were initiated in the 1990s as a means for local governments and regional agencies within metropolitan regions to coordinate long-range plans for transportation investment, air quality, and land use. In 2005, the California Business,
INTRODUCTIONTransportation and Housing Agency launched the California Regional Blueprint Planning Program. This is a voluntary, discretionary competitive grant program that provides seed funding that initiates or augments the activities of the MPOs and COGs to conduct comprehensive scenario planning with regional leaders, local governments and stakeholders on a preferred growth scenario, or “Regional Blueprint Plan.” The program is intended to better inform regional and local decision-making through proactive public engagement, and to foster consensus on a vision and preferred land use pattern through the year 2025 or longer.
Originally established by the California Legislature as a two-year program, the California Regional Blueprint Planning Program is administered by the California Department of Transportation (Caltrans), Office of Regional and Interagency Planning. During 2005 and 2006, Caltrans awarded $10 million for Regional Blueprint planning to nine grantees comprising sixteen of the State’s MPOs. Ninety-seven percent of the Californians reside in regions covered by Blueprint Plans underway.
Participating Blueprint grantees include:
ABAG/MTC (Bay Area), AMBAG (Monterey Bay), BCAG (Butte), SACOG (Sacramento), SANDAG (San Diego), SLOCOG (San Luis Obispo), San Joaquin Valley (collaboration of 8 MPOs/COGs), SCRTPA (Shasta), SCAG, and Tri-County Partnership (a rural pilot in Alpine, Amador and Calaveras counties). For a map of the regions see pp. 6-7
The California Regional Blueprint Planning Program has important components and partners. These include:
• The Blueprint Learning Network (BLN) – provides learning opportunities and technical support to the MPOs, COGs and their regional and local civic partners, including local elected officials. BLN holds three statewide workshops per year to focus on overcoming the challenges to effective Blueprint Planning and addressing new planning issues. Partners include members of the Governor’s Cabinet, State agencies and other segments of the public and private sectors. The workshops are a forum to share best practices and combine knowledge and resources. The 2007 workshops are co-sponsored by Caltrans and the Governor’s Office of Planning and Research. CCRL and U.C. Davis Information Center for the Environment are the managers of the BLN and collaborate with MPOs/COGs and the California Association of Councils of Governments (CALCOG).
• The State Coordinating Committee – provides State agency support; is co-hosted by Caltrans and the Governor’s Office of Planning and Research and is comprised of Cabinet Secretaries and key staff from the Business, Transportation and Housing Agency, the Governor’s Office of Planning and Research, the Resources Agency, Caltrans, Department of Housing and Community Development, Environmental Protection Agency, California Department of Food and Agriculture, and the Geographic Information Systems Council.
• A broad-based coalition of program affiliates to provide their perspective and enhance the delivery of the program.
For additional information go to http://calblueprint.dot.ca.gov/02

TABLE OF CONTENTS
Introduction 2
Framework 4
How Indicators Were Chosen 6
How Regions Were Defined 7
Importance of Statewide Challenges 8 and Regional Differences
Place, Prosperity, and PeopleThe California Story Today 11
What Progress Are We Making? 12
Summary of Regional Progress Chart 13
A Shared Vision for the Future 14
Looking Ahead 15
PLACE 16Efficient Development 17
Movement of People and Goods 20
Transportation Choices 24
Resource Use 26
Protected Lands 30
Air & Water Quality 32
Housing Affordability/Burden 36
PROSPERITY 38Employment Change 39
Income 42
Innovation 44
PEOPLE 46Access to Opportunity 48
Health 50
Public Safety 52
Opportunities + Implications 53
Appendix 55

The California Regional Blueprint Planning Process was created to foster consensus among community and regional leaders, local governments and stakeholders toward a vision for preferred growth and land use patterns for each region. The collaborative, comprehensive, planning efforts are to result in a Blueprint plan for the region through the year 2025. The long-range goal for the Regional Blueprint Plans is to guide future infrastructure development, in turn to accommodate anticipated population and economic growth within the regions. The desired outcomes for the Blueprint Plans are to:
Foster More Efficient Land Use Patterns and
Transportation Systems That:
•Support improved mobility and reduced dependency on single-occupant vehicle trips, and reduce congestion
•Increase transit use, walking and bicycling
•Encourage infill development
•Accommodate an adequate supply of housing for all incomes
•Reduce impacts on valuable habitat and productive farmland
•Improve air quality
•Increase efficient use of energy and other resources
•Result in safe and vibrant neighborhoods
Provide Consumers With More Housing and Transportation Choices
Improve California’s Economic Competitiveness and Quality of Life
Establish a Process for Public and Stakeholder Engagement That Can Be Replicated to Build
Awareness Of, and Support For, Critical Infrastructure and Housing Needs
Source: Regional Blueprint Planning Program, http://calblueprint.dot.ca.gov
Regional Blueprint Planning includes development of regional performance measures to measure progress toward the region’s own vision for future land use and transportation, as well as statewide performance measures to measure progress toward statewide transportation and housing goals. This report includes measures that address each of these areas.
The framework for the California Regional Progress Report recognizes the interdependence of policy choices, regional blueprint goals, and desired regional outcomes. Every day policy choices and investment decisions are made at the local, regional and state levels in areas of land use, transportation, housing, environment, economic development, and labor force that influence regional outcomes. Regional Blueprint Planning processes are voluntary collaborations and are one of many strategies pursued to affect one or more of these outcomes. In fact, by design, the Blueprints have focused primarily on affecting land use and transportation related outcomes in ways that either make a positive impact or avoid negative effects on the 3Ps.
All of these efforts are early in their implementation—or even still in the planning stage—and so have not yet had an opportunity to have a major impact on regional outcomes. The California Regional Progress Report recognizes this reality, and is not intended to evaluate the impacts of the Blueprint efforts. Instead, it provides a framework within which to understand the role of the Regional Blueprint Planning efforts in the larger context of policy choices across many areas. It also focuses on specific areas that the Blueprints intend to affect more directly over time—such as land use and transportation—to establish a baseline from which to measure progress in the coming years.
The Report also recognizes that California’s regions are unique—each facing a different set of demographic, economic, environmental, and other assets and challenges. As a result, the Report focuses on how each region is progressing compared to its past performance, rather than how regions compare to one another. The Report does describe patterns across regions to help regional stakeholders as well as state policymakers understand similarities and differences that could inform decision-making.
However, the purpose of this Report is to encourage every region to make progress towards its own shared vision of the 3Ps regardless of how they compare to other regions.
The Report recognizes that there can be important variations within the counties of larger regions. To enable readers to examine sub-regions more closely, develop comparisons, define their regions differently, or for other reasons, data was collected on a county-by-county basis and are available electronically (see www.ccrl.org).
The Report also recognizes that some measures may not indicate clear trends, or can be more meaningful for one region than another. As a result, the Report examines multiple indicators across the 3Ps, and focuses more on underlying patterns or overall direction across many indicators than the performance on any single measure. However, since data (where it exists) are being made available electronically for measures at the county level, a region could decide that a specific indicator warrants closer examination, or is more meaningful to them than to other regions.
FRAMEWORK FOR THE PROGRESS REPORT“The Regional Blueprint Planning Program is a critical part of meeting our Strategic Growth Plan goals to reduce congestion through smart land use.”
Will Kempton, Director, California Department of Transportation (Caltrans)
04

• Improve Mobility
• Reduce Congestion
• Increase Transit Use
• Encourage Infill
• Accomodate Housing Supply
• Minimize Impact on Farmlandand Habitat
Place (environment)
• Air and Water Quality• Efficient Development• Transportation Choices
• Housing Affordability/Burden • Protected Open Space • Resource Use
• Movement of People and Goods
Prosperity (economy)
• Employment Change • Innovation • Income
People (equity)
• Access to Opportunity • Health• Public Safety
• Land Use
• Transportation
• Housing
• Environment
• Economic Development
• Labor Force
Regional Blueprint Goals
Reg
iona
l OutcomesPolicy Choices
in
fl
ue
n
ce
i n f l u e n c e
i
nf
lu
en
ce
The Report’s indicators are more concentrated on the dimensions of Place than Prosperity and People. About two-thirds of the indicators focus on efficient development, movement of people and goods, transportation choices, resource use, protected lands, air and water quality, and housing affordability/burden. These indicators were chosen to provide a more complete picture in areas that are to be specifically affected by the implementation of the Regional Blueprint projects in the years ahead. It does not mean that Place is more important in some way than People or Prosperity. While we group the indicators in three categories, they are inter-related and many are relevant to more than simply one category. In many cases, regions have developed their own reports that include additional indicators in these other areas.
The Report keeps the focus on true regional progress—how well regions are advancing all three Ps. If, for example, regions are advancing on measures of place, such as land use and transportation, but not on measures of prosperity and people, most would agree that balanced regional progress is not being achieved. To what extent regions are experiencing balanced progress is an enduring question, one that should be the concern not only of the Blueprint efforts, but all who have a role in shaping the decisions and investments across the 3Ps. Stakeholders include not only local and regional leaders including elected officials, but also business, the non-profit sector, and the general public, and as well as state policymakers whose decisions set the context and will help determine the outcomes for regional progress.
05

NCSH
NS
NSV
BU
SA
BA
SJV
SS
MB
SLO
SB
HOW INDICATORS WERE CHOSEN
Selecting indicators for inclusion in the California Regional Progress
Report required clear criteria and a disciplined process. The Advisory
Team (which included representatives of MPOs, COGs, Caltrans,
and other state agency partners) assisted in the development of the
overall framework as well as the selection of the indicators. The first
step was to review what the regions themselves identified as important
indicators of progress through their own indexes and/or Blueprint efforts.
From this review, a common set of indicators used across several regions
was identified. Additional potential indicators were added based on work
done in other regions in other states across the country. From this list, the
Report advisors weighed each indicator according to the following criteria:
Alignment—An indicator must be consistent with existing Blueprint visions, goals, or measures; regional indicator projects; regional performance measures; and Caltrans performance measures. The relevancy of some measures also varied according to regional characteristics, especially related to the urban/rural nature and difference of scale. The greater the alignment across all these areas, the stronger the case for inclusion.
Quantifiability—An indicator must be able to be measured with credible, reliable data. Some promising ideas for indicators are not (yet) quantifiable on a regional basis, while others might be hindered by a less-than-sound methodology.
Outcome-Based—An indicator is stronger if focused on outcomes rather than inputs.
Clarity—An indicator is preferred if it is clear, understandable, and easily communicated.
Availability—An indicator should be available across as many Blueprint regions as possible. This criteria was the most difficult to meet. In the end, data was available across all regions for 15 indicators, and across the larger regions for all 27 indicators. Smaller regions—particularly those not yet undertaking Blueprint processes—posed the biggest challenge for data availability. Thus, some of the measures, while short of ideal, represent the best data available at this time covering the most regions.
The Advisory Team created a list of indicators that met these criteria and received a priority rating for inclusion from at least 75% of the advisors. However, it became clear that individual regions had developed innovative measures that met the first four criteria, but were generally not available for other regions. These innovative measures are important to communicate to a statewide audience, and are highlighted in the Report, representing a promising indicator for further development and replication.
Through the selection process, it became clear that there are more and different indicators to be measured than those that currently exist. While the Report highlights some of these possibilities, there is much room for improvement
in how we measure regional progress. Better measures of regional progress could be a common cause among local, regional, and state leaders. Resources need to be directed to local and regional as well as statewide data collection. While goals along the dimensions of place, prosperity, and people are long term, we should always be searching for better ways to measure progress towards these regional outcomes.
06

SLO
SD
SJV
NSV
SC
SD
NC
SH
NS
BU
SA
SS
BA
SB
SC
MB
San DiegoSan Diego
There are many ways to define regions in California—according to geography,
economy, commute shed, habitat, history, political jurisdiction, or other criteria.
For the purposes of this Report (see map), regions have been defined first
according to the boundaries of California’s Metropolitan Planning Organizations
(MPOs). There have also been some additional groupings. In the case of
the San Joaquin Valley, multiple MPOs are participating together in
blueprint planning and so are aggregated into a region. In the case
of the bi-state Tahoe Regional Planning Agency, the MPO is
included in the SACOG region due to data limitations. Some of
these Blueprint regions are very large in geographic area and population,
while others encompass a single county.
Second, for the balance of the state, we determined multi-county
groupings based primarily on a common economy or geography. In
the future, these groupings could change as regional partnerships form. Further,
as noted earlier, since data for this Report are available electronically at the
county level, stakeholders can create their own regional definitions as they see fit.
HOW REGIONS WERE DEFINED
North Coast RegionDel Norte Humboldt
Lake Mendocino
Trinity
Shasta RegionShasta
Northeast Sierra RegionLassen Modoc
Nevada Plumas
Sierra Siskiyou
Northern Sacramento ValleyColusa
Glenn
Tehama
Butte RegionButte
Sacramento Area RegionEl Dorado Placer
SacramentoSutter
Yolo Yuba
Southeast Sierra RegionAlpine Amador
Calaveras Inyo
Mariposa Mono
Tuolomne
Bay Area RegionAlameda Contra Costa
Marin Napa San Francisco
San Mateo Santa Clara
Solano Sonoma
San Joaquin ValleyFresno Kern
Kings Madera
Merced San Joaquin
Stanislaus Tulare
Monterey BayMonterey San Benito
Santa Cruz
San Luis ObispoSan Luis Obispo
Santa BarbaraSanta Barbara
Southern CaliforniaImperial Los Angeles
Orange Riverside
San Bernardino
Ventura
0707

There are important people, place, and prosperity challenges facing California. Every region shares in these challenges, although in different ways. These are shared challenges that cross boundaries of jurisdiction, sector, and traditional issues. They stem from inter-related social and economic forces shaping California and its regions—and can only be addressed effectively with an integrated and collaborative approach among local, regional, state, and often federal partners. Neither a top-down, “one size fits all” approach which views California only through the lens of statewide issues nor a bottom-up “go it alone” approach which views California as an unrelated set of regions with unique destinies will work. Instead, there are a set of major statewide challenges that can be best understood as variations on shared regional concerns.
IMPORTANCE OF STATEWIDE CHALLENGES AND REGIONAL DIFFERENCES
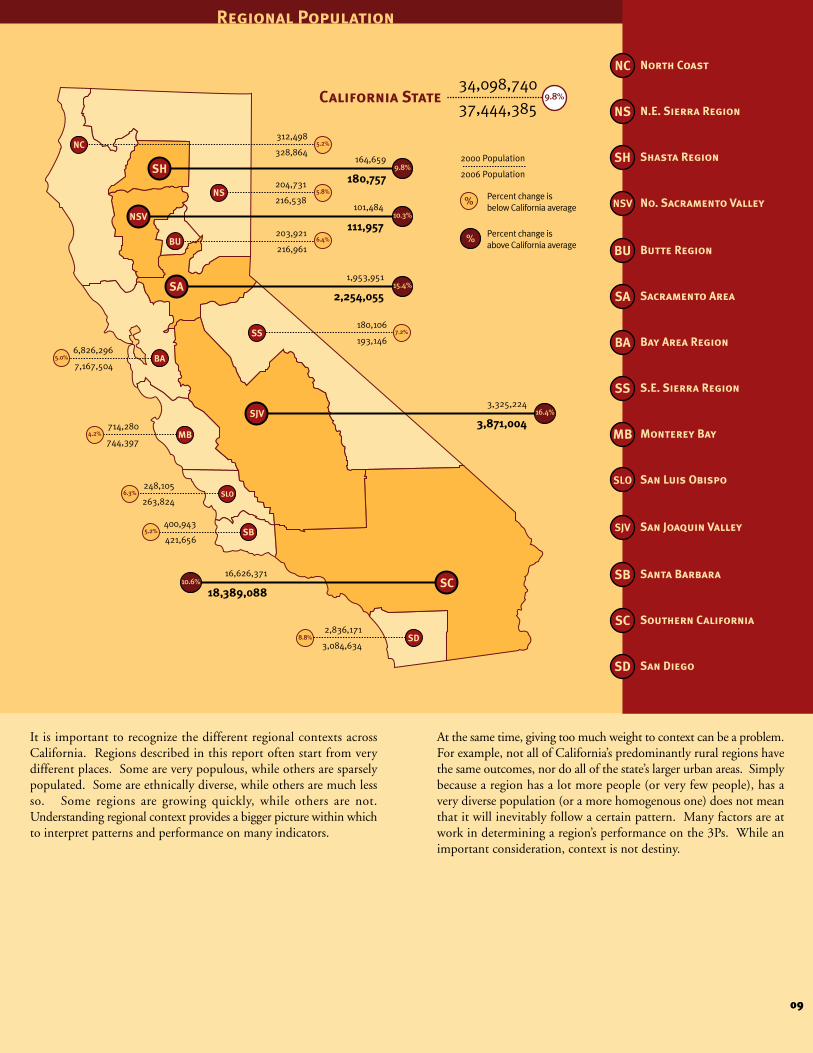
Growing Population: Between 2000 and 2006, California’s population grew almost 10%. Every region grew between four and sixteen percent (see chart on pg. 9). Immigration has played an important role in driving population growth in California. Indeed, it has played a role in every region, though with varying contributions from foreign immigration and domestic in-migration.
Growing Diversity: California has become more diverse since 2000. The mix of ethnicities is also changing in every region, though at different rates among different groups. Some regions have experienced a decline in certain ethnicities, while others have experienced balanced growth in all groups, and others have experienced much faster growth in some compared to other ethnic groups.
Aging of the population: Many regions are projecting that households with children under the age of 18 will drop while households without children will increase with the aging of the baby boomer population. This demographic change will bring different demands for services, transportation and mobility choices, and will affect demand for the type and preferred location for homes.
Growing Congestion: Over the longer term, California has become more congested as transportation infrastructure has not kept pace with growing population, expanding trade and goods movement, and increasing distances between jobs and housing. For some regions, inter-regional commute and goods movement corridors are the biggest concerns, while for others it is local streets and highway connections that have become overwhelmed by growth.
Growing Pressure on Agricultural Lands, Open Space, and Ecosystems: California’s development patterns have accelerated the conversion of agricultural land and open space and disrupted ecosystems. Every region is experiencing development pressures, although in different combinations depending on their existing urban form, industry mix, and rural landscape. Some regions are experiencing air quality problems primarily from transportation sources, while others see significant contributions of pollutants from agricultural and industrial sources and construction.
Growing Housing Costs: California’s housing costs have skyrocketed. Every region is experiencing the effects of this trend, though in different ways. Some regions have not provided enough housing for their workforce, increasing prices and commute distances. Other regions have built much more housing, some of which is bought by people who then commute long distances, move from more expensive housing markets, or purchase a second home – all of which have raised prices and made homeownership more difficult for local buyers.
Growing Global Competition: California participates in an increasingly competitive global economy, putting pressure on the state’s diverse industries to increase their value and limit their costs through technological innovation, talent recruitment and development, and international partnerships. Although every region has a different industry mix, every region has no choice but to meet this global challenge.08
NC
SH
NS
NSV
BU
SA
SS
BA
SJV
MB
SLO
SB
SD
SC
NC
SH
NS
NSV
BU
SA
BA
SJV
SS
MB
SLO
SB
SC
SD
6,826,296
7,167,504
714,280
744,397
248,105
263,824
400,943
421,656
2,836,171
3,084,634
16,626,371
18,389,088
312,498
328,864164,659
180,757
101,484
111,957
204,731
216,538
203,921
216,961
1,953,951
2,254,055
180,106
193,146
3,325,224
3,871,004
2000 Population
2006 Population
34,098,740
37,444,385
5.2%
5.8%
6.4%
9.8%
10.3%
15.4%
7.2%
16.4%
10.6%
5.2%
6.3%
4.2%
5.0%
8.8%
9.8%
%
%
Percent change is below California average
Percent change is above California average
It is important to recognize the different regional contexts across California. Regions described in this report often start from very different places. Some are very populous, while others are sparsely populated. Some are ethnically diverse, while others are much less so. Some regions are growing quickly, while others are not. Understanding regional context provides a bigger picture within which to interpret patterns and performance on many indicators.
At the same time, giving too much weight to context can be a problem. For example, not all of California’s predominantly rural regions have the same outcomes, nor do all of the state’s larger urban areas. Simply because a region has a lot more people (or very few people), has a very diverse population (or a more homogenous one) does not mean that it will inevitably follow a certain pattern. Many factors are at work in determining a region’s performance on the 3Ps. While an important consideration, context is not destiny.
North Coast
Shasta Region
N.E. Sierra Region
No. Sacramento Valley
Butte Region
Sacramento Area
S.E. Sierra Region
Bay Area Region
San Joaquin Valley
Monterey Bay
San Luis Obispo
Santa Barbara
San Diego
Southern California
California State
Regional Population
09

Source: State of California, Department of Finance, “Race/Ethnic Population with Age and Sex Detail"
Source: State of California, Department of Finance, “Race/Ethnic Population with Age and Sex Detail"
NCSH
NS
NSV
BU
SA
BA
SJV
SS
MB
SLO
SB
SC
SD
NCSH
NS
NSV
BU
SA
BA
SJV
SS
MB
SLO
SB
SC
SD
NC
SH
NS
NSV
BU
SA
SS
BA
SJV
MB
SLO
SB
SD
SC
North Coast
Shasta Region
N.E. Sierra Region
No. Sacramento Valley
Butte Region
Sacramento Area
S.E. Sierra Region
Bay Area Region
San Joaquin Valley
Monterey Bay
San Luis Obispo
Santa Barbara
San Diego
Southern California
Race/Ethnic PopulationTotal Share of Non-White Population
2006
25% or Less Non-White Share
26%-49% Non-White Share
More Than 50% Non-White Share
Race/Ethnic PopulationPercent Change of Non-White Population
2000-2006
11% or Less Increase
12%-18% Increase
More Than 19% Increase
10

California is a state of enormous economic, social, and environmental diversity. The complexity of the individual stories of California’s regions help us understand how California as a whole is improving its quality of life—the interplay of place, prosperity, and people.
The summary table on page 13 provides a picture of how each of 14 regions is doing across 13 categories and 27 indicators. We have coded each cell either a green or yellow.
Green means that the region has experienced a gain on that measure over the designated time period (usually at least 3 years and often longer).
Yellow means that the region has not made progress on the measure. It can also mean that we found a small gain, but one that we cannot be confident actually reflects a measurable change because the data are not precise enough to make that call.
White areas reflect where data are not available, especially for rural or smaller regions.
We chose yellow because it signals “caution”—that there has not been measurable progress—encouraging regions to take a closer look to see if there is reason for concern or a rationale for change. It is also worth noting that for each measure we focus on percentage change to show whether or not regions are making measurable progress. The rate of change should be viewed in the context of the underlying data. For example, a region can experience a large percentage change on a measure by starting from a very small base number. Or, a region can experience a small percentage change starting from a very large base number. In these and other cases, readers can take a closer look by consulting the county-by-county data available on www.ccrl.org and www.calcog.org.
It is not our role, nor the purpose of this report, to pass judgment on whether regions are succeeding or failing, winning or losing, or making sufficient progress to achieve their own goals and aspirations. Instead, we report objectively where diverse regions in very different circumstances have or have not made progress compared to their own past performance. In that sense, this Report should be a starting point for discussion about change, rather than a summary judgment on regional performance.
PLACE, PROSPERITY, AND PEOPLETHE CALIFORNIA STORY TODAY
California is a land of dynamic change, creating both tremendous benefits and undeniable challenges. The State continues to be a wellspring of opportunity, creating jobs and companies. It is also home to a population that is growing more educated and better able to compete in the global economy. We have become a safer state, with violent crime dropping in many regions in recent years.
At the same time, economic change has put pressure on our communities and infrastructure. In recent years, many communities have made concerted efforts to be more efficient in their development and expand the ways people travel to work and elsewhere in order to reduce traffic congestion. Many of the State’s regions have in fact made progress in growing more efficiently and encouraging people to use transit. But, the numbers and proportion of people commuting alone by car is growing in most regions, as are the number of miles traveled and traffic congestion. Many people are living far away from their jobs, often because they cannot afford to live closer, with housing affordability continuing to decline. Many cannot realistically commute by transit or other means because of distance to transit lines or work, a legacy of earlier automobile-dependent development patterns. Because of single-use development patterns, housing is also often disconnected from local services, recreation, and the like—necessitating additional trips.
The California story is still unfolding. Can we create economic opportunity and grow our communities in ways that reduce congestion and improve quality of life? Can we grow the talent of our population and connect people to economic opportunity, raising incomes and increasing their ability to afford a home closer to where they work? Can we use our economic prosperity and efficient development patterns to reduce our resource use, improve our air quality and health, and protect our vital agricultural lands and open space for this and future generations?
What is certain is that these and other questions like them will be answered in the regions of California. What is also clear is that State, regional, and local leaders will need to work across jurisdictions, sectors, and issues to strengthen our communities, developing solutions as innovative and diverse as California’s economy and its people.
11

WHAT PROGRESS ARE WE MAKING?The reality is that California’s regions are making progress on at least some measures. The initial impressions from the summary table on the facing page are that:
• Every region tells a mixed story—progress in some areas, lack of progress in others—across the full range of place, prosperity, and people measures.
• Every region has made gains on most of the prosperity measures in recent years—including increases in jobs, income, and new business formation.
• Most regions have not made progress on a majority of the people measures in recent years—indicators focused on education, health and public safety.
• No region has gained ground on a majority of the 18 place measures—ranging from efficient development to movement of people and goods, transportation choices, resource use, protected open space, air and water quality, and housing affordability.
• However, every region has made progress on three or more place measures. Eleven of 14 regions have made progress on five or more place measures.
A closer look at the place indicators reveals some shared patterns across regions:
• Most regions have made progress on measures of efficient development, such as the ratio of new multi-family to single-family residential building permits. Housing is being built in denser configurations than in the past.
• People are driving more and experiencing more traffic congestion. This has been a major stimulus to Blueprint Planning efforts. Nearly every one of California’s most populous regions has not made long-term progress in terms of movement of people and goods— recording increases in vehicle miles traveled per household and daily vehicle hours of delay since the 1990s.
• However, more recently (2000-2005), several regions have showed progress, with lower rates of vehicle miles traveled per household than over the previous decade (1990-2000). Several also experienced less traffic congestion. Many factors likely contributed to these changes, including lower rates of economic growth in the early 2000s, and completion of some congestion relief projects.
• While half of the regions—including both large urban and lightly populated areas—have experienced increases in transit ridership, almost every region (where data are available) has not experienced an overall increase in the share of the population taking transit, carpools, biking, walking, etc. While there have been increases in transit ridership in some regions, there have apparently been comparable or greater increases in the number of people commuting alone by car.
• Nearly every region is using more resources than in the past—from gasoline consumption to electricity. The exception is residential natural gas consumption, which has declined in every region.
• While most regions are experiencing higher rates of conversion of agricultural land to development, a few are recording lower rates of conversion than in the past.
•Most regions have added to their stock of protected open space—or at least have not taken many acres out of protected status.
•Most regions have improved their air quality in terms of ozone levels.
•Some highly-populated regions (Southern California and the Bay Area) have reduced the number of impaired waterways, while others have experienced increases (San Diego) Similarly, some less-populated regions (Central Coast) have more impaired waterways and some (North Coast) have fewer impaired waterways than in the past.
•No region (where data are available) has made progress on improving housing affordability.
A closer look at the prosperity indicators reveals some shared patterns across regions:
•Every region has experienced a net gain in jobs in non-farm sectors, and every region but two has enjoyed real increases in per capita income.
• Every region but one has also experienced net growth in new businesses with employees, with every region posting gains in new businesses without employees. In fact, every region has experienced double-digit increases in the number of firms where everyone working is at least a co-owner—a major shift in how economies are structured in California.
12

New Building Permits: Multi-Family vs. Single Family 18
18
21
22
25
25
27
28
28
29
29
31
31
32
35
36
37
37
40
43
44
45
48
50
51
52
52
SJV NCSH NS NSVBUSA SSBA MB SLOSD SC SB
SJV NCSH NS NSVBUSA SSBA MB SLOSD SC SB
Ratio of Jobs to Housing Units
Decrease in Vehicle Miles of Travel per Household
Decrease in Daily Vehicle Hours of Delay
Means of Transportation to Work
Increase in Transit Ridership
Decrease in Fuel Consumption
Residential Energy Consumption – Electricity
Residential Energy Consumption – Natural Gas
Non-residential Natural Gas Consumption
Non-residential Electricity Consumption
Conversion of Agricultural Lands to Urban/Built-up Uses
Protected Open Space
Ozone – Decrease in Days Exceeding 8-hour Standard
Decrease in Impaired Water Segments
Increase in Share of First-Time Buyers of Median Priced Home
Housing Renters with Costs Greater than 35% of Income
Housing Owners with Costs Greater than 35% of Income
Increase in Jobs
Increase in Per Capita Income
Increase in Net Business Formation – with Employees
Increase in Net Business Formation – without Employees
Increase in Educational Share; High School or More
Decrease in Share of Population with Asthma
Decrease in Share of Overweight/Obese Population
Decrease in Violent Crime Rate
Decrease in Property Crime Rate
SJV NCSH NS NSVBUSA SSBA MB SLOSD SC SB
SJV NCSH NS NSVBUSA SSBA MB SLOSD SC SB
11 1
2 2
SUMMARY OF REGIONAL PROGRESS
North Coast
Shasta
Northeast
Sierra
ButteSacra
mento Are
a
Southeast
Sierra
Bay Are
a
San Joaquin Valle
y
Montere
y Bay
San Luis
Obispo
San Diego
Southern
Californ
ia
No. Sacra
mento Valle
y
Santa B
arbara
No. Sacramento Valley
North Coast
Shasta
Northeast Sierra
ButteSacramento Area
Southeast Sierra
Bay Area
Monterey Bay
San Luis Obispo
San Diego
Southern California
Santa Barbara
San Joaquin Valley
Page
Page
Efficient Development
Movement of People
and Goods
Transportation Choices
Resource Use
Protected Lands
Air & Water Quality
Housing
Affordability/Burden
Employment Change
Income
Innovation
Access to Opportunity
Health
Public Safety
Place (environment)
Prosperity (economy)
People (equity)
Region Has Made Progress on This Measure
Region Has Not Made Progress on This Measure
No Data Available/Not Applicable
Notes:
1- The Caltrans State Highway Congestion Monitoring Program groups San Luis Obispo, Monterey Bay Region, and Santa Barbara as one region.
2- The Water Quality Control Board's regions of Lahontan and Central Valley include data for both Northeast Sierra and Southeast Sierra.
13

WHAT PROGRESS ARE WE MAKINGContinued from pg. 12
A closer look at the people indicators reveals some shared patterns across regions:
•Virtually every region (where data are available) has experienced an increase in its level of educational attainment. There is a bigger share of more highly-educated people living in these regions of California, a critical ingredient for competing in the increasingly knowledge-driven global economy.
•Few regions have improved in two key areas of health: asthma and obesity. Poor air quality has been linked to asthma rates. Obesity can lead to many illnesses. Many professionals believe that increases in obesity are in part a function of community design.
•While most regions have cut their rates of violent crime considerably, all regions have experienced major increases in property crime since 2000.
A closer look at the regions suggests some additional patterns as well:
•Four of five of the more heavily populated regions made progress in efficient development in recent years— including San Diego, Southern California, the Bay Area, and Sacramento regions. However, three of five also converted their agricultural land to urban and built-up uses at a faster rate.
•More than half of the less-populated regions also made progress in efficient development—including San Luis Obispo, Shasta, Santa Barbara, Northeast Sierra, Southeast Sierra, and North Coast regions. However, all but two of the nine less-populated regions converted their agricultural land to urban and built-up uses at a faster rate.
What would California’s regions look like if they were
making progress on all of the indicators measured in this
report? What if all the cells in the summary table were
green? Together, these indicators point in the direction
of a shared vision of quality of life for California—one
that connects people, place, and prosperity in mutually
beneficial ways in every region of the State.
In this future, California’s physical growth is getting more
efficient all the time—more housing and jobs on less land.
Californians are driving fewer miles because they are able
to work closer to home—or at home. More people are
living in places where alternatives to driving alone are
realistic—near major transit routes or close to other
commuters who carpool, or in communities where biking
or walking to work is possible. With greater attention to
design and amenities, the quality of California’s
communities is also improving. With these shifts and
expansion of California’s transportation infrastructure,
traffic congestion and delay is constantly improving.
Gasoline consumption per household is dropping along
with vehicle miles of travel, and there is wider adoption
of automobiles based on alternative fuels. With more
efficient land use patterns, less need for automobile travel,
and growing alternatives, Californians are enjoying
additional benefits such as better air quality, and lower
rates of asthma and obesity.
A SHARED VISION OF THE FUTURE
The California Transportation Plan: A Long-Term Framework
The California Transportation Plan (CTP) 2025 is a statewide, long-range transportation plan for meeting California's future mobility needs. The CTP provides a vision, developed in collaboration with the public and our transportation partners and stakeholders, for the State's future transportation system - a safe, sustainable, world-class transportation system that improves our mobility and enhances our quality of life. The CTP offers a policy framework to guide future transportation decisions and investments that will ensure California's ability to compete globally, provide safe and effective mobility for all persons, better link transportation and land use decisions, improve air quality, and reduce petroleum energy consumption. The CTP is developed in consultation with the State's regional transportation planning agencies, is influenced by the regional planning process and provides guidance for developing regional transportation plans.
http://www.dot.ca.gov/hq/tpp/offices/osp/ctp.htm
14

There are many factors that affect how regions are making
progress on place, prosperity, and people indicators. The
role of this report is neither to present a comprehensive
explanation for regional performance, nor provide
projections about the future. Those are tasks for the
regions themselves in collaboration with state-level partners
and independent researchers. Changes can be shaped by
population growth and diversity, economic booms or
downturns, technological innovation, and other broad
forces. Changes can also be shaped by state policy and
investments in transportation, education, health, energy
and greenhouse gas emissions reduction and other areas,
as well as regional and local decisions in transportation,
land use and protection, and economic and workforce
development. And, change can be driven by the decisions
of individual Californians, as they respond to economic
opportunities, quality of life concerns, and the like. How
all these factors interact to create regional outcomes is an
exceedingly complex question, but one that would be
worth further attention by state and regional partners.
ORGANIZATION OF THE REPORT
Sections on Place, Prosperity, and People indicators follow. Each section is divided into indicator categories described in the summary table—such as efficient development, movement of people and goods, transportation choices, and the like. Within each category, we describe why this indicator is important and what progress regions are making on specific measures. We have included excerpts from regional reports (Regional Views) to illustrate how the regions themselves are interpreting their performance in specific areas. We have also included highlights of regional measures (Regional Highlights) that offer an innovative approach for potential replication and/or collection on a statewide basis. The final section of the report focuses on opportunities and implications that flow from the findings of the inaugural California Regional Progress Report.
California’s economy is not only continuing to innovate
and create quality jobs, but is now growing more in areas
closer to where workers live. A more efficient development
pattern helps create prosperity by preserving quality of life
in communities and fostering a healthy business climate,
helping to create more vital urban centers with a critical
mass of people, housing, businesses, and amenities. More
efficient land use is creating better regional mobility, which
in turn is improving productivity. An innovative economy
is producing jobs at every level. With ongoing progress
in education and training, more people are able to climb
onto career ladders, helping them increase their income
and ability to buy a home—as well as their contributions
to California’s continuing prosperity and community well-
being. Housing affordability improves as incomes rise
and a greater variety of more affordable homes close to
jobs are built.
The conversion of California’s agricultural lands to urban
uses is slowing dramatically since most new development
is now taking place in existing communities. The amount
of protected land continues to increase—both urban parks
and rural open space—as Californians actively preserve
the State’s environmental assets and diversity for themselves
and future generations.
LOOKING AHEAD
15

SJV NCSH NS NSVBUSA SSBA MB SLOSD SC SB
New Building Permits: Multi-Family vs. Single Family 18
18
21
22
25
25
27
28
28
29
29
31
31
32
35
36
37
37
Ratio of Jobs to Housing Units
Decrease in Vehicle Miles of Travel per Household
Decrease in Daily Vehicle Hours of Delay
Means of Transportation to Work
Increase in Transit Ridership
Decrease in Fuel Consumption
Residential Energy Consumption – Electricity
Residential Energy Consumption – Natural Gas
Non-residential Natural Gas Consumption
Non-residential Electricity Consumption
Conversion of Agricultural Lands to Urban/Built-up Uses
Protected Open Space
Ozone – Decrease in Days Exceeding 8-hour Standard
Decrease in Impaired Water Segments
Increase in Share of First-Time Buyers of Median Priced Home
Housing Renters with Costs Greater than 35% of Income
Housing Owners with Costs Greater than 35% of Income
11 1
2 2
Place indicators encompass both the natural and built environment. They focus on efficient use
of land, transportation infrastructure, and resources such as energy and water. They also include
measures of environmental quality—focusing on air and water. And, they include housing
affordability, which is closely linked to other place indicators. These indicators, while primarily
related to place, are also clearly linked to prosperity and people. Together, place, prosperity, and
people measures are reflective of important dimensions of California’s quality of life.
place
North Coast
Shasta
Northeast
Sierra
ButteSacra
mento Are
a
Southeast
Sierra
Bay Are
a
San Joaquin Valle
y
Montere
y Bay
San Luis
Obispo
San Diego
Southern
Californ
ia
No. Sacra
mento Valle
y
Santa B
arbara
PagePlace (environment)
Region Has Made Progress on This Measure
Region Has Not Made Progress on This Measure
No Data Available/Not Applicable
Efficient Development
Movement of People
and Goods
Transportation Choices
Resource Use
Protected Lands
Air & Water Quality
Housing
Affordability/Burden
Notes:
1- The Caltrans State Highway Congestion Monitoring Program groups San Luis Obispo, Monterey Bay Region, and Santa Barbara as one region.
2- The Water Quality Control Board's regions of Lahontan and Central Valley include data for both Northeast Sierra and Southeast Sierra.
16

EFFICIENT DEVELOPMENT
REGIONAL VIEW: San Diego Future Outcomes if Local Plans are Left Unchanged
Excerpt from: SANDAG, Regional Comprehensive Plan for the San Diego Region,
July 2004
“Reduced open space. Current plans would consume far more land than a smart growth development pattern, which would emphasize more redevelopment and infill in existing urbanized areas near transit and activity centers such as downtowns and shopping areas, and more mixed use and compact development in currently-vacant areas that are planned for residential uses.
More expensive housing and fewer types of housing choices. On average, current densities in the cities and urbanized unincorporated areas are relatively low, and planned densities on currently vacant land are even lower. This pattern limits our ability to address our projected housing needs, pushes up housing costs, and can result in more people sharing the same house due to high home prices and rents.
WHY ARE THESE INDICATORS IMPORTANT?By directing growth to already developed areas, local jurisdictions can create critical mass for transit, reinvest in existing neighborhoods, use transportation systems more efficiently, and preserve the character of adjacent rural communities. More efficient development means creating more housing and jobs on less land. One indicator of a shift in the direction of greater efficiency is the ratio of permits for new multi-family housing units compared to new single-family housing units. A greater ratio of multi-family units suggests a shift to more housing on fewer acres. Another measure of efficiency is the ratio of jobs to housing. An imbalance of jobs to housing likely means that some or many workers have to commute to the region from other regions.
Imbalance between housing and jobs. Jobs are a key driver of population growth. Current local general plans allow for more growth in jobs than housing. Additionally, local plans largely separate residential areas from job centers, which increase traffic.
Environmental degradation. An imbalance between jobs and housing leads to more and longer commutes, and increased energy consumption. It also affects development patterns within our watersheds which increases urban runoff, and in turn, affects the quality of both our drinking water and our water bodies, such as lakes, streams, bays, and the ocean.”
17

1 1.40 0.2 0.4 0.6 0.8 1.2
1 1.40 0.2 0.4 0.6 0.8 1.2
More Multi-Family PermitsMore Single-Family Permits
Source: Construction Industry Research Board, California Building Permit Date by Building Category, 1995 and 2006
1.0 1.30.9 1.1
More Jobs than HousingMore Housing than Jobs
1.2
Source: California Employment Development Department;U.S. Census Bureau, American Community Survey 2005
* Note: Does not include data for all counties within region
NCNorth Coast
SHShasta
NSNorteast Sierra
NSVNo. Sacramento Valley
BUButte
SASacramento Area
SSSoutheast Sierra
BABay Area
SJVSan Joaquin Valley
MBMonterey Bay
SLOSan Luis Obispo
SBSanta Barbara
SDSan Diego
SCSouthern California
New Building Permits: Multi Family vs. Single Family
For most regions, the 1995-2006 period has been one of progress. Although typically the number of multi-family units approved is much less than the number of units of single-family housing approved, most regions experienced a shift in the share of approvals towards more multi-family units. In fact, nine of the fourteen regions narrowed the gap between the number of multi-family unit permits and single-family unit permits issued. The other five regions experienced very slight changes, keeping their ratios roughly the same sine 1995.
Ratio of Jobs to Housing Units
Although only two regions (where data are available) experienced progress in their ratio of jobs to housing, most regions did not lose ground between 2000 and 2005. Most regions experienced very small changes, maintaining their ratios during the first half of the decade. The exceptions include the Bay Area, which experienced substantial job loss and drop in their jobs-housing ratio from 1.27 to 1.15. The Bay Area is now comparable to most other highly-populated regions of California. The other exception is the Sacramento region, whose ratio dropped from 1.17 to 1.13 over the 2000-2005 period. It is also important to note that two regions (where data are available) continued to produce more housing than jobs over this period—both the San Joaquin region and Monterey regions produced just over nine jobs for every ten housing units. Of course, some of these new housing units are being used by people who are commuting to other regions. This is creating challenges across regions, particularly the Bay Area.
Ratio of New Building PermitsMulti-Family Unit Permits to Single Family Unit Permits
1995 and 2006
2006
WHAT PROGRESS ARE REGIONS MAKING?
Ratio of Jobs to Housing Units2000 and 2005
SCSouthern California*
SDSan Diego
BABay Area
SBSanta Barbara
SASacramento Area*
SJVSan Joaquin Valley*
MBMonterey Bay*
1995
20052000
18

The Silicon Valley Land Use Survey has given the region a unique perspective on its changing land use patterns. Beginning in 1998, Joint Venture: Silicon Valley began to survey its 23 jurisdictions on specific land use changes not otherwise available through other data sources. The survey is conducted annually, with results reported every year in the Index of Silicon Valley. It has measured the average units per acre of newly approved residential development—which has now risen to more than 22 units per acre, over three times the density of approved development in 1998.
Just as important, the survey has monitored progress towards a shared regional goal of targeting new development close to transit. As a result, the region has been able to monitor the percentage of both residential and commercial development within 1/4 mile of a rail station or major bus corridor—which has ranged from about 30% to more than 60% of the total since 1998.
For more information, see www.jointventure.org
More Multi-Family Permits
Re
gi
on
al
H
ig
hl
ig
ht
Re
gi
on
al
H
ig
hl
ig
ht
Silicon Valley’s Land Use Survey
Defining Smart Growth Areas in San Diego, the Bay Area and Southern California
emphasizing infill development within existing communities, and thereby preserving the region’s open space. For more information, see www.abag.ca.gov or www.mtc.ca.gov
In the 6-county Southern California region they are referred to as "2% Strategy Growth Opportunity Areas" which are existing and emerging centers and corridors targeted for more intensive growth. By utilizing the existing and planned transportationinfrastructure capacity to channel future growth, this strategy will reduce travel demand, increase transit ridership, promote walkable vibrant communities, and sustain the environment for future generations. Currently, dozens of local/regional planning partnerships are underway that demon-strate the benefits of this integrated growth strategy. For more information, see www.scag.ca.gov
The Blueprint Projects in the San Diego, Bay Area and Southern California regions have defined smart growth areas to target development, and measure progress:
San Diego calls them “Smart Growth Opportunity Areas,” which are places “that accommodate, or have the potential to accommodate higher residential and/or employment densities near public transit.” These areas provide a rationale for targeting transportation and other public investments and incentives. Nearly 200 areas have been designated, representing 15% of all housing units in the region and nearly 33% of all new housing units in 2005. For more information, see www.sandag.org
The Bay Area calls them “Priority Development Areas,” which are areas around transit stations and along major developed corridors. The goal is to capitalize on existing infrastructure to reduce travel demand,
REGIONAL VIEW: San Luis Obispo Housing Density
Excerpt from: San Luis Obispo Regional Profile, Census, 2004
“The most important finding demonstrated by the data (page 19) is the increasing dominance of the single-family, detached housing unit production. Between 1999 and 2003, the single family detached unit increased from 63% to 65% of the county housing stock…most planning professionals agree that more work needs to occur to provide a greater mix of housing opportunities, including multi-unit developments, apartment complexes, condominiums and other housing types as higher densities that are typically more affordable, and which consume less land and resources.”
19

REGIONAL VIEW: Sacramento Land Use, Job Centers, Trips, and Congestion
Excerpt from: SACOG, 2006 Metropolitan Transportation Plan
“Today the [Sacramento region] has evolved in ways unforeseen even ten years ago. The population, 2.1 million in 2005, has spread out to bring Elk Grove, Roseville, Rocklin, and Folsom into the urban area. Rancho Cordova has emerged as a second job center rivaling downtown Sacramento, and Roseville is not far behind. Two-worker households have become the norm, with extensive commuting from one community to another. Low-density suburban patterns mean people travel overwhelmingly by automobile. The radial transportation system no longer serves the region’s needs well. The U.S. 50 freeway serves as the region’s core corridor, carrying a full load of traffic in both directions both morning and afternoon, and increasingly at midday as well. Intermittent congestion is now widespread, since the spare capacity once built into the system has been consumed by growth, with little new capacity added since 1980.”
REGIONAL VIEW: Sacramento A More Complete Picture of Travel Patterns
Excerpt from: Valley Vision, 2004 Quality of Life report
“We know household travel includes both the trip to work as well as other non-work trips to shuttle children to school or day care, shop, run errands, and other purposes. The Sacramento region developed a measure of both work and non-work related travel trips based on data collected in a household travel survey. The findings? 85% of total trips were non-work related—with an increasing share of these trips done by people driving alone. These trips are big contributors to traffic congestion in the region.” For more information, seewww.valleyvision.org/work/publications/index.html
WHY ARE THESE INDICATORS IMPORTANT?Vehicle miles of travel (VMT) measures the total number of vehicular travel miles in each region on an average day, generated by trips originating within and outside of the region. As explained in the Caltrans 2006 California Motor Vehicle Stock, Travel, and Fuel Forecast, “VMT are key data for highway planning and management, and a common measure of roadway use. Along with other data, VMT are often used in estimating congestion, air quality, and potential gas-tax revenues, and can provide a general measure of the level of the region’s economic activity.” Vehicle miles of travel is also an important indicator of how our development patterns impact the volume of driving we need to do to go to work, take children to school, shop, run errands, and the like. Higher vehicle miles of travel over time suggest that concentrations of jobs, housing, schools, shopping, etc., are further from one another or more likely to require an automobile to travel between them instead of using other options (like walking, biking, or public transit).
Sources of VMT generated by trips originating outside of a region include goods movement along major transportation corridors, business and tourism-related travel, and commuting across regions. It is important to note that VMT is not measured in actual counts but is a derived estimate. Models indicate that VMT tracks strongly with income; strong economic growth leads to projected increases in VMT.
Daily vehicle hours of delay is a measure of traffic congestion. Caltrans measures Daily Vehicle Hours of Delay (DVHD) by district, rather than county; there is therefore some overlap in the data between Monterey, San Luis Obispo and Santa Barbara. Traffic delay produces economic, social, and environmental costs. It impacts worker and goods-movement productivity, as well as family time and air pollution. It is an important measure of the interplay among development patterns, transportation infrastructure, and use of travel modes other than single-occupancy vehicles.
MOVEMENT OF PEOPLE AND GOODSWHAT PROGRESS ARE REGIONS MAKING?Vehicle Miles of Travel
Between 1990 and 2000, there was a broad-based increase in vehicle miles of travel per household throughout every region of California. However, between 2000 and 2005, all but two regions made progress on this measure. Almost half of the regions actually cut their VMT per household during this period—including Butte County (down 14%), Northeast Sierra (5%), Bay Area (2%), Monterey region (2%), Southeast Sierra (1%), and Santa Barbara (1%). Three regions experienced very small change during this period (i.e., Sacramento, San Luis Obispo, and North Coast). In each case, these numbers represented a drop in the percentage gain from the 1990-2000 period. Southern California, San Diego, and San Joaquin continued to increase their VMT per household between 2000 and 2005, but did so at a lower rate than in the previous decade.
20

Work Trips1991
Work Trips2000
Non-Work Trips1991
Non-Work Trips2000
Work Trips1991
Work Trips2000
Non-Work Trips1991
Non-Work Trips2000
100%
0%
80%
60%
40%
20%
100%
0%
80%
60%
40%
20%
Drive Alone
Car/Van Pool
Public Transit
Bicycle
Walk
Other
0% 25%-20% -15% -10% -5% 5% 10%
Source: California Department of Finance, Population and Housing Estimates, 1990, 1995, 2000, 2005;Caltrans, 2006 California Motor Vehicle Stock, Travel and Fuel Forecast
15% 20%
0% 25%-20% -15% -10% -5% 5% 10% 15% 20%
By Travel Mode
SASacramento Area
MBMonterey Bay
SHShasta
SSSoutheast Sierra
NSVNo. Sacramento Valley
NCNorth Coast
NSNortheast Sierra
BUButte
BABay Area
SJVSan Joaquin Valley
SLOSan Luis Obispo
SBSanta Barbara
SDSan Diego
SCSouthern California
Vehicle Miles of Travel per HouseholdPercent Change
1990-2000 and 2000-2005
1990-20002000-2005
Work and Non-Work TripsSacramento
1991 and 2000
21

180,000
160,000
140,000
120,000
100,000
01998 1999 2000 2001 2002 2003 2004
* Note: Regional values are an average of the counties
Source: Caltrans, 2004 State Highway Congestion Monitoring Program Report
80,000
60,000
40,000
20,000
Vehicle Hours of Delay
Between 1998 and 2004 (the latest period for which data are available on an annual basis), every Caltrans district reporting daily vehicle hours of delay recorded increases on this measure. At the same time, the trends have varied between the early and later years of this time period. For example, the Bay Area experienced a rapid increase between 1998 and 2000, then a rapid drop from 2000 to 2003, then a leveling off in 2004. This region was most affected by the economic downturn during this period. At the end of the turbulent period, vehicle hours of delay was still higher than in 1998, but by only 11%.
MOVEMENT OF PEOPLE AND GOODSContinued
In some cases, patterns of delay have also varied within broader regions. A closer look at the Southern California region finds that delays grew in Los Angeles and Ventura Counties, as well as Orange County, but dropped slightly in Riverside and San Bernardino Counties between 1998 and 2004. More recently, however, the hours of delay have leveled off or decreased in all parts of the region except Orange County.
Daily Vehicle Hours of Delay1998-2004
District 8: Riverside, San Bernardino
District 11: San Diego
District 12: Orange
District 4: Alameda,Contra Costa, Marin,San Francisco, San MateoSanta Clara, Solano, Sonoma
District 3: El Dorado, Placer, Sacramento
District 5: Monterey,San Luis Obispo, Santa Cruz, Santa Barbara
District 10: San Joaquin,Stanislaus
District 6: Fresno, Kern
District 7:Los Angeles, Ventura
Explanation of Data Variation in the State Highway Congestion Monitoring Program (HICOMP)
In response to concerns that some of the data reported in the HICOMP 2004 Report was lower than expected or anticipated, Caltrans prepared an explanation that addresses both economic and technical factors. While no one answer will accurately cover all variables or circumstances, there are a few general conclusions that will help interpret the data.
First, there are two general methods of monitoring congested traffic in California: probe vehicles and automated detection. Probe vehicles involve a vehicle traveling a length of the freeway (one lane) that measures the speed and length of time required to cover the measured segment. Automated detection used embedded loops in the roadway that render an accurate measure for volume and speed in all lanes of travel at all times for one point in the freeway. Both methods have limitations. Comparison studies show that automated detection
generally renders lower congestion results than probe vehicles. Regions and highways use varying levels and/or combinations of one or both methods. In addition, the freeway segments monitored do not remain static over time and thus some data variation is inevitable.
Second, there are external causes for congestion variation. As the price of fuel increases, there may be a decrease in vehicle miles traveled as people try to combine multiple purposes into fewer trips, or use transit options. Sometimes capacity increasing (congestion relief ) projects are completed that may have an impact on congestion levels. Economic factors may impact the number of vehicles on the highways, such as occurred with the “dot com” down turn in the Bay Area from December 2000 through December 2004, with a loss of approximately 500,000 jobs. Employment growth in Los Angeles County during 2003-2004 was well below earlier average rates as well.
Source: Division of Transportation Planning, Office of Transportation Economics, and Office of Systems Management Planning, Caltrans, May 2007. For additional detail see links in the Data Appendix.
22

REGIONAL VIEW: Bay Area Infrastructure
Excerpts from: The Innovation Economy: Protecting the Talent Advantage, Bay Area Economic Profile, February 2006, ABAG, Bay Area Council and Bay Area Economic Forum.
Transit-Oriented Development – New Places, New Choices in the San Francisco Bay Area, November 2006, ABAG, MTC, Bay Area Air Quality Management District and Bay Area Conservation and Development
“Peak travel times in the Bay Area have risen significantly, and local commuters sacrifice more time to the road than those in any of our comparable cities except Los Angeles. According to MTC estimates, congestion cost the Bay Area more than $3 billion in wasted fuel and time in 2003.
The cause is not just growing population. As people move further away to find affordable housing and better schools, the number of commuters and the length of their driving times rise. The flow of commercial goods is also increasing, intensifying congestion as trucks compete with cars for limited highway space.”
“...already Bay Area households located close to transit stations make fewer driving trips than do others in the region. Households within a half-mile of train stations and ferry stops log only 20 vehicle miles of travel per day, just 56% of the regional average.”
REGIONAL VIEW: Southern California Traffic Congestion
Excerpt from: SCAG, 2006 State of the Region
“For the past two decades, Southern California has been consistently experiencing very high levels of congestion. Contributing factors include large population and physical extent of the region, rapid population growth, high automobile dependence, low levels of transit usage, and a maturing regional highway system with limited options for expansion. In addition, over 40% of all U.S. imports passing through the Ports of Los Angeles and Long Beach. As the nation's predominate gateway region with respect to the Pacific Rim, Southern California has incurred a heavy price in congestion and the associated air pollution.
It should be note that over the years the SCAG region has developed the most extensive High-Occupancy Vehicle (HOV) system in the nation. In 2005, Southern California continued to achieve the highest carpool share of 13% for journey to work among the largest metropolitan regions in the nation. The region’s bus rapid transit system has become a model for the nation.”
23

WHY ARE THESE INDICATORS IMPORTANT?The modes of transportation we use to access work, other people, goods, and services, impact the quality of our air and the region’s transportation infrastructure. By utilizing alternative modes of transportation, such as public transit and walking, residents can reduce their ecological footprint. Increases in the use of alternatives to driving alone can reflect the rising cost of automobile commuting, but also more accessible transit service, shorter distances between work and home, more efficient land use patterns overall, and other factors that are giving Californians more realistic transportation choices.
WHAT PROGRESS ARE REGIONS MAKING?Commute Mode Shares
Most commuters in most regions travel to work alone by car. Commuting to work is, of course, only part of the picture. Non-work trips for errands and other reasons can constitute a large percentage of total travel (see example from the Sacramento region on pg. 21). Nonetheless, data are most complete on the commute to work, and so is chosen as a measure of transportation choices in this Report.
Since 2000, the only region to see genuine progress on this measure is Santa Barbara. The percentage of commuters driving alone dropped almost 7%, with increases spread among public transportation (up 2.1%), working at home (1.8%), car pool (1.5%) and other means such as biking or walking (1.2%). Although other regions did not make progress overall, they did experience shifts in commute modes. In fact, in every region but one for which data are available, the percentage of people working from home increased between 2000 and 2005, undoubtedly due in part to the wider accessibility to the internet (and, more recently, broadband access).
TRANSPORTATION CHOICESTransit Ridership
Transit ridership is a function of many factors, including improved accessibility, expanded services, reductions in service due to public funding cuts, and changes in the economy. In half of the regions, transit ridership increased between 1999 and 2004. These regions included large increases for some heavily populated areas (i.e., Sacramento was up 19%) and some sparsely-populated places (i.e., Southeast Sierra was up 62%). For example, the Bay Area experienced a decrease in the absolute numbers of transit riders as the region went through a period of serious job loss, but also experienced an increase in the proportion of commuters using transit.
At the same time, in regions where data are available, increases in transit ridership did not produce shifts in the share of commuters using public transportation. Increases in share of people driving alone overcame increases in transit ridership. For example, in Sacramento region, transit ridership rose 19%, but the share of commuters using public transit declined and the share driving alone increased. Santa Barbara was an exception: transit ridership grew 7% and the share of commuters using public transportation also increased by 2.1%.
REGIONAL VIEW: Santa BarbaraTransportation Initiatives in Response to Jobs-Housing Imbalance
“High housing costs and continued employment growth in the South Coast subregion of Santa Barbara County have resulted in longer commutes and increasing traffic congestion, particularly on the 101 freeway between Ventura and Santa Barbara. SBCAG and its partners have responded to the challenge of this jobs/housing imbalance by initiating regional and interregional transportation improvements to reduce demand, increase commuter options and promote alternatives to single occupant vehicle, rush hour commuting. SBCAG has worked with its neighbor to the south, Ventura County Transportation Commission, in establishing the Coastal Express, an interregional commuter bus service operating between Ventura and Goleta. This service builds upon the success of the Clean Air Express, a commuter bus service that runs from more affordable residential centers in Lompoc and Santa Maria to job centers in Goleta and Santa Barbara. As gasoline prices climbed over the past year this increase in ridership on regional bus services
was accompanied by increase in local bus ridership, particularly in Santa Barbara and Santa Maria. The latest commute surveys indicate that these programs have resulted in a reduction in the percentage of single occupant vehicle trips and an across the board modest increase in use of other modes such as carpool, transit, and telecommuting. The region's plans call for continued expansion of commute options through the addition of HOV lanes on 101, initiation of commuter rail service, and working with employers and commuters to reduce peak hour travel through flexible work schedules and telecommuting. ”For more information check out “101 In Motion” and “FlexWork” programs at www.sbcag.org.
Santa Barbara County Association of Governments
24

Car, Truck, or Van;
Drove Alone
Car, Truck, or Van;
Carpooled
WorkedAt
Home
PublicTrans.
(excl. Taxi)
Taxi, MotorcycleBicycle, Walkedor Other Means
0% 70%-30% -20% -10% 10% 30% 50%
Source: Transit Operators and Non-Transit Claimants Annual Report 1999-2000 and 2004-2005
20% 40% 60%
0% 70%-30% -20% -10% 10% 30% 50%20% 40% 60%* Note: Does not include data for
all counties within region
-6.7%
-0.7%
-0.2%
0.6%
1.7%
1.7%
7.7%
1.5%
0.9%
-.03%
-0.1%
-1.7%
-1.9%
-8.2%
1.8%
0.6%
1.0%
1.1%
0.4%
0.7%
-1.0%
2.1%
-0.4%
-0.3%
-0.4%
-0.3%
-1.1%
1.2%
1.2%
-0.3%
-0.2%
-1.2%
-0.2%
0.5%
0.2%Source: American Community Survey
* Note: Does not include data for all counties within region
SB
SJV
SA
BA
MB
SD
SC
SJVSan Joaquin Valley
NSVNo. Sacramento Valley
SSSoutheast Sierra*
NCNorth Coast*
BUButte
SHShasta
NSNortheast Sierra
SASacramento Area*
BABay Area
MBMonterey Bay*
SLOSan Luis Obispo
SBSanta Barbara
SDSan Diego
SCSouthern California
Transit RidershipPercent Change in Total Annual Passengers:
Motor Bus, Bus Rapid, Street Car, Trolley Bus, Ferry Boat, Demand Response Vehicle, and other1999-2004
Commute: Means of TransportationPercent Difference: 2005 from 2000
San Joaquin Valley*
Sacramento Area*
Bay Area*
Monterey Bay*
Santa Barbara
San Diego
Southern California
25

WHY ARE THESE INDICATORS IMPORTANT?Resources are needed to run California’s communities and economies. Gasoline and diesel fuel consumption are fundamental resources, especially for transportation and goods movement. Fuel consumption creates economic benefits, but also creates financial costs for industry and households, and is producing greenhouse gases that are having far-reaching climate effects worldwide. How resources like energy (natural gas and electricity) are used indicate if regions are becomming more efficient, generating cost savings and preserving environmental resources. Greater efficiencies will allow for continued growth of the economy.
RESOURCE USEWHAT PROGRESS ARE REGIONS MAKING?Fuel Consumption: Diesel and Gasoline
In 2006, every region but one recorded higher consumption levels of both diesel and gasoline on public roadways than in 2000. In fact, six regions consumed 10% or more fuel than six years earlier. In most regions, fuel consumption rose faster than vehicle miles traveled per household. While several regions made progress on VMT per household, they did not reduce overall fuel consumption due to population increases, more volume of less fuel-efficient trucks and/or automobiles, or other reasons.
It is important to note that some regions are more substantial goods movement corridors than others. These regions typically have a larger share of inter-regional truck traffic as a proportion of total vehicles on public roadways. Specifically, between 10-20% of total vehicle miles of travel in these regions are from truck traffic compared to about 5-10% in other regions. Regions with additional truck traffic likely experience some effect on fuel consumption, although data on that estimated impact is not available.
REGIONAL VIEW: Southern California and Beyond Global Warming
Excerpt from: SCAG, The State of the Region, 2006
“Global Warming poses a serious threat to the economic well-being, public health, and natural environment in Southern California and beyond. The potential adverse impacts of global warming include, among others, a reduction in the quantity and quality of water supply, a rise in sea levels, damage to marine and other ecosystems, and an increase in the incidents of infectious diseases. Over the past few decades, energy intensity of the national and state economy has been declining due to the shift to a more service-oriented economy. California ranked fifth lowest among the states in CO2 emissions from fossil fuel consumption per unit of Gross State Product. However, in terms of total
CO2 emissions, California is second only to Texas in the nation and is the 12th largest source of climate change emissions in the world, exceeding most nations. The SCAG region, with close to half of the state’s population and economic activities, could be an important contributor to the global warming solution. Toward this end, SCAG has been developing regional energy policies and implementation actions through its Energy Working Group and the upcoming Regional Comprehensive Plan collaborating with a broad range of stakeholders.” For more information, please see www.scag.ca.gov/rcp/ewg/index.htm
26

0% 25%-10% -5% 5% 10% 15% 20%
Source: Caltrans, 2006 California Motor Vehicle Stock, Travel and Fuel Forecast
0% 25%-10% -5% 5% 10% 15% 20%
NSNortheast Sierra
SLOSan Luis Obispo
SCSouthern California
NSVNo. Sacramento Valley
SSSoutheast Sierra
BABay Area
SJVSan Joaquin Valley
NCNorth Coast
SHShasta
BUButte
SASacramento Area
MBMonterey Bay
SBSanta Barbara
SDSan Diego
Fuel ConsumptionPercent Change in Gasoline and Diesel Consumption
2000-2006
27

0% 12%-12% -10% -8% -6% -4% 2%
Source: California Energy Commission; California Department of Finance, Population and Housing Estimates
-2% 4% 6% 8% 10%
* Note: Does not include data for all counties within region
0% 12%-12% -10% -8% -6% -4% 2%-2% 4% 6% 8% 10%
NCNorth Coast*
SHShasta
NSNortheast Sierra*
NSVNo. Sacramento Valley
BUButte
SASacramento Area
SSSoutheast Sierra *
BABay Area
SJVSan Joaquin Valley
MBMonterey Bay
SLOSan Luis Obispo
SBSanta Barbara
SDSan Diego
SCSouthern California
Residential Energy ConsumptionElectricity and Natural Gas Consumption per Household
2001–2005
Electricity ConsumptionPercent Change in Million kWh
Natural Gas ConsumptionPercent Change in Million Therms
Natural Gas and Electricity
Between 2001 and 2005, every region reduced its residential con-sumption of energy from natural gas by 2% and 12%. Twelve regions also reduced total commercial, industrial, and agricultural consumption of natural gas. Upon closer examination, most regions experienced decreases in natural gas consumption in their industry sector and increases in their commercial sector. Regions were about evenly split in terms of increases and decreases in their agricultural sectors.
ENERGY CONSUMPTION
28

0% 40%-20% -10% 10% 20% 30%
Source: California Energy Commission
0% 120%-90% -60% -30% 60%30% 90%
Source: California Energy Commission
0% 40%-20% -10% 10% 20% 30%0% 120%-90% -60% -30% 60%30% 90%
Natural Gas ConsumptionBY CONSUMER CLASS
Industrial, Commercial, Agriculture & Water PumpingPercent Change in Million Therms; 2001-2005
CommercialIndustrial
Agriculture & Water Pumping
At the same, only one region made progress in reducing electricity use in their residential sector. Every region experienced increases in its commercial sector. While most regions experienced gains in other non-residential sectors as well, some areas’ industrial and/or agricultural sectors did cut their electricity use between 2001 and 2005.
Electricity ConsumptionBY CONSUMER CLASS
Industrial, Commercial, Agriculture & Water PumpingPercent Change in Million kWh; 2001-2005
NC
SH
NS
NSV
BU
SA
SS
BA
SJV
MB
SLO
SB
SD
SC
29

PROTECTED LANDSConversion of Agricultural Lands to Urban and Built-Up Uses
All regions continue to convert agricultural lands to urban and built-up uses. Although the rates of conversion are beginning to slow in some regions, the total amount of land being converted is still larger in the 2002-2004 cycle than the 1996-1998 cycle, especially in San Joaquin Valley, Southern California, and the Sacramento Area. Between 1996 and 2004, four regions cut their rate of agricultural land conversion—including the Bay Area (down 1%), Monterey Bay (65%), and the North Coast (99%). The regions cited with high growth rates but small absolute numbers are in the path of urbanization, both urban in-migration and second home development.
Protected Open Space
Seven regions increased their percentage of acreage in protected status between 2003 and 2005—including Northeast Sierra (15%), San Luis Obispo (5%), San Diego (2%). For this measure, protected open space was grouped into three different categories: State, Federal (not including Department of Defense), and Regional/Local. In most regions, federally owned land makes up the largest percentage of protected open space.
WHY ARE THESE INDICATORS IMPORTANT?Land preservation is an indicator of how a region is absorbing population and economic growth. An important measure showing change is land conversion. In particular, the conversion of agricultural land to urban and other built-up uses reflects a reliance on development into new land rather than filling in or reusing land in existing urban areas. Agricultural land is a unique and limited resource for most regions, offering many benefits including food production, exports, habitat, natural landscapes, and heritage. Yet, a combination of competitive pressure and economic opportunity can make agricultural land susceptible to development. Slowing the rate of conversion is a measure of progress.
Converting land from unprotected to protected status is another important indicator of progress. Preserving open space protects natural habitats, provides recreational opportunities, focuses development, and maintains the visual appeal of regions. Protected lands include habitat and wildlife preserves, waterways, agricultural lands, flood control properties, and parks. Although not measured in this report, the development of urban green infrastructure is an important element for creating livable cities and for supporting more compact urban development.
REGIONAL VIEW: Bay Area Open Space/Protected Lands
Excerpt from: At Risk: The Bay Area Greenbelt 2006 Edition. Greenbelt Alliance 2006
“Permanently protected acreage is now more than one-quarter of all non-urbanized land in the Bay Area, and more than one-fifth of all land.”
“…the remaining high-risk regional sprawl hot spots are predominantly at the outer edges of the region. These are places where land prices are lower and where growth pressures from the Bay Area overlap with those of the Sacramento, Santa Cruz and Central Valley regions.”
REGIONAL VIEW: Central Valley Urbanization
Excerpt from: Rural Economic and Health Vitality Policy Agenda Report, CCRL 2007
“Land use trends including high rates of farmland
urbanization in the Central Valley are [a] great concern.
High quality farmlands are being disproportionately
affected by city-oriented growth and development, with
implications for the viability of agriculture, one of the
State’s most important industries. Rural ranchette
development, a fast spreading form of sprawl across
many regions, is also consuming large amounts of land.
These low density single use patterns of urbanizing
land are inconsistent with general planning policy goals
to preserve valuable farmlands and open space/habitat,
reduce sprawl and traffic congestion, improve air quality,
and create more livable communities.”
REGIONAL VIEW: Sierra Housing and Land Use Conditions
Excerpt from: State of Sierra Agriculture – An Assessment of Working Landscapes in the Sierra Nevada, Sierra Business Council
“Numerous factors – population growth, land use change and development patterns – affect agricultural lands throughout the Sierra… Currently, nearly 70 percent of Sierra Nevada’s population resides along the western foothills and the population in these counties is expected to grow by 50-100 percent by 2020. The increasing population requires homes, businesses and schools for the new residents. All these people and businesses require land. Frequently, the most economically and easily accessible lands for development are agricultural lands. Less efficient land use development patterns through ranchette, second homes and leapfrog development increase land consumption of agricultural lands.”
30

40,000
35,000
30,000
25,000
20,000
15,000
10,000
5,000
0
+30%
+73%
+93%
-1%
+42%
+62%
+715%
+725%
+317%
+261%-65%
+491%+200%
-99%
* * * *
SH
NC
NS
NSV
BU
SA
BASJV
SS
+715%
-99%
+725%
+200%
+491%
+261%
+42%
MB
SLO
SB
SC
SD
+317%
+93%
+73%
+62%
+30%
-1%
-65%
SC SH NCNS NSV BUSA BASJV SSMB SLOSBSD
* Note: Does not include data for all counties within region
Source: California Department of Conservation, State Farmland Mapping and Monitoring Program
Source: California Department of Conservation, State Farmland Mapping and Monitoring Program
WHAT PROGRESS ARE REGIONS MAKING?
Protected Open SpacePercent Change in Acreage; 2003–2005
Conversion of Agricultural Lands to Urban and Built-up UsesAcreage and Percent Change: 1996–1998 and 2002–2004
2002-2004
1996-1998
Agricultural LandsPercent Change in Acres of Agricultural Land Converted to Urban and Built-up Uses; 1996–2004
North Coast
Shasta Region
Northeast Sierra
Northern Sacramento Valley
Butte
Sacramento Area
Southeast SierraBay Area
San joaquin Valley
Monterey Bay
San Luis Obispo
Santa Barbara
San Diego
Southern California
Source: Public and Conservation Trust Lands, 2003 and 2005
SH
NC
NS
NSV
BU
SA
BASJV
SS
-1.5%
+15.2%
+0.3%-0.1%
-0.2%-2.9%
0.0%
+0.3%
+0.1%+0.2%
+4.9%
-0.1%-5.0%
+1.9%
MB
SLO
SB
SC
SD
Northern Sacramento Valley
San joaquin Valley
Monterey Bay
San Luis Obispo
Santa Barbara
San Diego
Southern California
North Coast
Shasta Region
Northeast Sierra
Butte
Sacramento Area
Southeast SierraBay Area
31
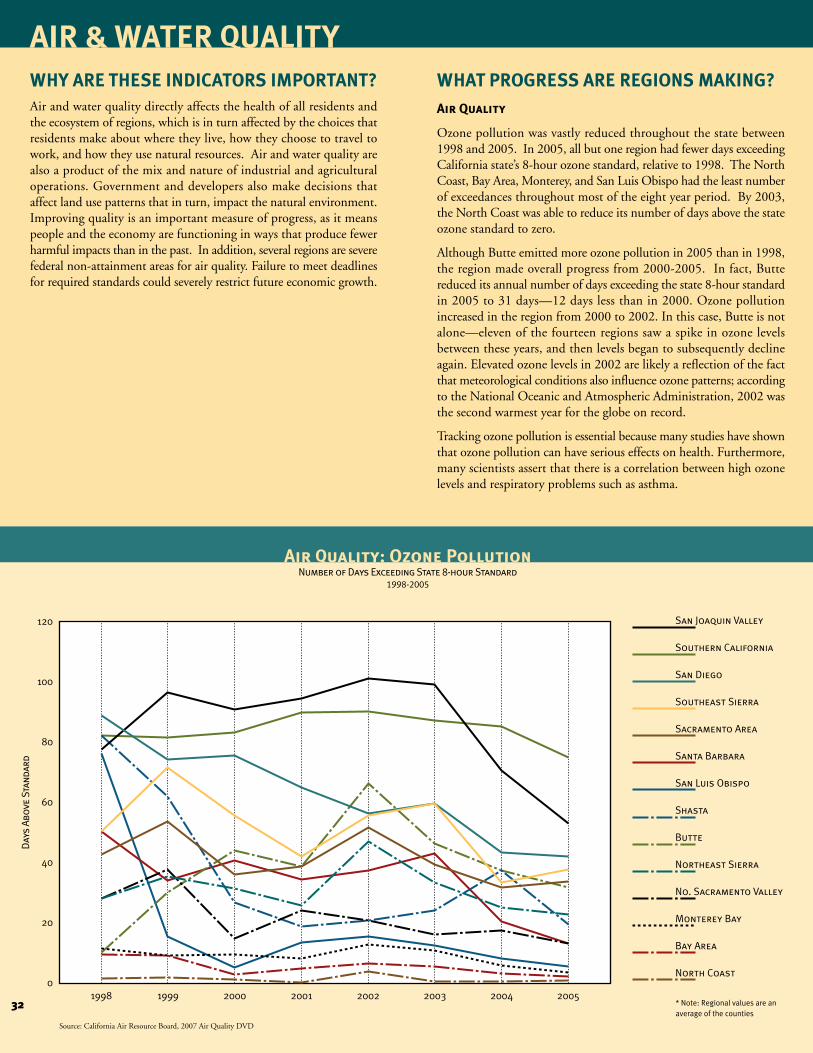
120
100
80
60
40
20
01998 1999 2000 2001 2002 2003 2004 2005
* Note: Regional values are an average of the counties
Source: California Air Resource Board, 2007 Air Quality DVD
AIR & WATER QUALITYWHY ARE THESE INDICATORS IMPORTANT?Air and water quality directly affects the health of all residents and the ecosystem of regions, which is in turn affected by the choices that residents make about where they live, how they choose to travel to work, and how they use natural resources. Air and water quality are also a product of the mix and nature of industrial and agricultural operations. Government and developers also make decisions that affect land use patterns that in turn, impact the natural environment. Improving quality is an important measure of progress, as it means people and the economy are functioning in ways that produce fewer harmful impacts than in the past. In addition, several regions are severe federal non-attainment areas for air quality. Failure to meet deadlines for required standards could severely restrict future economic growth.
WHAT PROGRESS ARE REGIONS MAKING?Air Quality
Ozone pollution was vastly reduced throughout the state between 1998 and 2005. In 2005, all but one region had fewer days exceeding California state’s 8-hour ozone standard, relative to 1998. The North Coast, Bay Area, Monterey, and San Luis Obispo had the least number of exceedances throughout most of the eight year period. By 2003, the North Coast was able to reduce its number of days above the state ozone standard to zero.
Although Butte emitted more ozone pollution in 2005 than in 1998, the region made overall progress from 2000-2005. In fact, Butte reduced its annual number of days exceeding the state 8-hour standard in 2005 to 31 days—12 days less than in 2000. Ozone pollution increased in the region from 2000 to 2002. In this case, Butte is not alone—eleven of the fourteen regions saw a spike in ozone levels between these years, and then levels began to subsequently decline again. Elevated ozone levels in 2002 are likely a reflection of the fact that meteorological conditions also influence ozone patterns; according to the National Oceanic and Atmospheric Administration, 2002 was the second warmest year for the globe on record.
Tracking ozone pollution is essential because many studies have shown that ozone pollution can have serious effects on health. Furthermore, many scientists assert that there is a correlation between high ozone levels and respiratory problems such as asthma.
Air Quality: Ozone PollutionNumber of Days Exceeding State 8-hour Standard
1998-2005
No. Sacramento Valley
Southeast Sierra
Southern California
San Joaquin Valley
Bay Area
North Coast
Shasta
Northeast Sierra
Butte
Sacramento Area
Monterey Bay
San Luis Obispo
Santa Barbara
San Diego
Day
s Ab
ove
Stan
dard
32

0% 200%-100% -50% 50%
Source: California Air Resources Board, 2007 Air Quality Data DVD
Air Quality DecreasingAir Quality Improving
100% 150%
0% 200%-100% -50% 50% 100% 150%
NSVNo. Sacramento Valley
SSSoutheast Sierra
SCSouthern California
SJVSan Joaquin Valley
BABay Area
NCNorth Coast
SHShasta
NSNortheast Sierra
BUButte
SASacramento Area
MBMonterey Bay
SLOSan Luis Obispo
SBSanta Barbara
SDSan Diego
Air Quality: Ozone PollutionPercent Change in Number of Days Exceeding State 8-hour Standard
1998-2005
REGIONAL VIEW: Southern California Air Quality
Excerpt from: SCAG State of the Region, 2006
“Air pollution consistently ranks high among public concerns in Southern California, and control efforts have been a high priority in recent decades. A recent study by the California Air Resources Board (CARB) found that the population-weighted exposure to concentrations of PM2.5 above the federal standards for residents of the South Coast Air Basin (within the Southern California Region) is an astonishing 82% of the statewide exposure and 52% of the national exposure. This exposure translates on an annual basis to 5,400 premature deaths. An important contributing factor is the significant increase in goods movements in the Southern California Region during the past decade. It is important to note that about 80 percent of the PM2.5 pollutant emissions are out of the local control but under control of the state and federal jurisdictions. SCAG has been working closely with the local air districts and the California Air Resources Board on strategic actions, including legislations at the state and federal levels, to address this air quality health crisis.”
REGIONAL VIEW: Central Valley Particulate Matter
Excerpt from: The Great Valley Center, Assessing the Region via Indicators: The Environment, 2005
“Every Central Valley county and the majority of the state continues to be in non-attainment of PM10 and PM2.5 standards. Since 2000, an estimated 6 tons of PM10 per day have been added to both the Sacramento and San Joaquin Valley Air Basins… The Sacramento Valley Air Basin has had some positive gains in reducing exceedance days. In 2000, the Air Basin had 81 calculated days about the state’s 24-hour standard. In 2003, the number dropped to 66. The San Joaquin Valley Air Basin has also seen some positive gains…in 2000, the Air Basin had 195.6 calculated days above the state’s 24-hour standard. In 2003, the number had dropped to 167.2.”
Even though there has been a broad-based reduction in ozone pollution throughout California, measuring overall air quality is more difficult. While ozone is a significant contributor to unhealthy air quality, there are various other pollutants, such as particulate matters (PM2.5 and PM10), that are also contributing factors. PM pollution refers to microscopic soot-like particles produced by power plant emissions, diesel exhausts, construction, wind-blown dust, vehicles, fires and other sources. When inhaled, particulate matter can lodge deep in lung tissue and cause severe health problems. Because annual PM2.5 and PM10 data are available by air basin rather than by county, ozone pollution is included as a measure in this report to show one important dimension of air quality. Most regions are generally not making as much progress in reducing PM10 emissions. Only four air basins monitored by the California Air Resources Board show a clear long-term positive trend in reducing the number of days above state PM10 emission standards. These basins include: Great Basin Valleys Air Basin, Mountain Counties Air Basin, Mojave Desert Air Basin, and Sacramento Valley Air Basin.
33

AIR & WATER QUALITYContinued
Water Quality
When looking at the number of impaired water segments in 2002 and 2006, the overall state trend in water quality has been mixed: about half of the regions have made progress in improving their water quality. Polluted water-bodies throughout California include bays and harbors, coastal shorelines, estuaries, lakes/reservoirs, rivers/streams, saline lakes, tidal wetlands, and freshwater wetlands. Urbanization is one of the factors that directly impacts water quality; urban water runoff from roads and parking lots contain high levels of contaminants which can flow directly into streams. Runoff and other problems are exacerbated by aging infrastructure.
For this dataset, there are a few notable differences in the regional definitions in comparison to the regional definitions used in this Report: both Northeast Sierra and Southeast Sierra are included in Lahontan and Central Valley. This difference is due to the way in which the California State Water Resources Control Board groups data. They do so by predetermined regions rather than counties.
The water quality in the Bay Area, North Coast, Northeast Sierra, Southeast Sierra, and the Sacramento Area is improving, as these regions had fewer impaired water segments in 2006 than in 2002. The success of improving water quality in the Lahontan region can be attributed to the reduction of impaired lakes/reservoirs, and rivers/streams.
The Southern California region used throughout this Report straddles three Water Quality Control Board regions: Colorado, Santa Ana, and Los Angeles. Although Colorado and Santa Ana had more impaired water segments in 2006 than in 2002, Los Angeles greatly reduced its number of impaired water segments. Thus, overall, water quality in Southern California improved. This substantial change in the Los Angeles region is due mostly to the reduction of impaired coastal shorelines as well as rivers/streams.
Other regions have not made as much progress in improving water quality, although there have been some steps in the right direction. For example, even though Central Coast had an overall 12% increase in its number of impaired water segments, the region reduced its number of impaired coastal shorelines from 11 to 6. Polluted runoff has been the main contributing factor to San Diego’s increase in the number of impaired water segments.
34

2002
North Coast
San Francisco Bay
Central Coast
Central Valley
Lohonton
Los Angeles
Colorado
Santa Ana
San Diego
Bays and H
arbors
Coastal S
horelin
es
Estuarie
s
Lakes/
Reserv
oirs
Rivers/
Streams
Saline La
kes
Wetla
nds, Tidal
Wetla
nds, Fre
shwate
r
TOTA
LBays
and Harb
ors
Coastal S
horelin
es
Estuarie
s
Lakes/
Reserv
oirs
Rivers/
Streams
Saline La
kes
Wetla
nds, Tidal
Wetla
nds, Fre
shwate
r
TOTA
L
2006
Percent Change
North Coast
San Francisco Bay
Central Coast
Central Valley
Lohonton
Los Angeles
Colorado
Santa Ana
San Diego
Sou
ther
n
Cali
forn
ia
Sou
ther
n
Cali
forn
ia
2 1 5 41 49 1 2 4 49 1 57
7 15 49 1 72 13 5 7 7 51 83
11 6 8 4 72 1 102 3 11 9 4 64 91
8 18 88 1 115 3 15 82 2 102
8 8 32 2 1 43 12 53 2 2 69
11 39 5 18 78 3 154 12 57 4 19 88 3 183
6 1 7 5 1 6
4 1 1 5 19 33 3 3 1 4 20 31
20 19 10 12 36 97 13 20 10 3 21 67
-14%
-13%
+12%
+13%
-38%
-16%
+17%
+6%
+45%
-12%
Impaired Water SegmentsNumber, and Percent Change
by Regional Water Quality Control Board2002-2006
35

70%
60%
50%
40%
30%
0% * Note: Region does not include data for all counties within region
Source: California Association of Realtors
20%
10%
Q1 03 Q2 03 Q3 03 Q4 03 Q1 04 Q2 04 Q3 04 Q4 04 Q1 05 Q2 05 Q3 05 Q4 05 Q1 06 Q2 06 Q3 06
HOUSING AFFORDABILITY/BURDENWHY ARE THESE INDICATORS IMPORTANT?The affordability of housing affects a region’s ability to maintain a viable economy and high quality of life. Lack of affordable housing in a region leads to longer commutes, which in turn diminish productivity, curtail family time and increase traffic congestion. Lack of affordable housing also restricts the ability of crucial service providers and others— such as teachers, registered nurses and police officers—to live in the communities in which they work. Housing affordability is a function of housing supply and variety, as well as incomes. Long commutes also add to increase in percent of income spent on transportation costs.
We examine two measures of affordability. Housing “burden” is the proportion of household income that is used for housing expenses (either mortgage or rent). The higher the percentage of income required, the higher the burden. The other measure is the percentage of households that can afford a median-priced home in the region. This provides an indication of how accessible home ownership is to people living and working in the region. Measuring housing affordability in rural regions has been more of a challenge, as county-level data are often not available.
WHAT PROGRESS ARE REGIONS MAKING?Percent of First Time Buyers that Can Afford to Purchase a Median-Priced HomeAcross all regions, housing affordability trends have been in accord—fewer first-time buyers could afford to purchase a median-priced home in 2006 than in 2003. In the time period for which there are data, housing affordability was on the decline until late 2004, when several regions became slightly more affordable until the first quarter of 2005, when they resumed their downward trend. Data from the latest quarter available (3rd Quarter 2006) shows that some regions are again beginning to slow or stop this downward trend.
Percent of Renter and Owner Households with Housing Costs Greater than 35% of Income
For renters, housing has been expensive throughout all of the regions for which there is data. In every region but one, more than 40% of renters have housing costs in excess of 35% of their income. In four regions, more than 45% do. Housing also proved to be expensive for owners, although somewhat less costly than for renters. In every region, more than 30% of owners have housing costs in excess of 35% of their income. In three regions, more than 45% do. Some regions have comparatively low burdens for one group (e.g., renters in the Bay Area, homeowners in Butte), while much higher burdens for the other groups. While there are substantial variations across California’s regions, every region exceeds the national average of 26% of income dedicated to housing costs.
Housing AffordabilityPercent of First Time Buyers that Can Afford to Purchase a Median Priced Home
2003-2006
San Luis Obispo
San Diego
San Joaquin Valley *
Bay Area *
Monterey Bay *
Southern California *
Sacramento Area *
Santa Barbara
36

0% 50%5% 10% 15% 20% 25% 30%
Source: U.S. Census Bureau, American Community Survey 2005
* Note: Does not include data for all counties within region
35% 40% 45%
0% 50%5% 10% 15% 20% 25% 30% 35% 40% 45%
SJVSan Joaquin Valley*
REGIONAL VIEW: San Diego Housing Affordability
Excerpt from: SANDAG Regional Comprehensive Plan
“To find affordable housing, many workers are moving far from their jobs, often outside San Diego County or across the international border. A recent survey indicates that 29,000 south western Riverside County residents commute into San Diego County for work, and workers even move as far away as Imperial County to find homes they can afford. An estimated 40,000 workers cross the border from Mexico each day for jobs in the San Diego region and many are U.S. citizens (Caltrans Traffic Census). This imbalance between jobs and housing is leading to a tremendous strain on our roads, freeways, infrastructure, and environment, as well as a strain on the quality of life for those commuters.”
NCNorth Coast*
SHShasta
NSNortheast Sierra*
BUButte
SASacramento Area*
BABay Area*
MBMonterey Bay*
SBSanta Barbara
SDSan Diego
SCSouthern California
Housing AffordabilityPercent of Households with Housing Costs Greater than 35% of Income
2005
RentersOwners
REGIONAL VIEW: Rural California Housing Affordability
Excerpt from: 2007 Rural Economic and Health Vitality Policy Agenda, CCRL
“There is a housing affordability crisis throughout Rural California – a shared challenge with the State’s urban areas – affecting almost all income levels. This problem is compounded for low income families, many of whom are the working poor who are increasingly “locked out” of the ability to own a home, the primary source of asset development. The high cost of housing is also affecting renters. Overcrowding is a major problem for many rural counties, especially in the Central Valley, parts of the Central Coast, and Imperial County. Farm workers and their families suffer from poor housing conditions disproportionately.”
SLOSan Luis Obispo
37

SJV NCSH NS NSVBUSA SSBA MB SLOSD SC SB
40
43
44
45
Increase in Jobs
Increase in Per Capita Income
Increase in Net Business Formation – with Employees
Increase in Net Business Formation – without Employees
Prosperity indicators encompass fundamental measures of employment, income, and innovation.
Employment change is measured overall, and in key industry sectors or clusters. Income is measured
on a per capita basis, and for households where the data are available. Innovation is measured
in terms of net new business formation—one of the important outcomes of business and technological
innovation in California. These indicators, while primarily related to prosperity, are also clearly
linked to people and place. Together, place, prosperity, and people measures are reflective of
important dimensions of California’s quality of life.
prosperity
Prosperity (economy)
North Coast
Shasta
Northeast
Sierra
ButteSacra
mento Are
a
Southeast
Sierra
Bay Are
a
San Joaquin Valle
y
Montere
y Bay
San Luis
Obispo
San Diego
Southern
Californ
ia
No. Sacra
mento Valle
y
Santa B
arbara
Page
Region Has Made Progress on This Measure
Region Has Not Made Progress on This Measure
No Data Available/Not Applicable
Employment Change
Income
Innovation
38

WHY ARE THESE INDICATORS IMPORTANT?Job gains are a basic measure of economic health. We examine all non-farm employment—including all other industry and government jobs. This provides a measure of progress in terms of job quantity, but not necessarily job quality. Thus, we examine employment in key sectors or clusters, many of which pay higher than average wages in their regions. We also measure if job increases are helping raise incomes. Per capita and median household income are important measures in this regard. They help answer the question if the job mix and growth of a region is providing enough for people to make real economic progress (that is, adjusted for inflation). Focusing on per capita and median household income helps us understand how broadly gains are distributed, as these measures are less likely to be skewed by a small percentage of very high income earning households. The median household income is the income value at which half the region’s households earn more and half earn less.
The third measure is innovation—a primary catalyst for economic growth. As an indicator, we focus on new business creation, as evidence of entrepreneurs bringing innovations to market. This measure is, of course, only one dimension of innovation, as existing companies also regularly introduce new products and adopt new processes that produce wealth. Some of the impact of those innovations is picked up in gains in jobs and incomes. In terms of new business creation, we examine two kinds of firms to gain a more complete accounting of net start-up growth. We focus on companies with employees as well as firms run by one or more co-owners, but without any employees. The latter is a rapidly growing share of all firms, and so is important to measure here.
REGIONAL VIEW: San Diego Globalization and Economic Opportunity
Excerpt from: SANDAG, Regional Comprehensive Plan for the San Diego Region
“[San Diego’s] economy functions within a regional and global economic setting. The San Diego-Baja California binational region faces increasing domestic and global competition. Many people are aware of globalization; however, few understand that regionalization or the increasing importance of regional economies is the other side of the coin. In economic terms, [the San Diego] region is directly connected to the greater Los Angeles area and Baja California, Mexico, which are gateways to the domestic and international marketplaces. Access to international markets is critical for the economic prosperity of the region. To the south, [San Diego] depend[s] on Baja California for an important part of [its] labor pool. Southwestern Riverside County also is becoming an increasingly important source of labor and an alternative housing choice for many.” 39

0% 30%5% 10% 15% 20%
Source: California Employment Development Department, 1997-2005
25%
0% 30%5% 10% 15% 20% 25%
WHAT PROGRESS ARE REGIONS MAKING?
Every region has experienced a net gain in jobs in non-farm sectors in recent years. Although some regions have experienced economic turbulence, with major job gains and losses and restructuring towards some industries and away from others, the net change in employment between 1997 and 2005 was positive for every region. For most regions, the net change was more than 10%. In five regions, net new jobs grew more than 20%. The Bay Area’s relatively low rate of employment growth during this time period makes it apparent that the region was clearly hit hardest by the recession. Regions with higher percentage increases are often a mix of higher and lower county growth rates, such as Southern California, where growth was strong in Orange County and the Inland Empire and lagged in Los Angeles County.
REGIONAL VIEW: Southern California Goods Movement and Economic Opportunity
“In 2005, More than 80 percent of the cargo (tonnage) in the state of California went through the ports of Los Angeles/Long Beach. Hence, the logistics sector (including transportation, warehousing and wholesale trade) has become increasingly prominent in the Southern California Region. In 2005, it provided about 600,000 jobs, or one in twelve jobs in the region. Due to the significance increase in foreign trade, total jobs in the logistics sector in the region are estimated to increase another 120,000 over the next ten years. In addition, jobs in the logistics sector offer wages higher than the overall average and enable upward economic mobility particularly for those without a college education.”– Southern California Association of Governments
NCNorth Coast
SHShasta
NSNortheast Sierra
NSVNo. Sacramento Valley
BUButte
SASacramento Area
SSSoutheast Sierra
BABay Area
SJVSan Joaquin Valley
MBMonterey Bay
SLOSan Luis Obispo
SBSanta Barbara
SDSan Diego
SCSouthern California
Employment GrowthPercent Change in Total Nonfarm
1997-2005EMPLOYMENT CHANGE
40

A growing number of regions have begun to re-examine their economies, identifying “clusters of opportunity”—groups of growing export-oriented industries and population-driven sectors which also provide job opportunities with good career potential for regional residents.
The Fresno Regional Jobs Initiative assessed its clusters of opportunity, set a goal of creating thousands of new jobs in those sectors, and launched a comprehensive, 5-year strategy of economic and workforce development to achieve the goal. They have measured their progress on a regular basis, having reduced their unemployment rate 31%, with
three-quarters of all non-farm job growth generated by the targeted clusters. For more information, see www.fresnorji.com
The North Coast region has just completed an analysis of its clusters of opportunity, which showed a major economic restructuring and emergence of growing sectors with good career potential. They identified specific occupations at the entry, mid, and high levels by cluster, and are now organizing to focus their economic and workforce development efforts on these clusters. For more information, see www.humboldtwib.com
Re
gi
on
al
H
ig
hl
ig
ht
4.5
3.5
2.5
1.5
0.5
(0.5)
0-2%-4%-6% 6%4%2% 10%8%
Buildings & SystemsConstruction & Maintenance
Specialty AgricultureFood & Beverage
Investment Support Services
DiversifiedHealth Care
Management& InnovationServices
NicheManufacturing
North Coast Targets of Opportunity
Conc
entr
atio
n (1
.0 =
Sta
te A
vera
ge)
Food Chain
Construction
Manufacturing Value Chain
Wholesale Trade
Retail Trade
Basic Information Services
Real Estate & Rental & Leasing
Prof. Sci. Tech & Mgmt. Services
Health Sciences & Services
Entertainment & Tourism
Other Services
All Government
Source: California Regional Economies Project, California Economic Base Report, 2006
Average Annual Growth Rate 1990-2004
Targets of Opportunity in the Central Valley and North Coast
Central C
oast
San Joaquin Valle
y
Northern
Californ
ia
No. Sacra
mento Valle
y
Added Employment
Did Not Add Employment
Not a Major Cluster
Greate
r Sacra
mento
Bay Are
a
Central S
ierra
Southern
Californ
ia
Southern
Bord
er
Employment Growth in Major Clusters/Industry Sectors2001-2004
WHAT PROGRESS ARE REGIONS MAKING?
A closer examination of key industry sectors and clusters at the regional level also suggests progress. This table is a summary of region-by-region economic base reports published by the California Regional Economies Project of the California Labor and Workforce Development Agency’s Economic Strategy Panel. The sectors and clusters shown represent major employment sectors in regions somewhat different than the regions used in this Report. While not directly comparable and sometimes incomplete, these results do show areas of progress that align with part or all of individual regions in this Report. Overall, it reinforces the conclusion that regions have been adding jobs, including jobs in one or more sectors important because of their export orientation, higher-than-median wages, and/or share of jobs in the economy. These are broad categories; many regions and sub-regions have developed their own more focused industry cluster or “clusters of opportunity” analysis (e.g., see the Regional Highlight, above, on the Central Valley and North Coast).
41

$0 70,00010,000 20,000 30,000 40,000 50,000
Source: U.S. Census Bureau, American Community Survey 2005
60,000
$0 70,00010,000 20,000 30,000 40,000 50,000 60,000
-7%
+16%
+5%
+13%
+1%
+2.2%
+3%
—
—
+7%
—
—
—
Note: Regional median household income is derived by averaging each county’s median household income in every region.
INCOMEReal Median Household Income and Real Per Capita Income
Every region but three (where data are available) has enjoyed real increases in per capita income.In fact, the ten regions with the lowest per capita income in the state all experienced real gains between 2000 and 2004.
NCNorth Coast
SHShasta
NSNortheast Sierra
BUButte
SASacramento Area
BABay Area
SJVSan Joaquin Valley
MBMonterey Bay
SLOSan Luis Obispo
SBSanta Barbara
SDSan Diego
SCSouthern California
Real Median Household Income2005 (Dollars) and 2000-2005 Percent Change
Many regions have also made progress in raising median household income. Between 2000 and 2005, six of seven regions (in which data are available) experienced real increases in their median household income. San Joaquin Valley, the region with the fourth lowest median household income, recorded a 7% increase between 2000 and 2005. Southern California also experienced a 2.2% gain, starting from a higher base in 2000. The Monterey region, with the second highest median household income, increased by a substantial 16%.
California State
42

Source: Per Capita Personal Income by County, California, 1994-2004 (Residence Adjusted), U.S. Department of Commerce, Bureau of Economic Analysis
$0 60,00010,000 20,000 30,000 40,000 50,000
-7%
+6%
+2%
-1%
-3%
+7%
+1%
+.1%
+8%
+2%
+4%
+3%
+2%
$0 60,00010,000 20,000 30,000 40,000 50,000
+7%
+6%
Real Per Capita Income2004 (Dollars) and 2000-2004 Percent Change
NCNorth Coast
SHShasta
NSNortheast Sierra
BUButte
SASacramento Area
BABay Area
SJVSan Joaquin Valley
MBMonterey Bay
SLOSan Luis Obispo
SBSanta Barbara
SDSan Diego
SCSouthern California
California State
NSVNo. Sacramento Valley
SSSoutheast Sierra
43

0 600,000100,000 200,000 300,000 500,000
Source: California Employment Development Department, Labor Market Information Division
+17%
+3%
+9%
+14%
+16%
+6%
-1%
+4%
+7%
+3%
+7%
+9%
+4%
+5%
400,000
0 600,000100,000 200,000 300,000 500,000400,000
INNOVATIONNet Business Formation: Firms with and without Employees
From 2001 to 2005, business formation for firms with employees has increased throughout California. In fact, every region but one experienced net growth in new businesses with employees. The regions of Southern California, San Diego, and Sacramento Area experienced double-digit increases in this kind of business formation from 2001-2005.
A growing trend is the increase in new businesses that do not have employees. These are establishments run by one or more owners that are not counted by the California Employment Development Department. Many of these firms are very small, exist in small offices or downtown settings, or are home-based operations. This shift has implications for transportation systems, housing demand, commercial space, telecommunications, urban amenities, and mixed-use development.
Every region posted gains in new businesses without employees. In fact, every region has experienced double-digit increases in the number of firms where everyone working is at least a co-owner—a major shift in how economies are structured in California. Regions as diverse as Sacramento (41%), San Joaquin Valley (39%), Southern California (34%), the Northern Sacramento Valley (34%), San Diego (29%), San Luis Obispo (28%), and Northeast Sierra (26%) experienced major gains in these kind of firms from 1997-2004.
NCNorth Coast
SHShasta
NSNortheast Sierra
NSVNo. Sacramento Valley
BUButte
SASacramento Area
SSSoutheast Sierra
BABay Area
SJVSan Joaquin Valley
MBMonterey Bay
SLOSan Luis Obispo
SBSanta Barbara
SDSan Diego
SCSouthern California
Net Business FormationFirms with Employees
2001-2005, Percent Change
Q3 2005Q3 2001
44

The Tri-Valley region (on the eastern edge of the Bay
Area, including the communities of Danville, Dublin,
Livermore, Pleasanton, and San Ramon) has examined
its changing economic landscape and found a burst
of growth in new, homegrown firms, many of which
are firms run by co-owners with no employees. These
findings are transforming prevailing assumptions that
large companies are responsible for job growth or that
new jobs come from relocations or expansions to the
region (in fact, less than 1% do). As a result, the region
is launching a new innovation network that will link
these very small firms to each other, customers, and
business services they need.
For more information, see www.trivalley.org
The California Regional Economies Project has
published an analysis of patterns of entrepreneurship
in rural regions of the State. This analysis was based
on proprietary data from the National Establishments
Time Series (NETS) database—including a more
complete accounting of new businesses with and
without employees. It turns out that businesses run
by sole owners or ownership groups are particularly
important to how business is done in rural California,
and often missed in the analyses of local and
regional economies.
For more information, see www.labor.ca.gov/panel
The Great Valley Center has also published a regional
analysis of the No. Sacramento Valley using NETS data.
For more information, see www.greatvalley.orgRe
gi
on
al
H
ig
hl
ig
ht
0% 45%5% 10% 15% 20% 25%
Source: U.S. Census Bureau, Nonemployer Statistics 1997 and 2004
30% 35% 40%
0% 45%5% 10% 15% 20% 25% 30% 35% 40%
SASacramento Area
A More Complete Accounting of New Businesses in the Tri-Valley and Rural California regions
Net Business FormationFirms Without EmployeesPercent Change, 1997-2004
NCNorth Coast
SHShasta
NSNortheast Sierra
NSVNo. Sacramento Valley
BUButte
SSSoutheast Sierra
BABay Area
SJVSan Joaquin Valley
MBMonterey Bay
SLOSan Luis Obispo
SBSanta Barbara
SDSan Diego
SCSouthern California
45

SJV NCSH NS NSVBUSA SSBA MB SLOSD SC SB
48
50
51
52
52
Increase in Educational Share; High School or More
Decrease in Share of Population with Asthma
Decrease in Share of Overweight/Obese Population
Decrease in Violent Crime Rate
Decrease in Property Crime Rate
People indicators encompass fundamental measures such as educational level, health status, and
public safety. These indicators, while primarily related to people, are also clearly linked to prosperity
and place. Together, place, prosperity, and people measures are reflective of important dimensions
of California’s quality of life. Measures of progress for People are affected by investments in place.
people
North Coast
ShastaNorth
east Sierra
ButteSacra
mento Are
a
Southeast
Sierra
Bay Are
a
San Joaquin Valle
y
Montere
y Bay
San Luis
Obispo
San Diego
Southern
Californ
ia
No. Sacra
mento Valle
y
Santa B
arbara
Page
Region Has Made Progress on This Measure
Region Has Not Made Progress on This Measure
No Data Available/Not Applicable
People (equity)
Access to Opportunity
Health
Public Safety
46

Re
gi
on
al
H
ig
hl
ig
ht
WHY ARE THESE INDICATORS IMPORTANT?A basic measure for people is educational attainment, which is highly predictive of economic well-being. Education provides people access to opportunity. The more education, the more income one is likely to earn on average. If a region is increasing its share of more educated residents, it is developing more capacity to compete in the global economy for jobs that require high levels of skill. In turn, a region is more likely to be increasing its share of residents who can earn more income and afford a higher standard of living.
A basic measure of personal well-being is health. Although there are many indicators from which to choose, we focus on asthma and obesity. Asthma is linked to and exacerbated by poor air quality, which is a byproduct of automobile-dependent development patterns as well as industrial and agricultural operations, and construction.
Over the past two decades, obesity has risen dramatically in the United States and its occurrence is not just limited to adults - the percentage of young people who are overweight has more than tripled since 1980. Being overweight or obese increases the risk of many diseases and health conditions, including Type 2 diabetes, hypertension, coronary heart disease, stroke and some type of cancers. Obesity and its associated health problems have a significant economic impact on the nation’s health care system as well as the overall economy due to declines in productivity. Researchers are increasingly drawing connections between obesity and land use patterns and community design, as well as reliance on automobiles.
A basic measure of personal and community well-being is public safety. The level of crime is a significant factor affecting the quality of life in a community. Incidence of crime not only poses an economic burden, but also erodes our sense of community by creating fear, frustration and instability. We examine violent crime as a clear indicator of personal safety, but also property crime, which is a measure of community well-being, and ultimately personal quality of life.
Reinvestment in Low-Income Neighborhoods in the Bay Area and Southern California
These regions are focusing on the intersection of
people and place—in particular, seeking to measure
improvements in specific low-income neighborhoods.
The Bay Area Family of Funds, created by the Bay Area
Council, focuses on generating (and measuring)
investments in 46 priority low-income neighborhoods
in the region. To date, over $175 million has been raised,
with over $70 invested thus far, producing or preserving
hundreds of jobs and affordable housing in vestment
to 46 impoverished neighborhoods in the region. A
Community Council monitors and reviews the impacts
of investments to ensure a “double bottom line” of
financial returns and social/environmental benefits.
For more information, see www.bayareacouncil.org
Southern California’s Compass Blueprint has
developed a 2% Strategy that seeks to direct
development to areas representing 2% of the land
of the region. The belief is that by making modest
changes in these areas, major impacts can be
achieved for the region over the long term. The 2%
Strategy Opportunity Areas explicitly links mobility,
livability, prosperity, and sustainability goals for these
neighborhoods and their residents—many of whom
are low-income. Changes are to include a variety of
housing for all incomes, educational opportunity,
and environmental justices regardless of race,
ethnicity, or income.
For more information, see www.scag.org 47

0% 60%10% 20% 30% 50%
Source: American Community Survey, U.S. Census Bureau
40%
18.5% 23.5% 14.7%
18.7% 25.0% 15.9%
16.4% 18.9% 11.2%
20.0% 21.1% 12.8%
19.4% 18.5% 12.0%
20.7% 19.9% 12.1%
19.0% 17.7% 7.4%
20.8% 14.5% 9.5%
20.2% 16.3% 8.7%
22.2% 17.7% 9.4%
25.4% 18.3% 8.1%
22.6% 19.1% 9.1%
25.1% 10.2% 4.8%
26.0% 11.4% 5.1%
0% 60%10% 20% 30% 50%40%
2000
2005
High School Bachelor Graduate/Professional*Note: Region does not include data for all counties within region
ACCESS TO OPPORTUNITYWHAT PROGRESS ARE REGIONS MAKING?Educational Attainment
Virtually every region (where data are available) has experienced an increase in its level of educational attainment. There is a bigger share of more highly-educated people living in every region of California, a critical ingredient for competing in the increasingly knowledge-driven global economy. San Diego experienced a particularly rapid rise in its talent pool: 54% of its population had a high school degree or higher in 2005 compared to 47% in 2000. The Bay Area region already had a high level of educational attainment in 2000—and continued moving upward despite job losses during this period.
SASacramento Area*
BABay Area *
SJVSan Joaquin Valley*
MBMonterey Bay*
SBSanta Barbara
SDSan Diego
SCSouthern California*
Educational AttainmentShare of Population by Highest Level of Education
2000 and 2005
San Joaquin, Southern California, and Santa Barbara regions grew the share of bachelor degree holders and high school graduates. The Monterey region added share at the highest end (those with graduate-level education) and among high-school graduates, but not at the bachelors level. The Sacramento region went in both directions—with a higher percentage of people with graduate and bachelors level education, and with less than a high school diploma.
48

Several regions have used public opinion surveys to fill in gaps of understanding about the cumulative effect of economic, social, and environmental trends on people—and what kind of change people might be willing to support.
The Public Policy Institute of California has conducted a survey almost every year since 1999 in collaboration with the Great Valley Center, which has asked residents to rate their region as a place to live, the most important issue facing the region, and the quality of specific public services. Traffic congestion, housing affordability, and air quality rank high as issues of regional concern.For more information, see www.greatvalleycenter.org
SACOG through its civic partner in the Regional Blueprint Program, Valley Vision, is conducting an on-line survey about the region’s trans-portation needs and priorities for the preparation of the 2035 Metropolitan Transportation Plan, the next step in Blueprint implementation.www.fmrsurvey.com/dhm/smti/smtilogn.htm
In 2005, SANDAG conducted a public opinion survey to measure opinion about quality of life in the region, identify regional priorities and policy attitudes, including attitudes toward smart growth, identify commute behavior and other transportation uses and examine trade-offs, and describe changes from 2002. See www.sandag.org
The Southern California Association of Governments (SCAG) in its Compass Blueprint planning process used public opinion surveying to pose several development alternatives to residents, including higher density in their neighborhood if carefully designed with open space, development in existing districts rather than using up open space, and the distribution of transportation improvements across freeways, high-speed transit, more bus service, bike paths, etc. For more information, see www.scag.org
Re
gi
on
al
H
ig
hl
ig
ht Surveying About Community Well-Being in the Central Valley,
Priorities for the 2035 Sacramento Metropolitan Transportation Plan, Willingness to Support Change in San Diego and Southern California
REGIONAL VIEW: Shasta Economic Opportunity
Excerpt from: Vital Signs, A Report on the Quality of Life in Shasta and Tehama Counties, the Mc Connell Foundation
“Among the concerns identified by residents and community leaders in the most recent regional community indicators report, the region was found to have a shortage of college-educated workers, and a large discrepancy between the jobs available and people qualified with high school diplomas. While the region exceeded the state literacy rate, a high percentage of adults still lacked the basic skills to function successfully.”
49
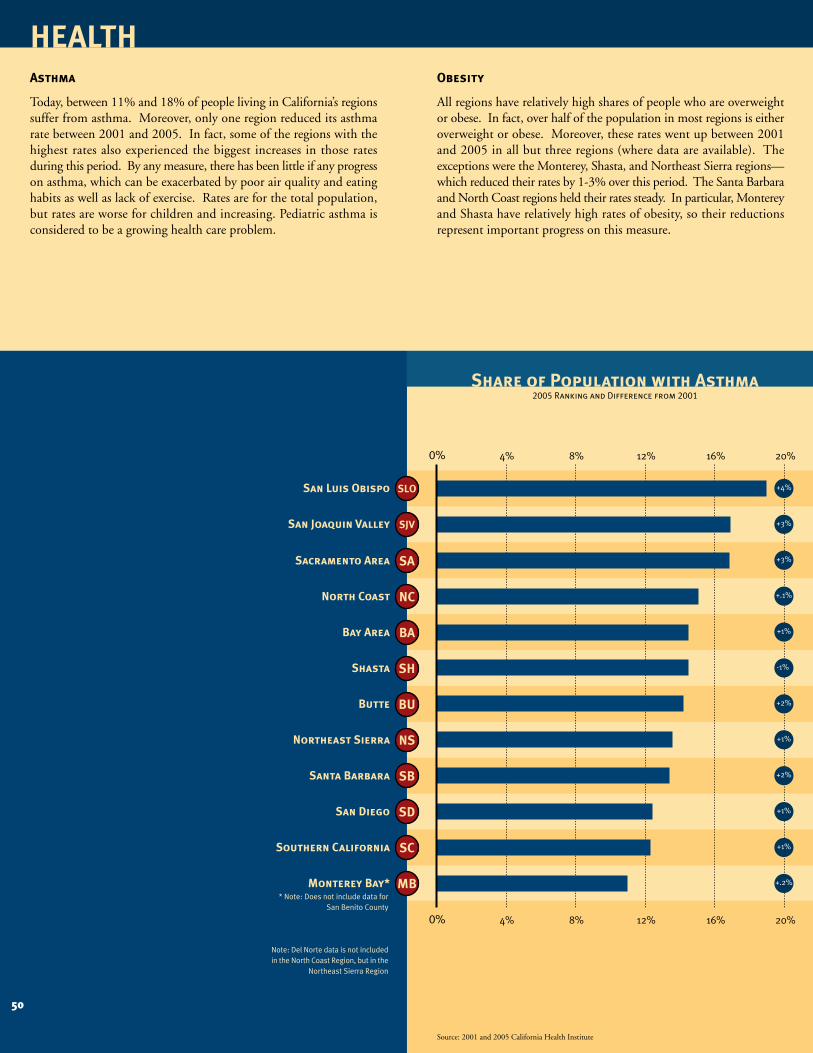
0% 20%4% 8% 12% 16%
Source: 2001 and 2005 California Health Institute
0% 20%4% 8% 12% 16%
+4%
+3%
+3%
+.1%
+1%
-1%
+2%
+1%
+2%
+1%
+1%
+.2%
* Note: Does not include data for San Benito County
Note: Del Norte data is not included in the North Coast Region, but in the
Northeast Sierra Region
SLOSan Luis Obispo
HEALTHAsthma
Today, between 11% and 18% of people living in California’s regions suffer from asthma. Moreover, only one region reduced its asthma rate between 2001 and 2005. In fact, some of the regions with the highest rates also experienced the biggest increases in those rates during this period. By any measure, there has been little if any progress on asthma, which can be exacerbated by poor air quality and eating habits as well as lack of exercise. Rates are for the total population, but rates are worse for children and increasing. Pediatric asthma is considered to be a growing health care problem.
Obesity
All regions have relatively high shares of people who are overweight or obese. In fact, over half of the population in most regions is either overweight or obese. Moreover, these rates went up between 2001 and 2005 in all but three regions (where data are available). The exceptions were the Monterey, Shasta, and Northeast Sierra regions—which reduced their rates by 1-3% over this period. The Santa Barbara and North Coast regions held their rates steady. In particular, Monterey and Shasta have relatively high rates of obesity, so their reductions represent important progress on this measure.
NCNorth Coast
SHShasta
NSNortheast Sierra
BUButte
SASacramento Area
BABay Area
SJVSan Joaquin Valley
MBMonterey Bay*
SBSanta Barbara
SDSan Diego
SCSouthern California
Share of Population with Asthma2005 Ranking and Difference from 2001
50

Source: 2001 and 2005 California Health Institute Survey
0% 60%10% 20% 30% 40%
+0.4%
+0.4%
+1.4%
-2.7%
-1.2%
+1.3%
+2.2%
+0.7%
+1.0%
+0.1%
+2.4%
-1.0%
50%
+1.2%
0% 60%10% 20% 30% 40% 50%
Note: Del Norte data is not included in the North Coast Region, but in the
Northeast Sierra Region
NSNortheast Sierra
SJVSan Joaquin Valley
REGIONAL VIEW: San Joaquin Valley Air Quality and Asthma
Excerpt from: The State of the Great Central Valley of California, Assessing the Region, The Environment
“PM2.5 and ozone exposure both have substantial adverse health impacts. Valley residents regularly suffer asthma attacks, acute bronchitis, lost work days, reduced activity, hospital admissions, school absences, and even premature death because of exposure to air pollution.
Youth who grow up in smoggy areas have lungs that are underdeveloped by the age of 18 and will likely never recover. Teenagers that live in more polluted areas are five times as likely to have clinically-low lung function as teens living in low-pollution areas. Each year, asthma accounts for 808,000 days of Valley school absences. Despite significant reductions in emissions of ozone-forming pollutants over the past 15 years, Valley residents still breathe ozone levels above the federal
Share of Population Overweight/Obese 2005 Ranking and Difference from 2001
SLOSan Luis Obispo
NCNorth Coast
SHShasta
BUButte
SASacramento Area
BABay Area
MBMonterey Bay
SBSanta Barbara
SDSan Diego
SCSouthern California
California State
8-hour standard about one third of the year. A recent report puts the cost of non-attainment at more than $3 billion per year or, an average of $1,000 per Valley resident per year.
These health and economic impacts make it essential to reduce public exposure to the pollutants as quickly as possible. The San Joaquin Valley’s geography, topography, and climate conditions add to this challenge. The Valley experiences low regional air evacuation and dispersion rates, frequent inversions, abundant sunlight and extreme temperatures.”
51

0 60001000 2000 3000 4000 5000
Source: California Department of Justice, California Crime Index 2000 and 2005
0 25,0005000 10,000 15,000 20,000
* Note: Does not include data for all counties within region
Source: California Department of Justice, California Crime Index 2000 and 2005
0 25,0005000 10,000 15,000 20,0000 60001000 2000 3000 4000 5000
PUBLIC SAFETYViolent and Property Crime
While most regions have cut their rates of violent crime considerably, all regions have experienced major increases in property crime since 2000. Four regions experienced double-digit reductions in violent crime rates—an important measure of progress in public safety. These regions included Southern California (down 16%), Monterey (14%), North Coast (11%), and Sacramento (11%). With a relatively high crime rate, Southern California’s reduction was particularly important. At the same time, however, every region experienced at least a 50% increase in the rate of property crimes per capita between 2000 and 2005. Those with relatively high and low rates alike saw property crimes spike up substantially during this period.
NCNorth Coast*
SHShasta
BUButte
SASacramento Area*
BABay Area
SJVSan Joaquin Valley
MBMonterey Bay*
SLOSan Luis Obispo
SBSanta Barbara
SDSan Diego
SCSouthern California
Violent Crime Rate per 100,000 Population
2000 and 2005
2005 Violent Crime Rate2000 Violent Crime Rate
Felony OffensesProperty Crime
Rate per 100,000 Population2000 and 2005
2005 Property Crime Rate2000 Property Crime Rate
52

opportunities + implications
Sustain and expand what’s working
The Report finds that regions have begun to see the results of their efforts to pursue efficient development and expand transportation choices (i.e., transit ridership). Most regions have successfully reduced ozone levels and have raised educational attainment.
Help each other improve
On certain indicators, some regions have gained, while others have not. Regions that have found innovative strategies that work can share them through mechanisms such as the Blueprint Learning Network. In some cases, adjacent regions can work together on challenges that are spilling over broader areas—such as commute sheds, agricultural lands, goods movement corridors, flood control, ecosystems, and the like.
Expand state-regional collaboration
Progress on most of the indicators in this report requires some level of collaboration among local, regional, and state leaders. State government sets the policy framework in many areas (such as tax and regulatory policy), makes substantial investments in others (such as education, transportation infrastructure, and public health and safety), and can contribute targeted assistance in others (such as workforce training or land protection). Regions and localities understand best the unique combination of needs and regional resources that can be mobilized to address those needs. The infrastructure bonds present an opportunity to foster collaboration on an integrated approach to solving regional challenges and leveraging investments for multiple benefits.
Expand inter- and intra-regional collaboration .
For issues best addressed at a regional scale, local decision makers can support regional planning efforts in areas of mutual concern and opportunity for long-term sustainability. This includes local jurisdictions collaborating with one another and with regional planning entities for better outcomes. It also includes state agencies helping to foster inter-regional collaboration, through programs such as the Regional Blueprint Learning Network. State interagency collaboration can create additional opportunities to support regional collaboration efforts through policy initiatives such as the Regional Blueprint Planning Program, the State Transportation Plan, the Goods Movement Action Plan, and the Climate Change Team.
Revisit and address what’s not working
The Report finds that vehicle miles traveled have skyrocketed, and the share of people driving alone to work has not changed appreciably. Gasoline consumption has gone up and housing is becoming less affordable across all regions. These trends seem to be overwhelming the gains in efficient development and transit ridership. With further population expansion anticipated, these trends, if they continue, seem likely to produce additional traffic congestion and other consequences.
Connect the dots
Health issues like asthma and obesity are linked to poor air quality and may be exacerbated by our prevailing automobile-dependent development pattern. Job and firm growth could provide jobs that pay better incomes and could be located closer to housing that is affordable. Housing, schools, shopping, and other community assets can be built in closer proximity or better connected. Slowing conversion of agricultural land while increasing acreage of protected open space could encourage more infill development in existing communities, keep agriculture economically viable, and contribute to climate change solutions.
Keep the 3Ps together
Place, prosperity, and people are clearly interdependent. Focusing on one area, such as place, without taking into account the other two areas doesn’t make sense. For example, discouraging economic growth could undermine people’s financial well-being, even as it eases congestion. Turning away from efficient development and efforts to expand transportation choices could make economic development more difficult by undermining quality of life and the ability to attract and retain talented workers. Letting health and public safety slip can also undermine quality of life and compromise economic development—regardless of how efficient development has become.
The findings of this inaugural California Regional Progress Report have implications for leaders at
the local, regional, and state levels as we go forward.
53

Create a priority list of new or refined indicators that would help regions measure “what matters most” as they pursue their visions of change—then develop and implement innovative data collection strategies at the local, regional, and/or state level. Where regions have pioneered innovative approaches, support should be provided to help regions adapt and replicate these indicators.
Examples of specific data areas could include:
• Efficient Development and Infill: building permits or new units built, by location in the region, closer to transit and existing development, services, jobs, schools, and so forth. Identify units being built in Blueprint opportunity zones and targeted growth areas
• Congestion: Reconcile data methodologies, identify and track factors affecting VMT, identify investments needed for better, consistent regional tracking and development of data
• Vehicle Miles Traveled: Develop household survey data methodologies and information to better identify travel behavior
• New Firms, Without Employees: Identify where located, what types of businesses are being created, employee growth potential
• Urban Green Infrastructure: Develop metrics for parks and amenities per capita and status within developed areas
• Cost of Living: Identify cost of living impacts of housing and transportation costs on income gains
• Air Quality: In addition to ozone, track pollutants such as PM10 and PM2.5
•Cross-Border Data: Identify data sources and methodologies to incorporate important bi-state, bi-national regions, such as the Lake Tahoe Basin, the Southern Border region with Mexico, and the North State and Oregon
Commit to an ongoing flow of timely data between state agencies and regions in forms most useful for measuring progress and informing decisions. In some cases, expand data collection in less-populated areas, so that those regions can measure progress as effectively as more populous regions. Address challenges with key data sources such as the U.S. Census Bureau’s American Community Survey.
Develop a State-Regional collaboration strategy on data collection and formats, including data collection in areas of common interest or inter-regional concern (e.g., methodologies for household survey data, transportation corridors).
Conduct a regular statewide public opinion survey geared to providing indicators of residents’ attitudes and behaviors at the regional level. The Public Policy Institute of California, Field Research Corporation, and others regularly do polling across California, but more directed polling to help construct indicators useful for measuring progress towards regional visions is needed.
Support adoption of best practices and new indicators. The State can support regions to invest in new tools and methodologies, some of which are very expensive but which would provide more accurate data to measure important areas. The Blueprint Learning Network is a valuable forum in which to conduct peer to peer learning and capacity building, identify standards for data sources and methodologies, adopt of best practices, and for state-regional collaboration. Regions new to Regional Blueprint Planning and developing regional progress indicators can use the Progress Report indicators as a basis for their measures.
Publicize and tie progress measures to policy and investment decisions. What gets measured, gets done. Measures of progress should be widely publicized at the local, regional, and state levels, and make visible and influential contributions to policy and investment discussions and decisions. Progress measures should help all Californians ask the right questions and seek workable solutions to the complex challenges facing every region of the State.
Continue the Process of Measuring Progress. This Report is the baseline report. Progress Measures are most effective when the process is conducted on a regular basis, so that regional, state and local decision makers and residents can see how their regions are doing and make the appropriate mid-course corrections. Continuation of the process will allow for identification and incorporation of new measures as reflected by the work of the Regional Blueprint Planning programs, such as the integration of greenhouse gas emission reduction strategies. It will also allow for development of better measures of progress, better understanding of certain issues by further exploration of trends and dynamics, and broader adoption of measurement techniques and applications. In turn, this can improve policy making and investments so important to the future of California.
The process of assembling the California Regional Progress Report has also clearly shown the need
to improve the range of data available to measure progress and expand the capacity to develop
and use indicators. The Blueprint Projects have thoughtfully constructed shared regional visions.
We do not yet have adequate data to measure progress towards these futures. Several steps can
be taken to improve this situation:
opportunities + implications
54

Introduction
Population Growth
Data are drawn from the California Department of Finance’s “California County Population Estimates and Percent Change,” July 1, 2000 through (Provisional) July 1, 2006.
Race/Ethnic Population
Statistics are from the California Department of Finance, “Race/Ethnic Population with Age and Sex Detail, 2000–2050.” Non-white population is the sum of Hispanic, Asian, Pacific Islander, Black, American Indian, and multi-race population.
Place
Efficient Development
New Building Permits: Multi-Family and Single-Family Units
Data are from the Construction Industry Research Board’s, “California Building Permit Data by Building Category.” Ratio is derived by the number of multi-family unit permits divided by the number of single-family unit permits.
Ratio of Jobs to Housing Units
Data are from the U.S. Census Bureau’s American Community Survey (ACS). Ratio is derived by dividing the number of jobs by the number of housing units.
Movement of People and Goods
Decrease in Vehicle Miles of Travel per Household
Vehicle Miles of Travel estimates are from the Caltrans 2006 “California Motor Vehicle Stock, Travel, and Fuel Forecast” and include state highway systems and other roads. Household estimates are from the California Department of Finance’s “Population and Housing Estimates, 1990, 1995, 2000, 2005.” VMT per household is calculated by dividing VMT by the number of households.
Decrease in Daily Vehicle Hours of Delay
Data are from the Caltrans, 2004 “State Highway Congestion Monitoring Program Report.”
Transportation Choices
Means of Transportation to Work
Data are from the U.S. Census Bureau’s American Community Survey (ACS). Figures are for workers 16 years and over.
Increase in Transit Ridership
Data are from the California State Controller’s “Transit Operators and Non-Transit Claimants Annual Report.”
Resource Use
Decrease in Fuel Consumption
Fuel consumption data are from the Caltrans, 2006 “California Motor Vehicle Stock, Travel, and Fuel Forecast” and include estimates for diesel and gasoline.
Energy Consumption- Electricity and Natural Gas
Both electricity and natural gas consumption data are provided by the California Energy Commission’s “Quarterly Fuel and Energy Report.”
Protected Lands
Conversion of Agricultural Lands to Urban/Built-Up Uses
Data are from the California Department of Conservation, State Farmland Mapping and Monitoring Program (1996-2004). Figures are the sum of prime, statewide & unique, other land & water, and grazing and local lands.
Protected Open Space
Protected Open Space data is from the Public and Conservation Trust Lands, provided by GreenInfo Network.
Air & Water Quality
Ozone—Decrease in Days Exceeding 8-Hour State Standard
Data are provided by the California Air Resources Board, 2007 Air Quality Data DVD.
Decrease in Number of Impaired Water Segments
Impaired water segments data are from the California State Water Resources Control Board, “CWA Section 303(d) List of Water Quality Limited Segments, 2002 and 2006.”
Housing Affordability/Burden
Increase in Share of First-Time Buyers of Median Priced Home
Data is from the California Association of Realtors’ “Historical Series: First-Time Buyer Housing Affordability Index.”
Renters and Owners with Housing Costs Greater than 35% of Income
The indicator measures the share of households (owners and renters) spending 35% or more of their monthly household income on housing costs. Data are from the U.S. Census Bureau’s American Community Survey (ACS).
appendix
55

Prosperity
Employment Change
Increase in Jobs
Total nonfarm data are from the Labor Market Information Division of the California Employment Development Department and are not seasonally adjusted.
Income
Increase in Per Capita Income
Per Capita Income data are from the U.S. Department of Commerce, Bureau of Economic Analysis. Income is adjusted for inflation using the Bureau of Labor Statistics, Consumer Price Index (CPI) for all urban consumers. All regions except for Southern California use the U.S. City Average CPI. For Southern California, the Los Angeles-Riverside-Orange County CPI is used.
Increase in Median Household Income
Median household income data are from the U.S. Census Bureau’s American Community Survey. The Southern California data set is for the Los Angeles-Long Beach-Riverside consolidated statistical area. Income is adjusted for inflation using the Bureau of Labor Statistics, Consumer Price Index (CPI) for all urban consumers. All regions except for Southern California use the U.S. City Average CPI. For Southern California, Los Angeles-Riverside-Orange County CPI is used.
Innovation
Increase in Net Business Formation: Firms With Employees
Data are from by the California Employment Development Department, Labor Market Information Division’s “California Size of Business Report.”
Increase in Net Business Formation: Firms Without Employees
Data are provided by the U.S. Census Bureau, Nonemployer Statistics 1997 and 2004. A nonemployer business is one that has no paid employees, has annual business receipts of $1,000 or more and is subject to federal income taxes. Such businesses include the three legal forms of organization: individual proprietorships, partnerships, and corporations.
People
Access to Opportunity
Education
Data for educational attainment are derived from the United States Census Bureau, 2005 American Community Survey.
Health
Asthma and Obesity
Data on obesity are drawn from the 2005 California Health Institute Survey. For adults, “Overweight or Obese” include the respondents who have a Body Mass Index (BMI) of 25 or greater. “Overweight or Obese” youth include the respondents who have a BMI in the highest 95th percentile with respect to their age and gender. Population with asthma includes respondents who have ever been diagnosed with asthma.
Public Safety
Violent and Property Crime
Data are provided by the California Department of Justice, “California Crime Index 2000 and 2005.” Violent crime includes: homicide, forcible rape, robbery, and aggravated assault. Property crime includes: burglary, motor vehicle theft and larceny-theft over $400.
For more detail on data sources, please visit:
www.calregions.org
www.calcog.org
http://calblueprint.dot.ca.gov/
appendix
56

CALIFORNIA REGIONAL PROGRESS REPORT
Prepared By:
Collaborative EconomicsDoug HentonJohn MelvilleTracey GroseGabrielle MaorAngelina AguirreBridget GibbonsHope Ebangi
With Support from the Project Team:
California Center for Regional LeadershipTrish KellyProject Director
Seth MillerInterim CEO
Nick BollmanSenior Advisor
—And—
Mike McCoyPrincipal Investigator, Information Center for the Environment,U.C. Davis
Wallace WalrodManaging Partner, Tech Coast Consulting Group LLC
Caltrans, Division of Transportation PlanningNieves Xochitl CastroAssociate Transportation Planner,Office of Regional and Interagency Planning
Pamela KorteProject Manager, California Transportation Plan,Office of State Planning
Marilee MortensonProject Manager, Regional Blueprint Planning Program,Office of Regional and Interagency Planning
Terry ParkerAssociate Senior Transportation Planner,Office of Community Planning
Jake SmithChief, California Transportation Plan,Action Element and Planning Policy Research Senior TransportationPlanner, Strategic Planning, Office of State Planning
Caltrans, Divison of TransportationSystem InformationTremain DowneyChief, Office of Performance Measures and Data Analysis
Caltrans, Division of Traffic OperationsSarah ChesebroSenior Transportation PlannerSHOPP .310 and .315 Program Advisor
Rex CluffAssociate Transportation PlannerHighway Congestion Management Program (HICOMP)
Special Thanks to the State Agencyand Other Partners for ProvidingValuable Data and Expertise:Andrea GoughEnergy Specialist, California Energy Commission
Nancy McKeeverSustainable Energy Planner, California Energy Commission
Molly PenberthManager, Farmland Mapping and Monitoring Program, CaliforniaDepartment of Conservation
David ShabazianSenior Planner, Sacramento Area Council of Governments
Luree StetsonGreat Places Program, California Resources Agency
Maegan Leslie TorresGreenInfo Network
Linda WheatonAssistant Deputy Director, Division of Housing Policy Development,Department of Housing and Community Development
design: 3x3 | palo alto

CCRL Board of Directors:
Dan Mazmanian, Interim ChairBedrosian Chair in Governance,School of Policy,Planning and Development,University of Southern California
Julie Meier WrightSan Diego Regional EconomicDevelopment Corporation
David AbelMetropolitan Forum Project
PROJECT SPONSORS
Christopher CabaldonMayor, City of West Sacramento
Randal HernandezBank of America
Robert HertzbergMayer, Brown, Rowe and Maw
Jim WundermanBay Area Council
The California Center for Regional Leadership (CCRL)collaborates with civic and government leaders as they confrontthe most pressing challenges to California’s economy and qualityof life. With a focus on innovative regional strategies and statepolicy reforms, CCRL works with its partners to advanceCalifornia’s economy while securing environmental stewardship,effective citizen participation, and economic and socialopportunity for all.
200 Pine Street, Suite 400, San Francisco, CA 94194415-445-8975
Printed in the U.S.A. on recycled paper
UC DavisInformation Center
for theEnvironment (ICE)