california rice commission water quality programs · california rice commission water quality...
TRANSCRIPT
DRAFT Quality Assurance Project Plan
for
California Rice Commission
Water Quality Programs
Rice Pesticides Program (RPP) Conditional Waiver for Rice Program (CWFR)
and Algae Management Plan (AMP)
QAPP Revision Number: Version 2.0 FINAL (update of the June 2009 Version 1.0 QAPP to reflect the requirements of MRP R5-2010-0805)
Prepared by
CH2M HILL, Inc.
In collaboration with
California Rice Commission and Kleinfelder, Inc.
Based on the Surface Water Ambient Monitoring Program (SWAMP) Electronic Template (SWRCB, 2008)
and the Quality Assurance Project Plan Guidelines for California Rice Commission Order No. R5-2010-0805

CRC_2010QAPP_Final_7-21-2010.doc Page 1 of 125
GROUP A ELEMENTS: PROJECT MANAGEMENT 1. TITLE AND APPROVAL SHEETS
Quality Assurance Project Plan
for
PROJECT NAME: California Rice Commission Water Quality Programs Rice Pesticide Program and Conditional Waiver for Rice
QAPP Revision Number: Version 2.0 FINAL Submitted for Review by the California Rice Commission
Date: April 2010 (update of the June 2009 Version 1.0 QAPP to reflect the requirements of MRP R5-2010-0805)
NAME OF RESPONSIBLE ORGANIZATION : California Rice Commission
APPROVAL SIGNATURES
IMPLEMENTING ORGANIZATION:
Title: Name: Signature: Date:
Program Manager Roberta Firoved/CRC

CRC_2010QAPP_Final_7-21-2010.doc Page 2 of 125
GROUP A ELEMENTS: PROJECT MANAGEMENT 1. TITLE AND APPROVAL SHEETS
Quality Assurance Project Plan
for
PROJECT NAME: California Rice Commission Water Quality Programs Rice Pesticide Program and Conditional Waiver for Rice
QAPP Revision Number: Version 2.0 FINAL Submitted for Review by the California Rice Commission
Date: April 2010 (update of the June 2009 Version 1.0 QAPP to reflect the requirements of MRP R5-2010-0805)
NAME OF RESPONSIBLE ORGANIZATION : California Rice Commission
APPROVAL SIGNATURES
IMPLEMENTING ORGANIZATION:
Title: Name: Signature: Date:
Project Reporting Lead Summer Bundy/CH2M HILL

CRC_2010QAPP_Final_7-21-2010.doc Page 3 of 125
GROUP A ELEMENTS: PROJECT MANAGEMENT 1. TITLE AND APPROVAL SHEETS
Quality Assurance Project Plan
for
PROJECT NAME: California Rice Commission Water Quality Programs Rice Pesticide Program and Conditional Waiver for Rice
QAPP Revision Number: Version 2.0 FINAL Submitted for Review by the California Rice Commission
Date: April 2010 (update of the June 2009 Version 1.0 QAPP to reflect the requirements of MRP R5-2010-0805)
NAME OF RESPONSIBLE ORGANIZATION : California Rice Commission
APPROVAL SIGNATURES
IMPLEMENTING ORGANIZATION:
Title: Name: Signature: Date:
QA Officer Jenny Krenz-Ruark/CH2M HILL


CRC_2010QAPP_Final_7-21-2010.doc Page 5 of 125
GROUP A ELEMENTS: PROJECT MANAGEMENT 1. TITLE AND APPROVAL SHEETS
Quality Assurance Project Plan
for
PROJECT NAME: California Rice Commission Water Quality Programs Rice Pesticide Program and Conditional Waiver for Rice
QAPP Revision Number: Version 2.0 FINAL Submitted for Review by the California Rice Commission
Date: April 2010 (update of the June 2009 Version 1.0 QAPP to reflect the requirements of MRP R5-2010-0805)
NAME OF RESPONSIBLE ORGANIZATION : California Rice Commission
APPROVAL SIGNATURES
IMPLEMENTING ORGANIZATION:
Title: Name: Signature: Date:
Project Monitoring Lead Jennifer Parson/Kleinfelder

CRC_2010QAPP_Final_7-21-2010.doc Page 7 of 125
GROUP A ELEMENTS: PROJECT MANAGEMENT 1. TITLE AND APPROVAL SHEETS
Quality Assurance Project Plan
for
PROJECT NAME: California Rice Commission Water Quality Programs Rice Pesticide Program and Conditional Waiver for Rice
QAPP Revision Number: Version 2.0 FINAL Submitted for Review by the California Rice Commission
Date: April 2010 (update of the June 2009 Version 1.0 QAPP to reflect the requirements of MRP R5-2010-0805)
NAME OF RESPONSIBLE ORGANIZATION : California Rice Commission
APPROVAL SIGNATURES
LABORATORY QA OFFICERS
Title: Name: Signature: Date:
Lab QA Officer ________________________/McCampbell Analytical Inc.


CRC_2010QAPP_Final_7-21-2010.doc Page 9 of 125
GROUP A ELEMENTS: PROJECT MANAGEMENT 1. TITLE AND APPROVAL SHEETS
Quality Assurance Project Plan
for
PROJECT NAME: California Rice Commission Water Quality Programs Rice Pesticide Program and Conditional Waiver for Rice
QAPP Revision Number: Version 2.0 FINAL Submitted for Review by the California Rice Commission
Date: April 2010 (update of the June 2009 Version 1.0 QAPP to reflect the requirements of MRP R5-2010-0805)
NAME OF RESPONSIBLE ORGANIZATION : California Rice Commission
APPROVAL SIGNATURES
LABORATORY QA OFFICERS
Title: Name: Signature: Date:
Lab QA Officer ________________________/ CLS

CRC_2010QAPP_Final_7-21-2010.doc Page 10 of 130
GROUP A ELEMENTS: PROJECT MANAGEMENT 1. TITLE AND APPROVAL SHEETS
Quality Assurance Project Plan
for
PROJECT NAME: California Rice Commission Water Quality Programs Rice Pesticide Program and Conditional Waiver for Rice
QAPP Revision Number: Version 2.0 FINAL Submitted for Review by the California Rice Commission
Date: April 2010 (update of the June 2009 Version 1.0 QAPP to reflect the requirements of MRP R5-2010-0805)
NAME OF RESPONSIBLE ORGANIZATION : California Rice Commission
APPROVAL SIGNATURES
LABORATORY QA OFFICERS
Title: Name: Signature: Date:
Lab QA Officer No signature required for AQUA-Science. AQUA-Science (or other toxicity lab) will review and sign in years for which aquatic toxicity testing is included in the CRC’s MRP.
_________________________/AQUA-Science Lab

CRC_2010QAPP_Final_7-21-2010.doc Page 11 of 125
GROUP A ELEMENTS: PROJECT MANAGEMENT 1. TITLE AND APPROVAL SHEETS
Quality Assurance Project Plan
for
PROJECT NAME: California Rice Commission Water Quality Programs Rice Pesticide Program and Conditional Waiver for Rice
QAPP Revision Number: Version 2.0 FINAL Submitted for Review by the California Rice Commission
Date: April 2010 (update of the June 2009 Version 1.0 QAPP to reflect the requirements of MRP R5-2010-0805)
NAME OF RESPONSIBLE ORGANIZATION : California Rice Commission
APPROVAL SIGNATURES
LABORATORY QA OFFICERS
Title: Name: Signature: Date:
Lab QA Officer No signature required for Nautilus. Nautilus (or other sediment toxicity lab) will review and sign in years for which sediment toxicity testing is included in the CRC’s MRP.
______________/ Nautilus Environmental Lab


CRC_2010QAPP_Final_7-21-2010.doc Page 13 of 125
GROUP A ELEMENTS: PROJECT MANAGEMENT 1. TITLE AND APPROVAL SHEETS
Quality Assurance Project Plan
for
PROJECT NAME: California Rice Commission Water Quality Programs Rice Pesticide Program and Conditional Waiver for Rice
QAPP Revision Number: Version 2.0 FINAL Submitted for Review by the California Rice Commission
Date: April 2010 (update of the June 2009 Version 1.0 QAPP to reflect the requirements of MRP R5-2010-0805)
NAME OF RESPONSIBLE ORGANIZATION : California Rice Commission
APPROVAL SIGNATURES
REGIONAL BOARD:
Title: Name: Signature: Date:
Conditional Waiver for Rice
Margaret Wong/CVRWQCB
QA Officer Leticia Valadez/CVRWQCB

CRC_2010QAPP_Final_7-21-2010.doc Page 14 of 125
2. TABLE OF CONTENTS Page:
Group A Elements: Project Management.............................................................................................................1
1. Title and Approval Sheets ....................................................................................................................................1
2. Table of Contents .................................................................................................................................................14
3. Distribution List ...................................................................................................................................................18
4. Project/Task Organization .................................................................................................................................19
5. Problem Definition/Background .......................................................................................................................25
6. Project/Task Description...................................................................................................................................29
7. Quality Objectives and Criteria for Measurement Data.................................................................................41
8. Special Training Needs/Certification...............................................................................................................51
9. Documents And Records....................................................................................................................................53
Group B: Data Generation and Acquisition ......................................................................................................57
10. Sampling Process Design..................................................................................................................................57
11. Sampling Methods.............................................................................................................................................79
12. Sample Handling and Custody .......................................................................................................................85
13. Analytical Methods ...........................................................................................................................................91
14. Quality Control ..................................................................................................................................................99
15. Instrument/Equipment Testing, Inspection, and Maintenance..................................................................99
16. Instrument/Equipment Calibration and Frequency ....................................................................................99
17. Inspection/Acceptance of supplies and Consumables ................................................................................99
18. Non-Direct Measurements (Existing Data) ....................................................................................................99
19. Data Management..............................................................................................................................................99
Group C: Assessment and Oversight..................................................................................................................99
20. Assessments & Response Actions ...................................................................................................................99
21. Reports to Management....................................................................................................................................99
Group D: Data Validation and Usability ............................................................................................................99
22. Data Review, Verification, and Validation Requirements ...........................................................................99
23. Verification and Validation Methods..............................................................................................................99
24. Reconciliation with User Requirements .........................................................................................................99

2. Table of Contents
CRC_2010QAPP_Final_7-21-2010.doc Page 15 of 130
LIST OF APPENDICES
Appendix A: Program Maps A-1: 2009 Rice Acreages A-2: CWFR and RPP Monitoring Sites A-3: BS1, Butte Slough 1 A-4: CBD1, Colusa Basin Drain 1 A-5: CBD5, Colusa Basin Drain 5 A-6: SSB, Sacramento Slough Bridge A-7: F, Lurline Creek; upstream site of CBD5 A-8: G, Cherokee Canal; upstream site for BS1 A-9: H, Obanion Outfall at DWR PP on Obanion Rd A-10: SR1, Sacramento River 1 Appendix B: Forms B-1: Calibration Record B-2 Field Data Sheet B-3: Stream flow Data Sheet B-4: Chain-of-Custody Form B-5: Training Certification Form Appendix C: Data Management C-1: SWAMP Compatible Data Submission Guide for Water Quality Chemistry Data C-2: SWAMP Compatible Data Submission Guide for Water Quality Toxicity Data C-3: SWAMP Compatible Data Workbook for Water Quality Chemistry Data C-4: SWAMP Compatible Data Workbook for Water Quality Toxicity Data C-5: SWAMP Compatible Data Workbook for Field Data
Appendix D: Laboratory QA Manuals and Methods D-1: McCampbell Analytical QA Manual D-2: McCampbell Analytical SOP for EPA 200.7 (proprietary) D-3: McCampbell Analytical SOP for EPA 200.8(proprietary) D-4: McCampbell Analytical SOP for EPA 547 (proprietary) D-5: McCampbell Analytical SOP for TDS D-6: McCampbell Analytical Modified SOP for EPA 525.2 (proprietary) D-7: McCampbell Analytical SOP for Penoxsulam by HPLC (proprietary) D-8: McCampbell Analytical SOP for Hardness by 2340 (calculation) D-9: AQUA-Science QA Manual D-10: AQUA-Science SOP for Chronic Algae (4th Edition) (proprietary) D-11: AQUA-Science SOP for Acute Fathead Minnow (5th Edition) (proprietary) D-12: AQUA-Science SOP for Acute Ceriodaphnia dubia (5th Edition) (proprietary) D-13: Nautilus QA Manual D-14: Nautilus SOP for 10 Day Hyalella (proprietary) D-15: Valent SOP for Thiobencarb (proprietary) D-16: McCampbell Analytical Modified SOP for EPA 532 (proprietary) D-17 CLS Labs Analytical QA Manual D-18 CLS Labs Analytical SPO for EPA 507 (proprietary)

2. Table of Contents
CRC_2010QAPP_Final_7-21-2010.doc Page 16 of 130
LIST OF FIGURES
Figure 4-1: Organization Chart ........................................................................................................................... 12
Figure 10-1: Network of stations for which sampling results were evaluated……………………………..45
LIST OF TABLES
Table 3-1: Distribution List............................................................................................................................. 18
Table 4-1: Personnel Responsibilities............................................................................................................ 22
Table 5-1: MRP Plan Objectives and Approaches ....................................................................................... 26
Table 5-2: Rice Pesticide Program Performance Goals............................................................................... 27
Table 6-1: Summary of Work to be Performed............................................................................................ 29
Table 6-2: Monitoring Sites, Frequency, Schedule and Parameters.......................................................... 29
Table 6-3: CWFR and RPP 2010 Monitoring Sites....................................................................................... 31
Table 6-4: CWFR Project Schedule ................................................................................................................ 36
Table 6-5: CWFR and RPP Overview Schedule........................................................................................... 37
Table 7-1: Data Quality Objectives and Criteria for Measurement Data ................................................ 41
Table 7-2: Performance Criteria Goals (Methods and Reporting Limits) ................................................ 42
Table 7-3: Analytical Laboratories and Methods ........................................................................................ 43
Table 9-1: Forms and Reports Produced for Sampling Events.................................................................. 50
Table 10-1: Assessment and Core Monitoring Cycle.................................................................................... 54
Table 10-2: Candidate Corollary Assessment Sites and Corresponding Drainages................................. 60
Table 10-3: Characteristics of Drainages Tributary to Candidate Assessment Sites Corollary to CBD5.................................................................................................................... 61
Table 10-4: Characteristics of Drainages Tributary to Candidate Assessment Sites Corollary to BS1 .. 61
Table 10-5: Characteristics of Drainages Tributary to Candidate Assessment Sites Corollary to SSB .. 61
Table 10-6: Selected Assessment Sites ............................................................................................................ 62
Table 10-7: Recommendations for Timing of Specific Rice Herbicide Applications ................................ 64
Table 10-8: Timing of Herbicide Tank Mix Combinations........................................................................... 65
Table 10-9: Timing of Specific Rice Insecticide Applications ...................................................................... 65
Table 10-10: Timing of Sequential Rice Herbicide Applications.................................................................. 66
Table 10-11: 2010 Monitoring Schedule........................................................................................................... 68
Table 10-12: Numbers of Bottles for Each Sampling Event ........................................................................... 70
Table 12-1: Water Sample Analysis Sample Containers, Volume, Preservation, and Holding Time .... 81
Table 12-2: Sediment Analysis Sample Containers, Volume, Preservation, and Holding Time ............ 82

2. Table of Contents
CRC_2010QAPP_Final_7-21-2010.doc Page 17 of 130
Table 13-1: Field Analytical Methods ............................................................................................................. 87
Table 13-2: Laboratory Analytical Methods................................................................................................... 88
Table 13-3: Field Testing Required Corrective Actions................................................................................ 89
Table 13-4: Lab Analysis Required Corrective Actions................................................................................ 90
Table 13-5: Toxicity Testing Required Corrective Actions........................................................................... 91
Table 21-1: QA management reports. ........................................................................................................... 117
LIST OF ACRONYMS
COC Chain-of-Custody CRC California Rice Commission CWFR Conditional Waiver for Rice D.O. dissolved oxygen MDL Method Detection Limit mg/L milligrams per liter MS/MSD Matrix Spike/Matrix Spike Duplicate PQL Practical Quantification Limit RPP Rice Pesticides Program RWQCB Regional Water Quality Control Board AMP Algae Management Plan AMR Annual Monitoring Report RPD relative percent difference LSS Laboratory Control Spike (LCS) LCSD Laboratory Control Spike Duplicate ppt parts per thousand

CRC_2010QAPP_Final_7-21-2010.doc Page 18 of 125
3. DISTRIBUTION LIST This distribution list provides a comprehensive list of the individuals and organization that will require a copy of the approved QAPP and subsequent revisions. It is assumed that the individuals named on this list will be those who will receive and retain a copy of the QAPP.
TABLE 3-1 Distribution List
Title Name (Affiliation) Email Tel. No. QAPP No
Program Manager Roberta Firoved/CRC [email protected] 916-387-2264 2.0
Reporting Project Lead (CH2M HILL)
Summer Bundy/CH2M HILL
[email protected] 510-439-7593 (cell) 2.0
Monitoring Project Lead (Kleinfelder)
Jennifer Parson/Kleinfelder
[email protected] 916-366-2434 2.0
QA Officer Jenny Krenz-Ruark/CH2M HILL
[email protected] 916-335-6267 (cell) 2.0
Regional Board Irrigated Lands Program
Joe Karkoski/CVRWQCB [email protected] 2.0
Regional Board Irrigated Lands Program CRC Liaison
Margaret Wong/CVRWQCB
Regional Board QA Officer
Leticia Valadez/CVRWQCB
McCampbell Analytical Inc.
Ed Hamilton [email protected] 925-798-1620 2.0
Valent Lab Director Charles Green Charles.Green@valent 925-948-2928 2.0
AQUA-Science Lab Director
Jeff Miller [email protected] 530-753-5456 2.0
Nautilus Environmental Lab Director
Steve Carlson Chris Stransky
[email protected] [email protected]
858-587-7333 2.0

CRC_2010QAPP_Final_7-21-2010.doc Page 19 of 125
4. PROJECT/TASK ORGANIZATION The Project Organization element provides for a detailed breakdown of key participating individuals and organizations identifying their individual roles and responsibilities within the project. This element also provides information about the chain of authority and at what level key decisions and project assessment reviews will take place.
4.1 Involved parties and roles
The California Rice Commission (CRC) is a statutory organization representing about 2,500 rice farmers who farm approximately 500,000 acres of California farmland. The CRC implements water quality monitoring and reporting activities in compliance with two programs of the Central Valley Regional Water Quality Control Board (CVRWQCB). The CRC implements Conditional Waiver for Rice (CWFR) monitoring and reporting, pursuant to the Monitoring and Reporting Program (MRP) issued under the CVRWQCB’s Conditional Waiver for Waste Discharge Requirements for Discharges from Irrigated lands. The CRC also implements the Rice Pesticides Program (RPP), pursuant to the Conditional Prohibition of Discharge requirements specified in the Water Quality Control Plan for the Sacramento and San Joaquin River Basins (Basin Plan).
The CRC implements the RPP and CWFR utilizing consulting contracts with two engineering consultant firms: field activities and laboratory services are contracted with Kleinfelder Engineers, and reporting activities are contracted with CH2M HILL. Kleinfelder subcontracts with several analytical labs, described below, to perform required chemical and biological testing.
The following generally describes the roles and responsibilities with respect to the monitoring and reporting aspect of the program:
• Sampling (Kleinfelder): Following field sampling, Kleinfelder submits samples to laboratories for analysis in accordance with a Quality Assurance Program Plan (QAPP) and emails CH2M HILL the field data sheets (containing flow measurements and field parameter measurements).
• Laboratory Analysis: The following labs are used
• McCampbell Analytical, Inc.: Pesticide analysis lab
• AQUA-Science: Aquatic toxicity testing. Toxicity testing is included in the 2012 requirements only.
• Nautilus: Sediment toxicity testing (subcontractor to AQUA-Science). Toxicity testing is included in the 2012 requirements only.
• Valent Lab: Thiobencarb analysis
• Data Entry and Review of Field Data (CH2M HILL): CH2M HILL enters the field data into a SWAMP compatible excel spreadsheet and compares data to water quality thresholds. Where water quality thresholds are exceeded, an Exceedance Report is prepared for the CRC’s review and submittal.

4. Project/Task Organization
CRC_2010QAPP_Final_7-21-2010.doc Page 20 of 130
• Receipt and Transfer of Chemistry Data (Kleinfelder): When Kleinfelder receives results from the analytical labs (for pesticides, metals, hardness), the results are emailed to the CRC (Roberta Firoved) and CH2M HILL (Summer Bundy and Jenny Krenz-Ruark). Kleinfelder is the primary point of contact with each of the labs.
• Data Entry and Review of Chemistry Data (CH2M HILL): CH2M HILL filters the analytical data into an excel spreadsheet and compares data to water quality thresholds. Where water quality thresholds are exceeded, an Exceedance Report is prepared for the CRC’s review.
• Receipt and Transfer of Toxicity Data (Kleinfelder): When Kleinfelder receives results from the toxicity lab, the results are emailed to the CRC (Roberta Firoved) and CH2M HILL (Summer Bundy). Toxicity testing is included in the 2012 requirements only.
• Data Entry and Review of Toxicity Data (CH2M HILL): When results are judged to show “significant toxicity”, CH2M HILL, Kleinfelder, and the CRC consult (via email or conference) to determine the next steps and provide direction to the lab. CH2M HILL is responsible for summarizing the results in a format to be used in the Annual Report. Toxicity testing is included in the 2012 requirements only.
4.2 Responsibilities
Program Manager
The Program Manager is responsible for overall management and oversight of the CRC’s water quality programs. She manages the consulting contracts and is the final authority for reporting to the CVRWQB.
The California Rice Commission is the lead agency responsible for monitoring and reporting under the RPP and CWFR. The CRC contracts with two firms, Kleinfelder and CH2M HILL, to complete the majority of the monitoring and reporting. The CRC also contracts with Valent for thiobencarb analysis. The Program manager is responsible for overseeing all aspects of the project, including supervision of contracted consultants.
Roberta Firoved is CRC’s Program Manager.
Field Project Manager
Kleinfelder is responsible for all of the field and laboratory aspects of the project. This includes scheduling of field staff, sampling according to the sampling calendar, scheduling of resampling events within the approved timeframe, transportation of samples to the contracted laboratories, and submittal of field sheets and results to both the CRC and CH2M HILL.
Kleinfelder contracts with several labs to complete the analyses not conducted in the field. These labs are described above and listed in Table 4-1, and are expected to analyze submitted samples in accordance with all method and quality assurance requirements found in this QAPP. These labs also serve as technical resources to Kleinfelder, CH2M HILL, and the CRC.
Jennifer Parson/Kleinfelder is the Field Project Manager.

4. Project/Task Organization
CRC_2010QAPP_Final_7-21-2010.doc Page 21 of 130
Reporting Project Manager
CH2M HILL is responsible for reviewing all field and lab results for completeness and quality, and for preparing the Annual Monitoring Report to satisfy the requirements of the CWFR and RPP.
Summer Bundy/CH2M HILL is the Reporting Project Manager.
Quality Assurance (QA) Officer
The QA Officer assists in developing the quality assurance and quality control procedures found in this QAPP as part of the sampling, field analysis, and laboratory analysis procedures. The QA Officer receives field results from Kleinfelder and laboratory results from the individual labs, and reviews the results to ensure they meet compliance standards. If samples outside of the standards are noticed, the QA Officer contacts Jennifer Parson/Kleinfelder, who communicates all quality assurance and quality control issues contained in this QAPP to the laboratory managers and follows through with implementation of the Program Corrective Actions.
Jenny Krenz-Ruark/CH2M HILL is the Quality Assurance Officer.
Lead Field Technician
Mark Lee/Kleinfelder is the Lead Field Technician.
Laboratory Directors
Lab directors are responsible for the implementation of this QAPP, with respect to laboratory analyses.
Lab directors working on this program are listed in Table 4-1.
CVRWQCB CRC Liaison
The CVRWQCB CRC Liaison is the assigned staff person of the CVRWQCB who is knowledgeable about the CWFR and RPP program requirements and the basis of the requirements. The CVRWQCB CRC Liaison reviews the results of the CRC’s monitoring programs and communicates findings and conclusions to the CRC and CVRWQCB. The CVRWQCB CRC Liaison also coordinates with the CVRWQCB QA Officer for review of the CRC’s QAPP.
Margaret Wong is the CVRWQCB CRC Liaison.
CVRWQCB QA Officer
The CVRWQCB QA Officer, at the request of the CVRWQCB CRC Liaison, reviews and comments on the QAPP.
Leticia Valadez is the CVRWQCB QA Officer

4. Project/Task Organization
CRC_2010QAPP_Final_7-21-2010.doc Page 22 of 130
TABLE 4-1 Personnel Responsibilities
Name Organizational Affiliation Title Contact Information (Telephone number, fax number, email address.)
Roberta Firoved California Rice Commission Program Manager 916-387-2264 [email protected]
Jennifer Parson Kleinfelder, Inc. Field and Lab Coordinator; Data Management
916-366-1701 [email protected]
Mark Lee Kleinfelder, Inc. Lead Field Technician 916-336-1701 [email protected]
Summer Bundy CH2M HILL, Inc. Project Manager, Reporting and Data Management
cell 510-439-7593 fax 510-622-9132 [email protected]
Jenny Krenz-Ruark CH2M HILL, Inc. QA Officer cell 916-335-6267 [email protected]
Ed Hamilton McCampbell Analytical, Inc Lab Director 925-798-1620
Scott Furnace CLS Labs Lab Director 916-638-7301
Jeff Miller AQUA-Science Lab Director 530-753-5456
Charles Green Valent Lab Director Manager/QA
925-948-2928 Charles.Green@valent,com
Margaret Wong CVRWQCB CRC Liaison [email protected]
Leticia Valadez CVRWQCB CVRWQCB QA Officer [email protected]

4. Project/Task Organization
CRC_2010QAPP_Final_7-21-2010.doc Page 23 of 130
4.3 Organizational Chart
Figure 4-1 shows the organization chart.
Roberta FirovedCalifornia Rice Commission
Jennifer ParsonField Activities
Field Crew
LABS
Ed HamiltonMcCampbell Analytical Inc.
Jenny Krenz-RuarkQA Off icer
Summer BundyData Management
Jef f Miller Aquascience
Charles GreenValent
Nautilaus
Regional Water Quality Control Board
QA Officer Margaret WongCVRWQCB CRC Liaison
Annual Monitoring Reports and Exceedance Reports
Scott FurnasCLS Labs
FIGURE 4-1 Organization Chart
4.5 Persons responsible for QAPP update and maintenance.
Changes and updates to this QAPP may be made after a review of the evidence for change by the Reporting Project Manager, Summer Bundy/CH2M HILL, and the Quality Assurance Officer, Jenny Krenz-Ruark/CH2M HILL, with the concurrence of both to the CVRWQCB CRC Liaison. Summer Bundy will be responsible for making the changes, submitting drafts for review, submitting the revisions to the CRC Program Manager for approval, preparing a final copy, and submitting the final for signature.

4. Project/Task Organization
CRC_2010QAPP_Final_7-21-2010.doc Page 24 of 130
4.6 Program Advisors
Program advisors, including technical experts from CH2M HILL, Kleinfelder, the analytical labs, and the UC Cooperative Extension may be relied upon to provide additional technical support on an as-needed basis.

CRC_2010QAPP_Final_7-21-2010.doc Page 25 of 125
5. PROBLEM DEFINITION/BACKGROUND The Problem Definition/Background element provides for a statement of the Project objectives and an overview of historical background for the problem the project is addressing. Existing and applicable regulatory information will also be identified within this section.
5.1 Program Objectives
CWFR
The objectives of the CWFR Monitoring Program are based on the goals defined in the agricultural conditional waiver. The specific objectives are to:
• assess the impacts of waste discharges from irrigated lands to the Sacramento River Basin; • determine the degree of implementation of management practices to reduce discharge of
specific wastes that impact water quality; • determine the effectiveness of management practices and strategies to reduce discharges of
wastes that impact water quality; • determine concentration and load of waste in these discharges to surface waters; and, • evaluate compliance with existing narrative and numeric water quality objectives to
determine if additional implementation of management practices is necessary to improve and/or protect water quality.
RPP
The objective of the RPP Monitoring Program is to monitor for the Basin Plan performance goals for thiobencarb, which apply to drain monitoring sites. Enforcement of water holding requirements takes place at the county agricultural commissioner (CAC) level with Department of Pesticide Regulation (DPR) oversight. Previous monitoring has determined that a correlation exists between drain exceedances and water holding violations.
5.2 Approaches to Meet Objectives
The approaches that will be used to achieve the program objectives are shown in Table 5-1.

5. Problem Definition/Background
CRC_2010QAPP_Final_7-21-2010.doc Page 26 of 130
TABLE 5-1 MRP Plan Objectives and Approaches
MRP Plan Objective Approach to Achieving the Objective
1. Determine whether the discharge of waste from irrigated lands within the Coalition Group boundaries causes or contributes to exceedances of applicable water quality standards or causes nuisance;
Monitor at representative locations within Coalition Group boundaries, select representative constituents for monitoring and analysis, compare monitoring results against water quality objectives and thresholds.
2. Provide information about the Coalition Group area characteristics, including but not limited to, land use, crops grown, and chemicals used;
Report pesticide use information and county rice acreage annually (Annual Report)
3. Monitor the effectiveness of management practices implemented to address exceedances of applicable water quality standards;
When water quality concerns are identified, assess MP implementation.
4. Determine which management practices are most effective in reducing wastes discharged to surface waters from irrigated lands;
Evaluate water quality monitoring results to identify water quality concerns. When water quality concerns are identified, assess MP implementation.
5. Specify details about monitoring periods, parameters, protocols, and quality assurance; Provide information to support the designation of
monitoring periods, including cropping calendar and timing of pesticide use, use Table II.D from the January 2008 MRP as a basis and provide technical basis for any deviation from Table II.D, develop and implement QAPP, update QAPP as necessary to reflect approved program changes.
6. Support the development and implementation of the Conditional Waiver; Monitoring, data analysis (overall trends, spatial
and temporal trends), reporting management practice implementation, submit annual monitoring report.
7. Verify the adequacy and effectiveness of the Conditional Waiver’s conditions; and Monitoring, data analysis, submit annual report.
8. Evaluate the Coalition Group’s compliance with the terms and conditions of the Conditional Waiver. Monitoring, data analysis, submit annual report.
5.3 Applicable Regulatory Information
The CVRWQCB regulates waters of the State within the study area covered by this program. Applicable water quality standards are identified in the Regional Board’s CVRWQCB Basin Plan.
The CRC implements water quality monitoring and reporting activities in compliance with the following two programs of the CVRWQCB:
• The CWFR monitoring and reporting, pursuant to the Monitoring and Reporting Programs (MRP) issued under the CVRWQCB’s Conditional Waiver of Waste

5. Problem Definition/Background
CRC_2010QAPP_Final_7-21-2010.doc Page 27 of 130
Discharges Requirements for Discharges from Irrigated Lands (Irrigated Lands Regulatory Program, ILRP), including:
o Monitoring and Reporting Program Order No. R5-2010-0805 under Resolution No. R5-2006-0053 as amended by 2006-0077 and 2009-0809, covering the period March 2010 through December 31, 2012
o 2010 Algae Management Plan (April 27, 2010)
o 2010 Propanil Management Plan (April 27, 2010)
• Rice Pesticides Program (RPP), pursuant to the Conditional Prohibition of Discharge requirements specified in the Water Quality Control Plan for the Sacramento and San Joaquin River Basins (Basin Plan).
Table 5-2 shows the Basin Plan performance goals for thiobencarb, which is monitored under the RPP.
TABLE 5-2 Rice Pesticide Program Performance Goals
Chemical Product Name Class ug/L* Water Hold
Thiobencarb AbolishTM (liquid) Bolero® (granular) Herbicide 1.5 AbolishTM 19 days
Bolero® 30 days
* Daily maxima
5.4 Decisions or Outcomes
With respect to the CWFR monitoring, it is expected to assist in the following:
• Inform the development of monitoring conducted in subsequent years
• Identify need for management plans and/or special studies
• Confirm core sites as representative
With respect to the RPP, it is expected to inform interested parties about the attainment of RPP performance goals for thiobencarb, and provide program recommendations to the CVRWQCB to maintain those standards.

CRC_2010QAPP_Final_7-21-2010.doc Page 28 of 130
5.5 Project Background/Historic Information
CWFR
The CRC implements water quality monitoring and reporting activities in compliance with two programs of the CVRWQCB. The CRC implements the CWFR MRP issued under the CVRWQCB’s Conditional Waiver of Waste Discharges Requirements for Discharges from Irrigated Lands [now the Irrigated Lands Regulatory Program (ILRP)]. The CRC also implements the RPP, pursuant to the Conditional Prohibition of Discharge requirements specified in the Basin Plan.
The CRC has undertaken water quality management activities since the 1980’s. The efforts began under the RPP and, beginning in 2004, included efforts under the CWFR. The CWFR includes routine monitoring, as well as monitoring in support of special studies. A description of the historical context of rice water quality management efforts in the Sacramento Valley follows.
RPP
In 1983, California’s pesticide regulatory agency (now DPR, then a California Department of Food and Agriculture (CDFA) division), the CACs, the Department of Fish and Game (DFG), State Water Resources Control Board (SWRCB), CVRWQCB and the rice industry worked together to develop and implement a plan to control discharges of pesticides from rice fields. In 1990, the CVRWQCB established a water quality objective based on the secondary Maximum Contaminant Level (MCL) for thiobencarb in the Basin Plan for the Sacramento River and San Joaquin River Basins. The Basin Plan also established performance goals for molinate and thiobencarb in 1990.
Several pesticides have been utilized on rice and have been monitored throughout the life of the RPP. Thiobencarb and molinate were once the most widely used rice pesticides, and are the focus of the annual monitoring. A molinate cancellation is in place with a five year phase out ending in 2008, and molinate use beyond 2009 is prohibited. Thiobencarb is the only rice pesticide monitored under the RPP beginning in 2010.
The objective of the RPP is to protect water quality in receiving waters adjacent to rice fields, including agricultural drains. Over the years, the RPP has proven successful in significantly reducing rice pesticides in the Sacramento River.

CRC_2010QAPP_Final_7-21-2010.doc Page 29 of 125
6. PROJECT/TASK DESCRIPTION 6.1 Detailed Summary of Work to Be Performed
The CWFR requirements span a three-year monitoring schedule, which includes two years of core monitoring (2010 and 2011), followed by a year of assessment monitoring (2012). Table 6-1 shows a detailed summary of the sampling and analysis to be conducted under the CWFR and RPP. Table 6-2 details the monitoring sites, frequency, schedule, and parameters for each of the three years.
TABLE 6-1 Summary of Work to be Performed
Constituent Type of Monitoring Frequency Programs
Field parameters: pH electrical conductivity dissolved oxygen temperature turbidity flow
Assessment and core All sampling events CWFR/RPP 1
General physical parameters: hardness total dissolved solids total organic carbon (toc)
Assessment and Core All sampling events CWFR
Nutrient Analysis: total Kjeldahl nitrogen nitrate + nitrite (as N) total ammonia Unionized ammonia (calculated) total phosphorous (as P) soluble orthophosphate
Assessment only (2012)
Monthly in July and August CWFR
Water column toxicity 2: Selenastrum capricornutum Ceriodaphnia dubia Pimephales promelas
Assessment only (2012)
Monthly from April through August
CWFR
Photo monitoring (digital) Assessment and Core To be taken initially, and as needed to document site changes that could affect
monitoring results
CWFR
Metals: Copper, dissolved
Assessment only (included in 2010 to
complete assessment monitoring, also 2012)
Monthly during April and May CWFR
RPP pesticide: thiobencarb
RPP RPP Schedule 3 RPP

6. Project/Task Description
CRC_2010QAPP_Final_7-21-2010.doc Page 30 of 130
TABLE 6-1 Summary of Work to be Performed
Constituent Type of Monitoring Frequency Programs
Pesticides: propanil Special Project Monitoring will be conducted at core and assessment site
Lurline Creek (F), in conjunction with the Rice Pesticides Program, on a
weekly basis during the month of June and possibly into early
July.
Propanil Management
Plan
Pesticides Assessment only (2012)
To be determined CWFR
Sediment toxicity: Hyalella azteca 4
Assessment (2012)
Once during fall drainage
CWFR
Sediment Pesticides: Lambda Cyhalothrin S-Cypermethrin
Assessment (2012)
Required only if sediment toxicity is observed b
CWFR
Sediment TOC Assessment Taken with sediment toxicity CWFR
1 – RPP field parameters include temperature, dissolved oxygen, and turbidity
2 Water column toxicity analyses shall be conducted on 100% (undiluted) sample for the initial screening with sufficient sample collected to allow the laboratory to conduct a Toxicity Identification Evaluation (TIE) on the same sample should toxicity be detected. The TIE shall be performed immediately if a 50% or greater difference in test organism mortality, as compared to the laboratory control, is detected at any time in an ambient sampled during an acceptable Ceriodaphnia dubia or Pimephales promelas test. A TIE shall be initiated immediately if a 50% or greater reduction in test organism growth is detected between an ambient sample and the laboratory control at the end of an acceptable Selenastrum capricornutum test – unless otherwise superseded by an approved Algae Toxicity Management Plan. For Ceriodaphnia dubia or Pimephales promelas toxicity >50%, a Phase 1 TIE6 manipulation shall be conducted to determine the general class of the chemical causing toxicity. 3 Monitoring for the RPP is conducted during the 10-week period of peak rice pesticide use. Monitoring is conducted once per week for the first three weeks, then is increased to twice per week for the following four weeks (corresponding with peak usage), and is then decreased to once per week for the final three weeks.
4 Sediment samples that show statistically significant toxicity to Hyalella azteca at the end of an acceptable test, and that exhibit ≥ 20% reduction in organism survival as compared to the control require pesticide analysis of the same sample to determine the possible cause of toxicity. The sample is to be analyzed for lambda cyhalothrin and s-cypermethrin.

6. Project/Task Description
CRC_2010QAPP_Final_7-21-2010.doc Page 31 of 130
TABLE 6-2 Monitoring Sites, Frequency, Schedule and Parameters
Component 2010 2011 2012
Monitoring Sites Primary : CBD5, BS1, CBD1, and SSB Secondary: F,G, and H (one year to complete assessment monitoring)
Primary: CBD5, BS1, CBD1, and SSB
Primary: CBD5, BS1, CBD1, and SSB
Constituents Monitored
Primary sites: General parameters, dissolved copper
Secondary sites: dissolved copper
Primary sites: General parameters (all sites); dissolved copper
Primary sites: General parameters, pesticides1, aquatic toxicity2, sediment toxicity3, nutrients, dissolved copper
Monitoring Period General parameters: April to August
Dissolved copper: April, May
General parameters: April to August
Dissolved copper: April, May
General parameters: April to August
Pesticides: April to August Aquatic toxicity: April to August
Sediment toxicity: September
Sediment TOC: September
Nutrients: July, August
Dissolved copper: April, May
Frequency General parameters: monthly
Dissolved copper: monthly
General parameters: monthly
Dissolved copper: monthly
General parameters: monthly
Pesticides: monthly
Aquatic toxicity: monthly
Sediment toxicity: monthly
Nutrients: monthly
Dissolved copper: monthly
1 Pesticides to be monitored will be selected after evaluating any changes in rice operations, irrigation, pesticide use, application techniques and management practices. This information and the pesticides properties will be incorporated into the Rice Pesticide Matrix and submitted by 1 November 2011. 2 Water column toxicity testing with Selenastrum capricornutum, Ceriodaphnia dubia, and Pimephales promelas. 3 Sediment toxicity testing with Hyalella azteca.

6. Project/Task Description
CRC_2010QAPP_Final_7-21-2010.doc Page 32 of 130
6.2. Schedule of Major Project Work Benchmarks
The following summarizes the schedule of project milestones:
Commence Sampling: Sampling is typically initiated during the first week of pesticide use. Typically, this occurs in March or April, depending upon the early season conditions. During some years, conditions such as late rain or dry weather may shift the rice planting dates. Based on information from growers and the CACs, the CRC proactively informs the CVRWQCB CRC Liaison of its proposed start-date for sampling.
Exceedance Reporting: Exceedance reporting is required within five (5) days of learning of an exceedance.
Annual Monitoring Report (AMR): The AMR is due to the CVRWQCB on January 1st of each year. The information required for inclusion in the AMR is detailed in the MRP (R5-2010-0805).
6.3 Detailed Geographical Information
Rice is grown in nine Sacramento Valley counties (Butte, Colusa, Glenn, Placer, Sacramento, Sutter, Tehama, Yolo, and Yuba). Rice is also farmed in counties outside the Sacramento Valley; however, the acreages are generally small and are not the dominant crops in these areas. For the purposes of the rice-specific MRP, the monitoring area is defined as the nine rice producing counties in the Sacramento Valley. Typically, about 500,000 acres of rice are farmed in the nine rice growing counties of the Sacramento Valley.
A detailed analysis of rice land use within designated subwatersheds was presented in the 2004 Basis of Water Quality Monitoring Program Report (CH2M HILL, 2004). All of the sites monitored under the CWFR and RPP programs are located within the Sacramento River Basin. The core sites were selected for monitoring because they collectively capture approximately 90% of the rice field drainage in the Sacramento River Basin. Assessment monitoring sites are to be selected to achieve the following: provide data on waterbodies representing a range of hydrologic conditions, provide data to develop correlations between assessment sites and core sites, confirm core site selection, provide upstream data on new generation pesticides, and monitor water quality from drainages with a high percentage of land farmed in rice.
Appendix A includes the program maps. Figure A-1 shows the geographical location of the CWFR and RPP monitoring sites. Detailed site maps for each sampling location follow as Figures A-2 through A-10. Table 6-3 lists site names, locations, and drainage area for each of the sites under the CWFR and RPP monitoring programs.

6. Project/Task Description
CRC_2010QAPP_Final_7-21-2010.doc Page 33 of 130
TABLE 6-3 Monitoring Sites
Site Code Site Name Latitude Longitude
Estimated Rice Area Captured
by Station (acres) Program(s) Site Type
CBD1 Colusa Basin Drain above Knights Landing
38.8125 N -121.7731 W 171,165 CWFR, RPP Primary
CBD5 Colusa Basin Drain #5 39.1833 N -122.0500 W 156,000 CWFR, RPP Primary
BS1 Butte Slough at Lower Pass Road
39.1875 N -121.9000 W 183,617 CWFR, RPP Primary
SSB Sacramento Slough Bridge near Karnak
38.7850 N -121.6533 W 24,549 CWFR, RPP Primary
F Lurline Creek; upstream site of CBD5 39.2184 N -122.1512 W -- CWFR Secondary
G Cherokee Canal, upstream site for BS1**
39.3611 N -121.8675 W -- CWFR Secondary
H Obanion Outfall at DWR PP on Obanion Rd
39.0258 N -121.7272 W -- CWFR Secondary
SR1 Sacramento River at Village Marina/Crawdads Cantina
38.6039 N -121.5189 W ~500,000 RPP River
** If there is no flow at the specified site, a site on Butte Slough will be sampled.
6.4 Site Photos
Representative photos for the core, assessment, and RPP river site are included below. Photos of all sites will be taken during the first sampling event and at any time where the sampling conditions are not typical.
6. Project/Task Description
CRC_2010QAPP_Final_7-21-2010.doc Page 34 of 130
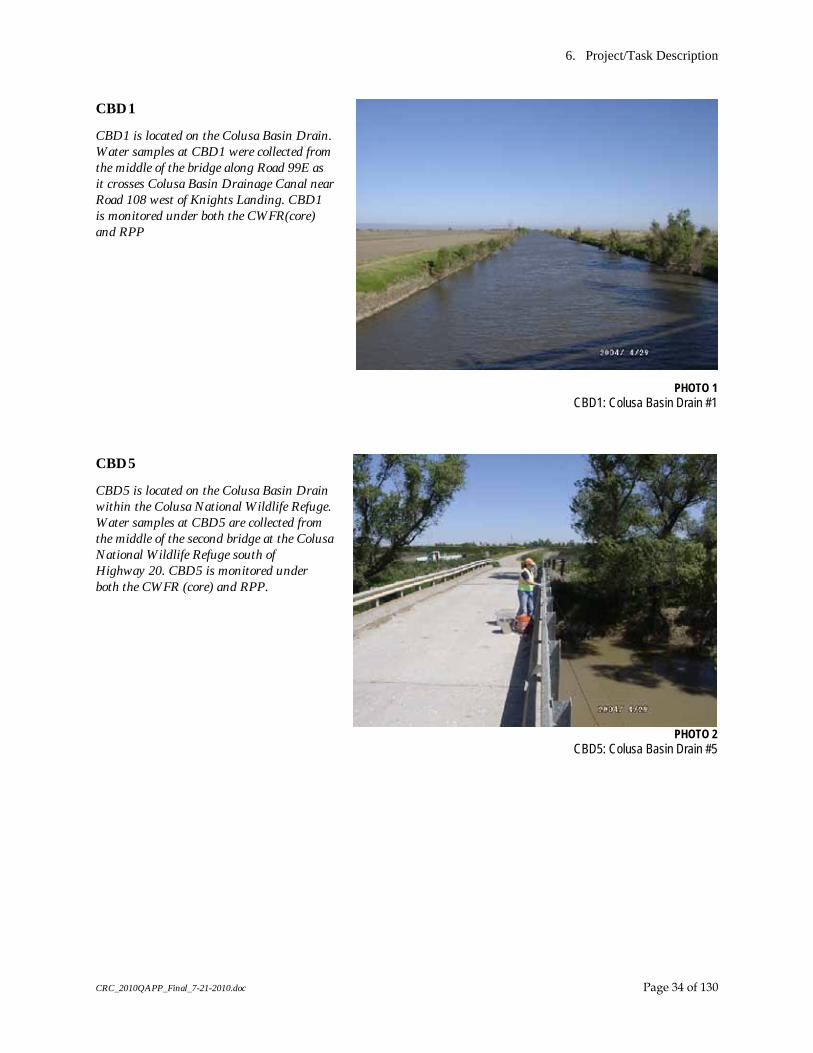
CBD1
CBD1 is located on the Colusa Basin Drain. Water samples at CBD1 were collected from the middle of the bridge along Road 99E as it crosses Colusa Basin Drainage Canal near Road 108 west of Knights Landing. CBD1 is monitored under both the CWFR(core) and RPP
PHOTO 1
CBD1: Colusa Basin Drain #1
CBD5
CBD5 is located on the Colusa Basin Drain within the Colusa National Wildlife Refuge. Water samples at CBD5 are collected from the middle of the second bridge at the Colusa National Wildlife Refuge south of Highway 20. CBD5 is monitored under both the CWFR (core) and RPP.
PHOTO 2
CBD5: Colusa Basin Drain #5

6. Project/Task Description
CRC_2010QAPP_Final_7-21-2010.doc Page 35 of 130
BS1
BS1 is located on Butte Slough. Water samples at BS1 are collected from the middle of the bridge along Lower Pass Road that crosses Butte Sough northeast of Meridian. In 1995 and 1996, samples were collected at the west end of the washed out bridge. Sampling at the current site started in 1997. BS1 is monitored under both the CWFR (core) and RPP.
PHOTO 3
BS1: Butte Slough #1
SSB
The RPP historically monitored Sacramento Slough at a location known as Sacramento Slough 1 (SS1), which was located at the DWR gauging station downstream of the Karnak pumps. Beginning in 2006, the monitoring site for Sacramento Slough was moved slightly upstream to a location named Sacramento Slough Bridge (SSB) in order to provide improved safety for field technicians accessing the site. SSB is monitored under both the CWFR (core) and RPP.
PHOTO 4 SSB: Sacramento Slough Bridge

6. Project/Task Description
CRC_2010QAPP_Final_7-21-2010.doc Page 36 of 130
F Site F is located on Lurline Creek. This is the upstream assessment site for core site CBD5. F is monitored under the CWFR (assessment).
(2010 and 2012 only)
PHOTO 5
F: Lurline Creek
G Site G is located on Cherokee Canal. This is the upstream assessment site for core site BS1. G is monitored under the CWFR (assessment).
(2012 only)
PHOTO 6
G: Cherokee Canal
6. Project/Task Description
CRC_2010QAPP_Final_7-21-2010.doc Page 37 of 125
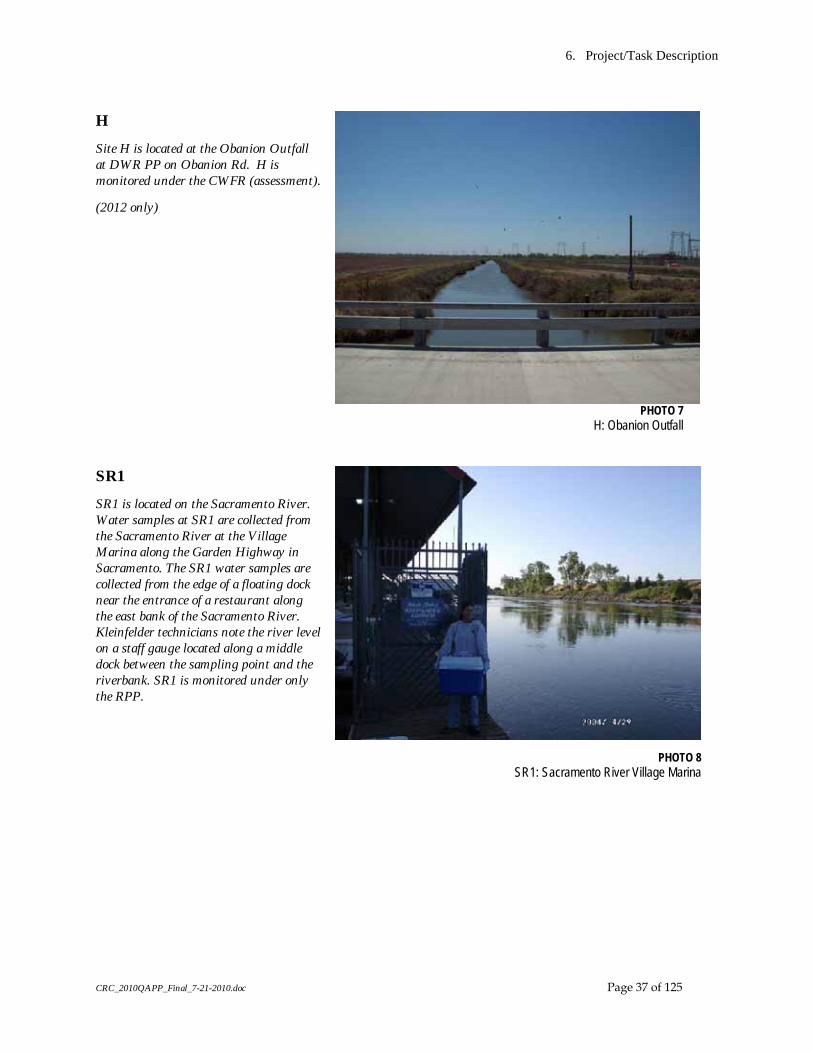
H Site H is located at the Obanion Outfall at DWR PP on Obanion Rd. H is monitored under the CWFR (assessment).
(2012 only)
PHOTO 7
H: Obanion Outfall
SR1 SR1 is located on the Sacramento River. Water samples at SR1 are collected from the Sacramento River at the Village Marina along the Garden Highway in Sacramento. The SR1 water samples are collected from the edge of a floating dock near the entrance of a restaurant along the east bank of the Sacramento River. Kleinfelder technicians note the river level on a staff gauge located along a middle dock between the sampling point and the riverbank. SR1 is monitored under only the RPP.
PHOTO 8
SR1: Sacramento River Village Marina
6. Project/Task Description
CRC_2010QAPP_Final_7-21-2010.doc Page 38 of 130
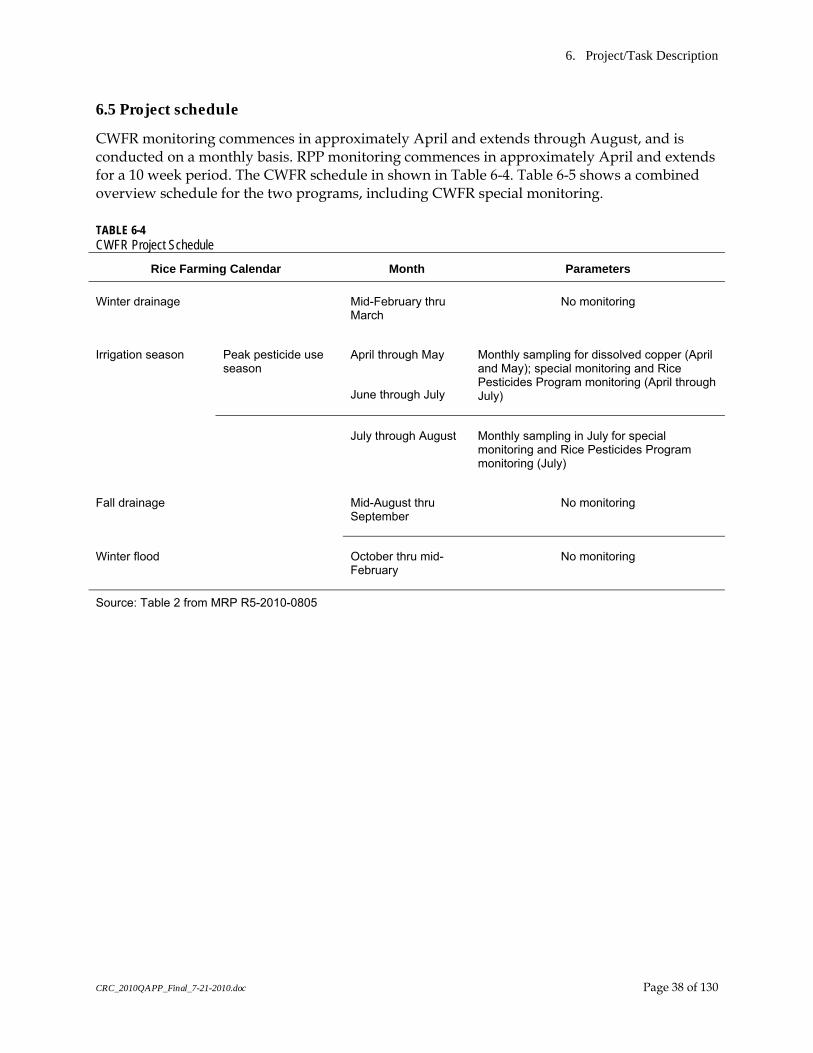
6.5 Project schedule
CWFR monitoring commences in approximately April and extends through August, and is conducted on a monthly basis. RPP monitoring commences in approximately April and extends for a 10 week period. The CWFR schedule in shown in Table 6-4. Table 6-5 shows a combined overview schedule for the two programs, including CWFR special monitoring.
TABLE 6-4 CWFR Project Schedule
Rice Farming Calendar Month Parameters
Winter drainage Mid-February thru March
No monitoring
April through May Peak pesticide use season
June through July
Monthly sampling for dissolved copper (April and May); special monitoring and Rice Pesticides Program monitoring (April through July)
Irrigation season
July through August Monthly sampling in July for special monitoring and Rice Pesticides Program monitoring (July)
Fall drainage Mid-August thru September
No monitoring
Winter flood October thru mid-February
No monitoring
Source: Table 2 from MRP R5-2010-0805

6. Project/Task Description
CRC_2010QAPP_Final_7-21-2010.doc Page 39 of 130
TABLE 6-5 CWFR and RPP Overview Schedule
Date Activity (2010, 2011, and 2012) Anticipated
Date of Initiation
Anticipated Date of
Completion
Deliverable
Deliverable Due Date
Start Project April None
Sample collection April September, Weekly reporting of monitoring results; lab results as provided
No specific due date, samples are run every week with results immediately reported.
The average lab turnaround is 5 to 10 days.
Annual Monitoring Report
November December 31 Final Report December 31
6.6 Project Constraints Extremely wet or extremely dry weather may present constraints to the monitoring programs. Extremely wet weather, although highly unlikely, may limit access to the monitoring locations and require samples to be collected at alternative locations. The CVRWQCB should be contacted for site approval if this scenario exists. Extremely dry weather can also be problematic if not enough water is present at a sampling location. Alternative sites would need to be approved by the CVRWQCB before initiation of sampling at those locations.


CRC_2010QAPP_Final_7-21-2010.doc Page 41 of 125
7. QUALITY OBJECTIVES AND CRITERIA FOR MEASUREMENT DATA
The Quality Objectives (QOs) and Criteria element provides the QC objectives as well as performance criteria to achieve those objectives. Objectives and criteria for meeting the objectives are defined at both the sampling design and analytical measurement levels. The analytical measurement levels must meet the requirements defined for a particular method. The completeness criteria (90%) will be calculated and reported with the submittal of each Annual Monitoring Report.
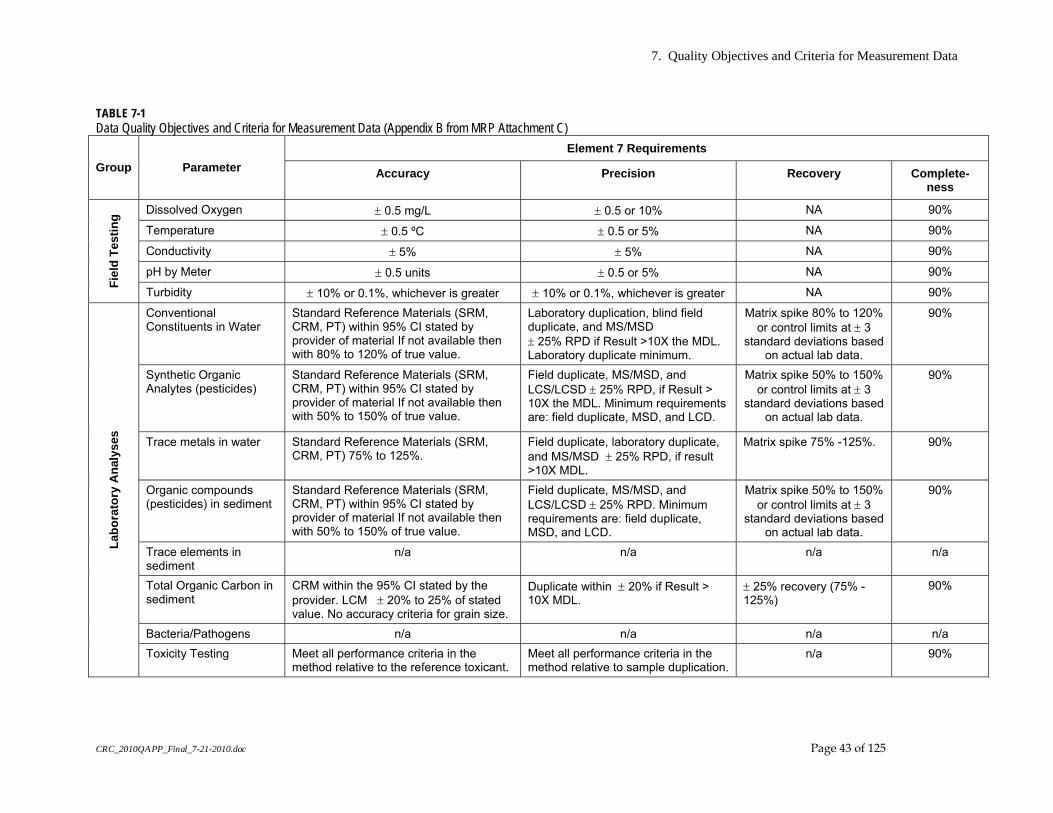
7.1 Data Quality Objectives
Accuracy, precision, and completeness data quality objectives apply to both field monitoring and lab analyses. Table 7-1 outlines acceptable data quality criteria for field and lab monitoring. Additional details regarding the calculation of accuracy, precision, and completeness are included below.
Accuracy Accuracy is a determination of how close the measurement is to the true value. Accuracy can be assessed using MS/MSD, laboratory control spike (LCS), calibration standard, and spiked environmental samples. The accuracy of the data submitted for this project will be assessed in the following manner:
• The percent recovery of LCS, MS/MSD, and spiked surrogate samples will be calculated and evaluated against established laboratory recovery limits.
Laboratory method blanks will be tested to determine levels of target compounds. If a target compound is found above the method detection limit (MDL) in the method blank and the same target compound is found in a sample, the data will not be background subtracted but will be flagged to indicate the result in the blank.
Accuracy is presented as percent recovery. Since accuracy is often evaluated from spiked samples, laboratories commonly report accuracy as:
The laboratories shall monitor accuracy by reviewing MS/MSD, LCS, calibration standard, and surrogate spike recovery results.
Precision Precision is a measure of the reproducibility of analyses under a given set of conditions. Precision will be assessed by replicate measurements of field and laboratory duplicate samples.

7. Quality Objectives and Criteria for Measurement Data
CRC_2010QAPP_Final_7-21-2010.doc Page 42 of 130
The routine comparison of precision is measured by the relative percent difference (RPD) between duplicate sample measurements. The overall precision of a sampling event is determined by a sampling component and an analytical component. The formula for the RPD between the two samples is shown below:
Completeness Completeness is a measure of the amount of valid data obtained from a measurement system compared with the amount that was expected to be obtained under normal conditions. To be considered complete, the data set must contain all analytical results and data specified for the project. In addition, all data shall be compared to project requirements to ensure that specifications were met. Completeness is evaluated by comparing the project objectives to the quality and quantity of the data collected to assess if any deficiencies exist. Missing data can result from any number of circumstances ranging from sample acquisition and accessibility problems to sample breakage and rejection of analytical data because of quality control deficiencies. Completeness will be quantitatively assessed as the percent of controlled QC parameters that are within limits. Percent completeness for each set of samples for each individual method can be calculated as follows:
Where: Valid data are defined as those data points that are not qualified as rejected. The requirement for completeness is 90% for each individual analytical method for all QC parameters except holding times. These QC parameters will include: • Initial calibration • Continuing calibrations • LCS percent recovery • MS/MSD • Field duplicate RPDs • Surrogate percent recoveries. The requirement for holding times will be 100%. Any deviations shall be reported in the lab report narrative.
7. Quality Objectives and Criteria for Measurement Data
CRC_2010QAPP_Final_7-21-2010.doc Page 43 of 125
TABLE 7-1 Data Quality Objectives and Criteria for Measurement Data (Appendix B from MRP Attachment C)
Element 7 Requirements Group Parameter Accuracy Precision Recovery Complete-
ness
Dissolved Oxygen ± 0.5 mg/L ± 0.5 or 10% NA 90%
Temperature ± 0.5 ºC ± 0.5 or 5% NA 90%
Conductivity ± 5% ± 5% NA 90%
pH by Meter ± 0.5 units ± 0.5 or 5% NA 90%
Fiel
d Te
stin
g
Turbidity ± 10% or 0.1%, whichever is greater ± 10% or 0.1%, whichever is greater NA 90%
Conventional Constituents in Water
Standard Reference Materials (SRM, CRM, PT) within 95% CI stated by provider of material If not available then with 80% to 120% of true value.
Laboratory duplication, blind field duplicate, and MS/MSD ± 25% RPD if Result >10X the MDL. Laboratory duplicate minimum.
Matrix spike 80% to 120% or control limits at ± 3
standard deviations based on actual lab data.
90%
Synthetic Organic Analytes (pesticides)
Standard Reference Materials (SRM, CRM, PT) within 95% CI stated by provider of material If not available then with 50% to 150% of true value.
Field duplicate, MS/MSD, and LCS/LCSD ± 25% RPD, if Result > 10X the MDL. Minimum requirements are: field duplicate, MSD, and LCD.
Matrix spike 50% to 150% or control limits at ± 3
standard deviations based on actual lab data.
90%
Trace metals in water Standard Reference Materials (SRM, CRM, PT) 75% to 125%.
Field duplicate, laboratory duplicate, and MS/MSD ± 25% RPD, if result >10X MDL.
Matrix spike 75% -125%. 90%
Organic compounds (pesticides) in sediment
Standard Reference Materials (SRM, CRM, PT) within 95% CI stated by provider of material If not available then with 50% to 150% of true value.
Field duplicate, MS/MSD, and LCS/LCSD ± 25% RPD. Minimum requirements are: field duplicate, MSD, and LCD.
Matrix spike 50% to 150% or control limits at ± 3
standard deviations based on actual lab data.
90%
Trace elements in sediment
n/a n/a n/a n/a
Total Organic Carbon in sediment
CRM within the 95% CI stated by the provider. LCM ± 20% to 25% of stated value. No accuracy criteria for grain size.
Duplicate within ± 20% if Result > 10X MDL.
± 25% recovery (75% - 125%)
90%
Bacteria/Pathogens n/a n/a n/a n/a
Labo
rato
ry A
naly
ses
Toxicity Testing Meet all performance criteria in the method relative to the reference toxicant.
Meet all performance criteria in the method relative to sample duplication.
n/a 90%

7. Quality Objectives and Criteria for Measurement Data
CRC_2010QAPP_Final_7-21-2010.doc Page 44 of 125
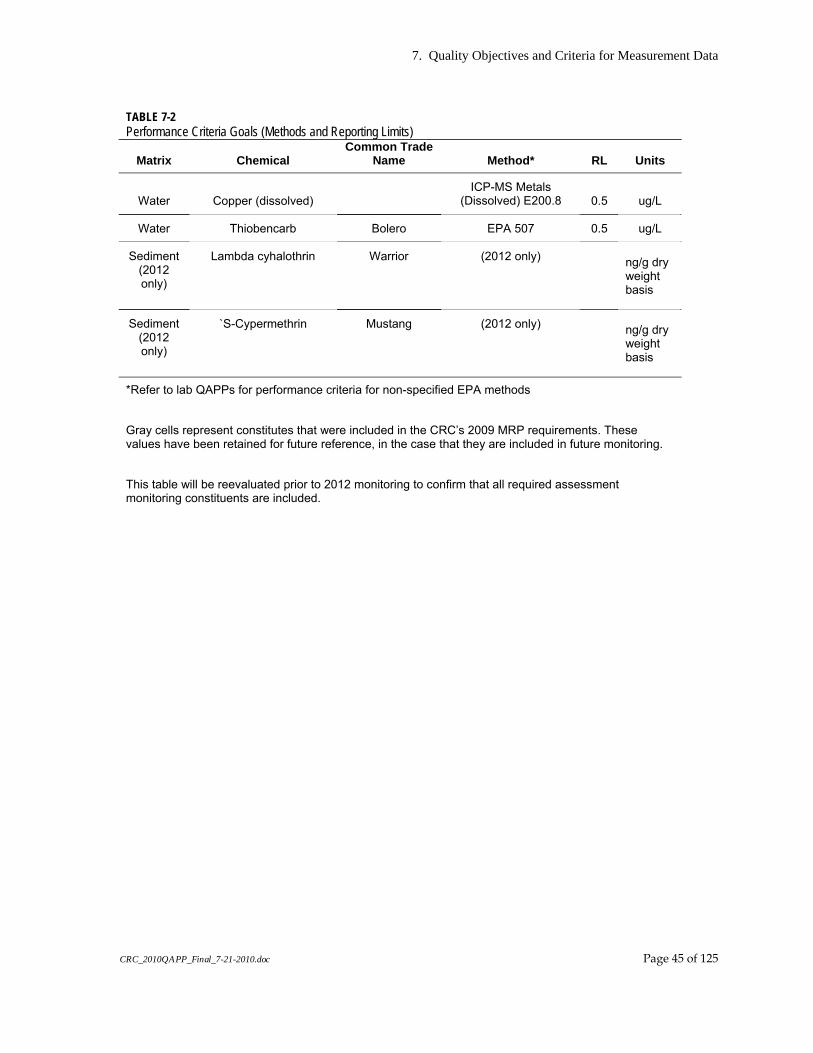
7.2 Performance Criteria Goals
Table 7-2 lists the methods and target reporting limits for the analytes included in this monitoring program. Table 7-3 lists the individual labs and the analyses for which they will be contracted.
TABLE 7-2 Performance Criteria Goals (Methods and Reporting Limits)
Matrix Chemical Common Trade
Name Method* RL Units
Water Hardness n/a USEPA 200.7, 130.1, 130.2, SM 2340C 10 mg/L
Water Total dissolved solids n/a EPA 160.1 10 mg/L
Water Total Organic Carbon n/a USEPA 415.3 0.5 mg/L
Water total Kjeldahl nitrogen n/a USEPA 351 or SM 4500-NH3 0.5 mg/L
Water nitrate + nitrite (as N) n/a USEPA 300, 300.1 351.3, 353.2,or SM
4500 0.05 mg/L
Water total ammonia n/a USEPA 350 or SM4500 NH3 0.1 mg/L
Water Unionized ammonia n/a (calculated) - mg/L
Water total phosphorous (as P) n/a USEPA 365.1, 365.4, or SM 4500-P 0.01 mg/L
Water soluble orthophosphate n/a USEPA 300.1, 365.1, or SM 4500-P 0.01 mg/L
Water Carfentrazone-ethyl Shark ug/L
Water Clomazone Cerano ug/L
Water Pendimethalin Prowl/Harbinger ug/L
Water Penoxsulam Granite
GC-ITMS = EPA 525.2m 0.2
ug/L
Water Propanil Stam EPA 532m 0.5 ug/L
Water Glyphosate Roundup EPA 547 10 ug/L
Water Triclopyr Grandstand ug/L
7. Quality Objectives and Criteria for Measurement Data
CRC_2010QAPP_Final_7-21-2010.doc Page 45 of 125
TABLE 7-2 Performance Criteria Goals (Methods and Reporting Limits)
Matrix Chemical Common Trade
Name Method* RL Units
Water Copper (dissolved) ICP-MS Metals
(Dissolved) E200.8 0.5 ug/L
Water Thiobencarb Bolero EPA 507 0.5 ug/L
Sediment (2012 only)
Lambda cyhalothrin Warrior (2012 only) ng/g dry weight basis
Sediment (2012 only)
`S-Cypermethrin Mustang (2012 only) ng/g dry weight basis
*Refer to lab QAPPs for performance criteria for non-specified EPA methods
Gray cells represent constitutes that were included in the CRC’s 2009 MRP requirements. These values have been retained for future reference, in the case that they are included in future monitoring.
This table will be reevaluated prior to 2012 monitoring to confirm that all required assessment monitoring constituents are included.

7. Quality Objectives and Criteria for Measurement Data
CRC_2010QAPP_Final_7-21-2010.doc Page 46 of 125
TABLE 7-3 Analytical Laboratories and Methods
Laboratory Analytes/Analytical
Method(s) Analytical Method(s) Standard Operating
Procedures
McCampbell Analytical, Inc 1534 Willow Pass Road Pittsburg, CA 94565 [email protected] 925-252-9262
Copper Propanil Pesticides (sediment) TOC (sediment) (2012 only)
EPA 200.8 EPA 532m EPA 8270 EPA 9060a or EPA 415.1m
CLS Labs 3249 Fitzgerald Road Rancho Cordova, CA 95742 916-638-7301
Thibobencarb EPA 507
Fathead Minnow Acute Bioassay
(2012 only)
Acute 96-Hour Percent Survival Static non-renewal, static renewal, or LC50 Test (EPA 821-R-02-012; 5th ed.) SOP #503.3
C. dubia Acute Bioassay
(2012 only)
Acute 96-Hour Percent Survival Static non-renewal, static renewal, or LC50 Test (EPA 821-R-02-012; 5th ed.) SOP #503.3
AQUA-Science 17 Arboretum Dr. Davis, CA 95616 [email protected] 530-753-5456
Algae Chronic Bioassay
(2012 only)
Chronic Freshwater Algae (selanastrum capricornutum) Static non-renewal Growth Test SOP #510. NO EDTA. (EPA 821-R-02-013; 4th Edition)
Nautilus Environmental San Diego Bioassay Laboratory 5550 Morehouse Drive, Suite 150 San Diego, CA 92121
Sediment Toxicity - Hyalella azteca 10-day Bioassay
(2012 only)
10-Day Freshwater Sediment Invertebrate (Hyalella azteca) Survival Test (based on EPA 823-B-98-004; EPA 600/R-99/064). SOP #518
Valent Dublin Laboratory (Registrant Laboratory) 6560 Trinity Court Dublin, CA 94568
Thiobencarb

7. Quality Objectives and Criteria for Measurement Data
CRC_2010QAPP_Final_7-21-2010.doc Page 47 of 125
7.3 Monitoring Parameters with Practical Quantitation Limits (PQLs) and Analytical Methods
Laboratories must establish quantitation limits (QLs) that are reported with the analytical results; these may also be called reporting limits. These laboratory QLs must be less than or equal to the PQLs that are identified in the ILRP MRP requirements. The laboratories must have documentation to support quantitation at the required levels. Any modification in reported QLs must be identified and discussed in the laboratory data report. For example, the reported QL for a measurement will change due to sample dilution. The dilution factor, reason for dilution, and other relevant information must be described in the data report.
Laboratories must also report analytical results with measurements equal to or higher than the MDL and lower than the QL. These results must be reported as numerical values and qualified as estimated. Reporting such values as “trace” or “<QL” is not acceptable.
Each laboratory performing analyses for the ILRP program must routinely conduct MDL studies to establish the maximum sensitivity (lowest concentration detectable) for each chemical constituent, and to document that the MDLs are less than the PQLs. The MDL studies must be thoroughly documented and conducted in accordance with Revision 1.1, Code of Federal Regulations (CFR), Title 40, Part 136, Appendix B (1984), “Definition and Procedure for the Determination of the Method Detection Limit.” New MDL studies should be conducted whenever there is a significant change in methods, reagent type or procedures, or within two years of the date the most recent study was conducted.
An MDL is developed from seven aliquots of a standard containing all analytes of interest spiked at approximately five times the expected MDL, which are taken through the analytical method sample processing steps. The data are then evaluated and used to calculate the MDL. If the calculated MDL is less than one-third the spiked concentration, the MDL study must be repeated using a lower concentration.
Project samples may not be analyzed and reported until the MDL study has been completed according to the CFR requirements. MDL study results must be available for review during audits, data review, or as requested. Current MDL study results must be reported at the beginning of every project for review and inclusion in project files.
If any analytes have MDLs that are higher than the project QLs, the following steps must be taken:
(a) Optimize the sensitivity of the analytical system (as allowed under the appropriate method), and perform a new MDL study sufficient to establish analyte identification at concentrations less than the project-specified QLs.
(b) If MDLs below required PQLs still could not be achieved for the required constituents using the methods identified in the MRP, the ILRP staff must be contacted. If an alternate method (accredited, modified or performance based) may be used to meet the desired MDLs, a written request to use that method must be provided to the ILRP. The request to use an alternate method must be approved by the Executive Officer and Quality Assurance Officer prior to sample analysis.

7. Quality Objectives and Criteria for Measurement Data
CRC_2010QAPP_Final_7-21-2010.doc Page 48 of 125
(c) If methods or laboratories that meet the QL requirements are not available, or cannot be feasibly accessed, a variance or exception to a specific QL may be requested in writing. Variances will only be approved on a case-by-case basis, and after consideration of the impact of the variance, and the documentation provided.
Quality Control Measurements.
The collection of samples and evaluation of data shall provide data that are representative, comparable, complete, precise, and accurate.
(a) Representativeness: Sampling locations should be selected that adequately represent all of the discharges from the farm/ranch, or project area, and the affected water bodies. Samples must also be collected during times and at locations that are representative and that meet the objectives described in the ILRP MRP. Objectives include adherence to sampling Standard Operating Procedures (SOPs), holding times, decontamination procedures, etc.
(b) Comparability: Data collected under the ILRP must be comparable in content and quality to the statewide consistency goals outlined by the SWAMP program. An acceptable, approved MRP Plan and project QAPP ensures comparability with other State monitoring programs and projects.
(c) Completeness: Data completeness is defined as a measure of the amount of valid data obtained from a measurement system as compared to the planned amount, usually expressed as a percentage. Factors that affect data completeness include sample breakage during transport or handling, insufficient sample volume, laboratory error, QC failure and equipment failure. The dischargers should strive to meet a goal of 90% data completeness per sample batch and must be calculated and reported with the completion of each monitoring report.
Project completeness can be divided into two areas: Field & Transport Completeness and Laboratory Completeness. Completeness goals should be applied to all aspects within these two areas to meet the 90% total requirement.
Field & Transport Completeness refers to the complete event process of successful planned site visit, conditions documentation, in-field measurements, sample collection technique and volume, in-field quality assurance and control sample preparation, chain-of-custody documentation, preservation, and successful transport of samples to the receiving agencies. Note that if a site is inaccessible or dry, the adequate documentation of these conditions through field sheets, photos, and other means meets the completeness goal for that site and event. Meeting this requirement does not supersede any further requirements outlined in the MRP order that would determine site re-visitation or site location changes.
Laboratory Completeness refers to the complete event process of sample reception, chain-of-custody documentation, storage and in-house preservation, extraction, analysis, and laboratory quality assurance and control samples and measures.
The Project must provide a narrative describing this assessment for each area as well as outline goals for improvement or maintenance of the 90% completeness requirement.

CRC_2010QAPP_Final_7-21-2010.doc Page 49 of 125
(d) Precision and Accuracy: The evaluation of precision and accuracy takes place at the analytical measurement level for values obtained both in the field and in the laboratory.


CRC_2010QAPP_Final_7-21-2010.doc Page 51 of 125
8. SPECIAL TRAINING NEEDS/CERTIFICATION The Special Training Needs/Certification element provides for information regarding any training that is required for field, laboratory, and other project staff and states the individuals or organizations that are responsible for ensuring that the training is adequate and is completed.
All staff performing field, laboratory, data entry, and data quality assurance procedures shall receive training to ensure that the work is conducted correctly and safely. At a minimum, all staff shall be familiar with the field guidelines and procedures and the laboratory SOPs included in the project QAPP. It is the responsibility of the discharger and project management to ensure that training is mandatory for all personnel, and that such training is documented through training certifications or records. The QA officer for the project is responsible for training but others may conduct training. These records must be maintained and updated for all participating field and laboratory staff.
8.1 Project Personnel with Specialized Training or Certification
Summer Bundy, Jennifer Parson, and Jenny Krenz-Ruark are trained for water quality field sample collection. Further, the Lead Field Technician, Mark Lee, is highly experienced in leading water quality monitoring programs.
8.2 Project Field Personnel Training
All staff performing field or laboratory procedures will receive training so that the work is conducted safely and correctly. At minimum, all staff will be familiar with the field guidelines and procedures. Work will be performed under the supervision of experienced staff, field managers, laboratory managers or other qualified individuals. The contracted laboratories provide training to their staff as part of their SOPs.
The following specialty training applies to this program.
Health & Safety Training: Field personnel are required to complete the field health and safety trainings required by their respective firms. The HS&E training records are maintained by the individual firms.
Field Sample Collection Training: At the beginning of each sampling season (or the first time that a field employee goes into the field during the season), the Lead Sampling Technician will train field staff in the proper collection of samples. This includes training on the following:
• Flow measurement and recording of flow measurements on the field form • Use of the YSI probe, including calibration and documentation • Sample handling and collection (rinse water, sample collection) • Chain of Custody requirements and documentation

8. Special Training Needs/Certification
CRC_2010QAPP_Final_7-21-2010.doc Page 52 of 125
8.3 QA Manager and Training Officer
The QA Manager is Jenny Krenz-Ruark/CH2M HILL. The QA Manager is responsible for collecting documentation from the Field Project Manager
The Lead Field Technician (Mark Lee/Kleinfelder) is the Training Officer. He is responsible for ensuring that field personnel receive training prior to sample collection, and for submitting the Field Sample Training Documentation to the Field Project Manager.
8.4 Training Renewal
Members of the field crew are to undergo Field Sample Collection Training once per season, prior to the first time they collect samples during the season.
8.5 How Training is Provided
Training will be provided by the Lead Field Technician, or his qualified designee, prior to the first time a person collects samples during the season. The training will be provided in-office, or as a tail-gate meeting prior to sample collection.
8.6 Training Documentation
Training will be documented on the form included as Exhibit B-5. One form will be completed by each person receiving training. The form will be signed by the person receiving and by the person providing the training. The training elements included in the training will be initialed.
8.7 Training Records
The training documentation records will be maintained on the project’s website.

9. Documents And Records
CRC_2010QAPP_Final_7-21-2010.doc Page 53 of 125
9. DOCUMENTS AND RECORDS The Documents and Records element describes the required documents and records necessary for project quality assurance, including the Project QAPP.
Copies of field sheets, chain-of-custody forms, and original preliminary and final laboratory reports must be kept for review by the CVRWQCB ILRP staff. The project field crew must retain original field logs with copies submitted to ILRP staff. The project contract laboratory shall retain original chain-of-custody forms and copies of the preliminary and final data reports for a period of no less than five years.
Kleinfelder will collect records for sample collection and field analyses. Samples will be sent to McCambell Labs (CWFR) and Valent (RPP) for chemistry analysis and will include a Chain of Custody form (COC). Aquatic and sediment toxicity samples will be sent to AquaScience and will include a COC form. The labs will generate records for sample receipt and storage, analyses, and reporting.
All records generated by this project will be stored at the CRC office, and will be maintained on a project website. The lab records pertinent to this project will be maintained at the lab, Kleinfelder, CH2M HILL and CRC offices.
Persons responsible for maintaining records for this project are as follows. Jennifer Parson, Kleinfelder Field Project Manager, will maintain all sample collection, chain of custody, and field analysis forms. The Field Project Manager and CRC Program Manager will maintain all records associated with the receipt and analysis of samples analyzed, and all records submitted by AquaScience. CH2M HILL will maintain the database of all field and laboratory records. Laboratory directors for each lab contracted to provide analytical results will maintain the lab records. The CRC Program Manager will oversee the actions of these persons and will arbitrate any issues relative to record retention and any decisions to discard records.
The CRC will maintain copies of the records in the form of the annual report indefinitely along with an electronic database.
9.1 Reporting Format
Field Sheets and Lab Reports
Table 9-1 lists the forms and reports are produced during sampling events as part of the CRC’s monitoring program. Sample meter calibration log, field data sheet, flow monitoring data sheet, and chain of custody forms are included in Appendix B.

9. Documents And Records
CRC_2010QAPP_Final_7-21-2010.doc Page 54 of 125
TABLE 9-1 Forms and Reports Produced for Sampling Events
QC Form Required Documentation Meter Calibration Log 1 per sampling event Field Crew → Field Project Manager → Project
Website Field Data Sheet 1 per site, per sampling event Field Crew → Field Project Manager → Project
Website Flow Monitoring Data Sheet
1 per site, per sampling event, for CWFR sites
Field Crew → Field Project Manager → Project Website
Chain of Custody – McCampbell
1 per site, per sampling event, for CWFR events and RPP QA events
Field Crew → McCampbell→ Included in McCampbell Results Report → Field Project Manager → Project Website
Chain of Custody – Valent
1 per site, per sampling event, for RPP events
Field Crew → Valent → Included in Valent Results Report → Field Project Manager → Project Website
Chain of Custody – AquaScience
1 per site, per sampling event, for aquatic toxicity monitoring events
Field Crew → AquaScience → Included in AquaScience Results Report → Field Project Manager → Project Website
Chain of Custody – Nautilus
1 per site, per sampling event, for sediment toxicity monitoring events
Field Crew → AquaScience → Nautilus → Included in Nautilus Results Report → AquaScience → Included in AquaScience Results Report → Field Project Manager → Project Website
McCampbell Results Report
1 per event McCampbell → Field Project Manager → Project Website
Valent Results Report 1 per RPP event Valent → Field Project Manager → Project Website
AquaScience Results Report
1 per aquatic toxicity and sediment monitoring event
AquaScience → Field Project Manager → Project Website
Nautilus Results Report
1 per sediment toxicity testing event
Nautilus → AquaScience → Field Project Manager → Project Website
Meter Calibration
The program’s meter calibration data sheet is included in Appendix B.
Before measuring field pH a daily check standard is required before the pH measurements are taken. This procedure ensures that the meter is within acceptable limits.

9. Documents And Records
CRC_2010QAPP_Final_7-21-2010.doc Page 55 of 125
Field Data Sheet
The program’s field data sheet is included in Appendix B.
For each sampling event, the field team or monitoring agency shall provide the Project Lead Staff with copies of the field data sheets, relevant pages of field logs, toxicity laboratory sheets (replicate and in house water quality data) including fail tests, and copies of the COC forms for all samples submitted for analysis. At minimum, the following sample-specific information must be provided for each sampling event:
(a) Site name.
(b) Site code.
(c) GPS coordinates
(d) Sample type, e.g. grab or composite type (Cross-sectional, flow-proportional, etc.).
(e) QC sample type and frequency.
(f) Date and time of sample collection (first sample taken).
(g) Results of field measurements.
(h) Sample preservation.
(i) Requested analyses (specific parameters or method references).
(j) Results of samples collected and all laboratory QC samples (calibrations, blanks, surrogates, laboratory spikes, matrix spikes, reference materials, etc.) and the identification of each analytical sample batch.
(k) Results of measurements for tests run prior to toxicity analyses, such as dissolved oxygen, temperature, electrical conductivity, hardness, and ammonia.
(l) A description of any unusual occurrences, noted by the field personnel, associated with the sampling event - particularly those that may affect sample or data quality.
(m) Any anomalies regarding sample condition noted by the laboratory.
(n) Report of any adjustments made to samples prior to running analyses, such as adjustments to dissolved oxygen, alkalinity, de-chlorination, or other.
(o) Records of exceedance reports or exception reports when results exceed standards or do not meet QC criteria.
For data connectivity purposes, all samples taken at a site for one sample event should be assigned one designated sampling time. This time designation is the time assigned to the first sample collected, and must be consistent with the time assigned in the chain of custody, field data sheet, and laboratory report forms.
9.2 Other Project Documents
Other project documents include the MRP and Basin Plan, and will be stored on the project website.
9.3 Project Information Storage and Retention

CRC_2010QAPP_Final_7-21-2010.doc Page 56 of 125
The Field Project Manager shall retain original field logs. Electronic copies of field logs will be posted to the project website, and copies of these shall be included in the AMR prepared by CH2M HILL and submitted to ILRP staff. The contract laboratory will retain original COC forms, and copies of the preliminary and final data reports.
All other forms and reports produced as part of this program will be posted to the project website by the Field Project Manager, and copies of these shall be included in the AMR prepared by CH2M HILL and submitted to ILRP staff.
9.4 Paper and Electronic Backups
Field and laboratory data will be stored in hard copy and electronic format (when applicable) as part of the project file. This information will be retained in the project file until project completion and closeout. Upon project closeout, all records will be archived for permanent storage. Records will be maintained for five years after the final report is issued.
The project website is routinely backed up, per CH2M HILL company policy. Backups are housed in off-site data storage repositories per CH2M HILL IT policies. At the end of the year, CH2M HILL archives the data to CD so that the data for each year is together in one package.
9.5 Document Updates and Distribution
When results are available, they will be posted to the project website by the Field Project Manager and an email will be sent to the Reporting Project Manager, QA Officer, and Program Manager to inform them that the results are available.
Any revisions to the QAPP will be reviewed with the project team, and the revised QAPP will be distributed.
9.6 Distribution of Revised QAPP Versions
The Reporting Project Manager, Summer Bundy/CH2M HILL, shall be responsible for distributing revised QAPP versions to the distribution list included in Section 3, either in hard copy, or via e-mail.

CRC_2010QAPP_Final_7-21-2010.doc Page 57 of 125
GROUP B: DATA GENERATION AND ACQUISITION 10. SAMPLING PROCESS DESIGN
The Sampling Process Design element provides for discussion on the Project’s data collection design in relation to the Project’s objectives. This section includes a description of the monitoring approach as well as follow up methods when water quality problems are detected.
10.1 Experimental and Data Collection Design
The CRC water programs were developed to assess the impact of rice drainage on water quality. The RPP was designed to address the rice pesticides explicitly regulated within the Basin Plan, while the CWFR monitoring was designed to address the requirements of CWFR monitoring and reporting, pursuant to the MRP issued under the CVRWQCB’s Conditional Waiver of Waste Discharges Requirements for Discharges from Irrigated Lands (Irrigated Lands Regulatory Program, ILRP), including: Monitoring and Reporting Program (MRP) Order No. R5-2004-0839 under Resolution No. R5-2003-0105, covering the period September 2004 through October 2007 and MRP No. R5-2007-0835 under Resolution No. R5-2006-0053 as amended by 2006-0077, covering the period February 2007 through October 2008, and the current MRP No. R5-2010-0805 under Resolution No. R5-2006-0053 as amended by 2006-0077, covering the period April 2010 through December 2012.
The RPP monitoring sites were selected based on historical sampling, which included extensive assessment monitoring over several years. Based on a review of the data, it was determined that the four drain sites and the river site accurately detect water quality exceedances for the Basin Plan pesticides. The frequency of this monitoring was established to coincide with the peak pesticide use season, with weekly sampling taking place at the beginning and end of the use season, and twice-weekly sampling taking place during the peak four weeks. This frequency of sampling provides a robust schedule that ensures that pesticide water quality concerns are identified.
The CWFR monitoring sites were also selected based on historical sampling. The CWFR relies on the four core drain sites. For 2010-2012, the CWFR also incorporates assessment sites, which were included to address the MRP’s requirements for assessment monitoring to develop correlation basis between upstream sites and the downstream core monitoring sites.
Consistent with the approach outlined in the MRP, the CRC’s approach for its monitoring program includes three different types of monitoring:
• assessment monitoring to assess condition of waterbody
• core monitoring for trend monitoring
• special project monitoring for source identification and other problem solving
Assessment and core monitoring are to be conducted according to a three-year cycle. Core monitoring is conducted at a subset of core sites considered to be representative of the Coalition Group’s area, and for a reduced set of parameters. Assessment monitoring is to

10. Sampling Process Design
CRC_2010QAPP_Final_7-21-2010.doc Page 58 of 125
include an expanded suite of parameters, and may include an expanded list of sites including both assessment sites and core sites. The purposes of the expanded suite are to confirm that core monitoring continues to adequately characterize water quality conditions or identify changed conditions and to provide the technical basis for use of core sites.
Special Project Monitoring will include monitoring and reporting implemented pursuant to approved and proposed Management Plans, as well as other focused investigations that may assist in addressing data gaps or other technical evaluations. Table 10-1, below, clarifies the sequential schedule for assessment and core monitoring.
TABLE 10-1 Assessment and Core Monitoring Cycle1
Monitoring Type 2010 2011 2012
Assessment yes
Core yes yes
1 Repeat cycle every three years, or as specified in an approved MRP Plan. 2 Assessment monitoring is conducted at both core sites and assessment sites. Site specific monitoring requirements may be included, as described below. 3 Core monitoring is conducted only at core sites.
Assessment Monitoring Assessment monitoring is to be used to provide supporting data for sites that a Coalition Group wishes to select as primary monitoring sites for trends. Supporting data may also allow consideration for the use of some monitoring sites to be representative of other locations within the Coalition Group boundaries.
In order to be considered representative, each Coalition Group must provide technically valid justification for the representative nature of the monitoring locations to include similarities in hydrology, crop types, pesticide use, and other factors that affect the discharge of wastes from irrigated lands to surface waters. This representativeness must also be supported by data from at least one full year of Assessment Monitoring. Each Coalition Group must provide this technical justification and identify which sites are to be considered representative of other designated sites in the MRP Plan or in a subsequent technical report that must be approved by the Executive Officer. When representative sites are approved, the monitoring data collected through the Core and Assessment monitoring shall be considered to represent conditions at the referenced designated sites.
Similarly, when action must be taken based on exceedances at the representative sites such as management practice implementation, the same action(s) shall be taken throughout the irrigated lands that are represented by the identified representative sites. Assessment monitoring may include coordinated monitoring with other programs. All coordinated monitoring data will need to be identified and discussed in the Coalition Group-specific MRP Plan, and data must be submitted with the Coalition Group annual monitoring reports.
The general MRP describes the technical requirements of proposed assessment monitoring. These requirements fall into the following categories:

10. Sampling Process Design
CRC_2010QAPP_Final_7-21-2010.doc Page 59 of 125
• Focus on a diversity of monitoring sites across the Coalition Group’s area (hydrology, size, and flow)
• Evaluate different types of water bodies for assessment
• Include a sufficient number of sampling sites to assess the entire Coalition Group area and all drainages
• Propose the approach, including a schedule, to sample assessment monitoring sites
• Include sampling sites in areas of known water quality impairments, even if they are not currently identified on the Clean Water Act (CWA) 303(d) listing
• Include sampling sites that are compliance monitoring sites for TMDLs, where implementation is conducted by the Coalition Group
• Provide scientific rationale for the site selection process based on historical and/or on-going monitoring, drainage size, crop types and distribution, and topography and land use
• Discuss the criteria for the selection of each monitoring site
• Conduct the initial focus of monitoring on water bodies that carry agricultural drainage or are dominated by agricultural drainage
• Identify priorities with respect to work on specific watersheds, subwatersheds, and water quality parameters
• In conjunction with Core Monitoring for trends and Special Projects focused on specific problems, demonstrate the effectiveness of management practices and identify locations for implementation of new management practices, as needed
• Include the requirements provided in Parts I through III of this MRP Order.
Core Monitoring – As described in the general MRP Core monitoring sites are to be selected from Assessment Monitoring locations or other suitable locations and be used to measure trends at the selected representative sites over extended periods of time. Core monitoring occurs at fixed stations, at probabilistic sites, or at some other combination of sites statistically appropriate for trend monitoring, and is to include a repetition of the Assessment Monitoring analytical regime at a minimum of every three years. The purpose of periodically repeating the Assessment Monitoring analytical regime is to evaluate the effects of changes in land-use and management practices and provide information about long-term trends and effectiveness of the management practices. Core monitoring shall not be limited to largest volume water bodies that would dilute waste constituents that may be in higher concentrations in tributary streams and drainages.
The Core Monitoring component of the Monitoring Strategy will:
• Focus on a diversity of monitoring sites across the Coalition Group’s area (hydrology, size, and flow);

10. Sampling Process Design
CRC_2010QAPP_Final_7-21-2010.doc Page 60 of 125
• Include sites that through Assessment Monitoring or other information have been shown to be characteristic of key crop types, topography, and hydrology within the Coalition Group’s boundaries;
• Provide scientific rationale for the site selection process based on the Assessment Monitoring, existing monitoring projects, or historical information;
• Discuss the criteria for the selection of each monitoring site;
• Propose the approach, including a schedule, to sample core monitoring sites.
• Include water bodies that carry agricultural drainage, are dominated by agricultural drainage, or are otherwise affected by other irrigated agriculture activities;
• Have management practice information provided in order to establish relationships (status and trends) with water quality monitoring information;
• In conjunction with Assessment Monitoring, demonstrate the effectiveness of management practices and implement new management practices, as needed; and
• Utilize data generated from the Core Monitoring Sites to establish trend information about the effectiveness of the Coalition Group’s efforts to reduce or eliminate the impact of irrigated agriculture on surface waters.
Special Project Monitoring – As described in the general MRP Special project monitoring shall be established on water bodies where waste-specific monitoring or targeted source identification studies must take place. This includes monitoring where the Coalition Group or another entity is implementing an applicable TMDL or specific targeted studies for the implementation of a Coalition Group Management Plan that results from exceedances. Management Plans are required when more than one exceedance of the same constituent has occurred at a given site during a three year period. Special project monitoring may also include, but shall not be limited to source waters, in order to provide information about pre-existing conditions.
10.2 Rationale for Data Collection Design
A detailed evaluation of Sacramento Valley hydrology was presented in the 2004 CWFR Report. A network diagram, shown in Figure 10-2, was developed to show the relationship of historic water quality monitoring stations to the CRC’s main sites. The network included 83 sites, which were included in past DPR and CRC monitoring efforts focused on rice pesticides. Each site was assigned a station designator (letters and numbers), as shown in Table 7.
The network diagram, combined with the subwatershed maps included in Appendix B, form the basis of designating and linking core and assessment sites.

10. Sampling Process Design
CRC_2010QAPP_Final_7-21-2010.doc Page 61 of 125
I, K, L, M, N, Q, P
A
H
D Z
R, DDE
54
17, 20, 37a
B
a These stations are in the Butte Creek drainage. Station Bcaptures drainage from Butte Creek diversions that occur downstream of where drainage from this area enters theCreek; other Butte Creek water not used fo r irrigation flowsto the Sacramento River
39, 40, 59, 63, 64
31
6141, 42, 43
30, 32
44
33
29
65
1426, 28
LCC
F, 51, 46
C
9, 22, 10, 11, 12, 21
13
57
8
Y, 49, 50, 56, 58, 48
34, 35
27
JS
47
FIGURE 10-1 Network of stations for which sampling results were evaluated. Stations shown in blue do not represent rice-growing areas.

10. Sampling Process Design
CRC_2010QAPP_Final_7-21-2010.doc Page 62 of 125
Monitoring Sites The CRC’s ILRP monitoring program has included primary and secondary sites since its 2004 inception1. The designation of the primary sites was based on analysis that took into consideration DPR, DFG and CRC monitoring that was conducted at 83 sites, beginning in the late 1980s.
The historic DPR and CRC monitoring was the basis of the original RPP. In the early phases of rice pesticides monitoring, DPR, in collaboration with the CVRWQCB staff and the CRC, undertook an effort to define rice drainage (hydrology) in the Sacramento Valley and measure pesticide concentrations within the drainages. Sites at that time were selected to be representative of smaller drainages. Over time, the DPR and CRC monitoring programs evolved to focus sampling efforts on primary sites, which were found to be representative of rice pesticides. Primary monitoring sites have also been routinely used to monitor for newly registered pesticides in the first years of registration and use.
The CWFR primary monitoring sites were selected in 2004 based on an evaluation of the historic water quality monitoring data that determined that water quality exceedances upstream were typically detected in greater concentrations at the four downstream main sites, for the pesticides monitored at upstream and core site locations. This analysis is documented in Section 4 of the CRC’s 2004 Basis of Water Quality Monitoring Program report (“CWFR 2004 Report”)
Primary Monitoring Sites
Primary monitoring sites are to be selected from past monitoring locations or other suitable locations and be used to track trends at selected representative sites over extended periods of time. Table 10-1 shows the MRP Plan Core Monitoring Sites.
Primary monitoring sites for trend monitoring of rice water quality impacts is appropriate because of the uniformity of rice farming practices across the Valley. Rice water management and rice water quality management practices are relatively consistent throughout the Sacramento Valley: the same set of field preparation, irrigation, and harvest practices are available to growers. Additionally, the same set of water hold requirements are in place for growers, leaving little variation in the methods of rice farming in one drainage versus another.
Secondary Monitoring Sites Secondary (assessment) monitoring sites are to be selected to achieve the following:
• provide data on waterbodies representing a range of hydrologic conditions
• provide data to develop correlations between assessment sites and core sites
• confirm primary site selection
• provide upstream data on newer generation pesticides

10. Sampling Process Design
CRC_2010QAPP_Final_7-21-2010.doc Page 63 of 125
• monitor water quality from drainages with a high percentage of land farmed in rice
This section presents the approach taken to identify candidate assessment sites, and the selection of appropriate assessment sites.
Evaluation of Candidate Sites The historic DPR and CRC dataset provides the initial set of sites to be considered for selection as assessment sites. This dataset includes 83 sites, including sites located on relatively smaller drainages and creeks, medium drainages (including the primary sites), and Sacramento Valley Rivers.
The hydrology network diagram and maps showing drainages, rice acreage, and monitoring sites were evaluated as part of the effort to select assessment sites. Each site located upstream of a primary site was considered. Then, historic water quality monitoring results (Appendix C of the 2004 CWFR Report) were closely examined to understand past monitoring that was conducted concurrently at upstream and primary sites. Next, a subset of the upstream sites was selected for further evaluation. This subset, called “candidate corollary assessment sites” is shown in Table 10-2, which lists the primary sites, the candidate corollary assessment site that correspond to the primary sites, and the corresponding drainage area represented by the candidate corollary secondary site.
The further evaluation included an examination of land use characteristics of the drainage in which each site was located. Tables 10-3 through 10-5 show the characteristics of the drainages listed above.
Several sites associated with CBD5, BS1, and SSB were identified for consideration. Since the candidate corollary site for CBD1 is simply a site upstream of CBD1, with only a portion of the Sycamore Area drainage contributing between site H and CBD1, no corollary secondary site was identified for CBD1.

10. Sampling Process Design
CRC_2010QAPP_Final_7-21-2010.doc Page 64 of 125
TABLE 10-2 Candidate Corollary Assessment Sites and Corresponding Drainages Primary
Site Candidate Corollary Secondary Site(s) Drainage Corresponding to Secondary Site
CBD5 I Colusa Basin Drain at Maxwell Road in Colusa County (CBD6)
Several upstream drainages (essentially the same as A, except for Lurline, Freshwater, and Hopkins Slough)
K Lurline Creek at Lurline Road in Colusa County (D10)
Lurline Creek
L Freshwater Creek at San Jose Road in Colusa County (D11)
Freshwater Creek
BS1 17 Butte Creek at Colusa Highway Butte Creek, Little Chico Creek
20 Cherokee Canal at Gridley Road Cherokee Canal (all)
37 Main Drainage Canal at Colusa Hwy (trib to Cherokee Canal)
Cherokee Canal (southwest)
CBD1 H Colusa Basin Drain at County Line Road in Colusa and Yolo Counties (CBD2)
Colusa Basin Drain between CBD5 and CBD1
SSB 30 Gilsizer Slough at Bogue Road Appears to capture very minimal rice acreage
32 Gilsizer Slough at Richland Appears to capture very minimal rice acreage
39 Obanion Outfall at DWR PP on Obanion Rd Lower Snake/Gilsizer Slough
40 Obanion Outfall North (Gilsizer Slough) Lower Snake/Gilsizer Slough
59 Sutter Bypass 1 mi. south Hwy. 20 Sutter
63 Wadsworth Canal at Franklin Rd Wadsworth
64 Wadsworth Canal at South Butte Road Wadsworth

10. Sampling Process Design
CRC_2010QAPP_Final_7-21-2010.doc Page 65 of 125
TABLE 10-3 Characteristics of Drainages Tributary to Candidate Secondary Sites Corollary to CBD5
Drainage name Subwatershed
Size of Drainage (acres)
Rice Farmed (acres) % Rice
Rank by Rice
Acreage
Rank by Rice
Percentage
Lurline Creek Colusa Basin 56,157 25,030 45% 4 9
Freshwater Creek Colusa Basin 85,224 16,291 19% 12 26
TABLE 10-4 Characteristics of Drainages Tributary to Candidate Secondary Sites Corollary to BS1
Drainage name Subwatershed
Size of Drainage (acres)
Rice Farmed (acres) % Rice
Rank by Rice
Acreage
Rank by Rice
Percentage
Little Chico Creek Butte S-Sutter N-Sac 82,112 10,494 13% 20 32
Cherokee Canal Butte S-Sutter N-Sac 194,062 74,723 39% 1 12
Butte Creek Butte S-Sutter N-Sac 280,747 55,647 20% 2 25
TABLE 10-5 Characteristics of Drainages Tributary to Candidate Secondary Sites Corollary to SSB
Drainage name Subwatershed
Size of Drainage (acres)
Rice Farmed (acres) % Rice
Rank by Rice
Acreage
Rank by Rice
Percentage
Gilsizer Butte S-Sutter N-Sac 31,942 1,041 3% 42 45
Wadsworth Butte S-Sutter N-Sac 54,942 12,317 22% 16 22
Lower Snake Butte S-Sutter N-Sac 25,721 12,691 49% 15 4
Lower Snake + Wadsworth 1 Butte S-Sutter N-Sac 80,663 25,008 31%
1 The drainage size and rice acres for the Lower Snake and Wadsworth are calculated as the sum of the two drainages.
Criteria for Secondary Site Selection After consideration of the percentage of each drainage area farmed in rice, the sites shown in Table 10-6 were selected as secondary sites. These represent relatively smaller drainages that are tributary to primary sites. These sites each capture a higher proportion of rice drainage than the other site candidate sites, and therefore tend to be representative of more concentrated rice drainage.

10. Sampling Process Design
CRC_2010QAPP_Final_7-21-2010.doc Page 66 of 125
TABLE 10-6 Selected Secondary Sites Core Site Selected Corollary Secondary Site
CBD5 K Lurline Creek at Lurline Road in Colusa County (D10)
BS1 20 Cherokee Canal at Gridley Road
SSB 39 Obanion Outfall at DWR PP on Obanion Road
RPP Rationale
The RPP was originally implemented in 1983 to reduce discharges into surface waterways of the rice herbicides molinate (Ordram®) and thiobencarb (Bolero® and AbolishTM). A collaborative effort was established with the CDFA, now DPR, (who provided initial program administration), the CVRWQCB, the CACs, the University of California the UCCE, the DFG, the California rice industry and other parties. In 1990, the CVRWQCB established formal program requirements through adoption of amendments to the Basin Plan for the Sacramento River and San Joaquin River Basins. The Basin Plan was amended to include an implementation plan for the control of rice field discharges containing carbofuran, malathion, and methyl parathion (insecticides), and molinate and thiobencarb (herbicides). A prohibition of discharge of water containing these five pesticides would be implemented unless dischargers followed approved management practices adopted by the CVRWQCB. Currently, only thiobencarb is registered for use and included in the 2010-2012 monitoring. The insecticides are not longer monitored for the following reasons: carbofuran and molinate are no longer registered for use on rice, malathion is used on less than 500 acres and methyl parathion is no longer used. Beginning in 1990, the Basin Plan established performance goal for thiobencarb,; this goal is listed below:
• Thiobencarb - 1.5 ug/L
With the creation of the California Environmental Protection Agency (Cal/EPA) in the early 1990s, program responsibilities were transferred from the CDFA to the newly created DPR. In 2002, DPR fulfilled the annual program reporting requirements before turning over the entire responsibility of monitoring, analyzing and reporting to the CRC.
In addition to performance goals, thiobencarb must meet MCLs measured in ug/L or parts per billion (ppb). MCLs are enforceable drinking water standards, set by the USEPA and/or California Department of Health Services (DHS). Water utilities are required to stay below MCLs in the water they provide their customers. The primary MCL for thiobencarb is 70.0 ppb (toxicity), the secondary MCL for thiobencarb is 1.0 ppb (off-taste). Secondary MCLs are derived in the same manner as primary MCLs, except they are based on aesthetic properties (e.g. taste, odor, or appearance) rater than health-based criteria. Monitoring and analysis of thiobencarb by the cities at the drinking water intakes takes place simultaneously with the duration of the RPP.

10. Sampling Process Design
CRC_2010QAPP_Final_7-21-2010.doc Page 67 of 125
Over the years, best management practices, such as water holding requirements, were implemented to ensure compliance with performance goals and protection of the water quality objectives/MCLs. The “water holds” allow for degradation of pesticides to occur, reducing concentrations contained in rice field runoff that enter waterways adjacent to a treated field. The standard holding period for granular thiobencarb (Bolero®) is 30 days, liquid thiobencarb (AbolishTM) is 19 days, methyl parathion is 24 days, and malathion is 4 days. Reduced water holds for thiobencarb is allowed when these products are applied in water-short areas, when closed water management systems are used and in hydrologically isolated fields that do not enter adjacent waterways.
Water Quality Management Practices
Management practices are a key component of the rice water quality programs. During the early phases of the RPP, management practices were developed to protect water quality. The cornerstone of rice management practices is a thorough understanding of the rice calendar, including the application methods and timing of pesticide use.
Management practices include field-level management of rice pesticides and discharges, CAC enforcement programs, grower education efforts, and communications programs. This chapter includes the pesticide use calendar, general information on rice water quality management practices, and specific 2007 enforcement data.
Pesticide Use Calendar The following tables depict the season or timing of pesticide applications to rice. Included are separate tables for possible herbicide applications (Table 10-7), tank mix combinations (Table 10-8), insecticide applications (Table 10-9), and sequential herbicide applications (Table 10-10). A “sequential” is the application of an herbicide followed by another herbicide with a different mode of action. Sequential applications are used to achieve better coverage and efficacy for weed control. The second application usually occurs in the next growth stage of the rice plant. For example, clomazone is applied at germination. A sequential application of bispyribac-sodium is applied at tiller initiation. Figure 10-2 provides illustrations of rice’s growth stages.
Rice pesticide applications are timed for specific growth stages of the rice plant and target pest. To simplify the rice growth schedule, the following tables group pre-flood and germination into early season; tiller initiation and tillering are mid-season, and panicle initiation and flower are late season.
This calendar of applications provides information that is useful for understanding potential water quality concerns relative to particular times during the year.

10. Sampling Process Design
CRC_2010QAPP_Final_7-21-2010.doc Page 68 of 125
TABLE 10-7 Recommendations for Timing of Specific Rice Herbicide Applications
Early Season (March–April)
Mid Season (May–June)
Late Season (June–July)
Pre-Flood Germination Tiller Initiation Tillering Panicle
Initiation Flowering
Bensulfuron-methyl
Permanent flood 7-day water hold
Bensulfuron-methyl
Pinpoint flood 7-day water hold
Bispyribac-sodiumPinpoint flood
Carfentrazone-ethyl Permanent flood
5-day static; 30-day release
Clomazone Permanent flood
14-day water hold
Cyhalofop-butyl Pinpoint flood
7-day water hold
Propanil Pin-point flood
Thiobencarb (Bolero and Abolish) Permanent flood
Bolero 30-day/Abolish 19-day
Triclopyr TEA Pinpoint flood
20-day water hold

10. Sampling Process Design
CRC_2010QAPP_Final_7-21-2010.doc Page 69 of 125
TABLE 10-8 Recommendations for Timing of Herbicide Tank Mix Combinations
Early Season (March–April)
Mid Season (May–June)
Late Season (June–July)
Pre-Flood Germination Tiller Initiation Tillering Panicle
Initiation Flowering
Bispyribac-sodium/Thiobencarb
(Abolish) Pinpoint flood
19-day water hold
Propanil/Thiobencarb (Abolish)
Permanent flood 19-day water hold
TABLE 10-9 Timing of Specific Rice Insecticide Applications
Early Season (March–April)
Mid Season (May–June)
Late Season (June–July)
Pre-Flood Germination Tiller Initiation Tillering Panicle
Initiation Flowering
Lambda cyhalothrin
Border treatment 7-day water hold
Lambda cyhalothrin
Boarder treatment7-day water hold
(s)-cypermethrin Border treatment 7-day water hold
(s)-cypermethrin Boarder treatment7-day water hold

10. Sampling Process Design
CRC_2010QAPP_Final_7-21-2010.doc Page 70 of 125
TABLE 10-10 Recommendations for Timing of Sequential Rice Herbicide Applications
Early Season (March–April)
Mid Season (May–June)
Late Season (June–July)
Pre-Flood Germination Tiller Initiation Tillering Panicle
Initiation Flowering
Bispyribac-sodium, Thiobencarb (Bolero)
30-day water hold Permanent Flood
Bispyribac-sodium, Propanil Pinpoint flood
Clomazone, Bensulfuron-methyl 14-day water old Permanent flood
Clomazone, Bispyribac-sodium 14-day water hold Permanent flood
Clomazone, Carfentrazone-ethyl up to 30-day water hold
Permanent flood
Clomazone, Propanil 14-day water hold Permanent flood
Clomazone, Propanil/Triclopyr TEA 20-day water hold
Cyhalofop-butyl, Bensulfuron-methyl7-day water hold
Pinpoint flood
Cyhalofop-butyl, Bispyribac-sodium7-day water hold
Pinpoint flood
Cyhalofop-butyl, Propanil 7-day water hold
Pinpoint flood
Propanil, Cyhalofop-butyl 7-day water hold
Pinpoint flood
Carfentrazone-ethyl, Cyhalofop-butyl 30-day water hold, 7-day water hold
Pinpoint flood

10. Sampling Process Design
CRC_2010QAPP_Final_7-21-2010.doc Page 71 of 125
Monitoring Periods The requirements of the MRP Order were used as general guidelines to establish appropriate monitoring times and frequencies. Past CWFR MRP Plans have defined monitoring periods including irrigation season, fall drainage season, winter flood-up and winter drainage. These monitoring periods were defined to provide functional equivalence to past RWQCB MRP Orders.
Winter Drainage
Winter drainage is defined as mid-February through March. This is the time of year when grower’s drain fields of rice decomposition water (or water applied for wildlife purposes) and begin to prepare the fields for planting.
Irrigation Season
As defined in the MRP Order, the time of year when water is applied to fields for the purpose of promoting crop growth, for distributing nutrients or other chemicals to crop lands or for the purposes of counteracting the effects of frost during cold season months. Based on a review of rice cultural practices, and in order to provide consistency with past CWFR monitoring efforts, the rice irrigation season continues to be defined as April through mid-August.
Peak Pesticide Use Period
As shown above, the rice pesticide use calendar is defined by early-season, mid-season, and late-season pesticide applications. Peak pesticide use on rice occurs during the months of April through July. This period is a subset of the irrigation season, and represents the focus of assessment pesticide monitoring. This approach to assessment pesticide monitoring is appropriate given that the peak use period represents the greatest risk to water quality and the greatest likelihood of rice pesticide detections.
Fall Drainage Season
Prior to harvest, rice fields are drained en masse. Though the specific timing is dependant on the spring planting date and weather patterns, the rice drainage season is typically mid-August through September.
Winter Flood Season
The winter flood season is defined as October through mid-February. During this time of the year, fields are typically flooded for the purposes of rice straw decomposition and/or support of seasonal wildlife habitat.
Spatial and Temporal Resolution
Spatial Resolution
The spatial resolution provided by historic rice pesticides monitoring is presented in the 2004 Basis of Water Quality Monitoring Report. The sites selected under the historic rice pesticides monitoring were selected by DPR, in collaboration with the CRC and RWQCB staff. These sites were selected to be representative of rice drainage in the Sacramento Valley.

10. Sampling Process Design
CRC_2010QAPP_Final_7-21-2010.doc Page 72 of 125
Temporal Resolution
Temporal resolution was selected to coincide with peak pesticide usage and to cover the range of seasonal changes and drainage patterns included in typical rice farming.

10. Sampling Process Design
CRC_2010QAPP_Final_7-21-2010.doc Page 73 of 125
10.3 Monitoring Schedule for Each Location
Monitoring schedules for each year are developed at the beginning of the sampling season, in coordination with the CRC, Kleinfelder, and the laboratories. The attached calendar shows the 2010 monitoring events, including sites and parameters. Updates will be provided for 2011 and 2012 prior to the commencement of monitoring activities, and included in this QAPP as minor revisions. Note that the date of the first sampling event was initially planned for April 27th; however, late season rains have resulted in a delayed planting season. The dates in Table 10-11 will be updated as a QAPP revision once the revised start date is determined.
TABLE 10-11 2010 Monitoring Schedule
Secondary Sampling Date
Primary
(CBD5, BS1, CBD1, SSB)
River (SR1)
F G H
4/27* CWFR general parameters, copper, thiobencarb
RPP general field parameters, thiobencarb
CWFR general parameters, copper
5/4 RPP general field parameters, thiobencarb
RPP general field parameters, thiobencarb
–
5/11 CWFR general parameters, copper, thiobencarb
RPP general field parameters, thiobencarb
CWFR general parameters, copper
5/18 RPP general field parameters, thiobencarb
RPP general field parameters, thiobencarb
–
5/20 RPP general field parameters, thiobencarb
RPP general field parameters, thiobencarb
–
5/25 RPP general field parameters, thiobencarb
RPP general field parameters, thiobencarb
–
5/27 RPP general field parameters, thiobencarb
RPP general field parameters, thiobencarb
–
6/1 CWFR general parameters, thiobencarb, propanil
RPP general field parameters, thiobencarb
CWFR general parameters, propanil
6/3 RPP general field parameters, thiobencarb
RPP general field parameters, thiobencarb
–
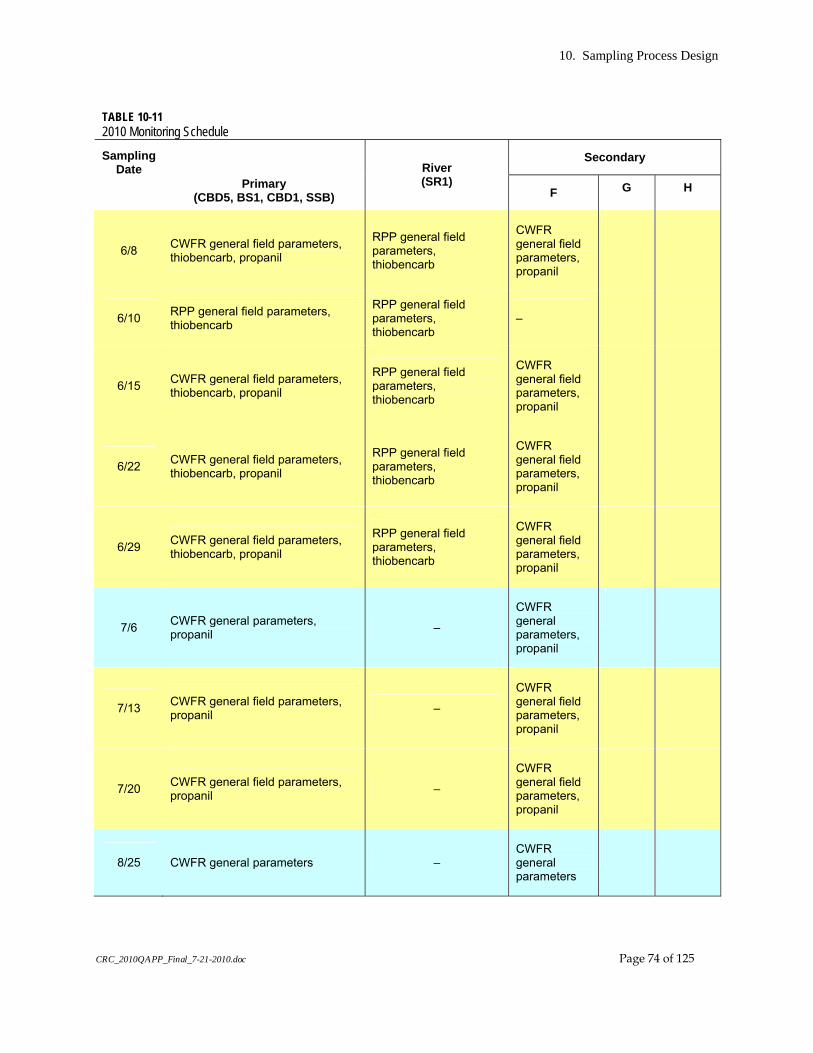
10. Sampling Process Design
CRC_2010QAPP_Final_7-21-2010.doc Page 74 of 125
TABLE 10-11 2010 Monitoring Schedule
Secondary Sampling Date
Primary
(CBD5, BS1, CBD1, SSB)
River (SR1)
F G H
6/8 CWFR general field parameters, thiobencarb, propanil
RPP general field parameters, thiobencarb
CWFR general field parameters, propanil
6/10 RPP general field parameters, thiobencarb
RPP general field parameters, thiobencarb
–
6/15 CWFR general field parameters, thiobencarb, propanil
RPP general field parameters, thiobencarb
CWFR general field parameters, propanil
6/22 CWFR general field parameters, thiobencarb, propanil
RPP general field parameters, thiobencarb
CWFR general field parameters, propanil
6/29 CWFR general field parameters, thiobencarb, propanil
RPP general field parameters, thiobencarb
CWFR general field parameters, propanil
7/6 CWFR general parameters, propanil –
CWFR general parameters, propanil
7/13 CWFR general field parameters, propanil –
CWFR general field parameters, propanil
7/20 CWFR general field parameters, propanil –
CWFR general field parameters, propanil
8/25 CWFR general parameters – CWFR general parameters

10. Sampling Process Design
CRC_2010QAPP_Final_7-21-2010.doc Page 75 of 125
10.4 Exceedance Plan Follow-Up
Exceedances for all parameters are to be reported in the AMR and within the frequency established in the management plan. The CRC shall provide exceedance reports if monitoring results show exceedances of water quality standards or other triggers. When a water quality standard is exceeded at a monitoring location, the CRC shall submit an Exceedance Report to the CVRWQCB. The estimated flow at the location and photographs (if taken due to changed site conditions) will be included.
The Reporting Program Manager will evaluate the monitoring data and make a determination of an exceedance no later than three business days after receiving the lab report, and will forward a draft Exceedance Report to the Program Manager for review and submittal to the CVRWQCB. Exceedance Reports shall be sent by email to the CVRWQCB CRC Liaison. The Exceedance report will describe the exceedance, follow-up monitoring, and analysis or other actions that may be warranted to address or characterize the exceedance.
When any pesticide or toxicity exceedance is identified, follow-up actions are to include an investigation of the pesticide use within the watershed area that is physically associated with the exceedance location. This includes all pesticides applied within the area that drains to the monitoring site during the four weeks prior to the exceedance date. The pesticide use information may be acquired from the CAC or from information received from farmers or pesticide applicators within the same drainage area. Results of the pesticide use investigation are to be summarized and discussed within the AMR.
10.5 Type and Total of Number of Samples, Matrices, and Runs/Trials Expected for the Project
Table 10-12 shows the numbers and types of bottles required for implementation of the 2010 monitoring activities described herein. All 2010 matrixes are water. The bottle plan for 2011 and 2012 will developed at the beginning of the monitoring seasons, and revisions will be incorporated into this QAPP.
10.6. Sample Locations
The sample locations are shown in Appendix A, and are described in Section 8 as well. The Lead Field Technician is knowledgeable of all sample locations included in the project.
10.7 Site Inaccessibility
Extremely wet or extremely dry weather may present constraints to the monitoring programs. Extremely wet weather, although highly unlikely, may limit access to the monitoring locations and require samples to be collected at alternative locations. Historically, all sites except for SSB have been accessible during the sampling season. In some seasons of late, heavy rain, the SSB sampling location may be inaccessible due to high water. If this occurs, an alternative site should be identified; alternative sites would need to be approved by the CVRWQCB before initiation of sampling at those locations.
10.8 Critical Project Data
All project data described herein is considered critical to the program.

10. Sampling Process Design
CRC_2010QAPP_Final_7-21-2010.doc Page 76 of 125
10.9 Variability
Sources of variability could include:
• weather • pesticide use patterns • market conditions (changing the acreage of rice planted) • water availability or water transfers 10.10 Bias & Interpretation
The CWFR and RPP programs were developed to prevent bias from influencing the outcomes. Samples are collected in the field by Kleinfelder, analyzed by a suite of laboratories, and the results compiled and reviewed by CH2M HILL. No single person has control of the outcome of the data or report.
All final reports are reviewed by several members of the CH2M HILL team, along with the CRC Program Manager. This enables the interpretation of the results to be reviewed by several people before submission to the CVRWQCB for review by their staff.

10. Sampling Process Design
CRC_2010QAPP_Final_7-21-2010.doc Page 77 of 125
TABLE 10-12 Numbers of Bottles for Each Sampling Event, 2010
Date Event Metals (Copper,
dissolved)
bottle
Hardness (EPA 200.7)
250 mL HDPE - HNO3
preserved
TDS
bottle
TOC
bottle
Thiobencarb
1x1-L Amber
unpreserved
Propanil
1x1-L Amber
unpreserved
QA/QC
1x1-L Amber
unpreserved
Backup
1x1-L Amber
unpreserved
TOTAL
1x1-L Amber unpreserved
4/27* RPP W1D1 CWFR 0410
9 7 7 7 5 5 - 8 18
5/4 RPPW2D1 – – – – 5 – 1 5 11
5/11 RPP W3D1 CWFR 0510
9 7 7 7 5 – - 7 12
5/18 RPP W4D1 – – – – 5 – 1 5 11
5/20 RPP W4D2 – – – – 5 – 1 5 11
5/25 RPPW5D1 – – – – 5 – 1 5 11
5/27 RPP W5D2 – – – – 5 – 1 5 11
6/1 RPP W6D1 CWFR 0610 Propanil 1
– – 4 4 5 5 2 6 18
6/3 RPP W6D2 – – – – 5 – 1 5 11
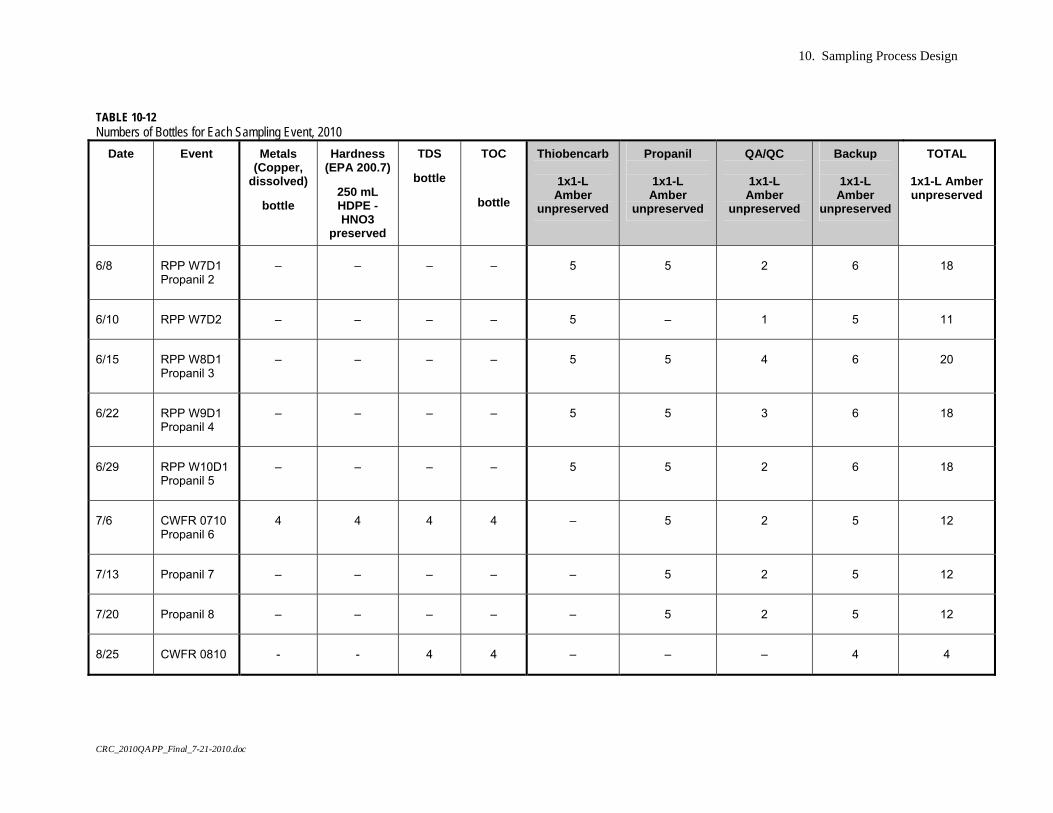
10. Sampling Process Design
CRC_2010QAPP_Final_7-21-2010.doc
TABLE 10-12 Numbers of Bottles for Each Sampling Event, 2010
Date Event Metals (Copper,
dissolved)
bottle
Hardness (EPA 200.7)
250 mL HDPE - HNO3
preserved
TDS
bottle
TOC
bottle
Thiobencarb
1x1-L Amber
unpreserved
Propanil
1x1-L Amber
unpreserved
QA/QC
1x1-L Amber
unpreserved
Backup
1x1-L Amber
unpreserved
TOTAL
1x1-L Amber unpreserved
6/8 RPP W7D1 Propanil 2
– – – – 5 5 2 6 18
6/10 RPP W7D2 – – – – 5 – 1 5 11
6/15 RPP W8D1 Propanil 3
– – – – 5 5 4 6 20
6/22 RPP W9D1 Propanil 4
– – – – 5 5 3 6 18
6/29 RPP W10D1 Propanil 5
– – – – 5 5 2 6 18
7/6 CWFR 0710 Propanil 6
4 4 4 4 – 5 2 5 12
7/13 Propanil 7 – – – – – 5 2 5 12
7/20 Propanil 8 – – – – – 5 2 5 12
8/25 CWFR 0810 - - 4 4 – – – 4 4

CRC_2010QAPP_Final_7-21-2010.doc Page 79 of 125
11. SAMPLING METHODS The Sample Collection Methods element provides for information regarding how samples will be collected consistently between all locations and by all sampling staff. The methods for sample collection preparation, physical collection, handling, and transportation must include measures to avoid contamination, ensure accurate tracking, and preserve sample integrity for analysis.
This element also includes a list of applicable field and laboratory SOPs identified by number, date, and regulatory citation. The identified SOPs must be attached to the QAPP as appendixes.
The sample collection methods described below were developed over the 20+ year history of the RPP. All collection methods were developed under the management of DPR in collaboration with the CVRWQCB, CACs, UCD, UCCE and DFG. Further refinement took place when the CRC began managing the program in 2003.
11.1 Identify criteria for acceptable versus unacceptable water and sediment samples.
Acceptable water and sediment samples will be delivered to the laboratory at the required holding temperature. The analyses shall be performed within the required hold time for the method. Samples bottles and seals will be intact. Samples will be accompanied by a chain-of-custody form.
It is noted that some samples collected during the summer may not yet have had time to be chilled to the 4C temperature. In the event that a sample was collected late in the day, iced immediately, and delivered per the standard transport procedures, this sample will be deemed to be in compliance with sample preservation requirements.
Samples that are not intact, are broken, are not at correct temperature, or are analyzed outside of the holding time are considered unacceptable.
11.2 Identify pre-sample collection preparation methods.
There are no pre-sample collection preparation methods applicable for this program.
11.3 Identify sample collection method SOPs.
SOP #1: Flow Measurement All sampling events must include flow information. When possible the USGS method should be used at all wadeable and nonwadeable stream sites for accurately determining flow during each specific monitoring event. If the USGS method cannot be used then flow measurements should be taken near the stream bank of the site or the float method can be used. The approximate location and number of stream flow measurements should be documented on the data sheets. Photo documentation will also be used when site conditions are abnormal. Data files for flow data should contain a comment column that will allow a flag for flow measurements that have a high degree of uncertainty. Flow data with a high degree of uncertainty should not be used for pesticide (or other constituent) instantaneous loading calculations. More rigorous load calculations might be required for TMDL or other programs needs.

11. Sampling Methods
CRC_2010QAPP_Final_7-21-2010.doc Page 80 of 125
Flow is measured only under the CWFR. Measurements are taken at 10 cross-sections at each site. The wetted width of the waterbody is measured, recorded, and divided by 10 to determine the width of each cross-section. The midpoint of each cross-section is calculated by dividing the cross-section width in half. Velocity is measured at the midpoint of each cross-section at 0.2 and 0.8 of the total depth from the water surface, and then averaged. Flow is then calculated back in the office by the Reporting Project Manager.
Flow measurement should be collected after collection of water and sediment samples in order to reduce sediment disturbance.
SOP #2: Physical Parameter Sample Collection and Documentation Measurements of physical parameters, including electrical conductivity (EC), dissolved oxygen (DO), temperature, turbidity, and pH, are taken for the CWFR events, and pH, temp and DO measurements are taken for the RPP monitoring events. These parameters are to be measured using a multiprobe instrument that is to be lowered directly into the water column. The meter is to be calibrated at the beginning of the sampling day, and is to be allowed to equilibrate for at least 90 seconds before data are recorded. Calibration logs for the monitoring events are to be completed and included with the records for the sampling event. Physical parameter results are to be logged on the field sheet for each sampling site during each sampling event.
• pH: a pH probe will be lowered directly into the water column and allowed to equilibrate for at least one minute before pH is recorded to the nearest 0.1 pH unit.
• Electrical Conductivity (EC) − EC will be measured directly from the water column using the multiprobe meter. The
conductivity probe will be allowed to equilibrate for at least one minute before specific conductance is recorded to three significant figures (if the value exceeds 100).
− Units will be umhos/cm • Dissolved Oxygen (DO)
− The multiprobe instrument will be lowered directly into the water column and allowed to equilibrate for at least 90 seconds before DO is recorded to the nearest 0.1 mg/L
− Units will be mg/L • Temperature
− Water temperature will be measured directly from the water column using the multiprobe meter
− Units will be degrees C • Turbidity
− Turbidity will be measured from a sample taken from the water column using a turbidity meter
− Units will be NTUs Initial photo documentation will be used to track the physical conditions at each sampling point, including: water volume, color, interferences in the channel, etc. Photo documentation is especially important for those sites/events where non-typical conditions exist.
SOP #3: Pesticides Sample Collection and Documentation Surface water samples will be collected using a Kemmerer water sampler (either stainless steel and Teflon model, or clear acrylic & PVC model; approximately 1.5 liter volume) at a depth

11. Sampling Methods
CRC_2010QAPP_Final_7-21-2010.doc Page 81 of 125
equal to one-half the water column. The Kemmerer will be emptied into a stainless steel container and the process repeated until the appropriate volume of water is acquired to split into the required number of samples. This process allows for homogenization as additional sample volume is added to the container. Certified sample containers are filled with the composite sample using a stainless steel funnel, with an additional bottle filled to be held in sample control as a back-up sample.
Pesticides samples collected at each site will be recorded on the field sheet for that site. Possession of samples will be tracked through the use of chain of custody (COC) forms.
SOP #4: Aquatic Toxicity Testing Sample Collection and Documentation Sample collection methodology same as above for SOP #3: Pesticides Sample Collection and Documentation.
Aquatic toxicity samples collected at each site will be recorded on the field sheet for that site. Possession of samples will be tracked through the use of COC forms.
SOP #5: Sediment Toxicity Testing Sample Collection and Documentation Sediment samples will be collected next using a LaMotte stainless steel bottom-sampling dredge with an approximate sample volume of 67.5 cubic inches. The grab will be slowly lowered to the bottom with a minimum of substrate disturbance and retrieved at a moderate speed (less than two feet per second) to reduce disturbance to the sediment surface. The water overlying the sediment in the grab will be decanted using care not to remove the surficial sediments. The top 2 cm of surficial sediment will be subsampled using a pre-cleaned flat bottom scoop, and placed into a stainless steel container. The process will be repeated until enough top layer sediment has been collected to fill two pre-cleaned 1-liter wide-mouth glass jars, taking care to scrub the sampling dredge with ambient water between successive deployments to reduce field contamination from below the sample layer.
Sediment samples collected at each site will be recorded on the field sheet for that site. Possession of samples will be tracked through the use of COC forms.

11. Sampling Methods
CRC_2010QAPP_Final_7-21-2010.doc Page 82 of 125
SOP #6: Meter Calibration and Documentation Routine meter calibration will be performed at least once per sample day prior to instrument use to check that all instruments are operating properly and producing accurate and reliable data. Specific calibration information is summarized as follows:
• YSI Meter: • Temperature - the YSI meter is an automatic temperature compensator that adjusts all
readings to a temperature of 25 degrees Celsius • pH - calibrated on two standards: a pH 7.0 standard and a pH 10.0 standard • DO - calibrated using the current barometric pressure for the Sacramento area in ml of
mercury, and an assumed atmospheric oxygen concentration • EC - calibrated using a 1 point calibration on a 1413 uS/cm standard.
• Turbidity Meter: • A three point calibration against a 0.02 NTU standard, a 10.0 NTU standard, and 1000
NTU standard. All meters are sent to the manufacturer at the beginning of the season for routine maintenance and mid-season if there are problems with routine calibrations. A sample meter calibration sheet is included in Appendix B.
SOP #7: Sample Equipment and Container Decontamination Non-disposable sampling equipment used in the collection of samples will be decontaminated after each use by thoroughly rinsing with distilled water. The sampling equipment will also be rinsed at each site with river water from the middle of the water column before sample collection. Clean sampling equipment will not be placed on the ground or other contaminated surfaces prior to use. Field personnel will wear clean, disposable gloves.
11.4 Identify sample container sizes, preservation, and transportation.
See Section 12.1 for information on container sizes and preservation. See Section 12.3 for sample transportation information.
11.5 Discuss sampling equipment cleansing and decontamination
See SOP #7.
11.6 Discuss corrective action measures for problematic situations
If sample bottle breakage occurs: A 1-liter amber bottle is filled with sample water at each location during each event to serve as backup water.
If breakage occurs and no backup sample is available: In cases where bottles break and where no backup sample exists, the site will be re-sampled within the same week and the samples will be submitted for analysis.

11. Sampling Methods
CRC_2010QAPP_Final_7-21-2010.doc Page 83 of 125
11.7 Discuss, if applicable to the project, how samples are homogenized, composited, split, and/or filtered.
Water samples:
Samples are collected with the Kemmerer water sampler and emptied into a stainless steel container until sufficient volume is collected. The composite sample is homogenized (see process, above), and then the appropriate sample bottles are filled using a stainless steel funnel.
Sediment samples:
Samples are collected using the LaMotte dredge and are emptied into a glass homogenizing container, such as a Pyrex bowl, until sufficient volume is collected. The composite sample is then blended using a pre-cleaned flat bottom scoop, and then transferred into the appropriate sample bottles.
11.8 Describe field procedures including the following items:
Photo Documentation: Photo documentation will consist of providing a representative photo for each site. When site conditions are unique or out of the ordinary, such as high or low flow, debris in the channel, or extreme algae conditions, a photo will be taken and the conditions noted on the field data sheet.
Recognize and avoid potential sources of contamination: Field personnel must be instructed in the proper collection of samples prior to the sampling event and in how to recognize and avoid potential sources of contamination. This will be discussed in the required Field Sample Collection Training that is included as part of this monitoring program.
Acceptable vs. Unacceptable Sample: Field personnel must be able to distinguish acceptable versus unacceptable water and sediment samples in accordance with pre-established criteria, as described above.
Sample Bottles: Sample containers must be new, pre-cleaned, and certified to be free of contamination according to the USEPA specification for the appropriate methods. Sample bottles will be provided by the analytical labs or purchased through a supply company. Samples will be held on wet ice (4oC) until delivered to the laboratory for analysis or sample control. Backup samples will be collected and held in secure sample control (4oC) until the initial data analyses are complete.
Decontamination: All field and sampling equipment that comes in contact with field samples must be decontaminated after each use in a designated area to minimize cross-contamination. Decontamination procedures (proper procedures for how and when to clean the equipment) are specified in the SOP #7.
Sample Numbering: All samples are to be identified with a unique number to ensure that results are properly reported and interpreted. Samples must be identified such that the site, sampling location, matrix, sampling equipment, and sample type (i.e., normal field sample or QC sample) can be distinguished by a data reviewer or user. The Field Project Manager provides the Lead Field Technician with sample ID information prior to the sampling event. This sample ID is recorded on the bottle and the COC form, and is the basis of reporting used by the labs.

11. Sampling Methods
CRC_2010QAPP_Final_7-21-2010.doc Page 84 of 125
Custody and Documentation: The Field Project Manager is be responsible for ensuring that the field sampling team adheres to proper custody and documentation procedures. A master binder of field datasheets shall be maintained for all samples collected during each sampling event. The QA Officer is responsible for confirming adherence to custody and documentation requirements described herein.
Documentation: All field activities must be adequately and consistently documented to ensure defensibility of any data used for decision-making and to support data interpretation. Pertinent field information, including (as applicable), the width, depth, flow rate of the stream, the surface water condition, and the actual GPS coordinates where the sample was taken must be recorded on the field sheets, along with field measurements.
Corrective Action: For field work, Kleinfelder staff communicates problems via radio phone. The Kleinfelder team communicates the issue with Roberta Firoved at the CRC. Roberta Firoved communicates any changes in the monitoring schedule and/or site locations to the CVRWQCB. All corrective action procedures are documented immediately through e-mail communication and the semi-annual and annual reports.

CRC_2010QAPP_Final_7-21-2010.doc Page 85 of 125
12. SAMPLE HANDLING AND CUSTODY The Sample Handling and Custody element provides a discussion of the sample integrity maintenance requirements as well as tracking and chain-of-custody procedures. The components of this element must describe the efforts that will be taken to ensure the physical and chemical integrity of a sample from collection to disposal.
12.1 Identify sample holding times, integrity, and storage measures (both before and after extraction).
TABLE 12-1 Water Sample Analysis Sample Containers, Volume, Preservation, and Holding Time
Parameters for Analysis in
Water Samples
Specified Containers
Sample Volume Initial Field Preservation Maximum Holding Time (analysis must start by
end of max)
Hardness 200 ml polyethylene or glass bottle
200 ml (one bottle)
Cool to 4C, dark
40 hrs at 4C, dark
6 months at 4C, dark
Total Dissolved Solids
TBD 1000 ml Cool to 6C, dark 7 days at 6 C, dark
Total Organic Carbon
40ml (one vial) Cool to 6C, dark 28 days at 6 C, dark
total Kjeldahl nitrogen
600 ml Cool to 6C, dark Recommend: 7 days Maximum: 28 days at 6 C, darl
nitrate + nitrite (as N)
Cool to 6C, dark 48 hours at 6 C, dark
total ammonia 500 ml Cool to 6C, dark 48 hours at 4 C, dark or, if acidified, 28 days at 6 C, dark
total phosphorous (as P)
300 ml Cool to 6C, dark 28 days at 6C, dark
soluble orthophosphate
150 ml Cool to 6C, dark 48 hours at 6 C, dark

12. Sample Handling and Custody
CRC_2010QAPP_Final_7-21-2010.doc Page 86 of 125
TABLE 12-1 Water Sample Analysis Sample Containers, Volume, Preservation, and Holding Time
Parameters for Analysis in
Water Samples
Specified Containers
Sample Volume Initial Field Preservation Maximum Holding Time (analysis must start by
end of max)
Pesticides 1-L amber glass bottle, with Teflon lid-liner (per each sample type)
1000 mL (one container) *Each sample requires 1000 mL in a separate container
Cool to 4C, dark. (Chlorine is not expected to be present, so no additional treatment required.)
Keep at 4, up to 7 days. Extraction must be performed within the 7 days; analysis must be performed within 40 days of extraction. (Standard turn-around time applies.)
Aquatic Toxicity Testing
Four 2.25L amber glass bottles (recommended volume 4 gallons)
9000 mL Cool to 6C, dark 38 hours at 4C, dark

12. Sample Handling and Custody
CRC_2010QAPP_Final_7-21-2010.doc Page 87 of 125
TABLE 12-2 Sediment Analysis Sample Containers, Volume, Preservation, and Holding Time Parameters for Analysis
in Water Samples
Specified Containers
Sample Volume Initial Field Preservation Maximum Holding Time (analysis must start by
end of max)
Sediment Toxicity Testing
I-Chem wide-mouth polyethylene jar with Teflon lid-liner; Pre-cleaned
2-Liters (two jars filled completely)
Cool to 4C, dark, up to 14 days
14 days (4C)
Do not freeze
Sediment Total Organic Carbon
125 mL clear glass jar; pre-cleaned
125 mL (one jar) Cool to 4C, dark, up to 48 hours
12 months1
Synthetic Organic Compounds
250 mL amber glass jar with Teflon lid-liner; pre-cleaned
500 mL (two jars) Cool to 4C, dark, up to 48 days
12 months1
1 Sediment samples will be held until toxicity results are available, and if additional sediment analyses are required, they will be performed subsequent to toxicity testing results.
12.2 Identify corrective action for samples that do not meet preservation and/or holding times.
It is assumed that the labs will consistently achieve sample analysis within the required holding times. If any sample is found to not meet preservation and/or holding times, the Lab Director or designee will immediately inform the Field Project Manager. Samples that do not meet preservation and/or holding times will be re-sampled.
It is noted that some samples collected during the summer may not yet have had time to be chilled to the 4C temperature. In the event that a sample was collected late in the day, iced immediately, and delivered per the standard transport procedures, this sample will be deemed to be in compliance with sample preservation requirements.
12.3 Identify the physical transport of samples from the field.
Sample shipments will be accompanied by the original COC form, which will identify the contents. Samples will be transported as soon as possible after sample collection to the laboratory for analyses. The following procedures will be used when packing and transporting samples to the laboratory:
• Waterproof metal or equivalent strength plastic ice chests or coolers will be used; • Wet ice or “blue ice” will be placed around, among, and on top of the samples; • Paperwork (COC record, etc.) will be placed in a waterproof plastic bag and taped to the
inside lid of the cooler if shipped, otherwise paperwork will be hand delivered to the lab;
Samples will be delivered as follows:

12. Sample Handling and Custody
CRC_2010QAPP_Final_7-21-2010.doc Page 88 of 125
• Analytic Samples: Either driven by car to McCampbell Analytical OR held in Kleinfelder’s refrigerated sample control overnight & shipped to registrant lab (Valent) the next morning (RPP).
• Aquatic Toxicity Samples: Delivered by Car to AquaScience
• Sediment Toxicity Samples: Delivered by Car to AquaScience, then shipped to Nautilus
12.4 Discuss sample handling and custody documentation
Sampling handling and custody documentation will be recorded on the COC Form, as described in Section 12.8.
12.5 Identify sample Chain-of-Custody procedures.
Custody of samples must be maintained and documented from the time of sample collection to the completion of the analyses. Each sample will be considered to be in the sampler’s custody, and the sampler will be personally responsible for the care and custody of the samples until they are delivered to sample control or the analytical laboratory. A sample is considered to be under a person’s custody if:
• The sample is in the person’s physical possession; • The sample is in view of the person after that person has taken possession; • The sample is secured by that person so that no one can tamper with the sample; • That person secures the sample in an area that is restricted to authorized personnel. Field datasheets and copies of the chain-of-custody forms will be maintained on the project website for all samples collected during each sampling event.
12.6 Identify the individuals responsible for verifying procedures.
Both the Field Project Manager and the QA Officer are responsible for verifying that sample handling and custody requirements are adhered to.
12.7. Field custody procedures
Sample custody must be traceable from the time of sample collection until results are reported. Sample custody procedures provide a mechanism for documenting information related to sample collection and handling.
A COC form must be completed after sample collection and prior to sample shipment or release. The COC form, sample labels, and field documentation must be cross checked to verify sample identification, type of analyses, number of containers, sample volume, method of preservation, and type of containers.
All sample shipments are accompanied with the COC form, which identifies the contents. The original COC form accompanies the shipment and a copy is retained in the project file.
All shipping containers will be secured with packing tape and the COC will be placed inside the cooler (in a sealed bag) for transportation to the laboratory. The samples must be transported in ice to maintain sample temperature between 2-4 degrees Celsius. The samples are to be protected in bubble wrap bags, or in specialty shipping containers provided by the
12. Sample Handling and Custody
CRC_2010QAPP_Final_7-21-2010.doc Page 89 of 125
labs and shipped to the contract laboratories according to Department of Transportation standard.
Samples that do not meet preservation and/or holding times need to be re-sampled.
If the lab informs the Field Project Manager that samples did not meet preservation and/or holding times, the Field Project Manager will inform the Program Manager, and will schedule the field crew to resample the site(s).
12.8. Chain of Custody forms
A COC form will be completed after sample collection at each sample event and prior to sample shipment or release. The COC record forms will be filled out with indelible ink. The COC form, sample labels, and field documentation will be cross-checked to verify sample identification, type of analyses, sample volume, and number and type of containers. Appendix B shows an example of the Kleinfelder COC form. This form or a similar form should be used to track possession of all samples. The project’s COC form is included in Appendix B.
Chain of custody forms should include the following items: (a) Sampler name. (b) Address (where the results need to be send). (c) Bottle temperatures at log-in. (d) To whom the laboratory results need to be sent. (e) Sample identification. (f) Analysis required. (g) Number of containers of each type (i.e. plastic, glass, vial, whirlpak). (h) Sample collection date and time. (i) Comments/special instructions. (j) Samples relinquished by (signature, print name, date). (k) Samples received by (signature, print name, date).
12.9. Sample control activities
Sample control activities must be conducted at the laboratory as well as in the field. Project laboratory custody procedures must include the following conditions:
(a) Verify initial sample log-in and verification of samples received with the COC form.
(b) Document any discrepancies noted during log-in on the COC.
(c) Initiate internal laboratory custody procedure.
(d) Verify sample preservation (e.g., temperature).
(e) Notify the project coordinator if any problems or discrepancies are identified.
(f) Identify proper sample storage, including daily refrigerator temperature monitoring and sample security.

12. Sample Handling and Custody
CRC_2010QAPP_Final_7-21-2010.doc Page 90 of 125
Samples will be held on wet or blue ice (4°C) until delivered to the laboratory for analysis or sample control. Backup samples will be collected and held in secure sample control (4°C) until the initial data analyses are complete. Samples that do not meet preservation and/or holding times will be re-sampled.
It is noted that some samples collected during the summer may not yet have had time to be chilled to the 4C temperature. In the event that a sample was collected late in the day, iced immediately, and delivered per the standard transport procedures, this sample will be deemed to be in compliance with sample preservation requirements.
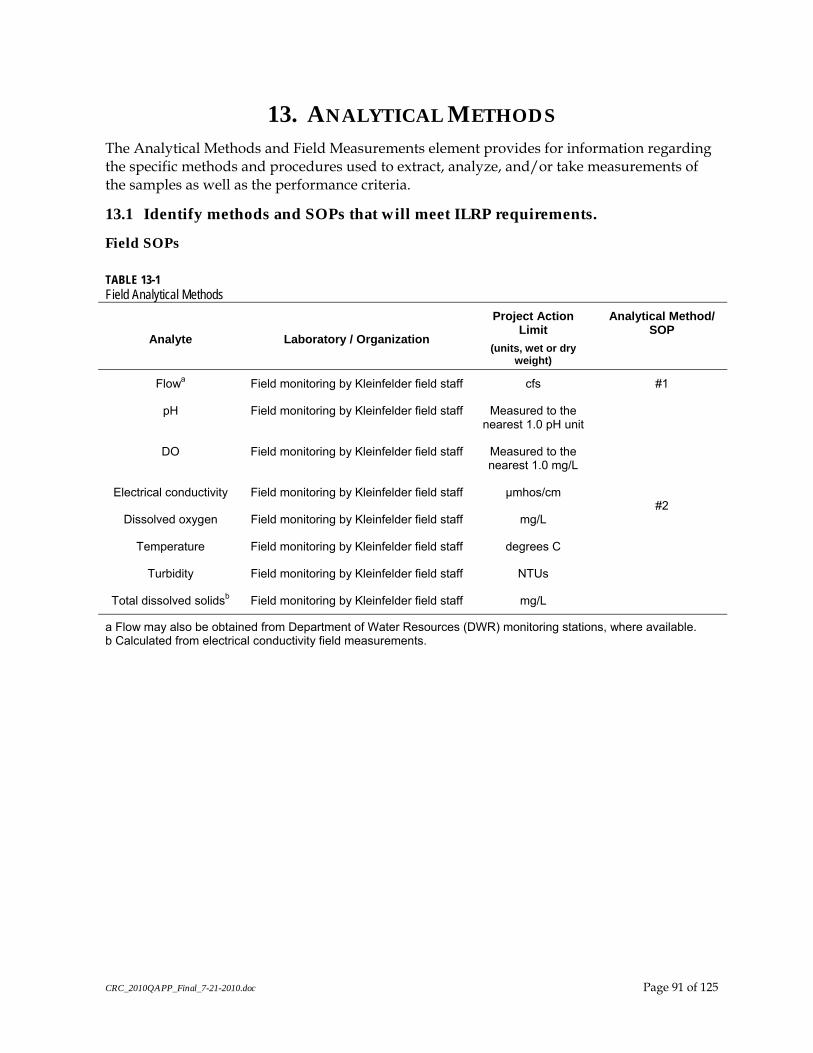
CRC_2010QAPP_Final_7-21-2010.doc Page 91 of 125
13. ANALYTICAL METHODS The Analytical Methods and Field Measurements element provides for information regarding the specific methods and procedures used to extract, analyze, and/or take measurements of the samples as well as the performance criteria.
13.1 Identify methods and SOPs that will meet ILRP requirements.
Field SOPs
TABLE 13-1 Field Analytical Methods
Analyte
Laboratory / Organization
Project Action Limit
(units, wet or dry weight)
Analytical Method/ SOP
Flowa Field monitoring by Kleinfelder field staff cfs #1
pH Field monitoring by Kleinfelder field staff Measured to the nearest 1.0 pH unit
DO Field monitoring by Kleinfelder field staff Measured to the nearest 1.0 mg/L
Electrical conductivity Field monitoring by Kleinfelder field staff µmhos/cm
Dissolved oxygen Field monitoring by Kleinfelder field staff mg/L
Temperature Field monitoring by Kleinfelder field staff degrees C
Turbidity Field monitoring by Kleinfelder field staff NTUs
Total dissolved solidsb Field monitoring by Kleinfelder field staff mg/L
#2
a Flow may also be obtained from Department of Water Resources (DWR) monitoring stations, where available. b Calculated from electrical conductivity field measurements.

13. Analytical Methods
CRC_2010QAPP_Final_7-21-2010.doc Page 92 of 125
TABLE 13-2 Laboratory Analytical Methods
Analyte
Laboratory / Organization
Project Action Limit
(units, wet or dry weight)
Analytical Method/ SOP
Copper McCampbell Analytical - EPA 200.8
Glyphosate McCampbell Analytical - EPA 547
Pesticides McCampbell Analytical - Alternative methods*
Hardness McCampbell Analytical - USEPA 200.7, 130.1, 130.2, SM 2340C
TDS McCampbell Analytical - EPA 160.1
TOC McCampbell Analytical - EPA 415.3
Thiobencarb Valent 1.5 ug/L (Basin Plan Performance Goal) Registrant method
Thiobencarb QC Samples CLS Labs 1.5 ug/L (Basin Plan
Performance Goal) EPA 507
Aquatic Toxicology - Green Algae AQUA-Science
≥20% reduction in cell growth = resampling
EPA 821-R-02-012; lab SOP 510
Aquatic Toxicology - Fathead Minnow AQUA-Science
≥20% reduction in survival =
resampling
EPA 821-R-02-012; lab SOP 503.3
Aquatic Toxicology - C.
dubia AQUA-Science
≥20% reduction in survival =
resampling
EPA 821-R-02-012; lab SOP 503.3
Sediment toxicology - 10 Day Hyalella Nautilus
≥20% reduction in survival = pesticide
analysis
SOP #518; based on EPA 823-B-98-004
and EPA 600/R-99/064
13. Analytical Methods
CRC_2010QAPP_Final_7-21-2010.doc Page 93 of 125
13.2 Identify instrumentation and kits associated with field measurements and laboratory measurements.
Several instruments are used to measure field parameters. They include:
• Flow meter: General Oceanics, Inc., Model 2135 Flow meter Display and Model 2031 Flow meter
• Multiparameter instrument (pH, D.O., Temp, EC): YSI 556 MPS • Turbidity meter: LaMotte 2020
13.3 Describe sample disposal procedures
Samples that are collected in unpreserved bottles and need to be disposed of in the field can be poured onto the ground or back into the waterbody downstream of the sampling location. Samples that are collected into preserved bottles should be disposed of at the lab.
Sample disposal at the lab is described in the Lab QAPPs.
13.4 Identify method and instrument performance criteria, detection, and QLs.
See Table 7-2 for Reporting Limits. See lab SOQs for method and instrument performance criteria.
13.5 Identify corrective action measures and documentation for test/measurement failure.
Table 13-2 lists the required corrective actions for field measurements. Table 13-3 lists the required corrective actions for analytical/chemistry labs, and Table 13-4 lists the required corrective actions for labs performing toxicity testing.
TABLE 13-3 Field Testing Required Corrective Actions
Type of Failure Required Corrective Action for Failures
Field Measurement
Depth, dissolved oxygen, pH, salinity, specific conductance, temperature, turbidity, velocity
The instrument should be recalibrated following the manufacturer cleaning and maintenance procedures. If measurements continue to fail measurement quality objectives, affected data should not be reported and the instrument should be returned to the manufacturer for maintenance. All troubleshooting and corrective actions should be recorded in the calibration and field data log sheets.
A backup probe should be available in the event of equipment failure, and the calibration and use of the backup should be reported in the field data sheets.

13. Analytical Methods
CRC_2010QAPP_Final_7-21-2010.doc Page 94 of 125
TABLE 13-4 Lab Analysis Required Corrective Actions
Type of Failure Required Corrective Action for Failures
Laboratory Quality Control
Calibration Standard Affected samples and associated quality control must be reanalyzed following successful instrument recalibration.
Continuing Calibration Verification
The analysis must be halted, the problem investigated, and the instrument recalibrated. All samples after the last acceptable continuing calibration verification must be reanalyzed.
Laboratory Blank If any analyte concentration in the method blank is above the PQL, all samples associated with that meted must be re-extracted and re-analyzed for that analyte. The exception to the above requirement is for common lab contaminants such as volatile solvents and phthalates, where all samples with an analyzed concentration less than 10 times the method blank concentration and above the PQL must be re-digested and re-analyzed for that analyte.
Reference Material/LCS/LCSD
Affected samples and associated quality control must be re-analyzed if acceptance criteria are exceeded.
Matrix Spike Results should be reviewed to evaluate matrix interference. If matrix interference is suspected, and reference material recoveries are acceptable, the matrix spike and the matrix spike duplicate result must be qualified.
Matrix Spike Duplicate
Appropriately spiked results should be compared to the matrix spike and evaluated for matrix interference. If matrix interference is suspected, and reference material recoveries are acceptable, the matrix spike duplicate result must be qualified.
Laboratory Duplicate For supplicates with a heterogeneous matrix and/or ambient levels below the reporting limit, failed results may be qualified. Other failures should be reanalyzed as sample volume allows.
Internal Standard The instrument must be flushed with rinse blank. If, after flushing, the responses of the internal standards remain unacceptable, the analysis must be terminated the cause of drift investigated.
Surrogate n/a
Period Laboratory Quality Control
Method Detection Limit Study
If results do not meet analytical methods requirements and the requirements of 40 CFR Part 136 Appendix B, a new MDL study must be performed before sample analysis begins. Any variance from this requirement must be requested and approved in writing prior to sample analysis.
Proficiency Test, Intercomparison
Results should be subjected to troubleshooting and/or reanalysis. If allowed by the vendor or referee, results may be resubmitted. To further examine the analytical failure, a follow-up proficiency test or intercomparison study should be completed as soon as possible.

13. Analytical Methods
CRC_2010QAPP_Final_7-21-2010.doc Page 95 of 125
TABLE 13-5 Toxicity Testing Required Corrective Actions
Type of Failure Required Corrective Action for Failures
Negative Controls
Laboratory Control Water
See Toxicity Trigger’s Focus Group Recommendation 8
Conductivity Control Water
Flag the data for samples with similar electrical conductivies (EC) and for the EC control and ensure that EC was within species tolerance range.
Additional Control Water (Method Blank)
Flag the data for samples affected or compared to the failed method blanks
Positive Controls
Reference Toxicant Tests
n/a
Field Quality Control Samples
Field Duplicate Flag the data for samples affected and identify source of failure to prevent future failures. All QC failures should be reported to the Field Project Manager and QA Manager immediately. If QC samples do not meet completeness criteria, flag the data.
13.6 Describe how instruments should store and maintain raw data. Methods or SOPs may be referenced and attached to the QAPP.
Raw data are not stored in the YSI probe. See lab QAPPs for description of how raw data are stored by the individual labs.
13.7 Specify laboratory turnaround times needed.
Laboratories utilized for this monitoring typically produce results within one to two weeks. It is important to receive pesticides results in a timely fashion in order to facilitate resampling, if needed.
13.8 Provide method validation and information for all non-standard SOPs and performance based methods (PBMs).
n/a
13.9 Indicate where PBMs development records are stored and how they can be accessed. n/a
13.10 Additional Requirements not mentioned above:
(a) Laboratory Corrective Actions

13. Analytical Methods
CRC_2010QAPP_Final_7-21-2010.doc Page 96 of 125
Corrective action measures should also be discussed in the event of instrument failure or performance criteria exceedances. Specific activities that will take place when a failure occurs must be discussed for chemical measurements, toxicity, and microbiological analyses. The QA Office and the Field Project Manager must ensure that the laboratory follow the corrective action procedures stated in their QAPP.
“When an out of control situation occurs, analyses or work must be stopped until the problem has been identified and resolved. The analyst responsible must document the problem and its solution and all analyses since the last in control point must be repeated or discarded. The nature and disposition of the problem must be documented in the data report that is sent to the Central Valley Water Board.”
(b) Laboratory Calibration Curves
Laboratory adjustments to calibration curves and also to recovery acceptance limits are method dependent. However, when these adjustments are changed during Project implementation, these changes need to be communicated to the ILRP Staff in order to ensure that new limits will meet the Program requirements.
For the ILRP, only calibration with a linear regression is acceptable for organic analyses. Non-linear calibration is not allowed due to the fact that using a non-linear option creates a potential for poor quantitation or biased concentrations of compounds at low or high concentrations (near the high and low ends of the calibration range). In order to conduct the linear regression, laboratories shall prepare an initial 5-point calibration curve, where the low level standard concentration is less than or equal to the analyte quantitation limits.
(c) Pesticide Analyses
Pesticide analyses must be conducted on unfiltered (whole) fractions of the samples. Prior to the analysis of any environmental samples, the laboratory must have demonstrated the ability to meet the minimum performance requirements for each analytical method. Initial demonstration of laboratory capabilities includes the ability to meet the Project specified quantitation limits (QL), the ability to generate acceptable precision and recoveries, and other analytical and QC parameters as stated in this document.
(d) Algae Toxicity Testing
Algae toxicity testing shall not be preceded with treatment of the chelating agent, EDTA. The purpose of omitting this reagent is to ensure that metals used to control algae in the field are not removed from sample aliquots prior to analysis.
(e) Sediment Toxicity Testing
The time frame for sediment sample collection, as well as a definition of a "Classified Storm Event" relevant to the project area, shall be described in Section A.6 Project Description of the QAPP. At the time of reporting sediment sample results (exceedance reports and/or SAMR), details about the site conditions previous to the sampling event should be given to aid in the analysis of those results (i.e., details of the last storm in terms of duration and hydrographs or last irrigation details in terms of time, duration, flow and others).

13. Analytical Methods
CRC_2010QAPP_Final_7-21-2010.doc Page 97 of 125
Sediment samples shall be collected using a standardized methodology. Methodology to be used shall be identified and detailed in the Project QAPP Section B.2 Sample Collection Methods.
Sediment samples shall be collected with overlying water present at a collection site, or in the absence of overlying water, when the sediment is moist. Analysis results from sediment samples collected in the absence of overlying water should be flagged as potential outlying data points. Sampling of dry sediment shall not be required, however alternative sampling events should be planned to meet the minimum sample collection requirements as outlined in the MRP.
Sampling conditions shall be documented in the field notes for every successful and non-successful monitoring event (IE including planned events when the site is dry upon arrival). The documentation of field conditions at all attempted events aids the project in meeting completeness goals as outlined by the QAPP as well as establishes a continuous documented history of field conditions for monitoring locations.
(f) Alternative Analytical Methods
Analytical methods are to be identified by number, date, and regulatory citation. Analytical methods used for chemistry analyses must follow a procedure approved by the USEPA or provided in Standard Methods for the Examination of Water and Waste Water 19th Edition. When there is a program need to analyze for contaminants that do not have an USEPA or Standard Methods procedures, then the USGS, American Society of Testing Materials (ASTM), and Association of Official Analytical Chemist (AOAC) methods may be used by accredited laboratories.
If ILRP requirements are provided in the referenced documents, then laboratories may still achieve compliance by submitting a performance-based evaluation of their procedure for the CVRWQCB Executive Officer’s approval. This will require a peer-reviewed published method or performance-based validation method based upon the protocol described by USEPA “Guide to Methods Flexibility and Approval of USEPA Water Methods” (USEPA, 1996).
Laboratory development of a performance-based method (PBM) validation package and SOP are required when analytes or quantification levels are outside the analyte list or differ by ten times the measurement levels stated in the published method. The validation package must include all data for the “Initial Demonstration of Laboratory Capability,” which includes:
1. MDL studies (the analyst shall determine the MDL for each analyte according to the procedure in Code 40 of Federal Regulation (CFR) 136, Appendix B using the apparatus, reagents, and standards that will be used in the practice of this method).
2. Initial precision and recovery (IPR)
3. QC samples, where applicable
4. Linear calibration ranges
(g) References for Analytical Methods
The analysis of any material required by this Program shall be performed by a laboratory that has accreditation or certification pursuant to Article 3 (commencing with Section 100825) of Chapter 4 of Part 1 of Division 101 of the Health and Safety Code. Specific method

13. Analytical Methods
CRC_2010QAPP_Final_7-21-2010.doc Page 98 of 125
modifications may be approved by the Executive Officer of the CVRWQCB if sufficient justification is provided.

CRC_2010QAPP_Final_7-21-2010.doc Page 99 of 125
14. QUALITY CONTROL The Quality Control (QC) element provides information regarding the QC activities that will take place for the Project. Definitions for all QC samples described here are included in the Appendices to this document. A summary table must be provided, which includes required and optional QC and the frequency. The QC summary table should address all sampling, measurement, and analysis techniques.
Internal QC is achieved by collecting and/or analyzing a series of duplicate, blank, spike, and spike duplicate samples to check that analytical results are within the specified QC objectives. The QC sample results are used to quantify precision and accuracy, and identify any problem or limitation in the associated sample results. The internal QC components of a sampling and analyses program ensure that data of known quality are produced and documented. The internal QC samples are described in the following sections.
(a) Chemical Analyses
At a minimum, one “QC Set” must be included per analytical method batch per Sampling Event. The minimum required samples for chemical analyses must include:
1. Field blank
2. Field duplicate
3. Matrix spike (MS) and matrix spike duplicate (MSD)
4. Laboratory control spike (LCS) and laboratory control spike duplicate (LCSD)
5. Laboratory blank
6. Laboratory duplicate (MS/MSD or LS/LSD pair may serve this function)
(b) Toxicity Analyses
The minimum required QC samples for toxicity tests must include:
1. Field duplicate
2. Negative control
3. Reference toxicant (one reference toxicant per species per month)
Optional QC samples that might be utilized by project management include travel blanks, equipment blanks, laboratory duplicates, equipment blank/rinsate samples, and field split samples.
QA/QC samples for the 2010 RPP program will remain as in years past to provide for consistency and ease of comparison of results. This QA/QC regime was initially established by DPR in cooperation with CVRWQCB staff and provides a robust QA/QC dataset. QC/QC samples include an established number of duplicate samples (sent to an independent QC lab to confirm the accuracy of the registrant laboratory results), as well as spike samples sent to both the registrant lab and QC lab.

14. Quality Control
CRC_2010QAPP_Final_7-21-2010.doc Page 100 of 125
14.1 Blank Specifications
Laboratory Blanks (Method and Reagent Blanks)
Two types of blanks routinely analyzed in the laboratory are method blanks and reagent blanks. Method blanks and reagent/solvent blanks are used to assess laboratory procedures as possible sources of sample contamination. These blanks are prepared with every analytical batch to ensure that batch is free of laboratory contamination. If the laboratory blank has a non-zero result, the analysis batch should be considered to be contaminated and the results of such should be flagged.
Methods blanks, and all laboratory positive and negative controls for other media and analytes, should be conducted, when necessary (depending on the method), upon initiation of sampling.
Although laboratory blanks are important for all analyses, method blanks for low-level analyses can be conflictive. Improvements in analytical sensitivity have lowered detection limits down to the point where some amount of analyte may be detected in even the cleanest laboratory blanks. In these circumstances, the magnitude of a contaminant found in blanks should be compared to the concentrations found in the samples. Subtracting method blank results from sample results is not permitted; however, any blank contamination should be discussed with project management, and must be reported in the monitoring reports that are submitted to the ILRP Staff.
When a detectable concentration of a specific analyte is found in the method blank as part of the laboratory quality control, samples need to re-extracted and re-analyzed in the following circumstances:
“METALS: If any analyte concentration in the method blank is above the PQL, the lowest concentration of that analyte in the associated samples must be 10 times the method blank concentration. Otherwise, all samples associated with that method blank with the analyte’s concentration less than 10 times the method blank concentration and above the PQL must be re-digested and re-analyzed for that analyte. The sample concentration is not to be corrected for the method blank value.
ORGANICS: If any analyte concentration in the method blank is above the PQL, all samples associated with that method blank must be re-extracted and re-analyzed for that analyte. The exception to the above requirement is for common laboratory contaminants such as volatile solvents and phthalates where all samples associated with that method blank, with an analyte concentration less than 10 times the method blank concentration and above the PQL must be re-digested and re-analyzed for that analyte.”
14.2 Matrix spike and spike duplicate specifications
The MS/MSD samples are collected at the same time as the environmental samples, and are spiked at the laboratory with a known concentration of the analyte(s) to be measured. These samples are used to evaluate the effect a particular sample matrix has on the accuracy of the measurement. The MSD sample serves as another check of the accuracy and allows calculation of the analysis method’s precision. The difference in the measured concentrations of the original sample and the spiked sample is compared with the spike concentration, and a percent recovery is reported.

14. Quality Control
CRC_2010QAPP_Final_7-21-2010.doc Page 101 of 125
A MS and MSD set must be prepared at the laboratory using sample water collected specifically by the project and be analyzed within the same analytical batch as the original samples. Certified Reference Materials shall be used to prepare the MS/MSD samples. After measurement of the MS/MSD, the Accuracy and Precision must be calculated and noted on the monitoring report and electronic record.
(a) Accuracy of MS Recovery is measured as the percent recovery and provides the accuracy of an analytical test measured against an analyte of known concentration that has been added to an actual field sample. Percent recovery for MS/MSD is calculated as follows:
100% xV
VVSpike
MS Ambient⎟⎟
⎠
⎞
⎜⎜
⎝
⎛ −=Recovery
Where:
VMS = is the measured concentration of the spiked sample.
VAmbient = is the measured concentration of the original (unspiked) sample.
VSpike = is the concentration of the spike added.
If the percent recovery for any analyte in the MS or MSD is less than the recommended warning limit, the chromatograms and raw data quantitation reports must be reviewed. Corrective action that is taken and verification of acceptable instrument response must be included in the cover letter discussion as well.
(b)Precision of the MS/MSD pair is measured as the RPD between two spiked samples and is calculated as follows:
%100xMean
RPD VV MSDMS −=
Where:
RPD = is the relative percent difference
VMs = is the measured concentration for the matrix spike.
VMSD = is the measured concentration of the matrix spike duplicate.
Mean = is the average of the two concentrations, calculated as follows:
( )⎥⎦
⎤⎢⎣
⎡ += 2
VV MSDMSMean
The Data Quality Objective (DQO) for Precision in MS/MSDs is 25% or less. If results for any analytes do not meet this DQO, calculations and instruments must be checked, and the analyst may be required to repeat the analysis to confirm the results. If the results repeatedly fail to meet the objectives indicating inconsistent homogeneity, unusually high concentrations of analytes, or poor laboratory precision, then the laboratory is obligated to:
14. Quality Control
CRC_2010QAPP_Final_7-21-2010.doc Page 102 of 125
• Halt the analysis of samples, • Identify the source of the imprecision, and • Make corrections (where appropriate) before proceeding.
If the source of a low or high percent recovery value is not discovered, the instrument response may be checked using a calibration standard. Low or high matrix spike recoveries may be a result of matrix interferences and further instrument response checks may not be warranted. An explanation for low or high percent recovery values for MS/MSD results must be discussed in a cover letter accompanying the data package to project management and included in the monitoring report to the CVRWQCB.
Failure to meet the designated QOs for MS and MSD is indicative of poor laboratory performance. In this case, the laboratory is obligated to halt the analysis of the samples and to identify the source of the problem and make corrections before proceeding.
14.3 Laboratory control spike and spike duplicate specifications
The LCS and the LCSD samples provide information on analytical accuracy, precision, and instrument bias. After measurements of the LCS and LCSD, the Percent Recovery (Accuracy) and Relative Percent Difference (Precision) must be calculated and noted on the report and electronic record.
(a) Accuracy as LCS Recovery is the measured as the test measured against the analyte of known concentration that had been added to laboratory purified water. Recovery for Laboratory Control Spikes is calculated as follows:
100% xVV
Spike
LCS
⎟⎟
⎠
⎞
⎜⎜
⎝
⎛=Recovery
Where:
VLCS = is the measured concentration of the spike control sample.
VLCSD = is the concentration resulting from the spike amount added.
If the percent recovery for any analyte in the LCS, LCSD is outside the recommended control limit, the chromatograms and raw data quantitation reports must be reviewed. Corrective action that is taken and verification of acceptable instrument response must be included in the cover letter discussion as well.
(b) Precision of the LCS/LCSD pair is measured as the RPD between two laboratory control samples, and is calculated as follows:
%100xMean
RPD VV LCSDLCS−
=
Mean is the average of the results from the two LCS samples, calculated as follows:
( )⎥⎦
⎤⎢⎣
⎡ += 2
VV LCSDLCSMean
14. Quality Control
CRC_2010QAPP_Final_7-21-2010.doc Page 103 of 125
The Data Quality Objective (DQO) for Precision in LCS/LCSDs is 25% or less. If results for any analytes do not meet this DQO, calculations and instruments must be checked, and the analyst may be required to repeat the analysis to confirm the results. If the results repeatedly fail to meet the objectives indicating inconsistent homogeneity, unusually high concentrations of analytes or poor laboratory precision, then the laboratory is obligated to:
• Halt the analysis of samples • Identify the source of the imprecision, and • Make corrections where appropriate before proceeding.
If an explanation for the low or high percent recovery value is not discovered, the instrument response may be checked using a calibration standard. Low or high matrix spike recoveries may be a result of matrix interferences and further instrument response checks may not be warranted. An explanation for low or high percent recovery values for LS/LSD results must be discussed in a cover letter accompanying the data package to project management and included in the monitoring report to the CVRWQCB.
Failure to meet the designated QOs for LS/LSD is indicative of poor laboratory performance. In this case, the laboratory is obligated to halt the analysis of the samples and to identify the source of the problem and make corrections before proceeding.
14.4 Test acceptability criteria for toxicity tests
Decision Step 1: If the Control treatment meets all USEPA Test Acceptability Criteria (TAC), then proceed to statistical analyses for determination of the presence of statistically significant reductions in organism survival or algal growth. For samples that exhibit toxicity, the follow-up requirements in the ILRP MRP must be followed.
Proposed Decision Step 2a: If the control exhibits <90% survival, an acute test of a water sample exhibits 90-100% survival, and the program completeness standard is met (e.g., ≥90% of testing performed successfully to meet ILRP Completeness Objective), the test result should be “flagged” to denote <90% survival in the Control treatment. A re-test is not required. ILRP completeness must be evaluated with each submittal of Annual or Semi-Annual Monitoring Reports.
If an acute test of a water sample exhibits 90-100% survival, and the program completeness objective for the test is not met, then a re-test of the original sample must be initiated within 24 hours of the observation of a Control treatment with <90% survival.
For the fathead minnow test, the laboratory must take the steps to procure test species within one working day, and the re-test must be initiated within one day of fish being available from a supplier. In all cases, both the original test results and the re-test results must be reported by the Project; the re-test results should be flagged to note that the re-test was initiated outside of the holding time limit. New samples must be collected within five working days of the laboratory identifying a second failure in TAC, if the re-test does not meet USEPA TAC.
Proposed Decision Step 2b: A water sample is not considered toxic if all of the following is true:
• The algal test control does not meet the USEPA TAC for variability (i.e., coefficient of variation >20%), and

14. Quality Control
CRC_2010QAPP_Final_7-21-2010.doc Page 104 of 125
• A water sample exhibits an algal cell density that is greater than the algal cell density in the control, and
• The average algal growth in the replicates does not overlap with that in the control (i.e., all test sample replicates exhibit greater algae growth than all control replicates), and
• The Program completeness objective is met.
If the program completeness objective for the test is not met, then a re-test of the original sample must be initiated within 24 hours of the termination of the initial algal test. In all cases, both the original test results and the re-test results must be reported by the Project; the re-test results must be flagged to note that the re-test was initiated outside of the holding time limit. New samples must be collected if the re-test does not meet USEPA TAC.
If an algal test Control treatment does not meet the minimum growth TAC of ≥ 200,000 cells/mL, then a retest of the original sample must be initiated within 24 hours of the termination of the initial algal test. Both the original test results and the re-test results must be reported by the Project; the re-test results should be flagged to note that the re-test was initiated outside of the holding time limit. New samples must be collected within five working days of the laboratory identifying a second failure in TAC, if the re-test does not meet USEPA TAC.
Proposed Decision Step 3: If a Control treatment does not meet USEPA TAC, and the associated ambient water sample(s) have <90% survival (for an acute toxicity test) or the algal growth is less than the Control, then the CVRWQCB will be notified within 1 business day of the observation of the results in question so that an agreement can be reached regarding how to proceed. At a minimum, re-testing of the original sample within 24 hours of the observed test failure will be required and test results should be “flagged.” For the fathead minnow test, the laboratory must take the steps to procure test species within one working day, and the re-test must be initiated within one day of fish being available from a supplier. If re-testing does not begin within 24 hours, then re-sampling must be conducted within 48 hours of the observed test failure. Re-test results should be flagged to note that the re-test was initiated outside of the holding time limit. New samples must be collected within five working days of the laboratory identifying a second failure in TAC, if the re-test does not meet USEPA TAC.
Note: it is important to recognize that when re-testing a sample beyond the 36-hour holding time prescribed in the test method manual, there is a possibility that toxicity will be reduced or completely gone. In addition, when re-sampling at a site, the new sample may not represent the same conditions under which the original sample was collected (this is particularly important to note when sampling is meant to characterize a specific event such as stormwater runoff).
The reporting of data that do not meet USEPA TAC must also include an assessment from the laboratory as to what may have caused the test control performance issue, the laboratory’s corrective measures to prevent future control failures, a comparison of the data against the USEPA test performance measures, and a comparison of the data against the ILRP required completeness criteria in the Project’s QAPP.
14.5 Toxicity Procedures - toxicity identification evaluation (TIE)
Ceriodaphnia and Pimephales promelas

14. Quality Control
CRC_2010QAPP_Final_7-21-2010.doc Page 105 of 125
Water Column toxicity procedures and triggers for initiating TIEs are described in more detail in Section E.1 of the MRP. At a minimum, Phase I TIE procedures shall be conducted to determine the general class (e.g., metals, non-polar organics, polar organics) of the chemical causing toxicity. Phase II TIEs may also be utilized to confirm and identify specific toxic agents. The TIE report to the Water Board must include a detailed description of the specific TIE procedures that were utilized. Some of the currently known and used TIE procedures are summarized in Appendix G.
Selanastrum
CVRWQCB Resolution No. R5-2006-0077 requires that Coalitions implementing water quality control program under the Conditional ILRP submit management plans when monitoring results show two or more observed “exceedances” over a three-year period.
TIEs performed to date have not provided adequate information to identify a specific toxicant. A non-polar organic pesticide with possible contribution from a metal has been implicated. Therefore, specific tests for pesticides and metals are warranted. TIEs are not included as an analytical tool in the Algae Management Plan; herbicide, copper, and hardness analyses are incorporated in lieu of TIEs.
14.6 Field duplicate specifications
Field duplicates consist of an additional bottle of sample collected at a randomly selected sample location at the same time as the primary sample.
The results from the duplicate sample are compared to the results from the primary sample; if the relative percent difference (RPD) between the samples is greater than 35 percent, a thorough evaluation of the samples will be performed to determine whether to take corrective action (to either report the data or resample). Factors such as high analyte concentrations, inhomogeneous sample matrix, and proximity to reporting limits will be considered when RPDs are greater than 35 percent. Duplicate samples provide precision information for the entire measurement system including sample acquisition, homogeneity, handling, shipping, storage, laboratory sample preparation, and laboratory analysis.
The evaluation of field precision must be addressed in the project QAPP. QAPP acceptance criteria for laboratory precision shall be based only on laboratory-based duplicate samples such as duplicate matrix spikes, blank spikes, laboratory control materials, or certified reference materials. For bacterial analyses, no assessment of field precision is required but laboratories are required to meet methodological precision requirements. Field duplicates with failed results (RPD >25%) do not require re-sampling. However, this data should be flagged and field teams should be notified so that the source of error can be identified and corrective actions taken before the next sampling event.
If a field duplicate result is found to be over the water quality trigger limit, an exceedance report must be submitted. Results for field samples and field duplicates must be reported independently and not be averaged for determining an exceedance of water quality trigger limits.


15. Instrument/Equipment Testing, Inspection, and Maintenance
CRC_2010QAPP_Final_7-21-2010.doc Page 107 of 125
15. INSTRUMENT/EQUIPMENT TESTING, INSPECTION, AND MAINTENANCE
15.1 Identify field and laboratory equipment that require periodic maintenance and the schedule.
Field Equipment Requiring Routine Maintenance:
The following field equipment is subject to routine maintenance.
• YSI multi-probe
• General Oceanics velocity meter (used for flow measurement)
Laboratory Equipment Maintenance
see LAB QAPPs
15.2 Identify equipment testing criteria and procedures.
Field Equipment Maintenance
Kleinfelder maintains all field equipment testing, inspection and maintenance internally. The equipment owners manuals are used, but no log books exist. All equipment is inspected and calibrated prior to every use and during field sampling and this calibration will be documented as noted above.
Field measurement equipment will be checked for operation in accordance with the manufacturer’s specifications. The Lead Field Technician will be responsible for testing, inspection and maintenance of all field sampling equipment.
Field sampling equipment that will contact samples and/or be used to collect samples will be decontaminated after each use by thoroughly rinsing with distilled water. The sampling equipment will also be rinsed at each site with water from the middle of the water column before sample collection.
Laboratory Equipment Maintenance
Testing, inspection and maintenance of analytical equipment used at each contract laboratory should be documented in the quality assurance manuals for each analyzing laboratory. Corrective actions should be documented in the same fashion. The laboratory shall maintain a stock of spare parts and consumables for all analytical equipment. Maintenance performed on each piece of equipment should be documented in the maintenance notebook. The frequency of routine procedures will vary depending on the production workload and the types of samples analyzed. The primary laboratory should operate backup instrumentation for most of its analytical equipment in the event of instrument failure.
see LAB QAPPs

15. Instrument/Equipment Testing, Inspection, and Maintenance
CRC_2010QAPP_Final_7-21-2010.doc Page 108 of 125
15.3 Identify the individual(s) responsible for instrument/equipment testing, inspection, and maintenance.
Field Equipment Maintenance
The Field Project Manager and Lead Field Technician are responsible for instrument/equipment testing, inspection, and maintenance.
Laboratory Equipment Maintenance
The Lab Directors are responsible for lab instrument/equipment testing, inspection, and maintenance.
15.4 Note the availability and location of spare parts.
Field Equipment Spare Parts:
For the YSI probe, equipment manuals, testing criteria and spare parts are kept in the vehicle with the equipment. Sample equipment testing includes checks of battery levels, routine replacement of membranes, and cleaning of conductivity electrodes.
Laboratory Equipment Maintenance see LAB QAPPs
15.5 Identify pre-use equipment inspection procedures.
Field Equipment Inspection
Sample equipment testing includes checks of battery levels, routine replacement of membranes, and cleaning of conductivity electrodes. All equipment will be inspected for damage when first handed out and when returned from use.
Laboratory Equipment Inspection
See lab QAPPs.
15.6 Identify corrective action measures and documentation for equipment failure.
Non-conformances are any incidents that may affect data quality, project cost, or sampling and analysis schedule. If a laboratory procedure or result is found to be nonconforming, data obtained since the last valid QC sample will be considered invalid. Analyses will not continue until testing processes have been corrected. The laboratory's QA officer, in consultation with Kleinfelder, is responsible for implementing corrective actions in the laboratory.

CRC_2010QAPP_Final_7-21-2010.doc Page 109 of 125
16. INSTRUMENT/EQUIPMENT CALIBRATION AND FREQUENCY
The Instrument/Equipment Calibration and Frequency element provides for information regarding how continual quality performance of equipment and instruments will be ensured. Routine field instrument calibration must be performed at least once per day prior to instrument use to ensure instruments are operating properly and producing accurate and reliable data. Calibration should be performed at a frequency recommended by the manufacturer, if more frequent than once per day and in case of instrument failure. The calibration should be recorded within a field calibration log or directly on the corresponding field sheet.
16.1 Identify field and laboratory equipment that require calibration.
Field
The following field equipment requires calibration and is subject to routine maintenance.
• YSI multi-probe
Lab
Analytical instruments shall be calibrated in accordance with the analytical methods. All analytes reported shall be present in the initial and continuing calibrations, and these calibrations shall meet USEPA Method acceptance criteria. All results reported shall be within the calibration range. Records of standard preparation and instrument calibration shall be maintained. Records shall be unambiguous.
16.2 Identify the calibration procedure and schedule.
Field
Immediately before use in the field, field parameter equipment will be calibrated, and calibration will be recorded on an Instrument Calibration Form. Calibration will be performed according to equipment manufacturer instructions.
All pH and conductivity measurement devices will be calibrated against standards.
Dissolved oxygen devices will be calibrated in percent saturation and corrected for the current barometric pressure.
Lab
see LAB QAPPs

16. Instrument/Equipment Calibration and Frequency
CRC_2010QAPP_Final_7-21-2010.doc Page 110 of 125
16.3 Identify calibration documentation methods.
Field
See calibration log included in Section 16.2 and Appendix B.
Lab
see LAB QAPPs
16.4 Identify corrective action measures and documentation for equipment deficiencies.
Corrective action requirements are identified in Section 13.5.

CRC_2010QAPP_Final_7-21-2010.doc Page 111 of 125
17. INSPECTION/ACCEPTANCE OF SUPPLIES AND CONSUMABLES
The Inspection/Acceptance of Supplies and Consumables element provides information about how supplies and consumables (e.g., standard materials and solutions, sample bottles, calibration gases, reagents, hoses, DI water, potable water, electronic data storage media) shall be inspected and accepted for use in the project if applicable. All stock standards and reagents used for extraction and standard solutions must be tracked through the laboratory. The preparation and use of all working standards must be recorded in bound laboratory notebooks that document standards traceable to USEPA, A2 LA or National Institute for Standards and Technology (NIST) criteria.
Records must have sufficient detail to allow determination of the identity, concentration, and viability of the standards including any dilutions performed to obtain the working standard. Date of preparation, analyte or mixture, concentration, name of preparer, lot or cylinder number, and expiration date, if applicable, must be recorded on each working standard. The Inspection/Acceptance of Supplies and Consumables element must include the following components:
17.1 Identify critical supplies and consumables for the field and laboratory
Field
The following are critical supplies and consumables for the field sampling:
• YSI probe
• backup multi-meter probe
• flow measurement equipment (survey tape measure, rope, velocity meter)
• pH and conductivity standards
• sample bottles
• gloves
• rinse water
• Kemmerer & back up Kemmerer
• ice
• labels
• depth measurement equipment
• calibration log, field data sheets, COC sheets
• coolers
• tape
• plastic bags (to seal the COC form)
• digital camera, batteries charged
• cell phone
Lab
All stock standards and reagents used for extraction and standard solutions must be tracked through the laboratory. The preparation and use of all working standards must be recorded in bound laboratory notebooks that document standard tractability to USEPA, A2LA or National Institute for Standards and Technology (NIST) criteria. Records must have sufficient detail to allow for checking of the identity, concentration, and viability of the standards including any dilutions performed obtaining the working standard. Date of preparation, analyte or mixture,

17. Inspection/Acceptance of supplies and Consumables
CRC_2010QAPP_Final_7-21-2010.doc Page 112 of 125
concentration, name of preparer, lot or cylinder number, and expiration date, if applicable, must be recorded on each working standard.
See lab QAPPs
17.2 Identify the source, acceptance criteria, and procedures for the tracking, storing, and retrieving of the above materials.
Field
Supplies will be examined for damage as they are received. Laboratories will be responsible for inspecting and approving all consumables used for this project, including standard materials and solutions, DI water, reagents, bottles, etc. All stock standards and reagents used for extraction and standard solutions must be tracked through the laboratory. The preparation and use of all working standards must be recorded in a bound laboratory notebook that documents standards traceable to USEPA, A2 LA or National Institute for Standards and Technology (NIST) criteria.
Field staff will check the pH and conductivity standards prior to entering the field by comparing their readings to those generates by the current lot of standards.
Lab
see LAB QAPPs
17.3 Identify the individual responsible for these tasks.
Field
The Lead Field Technician is responsible for these tasks.
Lab
see LAB QAPPs

CRC_2010QAPP_Final_7-21-2010.doc Page 113 of 125
18. NON-DIRECT MEASUREMENTS (EXISTING DATA) The Non-Direct Measurements element provides an identification and discussion of the types of data needed for project implementation or decision making that is obtained from non-measurement sources such as computer data bases, programs, literature files, and historical data bases.
18.1 Identify non-direct sources of data that will be used within the project.
Sources of non-direct data that used during the reporting phase of this project include:
• Ambient air temperature
• Rainfall records
• Streamflow records
• Preliminary Pesticide Use Reporting
• USDA Rice acreage statistics
• Knowledge about the timing of rice farming activities specific to the calendar year (early or late start, specific pest problems, unique weather conditions of note (wind, rainfall, etc.)
• Thiobencarb monitoring results from the Cities of Sacramento and West Sacramento.
18.2 Discuss the intended use of this information.
This information is discussed in the Annual Monitoring Report.
18.3 Identify the acceptance criteria for the data used.
Ambient air, rainfall, and stream flow records are acquired from known sources with their own data validation requirements. Preliminary Pesticide Use Reporting is provided by the CACs, through the DPR, and is subject to an initial screening to identify any clearly incorrect information. USDA rice acreage statistics are compared to the CAC reported acreages. Knowledge about the timing of rice farming activities is included in a narrative within the report, and may help understand certain results or trends.
18.4 Identify any required resources and support facilities (e.g. Data Logger, Controllers).
None.
18.5 Describe the process by which the project determines limits to validity and operating conditions.
Not applicable.


CRC_2010QAPP_Final_7-21-2010.doc Page 115 of 125
19. DATA MANAGEMENT The Data Management element provides for a detailed discussion of the data management process, tracing the path of the data from their generation to their final use and storage.
Data generated shall be converted to a SWAMP comparable format and maintained by the responsible party and available for electronic data submission to the CVRWQCB staff.
19.1 Identify the data management scheme from field to final use and storage for all data types.
Copies of field data logs, COC forms, original preliminary and final laboratory reports, and electronic media reports will be kept for review by CH2M HILL, Kleinfelder, and the CRC. The field crew will retain original field data logs. The contract laboratory will retain original COC forms, and copies of the preliminary and final data reports.
Field and laboratory data will be stored in hard copy and electronic format (when applicable) as part of the project file. This information will be retained in the project file until project completion and closeout. Upon project closeout, all records will be archived for permanent storage. Records will be maintained for five years after the final report is issued.
The CRC began keeping electronic files with the responsibility of fully managing the program in 2003. All program information and monitoring results are maintained in annual report binders kept on file indefinitely. Beginning in sample year 2009, all new data will be stored in a SWAMP comparable format and will be available for electronic data submission to the CVRWQCB. This method of data storage will continue.
The project website is routinely backed up, per CH2M HILL company policy. Backups are housed in off-site data storage repositories per CH2M HILL IT policies. At the end of the year, CH2M HILL archives the data to CD so that the data for each year is together in one package.
19.2 Identify standard record keeping and tracking practices and the corresponding SOPs where applicable.
Standard record keeping will be implemented by the project team through use of a project SharePoint website.
19.3 Discuss how field data and laboratory data will be entered or uploaded into the required data submission format.
Laboratory and field data will be entered into SWAMP comparable format spreadsheets as per the requirement detailed in Part IV A of the Monitoring and Reporting Program for California Rice Commission, Order No. R5-2009-0809. Laboratory results will be entered into spreadsheets following the guidelines provided in the SWAMP data submission guide available in appendixes D-1 and D-2. Sample spreadsheets for entering water quality chemistry and water quality toxicity data and are also available in appendixes D-3 and D-4. The water quality chemistry spreadsheet includes a “Results” and a “LabBatch” worksheet. All the chemistry and bacteria results, including the QA data will be uploaded into the results worksheet. The LabBatch worksheet will hold the summary and validation information of the laboratory batches recorded within the results worksheet.

19. Data Management
CRC_2010QAPP_Final_7-21-2010.doc Page 116 of 125
The water quality toxicity spreadsheet consists of three worksheets labeled “Tox Summary”, “Tox Results” and “Lab Batch”. The core summary data for toxicity including the mean, toxicity significant and percent of control will be uploaded in the Tox Summary worksheet. Both the environmental sample and negative control will be included in this worksheet. TIEs and reference toxicant tests are not required to be recorded and submitted electronically. The toxicity replicate data including in-test water quality measurements will be uploaded in the Tox Results worksheet. This worksheet will compliment the Tox Summary and provide the data that was used to calculate the results found in the summary. Providing this data will allow for external statistical analysis of the toxicity test replicates as well as provide environmental conditions of the samples to account for variability of the results and quality control review. The summary and validation information of the laboratory batches recorded within the results worksheet will be uploaded in the Tox Batch worksheet.
Field data from water and sediment sample collection will be entered into SWAMP comparable format datasheets. The sample datasheets are provided in appendix D-5.
Laboratory and field data will be uploaded into the corresponding spreadsheets by CH2M HILL, once the data are available from the Laboratory.
19.4 Discuss the control mechanism for detecting and correcting errors and for preventing loss of data during data reduction, data reporting, and data entry to forms, reports, and/or database.
All data records will be checked visually. The Data Manager will do all reviews and the CRC Project Manager will perform a check of 100% of the reports. The Laboratory’s QA Officer will perform checks of all of its records.
Issues will be noted and corrected by a committee composed the Data Manager, CRC Program Manager, Kleinfelder Program Manager, CH2M HILL; and if necessary the Laboratory’s QA Office. Any corrections require a unanimous agreement that the correction is appropriate. The laboratory results are visually checked for comparison to the MDL, and for any data not appearing to meet quality standards.
Procedures for data reduction with respect to significant figures must incorporate the following conventions:
A digit is significant if it is required to express the numerical value of a measurement. The number of significant digits in a measurement must be restricted by the least accurate of its input measurements. These input measurements include all of those associated with sample processing, including aliquots measured during sampling, preparation, and laboratory analysis.
Results of mathematical calculations shall have the same number of significant figures as the calculation’s least precise input value. Results of addition and subtraction of measurements shall reflect the decimal position of the calculation’s least precise input value. The number of

19. Data Management
CRC_2010QAPP_Final_7-21-2010.doc Page 117 of 125
significant figures can vary during these calculations. The final digit in an expressed measurement inherently possesses an uncertainty. This is especially relevant in the discussion of MDLs and reporting limits (RLs). In these instances, the number of reported significant digits must realistically reflect the laboratory’s analytical precision.
When the result of a calculation contains too many significant digits, it must be rounded. If a result’s trailing digit is less than five, the last significant digit is not changed. If this trailing digit is equal to or greater than five, the last significant digit is rounded up.
19.5 Identify the individual(s) responsible for data management.
QA Manager
19.6 Verify that continuous monitoring data will be stored in its original Sonde file.
Not applicable.
19.7 Include any checklists or forms used in data management.
See Appendix D


CRC_2010QAPP_Final_7-21-2010.doc Page 119 of 125
GROUP C: ASSESSMENT AND OVERSIGHT 20. ASSESSMENTS & RESPONSE ACTIONS
The Assessments and Response Actions element provides information regarding how a project’s activities will be assessed during the project to ensure that the QAPP is being implemented as approved.
20.1 Number, frequency, and type of project assessment activities that will be conducted. As lab reports are made available, the QA Officer will review the results against the quality objectives included in this QAPP, as well as against water quality standards and other triggers. When results trigger the need for an exceedance report, one will be prepared as described above.
The Annual Monitoring Report will be prepared in accordance with the requirements outlined in the MRP.
20.2 The individual(s) responsible for conducting assessments and indicate their authority to stop work as necessary. The QA Officer and the Reporting Project Manager will be responsible for conducting assessments. The QA Officer, in consultation with the Field Project Manager and Program Manager, has authority to stop work.
20.3 How and to whom assessment information should be reported. Information will be reported to the Program Manager. The Program Manager will report information required by the MRP (e.g. exceedance reports) to the CVRWQCB CRC Liaison.
20.4 Corrective action measures and documentation for assessment conclusions. Corrective actions measures will be documented as they implemented. Where a corrective action is required by the lab, the QA Officer will coordinate to ensure that the lab provides a Corrective Action Report.
For existing data use projects, data may be assessed to determine suitability for their intended use and to identify whether project specifications were met. Field operation audits, laboratory performance evaluations, and technical system audits should also be included in a project’s assessment element. The CVRWQCB staff may also audit laboratories during sample analyses for this program.
The contractor should routinely observe field operations to ensure consistency and compliance with sampling specifications presented in this document and QAPP that will be developed later. An audit checklist should document field observations and activities.
Performance evaluation (PE) audits quantitatively assess the data produced by a measurement system. Performing an evaluation audit involves submitting certified samples for each analytical method. The matrix standards are selected to reflect the concentration range expected for the sampling program. Any problem associated with PE samples must be evaluated to determine the influence on field samples analyzed during the same time period. The laboratory must provide a written response to any PE sample result deficiencies.

20. Assessments & Response Actions
CRC_2010QAPP_Final_7-21-2010.doc Page 120 of 125
A technical system audit is a quantitative review of a sampling or analytical system. Qualified technical staff members perform audits. The laboratory system audit results are used to review operations and ensure that the technical and documentation procedures provide valid and defensible data.

CRC_2010QAPP_Final_7-21-2010.doc Page 121 of 125
21. REPORTS TO MANAGEMENT The Reports to Management element provides for information regarding how management will be kept informed of project oversight, assessment, activities, scheduling, and findings. The Reports to Management element must include the following components:
21.1 Identify which project QA status reports will be needed and frequency. The QA Officer will review data within three working days of receipt. QA reports should be submitted to the QA officer along with the associated data.
21.2 Identify individual(s) responsible for composing the reports and the individual/s who will receive and respond to the reports. The CRC reports monitoring results to the CVRWQCB, DPR, CACs and Cities of Sacramento and West Sacramento upon receipt. The CVRWQCB and the cities receive the draft annual report for comment around mid-December. The final annual report is due December 31.
TABLE 21-1 QA management reports.
Type of Report
Frequency (daily, weekly, monthly,
quarterly, annually, etc.)
Projected Delivery Dates(s)
Person(s) Responsible for
Report Preparation
Report Recipients
Progress reports Weekly 5 to 10 days after samples are collected
Charles Green, Valent
Roberta Firoved Jennifer Parson Jenny Krenz-Ruark
Monitoring results summary
Annually End of August/First of September
CH2M HILL Roberta Firoved
Draft final report for review
Annually Mid-December CH2M HILL Roberta Firoved
Annual Monitoring Report (AMR)
Annually December 31 CH2M HILL, CRC CVRWQCB, Cities of Sacramento and West Sacramento
Exceedance Reports
As-required As-required CH2M HILL, CRC CVRWQCB

CRC_2010QAPP_Final_7-21-2010.doc Page 123 of 125
GROUP D: DATA VALIDATION AND USABILITY 22. DATA REVIEW, VERIFICATION, AND VALIDATION
REQUIREMENTS The Data Review, Verification, and Validation element provides the criteria used to review and validate data. These steps help ensure that the data satisfies the quality criteria detailed and required by the ILRP.
ASSESS THE CRITERIA USED TO VALIDATE PROJECT DATA (refer to element A.7)
Data must be consistently assessed and documented to determine whether project QOs have been met, to quantitatively assess data quality, and to identify potential limitations on data use. Assessment and compliance with QC procedures should be a priority throughout the project to ensure the accuracy of sample collection, laboratory analysis, exceedance communications, and the submitted monitoring reports. Data communicated to CVRWQCB staff will be considered draft until the receipt of the monitoring report, which will include copies of signed laboratory data sheets.
The Project QAPP must be used to accept, reject, or qualify the data generated by the laboratory. The Project Manager shall convey the QA/QC acceptance criteria to the laboratory management. The laboratory management will be responsible for validating the data generated by the laboratory. The laboratory personnel must verify that the measurement process was “in control” (i.e., all specified data quality objectives were met or acceptable deviations explained) for each batch of samples before proceeding with analysis of a subsequent batch. In addition, each laboratory will establish a system for detecting and reducing transcription and/or calculation errors prior to reporting data.
The laboratory will submit only data which have met QO’s, or which have deviations that are thoroughly evaluated and described, as final results. When QA requirements have not been met, the samples will be reanalyzed when possible and only the results of the reanalysis will be submitted, provided they are acceptable. The Project Manager will be responsible for determining if the validated laboratory data meets the project acceptance criteria.
After data entry or data transfer procedures are completed for each sample event, data should be inspected for data transcription errors, and corrected as appropriate. After the final QA checks for errors are completed, the data should be added to the final database. Quality assurance checks shall be performed at a project level prior to submission within monitoring reports and electronic data submittals.
Data will be consistently assessed to ensure achievement of DQO’s as specified in Element 7 and the quality assurance/quality control practices cited in Elements 14, 15, 16, and 17.
The QA/QC acceptance criteria will be communicated to Kleinfelder by the Project manager. The laboratory management will be responsible for validating the data generated by the Laboratory.
All data is reported and no data is rejected. Data quality has never been an issue for this program. When QA requirements have not been met, the samples will be reanalyzed when

22. Data Review, Verification, and Validation Requirements
CRC_2010QAPP_Final_7-21-2010.doc Page 124 of 125
possible and only the results of the reanalysis will be submitted, provided they are acceptable. The Project Manager will be responsible for determining if the validated laboratory data meets the project acceptance criteria.
The data will be checked for transcription errors after each sampling event. After the final QA checks for errors, data will be added to the final database. All data will be evaluated for meeting data quality objectives and will be used in the monthly, semi-annual and annual reports.

CRC_2010QAPP_Final_7-21-2010.doc Page 125 of 125
23. VERIFICATION AND VALIDATION METHODS The Verification and Validation Methods element provides for the identification of methods or processes for verifying and then validating project information.
The Team Field Leader and/or Project Manager will perform reviews and checks, for the duration of the field operations to assess continuing compliance with contract requirements. These checks will be documented in daily reports, field notebooks, sample data sheets, and COC forms. If non-conforming conditions are noted, corrective action will be initiated to assess the cause of the non-conformance. Field measurements and other field data will be uploaded or entered into an electronic database.
One hundred percent of the analytical data generated for this project will be evaluated through a systematic procedure in which method performance is compared to defined criteria. Data review efforts will focus on two aspects: data quality and contract compliance. Data quality will be evaluated by applying the QC acceptance criteria as defined in this QAPP. Contract compliance will be assessed relative to the requirements specified in this QAPP. The review will also include the electronic deliverables as well as the laboratory hard copy, with the electronic deliverables being compared with the associated hard copy to evaluate accuracy and precision of the electronic data transfer and/or entry.
23.1 Identify the methods and processes used to verify and validate project data.
The Field Management and QA Officer will perform reviews and checks, for the duration of the field operations to assess continuing compliance with contract requirements. These checks will be documented in daily reports, field notebooks, sample data sheets, and COC forms. If non-conforming conditions are noted, corrective action will be initiated to assess the cause of the non-conformance. Field measurements and other field data will be uploaded or entered into an electronic database. The Kleinfelder Database Manager or other Kleinfelder professional staff will then review the electronic data.
One hundred percent of the analytical data generated for this project will be evaluated through a systematic procedure in which method performance is compared to defined criteria. Data review efforts will focus on two aspects: data quality and contract compliance. Data quality will be evaluated by applying the QC acceptance criteria as defined in this QAPP. Contract compliance will be assessed relative to the requirements specified in this QAPP. The review will also include the electronic deliverables as well as the laboratory hard copy, with the electronic deliverables being compared with the associated hard copy to evaluate accuracy and precision of the electronic data transfer and/or entry.
All data records will be checked visually. The Data Manager will do all reviews and the CRC Project Manager will perform a check of 100% of the reports. The Laboratory’s QA Officer will perform checks of all of its records.
At minimum the contract laboratory will provide the following levels of review before data are reported.
Level 1: Analyst Review

23. Verification and Validation Methods
CRC_2010QAPP_Final_7-21-2010.doc Page 126 of 125
Each analyst reviews the quality of their work based on an established set of guidelines. The review criteria as established in each method, in this QAPP, or within the laboratory will be used.
Level 2: Peer Review
The Level 2 review will be performed by a supervisor or data review specialist whose function is to provide an independent, peer review of the data package.
Level 3: Administrative Review
Level 3 reviews are performed by the program administrator at the laboratory. This review will be a total overview of the data package to provide for consistency and compliance with project specific requirements. Errors noted will be corrected and documented.
Quality Assurance Review
QA review is performed by the laboratory QA Officer. This review is not part of the normal production data review process. The QA Officer would typically review at least 10 percent of the data produced by the laboratory using the procedures outlined in the Level 3 data review. Additional technical details could be reviewed based upon the results of this QA review. The data packages reviewed would be randomly selected by the QA Officer.
SYSTEM AND PERFORMANCE AUDITS The CVRWQCB or Kleinfelder may perform periodic audits to evaluate adherence to the QAPP. Two types of audits may be performed: system audits, which consist of reviews of the QA/QC to establish adequacy; and performance audits, which consist of observations of field and laboratory activities to provide for conformance with the QA/QC procedures established in this QAPP. A systems audit may be performed on the site before the analytical portion of the project. Additional audits may be performed during the duration of the project if deemed necessary by the Project Manager. Kleinfelder will conduct the audits with the cooperation of the affected project personnel. An audit scope of work and checklist will be prepared before the audit commences.
Any data quality issues will be noted and corrected by a committee composed the Data Manager, CRC Program Manager, Kleinfelder Program Manager, CH2M HILL; and if necessary the Laboratory’s QA Office. Any corrections require a unanimous agreement that the correction is appropriate.
23.2 Identify the individual(s) responsible for verification and validation of each type of data (e.g., Field Logs, Chain-of-Custodies, Calibration Information, Completeness).
Both the Field Project Manager and the QA Officer are responsible for the verification and validation of each type of data (e.g., Field Logs, Chain-of-Custodies, Calibration Information, Completeness).
23.3 Identify documentation and or corrective action for discrepancies.
Corrective action requirements are identified in Section 13.5.
23.4 Attach any checklists, forms, and calculations that will be used.

23. Verification and Validation Methods
CRC_2010QAPP_Final_7-21-2010.doc Page 127 of 125
Forms
Forms to be used for implementation of this program are included in Appendix B.
Calculations Flow
Flow is measured only under the CWFR. Measurements are taken at 10 cross-sections at each site. The wetted width of the waterbody is measured, recorded, and divided by 10 to determine the width of each cross-section. The midpoint of each cross-section is calculated by dividing the cross-section width in half. Velocity is measured at the midpoint of each cross-section at 0.2 and 0.8 of the total depth from the water surface, and then averaged. Flow is then calculated using the following equation:
∑=
=10
1nnnn VDWQ
Where:
Q = estimated flow at the site (cfs)
W = section width (feet)
D = depth of measurement (feet)
V = velocity (feet per second) Total Dissolved Solids
EC is measured in the field using the multiprobe instrument as described above. These measurements are then converted to a TDS result by using the following equation:
46.3677.0 +×= ECTDS
Where:
TDS = Total dissolved solids (mg/L)
EC = electrical conductivity measurement (µmhos/cm)


24. Reconciliation with User Requirements
CRC_2010QAPP_Final_7-21-2010.doc Page 129 of 125
24. RECONCILIATION WITH USER REQUIREMENTS The Reconciliation with User Requirements element provides for a discussion on how validated data will be evaluated to see if it answers the original questions asked within the monitoring objectives.
This element outlines the proposed methods to analyze the data and determine possible anomalies or departures from assumptions established in the planning phase of data collection. The element will also describe how reconciliation with user requirements will be documented, issues will be resolved, and how limitations on the use of the data will be reported to decision makers.