california workers’ compensation california workers’ compensation dwc 19th annual educational...
TRANSCRIPT

1
California Workers’ Compensation DWC 19th Annual Educational Conference
Los Angeles February 23 & 24, Oakland March 5 & 6, 2012
Insurance Commissioner – CA Department of InsuranceRate Regulation Branch – Rate Filing Bureaus
• In California, workers’ compensation is a “file-and-use” line of insurance; it is not covered under Proposition 103 as a “prior approval” line of insurance. (e.g. personal auto & homeowners, numerous comm’l lines)
• For WC, every insurer must file with the Commissioner all rates and supplementary rate information that are to be used in California.
• The WC rates and supplementary rate information must be filed not later than 30 days prior to the proposed effective date.
• If a WC filing is considered to be complete and in compliance with the filing requirements on the 30th day after filing receipt, the company can use or apply the information contained in the filing.
• In 2011, CDI received 491 WC filings from 202 different WC companies.

2
Pure Premium RatesA Very Brief, General, Simplified Overview
• One component of a WC insurance company rate filing is the pure premium rates that the company will be using.
• In the workers’ compensation system, pure premium rates are developed to cover the cost of benefits (losses – medical & indemnity) and the cost of adjusting and settling the claims for those benefits (loss adjustment expense or LAE).
• Each August, the WCIRB submits a filing to the CDI that contains proposed advisory pure premium rates covering nearly 500 different standard classifications.
• The CDI Commissioner, after conducting a public hearing, decides whether to approve, disapprove, or modify the WCIRB’s proposed advisory pure premium rates.
Pure Premium RatesA Very Brief, General, Simplified Overview
• The set of advisory pure premium rates approved under the Commissioner’s Decision and Order (November) take effect January 1st of each year.
• California’s open rating law allows each WC insurer to adopt the Commissioner’s approved advisory pure premium rates or to choose to deviate from the approved pure premium rates.
• There is no January 1st filing requirement for WC insurers, in fact they submit filings throughout the year. But when they submit a rate filing companies must identify the pure premium rates, inclusive of any deviations, the company is filing to use.
• Each insurer also factors in its own underwriting expense and profit loadings to its filed pure premium rates to arrive at its filed manual rates.
3
The password is…
+ +M
Leading up to the Insurance Commissioner’s Decision(File Number REG-2011-00022, November 4, 2011)
• November 2010, Commissioner’s Decision and Order (REG-2010-00014) provided that future WCIRB advisory Workers’ Compensation Claims Cost Benchmark and Pure Premium Rates (Benchmark) be based upon insurers’ actual filed pure premium rates. This direction was made to better inform the public and insurers regarding workers’ comp pure premium rates being utilized in the marketplace.
• The impact of all Benchmarks up to 1/1/2011 were related/linked to the previously approved Benchmark which provided no relevance to actual market conditions.
• June 2011, Commissioner directed WCIRB to submit its advisory Benchmark filing indexed to current industry average filed pure premium rates so that focus is on relationship to current market conditions.
• August 2011, CDI received WCIRB’s filing of the proposed revision to the Benchmark to take effect January 1, 2012. Per the WCIRB filing, the industry average filed pure premium rate as of July 1, 2011 = $2.37 per $100 of payroll, and the proposed advisory Benchmark average for January 1, 2012 = $2.33 (≈ -1.8%).

4
Leading up to the Insurance Commissioner’s Decision(File Number REG-2011-00022, November 4, 2011)
• Public Hearing on September 27, 2011 per CIC §11750(b) with conclusion of the period to receive written comment/additional documentation on October 5, 2011.
• Commissioner has 30 days from the conclusion of the hearing (including additional documentation period) to approve, disapprove, or modify the proposed Benchmark.
• Commissioner’s latest Decision and Order (REG-2011-00022) is an approval of an average advisory Benchmark rate of $2.30 per $100 of payroll, as ordered on November 4, 2011. Compared to the industry average filed pure premium rate as of July 1, 2011 of $2.37 per $100 of payroll, the approved advisory Benchmark ≈ -3%.
• As of year end 2011, for the top 100 insurers (96.7% of market based on 2010 DWP), the filed overall average change in pure premium rates is estimated to be an increase of 2.8%. This implies that the industry average filed pure premium rate as of January 1, 2012 ≈ $2.43 or $2.44 per $100 of payroll.
Aggregate Filed Manual Rate Changes for the CA Workers’ Compensation Industry
(Cumulative Post Reform Filed Manual Rate Changes: 1/1/2004 through 1/1/2012)
• State Compensation Insurance Fund Cumulative Filed Manual Rate Change -40.3%
• CA Workers’ Comp. Industry Cumulative Filed Manual Rate Reductions -40.9%

5
Aggregate Filed Manual Rate Changes - Top 10 Groups(Cumulative Post Reform Filed Manual Rate Changes: 1/1/2004 through 1/1/2012)
COMPANY/GROUP MARKET SHARE (2010) CUMULATIVE RATE CHANGE
• State Fund 16.0% -40.3%• Zurich/Farmers 8.6% -47.0%• Travelers Group 7.7% -52.2%• AIG Group 6.5% -42.1%• The Hartford Grp. 6.4% -59.8%• Fairfax (Zenith) 5.1% -28.3%• Liberty Mutual 4.6% -58.2%• Berkshire Hath. 4.3% -52.0%• Everest National 3.0% -47.1%• Ace Capital Group 2.8% -57.8%
-3.6%
-7.0%
-3.6%
-14.9%-14.7%
-10.7%-9.4%
-10.4%
-0.8%-2.6%
5.8%
8.5%
4.0%
1.6%
4.6%
1.4%
4.5%
Jan2004
Jul 2004 Jan2005
Jul 2005 Jan2006
Jul 2006 Jan2007
Jul 2007 Jan2008
Jul 2008 Jan2009
Jul 2009 Jan2010
Jul 2010 Jan2011
Jul 2011 Jan2012
Source: California Department of Insurance
Average Workers' Compensation Manual Rate Changes Filed by Insurers

6
50.00%
55.00%
60.00%
65.00%
70.00%
75.00%
80.00%
85.00%
1993 1994 1995 1996 1997 1998 1999 2000 2001 2002 2003 2004 2005 2006 2007 2008 2009 2010
Source: California Department of Insurance
California Workers' Compensation Market ShareTop 10 Companies/Groups
Newly Authorized Workers’ Compensation Insurers since AB 227, SB 228, SB 899
(Determined by Initial Rate Filing or Certificate of Authority Application, as of 1/1/2012)
COMPANY / GROUP NAME DATE OF ADMISSION
• 1. Norguard Group 2/2/04• 2. Employers Reinsurance Corp. 7/28/04• 3. National Liability & Fire Insurance Co 9/24/04• 4. Compwest Insurance Company 10/4/04• 5. Farmers Reinsurance Company 11/16/04• 6. California Insurance Company 12/23/04• 7. Berkley Regional Insurance Company 1/13/05• 8. TNUS Insurance Company 1/14/05• 9. Partner Reinsurance Company 2/15/05• 10. SUA Insurance Company 5/9/05• 11. Western United Insurance Company 7/29/05• 12. Insurance Corporation of Hannover 8/30/05• 13. Midwest Employers Casualty Company 12/30/05• 14. Endurance Reinsurance Corp. of America 1/6/06• 15. Great Divide Insurance Company 2/16/06

7
Newly Authorized Workers’ Compensation Insurers since AB 227, SB 228, SB 899
(Determined by Initial Rate Filing or Certificate of Authority Application, as of 1/1/2012)
COMPANY / GROUP NAME DATE OF ADMISSION
• 16. Financial Pacific Insurance Company 5/25/06• 17. Nova Casualty Company 8/16/06• 18. Sompo Japan Fire & Marine Ins Co 9/5/06• 19. Advantage Workers’ Comp Ins Co 9/6/06• 20. Lincoln General Insurance Company 3/21/07• 21. North American Elite Insurance Co 5/29/07• 22. Tower Insurance Company of New York 9/21/07• 23. Sparta Insurance Company 10/3/07• 24. New York Marine & General Ins Co 10/12/07• 25. XL Insurance America, Inc. 3/6/08• 26. Washington International Insurance Co 3/13/08• 27. Southern Insurance Company 4/23/08• 28. Sentry Casualty Company 5/28/08• 29. Memic Indemnity Company 7/7/08• 30. Security National Insurance Company 8/26/08
Newly Authorized Workers’ Compensation Insurers since AB 227, SB 228, SB 899
(Determined by Initial Rate Filing or Certificate of Authority Application, as of 1/1/2012)
COMPANY / GROUP NAME DATE OF ADMISSION
• 31. Preserver Insurance Company 12/30/08• 32. Peerless Indemnity Insurance Co 4/7/09• 33. Peerless Insurance Company 4/7/09• 34. Accident Fund Insurance Company 4/17/09• 35. United Wisconsin Insurance Company 4/20/09• 36. Netherlands Insurance Company (The) 5/19/09• 37. Companion Property & Casualty Ins Co 11/30/09• 38. Sequoia Insurance Company 12/12/09• 39. Seneca Insurance Company, Inc. 1/26/10• 40. Sentinel Insurance Company, Ltd. 3/4/10• 41. National Casualty Company 5/18/10• 42. Massachusetts Bay Insurance Company 6/17/10• 43. Allmerica Financial Benefit Insurance Co 7/20/10• 44. Citizens Insurance Company of America 7/20/10• 45. Starnet Insurance Company 7/21/10

8
Newly Authorized Workers’ Compensation Insurers since AB 227, SB 228, SB 899
(Determined by Initial Rate Filing or Certificate of Authority Application, as of 1/1/2012)
COMPANY / GROUP NAME DATE OF ADMISSION
• 46. Hanover American Insurance Company 9/21/10• 47. Pharmacists Mutual Insurance Company 11/19/10• 48. Republic Underwriters Insurance Co 12/16/10• 49. Berkley National Insurance Company 1/3/11• 50. Sparta American Insurance Company 1/19/11• 51. Dentists Insurance Company (The) 1/26/11• 52. RLI Insurance Company 3/25/11• 53. Wesco Insurance Company 3/25/11• 54. Technology Insurance Company, Inc. 3/30/11• 55. Crum & Forster Indemnity Company 11/1/11• 56. State National Insurance Company, Inc. 11/1/11• 57. Starr Indemnity & Liability Company 11/14/11• 58. North Pointe Insurance Company 11/14/11• 59. QBE Insurance Corporation 11/14/11
Pending Applications for New Workers’ Compensation Insurers since passage of AB 227, SB 228, SB 899
(Determined by Initial Rate Filing or Certificate of Authority Application, as of 1/1/2012)
COMPANY NAME DATE OF APPLICATION
• 1. HDI-Gerling America Insurance Company 6/8/11• 2. Plaza Insurance Company 8/11/11• 3. Stonington Insurance Company 12/2/11

9
Summary of Steps to Better Review, Analyze,and Inform the Public and Insurers Regarding
Workers’ Compensation Costs and Rates
• CDI provides WCIRB with the version of the Benchmark filed or adopted by each individual insurer. Together with any company filed Benchmark deviations, industry average filed pure premium rate level is calculated and a relation to the next proposed Benchmark established.
• CDI also provides WCIRB the with Loss Cost Multiplier (loading for underwriting expenses and profit) filed by each individual insurer. A company’s LCM applied to its filed pure premium rates results in a company’s filed manual rates. Industry average filed manual rate levels can then be calculated as well as industry average LCM.
• WCIRB provides comparisons by classification and overall of the proposed pure premium rates to the industry average filed pure premium rates.
Comparison Shop on the Internet
• Comparison Shop on the Internet
– www.insurance.ca.gov - Click on “Consumers”, “Compare Premiums”, “Information on the CA Workers’ Compensation Rate Comparison”, and click on the range of class codes that contains your governing class code. Use the bookmarks and Class Code Search feature to help navigate to specific class codes.
– Click on the Back button and go back to the Cal WC Rate Comparison main page, and click on “Check your insurance company’s profile” link to obtain profile information about the company. Request a premium quote from the company, or for an authorized agent/broker that may provide a quote. If the quote is too high, select another company from the list. Check company licenses and agent/broker licenses. Check financial stability ratings.
– Many companies have their own websites and can provide on-line quotes.

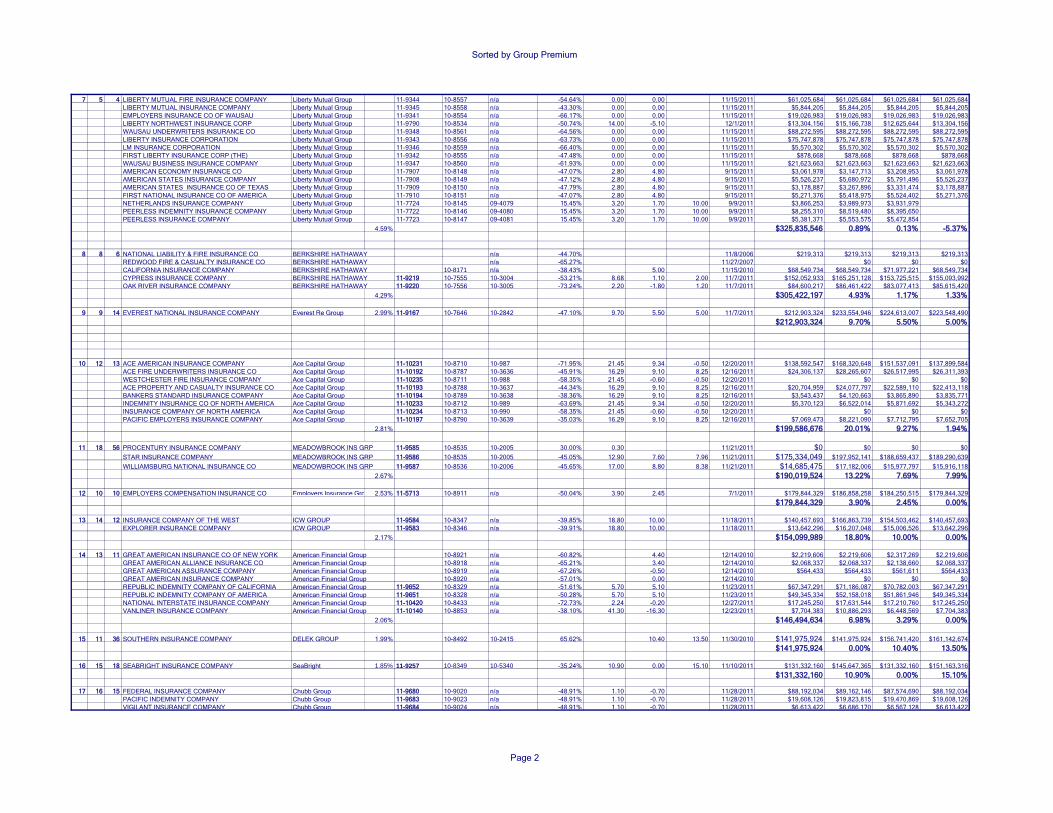
Sorted by Group Premium
Page 1
CALIFORNIA WORKERS' COMPENSATION MANUAL BASE RATES - RATE IMPACT OF FILINGS FROM 01/01/2004 THROUGH 01/01/2012List Current As Of 01/01/2012
'10 '09 '08 Sorted by Group Premium Volume & Group Market Share
COMPANY NAME GROUP NAME
Group Market Share 1/1/12 File # 1/1/11 File # 7/1/10 File #
01/01/2004 Cumulative % Rate Change
01/01/2012 % Rate Change
01/01/2011 % Rate Change
07/01/2010 % Rate Change
Date Most Recent Filing Recd.
2010 Direct Written Premium (after deductible credits)
01/01/2012 Group Rate Impact
01/01/2011 Group Rate Impact
07/01/2010 Group Rate Impact
1 1 1 STATE COMPENSATION INSURANCE FUND 16.02% 11-8830 10-7967 10-3091 -40.34% -1.07 5.20 0.00 10/27/2011 $1,140,202,785 $1,128,002,615 $1,199,493,330 $1,140,202,785
$1,140,202,785 -1.07% 5.20% 0.00%
2 2 3 AMERICAN GUARANTEE AND LIABILITY INS CO Zurich Insurance Group 11-9785 10-8562 n/a -59.66% 6.50 10.00 12/1/2011 $26,987,898 $28,742,111 $29,686,688 $26,987,898AMERICAN ZURICH INSURANCE COMPANY Zurich Insurance Group 11-9786 10-8563 n/a -61.34% 6.50 10.00 12/1/2011 $145,450,706 $154,905,002 $159,995,777 $145,450,706ASSURANCE COMPANY OF AMERICA Zurich Insurance Group 11-10318 10-7692 n/a -46.87% 8.50 11.00 12/22/2011 $9,064,030 $9,834,473 $10,061,073 $9,064,030FIDELITY AND DEPOSIT COMPANY OF MARYLAND Zurich Insurance Group 11-9787 10-8564 n/a -52.69% 6.50 10.00 12/1/2011 $1,572 $1,674 $1,729 $1,572MARYLAND CASUALTY COMPANY Zurich Insurance Group 11-10319 10-7693 n/a -43.34% 8.50 11.00 12/22/2011 $7,464,053 $8,098,498 $8,285,099 $7,464,053NORTHERN INSURANCE COMPANY OF NEW YORK Zurich Insurance Group 11-10320 10-7694 n/a -53.74% 8.50 11.00 12/22/2011 $20,773,656 $22,539,417 $23,058,758 $20,773,656ZURICH AMERICAN INSURANCE COMPANY Zurich Insurance Group 11-9788 10-8565 n/a -49.62% 6.50 10.00 12/1/2011 $204,671,648 $217,975,305 $225,138,813 $204,671,648ZURICH AMERICAN INSURANCE COMPANY OF IL Zurich Insurance Group 11-9789 10-8566 n/a -37.93% 6.50 10.00 12/1/2011 $5,858,628 $6,239,439 $6,444,491 $5,858,628CIVIC PROPERTY AND CASUALTY COMPANY Zurich Insurance Group 11-6189 10-7923 10-3127 -39.96% 4.00 6.00 -1.30 7/28/2011 $937,826 $975,339 $994,096 $925,634EXACT PROPERTY AND CASUALTY COMPANY Zurich Insurance Group 11-6190 10-7924 10-3128 -33.88% 4.00 6.00 -2.40 7/28/2011 $623,968 $648,927 $661,406 $608,993FARMERS INSURANCE EXCHANGE Zurich Insurance Group 11-6191 10-7925 10-3129 -33.30% 4.00 6.00 -2.30 7/28/2011 $30,156,202 $31,362,450 $31,965,574 $29,462,609MID-CENTURY INSURANCE COMPANY Zurich Insurance Group 11-6192 10-7926 10-3130 -51.61% 4.00 6.00 -1.30 7/28/2011 $55,192,110 $57,399,794 $58,503,637 $54,474,613NEIGHBORHOOD SPIRIT PROPERTY AND CAS CO Zurich Insurance Group 11-6193 10-7927 10-3131 -52.26% 4.00 6.00 -0.10 7/28/2011 $872,565 $907,468 $924,919 $871,692TRUCK INSURANCE EXCHANGE Zurich Insurance Group 11-6194 10-7928 10-3132 -39.91% 4.00 6.00 -0.30 7/28/2011 $103,058,158 $107,180,484 $109,241,647 $102,748,984
8.59% $611,113,020 5.84% 8.81% -0.29%
3 4 5 UNITED STATES FIDELITY AND GUARANTY CO TRAVELERS GROUP OF COMPAN11-5518 10-4703 n/a -55.72% 9.20 -0.40 6/29/2011 $33,255,995 $36,315,547 $33,122,971 $33,255,995FIDELITY AND GUARANTY INSURANCE CO TRAVELERS GROUP OF COMPAN11-5516 10-4701 n/a -57.07% 9.20 -0.40 6/29/2011 $8,237,622 $8,995,483 $8,204,672 $8,237,622DISCOVER PROPERTY & CASUALTY INS CO TRAVELERS GROUP OF COMPAN11-5515 10-4700 n/a -56.52% 9.20 -0.40 6/29/2011 $729,115 $796,194 $726,199 $729,115FIDELITY AND GUARANTY INS UNDERWRITERS TRAVELERS GROUP OF COMPAN11-5517 10-4702 n/a 19.19% 9.20 -0.40 6/29/2011 $379,395 $414,299 $377,877 $379,395TRAVELERS PROPERTY CAS CO OF AMERICA TRAVELERS GROUP OF COMPAN11-10177 10-8747 10-4073 -41.28% 9.10 5.10 -0.60 12/15/2011 $432,358,885 $471,703,544 $454,409,188 $429,764,732ST. PAUL FIRE AND MARINE INSURANCE CO TRAVELERS GROUP OF COMPANIES n/a -61.82% 12/12/2007 $0 $0 $0TRAVELERS INDEMNITY CO OF CT (THE) TRAVELERS GROUP OF COMPANIES 10-4072 -53.37% -0.60 6/1/2010 $971,851 $971,851 $971,851 $966,020ST. PAUL MERCURY INSURANCE COMPANY TRAVELERS GROUP OF COMPANIES n/a -60.48% 12/12/2007 $0 $0 $0ST. PAUL GUARDIAN INSURANCE COMPANY TRAVELERS GROUP OF COMPANIES n/a -60.02% 12/12/2007 $0 $0 $0ST. PAUL PROTECTIVE INSURANCE COMPANY TRAVELERS GROUP OF COMPANIES n/a -61.60% 12/12/2007 $0 $0 $0TRAVELERS CASUALTY INS CO OF AMERICA TRAVELERS GROUP OF COMPANIES 10-4071 -54.68% -0.60 6/1/2010 $975,101 $975,101 $975,101 $969,250NIPPONKOA INSURANCE COMPANY, LIMITED TRAVELERS GROUP OF COMPAN11-10238 10-8744 10-4353 -47.24% 6.20 6.70 2.10 12/20/2011 $6,155,365 $6,536,998 $6,567,774 $6,284,628TRAVELERS CASUALTY AND SURETY CO TRAVELERS GROUP OF COMPANIES 10-4069 -55.35% -0.60 6/1/2010 $65,086,762 $65,086,762 $65,086,762 $64,696,241TRAVELERS CASUALTY COMPANY OF CT TRAVELERS GROUP OF COMPANIES 10-4070 -54.19% -0.60 6/1/2010 $99,811 $99,811 $99,811 $99,212ATHENA ASSURANCE COMPANY TRAVELERS GROUP OF COMPANIES n/a -61.52% 12/12/2007 $0 $0 $0FARMINGTON CASUALTY COMPANY TRAVELERS GROUP OF COMPANIES 10-4067 -24.08% -0.60 6/1/2010 $0 $0 $0STANDARD FIRE INSURANCE COMPANY TRAVELERS GROUP OF COMPAN11-10176 10-8746 10-4068 -19.72% 9.10 -2.30 -0.60 12/15/2011 $5,035,590 $5,493,829 $4,919,771 $5,005,376
7.74% $553,285,492 7.97% 4.01% -0.52%
4 3 2 AMERICAN HOME ASSURANCE COMPANY AIG Group 11-9372 10-8384 n/a -41.82% 5.30 8.00 11/15/2011 $15,723,776 $16,557,136 $16,981,678 $15,723,776NATIONAL UNION FIRE INS CO OF PITTSBURGH, PA AIG Group 11-9377 10-8389 n/a -41.82% 5.30 8.00 11/15/2011 $213,631,744 $224,954,226 $230,722,284 $213,631,744COMMERCE AND INDUSTRY INSURANCE CO AIG Group 11-9374 10-8386 n/a -41.82% 5.30 8.00 11/15/2011 $36,250,937 $38,172,237 $39,151,012 $36,250,937GRANITE STATE INSURANCE COMPANY AIG Group 11-9375 10-8387 n/a -45.21% 8.56 8.00 11/15/2011 $80,405,960 $87,288,710 $86,838,437 $80,405,960INSURANCE CO OF THE STATE OF PA (THE) AIG Group 11-9376 10-8388 n/a -41.82% 5.30 8.00 11/15/2011 $67,086,511 $70,642,096 $72,453,432 $67,086,511NEW HAMPSHIRE INSURANCE COMPANY AIG Group 11-9379 10-8390 n/a -41.82% 5.30 8.00 11/15/2011 $50,514,004 $53,191,246 $54,555,124 $50,514,004AIU INSURANCE COMPANY AIG Group -44.82% 11/28/2006 $0 $0 $0CHARTIS PROPERTY CASUALTY COMPANY AIG Group 11-9373 10-8385 n/a -41.82% 5.30 8.00 11/15/2011 $1,722,916 $1,814,231 $1,860,749 $1,722,916
6.54% $465,335,848 5.86% 8.00% 0.00%
5 6 8 HARTFORD ACCIDENT AND INDEMNITY CO The Hartford Group 11-10301 10-7052 n/a -66.35% 5.30 2.30 12/21/2011 $90,145,182 $94,922,877 $92,218,521 $90,145,182HARTFORD CASUALTY INSURANCE COMPANY The Hartford Group 11-10302 10-7053 n/a -59.25% 5.30 2.30 12/21/2011 $21,971,788 $23,136,293 $22,477,139 $21,971,788HARTFORD FIRE INSURANCE COMPANY The Hartford Group 11-10303 10-7054 n/a -59.29% 5.30 2.30 12/21/2011 $69,747,038 $73,443,631 $71,351,220 $69,747,038HARTFORD INSURANCE CO OF THE MIDWEST The Hartford Group 11-10304 10-7055 n/a -61.06% 5.30 2.30 12/21/2011 $103,546,938 $109,034,926 $105,928,518 $103,546,938HARTFORD UNDERWRITERS INSURANCE CO The Hartford Group 11-10305 10-7056 n/a -59.25% 5.30 2.30 12/21/2011 $84,228,226 $88,692,322 $86,165,475 $84,228,226PROPERTY AND CASUALTY INS CO OF HARTFORD The Hartford Group 11-10306 10-7057 n/a -58.20% 5.30 2.30 12/21/2011 $5,850 $6,160 $5,985 $5,850SENTINEL INSURANCE COMPANY The Hartford Group 11-10307 10-7058 n/a 7.72% 5.30 2.30 12/21/2011 $5,606,641 $5,903,793 $5,735,594 $5,606,641TWIN CITY FIRE INSURANCE COMPANY The Hartford Group 11-10308 10-7059 n/a -59.25% 5.30 2.30 12/21/2011 $77,393,523 $81,495,380 $79,173,574 $77,393,523
6.36% $452,645,186 5.30% 2.30% 0.00%
6 24 24 UNITED STATES FIRE INSURANCE COMPANY FAIRFAX FINANCIAL 11-9438 10-8488 n/a -42.07% 15.60 8.90 11/18/2011 $81,406,632 $94,106,067 $88,651,822 $81,406,632NORTH RIVER INSURANCE COMPANY (THE) FAIRFAX FINANCIAL 11-9437 10-8487 n/a -42.54% 16.70 7.00 11/18/2011 $16,099,790 $18,788,455 $17,226,775 $16,099,790TIG INSURANCE COMPANY FAIRFAX FINANCIAL n/a n/a -62.62% 6/4/2007 $1,301,493 $1,301,493 $1,301,493 $1,301,493
7 7 ZENITH INSURANCE COMPANY FAIRFAX FINANCIAL 11-8865 10-8356 10-3634 -25.97% 5.20 2.90 0.00 10/27/2011 $212,171,093 $223,203,990 $218,324,055 $212,171,093ZNAT INSURANCE COMPANY FAIRFAX FINANCIAL 11-8866 10-8357 10-3635 -32.66% 5.20 2.90 0.00 10/27/2011 $53,166,499 $55,931,157 $54,708,327 $53,166,499
5.12% $364,145,507 8.01% 4.41% 0.00%
ANNUAL RANK
Sorted by Group Premium
Page 2
7 5 4 LIBERTY MUTUAL FIRE INSURANCE COMPANY Liberty Mutual Group 11-9344 10-8557 n/a -54.64% 0.00 0.00 11/15/2011 $61,025,684 $61,025,684 $61,025,684 $61,025,684LIBERTY MUTUAL INSURANCE COMPANY Liberty Mutual Group 11-9345 10-8558 n/a -43.30% 0.00 0.00 11/15/2011 $5,844,205 $5,844,205 $5,844,205 $5,844,205EMPLOYERS INSURANCE CO OF WAUSAU Liberty Mutual Group 11-9341 10-8554 n/a -66.17% 0.00 0.00 11/15/2011 $19,026,983 $19,026,983 $19,026,983 $19,026,983LIBERTY NORTHWEST INSURANCE CORP Liberty Mutual Group 11-9790 10-8534 n/a -50.74% 14.00 -5.10 12/1/2011 $13,304,156 $15,166,738 $12,625,644 $13,304,156WAUSAU UNDERWRITERS INSURANCE CO Liberty Mutual Group 11-9348 10-8561 n/a -64.56% 0.00 0.00 11/15/2011 $88,272,595 $88,272,595 $88,272,595 $88,272,595LIBERTY INSURANCE CORPORATION Liberty Mutual Group 11-9343 10-8556 n/a -63.73% 0.00 0.00 11/15/2011 $75,747,878 $75,747,878 $75,747,878 $75,747,878LM INSURANCE CORPORATION Liberty Mutual Group 11-9346 10-8559 n/a -66.40% 0.00 0.00 11/15/2011 $5,570,302 $5,570,302 $5,570,302 $5,570,302FIRST LIBERTY INSURANCE CORP (THE) Liberty Mutual Group 11-9342 10-8555 n/a -47.48% 0.00 0.00 11/15/2011 $878,668 $878,668 $878,668 $878,668WAUSAU BUSINESS INSURANCE COMPANY Liberty Mutual Group 11-9347 10-8560 n/a -61.93% 0.00 0.00 11/15/2011 $21,623,663 $21,623,663 $21,623,663 $21,623,663AMERICAN ECONOMY INSURANCE CO Liberty Mutual Group 11-7907 10-8148 n/a -47.07% 2.80 4.80 9/15/2011 $3,061,978 $3,147,713 $3,208,953 $3,061,978AMERICAN STATES INSURANCE COMPANY Liberty Mutual Group 11-7908 10-8149 n/a -47.12% 2.80 4.80 9/15/2011 $5,526,237 $5,680,972 $5,791,496 $5,526,237AMERICAN STATES INSURANCE CO OF TEXAS Liberty Mutual Group 11-7909 10-8150 n/a -47.79% 2.80 4.80 9/15/2011 $3,178,887 $3,267,896 $3,331,474 $3,178,887FIRST NATIONAL INSURANCE CO OF AMERICA Liberty Mutual Group 11-7910 10-8151 n/a -47.07% 2.80 4.80 9/15/2011 $5,271,376 $5,418,975 $5,524,402 $5,271,376NETHERLANDS INSURANCE COMPANY Liberty Mutual Group 11-7724 10-8145 09-4079 15.45% 3.20 1.70 10.00 9/9/2011 $3,866,253 $3,989,973 $3,931,979PEERLESS INDEMNITY INSURANCE COMPANY Liberty Mutual Group 11-7722 10-8146 09-4080 15.45% 3.20 1.70 10.00 9/9/2011 $8,255,310 $8,519,480 $8,395,650PEERLESS INSURANCE COMPANY Liberty Mutual Group 11-7723 10-8147 09-4081 15.45% 3.20 1.70 10.00 9/9/2011 $5,381,371 $5,553,575 $5,472,854
4.59% $325,835,546 0.89% 0.13% -5.37%
8 8 6 NATIONAL LIABILITY & FIRE INSURANCE CO BERKSHIRE HATHAWAY n/a -44.70% 11/8/2006 $219,313 $219,313 $219,313 $219,313REDWOOD FIRE & CASUALTY INSURANCE CO BERKSHIRE HATHAWAY n/a -65.27% 11/27/2007 $0 $0 $0CALIFORNIA INSURANCE COMPANY BERKSHIRE HATHAWAY 10-8171 n/a -38.43% 5.00 11/15/2010 $68,549,734 $68,549,734 $71,977,221 $68,549,734CYPRESS INSURANCE COMPANY BERKSHIRE HATHAWAY 11-9219 10-7555 10-3004 -53.21% 8.68 1.10 2.00 11/7/2011 $152,052,933 $165,251,128 $153,725,515 $155,093,992OAK RIVER INSURANCE COMPANY BERKSHIRE HATHAWAY 11-9220 10-7556 10-3005 -73.24% 2.20 -1.80 1.20 11/7/2011 $84,600,217 $86,461,422 $83,077,413 $85,615,420
4.29% $305,422,197 4.93% 1.17% 1.33%
9 9 14 EVEREST NATIONAL INSURANCE COMPANY Everest Re Group 2.99% 11-9167 10-7646 10-2842 -47.10% 9.70 5.50 5.00 11/7/2011 $212,903,324 $233,554,946 $224,613,007 $223,548,490
$212,903,324 9.70% 5.50% 5.00%
10 12 13 ACE AMERICAN INSURANCE COMPANY Ace Capital Group 11-10231 10-8710 10-987 -71.95% 21.45 9.34 -0.50 12/20/2011 $138,592,547 $168,320,648 $151,537,091 $137,899,584ACE FIRE UNDERWRITERS INSURANCE CO Ace Capital Group 11-10192 10-8787 10-3636 -45.91% 16.29 9.10 8.25 12/16/2011 $24,306,137 $28,265,607 $26,517,995 $26,311,393WESTCHESTER FIRE INSURANCE COMPANY Ace Capital Group 11-10235 10-8711 10-988 -58.35% 21.45 -0.60 -0.50 12/20/2011 $0 $0 $0ACE PROPERTY AND CASUALTY INSURANCE CO Ace Capital Group 11-10193 10-8788 10-3637 -44.34% 16.29 9.10 8.25 12/16/2011 $20,704,959 $24,077,797 $22,589,110 $22,413,118BANKERS STANDARD INSURANCE COMPANY Ace Capital Group 11-10194 10-8789 10-3638 -38.36% 16.29 9.10 8.25 12/16/2011 $3,543,437 $4,120,663 $3,865,890 $3,835,771INDEMNITY INSURANCE CO OF NORTH AMERICA Ace Capital Group 11-10233 10-8712 10-989 -63.69% 21.45 9.34 -0.50 12/20/2011 $5,370,123 $6,522,014 $5,871,692 $5,343,272INSURANCE COMPANY OF NORTH AMERICA Ace Capital Group 11-10234 10-8713 10-990 -58.35% 21.45 -0.60 -0.50 12/20/2011 $0 $0 $0PACIFIC EMPLOYERS INSURANCE COMPANY Ace Capital Group 11-10197 10-8790 10-3639 -35.03% 16.29 9.10 8.25 12/16/2011 $7,069,473 $8,221,090 $7,712,795 $7,652,705
2.81% $199,586,676 20.01% 9.27% 1.94%
11 18 56 PROCENTURY INSURANCE COMPANY MEADOWBROOK INS GRP 11-9585 10-8535 10-2005 30.00% 0.30 11/21/2011 $0 $0 $0 $0
STAR INSURANCE COMPANY MEADOWBROOK INS GRP 11-9586 10-8535 10-2005 -45.05% 12.90 7.60 7.96 11/21/2011 $175,334,049 $197,952,141 $188,659,437 $189,290,639
WILLIAMSBURG NATIONAL INSURANCE CO MEADOWBROOK INS GRP 11-9587 10-8536 10-2006 -45.65% 17.00 8.80 8.38 11/21/2011 $14,685,475 $17,182,006 $15,977,797 $15,916,118
2.67% $190,019,524 13.22% 7.69% 7.99%
12 10 10 EMPLOYERS COMPENSATION INSURANCE CO Employers Insurance Gro 2.53% 11-5713 10-8911 n/a -50.04% 3.90 2.45 7/1/2011 $179,844,329 $186,858,258 $184,250,515 $179,844,329
$179,844,329 3.90% 2.45% 0.00%
13 14 12 INSURANCE COMPANY OF THE WEST ICW GROUP 11-9584 10-8347 n/a -39.85% 18.80 10.00 11/18/2011 $140,457,693 $166,863,739 $154,503,462 $140,457,693EXPLORER INSURANCE COMPANY ICW GROUP 11-9583 10-8346 n/a -39.91% 18.80 10.00 11/18/2011 $13,642,296 $16,207,048 $15,006,526 $13,642,296
2.17% $154,099,989 18.80% 10.00% 0.00%
14 13 11 GREAT AMERICAN INSURANCE CO OF NEW YORK American Financial Group 10-8921 n/a -60.82% 4.40 12/14/2010 $2,219,606 $2,219,606 $2,317,269 $2,219,606GREAT AMERICAN ALLIANCE INSURANCE CO American Financial Group 10-8918 n/a -65.21% 3.40 12/14/2010 $2,068,337 $2,068,337 $2,138,660 $2,068,337GREAT AMERICAN ASSURANCE COMPANY American Financial Group 10-8919 n/a -67.26% -0.50 12/14/2010 $564,433 $564,433 $561,611 $564,433GREAT AMERICAN INSURANCE COMPANY American Financial Group 10-8920 n/a -57.01% 0.00 12/14/2010 $0 $0 $0REPUBLIC INDEMNITY COMPANY OF CALIFORNIA American Financial Group 11-9652 10-8329 n/a -51.61% 5.70 5.10 11/23/2011 $67,347,291 $71,186,087 $70,782,003 $67,347,291REPUBLIC INDEMNITY COMPANY OF AMERICA American Financial Group 11-9651 10-8328 n/a -50.28% 5.70 5.10 11/23/2011 $49,345,334 $52,158,018 $51,861,946 $49,345,334NATIONAL INTERSTATE INSURANCE COMPANY American Financial Group 11-10420 10-8433 n/a -72.73% 2.24 -0.20 12/27/2011 $17,245,250 $17,631,544 $17,210,760 $17,245,250VANLINER INSURANCE COMPANY American Financial Group 11-10140 10-8853 n/a -38.10% 41.30 -16.30 12/23/2011 $7,704,383 $10,886,293 $6,448,569 $7,704,383
2.06% $146,494,634 6.98% 3.29% 0.00%
15 11 36 SOUTHERN INSURANCE COMPANY DELEK GROUP 1.99% 10-8492 10-2415 65.62% 10.40 13.50 11/30/2010 $141,975,924 $141,975,924 $156,741,420 $161,142,674
$141,975,924 0.00% 10.40% 13.50%
16 15 18 SEABRIGHT INSURANCE COMPANY SeaBright 1.85% 11-9257 10-8349 10-5340 -35.24% 10.90 0.00 15.10 11/10/2011 $131,332,160 $145,647,365 $131,332,160 $151,163,316
$131,332,160 10.90% 0.00% 15.10%
17 16 15 FEDERAL INSURANCE COMPANY Chubb Group 11-9680 10-9020 n/a -48.91% 1.10 -0.70 11/28/2011 $88,192,034 $89,162,146 $87,574,690 $88,192,034PACIFIC INDEMNITY COMPANY Chubb Group 11-9683 10-9023 n/a -48.91% 1.10 -0.70 11/28/2011 $19,608,126 $19,823,815 $19,470,869 $19,608,126VIGILANT INSURANCE COMPANY Chubb Group 11-9684 10-9024 n/a -48.91% 1.10 -0.70 11/28/2011 $6,613,422 $6,686,170 $6,567,128 $6,613,422

Sorted by Group Premium
Page 3
GREAT NORTHERN INSURANCE COMPANY Chubb Group 11-9681 10-9021 n/a -48.91% 1.10 -0.70 11/28/2011 $2,498,860 $2,526,347 $2,481,368 $2,498,860NORTHWESTERN PACIFIC INDEMNITY COMPANY Chubb Group 11-9682 10-9022 n/a -48.91% 1.10 -0.70 11/28/2011 $46 $47 $46 $46CHUBB INDEMNITY INSURANCE COMPANY Chubb Group 11-9679 10-9019 n/a -48.91% 1.10 -0.70 11/28/2011 $11,791,810 $11,921,520 $11,709,267 $11,791,810SAMSUNG FIRE & MARINE INS CO LTD. (US BRNCH) Chubb Group n/a n/a -49.11% 11/19/2009 $0 $0 $0 $0
1.81% $128,704,298 1.10% -0.70% 0.00%
18 23 23 OLD REPUBLIC GENERAL INSURANCE CORP OLD REPUBLIC GROUP 11-3113 n/a n/a -49.19% 8.30 3/31/2011 $51,426,436 $55,694,830 $51,426,436 $51,426,436OLD REPUBLIC INSURANCE COMPANY OLD REPUBLIC GROUP 11-9624 10-8491 n/a -63.54% 29.78 -4.10 11/23/2011 $26,351,205 $34,198,594 $25,270,806 $26,351,205GREAT WEST CASUALTY COMPANY OLD REPUBLIC GROUP 11-9793 n/a n/a -41.98% 4.50 12/1/2011 $376,127 $393,053 $376,127 $376,127BITUMINOUS CASUALTY CORPORATION OLD REPUBLIC GROUP n/a n/a -63.80% 7/16/2007 $0 $0 $0
27 29 PA MANUFACTURERS ASSN INS OLD REPUBLIC GROUP 11-4193 n/a 10-1877 -38.56% 10.10 0.00 5/6/2011 $27,272,490 $30,027,011 $27,272,490 $27,272,490MANUFACTURERS ALLIANCE INSURANCE CO OLD REPUBLIC GROUP 11-4192 n/a 10-1876 -38.63% 10.10 0.00 5/6/2011 $18,863,514 $20,768,729 $18,863,514 $18,863,514PENNSYLVANIA MANUFACTURERS INDEMNITY CO OLD REPUBLIC GROUP 11-4194 n/a 10-1878 -38.62% 10.10 0.00 5/6/2011 $3,218,864 $3,543,969 $3,218,864 $3,218,864
1.79% $127,508,636 13.42% -0.85% 0.00%
19 22 20 TOWER INSURANCE COMPANY OF NY TOWER GROUP 11-9979 10-8016 10-2592 17.92% 15.00 9.00 7.70 12/7/2011 $64,996,233 $74,745,668 $70,845,894 $70,000,943PRESERVER INSURANCE COMPANY TOWER GROUP 11-9978 10-8015 10-2591 41.75% 15.00 9.00 7.70 12/7/2011 $21,230,533 $24,415,113 $23,141,281 $22,865,284CASTLEPOINT NATIONAL INSURANCE COMPANY TOWER GROUP 11-10215 10-8856 10-3845 -19.80% 15.00 10.00 2.40 12/19/2011 $37,678,480 $43,330,252 $41,446,328 $38,582,764
1.74% $123,905,246 15.00% 9.30% 6.09%
20 17 16 COMPWEST INSURANCE COMPANY COMPWEST 1.27% 11-8691 10-8486 10-6286 -38.34% 12.00 7.00 8.00 10/18/2011 $90,029,401 $100,832,929 $96,331,459 $97,231,753
$90,029,401 12.00% 7.00% 8.00%
21 21 26 AMERICAN CASUALTY CO OF READING, PA C.N.A. INSURANCE GROUP 11-9593 10-8350 10-4014 -47.48% 15.10 0.20 8.00 11/22/2011 $26,289,589 $30,259,317 $26,342,168 $28,392,756CONTINENTAL CASUALTY COMPANY C.N.A. INSURANCE GROUP 11-9594 10-8351 10-4015 -47.19% 15.10 0.20 8.00 11/22/2011 $4,802,897 $5,528,134 $4,812,503 $5,187,129CONTINENTAL INSURANCE COMPANY C.N.A. INSURANCE GROUP 11-9595 10-8352 10-4016 -13.61% 15.10 0.20 8.00 11/22/2011 $1,846,196 $2,124,972 $1,849,888 $1,993,892NATIONAL FIRE INSURANCE CO OF HARTFORD C.N.A. INSURANCE GROUP 11-9596 10-8353 10-4017 -47.19% 15.10 0.20 8.00 11/22/2011 $10,482,232 $12,065,049 $10,503,196 $11,320,811TRANSCONTINENTAL INSURANCE COMPANY C.N.A. INSURANCE GROUP n/a -53.24% 12/4/2006 $0 $0 $0TRANSPORTATION INSURANCE COMPANY C.N.A. INSURANCE GROUP 11-9597 10-8354 10-4018 -47.19% 15.10 0.20 8.00 11/22/2011 $7,775,278 $8,949,345 $7,790,829 $8,397,300VALLEY FORGE INSURANCE COMPANY C.N.A. INSURANCE GROUP 11-9598 10-8355 10-4019 -47.19% 15.10 0.20 8.00 11/22/2011 $34,930,549 $40,205,062 $35,000,410 $37,724,993
1.21% $86,126,741 15.10% 0.20% 8.00%
22 26 25 PREFERRED EMPLOYERS INSURANCE COMPANY WR Berkley Group 11-9401 10-8205 n/a -46.94% 5.85 1.10 11/16/2011 $61,794,524 $65,409,504 $62,474,264 $61,794,524GREAT DIVIDE INSURANCE COMPANY WR Berkley Group n/a n/a n/a -34.60% 7/8/2009 $10,522,067 $10,522,067 $10,522,067 $10,522,067MIDWEST EMPLOYERS CASUALTY COMPANY WR Berkley Group n/a n/a 10-2408 -32.34% 0.00 3/26/2010 $41,108 $41,108 $41,108 $41,108
1.03% $72,357,699 5.00% 0.94% 0.00%
23 19 17 MAJESTIC INSURANCE COMPANY 0.97% n/a n/a 10-3404 -52.30% 10.10 5/10/2010 $69,050,062 $69,050,062 $69,050,062 $76,024,118
$69,050,062 0.00% 0.00% 10.10%
24 25 21 STATE FARM FIRE AND CASUALTY COMPANY STATE FARM GROUP 0.93% 11-9599 10-8545 n/a -23.94% 0.00 4.00 11/22/2011 $66,115,206 $66,115,206 $68,759,814 $66,115,206
$66,115,206 0.00% 4.00% 0.00%
25 28 28 AMERICAN AUTOMOBILE INSURANCE COMPANY Allianz/Fireman's Fund Group 11-10511 10-8680 n/a -52.78% 2.00 7.00 12/28/2011 $18,590,854 $18,962,671 $19,892,214 $18,590,854AMERICAN INSURANCE COMPANY (THE) Allianz/Fireman's Fund Group n/a 10-8681 n/a -54.22% 7.00 12/3/2010 $14,333,643 $14,333,643 $15,336,998 $14,333,643ASSOCIATED INDEMNITY CORPORATION Allianz/Fireman's Fund Group n/a 10-8682 n/a -47.31% 7.00 12/3/2010 $558,693 $558,693 $597,802 $558,693FIREMAN'S FUND INSURANCE COMPANY Allianz/Fireman's Fund Group n/a 10-8683 n/a -62.31% 7.00 12/3/2010 $9,688,625 $9,688,625 $10,366,829 $9,688,625NATIONAL SURETY CORPORATION Allianz/Fireman's Fund Group n/a 10-8684 n/a -56.93% 7.00 12/3/2010 $22,427,589 $22,427,589 $23,997,520 $22,427,589
0.92% $65,599,404 0.57% 7.00% 0.00%
26 20 19 IMPERIUM INSURANCE COMPANY LIGHTYEAR DELOS GRO 0.87% n/a 10-5845 10-1535 43.30% 15.00 1.40 8/12/2010 $61,770,556 $61,770,556 $71,036,139 $62,635,344
$61,770,556 0.00% 15.00% 1.40%
27 42 46 ULICO CASUALTY COMPANY UNION LABOR GROUP 0.84% 11-2821 10-11 -34.57% 4.90 -1.70 3/22/2011 $59,472,841 $62,387,010 $59,472,841 $58,461,803
$59,472,841 4.90% 0.00% -1.70%
28 - - COMPANION PROPERTY & CASUALTY INS CO 0.67% 11-1099 0.00% 0.00 1/27/2011 $47,515,863 $47,515,863 $47,515,863 $47,515,863
$47,515,863 0.00% 0.00% 0.00%
29 34 39 NORGUARD INSURANCE COMPANY Guard Insurance Group 11-5342 10-9206 n/a -45.95% 4.50 6.96 6/21/2011 $25,620,209 $26,773,118 $27,403,376 $25,620,209AMGUARD INSURANCE COMPANY Guard Insurance Group 11-5340 10-9204 n/a -41.06% 4.50 6.96 6/21/2011 $16,847,229 $17,605,354 $18,019,796 $16,847,229EASTGUARD INSURANCE COMPANY Guard Insurance Group 11-5341 10-9205 n/a -41.91% 4.50 6.96 6/21/2011 $1,751,393 $1,830,206 $1,873,290 $1,751,393
0.62% $44,218,831 4.50% 6.96% 0.00%
30 31 48 SPARTA INSURANCE COMPANY Sparta Group 0.58% 11-9985 10-9530 n/a 71.73% 22.79 9.50 12/7/2011 $41,050,507 $50,405,918 $44,950,305 $41,050,507
$41,050,507 22.79% 9.50% 0.00%
31 - - SEQUOIA INSURANCE COMPANY JP Morgan Chase 0.54% 11-2486 10-6960 n/a 12.32% 7.90 4.10 3/10/2011 $38,650,138 $41,703,499 $40,234,794 $38,650,138
$38,650,138 7.90% 4.10% 0.00%

Sorted by Group Premium
Page 4
32 30 31 ARCH INSURANCE COMPANY Arch Insurance Group 0.51% n/a n/a n/a -56.13% 9/7/2007 $36,448,864 $36,448,864 $36,448,864 $36,448,864
$36,448,864 0.00% 0.00% 0.00%
36 33 30 CARE WEST INSURANCE COMPANY CARE WEST INSURANC 0.35% 11-9978 10-8602 10-6306 -43.85% 11.00 0.00 12.00 12/1/2011 $25,044,512 $27,799,408 $25,044,512 $28,049,853
$25,044,512 11.00% 0.00% 12.00%
37 36 32 ALASKA NATIONAL INSURANCE COMPANY ALASKA NATIONAL 0.31% 11-9650 10-8438 n/a -48.38% 16.50 -2.10 11/23/2011 $22,383,672 $26,076,978 $21,913,615 $22,383,672
$22,383,672 16.50% -2.10% 0.00%
38 38 33 SENTRY INSURANCE, A MUTUAL COMPANY SENTRY INSURANCE GROUP 11-365 n/a n/a -38.21% 7.60 1/13/2011 $16,813,696 $18,091,537 $16,813,696 $16,813,696SENTRY SELECT INSURANCE COMPANY SENTRY INSURANCE GROUP 11-366 n/a n/a -46.44% 7.60 1/13/2011 $421,544 $453,581 $421,544 $421,544SENTRY CASUALTY COMPANY SENTRY INSURANCE GROUP 11-364 n/a n/a 7.60% 7.60 1/13/2011 $1,438,084 $1,547,378 $1,438,084 $1,438,084MIDDLESEX INSURANCE COMPANY SENTRY INSURANCE GROUP 11-363 n/a n/a -23.74% 7.60 1/13/2011 $3,651,014 $3,928,491 $3,651,014 $3,651,014
0.31% $22,324,338 7.60% 0.00% 0.00%
52 63 27 GENERAL CASUALTY COMPANY OF WISCONSIN QBE INSURANCE GP 11-9982 n/a 10-3174 -39.51% -2.11 -0.50 5/3/2010 486065 $475,809 $486,065 $483,635REGENT INSURANCE COMPANY QBE INSURANCE GP 11-9983 n/a 10-3175 -24.59% -2.11 17.98 5/3/2010 927570 $907,998 $927,570 $1,094,347REDLAND INSURANCE COMPANY QBE INSURANCE GP n/a n/a -46.45% 11/24/2009 $0 $0 $0PRAETORIAN INSURANCE COMPANY QBE INSURANCE GP 11-9254 10-8913 n/a -15.40% 14.63 3.00 11/10/2011 8619906 $9,880,998 $8,878,503 $8,619,906
0.14% $10,033,541 12.27% 2.58% 1.64%
59 29 22 PACIFIC COMPENSATION INSURANCE COMPANY Alleghany Group 0.02% 11-9589 10-7133 n/a -41.62% 7.50 1.00 11/21/2011 $1,497,067 $1,609,347 $1,512,038 $1,497,067
(Formerly Employers Direct Insurance Company) $1,497,067 7.50% 1.00% 0.00%
TOTAL 95.75% Cumulative Jan-12 Jan-11 Jul-10
INSURERS: -40.9% 5.95 4.59 1.55

California Workers' Compensation - New Market Entrant Filing ActivityBased on Initial Rate Filings, Certificate of Authority Applications/Amendments, CIC 700 Financial Filings - Received from 4th Quarter 2003 to Present (post-reform)As of 1/6/2012YEAR (# COMPANIES - # GROUPS): 1991 (246-116), 1992 (243-unk), 1993 (235-108), 1994 (237-105), 1995 (238-104), 1996 (234-104), 1997 (241-106), 1998 (249-101), 1999 (246-95), 2000 (244-96), 2001 (235-91), 2002 (230-90), 2003 (225-87)
INSURER NAME GROUP NAME NAIC # GROUP#
TYPE OF FILING:
RATE, C/A, 700C.
RATE or C/A FILING #
DATE RATE or C/A FILING RECD.
DATE RATE or C/A FILING ACCEPTED / ISSUED / APPROVED
2010 DIRECT WRITTEN PREMIUM
2009 DIRECT WRITTEN PREMIUM
2008 DIRECT WRITTEN PREMIUM
2007 DIRECT WRITTEN PREMIUM
2006 DIRECT WRITTEN PREMIUM
AB 227 & SB 228 Chaptered 10/1/03
1 FARMERS REINSURANCE COMPANY Zurich Insurance Group 10873 212 C 03-8032 12/2/2003 11/16/2004 $0 $0 $0 $0 $0CASCADE NATIONAL INSURANCE COMPANY n/a 10175 n/a R, 700C * 03-8176 12/8/2003 CONSERVED $0 $0 $0 $0 $0
2004 (214-89)
2 AMGUARD, EASTGUARD, NORGUARD INS. COMPANIES Guard Insurance Companies 42390 0828 R, 700C * 04-37 1/6/2004 2/2/2004 $44,218,831 $29,222,874 $19,870,909 $13,820,987 $13,016,6643 PARTNER REINSURANCE COMPANY OF THE U.S Winterthur Group 38636 3483 C 04-290 1/16/2004 2/15/2005 $0 $0 $0 $0 $0
WESTERN COMPENSATION INSURANCE COMPANY n/a n/a n/a R, C 04-410, 04-343 1/21/04 & 1/20/04 W/D & W/D $0 $0 $0 $0 $0SELECTIVE INSURANCE COMPANY OF AMERICA Selective Insurance Group 12572 0242 R, C 04-894, 04-1454 2/4/04 & 2/23/04 N/A & W/D $0 $0 $0 $0 $0CATERPILLAR INSURANCE COMPANY n/a 11255 3569 C 04-1675 3/3/2004 W/D $0 $0 $0 $0 $0SB 899 Chaptered 4/19/04
4 COMPWEST INSURANCE COMPANY n/a 12177 n/a R, C 04-3555, 04-5917 5/12/04 & 8/19/04 6/4/04 & 10/4/04 $90,029,401 $109,420,925 $120,834,283 $112,265,528 $100,024,284IMPERIAL CASUALTY AND INDEMNITY COMPANY n/a 11487 3499 C 04-4961 7/12/2004 W/D $0 $0 $0 $0 $0
5 EMPLOYERS REINSURANCE CORPORATION (WESTPORT) Employers Re Corp Group 39845 0350 R * 04-5087 7/16/2004 7/26/2004 $16,650 $35,538 $291,342 $145,072 $280,130REMINGTON INSURANCE COMPANY, LTD. n/a n/a n/a C 04-6151 8/30/2004 REJECTED $0 $0 $0 $0 $0WESTERN SELECT INSURANCE COMPANY Public Service Mutual Group 10997 0853 R, 700C * 04-5281 7/28/2004 W/D $0 $0 $0 $0 $0
6 NATIONAL LIABILITY & FIRE INSURANCE COMPANY Berkshire Hathaway 20052 0031 R 04-6393 9/3/2004 9/24/2004 $219,313 $324,244 $6,467,323 $113,149,424 $399,782,207
7 CALIFORNIA INSURANCE COMPANY n/a 38865 n/a R, C 04-7990, 04-7041 11/15/04 & 10/12/04 11/29/04 & 12/23/04 $68,549,734 $50,556,348 $66,318,509 $98,145,382 $145,393,714TEVIS INSURANCE COMPANY n/a n/a n/a R, C 04-8731, 04-8846 12/1/04 & 12/6/04 W/D & W/D $0 $0 $0 $0 $0
8 TNUS INSURANCE COMPANY Millea / Tokio Marine Group 32301 3098 R, C 04-9310 & 04-2418 12/16/04 & 4/7/04 1/14/05 & 09/28/04 $2,277,377 $0 $0 $0 $0
9 BERKLEY REGIONAL INSURANCE COMPANY WR Berkley Corp Group 29580 0098 R 04-9375 12/17/2004 1/13/2005 $908,552 -$520,969 -$1,190,613 -$145,896 $785,825
2005 (210-86)
10 GREAT DIVIDE INS CO WR Berkley Corp Group 25224 0098 R, C 05-1613 & 05-1296 2/18/05 & 2/9/05 4/5/05 & 2/16/06 $10,522,067 $6,469,077 $7,972,272 $6,081,742 $5,541,457CORNERSTONE COMPENSATION INSURANCE COMPANY EMB America LLC n/a R, C 05-1860 & 05-1832 3/2/05 & 3/1/05 W/D & W/D $0 $0 $0 $0 $0
11 ADVANTAGE WORKERS' COMPENSATION INSURANCE COMPAn/a 40517 n/a R, C 05-2037 & 06-5039 3/9/05 & 8/7/06 3/29/05 & 9/6/06 $18,730,991 $13,384,371 $6,156,409 $1,795,564 $012 SUA INSURANCE COMPANY (CASTLEPOINT NAT'L) n/a 40134 n/a R, C 05-3334 & 05-2215 5/2/05 & 3/16/05 05/11/05 & 5/9/05 $37,678,480 $18,801,306 $26,008,303 $23,314,773 $17,331,480
LINCOLN GENERAL INSURANCE COMPANY Kingsway 33855 1326 R, C 05-4615 & 05-4207 6/13/05 & 5/31/05 W/D & 3/21/07 Note: Company resubmitted rate filing in 2006, see below13 MIDWEST EMPLOYERS CASUALTY COMPANY WR Berkley Corp Group 23612 0098 C 05-5003 6/23/2005 12/30/2005 $41,108 $62,864 $93,156 $170,505 $290,95314 WESTERN UNITED INSURANCE COMPANY n/a 37770 1278 C 04-3742 5/25/2004 7/29/2005 $0 $0 $0 $0 $0
15 ENDURANCE REINSURANCE CORPORATION OF AMERICA n/a 11551 n/a R, C 05-5428 & 05-5415 7/11/05 & 7/11/05 8/5/05 & 1/6/06 $0 $26,098,709 $232,827,682 $262,227,645 $93,779,43316 INSURANCE CORP. OF HANNOVER (PRAETORIAN INS.) Hannover Group 37257 0517 R 05-6191 8/15/2005 8/30/2005 $8,619,906 -$4,119,926 $51,368,087 $101,150,433 $33,877,80617 FINANCIAL PACIFIC INSURANCE COMPANY Mercer Group 31453 1114 C 05-9919 10/20/2005 5/25/2006 $0 $0 $0 $0 $0
2006 (204-81)
18 NOVA CASUALTY COMPANY AIX Group 42552 4257 R, C 06-1394 & 06-1248 2/24/06 & 2/17/06 3/8/06 & 8/16/06 $25,159,669 $11,905,609 $13,882,374 $3,440,820 $0MEMIC INDEMNITY COMPANY n/a n/a n/a R, C 06-1424 & 05-10073 2/27/06 & 12/7/05 W/D & W/D Note: Company resubmitted rate filing in 2008, see belowSENTRY CASUALTY COMPANY Sentry Mutual Group 28460 0169 R, C 06-4007 & 06-3840 6/19/06 & 6/12/06 W/D & 12/5/06 Note: Company resubmitted rate filing in 2007, see below
19 LINCOLN GENERAL INSURANCE COMPANY Kingsway 33855 1326 R, C 06-4936 & 05-4207 8/2/06 & 5/31/05 8/8/06 & 3/21/07 $0 $1,190,033 $14,091,871 $29,727,863 $020 SOMPO JAPAN FIRE & MARINE INSURANCE COMPANY OF AMENissan Insurance Group 38997 3219 R 06-5443 8/18/2006 9/5/2006 $1,057,646 $544,487 $282,499 $134,754 $021 NEW YORK MARINE AND GENERAL INSURANCE COMPANY New York Marine & Genl.Grp. 16608 0256 R, C 06-6198 & 06-5405 9/14/06 & 8/18/06 10/11/06 & 10/12/07 $0 $0 $0 $0 $022 TOWER INSURANCE COMPANY OF NEW YORK Tower Group Companies 44300 3703 R, C 06-8817 & 07-2629 12/5/06 & 4/5/07 12/29/06 & 9/21/07 $64,996,233 $75,077,144 $94,982,558 $3,691,169 $0
PHARMACISTS MUTUAL INSURANCE COMPANY Pharmacists Mutual Group 13714 0775 C 06-9375 12/1/2006 W/D Note: Company resubmitted rate filing in 2010, see below2007 (207-84)
23 NORTH AMERICAN ELITE INSURANCE COMPANY North American Reinsurance G 29700 0181 R 07-1192 2/13/2007 5/29/2007 $0 $0 $0 $0CRYSTAL MOUNTAIN INSURANCE, INC. n/a n/a 0000 R 07-3064 4/25/2007 REJECTED $0 $0 $0 $0
24 WASHINGTON INTERNATIONAL INSURANCE COMPANY North American Reinsurance G 32778 0181 R, C 07-3265 & 07-3056 5/3/2007 & 4/24/07 5/29/07 & 3/13/08 $0 $0 $0 $0
25 SOUTHERN INSURANCE COMPANY Republic Companies Group 19216 3489 R,C 07-4918 &07-4675 7/24/07 & 7/9/07 7/31/07 & 4/23/08 $141,975,924 $174,711,728 $23,188,876 $0ACCIDENT FUND INSURANCE COMPANY OF AMERICA n/a n/a n/a R, C 07-5443 & 07-5363 8/22/07 & 8/17/07 W/D & W/D Note: Company resubmitted rate filing in 2008, see below
15 ENDURANCE REINSURANCE CORPORATION OF AMERICA n/a 11551 n/a R, C 08-1173 & 07-6043 1/28/08 & 9/19/07 1/29/08 & 1/30/08 Note: Company redomesticated from NY to DE, see Co # 15 abov 26 SPARTA INSURANCE COMPANY n/a 20613 n/a R 07-6137 9/28/2007 10/3/2007 $41,050,507 $33,521,449 $10,968,310 $0
27 SENTRY CASUALTY COMPANY Sentry Mutual Group 28460 0169 R 07-6404 10/12/2007 5/28/2008 $1,438,084 $783,420 $197,866 $0CRYSTAL MOUNTAIN INSURANCE, INC. n/a n/a n/a R 07-6646 10/23/2007 REJECTED $0 $0 $0 $0
2008 (207-85)
28 MEMIC INDEMNITY COMPANY Maine Employers 11030 1332 R, C 08-1162 & 08-621 1/28/08 & 1/11/08 2/8/08 & 7/7/08 $71,435 $30,770 $84429 XL INSURANCE AMERICA, INC. XL AMERICA GROUP 24554 1285 R 08-2471 3/4/2008 3/6/2008 $653,191 $217,749 $310,85530 PRESERVER INSURANCE COMPANY Preserver Group Inc. 15586 0026 R, C 08-5805 & 08-12661 4/15/08 & 9/17/08 5/13/08 & 12/30/08 $21,230,533 $7,504,131 $0
SAFETY FIRST INSURANCE COMPANY Delphi Financial Group 11123 0074 C 08-9647 6/19/2008 W/D $0 $0 $0AMERICAN FAMILY HOME INSURANCE COMPANY Munich Group 23450 0361 R, C 08-11876 & 08-1039 9/3/08 & 7/17/2008 W/D & W/D $0 $0 $0
31 SECURITY NATIONAL INSURANCE COMPANY Amtrust Group 19879 2538 R 08-11247 8/18/2008 8/26/2008 $11,796,247 $1,236,018 $0IMPERIAL CASUALTY AND INDEMNITY COMPANY Providence Holdings Inc Gp 11487 3499 R, C 08-11677 & 08-1132 8/29/08 & 8/19/08 9/17/2008 & W/D $0 $0 $0AMERICAN MODERN HOME INSURANCE COMPANY n/a 23469 n/a R, C 08-12149 & 08-1096 9/18/08 & 8/6/08 10/14/08 & W/D $0 $0 $0

California Workers' Compensation - New Market Entrant Filing ActivityBased on Initial Rate Filings, Certificate of Authority Applications/Amendments, CIC 700 Financial Filings - Received from 4th Quarter 2003 to Present (post-reform)As of 1/6/2012YEAR (# COMPANIES - # GROUPS): 1991 (246-116), 1992 (243-unk), 1993 (235-108), 1994 (237-105), 1995 (238-104), 1996 (234-104), 1997 (241-106), 1998 (249-101), 1999 (246-95), 2000 (244-96), 2001 (235-91), 2002 (230-90), 2003 (225-87)
INSURER NAME GROUP NAME NAIC # GROUP#
TYPE OF FILING:
RATE, C/A, 700C.
RATE or C/A FILING #
DATE RATE or C/A FILING RECD.
DATE RATE or C/A FILING ACCEPTED / ISSUED / APPROVED
2010 DIRECT WRITTEN PREMIUM
2009 DIRECT WRITTEN PREMIUM
2008 DIRECT WRITTEN PREMIUM
2007 DIRECT WRITTEN PREMIUM
2006 DIRECT WRITTEN PREMIUM
32 ACCIDENT FUND INSURANCE COMPANY OF AMERICA n/a 10166 n/a R, C 08-13193 & 08-1312 10/27/08 & 10/23/08 11/25/2008 & 4/17/2009 $132,611 $0 $033 UNITED WISCONSIN INSURANCE COMPANY Cobalt Corporation Group 29157 0053 R, C 08-13192 & 08-1312 10/27/08 & 10/23/08 11/25/2008 & 4/20/2009 $108,022 $100,754 $0
2009 (207-85)
AMERICAN COMPENSATION INSURANCE COMPANY n/a 45934 n/a R, C 09-1967 & 09-1755 3/4/09 & 2/26/09 4/1/2009 & W/D $0 $0> PLAZA INSURANCE COMPANY n/a 30945 n/a R 09-1969 3/4/2009 4/1/2009 $0 $034 NETHERLANDS INSURANCE COMPANY (THE) Liberty Mutual Group 24171 0111 R, C 09-2521 & 08-14562 3/24/09 & 12/9/08 4/7/2009 & 5/19/2009 $3,866,253 $550,76535 PEERLESS INDEMNITY INSURANCE COMPANY Liberty Mutual Group 18333 0111 R 09-2522 3/24/2009 4/7/2009 $8,255,310 $1,486,98836 PEERLESS INSURANCE COMPANY Liberty Mutual Group 24198 0111 R 09-2523 3/24/2009 4/7/2009 $5,381,371 $701,77837 STARNET INSURANCE COMPANY WR Berkley Corp Group 40045 0098 R, C 09-5558 & 09-5865 7/15/09 & 7/27/09 7/24/2009 & 7/21/2010 $0 $038 ALLMERICA FINANCIAL BENEFIT INSURANCE COMPANY The Hanover Ins Group 41840 0088 R, C 09-6358 & 09-6486 8/14/09 & 8/25/09 9/15/2009 & 7/20/2010 $339,055 $039 MASSACHUSETTS BAY INSURANCE COMPANY The Hanover Ins Group 22306 0088 R, C 09-6359 & 09-6488 8/14/09 & 8/25/09 9/15/2009 & 6/17/2010 $143,808 $040 COMPANION PROPERTY AND CASUALTY INSURANCE CO n/a 12157 n/a R, C 09-6998 & 09-4427 9/10/09 & 6/02/09 9/29/2009 & 11/30/2009 $47,515,863 $0
ACCIDENT FUND GENERAL INSURANCE COMPANY Blue Cross / Shield of MI 12304 n/a R, C 09-8098 & 09-7826 10/20/09 & 10/09/09 11/12/2009 & W/D $0 $0ACCIDENT FUND NATIONAL INSURANCE COMPANY Blue Cross / Shield of MI 12305 n/a R, C 09-8099 & 09-7822 10/20/09 & 10/09/09 11/12/2009 & W/D $0 $0
41 SENECA INSURANCE COMPANY, INC. Fairfax Financial 10936 0158 R 09-8378 10/30/2009 1/26/2010 $0 $042 SEQUOIA INSURANCE COMPANY JP Morgan Chase & Co Grp 22985 0009 R, C 09-8942 & 09-5119 11/20/09 & 7/01/09 12/12/2009 & 10/08/2009 $38,650,138 $043 CITIZENS INSURANCE COMPANY OF AMERICA The Hanover Ins Group 31534 0088 R, C 09-9117 & 09-8843 11/30/09 & 11/18/09 12/24/2009 & 7/20/2010 $23,335 $044 HANOVER AMERICAN INSURANCE COMPANY (THE) The Hanover Ins Group 36064 0088 R, C 09-9118 & 09-8132 11/30/09 & 10/21/09 12/24/2009 & 9/21/2010 $2,673,168 $0
2010 (220-82)
45 SENTINEL INSURANCE COMPANY, LTD. n/a 11000 n/a R 10-1750 2/25/2010 3/4/2010 $5,606,64146 NATIONAL CASUALTY COMPANY n/a 11991 n/a R 10-3029 4/26/2010 5/18/2010 $361,23947 PHARMACISTS MUTUAL INSURANCE COMPANY n/a 13714 n/a R, C 10-4434 & 09-7692 6/10/10 & 10/06/09 8/1/2010 & 11/19/2010 $117,69348 BERKLEY NATIONAL INSURANCE COMPANY WR Berkley Corp Group 38911 0098 R, C 10-5035 & 10-5014 7/09/10 & 7/12/10 8/19/2010 & 1/03/2011 $049 REPUBLIC UNDERWRITERS INSURANCE COMPANY Delek Group 24538 3489 R, C 10-8548 & 08-10845 12/01/10 & 7/30/08 12/16/2010 & 1/26/2009 $050 DENTISTS INSURANCE COMPANY (THE) n/a 40975 n/a R, C 10-9202 & 10-8234 12/21/10 & 11/17/10 1/11/2011 & 1/26/2011 $051 SPARTA AMERICAN INSURANCE COMPANY Sparta Group 10079 4702 R 10-9532 12/23/2010 1/19/2011 $0
2011 (TBD-TBD)
52 RLI INSURANCE COMPANY RLI Insurance Group 13056 0783 R 11-2191 3/3/2011 3/25/2011
53 WESCO INSURANCE COMPANY Amtrust Group 25011 2538 R 11-2488 3/11/2011 3/25/2011
54 TECHNOLOGY INSURANCE COMPANY, INC. Amtrust Group 42376 2538 R 11-2689 3/16/2011 3/30/2011
CRUM & FORSTER INDEMNITY COMPANY Fairfax Financial 31348 0158 R 11-3047 3/30/2011 W/D
PROCENTURY INSURANCE COMPANY Meadowbrook Ins Group 21903 0748 R 11-4400 5/13/2011 W/D
> HDI-GERLING AMERICA INSURANCE COMPANY Hannover Group 41313 0517 R, C 11-5724 & 11-4927 6/30/11 & 6/8/11 9/20/2011 & PENDING
55 CRUM & FORSTER INDEMNITY COMPANY Fairfax Financial 31348 0158 R 11-7391 8/26/2011 11/1/2011
> PLAZA INSURANCE COMPANY State Auto Mutual Group 30945 0175 R,C 11-7883 & 11-6725 9/7/11 & 8/11/11 10/10/2011 & PENDING
56 STATE NATIONAL INSURANCE COMPANY, INC. State National Group 12831 0093 R 11-8016 9/22/2011 11/1/2011
57 STARR INDEMNITY & LIABILITY COMPANY Starr Group 38318 4670 R 11-8713 10/19/2011 11/14/2011
58 NORTH POINTE INSURANCE COMPANY QBE Insurance Group Ltd 27740 0796 R 11-8717 10/20/2011 11/14/2011
59 QBE INSURANCE CORPORATION QBE Insurance Group Ltd 39217 0796 R 11-8718 10/20/2011 11/14/2011
> STONINGTON INSURANCE COMPANY QBE Insurance Group Ltd 10340 0796 R 11-9798 12/2/2011 PENDING
LEGEND - TYPE OF FILING COLUMN
R = initial rate filing (Rate Filing Bureau) $704,416,386 $559,298,184 $694,923,715 $769,115,765 $810,103,953C = certificate of authority, or amended certificate of authority filing (Corporate Affairs Bureau-Legal) 2010 2009 2008 2007 2006
700C = Insurance Code 700(c) Surplus Review & Business Plan for companies already licensed (Financial Analysis Division)
* = already licensed & re-entering the market
LEGEND - OTHER COLUMNS
> = at least one application still pending at time of report (not yet authorized to write WC)
W/D = WITHDRAWN

1
WCIRBCalifornia®
California Workers’ Compensation Insurance Market Update
Presented by:Dave Bellusci & Kate Smith
WCIRB of California
DWC 19th Annual Educational ConferenceLos Angeles February 23-24, 2012
Oakland March 5-6, 2012
WCIRBCalifornia®
Agenda
• Insurer Results
• WCIRB Rate Filings
• Experience Rating Plan Changes

2
WCIRBCalifornia®
16.315.2
11.3
8.97.6
6.6 7.17.7
0
5
10
15
20
25
2004 2005 2006 2007 2008 2009 2010 2011
$ Billions
Calendar Year
Written PremiumNet of Deductible Credits
Estimated
WCIRBCalifornia®
6.29
5.49
4.36
2.85
2.30 2.16 2.29 2.32 2.37
0.00
2.00
4.00
6.00
8.00
7/03-12/03 7/04-12/04 7/05-12/05 7/06-12/06 7/07-12/07 2008 2009 2010 1/11 - 9/11
$ Dollars
Policy Year
Average Insurer Rateper $100 of Payroll
3
WCIRBCalifornia®
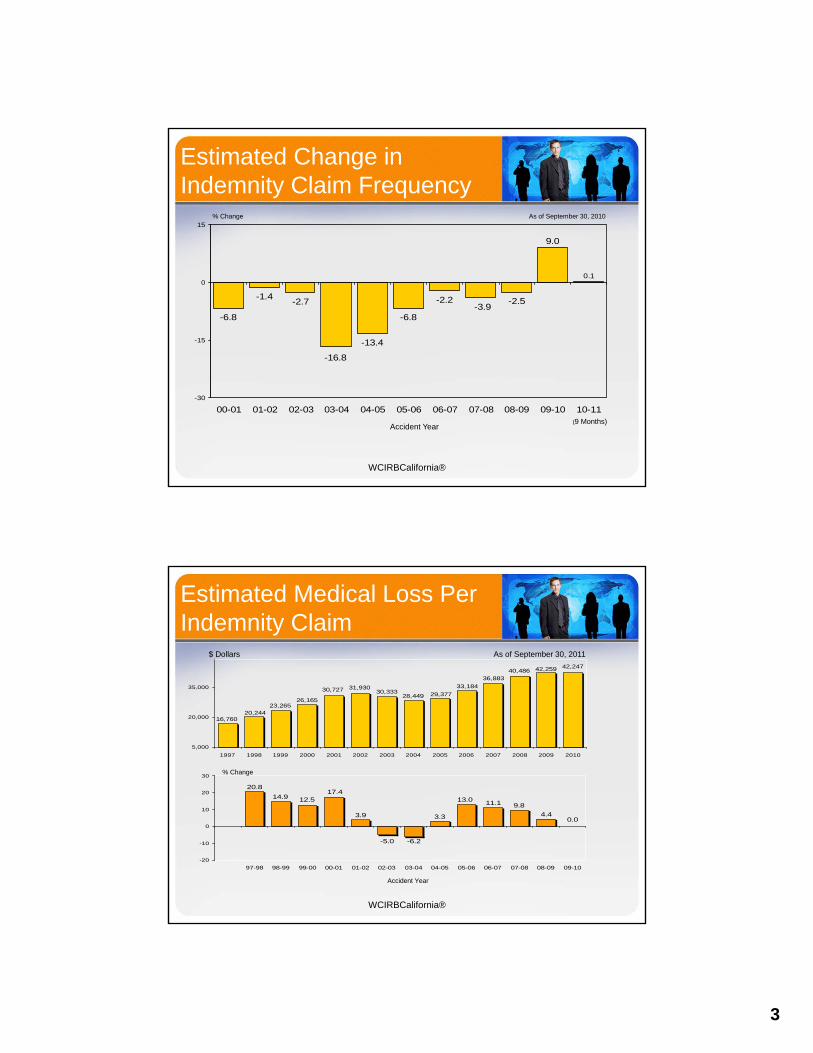
Estimated Change in Indemnity Claim Frequency
-6.8
-1.4-2.7
-13.4
-6.8
-2.5
9.0
0.1
-16.8
-2.2-3.9
-30
-15
0
15
00-01 01-02 02-03 03-04 04-05 05-06 06-07 07-08 08-09 09-10 10-11
% Change As of September 30, 2010
Accident Year(9 Months)
WCIRBCalifornia®
42,24742,259
30,727
26,16523,265
20,24416,760
31,93030,333
28,449 29,377
33,184
36,88340,486
5,000
20,000
35,000
1997 1998 1999 2000 2001 2002 2003 2004 2005 2006 2007 2008 2009 2010
-5.0
0.03.3
-6.2
3.9
17.4
4.4
9.811.112.514.9
20.8
13.0
-20
-10
0
10
20
30
97-98 98-99 99-00 00-01 01-02 02-03 03-04 04-05 05-06 06-07 07-08 08-09 09-10
Estimated Medical Loss Per Indemnity Claim
$ Dollars As of September 30, 2011
% Change
Accident Year

4
WCIRBCalifornia®
Permanent Disability Benefits
• California Among the Most Costly States Pre-Reform
• Reforms Reduced PD Benefit Costs by Two-Thirds
• Ogilvie and Almaraz/Guzman Decisions – Allow deviation from 2005 Permanent Disability Schedule
– Increase potential subjectivity & inconsistency
– WCIRB original estimates 5.8% overall cost estimate
– Early indication of impact on settlements and average ratings not inconsistent with original estimate
WCIRBCalifornia®
Average PD Ratings from USR 2nd Reports
14.614.3
14.1
15.0
20.1
22.723.3
22.922.1
21.120.520.1
17.117.7
18.7
10
15
20
25
1994 1995 1996 1997 1998 1999 2000 2001 2002 2003 2004 2005 2006 2007 2008
Accident Year

5
WCIRBCalifornia®
130%141%
126%107%
83%
53%34% 31%
41%58%
74%85% 84%
24%21%
21%
18%
14%
12%12%
15%
18%
23% 24%
22%22%
20%
16%
15%
14% 14%
16%
18%
20%
22%
9% 10%
22%
18%
0%
50%
100%
150%
200%
98 99 00 01 02 03 04 05 06 07 08 09 10
Other Expenses
LAE
Losses
Accident Year Combined Loss and Expense Ratios
As of September 30, 2011
Accident Year
130%130%
112%
91%
69%
55%57%
80%
113%
143%
167%
184%176%
WCIRBCalifornia®
12.7
-11.5
3.1
12.614.2 10.513.1
15.215.414.913.912.6
10.210.416.4
14.2
4.6 5.2
-7.3
7.0
-20
-10
0
10
20
01 02 03 04 05 06 07 08 09 10
Fortune Magazine - All Industry
Total All Lines All States
California Workers' Compensation
Average Return on Net Worth
%
10-Year Arithmetic Average Return
California Workers’ Compensation 4.6%
Fortune Magazine – All Industry 12.9%
Total P & C All Lines All States 5.62%
Calendar Year
Source: NAIC Report on Profitability in 2010

6
WCIRBCalifornia®
WCIRB Filing - Average Rates Per $100 of Payroll
$2.15$2.30$2.38
$3.27
$2.37$2.33
$1.00
$2.00
$3.00
WCIRBProposed
Average PurePremium Rate
1/1/11
WCIRBProposed
Average PurePremium Rate
1/1/12
IndustryAverage FiledPure Premium
Rate 7/1/11
IndustryAverage Manual
Rate 7/1/11
IndustryAverage
Charged Rate1/1/11 to3/31/11
ApprovedAverage PurePremium Rate
1/1/12
Rate per $100 of payroll
WCIRBCalifornia®
Experience Rating Plan Changes
• 2010 Changes– New primary/excess split
– New B and W values
• 2011 Changes – “No Loss Rating” shown on each rate sheet
– Explanatory summary with each rate sheet
• 2012 Changes – New formula & rate sheet format
• 2013 Changes – Updated credibility values and threshold

1
State Fund Proprietary and Confidential –DO NOT COPY OR REPRODUCE
1
Tom ClarkChief Operating Officer
State Fund Proprietary and Confidential –DO NOT COPY OR REPRODUCE
2
Making Workers' Compensation Profitable Is Unlikely For U.S. Property/Casualty Insurers
STANDARD &POOR'S FINANCIAL SERVICES LLC ("S&PZZ-L") – Making
Workers' Compensation Profitable Is Unlikely - For U.S. Property/Casualty
Insurers, Report Says:
• Continued high unemployment in the U.S., a sluggish economic recovery, potential for higher inflation on future claims payments, adverse reserve developments, and a volatile investment environment with historic low investment yields could add up to many years of unprofitability for the workers‘ compensation industry.
• The workers' compensation industry's reserves will remain inadequate over the next few years, in our view. We expect many insurers with meaningful concentration in workers' compensation to strengthen their prior year reserves, especially for accident years 2007-2010.

2
State Fund Proprietary and Confidential –DO NOT COPY OR REPRODUCE
3
Premium Growth No Panacea
New report from KBW expects loss cost trends to negate any
growth in premiums.
Insurance Networking News, January 24, 2012
• The soft market has persisted for so long it would be easy to see firming rates as a cure all for the industry’s economic woes.
• “We expect loss cost trends to closely follow rate increases, resulting in little improvement in underwriting results. We expect our coverage universe to split into the haves and have-nots. Any rising tide around rates will not benefit everyone equally.”
State Fund Proprietary and Confidential –DO NOT COPY OR REPRODUCE
4
CA workers’ compensation market update
• We continue to believe that the market is underpriced, as increases in loss costs have outpaced pricing changes
• No significant changes in market pricing have been observed, modest upward pressure, but in line with loss cost inflation.
• Either prices will go up, loss costs will go down, or some combination of the two (eventually anyway…)
• In summary current industry results bear similar resemblance to early 2000 results. But investment income is lagging.

3
State Fund Proprietary and Confidential –DO NOT COPY OR REPRODUCE
5
CALIF WC MARKET SHARE BY TYPE OF INSURER
Market Share by Type of Insurer
(Written Premium Prior to Deductible Credits)
70 71 7367
6258 60
63 6368 70
73 75
11 11 7
2
26
5
815
1414
1314
19 18 20
3136 36 35
2922
18 16 1411
0%
10%
20%
30%
40%
50%
60%
70%
80%
90%
100%
1998 1999 2000 2001 2002 2003 2004 2005 2006 2007 2008 2009 2010
National Insurers California Insurers State Fund Source: WCIRB Data
During Soft Market – National Insurers Have 70%+ of Market
Soft Market Soft Market
State Fund Proprietary and Confidential –DO NOT COPY OR REPRODUCE
6
CALIF VS COUNTRYWIDE WC RESULTS
WC Loss Plus LAE Ratio
California and Nationwide
25
50
75
100
125
150
175
1998 1999 2000 2001 2002 2003 2004 2005 2006 2007 2008 2009 2010
California
Nationwide
Source: WCIRB Data,
Conning Library
• CA WC Results More Volatile
• Much Higher Peaks / Lower Troughs
Similar gap now as early 2000’s

4
State Fund Proprietary and Confidential –DO NOT COPY OR REPRODUCE
7
CALIF WC PRICING INDUSTRY VS STATE FUND
Pricing Relative to WCIRB Advisory Pure Premium:
State Fund and Private Insurers
0.500
0.750
1.000
1.250
1.500
1.750
2.000
2.250
2.500
2.750
1998 1999 2000 2001 2002 2003 2004 2005 2006 2007 2008 2009 2010 2011
SCIF Private Insurers Source: WCIRB Data
•State Fund Increasing Pricing & Industry Is Not.
•State Fund LR Improves to 75% while Industry LR deteriorates
State Fund Proprietary and Confidential –DO NOT COPY OR REPRODUCE
8
Reported Loss Ratios are Underestimated
• Proforma ultimate loss ratios based on– Assumption that 2009 loss ratio is
reasonable– Loss costs increased in 2010 and 2011
by 7% per year, while prices plus wage inflation increased by 3% and 4%, thereby deteriorating loss ratio
Accident Year Ultimate Loss Ratios
71%
75%
69%
56%
74%
88%
91%
60%
85%84%
58%
85%
40%
50%
60%
70%
80%
90%
100%
2007 2008 2009 2010 2011
Insurer Reported Ultimate Loss Ratios
WCIRB Ultimate Loss Ratios
Proforma Ultimate Loss Ratios

5
State Fund Proprietary and Confidential –DO NOT COPY OR REPRODUCE
9
CA WC – UNCERTAINTY OF WCIRB ESTIMATES
Loss Ratio:
Initial and Current WCIRB Estimates
25
50
75
100
125
150
1998 1999 2000 2001 2002 2003 2004 2005 2006 2007 2008 2009 2010
Initial Estimate Current Estimate Source: WCIRB Data
• So far not as much volatility in loss ratios now vs late 90’s
State Fund Proprietary and Confidential –DO NOT COPY OR REPRODUCE
10
CA WC LOSS RATIOS
California WC Loss Ratios:
Initial Estimates by Carriers and WCIRB
20
40
60
80
100
120
1998 1999 2000 2001 2002 2003 2004 2005 2006 2007 2008 2009 2010 2011
Initial Carrier Reported LR Initial WCIRB Estimated LR Source: WCIRB Data
This shouldn’t happen…

6
State Fund Proprietary and Confidential –DO NOT COPY OR REPRODUCE
11
State Fund Proprietary and Confidential –DO NOT COPY OR REPRODUCE
CA WC COMBINED RATIOS
Combined Ratio:
Current WCIRB Estimates
130141
126
107
83
53
34 3141
58
7485 84
24
21
21
18
14
12
9 10
12
15
18
23 24
22
22
20
18
16
15
14 14
16
18
20
22 22
176
184
167
143
113
80
57 55
69
91
112
130 130
0
20
40
60
80
100
120
140
160
180
200
1998 1999 2000 2001 2002 2003 2004 2005 2006 2007 2008 2009 2010
Other Expenses
LAE
Loss
Source: WCIRB Data
Combined ratios back to unprofitable levels & increasing
State Fund Proprietary and Confidential –DO NOT COPY OR REPRODUCE
12
CA WC INVESTMENT YIELDS
Investment Yields for CA WC Insurers
And 10 Year Treasury Rates
3.0%
3.5%
4.0%
4.5%
5.0%
5.5%
6.0%
6.5%
1998 1999 2000 2001 2002 2003 2004 2005 2006 2007 2008 2009 2010
Insurer Investment Yields Sample Adjusted Yields 10 Yr Treasury RatesSource: St Louis Fed,
Conning
• Investment yields continue to decline
• Insurance companies will need to generate returns through UW income