californians & their government - courthousenews.com filethe public policy institute of...
TRANSCRIPT

PPIC STATEWIDE SURVEY JANUARY 2019
Californians & Their Government Mark Baldassare Dean Bonner Alyssa Dykman Lunna Lopes
CONTENTS Press Release 3 State Issues 6 National Issues 14 Regional Map 20 Methodology 21 Questionnaire and Results 23
Supported with funding from the James Irvine Foundation and the PPIC Donor Circle

The PPIC Statewide Survey provides a voice for the public and likely voters— informing policymakers, encouraging discussion, and raising awareness on critical issues of the day.
© 2019 Public Policy Institute of California
The Public Policy Institute of California is dedicated to informing and improving public policy in California through independent, objective, nonpartisan research.
PPIC is a public charity. It does not take or support positions on any ballot measures or on any local, state, or federal legislation, nor does it endorse, support, or oppose any political parties or candidates for public office.
Short sections of text, not to exceed three paragraphs, may be quoted without written permission provided that full attribution is given to the source.
Research publications reflect the views of the authors and do not necessarily reflect the views of our funders or of the staff, officers, advisory councils, or board of directors of the Public Policy Institute of California.

PPIC STATEWIDE SURVEY JANUARY 2019
PPIC.ORG/SURVEY Californians and Their Government 3
CONTACT
Steven Bliss 415-291-4412 Abby Cook 415-291-4436
News Release EMBARGOED: Do not publish or broadcast until 9:00 p.m. PST on Wednesday, February 6, 2019.
Para ver este comunicado de prensa en español, por favor visite nuestra página de internet: www.ppic.org/press-release/
PPIC STATEWIDE SURVEY: CALIFORNIANS AND THEIR GOVERNMENT
Most Californians Favor Governor’s First Budget IMMIGRATION SEEN AS TOP ISSUE, FEW SEE BORDER SITUATION AS A CRISIS
SAN FRANCISCO, February 6, 2019—Majorities of Californians support Governor Newsom’s first proposed budget, which increases spending on K–14 education, higher education, and health and human services. This is among the key findings of a statewide survey released today by the Public Policy Institute of California (PPIC).
When read a summary of the governor’s 2019–20 proposed budget, 70 percent of all California adults and 64 percent of likely voters favor the spending plan. Large majorities support two key components of the governor’s proposal: 77 percent of adults and 72 percent of likely voters favor allocating $1.8 billion to expand pre-kindergarten and early childhood programs and facilities, while 78 percent of adults and 70 percent of likely voters support an $832 million funding increase for public colleges and universities.
“Governor Newsom’s first budget proposal is highly popular among Californians, and there is overwhelming support for his plans to increase funding for preschool and higher education,” said Mark Baldassare, PPIC president and CEO.
The survey also asks which of the four major areas of state spending should have the highest priority: K–12 public education, health and human services, higher education, or prisons and corrections. Californians are most likely to choose K–12 education (46%), followed by health and human services (32%), higher education (16%), and prisons and corrections (4%).
Immigration Seen as Top Issue for State Leaders to Address Asked what the most important issue is for the governor and legislature to address in the coming year, more Californians name immigration and illegal immigration (15% adults, 18% likely voters) than any other issue. Additional issues mentioned by more than 5 percent of Californians are education (11% adults, 11% likely voters), jobs and the economy (10% adults, 8% likely voters), the environment (8% adults, 8% likely voters), and homelessness (6% adults, 7% likely voters).
Just 27 percent of Californians say the situation with illegal immigration across the US-Mexico border is a crisis, while 45 percent say it is a serious problem but not a crisis. A similar share of adults nationwide (24%) called the situation a crisis in a January ABC/Washington Post poll.
A strong majority of Californians (69%) oppose building a wall along the entire border with Mexico, while 28 percent favor doing so. Nationwide, a January CNN poll found that a majority of adults (56%) opposed building a wall and 39 percent were in favor.
The survey also asks Californians their views on the state of racial divisions in the US more generally: 45 percent say race relations are worse than they were a year ago, while only 20 percent say they are better and 34 percent say they are about the same. Two-thirds of African Americans (66%) in California

PPIC STATEWIDE SURVEY JANUARY 2019
PPIC.ORG/SURVEY Californians and Their Government 4
say race relations are getting worse, as do 45 percent of both Latinos and whites and 38 percent of Asian Americans.
“Building a wall along the US-Mexico border continues to be an unpopular idea, while many Californians say that the state of race relations in America has gotten worse in the last year,” Baldassare said.
Most Blame President, Republicans in Congress for Shutdown Most Californians believe President Trump and Republicans in Congress were primarily responsible for the recent partial shutdown of the federal government. A strong majority (64%) say the president and Republicans in Congress were responsible, compared with just 24 percent saying Democrats in Congress were responsible. Nationwide, 53 percent of adults blamed Trump and Republicans, while 29 percent blamed Democrats, according to a January ABC/Washington Post poll.
Majority Are Optimistic Governor, Legislature Can Work Together Two-thirds of Californians (67% adults, 65% likely voters) are optimistic that the new governor and the legislature will be able to work together and accomplish a lot in the next year. Majorities of Democrats (79%) and independents (59%) believe Governor Newsom and the legislature will be able to work together, as do 44 percent of Republicans.
“In the wake of the election, there are sky-high expectations that Governor Newsom and the Democratic-controlled legislature will be able to work together and accomplish a lot in 2019,” Baldassare said.
With Newsom in office for less than a month, 44 percent of adults and 43 percent of likely voters approve of the way he is handling his job, while 33 percent of adults and 29 percent of likely voters say they don’t know or have not heard enough to have an opinion yet. This is similar to Governor Brown’s approval rating when he took office in January 2011 (41% adults, 47% likely voters).
As the 2019–20 legislative session gets underway, about half of adults (49%) and 46 percent of likely voters approve of the way the California Legislature is handling its job. This is similar to the legislature’s approval rating from last January (51% adults, 50% likely voters).
When asked who should make the tough choices involved in the state budget this year, overwhelming majorities of Californians (77% adults, 78% likely voters) want voters to make some of the decisions. This is consistent with the large share of Californians—always at least three in four—expressing this view on PPIC surveys since 2011.
Mixed Views on “Split Roll” Change to Proposition 13 Proposition 13, which limits property taxes in California, is viewed favorably, with 61 percent of adults and 64 percent of likely voters saying it has been mostly a good thing for the state. A ballot measure eligible for the 2020 ballot would ease the strict limits that Proposition 13 places on commercial property taxes without changing its provisions for residential properties. Californians are divided on having commercial properties taxed according to their current market value. Slightly less than half (47%) favor this change, 43 percent oppose, and 10 percent don’t know. Likely voters hold similar views: 49 percent favor the change, 43 percent oppose, and 8 percent don’t know. A majority of Democrats approve (58%), while 49 percent of independents and 37 percent of Republicans do.
“Majorities of Californians continue to say that Proposition 13 has been a good thing for California, while the split roll property tax reform draws mixed reviews across party lines,” Baldassare said.
The survey also asks about Californians’ understanding of state finances. Asked to name the largest source of state revenue, a third (33% adults, 34% likely voters) correctly say personal income taxes.

PPIC STATEWIDE SURVEY JANUARY 2019
PPIC.ORG/SURVEY Californians and Their Government 5
Optimism about Direction of State, Pessimism about Nation A majority of Californians are optimistic about where the state is headed, with 55 percent of adults and 51 percent of likely voters saying things are going in the right direction. However, views vary across racial/ethnic groups and party affiliations. Majorities of Asian Americans (71%), Latinos (62%), and African Americans (57%), but less than half of whites (47%), believe California is going in the right direction. More than three-fourths of Democrats (79%) hold this view, while far fewer independents (41%) and Republicans (18%) do.
In contrast with overall optimism about where the state is headed, Californians are pessimistic about the direction of the country. Slightly less than a third of adults (30%) and likely voters (29%) say things are going in the right direction nationally. There is dramatic variation across racial/ethnic groups. Only 6 percent of African Americans in California say things in the US are going in the right direction, far less than among whites (30%), Latinos (32%), and Asian Americans (37%). A majority of Republicans (57%), but far fewer independents (30%) and Democrats (15%), say the country is headed in the right direction.
Record-Low Expectations of Trump, Congress Working Together As President Trump starts his third year in office, only 30 percent of California adults and 36 percent of likely voters approve of how he is handling his job. Just 34 percent of adults and 23 percent of likely voters approve of Congress.
With Democrats now controlling the House of Representatives, a record-low 25 percent of California adults, and even fewer likely voters (18%), say President Trump and Congress will be able to work together and accomplish a lot this year. Still, when asked about political divisions among Americans more generally, a majority of Californians (58%) are optimistic that people of different political views can work out their differences.
Just under half of adults (48%) and 50 percent of likely voters approve of how House Speaker Nancy Pelosi is handling her job. This is higher than House Minority Leader Kevin McCarthy’s job approval rating (32% adults, 28% likely voters). However, 38 percent of adults and 36 percent of likely voters say they don’t know or have not heard enough about McCarthy to have an opinion yet.
“As further evidence of the political fallout from the federal government shutdown, expectations for the president and Congress working together have never been lower,” Baldassare said. “Californians are much more likely to approve of Speaker Pelosi than President Trump or Minority Leader McCarthy.”
Most Expect Some Changes from New Democratic Majority in House While Californians are generally pessimistic about where the country is headed, many expect that Democratic control of the US House of Representatives will bring some change to how things are going. Two-thirds of adults (66%) think that the Democrats gaining a House majority in the midterm elections will lead to either a lot of change (28%) or some change (38%) in the way things are going in the country. Majorities across parties expect some change, but Democrats (81%) are far more likely than independents (59%) and Republicans (58%) to expect change.

PPIC STATEWIDE SURVEY JANUARY 2019
PPIC.ORG/SURVEY Californians and Their Government 6
State Issues
Key Findings Forty-four percent of Californians approve
of Governor Newsom’s job performance, while three in ten do not have an opinion yet; 49 percent approve of the state legislature. (page 7)
Californians name immigration or illegal immigration (15%) as the top issue for the governor and legislature to address this year. Two in three (67%) are optimistic that the governor and legislature will be able to work together and accomplish a lot in the next year. (page 8)
Fifty-five percent of Californians say that the state is generally headed in the right direction; half (49%) expect good economic times in the next year. (page 9)
Just 16 percent of Californians say that K–12 education is the top area of state spending; 33 percent correctly identify personal income taxes as the top revenue source. (page 10)
Forty-six percent of adults say K–12 education should be the state’s highest spending priority. Three in four would prefer that voters —rather than elected officials—make some of the decisions about spending and taxes. (page 11)
Four in ten Californians think the state budget situation is a big problem. When read a summary of the governor’s proposed 2019–20 budget, 70 percent of adults and 64 percent of likely voters are in favor. Three in four favor the governor’s early childhood and higher education funding plans. (page 12)
Six in ten Californians say Proposition 13 has been mostly a good thing. Forty-seven percent favor a split roll property tax. (page 13)
4449
23
37
0
20
40
60
80
100
Governor Newsom California Legislature
Perc
ent a
ll ad
ults
ApproveDisapprove
Approval ratings of state elected officials
7077 78
22 22 20
0
20
40
60
80
100
Governor's overallbudget proposal
$1.8 billion for earlychildhood programs
$832 million forhigher education
Perc
ent a
ll ad
ults
FavorOppose
Support for General Fund spending proposals
47
43
0
20
40
60
80
100
Perc
ent a
ll ad
ults
Favor
Oppose
Support for a split roll property tax

PPIC STATEWIDE SURVEY JANUARY 2019
PPIC.ORG/SURVEY Californians and Their Government 7
Approval Ratings of State Elected Officials With Gavin Newsom in office less than a month, a plurality of Californians (44% adults, 43% likely voters) say they approve of the way that he is handling his job as governor, while about three in ten say they do not know or haven’t heard enough to have an opinion yet. Governor Brown’s approval rating was similar when he entered office in January 2011 (41% adults, 47% likely voters). Today, a majority of Democrats (63%) but fewer independents (37%) and Republicans (16%) approve of Governor Newsom. A majority in the San Francisco Bay Area (52%) approve, compared to fewer in other regions. Majorities of Asian Americans (53%), African Americans (52%), and Latinos (51%)—and fewer than half of whites (37%)—approve.
“Overall, from what you know so far, do you approve or disapprove of the way that Gavin Newsom is handling his job as governor of California?”
Approve Disapprove Have not heard
enough (volunteered)
Don’t know
All adults 44% 23% 23% 10%
Likely voters 43 29 21 8
Party
Democrats 63 9 21 7
Republicans 16 59 19 6
Independents 37 30 22 11
Region
Central Valley 38 29 23 10
Inland Empire 36 19 31 14
Los Angeles 46 16 24 13
Orange/San Diego 41 31 22 7
San Francisco Bay Area 52 17 23 7 As the 2019–20 legislative session begins, 49 percent of adults and 46 percent of likely voters approve of the way the California Legislature is handling its job. Californians’ approval of the state legislature was similar in December (47% adults, 43% likely voters) and last January (51% adults, 50% likely voters). Today, a majority of Democrats (69%) approve, while fewer independents (38%) and Republicans (22%) approve. Majorities in the San Francisco Bay Area (55%) and Los Angeles (54%) approve, compared to fewer in other regions. Majorities of Asian Americans (64%), African Americans (60%), and Latinos (57%) approve of the way that the legislature is handling its job, compared to fewer whites (38%).
“Overall, do you approve or disapprove of the way that the California Legislature is handling its job?”
Approve Disapprove Don’t know
All adults 49% 37% 14%
Likely voters 46 43 11
Party
Democrats 69 18 13
Republicans 22 74 5
Independents 38 50 12
Region
Central Valley 44 44 12
Inland Empire 40 45 15
Los Angeles 54 30 16
Orange/San Diego 48 44 8
San Francisco Bay Area 55 26 19

PPIC STATEWIDE SURVEY JANUARY 2019
PPIC.ORG/SURVEY Californians and Their Government 8
Top Issues, Prospects of State Leaders Working Together in 2019 Californians name immigration and illegal immigration (15% adults, 18% likely voters) as the most important issue for the governor and legislature to work on in 2019. Other issues that were each mentioned by more than 5 percent of Californians include education (11% adults, 11% likely voters), jobs and the economy (10% adults, 8% likely voters), the environment (8% adults, 8% likely voters), and homelessness (6% adults, 7% likely voters).
Last January, Californians were about as likely as they are today to name immigration (20% adults, 23% likely voters), jobs and the economy (9% adults, 8% likely voters), and education, schools, and teachers (8% adults, 7% likely voters) as the most important issues for the governor and legislature to work on. The proportion of Californians who mention the state budget (5% adults, 8% likely voters) as the most important issue for state leaders to work on is similar to last January (7% adults, 9% likely voters).
Across regions, immigration is mentioned most frequently in the Central Valley, Orange/San Diego, and the San Francisco Bay Area. Los Angeles residents are the most likely to mention education, while Inland Empire residents mention immigration, jobs and the economy, and education equally often. Across parties, immigration is mentioned most often by Republicans (36%) and education is mentioned most often by Democrats (14%); independents are equally likely to mention education (14%) and immigration (14%).
“Which one issue facing California today do you think is the most important for the governor and state legislature to work on in 2019?”
Top 5 issues All adults
Region Likely voters Central
Valley Inland Empire
Los Angeles
Orange/ San Diego
San Francisco Bay Area
Immigration, illegal immigration 15% 22% 11% 13% 15% 14% 18%
Education, schools, teachers 11 11 11 16 9 11 11
Jobs, economy 10 7 11 13 10 9 8 Environment, pollution, global warming 8 3 4 8 13 9 8
Homelessness 6 5 7 6 4 7 7
In the 2018 election, the Democrats maintained control of the governor’s office and gained legislative seats, giving them more than a two-thirds majority in both the state senate and assembly. Two in three Californians (67% adults, 65% likely voters) say they think that Governor Newsom and the state legislature will be able to work together and accomplish a lot in the next year. Californians were slightly less likely to hold this view in January 2018 (60% adults, 58% likely voters); fewer held this view when Governor Brown entered office in January 2011 (58% adults, 52% likely voters). Today, majorities of Democrats (79%) and independents (59%)—and fewer Republicans (44%)—hold this view. At least six in ten across regions and across age, education, gender, income, and racial/ethnic groups expect that Governor Newsom and the state legislature will be able to work together and accomplish a lot in 2019.
“Do you think that Governor Newsom and the state legislature will be able to work together and accomplish a lot in the next year, or not?”
All adults
Party Likely voters Dem Rep Ind
Yes, will be able to 67% 79% 44% 59% 65%
No, will not be able to 22 11 45 27 25
Don’t know 11 10 10 14 10

PPIC STATEWIDE SURVEY JANUARY 2019
PPIC.ORG/SURVEY Californians and Their Government 9
State of the State Majorities of adults (55%) and likely voters (51%) say that things in California are generally going in the right direction. Californians had similar perceptions in December (54% adults, 50% likely voters) and last January (57% adults, 54% likely voters). Today, a majority of Democrats (79%) say that things in California are going in the right direction; far fewer independents (41%) and Republicans (18%) hold this view. Six in ten in the San Francisco Bay Area (64%) and Los Angeles (61%) say things are going in the right direction, compared to fewer in other regions. Majorities of Asian Americans (71%), Latinos (62%), and African Americans (57%)—and fewer whites (47%)—think that California is generally going in the right direction.
“Do you think things in California are generally going in the right direction or the wrong direction?” Right direction Wrong direction Don’t know
All adults 55% 40% 5%
Likely voters 51 45 3
Party
Democrats 79 17 4
Republicans 18 79 3
Independents 41 55 4
Region
Central Valley 51 44 5
Inland Empire 47 50 4
Los Angeles 61 35 4
Orange/San Diego 50 45 5
San Francisco Bay Area 64 28 8
About half of adults (49%) and 45 percent of likely voters say that the state will have good times financially during the next 12 months. Californians had similar perceptions in December (46% adults, 46% likely voters), while more had optimistic views last January (56% adults, 56% likely voters). Today, a majority of Democrats (54%)—and fewer independents (42%) and Republicans (35%)—are optimistic. A majority in the San Francisco Bay Area (56%) are optimistic, while fewer hold this view in other regions. Majorities of Latinos (60%) and Asian Americans (53%) expect good times, compared to fewer whites (42%) and African Americans (41%).
“Turning to economic conditions in California, do you think that during the next 12 months we will have good times financially or bad times?”
Good times Bad times Don’t know
All adults 49% 42% 9%
Likely voters 45 45 10
Party
Democrats 54 37 9
Republicans 35 57 8
Independents 42 47 11
Region
Central Valley 45 45 10
Inland Empire 43 50 8
Los Angeles 50 40 10
Orange/San Diego 49 45 6
San Francisco Bay Area 56 32 11

PPIC STATEWIDE SURVEY JANUARY 2019
PPIC.ORG/SURVEY Californians and Their Government 10
Knowledge of the State Budget On January 10, Governor Newsom proposed a 2019–20 state budget that includes approximately $144.2 billion in General Fund expenditures. About 90 percent of General Fund spending in the proposed budget is allocated for K–12 public education (40.7%, $58.7 billion), health and human services (28.0%, $40.3 billion), higher education (11.9%, $17.2 billion), and corrections and rehabilitation (8.7%, $12.5 billion). When asked to identify the largest area of state spending, about one in three name either health and human services (35% adults, 35% likely voters) or prisons and corrections (33% adults, 32% likely voters); fewer name K–12 public education (16% adults, 20% likely voters) and about one in ten say higher education (10% adults, 8% likely voters). The perception of K–12 public education has been similar in our other January surveys in this decade (16% 2010, 2011, 2012; 17% 2014; 15% 2015, 2016; 16% 2017; 16% today) and has not risen above 30 percent since we began asking this question in May 2005. Today, the perception that K–12 public education is the largest spending area is similar among Democrats (18%), Republicans (18%), and independents (20%). Across demographic groups, awareness is highest among whites (19%), college graduates (20%), men (20%), those 55 and older (18%), and those with annual incomes of $80,000 or more (20%).
“I’m going to name some of the largest areas for state spending. Please tell me the one that represents the most spending in the state budget.”
All adults
Party Likely voters Dem Rep Ind
Health and human services 35% 26% 48% 38% 35%
Prisons and corrections 33 38 22 31 32
K–12 public education 16 18 18 20 20
Higher education 10 13 5 8 8
Don’t know 5 4 7 3 4 When it comes to identifying the largest state revenue source, 33 percent of adults and 34 percent of likely voters correctly choose the personal income tax. The share of adults identifying the personal income tax has been similar in our January surveys since 2010 (28% 2010; 29% 2011, 2012; 26% 2014; 33% 2015; 33% today). Today, fewer than one in four say sales taxes (23% adults, 22% likely voters), corporate taxes (22% adults, 24% likely voters), or motor vehicle fees (17% adults, 15% likely voters). About one in three Republicans (35%), Democrats (32%), and independents (32%) correctly identify personal income tax as the state’s top revenue source. Regionally, awareness is highest in Orange/San Diego (42%) and lowest in the Central Valley and Los Angeles (29% each). Awareness is highest among Asian Americans (40%), college graduates (38%), those under 35 (35%), and those with incomes over $80,000 (41%). Only 8 percent of adults and 9 percent of likely voters identify both K–12 public education and the personal income tax as the top spending and revenue areas.
“I’m going to name some of the largest areas for state revenues. Please tell me the one that represents the most revenue for the state budget.”
All adults
Party Likely voters Dem Rep Ind
Personal income tax 33% 32% 35% 32% 34%
Sales tax 23 25 18 25 22
Corporate tax 22 24 26 22 24
Motor vehicle fees 17 15 14 15 15
Don’t know 5 4 8 5 5
PPIC STATEWIDE SURVEY JANUARY 2019
PPIC.ORG/SURVEY Californians and Their Government 11
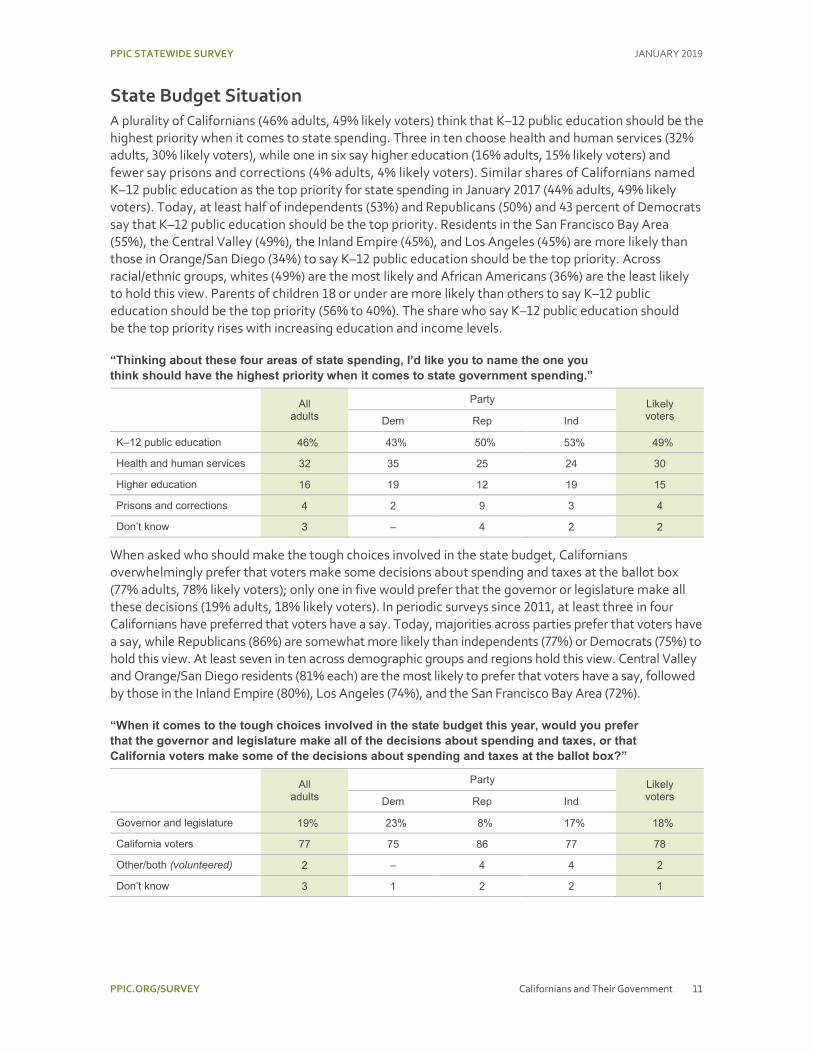
State Budget Situation A plurality of Californians (46% adults, 49% likely voters) think that K–12 public education should be the highest priority when it comes to state spending. Three in ten choose health and human services (32% adults, 30% likely voters), while one in six say higher education (16% adults, 15% likely voters) and fewer say prisons and corrections (4% adults, 4% likely voters). Similar shares of Californians named K–12 public education as the top priority for state spending in January 2017 (44% adults, 49% likely voters). Today, at least half of independents (53%) and Republicans (50%) and 43 percent of Democrats say that K–12 public education should be the top priority. Residents in the San Francisco Bay Area (55%), the Central Valley (49%), the Inland Empire (45%), and Los Angeles (45%) are more likely than those in Orange/San Diego (34%) to say K–12 public education should be the top priority. Across racial/ethnic groups, whites (49%) are the most likely and African Americans (36%) are the least likely to hold this view. Parents of children 18 or under are more likely than others to say K–12 public education should be the top priority (56% to 40%). The share who say K–12 public education should be the top priority rises with increasing education and income levels.
“Thinking about these four areas of state spending, I’d like you to name the one you think should have the highest priority when it comes to state government spending.”
All adults
Party Likely voters Dem Rep Ind
K–12 public education 46% 43% 50% 53% 49%
Health and human services 32 35 25 24 30
Higher education 16 19 12 19 15
Prisons and corrections 4 2 9 3 4
Don’t know 3 – 4 2 2 When asked who should make the tough choices involved in the state budget, Californians overwhelmingly prefer that voters make some decisions about spending and taxes at the ballot box (77% adults, 78% likely voters); only one in five would prefer that the governor or legislature make all these decisions (19% adults, 18% likely voters). In periodic surveys since 2011, at least three in four Californians have preferred that voters have a say. Today, majorities across parties prefer that voters have a say, while Republicans (86%) are somewhat more likely than independents (77%) or Democrats (75%) to hold this view. At least seven in ten across demographic groups and regions hold this view. Central Valley and Orange/San Diego residents (81% each) are the most likely to prefer that voters have a say, followed by those in the Inland Empire (80%), Los Angeles (74%), and the San Francisco Bay Area (72%).
“When it comes to the tough choices involved in the state budget this year, would you prefer that the governor and legislature make all of the decisions about spending and taxes, or that California voters make some of the decisions about spending and taxes at the ballot box?”
All adults
Party Likely voters Dem Rep Ind
Governor and legislature 19% 23% 8% 17% 18%
California voters 77 75 86 77 78
Other/both (volunteered) 2 – 4 4 2
Don’t know 3 1 2 2 1

PPIC STATEWIDE SURVEY JANUARY 2019
PPIC.ORG/SURVEY Californians and Their Government 12
Governor’s Proposed Budget When he unveiled his 2019–20 proposed state budget on January 10, Governor Newsom estimated a one-time surplus of $21.5 billion for the state. Nonetheless, 40 percent of Californians say the state budget situation is a big problem. Similar shares of Californians (43%) held this view last January. Across parties, 69 percent of Republicans say the budget situation is a big problem, while fewer independents (45%) and Democrats (26%) say the same. Regionally, Inland Empire residents (48%) are the most likely to hold this view (42% Orange/San Diego, 38% San Francisco Bay Area, 37% Central Valley, 37% Los Angeles).
“Do you think the state budget situation in California—that is, the balance between government spending and revenues—is a big problem, somewhat of a problem, or not a problem for the people of California today?
All adults
Party Likely voters Dem Rep Ind
Big problem 40% 26% 69% 45% 43%
Somewhat of a problem 38 52 23 38 38
Not a problem 18 20 6 14 16
Don’t know 4 3 2 3 3 Governor Newsom’s budget proposes increased spending on K–14, higher education, and health and human services. It would allocate $4 billion to eliminate budgetary debts and reverse the deferrals of past decades, as well as $1.8 billion in additional funds to bring the rainy day fund to $15.3 billion. After being read a brief description, 70 percent of Californians and 64 percent of likely voters are in favor. Most Democrats (83%) and six in ten independents (62%) favor the plan; one in three Republicans (35%) hold this view. Majorities across regions and demographic groups favor the budget plan, but support is lower in Orange/San Diego (60%) and among whites (61%), those 55 and older (63%), and those with household incomes more than $80,000 (64%). Among those who call the state budget situation a big problem, 52 percent are in favor of the governor’s budget proposal.
“In general, do you favor or oppose the governor’s budget plan?”*
All adults
Party Likely voters Dem Rep Ind
Favor 70% 83% 35% 62% 64%
Oppose 22 9 54 30 26
Don’t know/haven’t heard anything about the budget 8 7 10 9 10
*For complete question text, see p. 24. As part of his budget plan, the governor proposes allocating $1.8 billion to expand pre-kindergarten and early childhood programs and facilities. After hearing a brief description of this proposal, more than seven in ten adults (77%) and likely voters (72%) are in favor. Democrats (89%) are much more likely than independents (70%) and Republicans (47%) to favor this proposal. More than two in three across regions and demographic groups are in favor.
Governor Newsom also proposed an increase of $832 million for public colleges and universities, including policies aimed at increasing enrollment and degree completion, a tuition freeze, and two free years of community college for first-time, full-time students. After hearing a brief description of the governor’s higher education funding proposal, 78 percent of adults and 70 percent of likely voters favor it. Again, Democrats (91%) are much more likely than independents (67%) and Republicans (46%) to be in favor. More than two in three across regions and demographic groups hold this view.
PPIC STATEWIDE SURVEY JANUARY 2019
PPIC.ORG/SURVEY Californians and Their Government 13
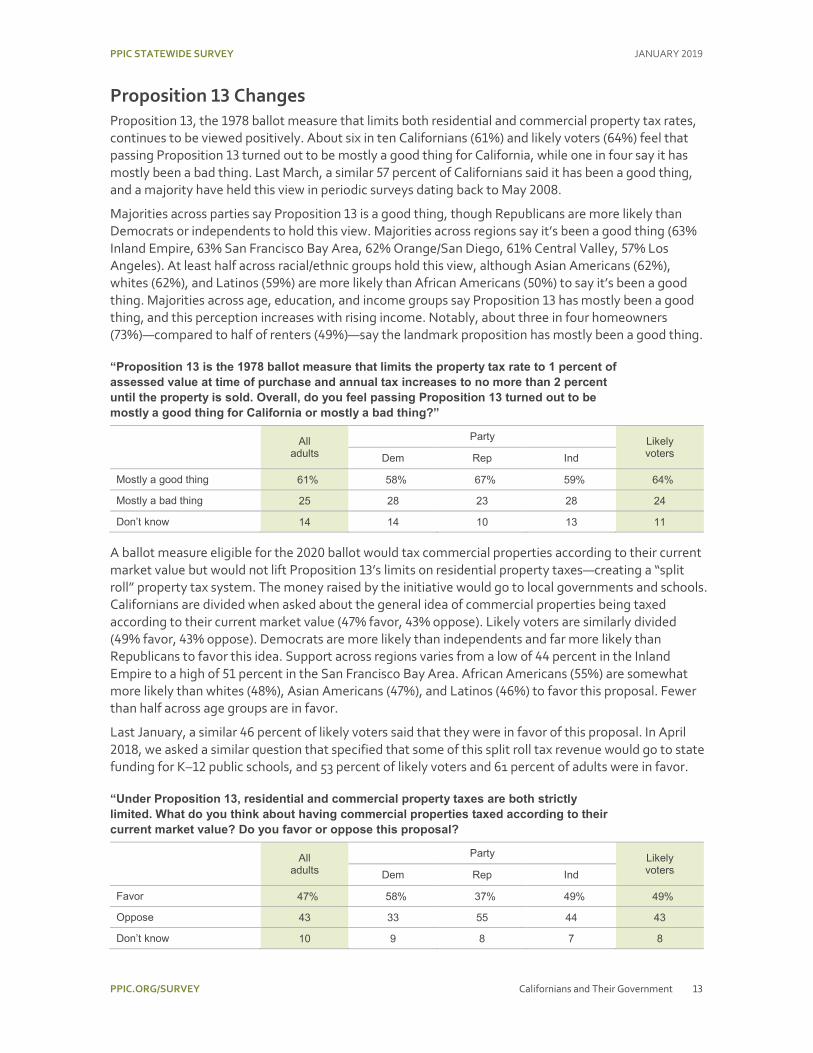
Proposition 13 Changes Proposition 13, the 1978 ballot measure that limits both residential and commercial property tax rates, continues to be viewed positively. About six in ten Californians (61%) and likely voters (64%) feel that passing Proposition 13 turned out to be mostly a good thing for California, while one in four say it has mostly been a bad thing. Last March, a similar 57 percent of Californians said it has been a good thing, and a majority have held this view in periodic surveys dating back to May 2008.
Majorities across parties say Proposition 13 is a good thing, though Republicans are more likely than Democrats or independents to hold this view. Majorities across regions say it’s been a good thing (63% Inland Empire, 63% San Francisco Bay Area, 62% Orange/San Diego, 61% Central Valley, 57% Los Angeles). At least half across racial/ethnic groups hold this view, although Asian Americans (62%), whites (62%), and Latinos (59%) are more likely than African Americans (50%) to say it’s been a good thing. Majorities across age, education, and income groups say Proposition 13 has mostly been a good thing, and this perception increases with rising income. Notably, about three in four homeowners (73%)—compared to half of renters (49%)—say the landmark proposition has mostly been a good thing.
“Proposition 13 is the 1978 ballot measure that limits the property tax rate to 1 percent of assessed value at time of purchase and annual tax increases to no more than 2 percent until the property is sold. Overall, do you feel passing Proposition 13 turned out to be mostly a good thing for California or mostly a bad thing?”
All adults
Party Likely voters Dem Rep Ind
Mostly a good thing 61% 58% 67% 59% 64%
Mostly a bad thing 25 28 23 28 24
Don’t know 14 14 10 13 11
A ballot measure eligible for the 2020 ballot would tax commercial properties according to their current market value but would not lift Proposition 13’s limits on residential property taxes—creating a “split roll” property tax system. The money raised by the initiative would go to local governments and schools. Californians are divided when asked about the general idea of commercial properties being taxed according to their current market value (47% favor, 43% oppose). Likely voters are similarly divided (49% favor, 43% oppose). Democrats are more likely than independents and far more likely than Republicans to favor this idea. Support across regions varies from a low of 44 percent in the Inland Empire to a high of 51 percent in the San Francisco Bay Area. African Americans (55%) are somewhat more likely than whites (48%), Asian Americans (47%), and Latinos (46%) to favor this proposal. Fewer than half across age groups are in favor.
Last January, a similar 46 percent of likely voters said that they were in favor of this proposal. In April 2018, we asked a similar question that specified that some of this split roll tax revenue would go to state funding for K–12 public schools, and 53 percent of likely voters and 61 percent of adults were in favor.
“Under Proposition 13, residential and commercial property taxes are both strictly limited. What do you think about having commercial properties taxed according to their current market value? Do you favor or oppose this proposal?
All adults
Party Likely voters Dem Rep Ind
Favor 47% 58% 37% 49% 49%
Oppose 43 33 55 44 43
Don’t know 10 9 8 7 8

PPIC STATEWIDE SURVEY JANUARY 2019
PPIC.ORG/SURVEY Californians and Their Government 14
National Issues
Key Findings Three in ten Californians approve of
President Trump’s job performance, while 34 percent approve of Congress. Twenty-five percent of Californians—a record low in PPIC surveys—think President Trump and Congress will be able to work together and accomplish a lot in the next year. (page 15)
About half of Californians (48%) approve of House Speaker Pelosi. Thirty-two percent approve of House Minority Leader McCarthy, while about four in ten do not have an opinion of him yet. (page 16)
Two in three Californians say that Democratic control of the US House of Representatives will lead to a lot (28%) or some (38%) change to the way things are going in the country. Three in ten say the country is headed in the right direction. (page 17)
Sixty-four percent of Californians say Trump and Republicans in Congress were responsible for the federal government shutdown. Twenty-seven percent say the situation with illegal immigration at the border is a crisis. A majority of Californians (69%) oppose building a wall along the border with Mexico. (page 18)
A majority of Californians (58%) are optimistic that Americans of different political views can come together and work out their differences. Forty-five percent of adults perceive race relations as having gotten worse in America over the last year. (page 19)
30
34
0
20
40
60
80
100
Perc
ent a
ll ad
ults
President Trump
US Congress
Approval ratings of federal elected officials
28
39
69
56
0
20
40
60
80
100
Californians Adults nationwide*
Perc
ent
all a
dults
Favor
Oppose
Support for a wall along the border with Mexico
45
66
3845 45
0
20
40
60
80
100
All adults AfricanAmericans
AsianAmericans
Latinos Whites
Perc
ent
Belief that race relations in the United States are worse than they were a year ago
*January 2019, CNN

PPIC STATEWIDE SURVEY JANUARY 2019
PPIC.ORG/SURVEY Californians and Their Government 15
Approval Ratings of Federal Elected Officials As President Trump begins his third year in office, just three in ten Californians and 36 percent of likely voters say they approve of the way that he is handling his job as president, while about two in three say they disapprove (67% adults, 62% likely voters). President Trump’s approval rating was similar when he first entered office in January 2017 (30% adults, 34% likely voters). Today, a strong majority of Republicans (77%) approve of President Trump, while solid majorities of Democrats (89%) and independents (60%) disapprove. Majorities across all regions disapprove of the way Donald Trump is handling his job, as do majorities across all racial/ethnic groups (96% African Americans, 75% Latinos, 64% Asian Americans, 59% whites). In a recent Gallup poll, 37 percent of adults nationwide approved of the president, while 59 percent disapproved.
As the 116th US Congress commences with the Democrats in control of the House of Representatives and the US Senate remaining under Republican control, only a third of Californians (34%) approve of the way Congress is handling its job. Approval of Congress is even lower among likely voters, with only 23 percent saying they approve. Approval of the US Congress was similar in December (29% adults, 20% likely voters) and lower last January (21% adults, 15% likely voters). Today, majorities across parties and regions disapprove of the way Congress is handling its job. Across racial/ethnic groups, Latinos (50%) and Asian Americans (41%) are more likely than African Americans (25%) and whites (21%) to approve of the way Congress is handling its job. In a recent Gallup poll, only 20 percent of adults nationwide approved of Congress, while 75 percent disapproved.
“Overall, do you approve or disapprove of the way…?”
All adults
Party Likely voters Dem Rep Ind
Donald Trump is handling his job as president
Approve 30% 9% 77% 38% 36%
Disapprove 67 89 20 60 62
Don't know 3 2 3 2 2
The US Congress is handling its job
Approve 34 32 21 25 23
Disapprove 59 64 75 70 72
Don't know 7 4 4 5 5
With the Democrats now controlling the House of Representatives, a record-low one in four Californians (25%) and even fewer likely voters (18%) say they think that President Trump and the US Congress will be able to work together and accomplish a lot in the next year. Californians held similar views in January 2018 (29% adults, 27% likely voters) but were more optimistic in January 2017, when President Trump first took office (50% adults, 55% likely voters). Today, majorities across parties do not think that the president and Congress will be able to work together and accomplish a lot in the coming year. Indeed, strong majorities across regions and demographic groups are pessimistic about the prospect of the president and Congress working together and accomplishing a lot in the next year.
“Do you think that President Trump and the US Congress will be able to work together and accomplish a lot in the next year, or not?”
All adults
Party Likely voters Dem Rep Ind
Yes, will be able to 25% 13% 37% 19% 18%
No, will not be able to 72 84 59 78 79
Don’t know 3 3 3 3 3
PPIC STATEWIDE SURVEY JANUARY 2019
PPIC.ORG/SURVEY Californians and Their Government 16
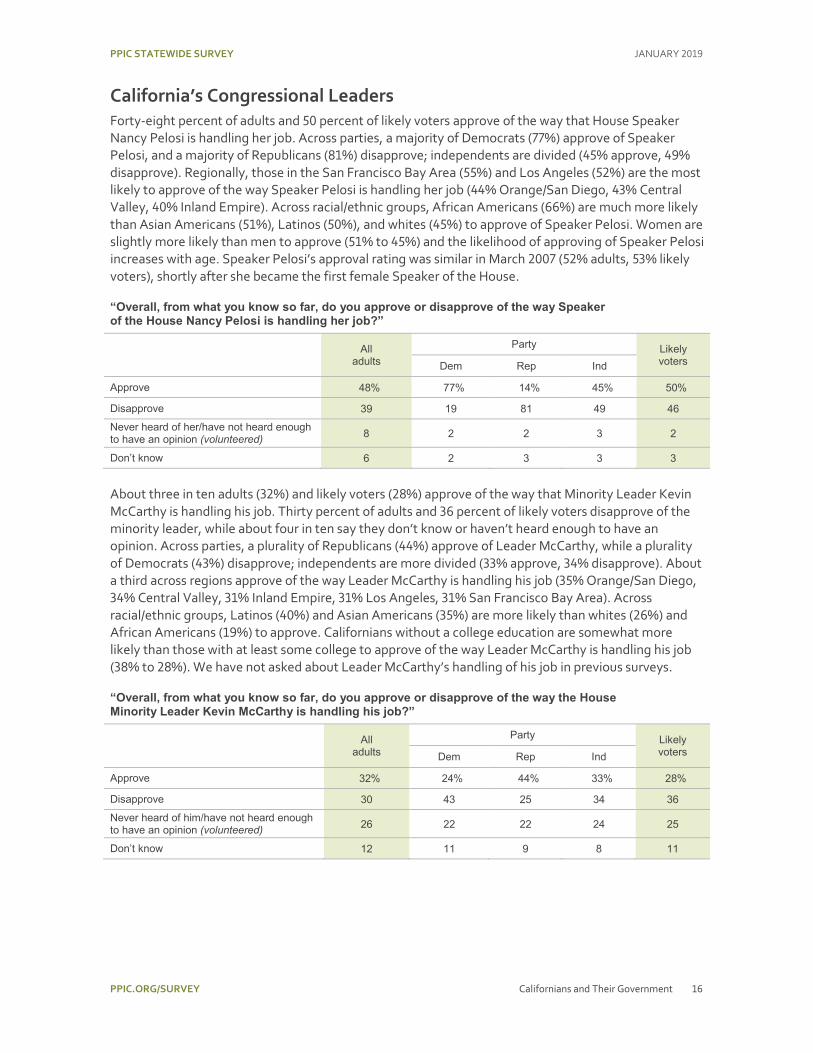
California’s Congressional Leaders Forty-eight percent of adults and 50 percent of likely voters approve of the way that House Speaker Nancy Pelosi is handling her job. Across parties, a majority of Democrats (77%) approve of Speaker Pelosi, and a majority of Republicans (81%) disapprove; independents are divided (45% approve, 49% disapprove). Regionally, those in the San Francisco Bay Area (55%) and Los Angeles (52%) are the most likely to approve of the way Speaker Pelosi is handling her job (44% Orange/San Diego, 43% Central Valley, 40% Inland Empire). Across racial/ethnic groups, African Americans (66%) are much more likely than Asian Americans (51%), Latinos (50%), and whites (45%) to approve of Speaker Pelosi. Women are slightly more likely than men to approve (51% to 45%) and the likelihood of approving of Speaker Pelosi increases with age. Speaker Pelosi’s approval rating was similar in March 2007 (52% adults, 53% likely voters), shortly after she became the first female Speaker of the House.
“Overall, from what you know so far, do you approve or disapprove of the way Speaker of the House Nancy Pelosi is handling her job?”
All adults
Party Likely voters Dem Rep Ind
Approve 48% 77% 14% 45% 50%
Disapprove 39 19 81 49 46 Never heard of her/have not heard enough to have an opinion (volunteered) 8 2 2 3 2
Don’t know 6 2 3 3 3
About three in ten adults (32%) and likely voters (28%) approve of the way that Minority Leader Kevin McCarthy is handling his job. Thirty percent of adults and 36 percent of likely voters disapprove of the minority leader, while about four in ten say they don’t know or haven’t heard enough to have an opinion. Across parties, a plurality of Republicans (44%) approve of Leader McCarthy, while a plurality of Democrats (43%) disapprove; independents are more divided (33% approve, 34% disapprove). About a third across regions approve of the way Leader McCarthy is handling his job (35% Orange/San Diego, 34% Central Valley, 31% Inland Empire, 31% Los Angeles, 31% San Francisco Bay Area). Across racial/ethnic groups, Latinos (40%) and Asian Americans (35%) are more likely than whites (26%) and African Americans (19%) to approve. Californians without a college education are somewhat more likely than those with at least some college to approve of the way Leader McCarthy is handling his job (38% to 28%). We have not asked about Leader McCarthy’s handling of his job in previous surveys.
“Overall, from what you know so far, do you approve or disapprove of the way the House Minority Leader Kevin McCarthy is handling his job?”
All adults
Party Likely voters Dem Rep Ind
Approve 32% 24% 44% 33% 28%
Disapprove 30 43 25 34 36 Never heard of him/have not heard enough to have an opinion (volunteered) 26 22 22 24 25
Don’t know 12 11 9 8 11
PPIC STATEWIDE SURVEY JANUARY 2019
PPIC.ORG/SURVEY Californians and Their Government 17
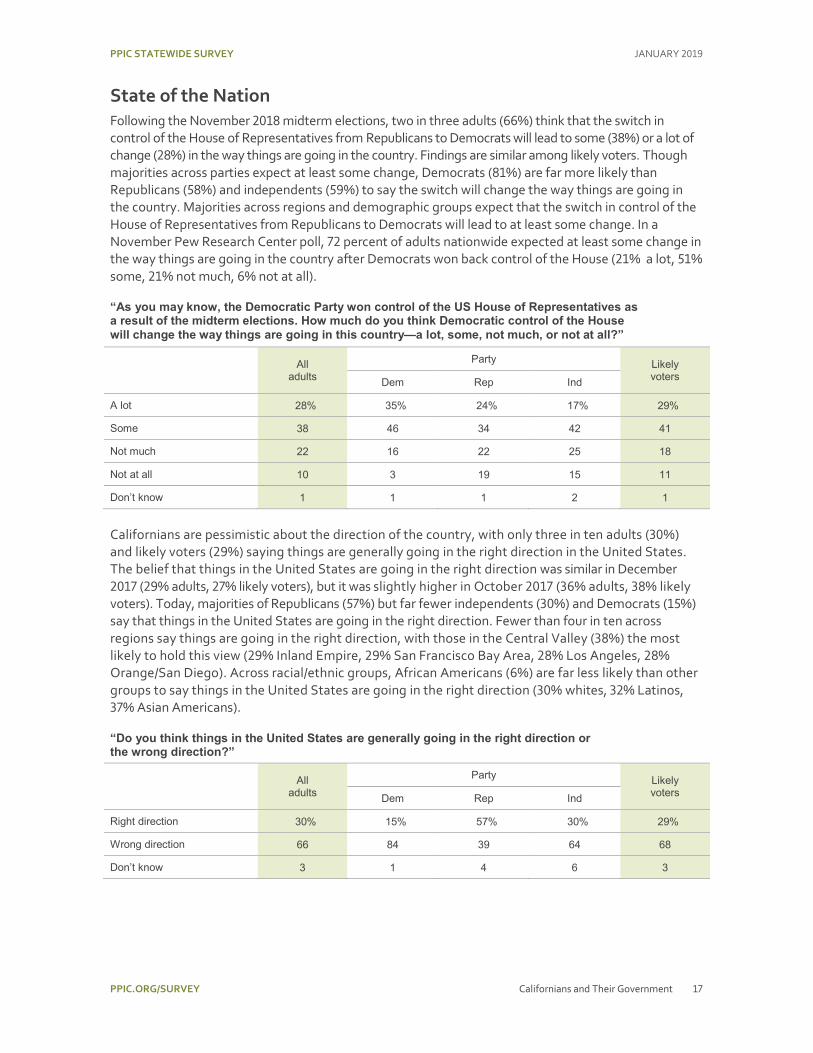
State of the Nation Following the November 2018 midterm elections, two in three adults (66%) think that the switch in control of the House of Representatives from Republicans to Democrats will lead to some (38%) or a lot of change (28%) in the way things are going in the country. Findings are similar among likely voters. Though majorities across parties expect at least some change, Democrats (81%) are far more likely than Republicans (58%) and independents (59%) to say the switch will change the way things are going in the country. Majorities across regions and demographic groups expect that the switch in control of the House of Representatives from Republicans to Democrats will lead to at least some change. In a November Pew Research Center poll, 72 percent of adults nationwide expected at least some change in the way things are going in the country after Democrats won back control of the House (21% a lot, 51% some, 21% not much, 6% not at all).
“As you may know, the Democratic Party won control of the US House of Representatives as a result of the midterm elections. How much do you think Democratic control of the House will change the way things are going in this country—a lot, some, not much, or not at all?”
All adults
Party Likely voters Dem Rep Ind
A lot 28% 35% 24% 17% 29%
Some 38 46 34 42 41
Not much 22 16 22 25 18
Not at all 10 3 19 15 11
Don’t know 1 1 1 2 1
Californians are pessimistic about the direction of the country, with only three in ten adults (30%) and likely voters (29%) saying things are generally going in the right direction in the United States. The belief that things in the United States are going in the right direction was similar in December 2017 (29% adults, 27% likely voters), but it was slightly higher in October 2017 (36% adults, 38% likely voters). Today, majorities of Republicans (57%) but far fewer independents (30%) and Democrats (15%) say that things in the United States are going in the right direction. Fewer than four in ten across regions say things are going in the right direction, with those in the Central Valley (38%) the most likely to hold this view (29% Inland Empire, 29% San Francisco Bay Area, 28% Los Angeles, 28% Orange/San Diego). Across racial/ethnic groups, African Americans (6%) are far less likely than other groups to say things in the United States are going in the right direction (30% whites, 32% Latinos, 37% Asian Americans).
“Do you think things in the United States are generally going in the right direction or the wrong direction?”
All adults
Party Likely voters Dem Rep Ind
Right direction 30% 15% 57% 30% 29%
Wrong direction 66 84 39 64 68
Don’t know 3 1 4 6 3

PPIC STATEWIDE SURVEY JANUARY 2019
PPIC.ORG/SURVEY Californians and Their Government 18
Partial Government Shutdown Sixty-four percent of Californians say that President Trump and Republicans in Congress were mainly responsible for the shutdown, while 24 percent say Democrats in Congress were mainly responsible. We began interviewing survey respondents on January 20 and thus were able to interview Californians during and after the shutdown. The findings were similar during the shutdown (63% Trump and Republicans, 26% Democrats) and once it had ended (66% Trump and Republicans, 23% Democrats). Overall, nearly nine in ten Democrats blame Trump and Republicans in Congress, while seven in ten Republicans blame Democrats in Congress. Half of independents think Trump and Republicans were responsible (33% say Democrats). Whites are the least likely across racial/ethnic groups to say Trump and Republicans were responsible. The share saying Trump and Republicans were responsible declines with rising age and income, and is higher among women than men. In a January ABC/Washington Post poll, 53 percent of adults nationwide blamed Trump and congressional Republicans (29% blamed Democrats).
“As you may know, the federal government was partially shut down because Donald Trump and Republicans in Congress and Democrats in Congress could not agree on laws about border security. Who do you think was mainly responsible for this situation—Trump and Republicans in Congress or Democrats in Congress?”*
All adults
Party Race/Ethnicity
Dem Rep Ind African Americans
Asian Americans Latinos Whites
Trump and Republicans in Congress 64% 87% 16% 52% 76% 67% 75% 56%
Democrats in Congress 24 6 71 33 9 24 13 34
Both (volunteered) 8 4 10 12 13 5 9 8
Neither (volunteered) 1 1 1 1 – 2 – 1
Don't know 2 2 1 2 2 2 3 2 *Question wording was changed on January 25. For complete question text, see p. 26.
When asked about the situation with illegal immigration across the US-Mexico border, 27 percent of Californians call it a crisis, 45 percent say it is a serious problem but not a crisis, and 27 percent say it is not a serious problem. Fifty-eight percent of Republicans call the situation a crisis, compared to just 14 percent of Democrats and 28 percent of independents. Across regions and demographic groups, no more than one in three Californians say the situation is a crisis. Similar shares of adults nationwide (24%) called the situation a crisis in the January ABC/Washington Post poll.
“Do you think the situation with illegal immigration across the US-Mexico border is currently a crisis, a serious problem but not a crisis, or not a serious problem?”
All adults
Party Race/Ethnicity
Dem Rep Ind African Americans
Asian Americans Latinos Whites
A crisis 27% 14% 58% 28% 21% 17% 24% 32%
A serious problem but not a crisis 45 44 30 47 48 52 50 38
Not a serious problem 27 41 11 24 27 30 25 29
Don't know 1 1 – 1 4 1 1 1 When asked about building a wall along the entire border with Mexico, most Californians (69%) are opposed (28% favor). In seven periodic surveys dating back to May 2016, fewer than three in ten have favored building a wall. Today, three in four Republicans are in favor, but support among other partisans and across regions and demographic groups fails to eclipse 40 percent. In a January CNN poll, 56 percent of adults nationwide opposed the wall and 39 percent were in favor.

PPIC STATEWIDE SURVEY JANUARY 2019
PPIC.ORG/SURVEY Californians and Their Government 19
Political and Racial Divisions In a rancorous political environment and on the heels of a historic government shutdown, most Californians (58%) continue to feel optimistic that Americans of different political views can still come together and work out their differences (40% pessimistic). Findings were nearly identical in September 2017 (56% optimistic, 40% pessimistic).
About half of Democrats, Republicans, and independents are optimistic, as are about six in ten residents across regions (56% Inland Empire, 57% Los Angeles, 57% San Francisco Bay Area, 58% Orange/San Diego, 61% Central Valley). Optimism varies across racial/ethnic groups, with African Americans and Latinos more optimistic than Asian Americans and whites. Optimism declines as educational attainment and household income increases.
“These days, do you feel optimistic or pessimistic that Americans of different political views can still come together and work out their differences?”
All adults
Party Race/Ethnicity
Dem Rep Ind African Americans
Asian Americans Latinos Whites
Optimistic 58% 52% 49% 52% 70% 56% 67% 49%
Pessimistic 40 44 50 44 27 42 29 49
Don't know 3 4 2 4 3 2 4 2
When it comes to race relations in the United States today, a plurality of Californians say things are worse than they were a year ago, while a third say things are about the same and one in five say things are better than they were a year ago. In September 2017, findings were similar (14% better, 35% about the same, 49% worse).
Most Democrats and nearly half of independents say race relations are worse today, while a plurality of Republicans say they are about the same as a year ago. Notably, two in three African Americans and pluralities of Latinos, whites, and Asian Americans say that race relations in the United States are worse than they were a year ago. The belief that race relations are worse than they were a year ago is also held by pluralities across regions. Women (54%) are much more likely than men (35%) to say that things are worse. Pluralities across age, education, and income groups say things are worse off than they were a year ago.
“What is your opinion with regard to race relations in the United States today? Would you say things are better, about the same, or worse than they were a year ago?”
All adults
Party Race/Ethnicity
Dem Rep Ind African Americans
Asian Americans Latinos Whites
Better 20% 15% 28% 19% 9% 25% 21% 17%
About the same 34 28 42 32 24 35 33 37
Worse 45 57 28 47 66 38 45 45
Don't know 1 1 2 1 1 2 1 1

PPIC STATEWIDE SURVEY JANUARY 2019
PPIC.ORG/SURVEY Californians and Their Government 20
Regional Map
PPIC STATEWIDE SURVEY JANUARY 2019
PPIC.ORG/SURVEY Californians and Their Government 21
Methodology The PPIC Statewide Survey is directed by Mark Baldassare, president and CEO and survey director at the Public Policy Institute of California, with assistance from survey research associate Alyssa Dykman, project manager for this survey, associate survey director Dean Bonner, and survey research associate Lunna Lopes. The Californians and Their Government is supported with funding from the James Irvine Foundation and the PPIC Donor Circle. The PPIC Statewide Survey invites input, comments, and suggestions from policy and public opinion experts and from its own advisory committee, but survey methods, questions, and content are determined solely by PPIC’s survey team.
Findings in this report are based on a survey of 1,707 California adult residents, including 1,195 interviewed on cell phones and 512 interviewed on landline telephones. Interviews took an average of 18 minutes to complete. Interviewing took place on weekend days and weekday nights from January 20–29, 2019.
Cell phone interviews were conducted using a computer-generated random sample of cell phone numbers. All cell phone numbers with California area codes were eligible for selection. Once a cell phone user was reached, it was verified that this person was age 18 or older, a resident of California, and in a safe place to continue the survey (e.g., not driving). Cell phone respondents were offered a small reimbursement to help defray the cost of the call. Cell phone interviews were conducted with adults who have cell phone service only and with those who have both cell phone and landline service in the household.
Landline interviews were conducted using a computer-generated random sample of telephone numbers that ensured that both listed and unlisted numbers were called. All landline telephone exchanges in California were eligible for selection. Once a household was reached, an adult respondent (age 18 or older) was randomly chosen for interviewing using the “last birthday method” to avoid biases in age and gender.
For both cell phones and landlines, telephone numbers were called as many as eight times. When no contact with an individual was made, calls to a number were limited to six. Also, to increase our ability to interview Asian American adults, we made up to three additional calls to phone numbers estimated by Survey Sampling International as likely to be associated with Asian American individuals.
Live landline and cell phone interviews were conducted by Abt Associates in English and Spanish, according to respondents’ preferences. Accent on Languages, Inc., translated new survey questions into Spanish, with assistance from Renatta DeFever.
Abt Associates uses the US Census Bureau’s 2012–2016 American Community Survey’s (ACS) Public Use Microdata Series for California (with regional coding information from the University of Minnesota’s Integrated Public Use Microdata Series for California) to compare certain demographic characteristics of the survey sample—region, age, gender, race/ethnicity, and education—with the characteristics of California’s adult population. The survey sample was closely comparable to the ACS figures. To estimate landline and cell phone service in California, Abt Associates used 2016 state-level estimates released by the National Center for Health Statistics—which used data from the National Health Interview Survey (NHIS) and the ACS. The estimates for California were then compared against landline and cell phone service reported in this survey. We also used voter registration data from the California Secretary of State to compare the party registration of registered voters in our sample to party registration statewide. The landline and cell phone samples were then integrated using a frame integration weight, while sample balancing adjusted for differences across regional, age, gender, race/ethnicity, education, telephone service, and party registration groups.

PPIC STATEWIDE SURVEY JANUARY 2019
PPIC.ORG/SURVEY Californians and Their Government 22
The sampling error, taking design effects from weighting into consideration, is ±3.3 percent at the 95 percent confidence level for the total unweighted sample of 1,707 adults. This means that 95 times out of 100, the results will be within 3.3 percentage points of what they would be if all adults in California were interviewed. The sampling error for unweighted subgroups is larger: for the 1,440 registered voters, the sampling error is ±3.5 percent; for the 1,154 likely voters, it is ±4.0 percent. Sampling error is only one type of error to which surveys are subject. Results may also be affected by factors such as question wording, question order, and survey timing.
We present results for five geographic regions, accounting for approximately 90 percent of the state population. “Central Valley” includes Butte, Colusa, El Dorado, Fresno, Glenn, Kern, Kings, Madera, Merced, Placer, Sacramento, San Joaquin, Shasta, Stanislaus, Sutter, Tehama, Tulare, Yolo, and Yuba Counties. “San Francisco Bay Area” includes Alameda, Contra Costa, Marin, Napa, San Francisco, San Mateo, Santa Clara, Solano, and Sonoma Counties. “Los Angeles” refers to Los Angeles County, “Inland Empire” refers to Riverside and San Bernardino Counties, and “Orange/San Diego” refers to Orange and San Diego Counties. Residents of other geographic areas are included in the results reported for all adults, registered voters, and likely voters, but sample sizes for these less populous areas are not large enough to report separately.
We present results for non-Hispanic whites, who account for 42 percent of the state’s adult population, and also for Latinos, who account for about a third of the state’s adult population and constitute one of the fastest-growing voter groups. We also present results for non-Hispanic Asian Americans, who make up about 15 percent of the state’s adult population, and non-Hispanic African Americans, who comprise about 6 percent. Results for other racial/ethnic groups—such as Native Americans—are included in the results reported for all adults, registered voters, and likely voters, but sample sizes are not large enough for separate analysis. Results for African American and Asian American likely voters are combined with those of other racial/ethnic groups because sample sizes for African American and Asian American likely voters are too small for separate analysis. We compare the opinions of those who report they are registered Democrats, registered Republicans, and decline-to-state or independent voters; the results for those who say they are registered to vote in other parties are not large enough for separate analysis. We also analyze the responses of likely voters—so designated per their responses to survey questions about voter registration, previous election participation, intentions to vote this year, attention to election news, and current interest in politics.
The percentages presented in the report tables and in the questionnaire may not add to 100 due to rounding.
We compare current PPIC Statewide Survey results to those in our earlier surveys and to those in national surveys by ABC/Washington Post, CNN, Gallup, and the Pew Research Center. Additional details about our methodology can be found at www.ppic.org/wp-content/uploads/SurveyMethodology.pdfand are available upon request through [email protected].

PPIC STATEWIDE SURVEY JANUARY 2019
PPIC.ORG/SURVEY Californians and Their Government 23
Questionnaire and Results CALIFORNIANS AND THEIR GOVERNMENT
January 20–29, 2019 1,707 California Adult Residents: English, Spanish
MARGIN OF ERROR ±3.3% AT 95% CONFIDENCE LEVEL FOR TOTAL SAMPLE PERCENTAGES MAY NOT ADD TO 100 DUE TO ROUNDING
First, which one issue facing California today do you think is the most important for the governor and state legislature to work on in 2019?
[code, don’t read]
15% immigration, illegal immigration 11 education, schools, teachers 10 jobs, economy 8 environment, pollution, global
warming 6 homelessness
5 government in general, problems with elected officials, parties
5 health care, health insurance 5 housing costs, availability 5 state budget, deficit, taxes 4 infrastructure 3 crime, gangs, drugs 2 water, drought 13 other (specify) 8 don’t know
Overall, from what you know so far, do you approve or disapprove of the way that Gavin Newsom is handling his job as governor of California?
44% approve 23 disapprove 23 have not heard enough to have an
opinion (volunteered) 10 don’t know
Overall, do you approve or disapprove of the way that the California Legislature is handling its job?
49% approve 37 disapprove 14 don’t know
Do you think that Governor Newsom and the state legislature will be able to work together and accomplish a lot in the next year, or not?
67% yes, will be able to work together 22 no, will not be able to work together 11 don’t know
Do you think things in California are generally going in the right direction or the wrong direction?
55% right direction 40 wrong direction 5 don’t know
Turning to economic conditions in California, do you think that during the next 12 months we will have good times financially or bad times?
49% good times 42 bad times 9 don’t know
[rotate questions 7 and 8]
I’m going to name some of the largest areas for state spending. Please tell me the one that represents the most spending in the state budget. [rotate] (1) K–12 public education, (2) higher education, (3) health and human services, [or] (4) prisons and corrections.
16% K–12 public education 10 higher education 35 health and human services 33 prisons and corrections 5 don’t know
PPIC STATEWIDE SURVEY JANUARY 2019
PPIC.ORG/SURVEY Californians and Their Government 24
I’m going to name some of the largest areas for state revenues. Please tell me the one that represents the most revenue for the state budget. [rotate] (1) personal income tax, (2) sales tax, (3) corporate tax, [or] (4) motor vehicle fees.
33% personal income tax 23 sales tax 22 corporate tax 17 motor vehicle fees 5 don’t know
Thinking about these four areas of state spending, I’d like you to name the one you think should have the highest priority when it comes to state government spending, [rotate in same order as Q7] (1) K–12 public education, (2) higher education, (3) health and human services, [or] (4) prisons and corrections.
46% K–12 public education 16 higher education 32 health and human services 4 prisons and corrections 3 don’t know
When it comes to the tough choices involved in the state budget this year, would you prefer [rotate] (1) that the governor and legislature make all of the decisions about spending and taxes [or] (2) that California voters make some of the decisions about spending and taxes at the ballot box?
19% that the governor and legislature make all of the decisions
77 that California voters make some of the decisions about spending at the ballot box
1 other (specify) (volunteered) 1 both (volunteered) 3 don’t know
Next,
Proposition 13 is the 1978 ballot measure that limits the property tax rate to 1 percent of assessed value at time of purchase and annual tax increases to no more than 2 percent until the property is sold. Overall, do you feel passing Proposition 13 turned out to be mostly a good thing for California or mostly a bad thing?
61% mostly a good thing 25 mostly a bad thing 14 don’t know
Under Proposition 13, residential and commercial property taxes are both strictly limited. What do you think about having commercial properties taxed according to their current market value? Do you favor or oppose this proposal?
47% favor 43 oppose 10 don’t know
Next,
Do you think the state budget situation in California—that is, the balance between government spending and revenues—is a big problem, somewhat of a problem, or not a problem for the people of California today?
40% big problem 38 somewhat of a problem 18 not a problem 4 don’t know
Governor Newsom recently proposed a budget plan for the next fiscal year that includes $144 billion in General Fund spending. The proposed budget will increase spending on K–14 and higher education and health and human services. The plan includes $4 billion to eliminate budgetary debts and reverse the deferrals of the past decades. The plan includes $1.8 billion in additional funds to bring the rainy day fund to $15.3 billion. In general, do you favor or oppose the governor’s budget plan?
70% favor 22 oppose 3 haven’t heard anything about the
budget (volunteered) 5 don’t know

PPIC STATEWIDE SURVEY JANUARY 2019
PPIC.ORG/SURVEY Californians and Their Government 25
Next, the state is projected to have a budget surplus of several billion dollars. In Governor Newsom’s state budget proposal, he included several proposals that would require a significant amount of General Fund spending. Please say if you favor or oppose the following proposals.
(question 15 not asked)
[rotate questions 16 and 17]
How about an increase of $832 million for public colleges and universities, including funding for policies aimed at increasing enrollment and degree completion, a tuition freeze, and two free years at community college for first-time, full-time students? (Do you favor or oppose this proposal?)
78% favor 20 oppose 2 don’t know
How about allocating $1.8 billion to expand pre-kindergarten and early childhood programs and facilities? (Do you favor or oppose this proposal?)
77% favor 22 oppose 2 don’t know
(question 18 not asked)
Changing topics,
Overall, do you approve or disapprove of the way that Donald Trump is handling his job as president?
30% approve 67 disapprove 3 don’t know
Overall, from what you know so far, do you approve or disapprove of the way Speaker of the House Nancy Pelosi is handling her job?
48% approve 39 disapprove 8 never heard of her/have not heard
enough to have an opinion (volunteered)
6 don’t know
Overall, from what you know so far, do you approve or disapprove of the way the House Minority Leader Kevin McCarthy is handling his job?
32% approve 30 disapprove 26 never heard of him/have not heard
enough to have an opinion (volunteered)
12 don’t know
Overall, do you approve or disapprove of the way the US Congress is handling its job?
34% approve 59 disapprove 7 don’t know
Do you think that President Trump and the US Congress will be able to work together and accomplish a lot in the next year, or not?
25% yes, will be able to work together 72 no, will not be able to work together 3 don’t know
Do you think things in the United States are generally going in the right direction or the wrong direction?
30% right direction 66 wrong direction 3 don’t know
As you may know, the Democratic Party won control of the US House of Representatives as a result of the midterm elections. How much do you think Democratic control of the House will change the way things are going in this country—a lot, some, not much, or not at all?
28% a lot 38 some 22 not much 10 not at all 1 don’t know

PPIC STATEWIDE SURVEY JANUARY 2019
PPIC.ORG/SURVEY Californians and Their Government 26
Changing topics,
All in all, would you favor or oppose building a wall along the entire border with Mexico?
28% favor 69 oppose 3 don’t know
Next,
*[Asked from January 20–24] As you may know, the federal government has been partially shut down because [rotate] (1) Donald Trump and Republicans in Congress and (2) Democrats in Congress cannot agree on laws about border security. Who do you think is mainly responsible for this situation—[read in same order as above] (1) Trump and Republicans in Congress [or] (2) Democrats in Congress?
64% Trump and Republicans in Congress 24 Democrats in Congress 8 both equally (volunteered) 1 neither (volunteered) 2 don’t know
*[Asked from January 25–29] As you may know, the federal government was partially shut down because [rotate] (1) Donald Trump and Republicans in Congress and (2) Democrats in Congress could not agree on laws about border security. Who do you think was mainly responsible for this situation—[read in same order as above] (1) Trump and Republicans in Congress [or] (2) Democrats in Congress?
Do you think the situation with illegal immigration across the US-Mexico border is currently a crisis, a serious problem but not a crisis, or not a serious problem?
27% a crisis 45 a serious problem but not a crisis 27 not a serious problem – not a problem (volunteered)
1 don’t know
Changing topics,
These days, do you feel [rotate response options] (1) (optimistic) or (2) (pessimistic) that Americans of different political views can still come together and work out their differences?
58% optimistic 40 pessimistic 3 don’t know
(question 30 not asked)
31. What is your opinion with regard to race relations in the United States today? Would you say things are [rotate 1 and 2] (1) (better), (2) (about the same); or worse than they were a year ago?
20% better 34 about the same 45 worse 1 don’t know
(question 32 not asked)
Next, some people are registered to vote and others are not. Are you absolutely certain that you are registered to vote in California?
68% yes [ask q33a] 32 no [skip to q34b]
33a. Are you registered as a Democrat, a Republican, another party, or are you registered as a decline-to-state or independent voter?
43% Democrat [ask q34] 24 Republican [skip to q34a] 5 another party (specify) [skip to q35] 28 independent [skip to q34b]
Would you call yourself a strong Democrat or not a very strong Democrat?
63% strong 34 not very strong 3 don’t know
[skip to q35]

PPIC STATEWIDE SURVEY JANUARY 2019
PPIC.ORG/SURVEY Californians and Their Government 27
34a. Would you call yourself a strong Republican or not a very strong Republican?
59% strong 39 not very strong 2 don’t know
[skip to q35]
34b. Do you think of yourself as closer to the Republican Party or Democratic Party?
24% Republican Party 49 Democratic Party 22 neither (volunteered) 6 don’t know
Next, would you consider yourself to be politically:
[read list, rotate order top to bottom]
14% very liberal 22 somewhat liberal 31 middle-of-the-road 20 somewhat conservative 11 very conservative 3 don’t know
Generally speaking, how much interest would you say you have in politics—a great deal, a fair amount, only a little, or none?
28% great deal 34 fair amount 29 only a little 8 none – don’t know
[d1-d15 demographic questions]

PPIC STATEWIDE SURVEY ADVISORY COMMITTEE
Ruben Barrales Senior Vice President, External Relations Wells Fargo
Angela Glover Blackwell Founder in Residence PolicyLink
Mollyann Brodie Senior Vice President Henry J. Kaiser Family Foundation
Bruce E. Cain Director Bill Lane Center for the American West Stanford University
Jon Cohen Vice President of Survey Research SurveyMonkey
Joshua J. Dyck Co-Director Center for Public Opinion University of Massachusetts, Lowell
Lisa García Bedolla Director Institute of Governmental Studies University of California, Berkeley
Russell Hancock President and CEO Joint Venture Silicon Valley
Sherry Bebitch Jeffe Professor Sol Price School of Public Policy University of Southern California
Robert Lapsley President California Business Roundtable
Carol S. Larson President and CEO The David and Lucile Packard Foundation
Donna Lucas Chief Executive Officer Lucas Public Affairs
Sonja Petek Fiscal and Policy Analyst California Legislative Analyst’s Office
Lisa Pitney Vice President of Government Relations The Walt Disney Company
Robert K. Ross, MD President and CEO The California Endowment
Most Reverend Jaime Soto Bishop of Sacramento Roman Catholic Diocese of Sacramento
Carol Whiteside Principal California Strategies
The PPIC Statewide Survey Advisory Committee is a diverse group of experts who provide advice on survey issues. However, survey methods, questions, content, and timing are determined solely by PPIC.
PPIC BOARD OF DIRECTORS
Steven A. Merksamer, Chair Senior Partner Nielsen Merksamer Parrinello Gross & Leoni LLP
Mark Baldassare President and CEO Public Policy Institute of California
Ruben Barrales Senior Vice President, External Relations Wells Fargo
María Blanco Executive Director University of California Immigrant Legal Services Center
Louise Henry Bryson Chair Emerita, Board of Trustees J. Paul Getty Trust
A. Marisa Chun Partner McDermott Will & Emery LLP
Chet Hewitt President and CEO Sierra Health Foundation
Phil Isenberg Former Chair Delta Stewardship Council
Donna Lucas Chief Executive Officer Lucas Public Affairs
Mas Masumoto Author and Farmer
Leon E. Panetta Chairman The Panetta Institute for Public Policy
Gerald L. Parsky Chairman Aurora Capital Group
Kim Polese Chairman ClearStreet, Inc.
Gaddi H. Vasquez Senior Vice President, Government Affairs Edison International Southern California Edison

Public Policy Institute of California 500 Washington Street, Suite 600 San Francisco, CA 94111 T: 415.291.4400 F: 415.291.4401
PPIC.ORG
PPIC Sacramento Center Senator Office Building 1121 L Street, Suite 801 Sacramento, CA 95814 T: 916.440.1120 F: 916.440.1121