cambium learning group, inc
TRANSCRIPT

ANNUAL REPORT 2014

BOARD OF DIRECTORS
Joe Walsh, Chairman of the Board
David F. Bainbridge, Director
Dr. Walter G. Bumphus, Director
John Campbell, Director
Clifford K. Chiu, Director
Thomas Kalinske, Director
Harold O. Levy, Director
Jeffrey T. Stevenson, Director
LEADERSHIP TEAM
John Campbell Chief Executive Officer, Cambium Learning Group, Inc.
Bob Holl President, Learning A–Z
George Logue President, Voyager Sopris Learning
Dave Shuster President, ExploreLearning
Barbara Benson Chief Financial Officer, Cambium Learning Group, Inc.
Paul Fonte Chief Technology Officer, Cambium Learning Group, Inc.
Carolyn Getridge Senior Vice President, Strategic Partnerships

UNITED STATES SECURITIES AND EXCHANGE COMMISSION
Washington, D.C. 20549
FORM 10-K
ANNUAL REPORT PURSUANT TO SECTION 13 OR 15(d) OF THE SECURITIES EXCHANGE ACT OF 1934
For the fiscal year ended December 31, 2014 or
TRANSITION REPORT PURSUANT TO SECTION 13 OR 15(d) OF THE SECURITIES EXCHANGE ACT OF 1934 For the transition period from to
Commission file number 001-34575
Cambium Learning Group, Inc. (Exact Name of Registrant as Specified in its Charter)
Delaware 27-0587428 (State or Other Jurisdiction of Incorporation or Organization)
(I.R.S. Employer Identification No.)
17855 Dallas Parkway, Suite 400, Dallas, Texas
75287
(Address of Principal Executive Offices) (Zip Code)
Registrant’s telephone number, including area code: (888) 399-1995 Securities registered pursuant to Section 12(b) of the Act:
Common Stock, par value $0.001 per share The NASDAQ Capital Market(Title of class) (Name of exchange on which registered)
Securities registered pursuant to Section 12(g) of the Act: None
Indicate by check mark if the registrant is a well-known seasoned issuer, as defined in Rule 405 of the Securities Act. Yes No
Indicate by check mark if the registrant is not required to file reports pursuant to Section 13 or Section 15(d) of the Exchange Act. Yes No
Indicate by check mark whether the registrant (1) has filed all reports required to be filed by Section 13 or 15(d) of the Securities Exchange Act of 1934 during the preceding 12 months (or for such shorter period that the registrant was required to file such reports), and (2) has been subject to such filing requirements for the past 90 days. Yes No
Indicate by check mark whether the registrant has submitted electronically and posted on its corporate Web site, if any, every Interactive Data File required to be submitted and posted pursuant to Rule 405 of Regulation S-T (§ 232.405 of this chapter) during the preceding 12 months (or for such shorter period that the registrant was required to submit and post such files). Yes No
Indicate by check mark if disclosure of delinquent filers pursuant to Item 405 of Regulation S-K (§ 229.405 of this chapter) is not contained herein, and will not be contained, to the best of registrant’s knowledge, in definitive proxy or information statements incorporated by reference in Part III of this Form 10-K or any amendment to this Form 10-K.
Indicate by check mark whether the registrant is a large accelerated filer, an accelerated filer, a non-accelerated filer, or a smaller reporting company. See the definitions of “large accelerated filer, “accelerated filer”, and “smaller reporting company” in Rule 12b-2 of the Exchange Act.
Large accelerated filer Accelerated filer
Non-accelerated filer Smaller reporting company
Indicate by check mark whether the registrant is a shell company (as defined in Rule 12b-2 of the Exchange Act). Yes No
The aggregate market value of the registrant’s common stock, par value $0.001 per share, held by non-affiliates of the registrant was $28,723,270 based on the closing sale price of the registrant’s common stock on June 30, 2014, the last business day of the registrant’s most recently completed second fiscal quarter, as reported on the NASDAQ Capital Market. As of March 3, 2015, there were 45,481,969 shares of the registrant’s common stock outstanding.
Documents Incorporated by Reference: Part III incorporates certain information by reference from the registrant’s definitive proxy statement for the 2015 Annual Stockholders Meeting, which definitive proxy statement will be filed by the registrant with the Securities and Exchange Commission within 120 days after the end of the registrant’s fiscal year ended December 31, 2014.

TABLE OF CONTENTS
PART I Page No
Item 1. Business .............................................................................................................................................................. 1Item 1A. Risk Factors ........................................................................................................................................................ 10Item 1B. Unresolved Staff Comments ............................................................................................................................... 14Item 2. Properties ............................................................................................................................................................ 14Item 3. Legal Proceedings .............................................................................................................................................. 14Item 4. Mine Safety Disclosures ..................................................................................................................................... 14
PART II Item 5. Market for Registrant’s Common Equity, Related Stockholder Matters and Issuer Purchases of Equity
Securities .......................................................................................................................................................... 15
Item 6. Selected Financial Data ...................................................................................................................................... 16Item 7. Management’s Discussion and Analysis of Financial Condition and Results of Operations ............................. 16Item 7A. Quantitative and Qualitative Disclosures About Market Risk ............................................................................ 32Item 8. Financial Statements and Supplementary Data .................................................................................................. 32Item 9. Changes in and Disagreements with Accountants on Accounting and Financial Disclosure ............................. 71Item 9A. Controls and Procedures ..................................................................................................................................... 71Item 9B. Other Information ............................................................................................................................................... 72
PART III Item 10. Directors, Executive Officers and Corporate Governance ................................................................................. 73Item 11. Executive Compensation .................................................................................................................................... 73Item 12. Security Ownership of Certain Beneficial Owners and Management and Related Stockholder Matters ........... 73Item 13. Certain Relationships and Related Transactions, and Director Independence ................................................... 73Item 14. Principal Accountant Fees and Services ............................................................................................................. 73
PART IV
Item 15. Exhibits and Financial Statement Schedules ....................................................................................................... 74
SIGNATURE PAGE ..................................................................................................................................................................... 79

1
PART I
Cautionary Note Regarding Forward-looking Statements This report contains forward-looking statements within the meaning of the federal securities laws that involve risks and
uncertainties, and which are based on beliefs, expectations, estimates, projections, forecasts, plans, anticipations, targets, outlooks, initiatives, visions, objectives, strategies, opportunities, drivers and intents of our management. Such statements are made in reliance upon the safe harbor provisions of the Private Securities Litigation Reform Act of 1995. All statements other than statements of historical facts included in this report, including, without limitation, statements regarding our future financial position, economic performance and results of operations, as well as our business strategy, objectives of management for future operations, and certain information set forth under “Management’s Discussion and Analysis of Financial Condition and Results of Operations,” are forward-looking statements.
Statements that are not historical facts, including statements about our beliefs and expectations, are forward-looking statements. Forward-looking statements can be identified by, among other things, the use of forward-looking language, such as “believes,” “expects,” “estimates,” “projects,” “forecasts,” “plans,” “anticipates,” “targets,” “outlooks,” “initiatives,” “visions,” “objectives,” “strategies,” “opportunities,” “drivers,” “intends,” “scheduled to,” “seeks,” “may,” “will,” or “should” or the negative of those terms, or other variations of those terms or comparable language, or by discussions of strategy, plans, targets, models or intentions. Forward-looking statements speak only as of the date they are made, and except for our ongoing obligations under the federal securities laws, we undertake no obligation to publicly update any forward-looking statements, whether as a result of new information, future events, or otherwise, or to update the reasons actual results could differ materially from those anticipated in any forward-looking statements. Accordingly, you are cautioned that any such forward-looking statements are not guarantees of future performance and are subject to certain risks, uncertainties and assumptions that are difficult to predict. Although we believe that the expectations reflected in such forward-looking statements are reasonable as of the date made, expectations may prove to have been materially different from the results expressed or implied by such forward-looking statements, as it is impossible for us to anticipate all factors that could affect our actual results. We discuss certain of these risks in greater detail under the heading “Risk Factors” in Item 1A of this report. Unless otherwise required by law, we also disclaim any obligation to update our view of any such risks or uncertainties or to announce publicly the results of any revisions to the forward-looking statements made in this report.
Item 1. Business.
Unless otherwise expressly indicated in this Item 1, the discussions set forth herein are as of December 31, 2014. The “Company”, “we”, “us”, or “our” when used in this report refers to Cambium Learning Group, Inc. and its predecessors and consolidated subsidiaries, as the context requires.
Overview Cambium Learning Group, Inc., a Delaware corporation, is a leading educational solutions and services company that is
committed to helping all students reach their full potential. Our award winning product lines include: Learning A–Z™ (www.learninga-z.com), ExploreLearning® (www.explorelearning.com and www.reflexmath.com), Voyager Sopris Learning™ (www.voyagersopris.com) and Kurzweil Education™ (www.kurzweiledu.com). Together, these product lines provide breakthrough technology solutions for online learning and professional support; best-in-class intervention and supplemental instructional materials; gold-standard professional development and school-improvement services; valid and reliable assessments; and proven materials to support a positive and safe school environment.
During 2014, our products, more fully described in Segment and Product Information below, continued to receive awards and accolades from industry publications including:
The 20th Annual Best Educational Software Awards (“BESSIE”) presented by The ComputED Gazette
Learning A-Z – Raz-Kids.com
Learning A-Z – ScienceA-Z.com
ExploreLearning – Reflex
ExploreLearning – Gizmos
Kurzweil Education – Kurzweil 3000-firefly
The BESSIE Awards target innovative and content-rich programs and websites that provide parents and teachers with technology to foster educational excellence and are awarded to titles submitted by publishers worldwide.

2
The 19th Annual Education Software Review Awards (“EDDIE”) presented by The ComputED Gazette
Learning A-Z – Reading A-Z.com
Learning A-Z – Raz-Kids.com
ExploreLearning – Reflex
ExploreLearning – Gizmos
Kurzweil Education – Kurzweil 3000-firefly
The EDDIE Awards target innovative and content-rich programs and websites that augment classroom curriculum and improve teacher productivity, providing parents and teachers with technology to foster educational excellence. Selection criteria includes academic content, potential for broad classroom use, technical merit, subject approach, management approach and are awarded to titles submitted by publishers worldwide.
2014 CODiE Award for Best Learning Game presented by the Software and Information Industry Association
ExploreLearning – Reflex
For nearly 30 years, the Software and Information Industry Association (SIIA) CODiE Awards have recognized software and information companies for achievement and vision. It is the only peer-reviewed program in the content, education and software industries.
2014 REVERE Awards presented by the PreK-12 Learning Group Association of American Publishers
Learning A-Z – Raz-Kids.com
ExploreLearning – Gizmos
The annual REVERE awards, established by the Association of Educational Publishers (AEP) and formerly known as the AEP Awards program, recognize exemplary learning resources for preK-12 students, educators and administrators, as well as adult learners.
The 32nd Annual Tech & Learning Awards of Excellence for Best Upgraded Product
Learning A-Z – Reading A-Z.com
Learning A-Z – Science A-Z.com
ExploreLearning – Gizmos
Kurzweil Education – Kurzweil 3000-firefly
The Tech & Learning Awards of Excellence recognize both new and upgraded education technology products. Judges evaluated more than 150 applicants using four criteria: quality and effectiveness, ease of use, creative use of technology and suitability for use in an educational environment.
2014 Reader’s Choice Top 100 Products presented by District Administration Magazine
ExploreLearning – Reflex
Voyager Sopris Learning – Read Well
The annual Reader’s Choice Top 100 Products list, notifies and educates superintendents and other senior school influencers about the top products being used around the country to help districts excel. The winning products were selected from more than 2,400 unique nominations submitted by the nation’s top K-12 leaders and demonstrate the powerful impact of technology and the Internet.

3
Segment and Product Information Our product lines are operated in four business segments: Learning A-Z, Voyager Sopris Learning, ExploreLearning, and
Kurzweil Education. Each segment operates with separate management teams and infrastructures that offer various products and services, many of which are described below. During 2014, net revenues were $44.4 million for Learning A-Z, $71.2 million for Voyager Sopris Learning, $18.1 million for ExploreLearning and $8.0 million for Kurzweil Education. Unallocated shared services such as accounting, legal, human resources and corporate-related items are reported in Other. Depreciation and amortization expense, goodwill impairment, interest income and expense, other income and expense, and taxes are also included in Other as we evaluate the performance of our business segments excluding these captions. Further information is available in our Consolidated Financial Statements and notes thereto included in this Annual Report on Form 10-K.
Learning A-Z Segment
Learning A-Z is a preK-6 educational resource company specializing in online delivery of leveled readers and supplementary curriculum. Founded in 2002 to help teachers differentiate instruction and meet the unique needs of all students, Learning A-Z’s resources are currently used in more than half the districts across the United States and Canada and in approximately 190 countries worldwide. Serving a wide range of student needs, including English language learners, intervention, special education, and daily instruction, Learning A-Z’s value proposition focuses on three key elements:
Saving teachers time, giving them all the resources they need, all online, all accessible at the click of a mouse Saving teachers money, delivering thousands of resources for a fraction of the cost of print and other online providers Supporting student achievement through differentiated instruction, ensuring the right high-quality resources for every
preK-6 student Learning A-Z operates seven subscription-based websites: Reading A-Z, Raz-Kids, Vocabulary A-Z, Headsprout®, ReadyTest A-
Z, Writing A-Z and Science A-Z. These websites are stand-alone or integrated, for a comprehensive solution that provides online supplemental books, lessons, assessments and other instructional resources for individual classrooms, schools, and districts.
Reading A-Z offers thousands of research-based, printable teacher materials to teach guided reading, phonological awareness, phonics, comprehension, fluency, letter recognition and formation, high-frequency words, poetry and vocabulary. The teaching resources include professionally developed downloadable leveled books across 27 levels, a systematic phonics program that includes decodable books, high-frequency word books, poetry books, nursery rhymes, vocabulary books, read-aloud books, lesson plans, worksheets, graphic organizers and reading assessments. All leveled books, worksheets, graphic organizers and quizzes are available as printable PDF files and as projectables for use on interactive and non-interactive whiteboards. The leveled books and a variety of other books are available in Spanish, French, and British English.
Raz-Kids is a student-centered online collection of leveled eBooks and eQuizzes designed to guide and motivate emergent and reluctant readers, as well as improve the skills of fluent readers. Students can listen to and read books as well as record their reading and then take an online quiz while receiving immediate feedback. Students earn stars for their reading activity, which can then be spent in each student’s Raz-Rocket, a catalog full of items that include aliens and other fun characters. The program currently consists of 400+ online eBooks along with companion eQuizzes and worksheets spread across 27 levels of difficulty. An online assessment tool allows teachers to assess students for placement at the appropriate reading level by determining reading rate, accuracy, fluency and comprehension. The website also features a classroom management system for teachers to build rosters, assign books, monitor student progress, and evaluate instructional needs. Free apps are also available, allowing teachers and students to access Raz-Kids via their favorite tablet.
Headsprout teaches K-5 students to be successful readers using online instruction that automatically adapts to the specific needs of every student. The website teaches nonreaders and early readers critical reading fundamentals, including phonemic awareness, phonics, fluency and basic vocabulary and teaches grade 3-5 readers the four main components of comprehension: finding facts, making inferences, identifying themes and learning vocabulary context.
ReadyTest A-Z was launched in October 2014. The website delivers downloadable resources teachers need to provide effective high-stakes English Language Arts assessment practice and instruction, as well as a student-centric environment where kids log in to develop their test-taking skills online. Kids are able to access ReadyTest A-Z 24/7 to develop real high-stakes testing skills, while teachers can monitor student progress and then provide customized instruction to help students maximize their learning.
Science A-Z provides teachers with an online collection of resources to improve student skills associated with reading, thinking and learning science. The website delivers printable and projectable science curriculum resources, organized by unit themes and grouped into grade spans, for elementary teachers to teach a concept at each student’s appropriate reading level. Filled with materials, including books, worksheets, labs, correlations to state standards, and videos, this website seamlessly blends literacy and science.

4
Voyager Sopris Learning Segment
Voyager Sopris Learning is committed to partnering with school districts to overcome obstacles that students, teachers and school leaders face every day. The suite of instructional and service solutions Voyager Sopris Learning provides is not only research based, but also evidence based—proven to increase student achievement and educator effectiveness. Voyager Sopris Learning’s solutions have been fully tested in the classroom, ensuring that they are easy to implement and teacher friendly. They are innovative, both in overall instructional approach and in the strategic use of technology in blended and 100% online solutions and are supported by an unparalleled commitment to build local capacity for sustained success. With a comprehensive suite of instructional resources, Voyager Sopris Learning provides assessments, professional development and school improvement services, literacy and math instructional tools—comprehensive, intervention and supplemental—and resources to build a positive school climate.
Voyager Sopris Literacy Solutions LANGUAGE! ® Live is a comprehensive English language arts solution designed to meet the rigor of state and national standards
and assessments for students in grades 5–12. LANGUAGE! Live combines personalized instruction in both foundational and advanced literacy skills to quickly move learners to grade-level achievement. The curriculum is comprised of two main components, Word and Text Training, and includes a robust, integrated assessment system. LANGUAGE! Live provides instruction across all key literacy strands—from phonemic awareness and word study to fluency, vocabulary, close reading/comprehension and writing. In August 2014, LANGUAGE! Live Level 2 was released, which significantly expanded the scope and reach of LANGUAGE! Live. Also included in the August 2014 release were the online library ReadingScape, an engaging independent reading component that includes literacy and informational texts with audio, animation and video, as well as PowerPass, an online test-readiness component. In early efficacy studies, LANGUAGE! Live students—including nonreaders, struggling readers and English language learners—are already demonstrating significant and accelerated gains in both comprehension (Lexile®) and fluency.
LANGUAGE!® The Comprehensive Literacy Curriculum, targets students in grades 4–12 achieving at or below the 40th percentile. The program covers phonemic awareness and phonics, word recognition and spelling, vocabulary and morphology, grammar and usage, listening and reading comprehension, and speaking and writing. LANGUAGE! is a mastery-based curriculum designed for students with language-based learning disabilities, English language learners, and students who have not yet grasped foundational literacy skills. Students exit as soon as they achieve grade-level proficiency, which will vary depending on the specific needs of the student and where the student enters the curriculum. With the addition of the Online Teacher and Student Centers and eBooks in 2014, educators and students now have a single point of access to all technology components and the ability to use online materials, which provide an intuitive and interactive format.
Step Up to Writing® provides a comprehensive resource of multisensory writing strategies to support students in grades K–12 in creating thoughtful, well-written compositions across content areas. The program explicitly connects reading, writing, speaking, and listening with hands-on strategies and directly teaches each phase of the writing process. Students learn to actively engage with reading materials, develop study skills, and produce proficient informative/explanatory, narrative, and opinion/argument writing in accordance with the Common Core State Standards. Implementation Guides at both the Intermediate and Secondary levels provide a flexible, grade-level sequence of strategies for each type of writing specified in the Common Core State Standards, with genre-specific rubrics and clear, concise teacher support. Independent school district studies show that Step Up to Writing results in improved performance on state writing tests, increased understanding of content area text and proficiency across all student populations. In 2014, Step Up to Writing 4th Edition for grades 3–8 was released, which incorporates completely updated materials to support more rigorous standards and significant online support for teachers, including a robust set of online resources such as professional development videos, printable instructional tools and assessment and progress monitoring components.
Passport Reading Journeys® is a targeted intervention program designed to improve reading, comprehension, vocabulary, fluency, and writing for struggling learners in grades 6–12. Age-appropriate content, real-life journeys on DVDs, online interactive lessons, new eBooks and captivating text are designed to hold students’ interest and motivate them to read for both information and enjoyment. The program targets the affective domain as much as the cognitive domain, as many struggling readers have lost confidence, are not engaged, and are close to dropping out. Passport Reading Journeys was updated in 2014 to reflect more rigorous reading standards; provide independent reading practice through the new online library, ReadingScape; and includes PowerPass, a test-readiness component.
REWARDS® is an explicitly taught, research-validated reading and writing intervention program designed for general and special education, supplemental reading intervention, summer school, and after school implementation. Built to specifically address the Common Core State Standards, REWARDS Intermediate and Secondary build students’ proficiency in foundational skills, language, and reading informational text. This short-term intervention increases oral and silent reading rates through a highly generalizable, effective strategy for decoding the multisyllabic words frequently found in content-area texts. REWARDS Plus engages students in applying the strategy to authentic content-area materials, and REWARDS Writing teaches essential sentence-writing skills that can be applied in all content areas.

5
Read Well® is an evidence-based K–3 reading and language arts solution that helps students build the critical skills needed to be successful readers and learners. A blended approach of whole-class, small-group, and online instruction with flexible pacing and multiple entry points gives teachers the flexibility they need to meet students at their skill and developmental levels and adapt instruction accordingly. Read Well uses an explicit, systematic, mastery-based instructional model that transitions students to proficient reading, writing, speaking, and listening. The curriculum aligns to the Common Core State Standards for English Language Arts, and the newly released Read Well 3 and Read Well 2 Composition was built to specifically address these standards.
Ticket to Read® is an interactive, web-based program designed to improve the reading performance of students in grades K–6 by providing independent reading activities and extended skills practice. Dynamic content in critical phonics and word-attack skills, vocabulary, fluency, and reading comprehension is leveled, self-paced, and teacher-monitored. Students are motivated by a leaderboard, a virtual clubhouse that includes earning online tickets and other rewards, games, and engaging, self-selected passages on a variety of relevant topics. With the 2014 release of the Ticket to Read iPad® app, students now have additional options for accessing the award-winning, interactive content.
Voyager Sopris Math Solutions TransMath® is an intensive, mastery-based intervention solution for struggling students in grades 5–10. In TransMath, concepts
are developed with visual models that help students see big ideas being taught and build skills in algebraic thinking, computational fluency, fluency with rational numbers, and aspects of geometry and measurement. The program controls cognitive overload by presenting fewer topics in greater depth and providing two strands of instruction in each daily lesson: Number Sense and Problem Solving. TransMath teaches multistep problems gradually and in a meaningful context to prepare students for algebra and success in higher mathematics.
Vmath® is an explicit, systematic targeted math intervention that complements and enhances any core math program in grades 2–8 by filling critical learning gaps. This research-based program reinforces students’ understanding of strategies and concepts most frequently tested, while providing instruction in critical skills that they may have missed in previous years of instruction. Vmath offers a simple way for teachers to build student confidence and provide the purposeful practice recommended for transferring the skills of the Common Core State Standards to daily application and use of mathematics. With the addition of the Online Teacher and Student Centers and eBooks in 2014, educators and students now have a single point of access to all technology components and the ability to use online materials, which provide an intuitive and interactive format. Vmath Summer Adventure is an intensive intervention for students in grades K–8 that uses the same pedagogy and research as Vmath.
VmathLive® is a web-based solution that provides purposeful math practice in a stimulating learning environment. Newly expanded to include kindergarten and first grade, VmathLive helps students in grades K–8 continuously improve their results through scaffolded instruction with problem-specific, step-by-step hints and on-screen tutoring focused on visual representations of math concepts with both English and Spanish audio. Students work sequentially through a year’s worth of math and are encouraged to stay on track with messaging, badges, trophies, points, live competition with peers, and other confidence-building strategies. The program’s new Play component includes 20 different games involving mental math, using patterns, multiple steps, and reasoning skills aligned to the Common Core State Standards.
Voyager Sopris Prekindergarten Solution
We Can Early Learning Curriculum, Second Edition, is built specifically to prepare students for rigorous kindergarten standards, including the Common Core State Standards, and to address the Head Start Child Development and Early Learning Framework. The fundamental goal of We Can is to prepare students for academic success in kindergarten and beyond. This robust, multidisciplinary curriculum provides a clear road map for early learning success—cross-curricular content addressing 10 early childhood domains, online learning tools, reinforced routines and procedures, a pre-writing kit, a classroom management component, and fully integrated assessments. Teachers can maximize multiple opportunities to observe children, identify their capabilities and needs, manage their behavior, and monitor their progress.
Voyager Sopris Assessment Solutions DIBELS® Next (grades K–6), and the Spanish-language counterpart IDEL® (grades K–3) provide quick, reliable universal
screening and progress monitoring in basic early literacy skills. Students take benchmark assessments, either online or with paper/pencil, three times a year to measure the critical areas of phonemic awareness, phonics, fluency, and comprehension. Progress monitoring assessments are administered frequently, and teachers have the option of using DIBELS Next Survey for students who may require off-grade-level progress monitoring. DIBELS Deep provides the option of an in-depth diagnostic assessment. The data generated from this suite of assessments support educators as they identify students who need intervention, select and evaluate instructional interventions, group students, and prepare instruction to support students in reaching learning goals.

6
Voyager Sopris Learning Professional Services LETRS® is a professional development program that responds to the need for high-quality teachers of literacy in grades preK–
12. Authored by literacy expert Louisa Moats, Ed.D., LETRS provides the deep foundational knowledge necessary to understand how students learn to read, write, and spell—and why some of them struggle. Based in real-world experience and the science of reading, the program provides strategies and activities that can be implemented immediately. Professional development is delivered through a combination of print materials, online courses, software, and face-to-face training. LETRS Institutes, presented by certified national LETRS trainers, engage educators through group activities and hands-on practice.
NUMBERS is a rigorous mathematics professional development offering for teachers of mathematics in grades K–8. Integrating findings from the most current research, NUMBERS delves deeply into each domain of the Common Core State Standards. The content of NUMBERS is based on the premise that increasing teacher expertise results in improved student outcomes. There are five modules: Number Sense (K–5); Fractions and Decimals (3–6); Ratios and Proportions (5–8); Algebraic Thinking (5–8); and Data, Measurement, and Geometry (K–8, with an emphasis on 3–8). The content can be applied to any curriculum, context, or student population.
Voyager Sopris Learning Professional Services and Resources supports preK–12 educators by providing targeted, job embedded professional development with a focus on accelerating student gains and overall school performance. The team is committed to increasing student results by serving teachers and school leaders through planning, coaching, training, and ongoing support. The team specializes in partnering with schools and districts to build custom implementation support plans that ensure all stakeholders are prepared to implement and sustain instructional programs from Voyager Sopris Learning, as well as stand-alone professional development. Support is fully customized during every stage of implementation: pre-implementation planning, launch, ongoing, and data review. In-person training includes initial, refresher, training of trainers (TOT), advanced, transition, and ongoing support days. Training is also available online in the form of live webinars or web-based courses.
ExploreLearning Segment
ExploreLearning develops online solutions to improve student learning in math and science. ExploreLearning currently offers two supplemental programs: Gizmos, the world’s largest library of online simulations for math and science in grades 3-12 that help students gain a deep understanding of challenging concepts through active inquiry and exploration; and Reflex, a powerful adaptive online program that helps students in grades 2-8 develop math fact fluency through game-based instruction and practice.
Gizmos and Reflex bring research-proven, standards-aligned instructional strategies to classrooms around the world. They support the tenets of the National Council of Teachers of Mathematics, the National Science Teachers Association and new rigorous state and national standards. Additionally, new studies show students using Reflex are scoring higher and growing faster than their peers on standardized tests.
Reflex Student, an app launched in August 2014, joined Gizmos on the iPad®. The new app features the Reflex student experience, which helps students gain quick and effortless recall of basic math facts in all four operations. With expanded access on the iPad®, even more students can build fluency anytime and anywhere.
Kurzweil Education Segment
Kurzweil Education delivers award-winning educational technology that solves real problems. The segment’s literacy and learning solutions offer learners a way up and a path forward. Using the principals of Universal Design for Learning, Kurzweil Education delivers content and tools that enable all learners to read, understand and demonstrate their learning using technology-based tools and resources.
Kurzweil 3000-firefly provides literacy support for students anytime, anywhere. It can be accessed from a PC, Macintosh®, iPad®, and the web, providing support for students in the classroom and at home, while studying, or completing homework. Built-in tools for reading, writing, study skills and test taking deliver a multisensory approach to learning, helping students who struggle, such as those with dyslexia and English language learners, become independent learners. A cloud-based centralized library allows for easy access and distribution of curricula, while reporting delivers helpful insights into student usage.
Kurzweil 3000 is award-winning educational software designed to provide literacy support for those who struggle with literacy in the classroom, at home, or in the workplace. Built-in features for reading, writing and study skills help students to become independent learners, active participants within inclusion classrooms or sheltered instruction programs; but most importantly, to keep up with peers and achieve their full academic potential. Students can use Kurzweil 3000 throughout their school career and beyond, utilizing the literacy support to become lifelong learners.

7
Kurzweil 1000 is a scan and read software that makes printed or electronic text accessible to people who are blind or visually impaired. Combing traditional reading machine technologies, such as scanning, image processing and text-to-speech, with communication and productivity tools, eases and enhances users’ reading, writing and learning experiences. Documents and digital files are converted from text-to-speech and read aloud in a variety of natural-sounding voices that can modified to individual preferences. Additionally, this software enables users to write and edit documents, complete simple forms independently, assists with note taking, summarizing content and outlining text.
Industry Information We sell primarily to public school districts in the United States. On a much smaller scale, we also sell to private and charter
schools, home school and parent consumers, and other companies that bundle our products with their offerings. Most of our public school district customers are largely dependent on federal, state and local funding to purchase our products.
The education market is changing in response to the adoption of the Common Core State Standards by a majority of the states. Common Core State Standards define the knowledge and skills students should have within their K-12 education careers so that they will graduate high school able to succeed in entry-level, credit-bearing academic college courses and in workforce training programs. These standards are the product of a state-led effort to establish a single set of clear educational standards for grades K-12. Most states that have adopted the Common Core State Standards also belong to one of two multistate testing consortia that are developing common state assessments in English language arts and mathematics, aligned to the new standards. These assessments, which will be designed to replace existing statewide tests, are expected to be administered beginning in the 2014-2015 school year. Schools in these states may need to augment or replace instructional materials to align to the Common Core State Standards and to prepare students for the new state assessments. Additionally, the digitalization of education content and delivery is driving a substantial shift in the education market. The demand for these products has developed rapidly over the past several years and has led to changes in the way that providers develop, produce, market and distribute products. We believe our strategic plans aligned to these market trends.
Funding Information
School districts use a variety of government funding sources in order to procure our products and services, drawing from both federal funding sources and state and local sources. We estimate that approximately half of our overall sales are paid by school districts using federal funding sources. Our Voyager Sopris Learning segment has a higher reliance on sales related to use of federal funds than our other segments.
The Title I portion (“Title I”) of the reauthorized Elementary Secondary Education Act (“ESEA”) (and the Title III portion) and the Individuals with Disabilities Education Act (“IDEA”) are the two primary federal funding sources for at-risk students and students with disabilities, respectively. Title I distributes funding to those schools and school districts which are comprised of a relatively high percentage of students from low income families as defined by IDEA. In addition, Title I appropriates money for the education system for the prevention of dropouts and the improvement of schools. IDEA governs how states and public agencies provide early intervention, special education, and related services to children with disabilities.
We believe that demand for our products and professional services will be driven by an increased emphasis on accountability and measurement. There is greater emphasis on evaluating educators based on the performance of their students, driven by reforms contained in the Race to the Top program. These regulatory frameworks have mandated stricter accountability, higher standards and increased transparency in education, and states have been required to measure annual progress towards these standards and make results publicly available for the first time. We believe that with more attention in general, increased analysis of U.S. student outcomes versus other countries, and movement to national standards through the adoption of the Common Core State Standards, the number of children deemed to need intervention is likely to increase.
Competition
The market for our products is highly competitive and fragmented. Competition varies by segment and product line but typically comes from large publishers covering a broad array of products, smaller providers who specialize in very limited areas and free or open source teacher and student resources. Below are examples of competitors.
Educational technology suppliers, including Scholastic (Read 180, System 44, FASTT Math), Pearson (iLit), Scientific Learning, Achieve3000, DreamBox, Carnegie Learning, Renaissance Learning, Adaptive Curriculum, myON, Don Johnston and TextHelp
Traditional and supplemental curriculum suppliers, including Houghton Mifflin Harcourt, Pearson, McGraw-Hill Education, School Specialty, Haights Cross Communications and National Geographic (Cengage)

8
Seasonality
Our quarterly operating results fluctuate due to a number of factors, including the academic school year, school procurement policies, funding cycles, the amount and timing of new products and spending patterns. In addition, customers experience cyclical funding issues that can impact revenue patterns. Our first quarter historically represents less than 15% of Bookings, which tend to build through the second quarter and peak during the third quarter, representing by far the preponderance of orders, revenue and income each year.
Product Development, Sales and Marketing We are strategically focused on having the best possible product offerings and the sales and marketing forces to effectively and
efficiently deliver these products. Each segment has its own development, sales and marketing teams to better address the unique market position and target customer of its products.
Product Development
We seek to take advantage of new product and technology opportunities and view product development to be essential to maintaining and growing our market position. We update our products as needed to incorporate the latest research or pedagogy, bring images current or update factual content. Our web-based products are enhanced continuously. Between the product refreshes, we often develop variations, expansions (e.g., more grade levels) and other basic enhancements of our products.
We expect sales of our purely print-based products to continue to decline. Therefore, to stabilize order volume and enable growth in future years, we are focusing our development efforts on technology-enabled solutions. These investments will include enhancements for our Learning A-Z and ExploreLearning subscription products, the development of blended learning solutions in the Voyager Sopris Learning segment, and continued investment in firefly, the web-based solution in the Kurzweil Education segment.
Changing standards, such as the Common Core State Standards, also provide opportunities to meet new market needs. The implementation of these standards is likely to result in an increase in the number of students that are deemed to be below grade level proficiency. Products that are aligned with the Common Core or other rigorous state standards will allow educators to focus on areas where students are not proficient as each lesson will be clearly tied to the required learning objectives.
Research and development expense, net of capitalization, was $11.1 million and $9.8 million for the years ended December 31, 2014 and 2013, respectively. We capitalize product development costs associated with internal-use software, which includes software as a service offered to our customers with an online subscription, as well as certain pre-publication, production, and online curriculum development expenditures. Capitalized product development costs were as follows in 2014:
Learning A-Z – $5.6 million
Voyager Sopris Learning – $7.4 million
ExploreLearning – $1.6 million
Kurzweil Education – $0.5 million
Sales and Marketing
Our sales force is divided into field sales producers, who generally cover larger opportunity customers, and an inside sales force, which generally covers smaller territories. Our sales representatives are supported by product or subject matter and implementation experts as well as a marketing team. Voyager Sopris Learning also uses direct marketing through catalogs and all of our segments are increasingly making use of e-commerce and the Internet to sell our products. We have and will continue to participate in state adoptions when our products meet the needs of those adoptions. As of December 31, 2014, our total combined company sales force consisted of 67 field and 55 inside sales representatives for a total of 122 direct sales producers, excluding sales management and marketing. Sales and marketing expense was $41.4 million and $42.2 million for the years ended December 31, 2014 and 2013, respectively.
Concentration Risk We are not overly dependent upon any one customer or a few customers, the loss of which would have a material adverse effect
on our business. We have a broad customer base; in the two years ended December 31, 2014, on a consolidated basis, no single customer accounted for more than 10% of our total net revenues in any one year. Our top ten customers accounted for approximately 11% of our total net revenues in 2014.
9
Governmental Regulations Our operations are governed by laws and regulations relating to equal employment opportunity, workplace safety, information
privacy, and worker health, including the Occupational Safety and Health Act and regulations under that Act. Additionally, as a company that often bids on various state, local and federally funded programs, we are subject to various governmental procurement policies and regulations. We believe that we are in compliance in all material respects with applicable laws and regulations and we believe that future compliance will not have a material adverse effect upon our consolidated operations or financial condition.
Executive Officers
John Campbell. John Campbell, age 54, currently serves as Chief Executive Officer of Cambium Learning Group. Mr. Campbell served as President of Cambium Learning Technologies from December 2009 until March 2013, and COO of Voyager Learning Company from January 2007 through December 2009. He joined ProQuest in January of 2004, which sold off its library business and changed its name to Voyager Learning Company in January of 2007. Before joining Cambium Learning Group, Mr. Campbell served as Chief Operating Officer and business unit head of a research-based reading company (Breakthrough to Literacy) within McGraw-Hill. Prior to joining Breakthrough/McGraw-Hill, he served as Director of Technology for Tribune Education. Additionally, Mr. Campbell has experience as General Manager of a software start-up (Insight Industries Inc.) and as Director of Applications and Technical Support for a hardware manufacturer (Commodore International). John has also served on the Education Board for the Software Information Industry Association (SIIA).
Barbara Benson. Barbara Benson, age 44, has served as the Chief Financial Officer of Cambium Learning Group, Inc. since March 2013. Ms. Benson joined the Company in March 2007 and previously served as Controller of Cambium Learning Group, Inc. from December 2009 to March 2013, and as Controller of the Voyager Learning Company from March 2007 to December 2009. She has also served as the Principal Accounting Officer of the Company since March 2010. From 2004 until joining the Company in March 2007, Ms. Benson held positions at Pegasus Solutions, Inc., a hotel technology provider of reservation, distribution, financial, and representation services, including Controller and Director of Financial Accounting and Reporting. She began her career as an auditor with Coopers & Lybrand. Ms. Benson is a Certified Public Accountant licensed in the state of Texas.
Bob Holl. Bob Holl, age 71, is the Co-founder and President of Learning A-Z. Mr. Holl has a wealth of educational knowledge and publishing experience having spent 10 years as a public school educator and 30 years in educational publishing. Before founding Learning A-Z, he served as Vice President of Development for the Wright Group and prior to that served as Editor-in-Chief of Addison-Wesley Publishing and Scott-Foresman Publishing Companies. He has been the architect and writer of many curriculum programs and educational resources during his publishing career.
David Shuster. David Shuster, age 48, is the Founder and President of ExploreLearning. Mr. Shuster is a former classroom educator and is intimately involved in the design and development of the company's award-winning products. He holds a Ph.D. in Applied Mathematics from the University of Virginia and has led ExploreLearning since its inception in 1999.
George A. Logue. George A. Logue, age 64, currently serves as President of Voyager Sopris Learning. Mr. Logue previously served as the Executive Vice President and President of Sopris Learning, the Supplemental Solutions business unit of Cambium Learning Group, Inc. Mr. Logue has served as the Executive Vice President of Cambium since June 2003 and has 30 years of education industry experience. Before joining Cambium, Mr. Logue spent 18 years in various leadership roles with Houghton Mifflin Company. At Houghton Mifflin, Mr. Logue served as Executive Vice President of the School Division from 1996 to 2003. Prior to serving as Executive Vice President of Houghton Mifflin, Mr. Logue was Vice President for Sales and Marketing from 1994 to 1996.
Carolyn Getridge. Carolyn Getridge, age 70, currently serves as Senior Vice President, Strategic Partnerships. Ms. Getridge joined Voyager Learning Company in 1997 as a member of the team that launched the company after a distinguished 30-year career in public education. Immediately prior to joining Voyager Learning Company, Ms. Getridge was Superintendent of the Oakland Unified School District. Ms. Getridge also served as Associate Superintendent of Curriculum and Instruction in Oakland and as Director of Education Programs for the Alameda County Office of Education.
Paul Fonte. Paul Fonte, age 46, currently serves as Chief Technology Officer of Cambium Learning Group. Mr. Fonte previously served as the Vice President of Technology for Cambium Learning Technologies since December 2009. Mr. Fonte joined Voyager in 2003 as Senior Project Lead and was promoted to a number of positions within Voyager, including the Director of Technology where he served until December 2009. Mr. Fonte has over 20 years of professional experience developing and delivering software at all levels.
Employees
As of December 31, 2014, we had a total of 528 employees, including 518 full-time and 10 part-time employees. We consider our current relationship with our employees to be good. Our employees are not represented by labor unions and are not subject to collective bargaining agreements.

10
Proprietary Rights We regard a substantial portion of our technologies and content as proprietary and rely primarily on a combination of patent,
copyright, trademark and trade secret laws, and employee or vendor non-disclosure agreements, to protect our rights. We have developed relationships with authors who are known for their expertise in improving the cognitive and behavioral
performance of at-risk and special education students. Many authors are leaders in their respective fields, such as literacy, mathematics, and positive school climate. These authors are engaged by us to develop content and then to refine that content once feedback is obtained from our customers. We act as exclusive agents for and, in most instances, own the intellectual property from these well-known authors, whereby we publish their works under a royalty arrangement. We also derive a substantial amount of our curriculum content through in-house development efforts. To a much lesser degree, we also license from third parties published works, certain technology content or services upon which we rely to deliver certain products and services. Curriculum developed in-house or developed through the use of independent contractors is our proprietary property. Certain curriculum might be augmented or complemented with third party products, which may include printed materials, videos or photographs. This additional third party content may be sourced from various providers who retain the appropriate trademarks and copyrights to the material and agree to our use under a nonexclusive, fee-based arrangement.
We use U.S.-registered trademarks to identify various products which we develop. The trademarks survive as long as they are in use and the registration of these trademarks is renewed.
Website Access to Company Reports We make available free of charge through our website, www.cambiumlearning.com, our Annual Reports on Form 10-K,
Quarterly Reports on Form 10-Q, Current Reports on Form 8-K, Forms 3, 4 and 5 filed on behalf of our directors, officers and other affiliated persons, and all amendments to those reports as soon as reasonably practical after such material is electronically filed with, or furnished to, the Securities and Exchange Commission (“SEC”). We also will provide any of the foregoing information without charge upon written request to Cambium Learning Group, Inc., 17855 Dallas Parkway, Suite 400, Dallas, Texas 75287, Attention: Investor Relations.
We are providing the address to our website solely for the information of our investors. Our website and the information contained therein or incorporated therein are not intended to be incorporated into this Annual Report on Form 10-K.
Code of Ethics We have adopted a Senior Financial Officers Code of Ethics and a Code of Business Conduct to promote such standards as
(1) honest and ethical conduct; (2) full, fair, accurate, timely and understandable disclosure in our periodic reports; and (3) compliance with applicable governmental rules and regulations. Amendments to, or waivers from, the code of ethics will be posted on our website. A copy of the code of ethics and the code of business conduct are posted on our website, www.cambiumlearning.com, within the “Investor Relations” section under the heading “Corporate Governance”. The code of ethics is also available in print to anyone who requests it by writing to the Company at the following address: Cambium Learning Group, Inc., 17855 Dallas Parkway, Suite 400, Dallas, Texas 75287, Attention: Investor Relations.
We have also implemented a whistleblower hotline, as required under the Sarbanes-Oxley Act of 2002, by engaging a third party service that provides anonymous reporting for serious workplace ethical issues via telephone and/or the Internet.
Item 1A Risk Factors. This section should be read in conjunction with the Consolidated Financial Statements of the Company and the notes thereto
included in this Annual Report on Form 10-K for the year ended December 31, 2014.
Risks Related to our Business Changes in funding for public schools could cause the demand for our products to decrease.
We derive a significant portion of our revenues from public schools, which are heavily dependent on federal, state and local government funding. Budget cuts, curtailments, delays, changes in leadership, shifts in priorities or general reductions in funding could reduce or delay our revenues. Funding difficulties experienced by schools could also cause those institutions to demand price reductions and could slow or reduce purchases of intervention products, which in turn could materially harm our business. Our business may be adversely affected by changes in educational funding at the federal, state or local level, resulting from changes in legislation, changes in state procurement processes, changes in government leadership, emergence of other funding or legislative priorities and changes in the condition of the local, state or U.S. economy.

11
Changes in school procurement policies may adversely affect our business. The school appropriations process is often slow, unpredictable and subject to many factors outside of our control. School
districts choose to procure educational materials in various ways which can change quickly necessitating a change in our sales strategy or sales investments. Districts and states may switch procurement decisions from a centralized (district-wide) to a decentralized (school by school) decision, states may switch from state-wide standard adoptions to flexible district level procurement, and customers could increasingly utilize competitive requests for proposals (RFP) or procurement. Any of these changes could cause us to modify our sales strategy or cause us to expend greater sales effort to win business and if we are slow to respond the result could be a material loss of market share.
Our business is anticipated to be seasonal and our operating results are anticipated to fluctuate seasonally. Our business is subject to seasonal fluctuations. In addition, the quarterly results of operations have fluctuated in the past, and
our quarterly results of operations can be expected to continue to fluctuate in the future. Our first quarter historically represents less than 15% of Bookings, which tend to build through the second quarter and peak during the third quarter, representing the preponderance of orders, revenue, and income each year.
Certain of our activities are subject to weather risks, which could disrupt our operations or otherwise adversely affect our financial performance.
Weather disruptions due to snowstorms, hurricanes, or tornadoes could result in school closures, resulting in reduced demand for the Company’s products in it school channels during the affected periods. Additionally, the Company conducts certain of its businesses and maintains warehouse and office facilities in locations that are at risk of being negatively affected by severe weather events, such as snowstorms, hurricanes, tornadoes, or floods.
Our intellectual property protection may be inadequate, which may allow others to use our intellectual property and thereby reduce our ability to compete.
The intellectual property underlying our services and products may be vulnerable to attack by our competitors. We rely on a combination of trademark, copyright and trade secret laws, employee and third party nondisclosure agreements and other contracts to establish and protect our technology and other intellectual property rights. The steps that we have taken in order to protect our proprietary intellectual property may not be adequate to prevent misappropriation of our assets or to prevent third parties from developing similar offerings independently.
Our products could infringe on the intellectual property of others, which may cause us to engage in costly litigation and to pay substantial damages or restrict or prohibit us from selling our products.
Third parties may assert infringement or other intellectual property claims against us based on their intellectual property rights. If any of these claims are successful, we may be required to pay substantial damages, possibly including treble damages, for past infringement. We also may be prohibited from selling our products or providing certain content without first obtaining a license from the third party, which, if available at all, may require us to pay additional fees or royalties to the third party. Even if infringement claims against us are without merit, defending a lawsuit takes significant time, is often expensive and may divert management attention away from other business concerns.
Our success will depend in part on our ability to attract and retain key personnel. Our success depends in part on our ability to attract and retain highly qualified executives and management, as well as creative
and technical personnel. Members of our senior management team have substantial industry experience that is critical to the execution of our business plan. If they or other key employees were to leave our company, and we were unable to find qualified and affordable replacements for these individuals, our business could be harmed materially.
We could experience system failures, software errors or capacity constraints, any of which would cause interruptions in the delivery of electronic content to customers and we could experience security breaches to our systems. The occurrence of any such systems failures and security breaches ultimately may cause us to lose customers.
Any significant delays, disruptions or failures in the systems, or errors in the software, that we use for the technology-based component of our products, as well as for internal operations, could harm our business materially. We have occasionally suffered computer and telecommunication outages or related problems in the past. The growth of our customer base, as well as the number of websites we provide, could strain our systems in the future and will likely magnify the consequences of any computer and telecommunications problems that we may experience.

12
However, destruction or disruption of data center sites could cause a system-wide failure. Although we maintain property insurance on these premises, claims for any system failure could exceed our coverage. In addition, our products could be affected by failures associated with third party hosting providers or by failures of third party technology used in our products, and we may have no control over remedying these failures.
Additionally, our systems and websites may be vulnerable to unauthorized access by hackers, computer viruses and other disruptive problems. Any security breaches or problems could lead to misappropriation of our customers’ information, our websites, our intellectual property and other rights, as well as disruption in the use of our systems and websites. Any security breach related to our websites could tarnish our reputation and expose us to damages and litigation. We also may incur significant costs to maintain our security precautions or to correct problems caused by security breaches. Furthermore, to maintain these security measures, we may be required to monitor our customers’ access to our websites, which may cause disruption to customers’ use of our systems and websites. These disruptions and interruptions could harm our business materially.
Federal and state regulation of education and student information is rapidly evolving. Our reputation is one of our most important assets, and any adverse events, such as data privacy breaches or violation of privacy laws or regulations, could cause significant reputational damage and could have an adverse effect on our operating results.
Federal and state regulations for privacy is currently in flux and is likely to remain so for the foreseeable future. Practices regarding the collection, use, storage, display, processing, transmission and security of personal information by companies offering online services have recently come under increased public scrutiny.
Examples of regulations that could be applicable to our company include the Children’s Online Privacy Protection Act (COPPA), relating to access to and the use of information received from children in respect to our on-line offerings, and the Family Educational Rights and Privacy Act (FERPA), which imposes parental or student consent requirements for specified disclosures of student information to third parties.
Adverse publicity stemming from a data or privacy breach, whether or not valid, could reduce demand for our products or adversely affect our relationship with customers. Further, a failure to adequately protect personal data, including that of customers or students, or other data security failures, such as cyber-attacks from third parties, could lead to penalties, significant remediation costs and reputational damage, including loss of future business.
We have a single distribution center and could experience significant disruption of business and ultimately lose customers in the event it was damaged, destroyed or experienced technological failure.
Our inventory and fulfillment operations are outsourced to an Ozburn Hessey Logistics (“OHL”) location in the St. Louis, Missouri area. In the event that these distribution facilities were damaged, destroyed or experienced technological failure, we would be delayed in responding to customer requests. Additionally, business disruptions within OHL that are out of our control could delay our ability to deliver printed materials to our customers in a timely manner. Customers often purchase materials very close to the school year and such delivery delays could cause our customers to turn to competitors for products they need immediately. While we maintain adequate property insurance, the loss of customers could have a long-term, detrimental impact on our reputation and business.
Customer acceptance of our products could be impacted by changing educational standards. Customer acceptance of our products may be impacted by changing educational standards, such as the adoption of Common
Core or other rigorous state standards. While there could be opportunity for us, if customer acceptance of our products is negatively impacted by changing educational standards, our sales could decline or we may be required to expend more on investments in product development than planned.
Risks Related to Debt and Ownership of our Common Stock We do not foresee paying cash dividends in the foreseeable future and, as a result, our investors’ sole source of gain, if any, will depend on capital appreciation, if any.
We do not plan to declare or pay any cash dividends on our shares of common stock in the foreseeable future and currently intend to retain future earnings, if any, for future operation, debt reduction and expansion. Any decision to declare and pay dividends in the future will be made at the discretion of our board of directors and will depend on, among other things, our results of operations, financial condition, restrictions imposed by applicable law, business and investment strategy, contractual limitations and other factors that our board of directors may deem relevant. In addition, our ability to pay dividends may be limited by covenants of any existing and future indebtedness we or our subsidiaries incur, including the 9.75% senior secured notes (described below). As a result, our stockholders may not receive any return on an investment in our common stock unless they sell our common stock for a price greater than that which they paid for it. Moreover, investors may not be able to resell their shares of the Company at or above the price they paid for them.

13
The existence of a majority stockholder may adversely affect the market price of our common stock and could delay, hinder or prevent a change in corporate control or result in the entrenchment of management and the board of directors, and our majority stockholder has a contractual right to maintain its percentage ownership in our company.
VSS-Cambium Holdings III, LLC, owns a majority of our outstanding common stock. Accordingly, VSS-Cambium Holdings III, LLC will likely have the ability to determine the outcome of matters submitted to our stockholders for approval, including the election and removal of directors and any merger, consolidation or sale of all or substantially all our assets. In addition, VSS-Cambium Holdings III, LLC will likely have the ability to control our management, affairs and operations. Accordingly, this concentration of ownership may harm the market price of our common stock by delaying, deferring or preventing a change in control or impeding a merger, consolidation, takeover or other business combination.
The ownership of a large block of stock by a single stockholder may reduce our market liquidity. Should VSS-Cambium Holdings III, LLC determine to sell any of its position in the future, sales of substantial amounts of our common stock on the market, or even the possibility of these sales, may adversely affect the market price of our common stock. These sales, or even the possibility of these sales, also may make it more difficult for us to raise capital through the issuance of equity securities at a time and at a price we deem appropriate.
Moreover, VSS-Cambium Holdings III, LLC has a contractual right to maintain its percentage ownership in our company. Specifically, under the terms of a stockholders agreement entered into in connection with the mergers, if we were to engage in a new issuance of our securities, VSS-Cambium Holdings III, LLC and funds managed or controlled by VSS would have preemptive rights to purchase an amount of our securities that would enable them to maintain their same collective percentage of ownership in our company following the new issuance. VSS-Cambium Holdings III, LLC and funds managed or controlled by VSS would have these preemptive rights for so long as those entities collectively beneficially own, in the aggregate, at least 25% of the outstanding shares of our common stock. Thus, while other holders of our securities would risk suffering a reduction in percentage ownership in connection with a new issuance of securities by us, VSS-Cambium Holdings III, LLC and funds managed or controlled by VSS would, through this preemptive right, have the opportunity to avoid a reduction in percentage ownership.
We are a “controlled company” within the meaning of the NASDAQ rules and, as a result, qualify for, and rely on, exemptions from various corporate governance standards, which limits the presence of independent directors on our board of directors and board committees.
Due to the fact that VSS-Cambium Holdings III, LLC owns a majority of our outstanding common stock, we are deemed a “controlled company” for purposes of NASDAQ Rule 5615(c)(2). Under this rule, a company of which more than 50% of the voting power for the election of directors is held by an individual, a group or another company is a “controlled company” and is exempt from certain NASDAQ corporate governance requirements, including requirements that a majority of the board of directors consist of independent directors, that compensation of officers be determined or recommended to the board of directors by a majority of independent directors or by a compensation committee that is composed entirely of independent directors and that director nominees be selected or recommended for selection by a majority of the independent directors or by a nominating committee composed solely of independent directors. We intend to rely upon these exemptions. Accordingly, our stockholders may not have the same protections afforded to stockholders of other companies that are required to comply fully with the NASDAQ rules.
Since the “controlled company” exemption does not extend to the composition of audit committees, we are required to have an audit committee that consists of at least three directors, each of whom must be “independent” based on independence criteria set forth in Rule 10A-3 of the Securities Exchange Act of 1934 (the “Exchange Act”). Our board of directors has adopted an audit committee charter which will govern our audit committee. These three directors must also satisfy the requirements set forth in NASDAQ Rule 5605(a) and (c). The audit committee is currently composed entirely of independent directors.
Provisions of our organizational documents and Delaware law may delay or deter a change of control. Our organizational documents contain provisions that may have the effect of discouraging, delaying or preventing a change of
control of, or unsolicited acquisition proposals for, our company. These include provisions that: vest our board of directors with the sole power to set the number of directors of our company; limit the persons that may call special meetings of stockholders; establish advance notice requirements for stockholder proposals and director nominations; and limit stockholder action by written consent.
Also, our board of directors has the authority to issue shares of preferred stock in one or more series and to fix the rights and preferences of these shares, all without stockholder approval. Any series of preferred stock is likely to be senior to our common stock with respect to dividends, liquidation rights and, possibly, voting rights. The ability of our board of directors to issue preferred stock also could have the effect of discouraging unsolicited acquisition proposals, thus adversely affecting the market price of our common stock.

14
In addition, Delaware corporate law makes it difficult for stockholders that recently have acquired a large interest in a corporation to cause the merger or acquisition of the corporation against the directors’ wishes. Under Section 203 of the Delaware General Corporate Law (the “DGCL”), a Delaware corporation such as our company may not engage in any merger or other business combination with an interested stockholder or such stockholder’s affiliates or associates for a period of three years following the date that such stockholder became an interested stockholder, except in limited circumstances, including by approval of the corporation’s board of directors.
We have a significant amount of senior secured debt and will have the obligation to make interest payments and comply with restrictions contained in the credit agreements with our senior secured lenders.
We have $140.0 million aggregate principal amount outstanding of 9.75% senior secured notes due 2017. We are subject to risks associated with substantial indebtedness, including the risk that we will not be able to refinance existing
indebtedness when it becomes due, the risk that we would not be able to secure alternative financing if we are unable to comply with the debt covenants or if we were to experience an event of default, and the risk that our cash flows from operations are insufficient to make scheduled interest payments. We are required to make interest payments semi-annually in arrears on each February 15th and August 15th. If we are unable to generate sufficient cash flow from operations in the future to service our debt, we may be required to refinance all or a portion of our debt. However, we may not be able to obtain any such new or additional financing on favorable terms or at all.
The indenture governing the notes contain various covenants that limit our ability to, among other things, incur or guarantee additional indebtedness; pay dividends and make other restricted payments; incur restrictions on the payment of dividends or other distributions from our restricted subsidiaries; create or incur certain liens; make certain investments; transfer or sell assets; enter into operating leases; engage in transactions with affiliates; and merge or consolidate with other companies or transfer all or substantially all of our or our restricted subsidiaries’ assets.
Further, upon the occurrence of specific types of change of control events, we will be required to offer to repurchase outstanding notes at 101% of their principal amount plus accrued and unpaid interest. The source of funds for any such purchase of the notes will be our available cash or cash generated from our and our subsidiaries’ operations or other sources, including borrowings, sales of assets or sales of equity. Our failure to repurchase the notes upon a change of control would cause a default under the indenture governing the notes and a cross default under our revolving credit facility.
Item 1B. Unresolved Staff Comments. None.
Item 2. Properties.
Our principal corporate office is located in Dallas, Texas. We lease office and warehouse facilities in Dallas, Texas; Charlottesville, Virginia; Tucson, Arizona; Frederick, Colorado; Longmont, Colorado; Natick, Massachusetts; and Ann Arbor, Michigan. At December 31, 2014, our leased properties consisted of 309,651 square feet.
In conjunction with the outsourcing of our warehouse operations to a third party logistics provider, we have subleased one of our Frederick, Colorado facilities comprising approximately 200,420 square feet.
We believe the buildings and equipment used in our operations generally to be in good condition and adequate for our current needs and that additional space will be available as needed.
Item 3. Legal Proceedings. We are not presently engaged in any pending legal proceeding material to our financial condition, results of operations or
liquidity.
Item 4. Mine Safety Disclosures. None.

15
PART II
Item 5. Market for Registrant’s Common Equity, Related Stockholder Matters and Issuer Purchases of Equity Securities. Market Information
Our common stock is traded on the NASDAQ Capital Market under the symbol “ABCD.” Below are the high and low sale prices for each quarter in the years ended December 31, 2014 and 2013.
Year Ended December 31, 2014 2013 Fiscal Quarter High Low High Low First ........................................................................ $ 2.54 $ 1.59 $ 1.40 $ 0.93Second .................................................................... $ 2.40 $ 1.90 $ 1.50 $ 0.93Third ....................................................................... $ 2.25 $ 1.29 $ 1.85 $ 1.16Fourth ..................................................................... $ 2.10 $ 1.40 $ 1.82 $ 1.25
As of March 3, 2015, there were 603 holders of record of our common stock.
Purchases of Equity Securities
Shares of common stock repurchased by the Company during the quarter ended December 31, 2014 were as follows:
Issuer Purchases of Equity Securities
Total Number of
Shares Repurchased
Average Price Paid
per Share
Total Number of Shares
Purchased as Part of
Publicly Announced
Plans or Programs
Maximum Dollar Value of Shares that May Yet be Purchased Under the Program
October 1st — October 31st ............................... — $ — — $ —November 1st — November 30th ....................... 193,416 $ 1.70 — $ —December 1st — December 31st ........................ — $ — — $ —
In November 2014, the Company’s Board of Directors authorized the Company to repurchase 193,416 shares of its common stock at $1.70 per share in a private transaction.
Dividends
We have not declared or paid any cash dividends to our stockholders. Any future determination to pay dividends, if any, will be at the discretion of our board of directors and will be subject to our ability to pay dividends, which may be limited by covenants of any existing and future indebtedness we or our subsidiaries incur, including the 9.75% senior secured notes, described below. We do not presently expect to pay any dividends.
Securities Authorized for Issuance Under Equity Compensation Plans
We have securities authorized for issuance under the Cambium Learning Group, Inc. 2009 Equity Incentive Plan (“Incentive Plan”). In connection with the then pending merger with Voyager Learning Company, on July 31, 2009, the Company’s board of directors and sole stockholder approved the Incentive Plan. The general purposes of the Incentive Plan are to attract and retain the best available personnel for positions of substantial responsibility, to provide additional incentives to employees, directors and consultants, and to promote the success of the Company.

16
Securities authorized for issuance under equity compensation plans at December 31, 2014 are as follows:
(in thousands, except per share amounts)
Plan Category
Number of securities to be issued upon exercise of
outstanding options
Weighted-average exercise
price of outstanding options
Number of securities
remaining availablefor future issuance
under equity incentive plans (a)
Equity compensation plans approved by security holders ...................................... 2,602 $ 1.49 2,252Equity compensation plans not approved by security holders .................................. — $ — —
Total .................................................... 2,602 $ 1.49 2,252
(a) Excludes securities reflected in the first column, “Number of securities to be issued upon exercise of outstanding options,” and issued restricted stock.
Item 6. Selected Financial Data. This item is not required for a smaller reporting company.
Item 7. Management’s Discussion and Analysis of Financial Condition and Results of Operations.
This section should be read in conjunction with the Consolidated Financial Statements of the Company and the notes thereto included in this Annual Report on Form 10-K for the year ended December 31, 2014.
Organization of Information Management’s Discussion and Analysis of Financial Condition and Results of Operations includes the following sections: Overview Results of Operations Strategy and Outlook Year Ended December 31, 2014 Compared to Year Ended December 31, 2013 Liquidity and Capital Resources Non-GAAP Measures Capital Expenditures Outlook Commitments and Contractual Obligations Off-Balance Sheet Arrangements Critical Accounting Policies and Estimates Recently Issued Financial Accounting Standards
Overview Form of Organization
On December 8, 2009, we completed the business combination of Cambium and Voyager Learning Company (“VLCY”) as contemplated by the Agreement and Plan of Mergers, dated as of June 20, 2009, among us, VLCY, Vowel Acquisition Corp., our wholly-owned subsidiary, Cambium, a wholly-owned subsidiary of VSS-Cambium Holdings III, LLC, Consonant Acquisition Corp., our wholly owned subsidiary, and Vowel Representative, LLC, solely in its capacity as stockholders’ representative. We refer to this agreement and plan of mergers in this report as the merger agreement. Pursuant to the merger agreement, we acquired all of the common stock of each of Cambium and VLCY through the merger of Consonant Acquisition Corp. with and into Cambium, with Cambium continuing as the surviving corporation (the “Cambium Merger”), and the concurrent merger of Vowel Acquisition Corp. with and into VLCY, with VLCY continuing as the surviving corporation (the “Voyager Merger”). As a result of the effectiveness of the mergers, Cambium and VLCY became our wholly owned subsidiaries.

17
Segments
We have four reportable segments with separate management teams and infrastructures that offer various products and services: Learning A-Z, Voyager Sopris Learning, ExploreLearning, and Kurzweil Education. Segment results of operations also include Other, which consists of unallocated shared services, such as accounting, legal, human resources and corporate related items, as well as depreciation and amortization expense, goodwill impairment, interest income and expense, other income and expense, and income taxes. We do not allocate any of these costs to our segments, and our chief operating decision maker evaluates performance of operating segments excluding these items.
Results of Operations
Bookings, previously referred to as order volume, is an internal metric that measures the total dollar value of customer orders in a period, regardless of the timing of the related revenue recognition and is a leading indicator of revenues. During 2014, consolidated Bookings were down 5% compared to 2013, with percentage change by segment as follows:
Learning A-Z increased 30%, continuing its trend of double-digit growth due to a compelling value proposition and strong execution of product development, sales and marketing
Voyager Sopris Learning decreased 20%, with declines in legacy print-based products outpacing gains from newer technology-enabled solutions
ExploreLearning increased 1%, which was lower growth than the segment experienced in prior years due to 2013 including several large multi-year deals, creating a tough comparable year
Kurzweil Education decreased 24%, due to the segment transitioning to a subscription model from a perpetual model and competition from free and low-priced, but less comprehensive, special education text-to-speech solutions
We continue to execute our strategy to shift resources to subscription and technology-enabled products. For the year ended December 31, 2014, 60% of Bookings (order volume) were generated by technology-enabled products versus 46% for the same period of 2013. For purposes of this metric, technology-enabled products are defined as those products that are sold primarily as a technology-based solution or that could be used solely using a digital platform. For the Voyager Sopris Learning segment, several products classified as technology-enabled include supplemental print materials.
GAAP net revenues decreased in 2014 by 6% to $141.7 million, compared to $150.5 million in 2013. GAAP net revenues by segment in 2014 and the percentage change from 2013 were as follows:
Learning A-Z: $44.4 million, increased 33%, consistent with its ongoing strong Bookings trend
Voyager Sopris Learning: $71.2 million, decreased 21%, consistent with its Bookings
ExploreLearning: $18.1 million, increased 11%, higher than its Bookings increase in 2014 due to the recognition of prior period Bookings, which are recognized pro-rata over the applicable subscription periods
Kurzweil Education: $8.0 million, decreased 23%, consistent with its Bookings
The following strategic initiatives have also impacted results of operations and cash flows:
To facilitate expected growth in our Learning A-Z and ExploreLearning segments, we made investments in 2013 and 2014 in our product development and sales and marketing, which increased costs as a percentage of net revenues within these segments for the full year 2014.
Right-sizing cost structure efforts completed by Voyager Sopris Learning have helped offset top-line declines.
The increasing contribution from higher margin technology-enabled products positively impacted our earnings.
Capital expenditures have increased as we continue to invest in the development of technology-enabled products that prepare students to achieve and thrive in increasingly rigorous testing environments.

18
Strategy and Outlook
Based on the success of our technology-enabled products, 2015 is planned to be a year of investment in which we build a platform for continued consolidated Company growth. As Learning A-Z, ExploreLearning, and newer products in our other segments like LANGUAGE! Live and firefly have already shown, we have a tremendous opportunity to transform our business model through continued strong execution of our development, marketing and sales plans. Therefore, we will continue to deploy cash generated by legacy products to invest in high-return technology-enabled opportunities and selectively expand our sales and marketing capabilities, maintaining careful oversight of the relationship of our cost base to Bookings and revenue performance, to create a higher-margin, growing business. Bookings generated by our faster growing technology-enabled solutions may grow to 70% or more of our 2015 total. Ultimately, we want our success as a provider of solutions that help all students reach their full potential to also drive strong returns for our stakeholders.
The essential tenets of our strategy continue to be:
Deliver effective solutions that meet the needs of today’s educators. Our products include robust, evidence-based solutions that empower educators and raise the achievement levels of all students. While we regularly receive industry awards for market leadership in innovative educational products and programs, it is our commitment to help all students reach their full potential that drives Cambium Learning Group. It is our objective to create adaptive, personalized instruction solutions for students throughout the United States and worldwide.
Continue to invest in technology-enabled solutions. Technology-enabled solutions include purely online products like Learning A-Z and ExploreLearning, as well as products like the new intervention programs being developed by Voyager Sopris Learning or the online Kurzweil solution named firefly. Our products and programs are designed to help teachers around the world address the increasingly wide range of individual needs and potential of every student in their classroom. We are committed to leveraging technology to make a difference for students.
Demonstrate the Company’s belief in the importance of the teacher. We believe in the importance of the teacher’s role as the key to learning and the single most important catalyst for learners in the foreseeable future. Products and professional services are designed to increase teacher effectiveness by providing information about their students, the resources to propel their students forward, and the professional development to have teachers increase both their own skills and those of their students.
Forge strong partnerships with our customers. We are committed to stellar customer service and expert implementation and training services. As part of this commitment, we place high importance on cybersecurity, and provide vigilance and protection over privacy and data security for the kids who use our products.
Our strategy specific to each segment includes the following:
Learning A-Z: We will pursue aggressive investment in Learning A-Z products to support continued strong double-digit growth of the segment. Learning A-Z’s products’ compelling value proposition is centered upon its quality content and award-winning technology, and the segment will continue to invest heavily in product development. Additionally, investments will be made in Learning A-Z’s sales and marketing to increase domestic and international penetration. EBITDA and Cash Income margins are anticipated to continue to be strong, but are expected to decline slightly in 2015 versus 2014 as a result of these investments in growth. Capital expenditures for product development are expected to range from $7.0 million to $7.5 million in 2015.
Voyager Sopris Learning: This segment will continue its transition to technology-enabled solutions, which we believe is necessary for the future growth of Voyager Sopris Learning and will result in more effective, affordable solutions for customers. Bookings for purely print-based solutions that make up legacy products are expected to continue to decline and the decline in these older products is expected to outpace Bookings generated by newer technology-enabled offerings during 2015. Also, as opposed to print orders, for which GAAP revenues are typically recognized up front at the time of shipment, GAAP revenues for technology orders are generally recognized pro rata over the subscription period. Therefore, the transition to more technology-enabled products will put pressure on GAAP revenues for several years. Voyager Sopris Learning plans to continue investment in new product development, and capital expenditures for product development in 2015 are expected to range from $7.0 million to $7.5 million. Although 2015 margins are likely to be lower due to declining Bookings, the longer cycle for GAAP revenue recognition, and the consistent level of product development spending, the transition to technology-enabled solutions combined with cost right-sizing activities completed in 2014 should result in improved EBITDA and Cash Income margins for this segment over time. Assuming Voyager Sopris Learning continues to progress as expected, this segment could return to Bookings growth in 2016.
19
ExploreLearning: This segment will focus on accelerating top-line growth in 2015 primarily by increasing geographic penetration in the United States and Canada. EBITDA and Cash Income margins will continue to be strong and are expected to remain constant or increase slightly as more scale is achieved. Capital expenditures for product development are expected to increase as ExploreLearning continues to invest in development of its Gizmos and Reflex product lines, and are expected to range from $2.1 million to $2.4 million in 2015.
Kurzweil Education: This segment will continue to focus its resources on development and expansion of its firefly online subscription solution. Bookings are expected to contract in 2015, although at a lower percentage than Kurzweil Education experienced in 2014. Adjusted EBITDA and Cash Income are expected to decline commensurately. Capital expenditures for product development are expected to range from $0.4 million to $0.6 million in 2015.
Company-wide Bookings are expected to be up slightly in 2015 compared to 2014. We expect continued strong double-digit Bookings growth in Learning A-Z and higher Bookings growth in ExploreLearning than the 1% experienced in 2014, which was impacted by tough comparables in 2013. 2015 is expected to further transform the Voyager Sopris Learning and Kurzweil Education segments, where Bookings are expected to decline but at a lower percentage than the 20% and 24%, respectively, experienced in 2014. Assuming our strategies for Voyager Sopris Learning and Kurzweil Education continue to progress on plan, Bookings in each of these segments could return to growth in 2016. Our objective is to build a platform for growth in 2016.

20
Year Ended December 31, 2014 Compared to Year Ended December 31, 2013
Year Ended
December 31, 2014 Year Ended
December 31, 2013 Year Over Year ChangeFavorable/(Unfavorable)
(in thousands) Amount % of
Revenues Amount % of
Revenues $ % Net revenues:
Product revenues Learning A-Z ........................................................ $ 44,385 31.3% $ 33,483 22.2 % $ 10,902 32.6%Voyager Sopris Learning ...................................... 61,394 43.3% 78,115 51.9 % (16,721) (21.4)%ExploreLearning ................................................... 18,138 12.8% 16,279 10.8 % 1,859 11.4%Kurzweil Education .............................................. 7,995 5.6% 10,418 6.9 % (2,423) (23.3)%
Service revenues Voyager Sopris Learning ...................................... 9,835 6.9% 12,225 8.1 % (2,390) (19.6)%
Total net revenues ......................................................... 141,747 100.0% 150,520 100.0 % (8,773) (5.8)%Cost of revenues:
Cost of product revenues Learning A-Z ........................................................ 1,586 1.1% 908 0.6 % (678) (74.7)%Voyager Sopris Learning ...................................... 25,831 18.2% 32,803 21.8 % 6,972 21.3%ExploreLearning ................................................... 2,867 2.0% 2,249 1.5 % (618) (27.5)%Kurzweil Education .............................................. 1,800 1.3% 2,290 1.5 % 490 21.4%
Cost of service revenues Voyager Sopris Learning ...................................... 5,790 4.1% 8,438 5.6 % 2,648 31.4%
Amortization expense .............................................. 18,270 12.9% 17,519 11.6 % (751) (4.3)%Total cost of revenues ................................................... 56,144 39.6% 64,207 42.7 % 8,063 12.6%Research and development expense .............................. 11,091 7.8% 9,810 6.5 % (1,281) (13.1)%Sales and marketing expense ........................................ 41,431 29.2% 42,233 28.1 % 802 1.9%General and administrative expense .............................. 19,357 13.7% 21,341 14.2 % 1,984 9.3%Shipping and handling costs .......................................... 1,469 1.0% 1,722 1.1 % 253 14.7%Depreciation and amortization expense ........................ 4,209 3.0% 4,895 3.3 % 686 14.0%Impairment of long-lived assets .................................... — 0.0% 2,227 1.5 % 2,227 100.0%Embezzlement-related expense ..................................... — 0.0% 118 0.1 % 118 100.0%Income (loss) before interest, other income (expense) and income taxes ........................................................ 8,046 5.7% 3,967 2.6 % 4,079 102.8%Net interest expense ...................................................... (17,659) (12.5)% (18,819) (12.5 )% 1,160 6.2%Loss on extinguishment of debt .................................... (922) (0.7)% — 0.0 % (922) –– Other income, net .......................................................... 1,180 0.8% 764 0.5 % 416 54.5%Income tax expense ....................................................... (600) (0.4)% (165) (0.1 )% (435) (263.6)%Net loss ......................................................................... $ (9,955) (7.0)% $ (14,253) (9.5 )% $ 4,298 30.2%
Net revenues
Net revenues for the year ended December 31, 2014 decreased $8.8 million, or 5.8%, to $141.7 million from $150.5 million in the same period of 2013. Bookings (order volume) declined 4.7% compared to 2013. Our percentage decline in Bookings was less than the percentage decline in our net revenues because our order mix continues to shift towards technology-enabled products, which typically result in pro-rata revenue recognition over the life of the applicable contract. As a result of this shift in mix, a larger portion of our 2014 Bookings were deferred for revenue recognition purposes relative to prior year. Net revenues by segment were as follows:
Learning A-Z’s net revenues increased $10.9 million, or 32.6%, to $44.4 million in the year ended December 31, 2014 compared to the same period of 2013. Revenue growth was fueled by continued strong double-digit growth in Bookings due to a compelling value proposition and strong execution of product development, sales and marketing.
Voyager Sopris Learning’s net revenues decreased $19.1 million, or 21.2%, to $71.2 million in the year ended December 31, 2014 compared to the same period of 2013. The year-over-year change was the result of lower Bookings, with declines in legacy print-based products outpacing gains from newer technology-enabled solutions.

21
ExploreLearning’s net revenues increased $1.9 million, or 11.4%, to $18.1 million in the year ended December 31, 2014 compared to the same period of 2013. Revenue growth outpaced Bookings growth during the year as a result of the recognition of prior period Bookings, which are recognized pro-rata over the applicable subscription period.
Kurzweil Education’s net revenues decreased $2.4 million, or 23.3%, to $8.0 million in the year ended December 31, 2014 compared to the same period of 2013. The decline in revenue was the result of lower Bookings, driven by the segment’s transition to a subscription model from a perpetual model combined with competition from free and low-priced, but less comprehensive, special education text-to-speech solutions.
Cost of revenues
Cost of product revenues include expenses to print, purchase, handle and warehouse product, as well as order processing and royalty costs while cost of service revenues include costs to provide services and support to our customers. Total cost of revenues, excluding amortization, decreased $8.8 million, or 18.9%, to $37.9 in the year ended December 31, 2014 compared to the same period of 2013. The year-over-year decline in cost of revenues was primarily due to lower Bookings within the Voyager Sopris Learning segment. Cost of revenues by segment were as follows:
Learning A-Z’s cost of revenues increased $0.7 million, or 74.7%, to $1.6 million in the year ended December 31, 2014 compared to same the period of 2013. The increase in cost of revenues was due to increased costs related to supporting the expanding subscriber base as well as new customer implementations as a result of the continued trend of strong Bookings growth.
Voyager Sopris Learning’s cost of revenues decreased $9.6 million, or 23.3%, to $31.6 million in the year ended December 31, 2014 compared to the same period of 2013. This year-over-year decline was driven by lower Bookings.
ExploreLearning’s cost of revenues increased $0.6 million, or 27.5%, to $2.9 million in the year ended December 31, 2014 compared to the same period of 2013. The increase in cost of revenues is primarily due to increased costs related to implementation and training due to the segment’s increased level of customer support.
Kurzweil Education’s cost of revenues decreased $0.5 million, or 21.4%, to $1.8 million in the year ended December 31, 2014 compared to the same period of 2013. This year-over-year decline was driven by lower Bookings.
Amortization expense
Amortization expense included in cost of revenues includes amortization for acquired pre-publication costs and technology, acquired publishing rights, and ongoing pre-publication and technology product development. Amortization for the year ended December 31, 2014 increased $0.8 million, or 4.3%, to $18.3 million compared to the same period of 2013.
Research and development expense
Research and development expense includes costs to research, evaluate and develop educational products, net of capitalization. Research and development expense increased $1.3 million, or 13.1%, to $11.1 million for the year ended December 31, 2014 compared to the same period of 2013 as we continue to invest in our product offerings.
Sales and marketing expense
Sales and marketing expense includes all costs to maintain our various sales channels, including the salaries and commissions paid to our sales force, and costs related to our advertising and marketing efforts. Sales and marketing expense decreased $0.8 million or 1.9%, to $41.4 million for the year ended December 31, 2014 compared to same period of 2013. This decline was primarily the result of lower expense in Voyager Sopris Learning due to lower Bookings during the year combined with management’s continued focus on the cost structure of slower-growing or declining areas of the Company. The lower level of expense in Voyager Sopris Learning was partially offset by planned investments in both Learning A-Z and ExploreLearning.
General and administrative expense
General and administrative expense decreased $2.0 million, or 9.3%, to $19.4 million for the year ended December 31, 2014 compared to the same period of 2013. This decline was primarily due to severance charges recorded in connection with the management transition completed in the first quarter of 2013 totaling $1.5 million combined with lower incentive compensation expense in 2014.
Shipping and handling costs
Shipping costs decreased $0.3 million, or 14.7%, to $1.5 million for the year ended December 31, 2014 compared to the same period of 2013. This decline was primarily attributable to the reduction in Bookings within Voyager Sopris Learning as discussed above. Shipping and handling costs totaled 1.0% of net revenues for the year ended December 31, 2014, in-line with 2013.

22
Depreciation and amortization expense
Depreciation and amortization expense decreased $0.7 million, or 14.0%, to $4.2 million for the year ended December 31, 2014 compared to the same period of 2013.
Impairment of long-lived assets
During the year ended December 31, 2013, we recorded impairments totaling $2.2 million for product lines and previously capitalized projects that were to be abandoned or deemed to have no ongoing value. See Note 13 — Fair Value of Financial Instruments to the Consolidated Financial Statements for further information regarding these charges.
Net interest expense
Net interest expense decreased $1.2 million, or 6.2%, to $17.7 million for the year ended December 31, 2014 compared to the same period of 2013. The decrease in net interest expense is primarily due to lower average debt balances during 2014 as a result of the repurchase of $35.0 million aggregate principal amount of debt during the year, combined with the termination of the ABL Facility on March 26, 2014. See Note 14 — Long-Term Debt to the Consolidated Financial Statements for further information.
Loss on extinguishment of debt
During the year ended December 31, 2014, we repurchased $35.0 million aggregate principal amount of our senior secured notes due 2017 for approximately $35.0 million, plus accrued and unpaid interest. We recognized a Loss on Extinguishment of Debt of approximately $0.7 million in connection with the repurchases, which was primarily due to the write-off of unamortized deferred financing costs. Additionally, during the year ended December 31, 2014, a Loss on Extinguishment of Debt of $0.2 million was recognized in connection with the termination of the ABL Facility related to the write-off of unamortized deferred financing costs. See Note 14 — Long-Term Debt to the Consolidated Financial Statements for further information.
Other income, net
Other income, net increased $0.4 million to $1.2 million in the year ended December 31, 2014 compared to the same period of 2013 primarily due to a settlement associated with a domain name during the third quarter of 2014.
Income tax expense
We recorded income tax expense of $0.6 million in 2014 and $0.2 million in 2013. We continue to maintain a valuation allowance against our deferred tax assets, which eliminated any deferred tax benefit generated. The year over year increase is due to state income taxes, where we are reporting higher taxable income for certain legal entities in states that have separate or consolidated nexus reporting requirements.
Liquidity and Capital Resources Sales seasonality affects operating cash flow, and as a result, we normally incur a net cash deficit from all of our activities
through the early part of the third quarter of the year. We typically fund these seasonal deficits through the drawdown of cash. The cash balance as of December 31, 2014 was $34.4 million. The primary sources of liquidity are our current cash balances and our annual cash flow from operations and the primary liquidity requirements relate to interest on our long-term debt, product development costs and working capital. We believe that based on current and anticipated levels of operating performance and cash flow from operations, we will be able to make required interest payments on our debt and fund our working capital and capital expenditure requirements for the next 12 months. In the event we need access to short-term financing during the seasonal low point in cash, we believe that we could secure such financing on terms acceptable to us.
Long-term debt Senior Secured Notes Due 2017
In February 2011, the Company closed an offering of $175.0 million aggregate principal amount of 9.75% senior secured notes due 2017 (the “Notes”). Deferred financing costs, net of accumulated amortization, are capitalized in Other Assets in the Consolidated Balance Sheets and are amortized over the term of the related debt using the effective interest method. Unamortized deferred financing costs at December 31, 2014 and 2013 were $2.3 million and $4.5 million, respectively, related to the Notes and the ABL Facility (as defined and described below), which was terminated in the quarter ended March 31, 2014.
Interest on the Notes accrues at a rate of 9.75% per annum from the date of original issuance and is payable semi-annually in arrears on each February 15th and August 15th to the holders of record of the Notes on the immediately preceding February 1st and August 1st. No principal repayments are due until the maturity date of the Notes.

23
The Notes are secured by (i) a first priority lien on substantially all of the Company’s assets, including capital stock of the guarantors (which are certain of the Company’s subsidiaries), and (ii) a second-priority lien, prior to the termination of the ABL Facility, on substantially all of the inventory and accounts receivable and related assets of the ABL Credit Parties, in each case, subject to certain permitted liens. The Notes also contain customary covenants, including limitations on the Company’s ability to incur debt, and events of default as defined by the agreement. The Company may, at its option, redeem the Notes prior to their maturity based on the terms included in the agreement.
During the year ended December 31, 2014, the Company repurchased $35.0 million aggregate principal amount of its senior secured notes due 2017 for approximately $35.0 million, plus accrued and unpaid interest. The Company recognized a Loss on Extinguishment of Debt of approximately $0.7 million in connection with the repurchases, which was primarily due to the write-off of unamortized deferred financing costs.
The Notes mature on February 15, 2017. We believe that we will be able to refinance any principal amount outstanding under the Notes at or before this date on terms acceptable to us.
ABL Facility
In February 2011, the Company’s wholly owned subsidiary, Cambium Learning, Inc. (together with its wholly owned subsidiaries, the “ABL Credit Parties”), entered into a credit facility (the “ABL Facility”) pursuant to a Loan and Security Agreement (the “ABL Loan Agreement”), by and among the ABL Credit Parties, Harris N.A., individually and as Agent (the “Agent”) for any ABL Lender (as hereinafter defined) which is or becomes a party to said ABL Loan Agreement, certain other lenders party thereto (together with Harris N.A. in its capacity as a lender, the “ABL Lenders”), Barclays Bank PLC, individually and as Collateral Agent, and BMO Capital Markets and Barclays Capital, as Joint Lead Arrangers and Joint Book Runners. The ABL Facility consisted of a four-year $40.0 million revolving credit facility, which included a $5.0 million subfacility for swing line loans and a $5.0 million subfacility for letters of credit.
The ABL Facility was, subject to certain exceptions, secured by a first-priority lien on the ABL Credit Parties’ inventory and accounts receivable and related assets and a second-priority lien (junior to the lien securing the ABL Credit Parties’ obligations with respect to the Notes) on substantially all of the ABL Credit Parties’ other assets.
The ABL Credit Parties were required to pay, quarterly in arrears, an unused lien fee equal to the product of (x) either 0.375% or 0.50% (depending upon the ABL Credit Parties’ fixed charge coverage ratio at the time) and (y) the average daily unused amount of the revolver. The ABL Facility contained a financial covenant that generally required the ABL Credit Parties to maintain, on a consolidated basis, either (i) excess availability of at least the greater of $8.0 million and 15% of the revolver commitment or (ii) a fixed charge coverage ratio of 1.1 to 1.0.
During the quarter ended March 31, 2014, the Company’s excess availability and fixed charge coverage ratios fell below the required thresholds, which put the Company in a Trigger Period, as defined under the ABL Loan Agreement. On March 26, 2014, the Company had no borrowings outstanding under the agreement and terminated the ABL Facility. A Loss on Extinguishment of Debt of approximately $0.2 million was recognized in connection with the termination related to the write-off of unamortized deferred financing costs.
Cash flows Cash from operations is seasonal, with more cash generated in the second half of the year than in the first half of the year. Cash
is historically generated during the second half of the year because the buying cycle of school districts generally starts at the beginning of each new school year in the fall. Cash provided by (used in) our operating, investing and financing activities is summarized below:
Year Ended December 31, (in thousands) 2014 2013 Operating activities ........................................................ $ 23,643 $ 45,786 Investing activities ......................................................... (20,669) (23,788 )Financing activities ........................................................ (36,580) (5,909 )
Operating activities. Cash provided by operating activities was $23.6 million and $45.8 million for the years ended December 31, 2014 and 2013, respectively. In addition to lower Bookings, cash flow from operations were impacted by the movement of $1.7 million of cash to certificates of deposit to collateralize certain letters of credit, which were previously collateralized by the ABL Facility prior to its termination. A significant portion of the 2013 cash provided by operations is related to tax refunds received from the state of Michigan and the release of escrow from a potential tax indemnity obligation which totaled $12.3 million and $3.0 million, respectively.

24
Investing activities. Cash used in investing activities was $20.7 million and $23.8 million for the years ended December 31, 2014 and 2013, respectively. Capital expenditures were $1.8 million higher in the year ended December 31, 2014 compared to the same period of 2013 as we continue to make strategic investments in our product offerings. Cash outflows in 2014 include a Headsprout acquisition payment of $3.6 million, offset by proceeds from the IntelliTools product line sale of $0.8 million. Cash outflows in the year ended December 31, 2013 include the final contingent value rights payment of $7.7 million.
Financing activities. Cash used in financing activities was $36.6 million and $5.9 million for the years ended December 31, 2014 and 2013, respectively. The year ended December 31, 2014 includes the repurchase of $35.0 million of our senior secured notes due 2017, as well as cash payments of $0.6 million in conjunction with share repurchases. Cash outflows in the year ended December 31, 2013 include shares repurchases totaling $4.6 million.
Non-GAAP Measures The Company uses the following non-GAAP financial measures to monitor and evaluate the operating performance of the
Company and as a basis to set and measure progress towards performance targets, which directly affect compensation for employees and executives: Bookings (order volume), EBITDA, Adjusted EBITDA, and Cash Income.
Bookings (order volume) measure the total dollar value of customer orders in a period, regardless of the timing of the related revenue recognition and is a leading indicator of revenue.
EBITDA is earnings (loss) from operations before interest, income taxes, and depreciation and amortization.
Adjusted EBITDA is EBITDA excluding non-operational and non-cash items. Examples of items excluded from Adjusted EBITDA include stock-based compensation, merger, acquisition and disposition activities, and certain impairment charges.
Cash Income reduces Adjusted EBITDA for capital expenditures and removes the timing differences for recognition of deferred revenues and related deferred costs.
Bookings (order volume), EBITDA, Adjusted EBITDA and Cash Income are not prepared in accordance with GAAP and may be different from similarly named, non-GAAP financial measures used by other companies. Non-GAAP financial measures should not be considered a substitute for, or superior to, measures of financial performance prepared in accordance with GAAP. We believe that these non-GAAP measures provide useful information to investors because they reflect the underlying performance of the ongoing operations of the Company and provide investors with a view of the Company’s operations from management’s perspective. Net loss reported on a GAAP basis includes material non-operational and non-cash items while Adjusted EBITDA and Cash Income remove significant purchase accounting, non-operational or certain non-cash items from earnings. We generally use these non-GAAP measures as measures of operating performance and not as measures of liquidity. Our presentation of Bookings (order volume), EBITDA, Adjusted EBITDA and Cash Income should not be construed as an indication that our future results will be unaffected by unusual, non-operational or non-cash items.

25
Below are reconciliations of Bookings to Net Revenues and of Net Loss to Cash Income for the years ended December 31, 2014 and 2013.
Reconciliation of Bookings to Net Revenues
Year Ended December 31, (in thousands) 2014 2013 Bookings (order volume) .............................................. $ 150,648 $ 158,016 Change in deferred revenues ......................................... (9,876) (9,301 ) Other (a) ......................................................................... 975 1,805
Net revenues ............................................................ $ 141,747 $ 150,520
Reconciliation of Net Loss to Cash Income
Year Ended December 31, (in thousands) 2014 2013 Net loss .......................................................................... $ (9,955) $ (14,253 )Reconciling items between net loss and EBITDA:
Depreciation and amortization expense .................... 22,479 22,414 Net interest expense .................................................. 17,659 18,819 Income tax expense .................................................. 600 165
Income from operations before interest, income taxes, and depreciation and amortization (EBITDA) .............................................. 30,783 27,145 Non-operational or non-cash costs included in EBITDA but excluded from Adjusted EBITDA:
Impairment of long-lived assets (f) ............................ — 1,189 Other income, net ..................................................... (1,180) (764 )Loss on extinguishment of debt ................................ 922 — Merger, acquisition and disposition activities (c) ...... 1,116 732 Stock-based compensation and expense (d) ............... 511 1,080 Embezzlement-related expense (e) ............................ — 118 Adjustments related to purchase accounting (b) ........ — 95 Adjustments to CVR liability (g) ............................... — 74 Management transition (h) ......................................... — 1,501
Adjusted EBITDA ......................................................... 32,152 31,170 Change in deferred revenues .......................................... 9,876 9,301 Change in deferred costs ................................................ (1,004) (1,308 )Capital expenditures ...................................................... (17,875) (16,115 )Cash income ................................................................... $ 23,149 $ 23,048

26
Reconciliation of Bookings to Net Revenues by Segment
Year Ended December 31, 2014
(in thousands) Learning
A-Z
Voyager Sopris
Learning ExploreLearning Kurzweil Education Consolidated
Bookings (order volume) .................................... $ 52,085 $ 70,741 $ 19,810 $ 8,012 $ 150,648 Change in deferred revenues ............................... (7,715) (522) (1,598 ) (41) (9,876)Other (a)................................................................ 15 1,010 (74 ) 24 975
Net revenues .................................................. $ 44,385 $ 71,229 $ 18,138 $ 7,995 $ 141,747
Reconciliation of Net Income (Loss) to Cash Income by Segment
Year Ended December 31, 2014
(in thousands) Learning
A-Z
Voyager Sopris
Learning ExploreLearning Kurzweil Education Other Consolidated
Net income (loss) ....................................... $ 23,739 $ 14,616 $ 5,058 $ 1,767 $ (55,135) $ (9,955)Reconciling items between net loss and EBITDA:
Depreciation and amortization expense .............................................. — — — — 22,479 22,479 Net interest expense .............................. — — — — 17,659 17,659 Income tax expense .............................. — — — — 600 600
Income from operations before interest, income taxes, and depreciation and amortization (EBITDA) ............................................... 23,739 14,616 5,058 1,767 (14,397) 30,783 Non-operational or non-cash costs included in EBITDA but excluded from Adjusted EBITDA:
Other income, net ................................. — — — — (1,180) (1,180)Loss on extinguishment of debt ............ — — — — 922 922 Merger, acquisition and disposition activities (c) ................................................................ — — — — 1,116 1,116 Stock-based compensation and expense .............................................. 141 132 63 16 159 511
Adjusted EBITDA...................................... 23,880 14,748 5,121 1,783 (13,380) 32,152 Change in deferred revenues ...................... 7,715 522 1,598 41 — 9,876 Change in deferred costs ............................ (904) (132) 61 (29 ) — (1,004)Adjusted EBITDA excluding effect of deferred revenues and deferred costs .......................................... 30,691 15,138 6,780 1,795 (13,380) 41,024 Capital expenditures pre-publication costs ........................................................ (4,241) (3,142) (535) — — (7,918)Capital expenditures software development costs ................................... (1,385) (4,272) (1,067) (530 ) (31) (7,285)Capital expenditures general expenditures ............................................ — — — — (2,672) (2,672)Cash income ............................................... $ 25,065 $ 7,724 $ 5,178 $ 1,265 $ (16,083) $ 23,149

27
Reconciliation of Bookings to Net Revenues by Segment
Year Ended December 31, 2013
(in thousands) Learning
A-Z
Voyager Sopris
Learning ExploreLearning Kurzweil Education Consolidated
Bookings (order volume) ................................... $ 39,974 $ 87,901 $ 19,594 $ 10,547 $ 158,016 Change in deferred revenues .............................. (6,492) 835 (3,432 ) (212) (9,301)Other (a)............................................................... 1 1,604 117 83 1,805
Net revenues ................................................. $ 33,483 $ 90,340 $ 16,279 $ 10,418 $ 150,520
Reconciliation of Net Income (Loss) to Cash Income by Segment
Year Ended December 31, 2013
(in thousands) Learning
A-Z
Voyager Sopris
Learning ExploreLearning Kurzweil Education Other Consolidated
Net income (loss) ....................................... $ 18,968 $ 16,946 $ 4,878 $ 3,642 $ (58,687) $ (14,253)Reconciling items between net loss and EBITDA:
Depreciation and amortization expense .............................................. — — — — 22,414 22,414 Net interest expense .............................. — — — — 18,819 18,819 Income tax expense .............................. — — — — 165 165
Income from operations before interest, income taxes, and depreciation and amortization (EBITDA) .......................... 18,968 16,946 4,878 3,642 (17,289) 27,145 Non-operational or non-cash costs included in EBITDA but excluded from Adjusted EBITDA:
Impairment of long-lived assets (f) ........ — — — — 1,189 1,189 Other income, net ................................. — — — — (764) (764)Merger, acquisition and disposition activities (c) ......................................... — — — — 732 732 Stock-based compensation and expense (d) ............................................. 113 269 76 11 611 1,080 Embezzlement-related expense (e) ......... — — — — 118 118 Adjustments related to purchase accounting (b) ...................................... 20 20 55 — — 95 Adjustments to CVR liability (g) ........... — — — — 74 74 Management transition (h) ..................... — — — — 1,501 1,501
Adjusted EBITDA...................................... 19,101 17,235 5,009 3,653 (13,828) 31,170 Change in deferred revenues ...................... 6,492 (835) 3,432 212 — 9,301 Change in deferred costs ............................ (826) 179 (544) (117 ) — (1,308)Adjusted EBITDA excluding effect of deferred revenues and deferred costs ...... 24,767 16,579 7,897 3,748 (13,828) 39,163 Capital expenditures pre-publication costs ........................................................ (3,101) (3,513) (577) — — (7,191)Capital expenditures software development costs ................................... (1,300) (3,597) (885) (418 ) (155) (6,355)Capital expenditures general expenditures ............................................ — — — — (2,569) (2,569)Cash income ............................................... $ 20,366 $ 9,469 $ 6,435 $ 3,330 $ (16,552) $ 23,048

28
(a) Other comprises timing differences between the invoicing of a transaction, which generates Bookings, and its recognition as either net revenues or deferred revenue. The most common reasons for these timing differences include product that is shipped from our warehouse and invoiced but not recognized as revenues until physical delivery due to shipping terms, adjustments to the allowance for estimated sales returns, and revenue under contract that is earned and recognized in one period but invoiced in a subsequent period.
(b) Under applicable accounting guidance for business combinations, an acquiring entity is required to recognize all of the assets acquired and liabilities assumed in a transaction at the acquisition date fair value. Net revenues have been reduced by $0.1 million for the year ended December 31, 2013 in the historical financial statements due to the write-down of deferred revenue to its estimated fair value as of the merger date. The write-down was determined by estimating the cost to fulfill the related future customer obligations plus a normal profit margin. Partially offsetting this impact, cost of revenues were reduced for other purchase accounting adjustments, primarily a write-down of deferred costs to zero at the acquisition date. The adjustment of deferred revenue and deferred costs to fair value is required only at the purchase accounting date; therefore, its impact on net revenues and cost of revenues is non-recurring.
(c) Costs are related to merger and acquisition activities including due diligence and other non-operational charges such as pension and severance costs for former employees. This caption also includes a gain on sale of the IntelliTools product line of $0.3 million recorded in the second quarter of 2014.
(d) Stock-based compensation and expense is related to our outstanding options, restricted stock awards, and warrants. This total also includes legal fees incurred in connection with the Company’s exchange offer which were recorded as consulting expenses and therefore were not included in stock-based compensation and expense as detailed in Note 17 — Stock-Based Compensation and Expense.
(e) During 2008, we discovered certain irregularities relating to the control and use of cash and certain other general ledger items which resulted from a substantial misappropriation of assets over more than a three-year period beginning in 2004 and continuing through April 2008. These irregularities were perpetrated by a former employee. Charges incurred after April 2008 represent expenses to recover property purchased by the former employee using the embezzled funds, net of any recoveries.
(f) See Note 7 — Goodwill and Other Intangible Assets and Note 13 — Fair Value of Financial Instruments for additional information related to the Impairment of Long-Lived Assets charges.
(g) Adjustments to the CVR liability as a result of changes in the likelihood of collecting potential tax receivables and related interest income included in the estimate of the fair value of the CVRs.
(h) Severance charges were recorded in connection with the management transition completed in the first quarter of 2013.
Capital Expenditures Outlook
Capital spending in 2015 is expected to increase relative to 2014 as we continue to invest in new product development and product enhancements in each segment. The capital expenditures disclosed for each segment represent development expenses, primarily developed curriculum and capitalized software. General capital expenditures are recorded in Other and represent expenditures that benefit the entire Company such as back-office systems, computer equipment, or office furniture.
(in thousands) Capital Expenditures Segment 2014 Estimated 2015 Development capital expenditures
Learning A-Z ................................................. $ 5,626 $ 7,000 – 7,500Voyager Sopris Learning ............................... 7,414 7,000 – 7,500ExploreLearning ............................................ 1,602 2,100 – 2,400Kurzweil Education ....................................... 530 400 – 600
General capital expenditures ............................... 2,703 2,400 – 2,600Capital expenditures ........................................... $ 17,875 $ 18,900 – 20,600
Commitments and Contractual Obligations We have various contractual obligations which are recorded as liabilities in our Consolidated Financial Statements. Other items,
such as certain purchase commitments and other executory contracts, are not recognized as liabilities in our Consolidated Financial Statements but are required to be disclosed.
We have letters of credit outstanding at December 31, 2014 in the amount of $2.0 million to support the build-to-suit lease, credit collections, and workers’ compensation activity. We maintain certificates of deposit of $2.7 million to serve as collateral for these letters of credit. Additionally, we also maintain a $0.9 million money market fund investment as collateral for our travel card program. The certificates of deposit and money market fund investment are recorded in Other Assets in the Consolidated Balance Sheets.

29
At December 31, 2014, we have $12.6 million in obligations with respect to our pension plan. For further information, see Note 15 — Profit-Sharing, Pension, and Other Post Retirement Benefit Plans to our Consolidated Financial Statements.
As of December 31, 2014, we have approximately $1.2 million of long-term income tax liabilities that have a high degree of uncertainty regarding the timing of the future cash outflows. We are unable to reasonably estimate the years when settlement will occur with the respective taxing authorities.
Off-Balance Sheet Arrangements The Company has no off-balance sheet arrangements that have or are reasonably likely to have a current or future material effect
on the Company’s financial condition, changes in financial condition, revenues or expenses, results of operations, liquidity, capital expenditures or capital resources.
Critical Accounting Policies and Estimates Our Consolidated Financial Statements are prepared in accordance with GAAP, which require management to make estimates
and assumptions that affect the reported amount of assets, liabilities, revenue, expenses, and related disclosure of contingent assets and liabilities.
On an ongoing basis, we evaluate our estimates, including those related to accounting for revenue recognition, impairment, capitalization and depreciation, allowances for doubtful accounts and sales returns, inventory reserves, and income taxes. We base our estimates on historical experience and other assumptions we believe are reasonable under the circumstances, the results of which form the basis for making judgments about the carrying value of assets and liabilities that may not be readily available from other sources. Actual results may differ from these estimates, which could have a material impact on our financial statements.
Certain accounting policies require higher degrees of judgment than others in their application. We consider the following to be critical accounting policies due to the judgment involved in each. For a detailed discussion of our significant accounting policies, see Note 2 — Significant Accounting Policies to our Consolidated Financial Statements.
Revenue Recognition
Voyager Sopris Learning Segment Revenues for our Voyager Sopris Learning segment are derived from sales of literacy and math educational solutions and
services to school districts. Sales include printed materials, interactive web-based programs and online educational content, courseware, training and implementation services, school improvement services, and professional development. Revenue from the sale of printed materials is recognized when the product is shipped to or received by the customer, depending on the shipping terms of the arrangement. Revenue for interactive web-based programs and online educational content, which may be sold separately or included with printed curriculum materials, courseware and school improvement services are recognized ratably over the subscription or contractual period, typically a school year. Professional services such as training, implementation and professional development are recognized over the period services are delivered.
The division of revenue between printed materials, materials and programs accessed online, and ongoing support and services is determined in accordance with the accounting guidance for revenue arrangements with multiple deliverables. Under this guidance, we are required to allocate revenue among the deliverables in an arrangement using the relative selling price method. The guidance requires use of a selling price hierarchy for determining the selling price of each deliverable, which includes (1) vendor-specific objective evidence (“VSOE”), if available, (2) third party evidence (“TPE”), if VSOE is not available, and (3) best estimate of selling price (“BESP”), if neither VSOE nor TPE is available. The objective of BESP is to determine the price at which we would transact a sale if the product or service were sold on a stand-alone basis.
We are not able to establish VSOE for each deliverable. Whenever VSOE cannot be established, we review the offerings of competitors to determine whether TPE can be established. TPE is determined based on the prices charged by our competitors for a similar deliverable when sold separately. It may be difficult to obtain sufficient information on competitor pricing to substantiate TPE and therefore we may not always be able to use TPE. We also use BESP to determine the selling price of certain deliverables, primarily for certain printed materials which have historically been priced on a bundled basis with related online materials. The determination of BESP considers the anticipated margin on that deliverable, the selling price and profit margin for similar parts or services, and our ongoing pricing strategy and policies. We analyze the selling prices used in the allocation of arrangement consideration at least annually. Selling prices are analyzed on a more frequent basis if a significant change in the business necessitates a more timely analysis or if we experience significant variances in selling prices.
In some cases, such as our blended learning solution LANGUAGE! Live, printed materials and related services do not qualify as separate units of accounting. When this occurs, all deliverables associated with the sale are recognized over the life of the on-line subscription which is typically a school year.

30
Shipments to school book depositories are on consignment and revenue is recognized based on shipments from the depositories to the schools.
Learning A-Z and ExploreLearning Segments
The Learning A-Z and ExploreLearning segments derive revenue exclusively from sales of online subscriptions to their reading, math and science teaching websites and related training and professional development. Typically, the subscriptions are for a twelve month period (although they can be for longer periods) and the revenue is recognized ratably over the period the online access is available to the customer. Any training or professional development related to an online subscription is recognized over the same period of online access.
Kurzweil Education Segment The Kurzweil Education segment derives revenue from either an online subscription or from the delivery of software.
Subscription revenues are recognized ratably over the period the online access is available to the customer. Perpetual software sales are recognized when shipped or provided to customers. Maintenance and support services for the Company’s perpetual software can include telephone support, bug fixes, and, for certain products, rights to upgrades and enhancements on a when-and-if available basis. On-line services include access to digital content including literacy tools, cloud storage and the ability to individualize assignments. These services are recognized on a straight-line basis over the period they are provided. In certain instances, telephone support and software repairs are provided for free within the first three months of licensing the software. The cost of providing this service is insignificant, and is accrued at the time of revenue recognition.
From time to time for all of our segments, we enter into agreements to license or sell certain publishing rights and content. We recognize the revenue from these agreements when the license amount is fixed and determinable, collection is reasonably assured, and when either the license period, if applicable, has commenced or transfer of content, if applicable, has occurred.
Impairment of Goodwill
We review the carrying value of goodwill for impairment at least annually and if a triggering event is determined to have occurred in an interim period. Our annual analysis is performed as of October 1st.
GAAP provides entities with the option of performing a “qualitative” assessment to determine if it is more-likely-than-not that goodwill might be impaired or a quantitative two-step goodwill impairment test. For the two-step quantitative impairment test, the fair value of each reporting unit is compared to its carrying value. If the fair value of a reporting unit exceeds the carrying value of that unit, goodwill is not impaired and no further testing is required. If the carrying value of the reporting unit exceeds the fair value of that unit, then a second step must be performed to determine the implied fair value of the reporting entity’s goodwill. If the carrying value of a reporting unit’s goodwill exceeds its implied fair value, then an impairment loss equal to the difference is recorded.
Determining the fair value of a reporting unit is judgmental in nature, and involves the use of significant estimates and assumptions. These estimates and assumptions may include revenue growth rates and operating margins used to calculate projected future cash flows, risk-adjusted discount rates, future economic and market conditions, and determination of appropriate market comparables. In addition, we make certain judgments and assumptions in allocating shared assets and liabilities to determine the carrying values of our reporting units.
We performed our goodwill impairment review in 2014 using four reporting units: Learning A-Z; Voyager Sopris Learning; ExploreLearning; and Kurzweil Education. The following table details the goodwill balances at December 31, 2014 by reporting unit:
(in thousands) December 31, 2014 Learning A-Z .................................................................. $ 13,215 Voyager Sopris Learning ................................................ 22,018 ExploreLearning ............................................................. 6,947 Kurzweil Education ........................................................ 5,662
Goodwill .............................................................................. $ 47,842
During 2014, we elected to perform the optional qualitative assessment for the Learning A-Z and ExploreLearning reporting units. The qualitative assessment did not result in a conclusion that it was more likely than not that the fair value of these reporting units was less than their respective carrying amounts, therefore it was unnecessary to perform the quantitative two-step goodwill impairment test for the Learning A-Z and ExploreLearning reporting units.
During 2014, we elected to perform the quantitative two-step goodwill impairment test for the Voyager Sopris Learning and Kurzweil Education reporting units. The step one calculated fair values of these reporting units exceeded their respective carrying amounts by at least 10%; therefore it was unnecessary to perform the second step of the quantitative impairment test. No impairment was indicated as a result of our 2014 annual impairment analysis.

31
When performing the two-step quantitative impairment test, we first determined the fair market value of each reporting unit to be tested using a weighted income and market approach. The income approach was dependent on multiple assumptions and estimates, including future cash flow projections with a terminal value multiple and the discount rate used to determine the expected present value of the estimated future cash flows. Future cash flow projections were based on management’s best estimates of economic and market conditions over the projected period, including industry fundamentals such as the state of educational funding, revenue growth rates, future costs and operating margins, working capital needs, capital and other expenditures, and tax rates. The discount rate applied to the future cash flows was a weighted-average cost of capital and took into consideration market and industry conditions, returns for comparable companies, the rate of return an outside investor would expect to earn, and other relevant factors. The fair values of each reporting unit also took into consideration a market approach, based on historical and projected multiples of certain guideline companies. If the carrying value of the reporting unit exceeds the fair value of that unit for the first step of the impairment test, then a second step was performed to determine the implied fair value of the reporting entity’s goodwill. The second step of the impairment test requires the allocation of the fair value of a reporting unit to all of the assets and liabilities of that reporting unit as if the reporting unit had been acquired in a business combination. If the carrying value of a reporting unit’s goodwill exceeds its implied fair value, then an impairment loss equal to the difference is recorded.
Impairment of Long Lived Assets
We review the carrying value of long lived assets for impairment whenever events or changes in circumstances indicate net book value may not be recoverable from the estimated undiscounted future cash flows. If our review indicates any assets are impaired, the impairment of those assets is measured as the amount by which the carrying amount exceeds the fair value as estimated by discounted cash flows. Assets to be disposed of are reported at the lower of the carrying amount or fair value less cost of disposal.
Pre-Publication Costs
We capitalize certain pre-publication costs of our curriculum, including art, prepress, editorial, and other costs incurred in the creation of the master copy of our curriculum products. Pre-publication costs are amortized over the expected life of the education program, generally on an accelerated basis over a period of five years. The amortization methods and periods chosen reflect the expected revenues generated by the education programs. We periodically review the recoverability of the capitalized costs based on expected net realizable value.
Accounts Receivable
Accounts receivable are stated net of allowances for doubtful accounts and estimated sales returns. The allowance for doubtful accounts is based on a review of the outstanding balances and historical collection experience. The reserve for sales returns is based on historical rates of returns as well as other factors that in our judgment could reasonably be expected to cause sales returns to differ from historical experience. Actual bad debt write-offs and returns could differ from our estimates.
Inventory
Inventory is stated at the lower of cost, determined using the first-in, first-out (FIFO) method, or market, and consists of finished goods. We reduce slow-moving or obsolete inventory to net realizable value. Inventory values are maintained at an amount that management considers appropriate based on factors such as the inventory aging, historical usage of the product, future sales forecasts, and product development plans. These factors involve management’s judgment and changes in estimates could result in increases or decreases to the inventory values. The impact of a one percentage point change in the amount of inventory considered to be excess or obsolete would have resulted in an increase or decrease in cost of revenues of approximately $0.2 million for the year ended December 31, 2014. Inventory values are reviewed on a periodic basis.
Income Taxes
Provision is made for the expense, or benefit, associated with taxes based on income. The provision for income taxes is based on laws currently enacted in every jurisdiction in which we do business and considers laws mitigating the taxation of the same income by more than one jurisdiction. Significant judgment is required in determining income tax expense, current tax receivables and payables, deferred tax assets and liabilities, and valuation allowance recorded against the net deferred tax assets. Management considers the scheduled reversal of deferred tax liabilities, projected future taxable income, taxable income in prior carryback years, loss carryforward limitations, and tax planning strategies in assessing whether deferred tax assets will be realized in future periods. If, after consideration of these factors, management believes it is more likely than not that a portion of the deferred tax assets will not be realized, a valuation allowance is established. The amount of the deferred tax asset considered realizable could be reduced if estimates of future taxable income during the carryforward period are reduced.

32
We recognize liabilities for uncertain tax positions based on a two-step process. The first step is to evaluate the tax position for recognition by determining if available evidence indicates that it is more likely than not that the position will be sustained on audit. The second step requires us to estimate and measure the tax benefit as the largest amount that is more than 50% likely to be realized upon ultimate settlement. It is inherently difficult and subjective to estimate these amounts, since this requires management to determine the probability of various possible outcomes. We reevaluate our uncertain tax positions on a periodic basis, based on factors such as changes in facts and circumstances, changes in tax law, effectively settled issues under audit and new audit activity.
Recently Issued Financial Accounting Standards Information regarding recently issued accounting standards is included in Note 2 — Significant Accounting Policies to the
Consolidated Financial Statements, which is included in Item 8 of this Annual Report on Form 10-K.
7A. Quantitative and Qualitative Disclosures About Market Risk. This item is not required for a smaller reporting company.
Item 8. Financial Statements and Supplementary Data.

33
REPORT OF INDEPENDENT REGISTERED PUBLIC ACCOUNTING FIRM
To the Board of Directors and Stockholders of Cambium Learning Group, Inc. We have audited the accompanying consolidated balance sheets of Cambium Learning Group, Inc. and subsidiaries (the “Company”), as of December 31, 2014 and 2013, and the related consolidated statements of operations and comprehensive loss, changes in stockholders’ equity (deficit), and cash flows for each of the years in the two-year period ended December 31, 2014. The Company’s management is responsible for these financial statements. Our responsibility is to express an opinion on these financial statements based on our audits. We conducted our audits in accordance with the standards of the Public Company Accounting Oversight Board (United States). Those standards require that we plan and perform the audit to obtain reasonable assurance about whether the financial statements are free of material misstatement. The Company is not required to have, nor were we engaged to perform, an audit of its internal control over financial reporting. Our audit included consideration of internal control over financial reporting as a basis for designing audit procedures that are appropriate in the circumstances, but not for the purpose of expressing an opinion on the effectiveness of the Company’s internal control over financial reporting. Accordingly, we express no such opinion. An audit also includes examining, on a test basis, evidence supporting the amounts and disclosures in the financial statements, assessing the accounting principles used and significant estimates made by management, as well as evaluating the overall financial statement presentation. We believe that our audits provide a reasonable basis for our opinion. In our opinion, the consolidated financial statements referred to above present fairly, in all material respects, the financial position of the Company, as of December 31, 2014 and 2013, and the results of their operations and their cash flows for each of the years in the two-year period ended December 31, 2014 in conformity with accounting principles generally accepted in the United States of America.
/s/ Whitley Penn LLP
Dallas, Texas March 17, 2015

34
Cambium Learning Group, Inc. and Subsidiaries Consolidated Statements of Operations and Comprehensive Loss
(in thousands, except per share data)
Year Ended December 31, 2014 2013 Net revenues:
Product revenues............................................................................................. $ 131,912 $ 138,295 Service revenues ............................................................................................. 9,835 12,225
Total net revenues ................................................................................................ 141,747 150,520 Cost of revenues:
Cost of product revenues ................................................................................ 32,084 38,250 Cost of service revenues ................................................................................. 5,790 8,438 Amortization expense ..................................................................................... 18,270 17,519
Total cost of revenues .......................................................................................... 56,144 64,207 Research and development expense ..................................................................... 11,091 9,810 Sales and marketing expense ............................................................................... 41,431 42,233 General and administrative expense ..................................................................... 19,357 21,341 Shipping and handling costs ................................................................................. 1,469 1,722 Depreciation and amortization expense ............................................................... 4,209 4,895 Impairment of long-lived assets ........................................................................... — 2,227 Embezzlement-related expense ............................................................................ — 118
Total costs and expenses ........................................................................... 133,701 146,553 Income (loss) before interest, other income (expense) and income taxes ............................................................................................... 8,046 3,967 Net interest income (expense):
Interest income ............................................................................................... 4 191 Interest expense .............................................................................................. (17,663 ) (19,010)
Net interest income (expense) .............................................................................. (17,659 ) (18,819)Loss on extinguishment of debt ........................................................................... (922 ) — Other income (expense), net ................................................................................ 1,180 764 Loss before income taxes ..................................................................................... (9,355 ) (14,088)Income tax expense .............................................................................................. (600 ) (165)Net loss ................................................................................................................ $ (9,955 ) $ (14,253)Other comprehensive income (loss):
Net pension gain (loss) ................................................................................... $ (1,930 ) $ 384 Amortization of net pension loss .................................................................... 86 120
Comprehensive loss ............................................................................................. $ (11,799 ) $ (13,749)Net loss per common share:
Basic net loss per common share .................................................................... $ (0.22 ) $ (0.30)Diluted net loss per common share ................................................................. $ (0.22 ) $ (0.30)
Average number of common shares and equivalents outstanding:
Basic ............................................................................................................... 45,636 47,040 Diluted ............................................................................................................ 45,636 47,040
The accompanying Notes to the Consolidated Financial Statements are an integral part of these statements.

35
Cambium Learning Group, Inc. and Subsidiaries Consolidated Balance Sheets
(in thousands, except per share data)
December 31, 2014 2013
ASSETS Current assets:
Cash and cash equivalents .............................................................................. $ 34,387 $ 67,993 Accounts receivable, net ................................................................................. 14,304 15,767 Inventory ......................................................................................................... 5,337 9,221 Restricted assets, current ................................................................................ 1,345 1,343 Other current assets ........................................................................................ 8,168 6,873
Total current assets ............................................................................................... 63,541 101,197 Property, equipment and software at cost ....................................................... 51,298 43,224 Accumulated depreciation and amortization .................................................. (30,442 ) (22,909)
Property, equipment and software, net ................................................................. 20,856 20,315 Goodwill .............................................................................................................. 47,842 47,842 Acquired curriculum and technology intangibles, net .......................................... 5,209 8,719 Acquired publishing rights, net ............................................................................ 2,762 4,705 Other intangible assets, net .................................................................................. 4,499 6,251 Pre-publication costs, net ..................................................................................... 15,070 13,401 Restricted assets, less current portion .................................................................. 4,152 5,492 Other assets .......................................................................................................... 7,635 8,288 Total assets ........................................................................................................... $ 171,566 $ 216,210
The accompanying Notes to the Consolidated Financial Statements are an integral part of these statements.

36
Cambium Learning Group, Inc. and Subsidiaries Consolidated Balance Sheets
(in thousands, except per share data)
December 31, 2014 2013
LIABILITIES AND STOCKHOLDERS' EQUITY (DEFICIT) Current liabilities:
Capital lease obligations, current .................................................................... $ 1,076 $ 995 Accounts payable ............................................................................................ 1,612 1,301 Accrued expenses ........................................................................................... 17,432 25,279 Deferred revenue, current ............................................................................... 61,788 53,532
Total current liabilities ......................................................................................... 81,908 81,107 Long-term liabilities:
Long-term debt ............................................................................................... 139,723 174,491 Capital lease obligations, less current portion ................................................ 943 2,019 Deferred revenue, less current portion ............................................................ 9,409 7,829 Other liabilities ............................................................................................... 14,638 13,954
Total long-term liabilities ..................................................................................... 164,713 198,293 Commitments and contingencies (See Note 18) .................................................. Stockholders' equity (deficit):
Preferred Stock ($0.001 par value, 15,000 shares authorized, zero shares issued and outstanding at December 31, 2014 and 2013) ..................................................................................................... — — Common stock ($0.001 par value, 150,000 shares authorized, 52,006 and 51,208 shares issued, and 45,474 and 45,042 shares outstanding at December 31, 2014 and 2013, respectively) ................................................................................................ 52 51 Capital surplus ................................................................................................ 284,243 283,673 Accumulated deficit ........................................................................................ (342,650 ) (332,695)Treasury stock at cost (6,532 and 6,166 shares at December 31, 2014 and 2013, respectively) ................................................ (12,784 ) (12,147)Accumulated other comprehensive loss:
Pension and postretirement plans ........................................................... (3,916 ) (2,072)Accumulated other comprehensive loss ......................................................... (3,916 ) (2,072)
Total stockholders' equity (deficit) ....................................................................... (75,055 ) (63,190)Total liabilities and stockholders' equity (deficit) ................................................ $ 171,566 $ 216,210
The accompanying Notes to the Consolidated Financial Statements are an integral part of these statements.

37
Cambium Learning Group, Inc. and Subsidiaries Consolidated Statements of Cash Flows
(in thousands)
Year Ended December 31, 2014 2013 Operating activities: Net loss ................................................................................................................. $ (9,955 ) $ (14,253)Adjustments to reconcile net loss to net cash provided by operating activities:
Depreciation and amortization expense...................................................... 22,479 22,414 Impairment of long-lived assets ................................................................. — 2,227 Loss on extinguishment of debt ................................................................. 922 — Amortization of note discount and deferred financing costs ......................................................................................................... 1,509 1,743 Gain on sale of IntelliTools product line .................................................... (289 ) — Loss on disposal of assets ........................................................................... 93 105 Loss from recovery of property held for sale ............................................. — 122 Proceeds from sale of recovered properties ................................................ — 258 Stock-based compensation and expense ..................................................... 511 890 Change in fair value of contingent value rights obligation ........................ — 74 Michigan tax refund received ..................................................................... — 12,342 Deferred income taxes ................................................................................ (21 ) (102)
Changes in operating assets and liabilities: Accounts receivable, net ............................................................................ 1,463 2,314 Inventory .................................................................................................... 3,626 7,399 Other current assets .................................................................................... (1,285 ) (690)Other assets ................................................................................................ (1,538 ) (810)Restricted assets ......................................................................................... 1,338 4,306 Accounts payable ....................................................................................... 311 (1,706)Accrued expenses ....................................................................................... (4,648 ) 889 Deferred revenue ........................................................................................ 9,876 9,301 Other long-term liabilities .......................................................................... (749 ) (1,037)
Net cash provided by operating activities ............................................................. 23,643 45,786 Investing activities:
Cash paid for acquisitions ................................................................................ (3,600 ) — Cash paid for contingent value rights obligation related to acquisition ..................................................................................................... — (7,673)Proceeds from sale of IntelliTools product line ............................................... 806 — Expenditures for property, equipment, software and pre-publication costs ..................................................................................... (17,875 ) (16,115)
Net cash used in investing activities ..................................................................... (20,669 ) (23,788)Financing activities:
Principal payments under capital lease obligations ......................................... (995 ) (1,290)Repayment of debt ........................................................................................... (35,008 ) — Proceeds from exercise of stock options .......................................................... 53 — Share repurchases ............................................................................................ (630 ) (4,619)
Net cash used in financing activities ..................................................................... (36,580 ) (5,909)Change in cash and cash equivalents .................................................................... (33,606 ) 16,089 Cash and cash equivalents, beginning of period ................................................... 67,993 51,904 Cash and cash equivalents, end of period ............................................................. $ 34,387 $ 67,993 Supplemental disclosure of cash flow information:
Net income taxes paid ...................................................................................... $ 173 $ 93 Interest paid ..................................................................................................... $ 17,505 $ 17,288
The accompanying Notes to the Consolidated Financial Statements are an integral part of these statements.

38
Cambium Learning Group, Inc. and Subsidiaries Consolidated Statements of Stockholders’ Equity (Deficit)
(in thousands)
Common Stock Additional
Paid in Treasury Stock
Accumulated Other
Comprehensive Accumulated Shares Amount Capital Shares Amount Income (Loss) Deficit Total Balance at December 31, 2012 ..... 51,208 $ 51 $ 282,450 (4,110) $ (7,528) $ (2,576 ) $ (318,442) $(46,045)
Issuance of restricted stock ..... — — 21 — — — — 21 Stock-based compensation and expense ................................ — — 815 — — — — 815 Issuance of warrant related to employee embezzlement matter ................................... 387 387 Stock repurchases ................... — — — (2,056) (4,619) — — (4,619)Net loss ................................... — — — — — — (14,253) (14,253)Pension plan ............................ — — — — — 504 — 504
Balance at December 31, 2013 ..... 51,208 51 283,673 (6,166) (12,147) (2,072 ) (332,695) (63,190)Issuance of restricted stock ..... 2 — 2 — — — — 2 Stock-based compensation and expense ................................ — — 509 — — — — 509 Exercise of stock options and warrants ............................... 796 1 59 (5) (7) — — 53 Stock repurchases ................... — — — (361) (630) — — (630)Net loss ................................... — — — — — — (9,955) (9,955)Pension plan ............................ — — — — — (1,844 ) — (1,844)
Balance at December 31, 2014 ..... 52,006 $ 52 $ 284,243 (6,532) $ (12,784) $ (3,916 ) $ (342,650) $(75,055)
The accompanying Notes to the Consolidated Financial Statements are an integral part of these statements.

39
Cambium Learning Group, Inc. and Subsidiaries Notes to the Consolidated Financial Statements Note 1 — Basis of Presentation Cambium Learning Group, Inc.
Cambium Learning Group, Inc. (the “Company”) was incorporated under the laws of the State of Delaware in June 2009. On December 8, 2009, the Company completed the mergers of Voyager Learning Company (“VLCY”) and VSS-Cambium Holdings II Corp. (“Cambium”) into two of its wholly-owned subsidiaries, resulting in VLCY and Cambium becoming wholly-owned subsidiaries. Following the completion of the mergers, all of the outstanding capital stock of VLCY’s operating subsidiaries, Voyager Expanded Learning, Inc. and LAZEL, Inc., was transferred to Cambium Learning, Inc., Cambium’s operating subsidiary (“Cambium Learning”). The transaction was accounted for as an “acquisition” of VLCY by Cambium, as that term is used under U.S. Generally Accepted Accounting Principles (“GAAP”), for accounting and financial reporting purposes under the applicable accounting guidance for business combinations.
Fiscal Year
The consolidated financial statements present the Company as of a calendar year ending on December 31st.
Nature of Operations and Segments
The Company is a leading educational solutions and services company that is committed to helping every student reach their full potential. The Company’s brands include: Voyager Sopris LearningTM (www.voyagersopris.com), Learning A–ZTM (www.learninga-z.com), ExploreLearning® (www.explorelearning.com and www.reflexmath.com), and Kurzweil EducationTM
(www.kurzweiledu.com). Together, these business units provide breakthrough technology solutions for online learning and professional support; best-in-class intervention and supplemental instructional materials; gold-standard professional development and school-improvement services; valid and reliable assessments; and proven materials to support a positive and safe school environment.
These brands comprise four reportable segments with separate management teams and infrastructures that offer various products and services: Learning A-Z, Voyager Sopris Learning, ExploreLearning, and Kurzweil Education. Prior to the sale of the IntelliTools product line in the quarter ended June 30, 2014, the Company referred to its Kurzweil Education segment as Kurzweil/IntelliTools.
Learning A-Z Segment
Learning A-Z is a preK-6 educational resource company specializing in online delivery of leveled readers and other supplementary curriculum. Founded in 2002 to help teachers differentiate instruction and meet the unique needs of all students, Learning A-Z’s resources are currently used in more than half the districts in the United States and Canada and in approximately 190 countries worldwide. Serving a wide range of student needs, including English language learners, intervention, special education, and daily instruction, Learning A-Z’s value proposition focuses on three key elements:
Saving teachers time, giving them all the resources they need, all online, all accessible at the click of a mouse Saving teachers money, delivering thousands of resources for a fraction of the cost of print and other online providers Supporting student achievement through differentiated instruction, ensuring the right high-quality resources for every
preK-6 student Learning A-Z operates seven subscription-based websites: Reading A-Z, Raz-Kids, Vocabulary A-Z, Headsprout®, ReadyTest
A-Z, Writing A-Z, and Science A-Z. These websites are stand-alone or integrated, for a comprehensive solution that provides online supplemental books, lessons, assessments and other instructional resources for individual classrooms, schools, and districts.
Voyager Sopris Learning Segment
Voyager Sopris Learning is committed to partnering with school districts to overcome obstacles that students, teachers, and school leaders face every day. The suite of instructional and service solutions Voyager Sopris Learning provides is not only research based, but also evidence based—proven to increase student achievement and educator effectiveness. Voyager Sopris Learning’s solutions have been fully tested in the classroom, ensuring that they are easy to implement and teacher friendly. They are innovative, both in overall instructional approach and in the strategic use of technology in blended and 100% online solutions and are supported by an unparalleled commitment to build local capacity for sustained success. With a comprehensive suite of instructional resources, Voyager Sopris Learning provides assessments, professional development and school improvement services, literacy and math instructional tools—both comprehensive, intervention and supplemental—and resources to build a positive school climate.

40
ExploreLearning Segment
ExploreLearning develops online solutions to improve student learning in math and science. ExploreLearning currently offers two supplemental programs: Gizmos, the world’s largest library of online simulations for math and science in grades 3-12 that help students gain a deep understanding of challenging concepts through active inquiry and exploration; and Reflex, a powerful adaptive online program that helps students in grades 2-8 develop math fact fluency through game-based instruction and practice. Gizmos and Reflex bring research-proven instructional strategies to classrooms around the world.
Kurzweil Education Segment
Kurzweil Education delivers award-winning educational technology that solves real problems. The segment’s literacy and learning solutions offer learners a way up and a path forward. Using the principals of Universal Design for Learning, Kurzweil Education delivers content and tools that enable all learners to read, understand and demonstrate their learning using technology-based tools and resources.
In the quarter ended June 30, 2014, the Company completed the sale of the IntelliTools product line for $0.8 million. Net revenues associated with the IntelliTools product line were $0.3 million during 2014 through the date of sale and $1.0 million for the year ended December 31, 2013. Prior to the sale of the IntelliTools product line, the Company referred to the Kurzweil Education segment as Kurzweil/IntelliTools. Note 2 — Significant Accounting Policies Use of Estimates
The preparation of financial statements in conformity with GAAP requires management to make estimates and assumptions that affect the reported amounts of assets and liabilities and the disclosure of contingent assets and liabilities at the date of the financial statements, and the reported amounts of revenues and expenses during the reporting periods. Subsequent actual results may differ from those estimates.
Principles of Consolidation
The consolidated financial statements include the accounts of the Company and its wholly-owned subsidiaries. All intercompany accounts and transactions are eliminated in consolidation.
Revenue Recognition
Voyager Sopris Learning Segment
Revenues for the Voyager Sopris Learning segment are derived from sales of literacy and math educational solutions and services to school districts. Sales include printed materials, interactive web-based programs and online educational content, courseware, training and implementation services, school improvement services, and professional development. Revenue from the sale of printed materials is recognized when the product is shipped to or received by the customer, depending on the shipping terms of the arrangement. Revenue for interactive web-based programs and online educational content, which may be sold separately or included with printed curriculum materials, courseware and school improvement services are recognized ratably over the subscription or contractual period, typically a school year. Professional services such as training, implementation, and professional development are recognized over the period services are delivered.
Printed materials, materials and programs accessed online, and ongoing support and services generally qualify as separate units of accounting and the division of revenue among these units is determined in accordance with the accounting guidance for revenue arrangements with multiple deliverables. Under this guidance, the Company is required to allocate revenue among the deliverables in an arrangement using the relative selling price method. The guidance requires use of a selling price hierarchy for determining the selling price of each deliverable, which includes (1) vendor-specific objective evidence (“VSOE”), if available, (2) third party evidence (“TPE”), if VSOE is not available, and (3) best estimate of selling price (“BESP”), if neither VSOE nor TPE is available. The objective of BESP is to determine the price at which the Company would transact a sale if the product or service were sold on a stand-alone basis.
The Company is not able to establish VSOE for each deliverable. Whenever VSOE cannot be established, the Company reviews the offerings of competitors to determine whether TPE can be established. TPE is determined based on the prices charged by the Company’s competitors for a similar deliverable when sold separately. It may be difficult to obtain sufficient information on competitor pricing to substantiate TPE and therefore the Company may not always be able to use TPE. The Company also uses BESP to determine the selling price of certain deliverables, primarily for certain printed materials which have historically been priced on a bundled basis with related online materials. The determination of BESP considers the anticipated margin on that deliverable, the selling price and profit margin for similar parts or services, and the Company’s ongoing pricing strategy and policies. The Company analyzes the selling prices used in the allocation of arrangement consideration at least annually. Selling prices are analyzed on a more frequent basis if a significant change in the business necessitates a more timely analysis or if the Company experiences significant variances in selling prices.

41
In some cases, such as the Company’s blended learning solution LANGUAGE! Live, printed materials and related services do not qualify as separate units of accounting. When this occurs, all deliverables associated with the sale are recognized over the life of the on-line subscription which is typically a school year.
Shipments to school book depositories are on consignment and revenue is recognized based on shipments from the depositories to the schools.
Learning A-Z and ExploreLearning Segments
The Learning A-Z and ExploreLearning segments derive revenue exclusively from sales of online subscriptions to their reading, math and science teaching websites and related training and professional development. Typically, the subscriptions are for a twelve month period (although they can be for longer periods) and the revenue is recognized ratably over the period the online access is available to the customer. Any training or professional development related to an online subscription is recognized over the same period of online access.
Kurzweil Education
The Kurzweil Education segment derives revenue from either an online subscription or from the delivery of software. Subscription revenues are recognized ratably over the period the online access is available to the customer. Perpetual software sales are recognized when shipped or provided to customers. Maintenance and support services for the Company’s perpetual software can include telephone support, bug fixes, and, for certain products, rights to upgrades and enhancements on a when-and-if available basis. On-line services include access to digital content including literacy tools, cloud storage, and the ability to individualize assignments. These services are recognized on a straight-line basis over the period they are provided. In certain instances, telephone support and software repairs are provided for free within the first three months of licensing the software. The cost of providing this service is insignificant, and is accrued at the time of revenue recognition.
From time to time for all reportable segments, the Company enters into agreements to license or sell certain publishing rights and content. The Company recognizes the revenue from these agreements when the license amount is fixed and determinable, collection is reasonably assured, and when either license period, if applicable, has commenced or transfer of content, if applicable, has occurred.
Accounts Receivable
Accounts receivable are stated net of allowances for doubtful accounts and estimated sales returns. The allowance for doubtful accounts and estimated sales returns totaled $0.4 million and $0.7 million at December 31, 2014 and 2013, respectively. The allowance for doubtful accounts is based on a review of the outstanding balances and historical collection experience. The reserve for sales returns is based on historical rates of returns as well as other factors that in the Company’s judgment could reasonably be expected to cause sales returns to differ from historical experience. A reconciliation of the accounts receivable reserve is shown in the table below for the periods indicated:
December 31, (in thousands) 2014 2013 Accounts receivable reserve, beginning of period ......... $ 735 $ 431
Charged to costs and expenses ................................. 316 9 Charged to other accounts (1) .................................... (538) 358 Write-offs ................................................................. (78) (63 )
Accounts receivable reserve, end of period ................... $ 435 $ 735 (1) Changes in sales return reserve.
Net Loss per Common Share
Basic loss per common share is computed by dividing net loss by the weighted-average number of common shares outstanding during the period including a warrant for shares issuable for little or no cash consideration, which is considered a common share equivalent. Diluted net loss per common share is computed by dividing net loss by the weighted-average number of common shares outstanding during the period; including potential dilutive shares of common stock assuming the dilutive effect of outstanding stock options, restricted stock awards and warrants using the treasury stock method. Weighted-average shares from common share equivalents in the amount 2,628,862 and 3,044,787 for the years ended December 31, 2014 and 2013, respectively, were excluded from dilutive shares outstanding because their effect was anti-dilutive.

42
The following table presents the calculation of basic and diluted net loss per share:
Year Ended December 31, (in thousands, except per share data) 2014 2013 Numerator:
Net loss ..................................................................... $ (9,955) $ (14,253 )Denominator:
Basic: Weighted-average common shares used in computing basic net loss per share ........................ 45,636 47,040 Diluted:
Add weighted average effect of dilutive securities: Stock options, restricted stock awards and warrant ................................................................ — —
Weighted-average common shares used in computing diluted net loss per share ..................... 45,636 47,040
Net loss per common share: Basic ......................................................................... $ (0.22) $ (0.30 )Diluted ...................................................................... $ (0.22) $ (0.30 )
Cash and Cash Equivalents
The Company considers all highly liquid investments with maturities of three months or less (when purchased) to be cash equivalents. The carrying amount reported in the Consolidated Balance Sheets approximates fair value.
Inventory
Inventory is stated at the lower of cost, determined using the first-in, first-out (FIFO) method, or market, and consists of finished goods. The Company reduces slow-moving or obsolete inventory to net realizable value. Inventory values are maintained at an amount that management considers appropriate based on factors such as the inventory aging, historical usage of the product, future sales forecasts, and product development plans. Inventory values are reviewed on a periodic basis.
Restricted Assets
Restricted assets consist of funds placed in a rabbi trust pursuant to the merger agreement for the purpose of funding certain obligations acquired in the VLCY merger, mostly deferred compensation, pension, and employee related obligations.
Property and Equipment
Property and equipment are stated at cost less accumulated depreciation and amortization. Depreciation is computed over the assets’ estimated useful lives using the straight-line method. Estimated lives are as follows:
Asset Class Estimated Useful Life
Machinery and other equipment ............................................. 5 – 15 years Computer equipment .............................................................. 3 – 5 years
Leasehold improvements ....................................................... Lesser of useful life or lease term
Furniture and fixtures ............................................................. 8 years
Expenditures for maintenance and repairs, as well as minor renewals, are charged to expense as incurred, while improvements and major renewals are capitalized.
Purchased and Developed Software
Purchased and developed software includes the costs to purchase third party software and to develop internal-use software, which includes software as a service offered to customers with an online subscription. The Company follows applicable guidance for the costs of computer software developed or obtained for internal use for capitalizing software projects. Software costs are amortized over the expected economic life of the product, generally on an accelerated basis over a period of three to five years. At December 31, 2014 and 2013, unamortized capitalized software was $15.4 million and $14.4 million, respectively, which included amounts of software under development of $1.8 million and $1.1 million, respectively.

43
Acquired Curriculum and Technology
Acquired curriculum and technology represents curriculum and developed technology acquired in the acquisitions of Headsprout in 2013 and VLCY in 2009, and is the initial purchase accounting value placed on the past development and refinement of the core methodologies, processes, measurement techniques, and technologies by which the Company structures curriculum. Prior to its impairment in the fourth quarter of 2013, acquired curriculum and technology also included assets acquired in the acquisition of Class.com in 2011. Acquired curriculum and technology is being amortized using an accelerated method over six to seven years, as it has an economic benefit declining over the estimated useful life. The Company periodically reviews the recoverability of the acquired curriculum and technology based on expected net realizable value, and generally retires the assets once fully depreciated. Acquired curriculum and technology is presented net of accumulated amortization of $19.6 million and $16.1 million at December 31, 2014 and 2013, respectively.
See Note 7 — Goodwill and Other Intangible Assets and Note 13 — Fair Value of Financial Instruments herein for further discussion of the Company’s review of its acquired curriculum and technology assets and the related impairment charge recognized in the year ended December 31, 2013.
Acquired Publishing Rights
A publishing right allows the Company to publish and republish existing and future works, as well as transform, adapt, or create new works based on previously published materials. The Company determines the fair market value of publishing rights arising from business combinations by discounting the after-tax cash flows projected to be derived from the publishing rights and titles to their net present value using a rate of return that accounts for the time value of money and the appropriate degree of risk. The useful life of acquired publishing rights is based on the lives of the various titles involved, which is generally ten years. The Company calculates amortization using either the straight-line method or the percentage of the projected discounted cash flows derived from the titles in the current year as a percentage of the total estimated discounted cash flows over the remaining useful life. The Company periodically reviews the recoverability of acquired publishing rights based on expected net realizable value, and generally retires assets once fully depreciated. Acquired publishing rights are presented net of accumulated amortization of $23.4 million and $21.5 million at December 31, 2014 and 2013, respectively.
Pre-Publication Costs
The Company capitalizes certain pre-publication costs of its curriculum including art, prepress, editorial, and other costs incurred in the creation of the master copy of its curriculum products. Pre-publication costs are amortized over the expected life of the education program, generally on an accelerated basis over a period of five years. The amortization methods and periods chosen reflect the expected sales generated by the education programs. The Company periodically reviews the recoverability of the capitalized costs based on expected net realizable value, and generally retires assets once fully depreciated. Pre-publication costs are presented net of accumulated amortization of $15.7 million and $18.3 million at December 31, 2014 and 2013, respectively. Interest capitalized during the years ended December 31, 2014 and 2013 totaled $0.1 million and $0.2 million, respectively. During the year ended December 31, 2013 the Company recognized impairment charges of $0.6 million related to expenditures capitalized as pre-publication costs for projects that were subsequently abandoned or determined to have no ongoing benefit to the Company.
See Note 13 — Fair Value of Financial Instruments for further discussion of the Company’s review of its pre-publication costs and the related impairment charge recognized in the year ended December 31, 2013.
Goodwill and Other Intangible Assets
Goodwill and other intangible assets relate to the acquisitions of Headsprout in 2013, VLCY in 2009, and Cambium Learning in 2007. Other intangible assets include trade names/trademarks, reseller networks, customer relationships/lists, and conference attendee relationships, which are being amortized on a straight-line basis over estimated lives ranging from six to sixteen years. Other intangible assets are presented net of accumulated amortization of $20.6 million and $19.6 million at December 31, 2014 and 2013, respectively. Prior to its impairment in the fourth quarter of 2013, other intangible assets also included assets acquired in the acquisition of Class.com in 2011.
See Note 7 — Goodwill and Other Intangible Assets and Note 13 — Fair Value of Financial Instruments for further discussion of the Company’s review of goodwill and other intangible assets and the related impairment charges recognized in the year ended December 31, 2013.

44
Depreciation and Amortization
Depreciation and amortization for the years ended December 31, 2014 and 2013 consisted of the following:
Year Ended December 31, (in thousands) 2014 2013
Acquired publishing rights ....................................... $ 1,943 $ 2,897Acquired curriculum and technology ....................... 3,510 3,687Pre-publication costs ................................................ 6,394 5,115Internally developed software related to product ..... 6,423 5,820
Total amortization included in cost of revenues ............ 18,270 17,519Trade names and trademarks .................................... 452 492Other intangible assets .............................................. 1,045 1,315Property, equipment and software ............................ 2,712 3,088
Total depreciation and amortization included in operating expense ..................................... 4,209 4,895Total depreciation and amortization .............................. $ 22,479 $ 22,414
Impairment of Long Lived Assets
The Company reviews the carrying value of definite-lived long lived assets for impairment whenever events or changes in circumstances indicate net book value may not be recoverable from the estimated undiscounted future cash flows. If the review indicates any assets are impaired, the impairment of those assets is measured as the amount by which the carrying amount exceeds the fair value as estimated by either quoted market prices or discounted cash flows. Assets to be disposed of are reported at the lower of the carrying amount or fair value less cost of disposal. The determination whether the Company’s definite-lived intangible assets are impaired involves significant assumptions and estimates, including projections of future cash flows, the percentage of future revenues and cash flows attributable to the intangible assets, asset lives used to generate future cash flows, and royalty relief savings attributable to trademarks. See Note 13 — Fair Value of Financial Instruments for additional information regarding the impairment of long lived assets recognized in the year ended December 31, 2013.
Deferred Costs
Certain up-front costs associated with completing the sale of the Company’s products are deferred and recognized as the related revenue is recognized.
Advertising Costs
The Company may ship products to prospective customers as samples. Samples costs are expensed to sales and marketing expense upon shipment and totaled $0.9 million and $1.1 million for the years ended December 31, 2014 and 2013, respectively. Other costs of advertising, which include advertising, print, and photography expenses, are expensed as incurred and totaled $1.2 million and $1.6 million for the years ended December 31, 2014 and 2013, respectively. The Company recognizes catalog expense when the catalog is mailed to potential customers.
Income Taxes
Provision is made for the expense, or benefit, associated with taxes based on income. The provision for income taxes is based on laws currently enacted in every jurisdiction in which the Company does business and considers laws mitigating the taxation of the same income by more than one jurisdiction. Significant judgment is required in determining income tax expense, current tax receivables and payables, deferred tax assets and liabilities, and valuation allowance recorded against the net deferred tax assets. Management considers the scheduled reversal of deferred tax liabilities, projected future taxable income, taxable income in prior carryback years, loss carryforward limitations, and tax planning strategies in assessing whether deferred tax assets will be realized in future periods. If, after consideration of these factors, management believes it is more likely than not that a portion of the deferred tax assets will not be realized, a valuation allowance is established. The amount of the deferred tax asset considered realizable could be reduced if estimates of future taxable income during the carryforward period are reduced.
The Company recognizes liabilities for uncertain tax positions based on a two-step process. The first step is to evaluate the tax position for recognition by determining if available evidence indicates that it is more likely than not that the position will be sustained on audit. The second step requires the Company to estimate and measure the tax benefit as the largest amount that is more than 50% likely to be realized upon ultimate settlement. The Company reevaluates its uncertain tax positions on a periodic basis, based on factors such as changes in facts and circumstances, changes in tax law, effectively settled issues under audit and new audit activity. The Company accrues interest and penalties, if any, related to unrecognized tax benefits as a component of income tax expense.

45
Royalty Advances
Royalty advances to authors are capitalized and represent amounts paid in advance of the sale of an author’s product. These costs are then expensed as the related publication is sold. The Company evaluates advances periodically to determine if they are expected to be utilized and reserves any portion of a royalty advance that is not expected to be recovered.
Sales Taxes
The Company reports sales taxes collected from customers and remitted to governmental authorities on a net basis. Sales tax collected from customers is excluded from revenues. Collected but unremitted sales tax is included as part of Accrued Expenses in the accompanying Consolidated Balance Sheets.
Stock-Based Compensation
The Company accounts for its stock-based compensation in accordance with applicable accounting guidance for share-based payments. This guidance requires all share-based payments to be recognized in the Consolidated Statements of Operations and Comprehensive Loss based on their fair values. Compensation costs for awards with graded vesting are recognized on a straight-line basis over the anticipated vesting period.
Reclassifications
Certain reclassifications to service revenues and the related cost of revenues in the Consolidated Statements of Operations and Comprehensive Loss for the year ended December 31, 2013 have been made to conform to the 2014 presentation. Revenue attributable to product related implementation and service and the associated costs previously reported in the captions service revenues and cost of service revenues, respectively, in the prior year were reclassified to product revenues and cost of product revenues, respectively, in the current year.
Recently Issued Financial Accounting Standards
In May 2014, the FASB issued Accounting Standards Update No. 2014-09, Revenue from Contracts with Customers (ASU 2014-09), which supersedes nearly all existing revenue recognition guidance under GAAP. The core principle of ASU 2014-09 is to recognize revenues when promised goods or services are transferred to customers in an amount that reflects the consideration to which an entity expects to be entitled for those goods or services. The new revenue guidance defines a five step process to achieve this core principle and, in doing so, more judgment and estimates may be required within the revenue recognition process than are required under existing GAAP. It is effective for annual periods beginning after December 15, 2016 using either of the following transition methods: (i) a full retrospective approach reflecting the application of the standard in each prior reporting period with the option to elect certain practical expedients, or (ii) a retrospective approach with the cumulative effect of initially adopting ASU 2014-09 recognized at the date of adoption (which includes additional footnote disclosures). The Company is currently evaluating the impact its impending adoption of ASU 2014-09 on its financial statements and has not yet determined the method by which it will adopt the standard in 2017.
In April 2014, The Financial Accounting Standards Board (“FASB”) issued Accounting Standards Update No. 2014-08, Presentation of Financial Statements (Topic 205) and Property, Plant and Equipment (Topic 360): Reporting Discontinued Operations and Disclosures of Disposals of Components of an Entity (ASU 2014-08). ASU 2014-08 raises the threshold for a disposal to qualify as a discontinued operation and requires new disclosures of both discontinued operations and certain other disposals that do not meet the definition of a discontinued operation. It is effective for annual periods beginning on or after December 15, 2014. Early adoption is permitted but only for disposals that have not been reported in financial statements previously issued. The Company does not expect the adoption of this standard to have a significant impact of its consolidated financial statements.
Note 3 — Embezzlement-Related Expense
On April 26, 2008, the Company began an internal investigation that revealed irregularities over the control and use of cash and certain other general ledger accounts of the Company, revealing a misappropriation of assets, or embezzlement. These irregularities were perpetrated by a former employee over more than a three-year period beginning in 2004 and continuing through April 2008 with total embezzlement losses of approximately $14.0 million. Charges included in the Consolidated Statements of Operations and Comprehensive Loss after April 2008 represent expenses incurred by the Company to recover property purchased by the former employee using the embezzled funds, net of any recoveries.
During the quarter ended September 30, 2013, the Company substantially completed the recovery and sale of property related to the employee embezzlement matter. The net expense recorded in the year ended December 31, 2013 was primarily due to reductions in the carrying value of the recovered property to the final sales price.

46
Warrant
The number of shares of common stock issuable under a warrant held by VSS-Cambium Holdings III, LLC was increased based on cash recoveries, net of related expenses, that the Company received related to the employee embezzlement matter on and after June 1, 2009. The number of shares issuable under the warrant equaled 0.45 multiplied by the quotient of net cash recoveries divided by $6.50. As a result of net cash recoveries of $0.3 million realized during the year ended December 31, 2013, shares under the warrant were increased by 17,864 to 299,847. As the contingency around the number of shares issuable under the warrant was substantially resolved during the year ended December 31, 2013, the Company reclassified the award from Other Liabilities to Capital Surplus in the Consolidated Balance Sheets in accordance with applicable accounting guidance.
See Note 17 — Stock-Based Compensation and Expense for additional information related to the warrant. Note 4 — Acquisition of Headsprout
In December 2013, LAZEL, Inc., a wholly owned subsidiary of the Company, completed the acquisition of certain assets of Headsprout from Mimio, LLC. Headsprout is an adaptive and engaging reading program that uses patented research-based instruction systems that teach kids critical early reading skills and reading comprehension strategies. The program’s patented scaffolded delivery is designed to adapt to the specific needs and learning pace of each student, and has been proven to boost test scores and improve literacy rates in various classroom environments across the country. Headsprout is part of the Learning A-Z product line’s larger reading offering and is marketed and sold as Headsprout® (www.headsprout.com). The acquisition directly relates to the Company’s strategy to increase its digital subscription product offerings and the purchased assets add breadth to the Learning A-Z product line by adding proven, adaptable student-facing phonics and comprehension resources to the product line’s existing reading offerings.
The Headsprout acquisition was accounted for as a purchase transaction with the Company acquiring certain assets for $4.0 million. Of the total purchase price, $3.6 million was paid in January 2014 with the remaining $0.4 million to be paid 18 months after the closing date, subject to the holdback provisions of the purchase agreement. The holdback liability was reported in Other Liabilities at December 31, 2013 but was subsequently reclassified to Accrued Expenses during 2014.
Note 5 — Income Taxes
Losses before income taxes for the years ended December 31, 2014 and 2013 were primarily attributable to the United States. Income tax expense attributable to income included the following:
Year Ended December 31, (in thousands) 2014 2013
Current income tax expense: United States federal ...................................... $ — $ — State and local ................................................ 291 218
Total current income tax expense ........................ 291 218 Deferred income tax expense:
United States federal ...................................... (902) 49 State and local ................................................ 1,211 (102 )
Total deferred income tax expense ...................... 309 (53 )Income tax expense ................................................ $ 600 $ 165
Reconciliation of income tax expense and the domestic federal statutory income tax benefit is as follows:
Year Ended December 31, (in thousands) 2014 2013 Statutory federal income tax benefit ...................... $ (3,274) $ (4,931 )Increase (reduction) from:
State taxes (net of federal benefit) ..................... 600 116 Change in valuation allowance ......................... 3,096 4,773 Other ................................................................. 178 207
Income tax expense ................................................ $ 600 $ 165
Deferred income taxes are primarily provided for temporary differences between the financial reporting basis and the tax basis of the Company’s assets and liabilities.

47
The tax effects of each type of temporary difference and carryforward that give rise to a significant portion of deferred tax assets (liabilities) at December 31, 2014 and 2013 were as follows:
December 31, (in thousands) 2014 2013 Deferred tax assets are attributable to:
Net operating loss carryforwards .............................. $ 27,645 $ 25,589 Tax credit carryforwards .......................................... 7,622 7,622 Reserves ................................................................... 4,864 4,546 Inventory .................................................................. 5,090 5,552 Deferred financing costs ........................................... 2,064 1,589 Fixed assets .............................................................. 263 1,691 Deferred revenue ...................................................... 3,853 2,959 Intangibles ................................................................ 5,434 5,391 Other ......................................................................... 1,895 1,867
Total gross deferred tax assets ....................................... 58,730 56,806 Valuation allowance ................................................. (54,945) (51,849 )
Net deferred tax assets ................................................... 3,785 4,957 Deferred tax liabilities attributable to intangibles .......... (3,798) (4,991 )Net deferred tax liability ................................................ $ (13) $ (34 )
The deferred tax asset (liability) is classified as follows:
December 31, (in thousands) 2014 2013 Short-term deferred tax asset ......................................... $ 546 $ 536 Long-term deferred tax liability ..................................... (559) (570 )
Net deferred tax liability ........................................... $ (13) $ (34 )
The net increase in the valuation allowance in 2014 and 2013 was $3.1 million and $4.8 million, respectively. The valuation allowance increased primarily because it offset the increase in the deferred tax asset derived from pre-tax losses. As of December 31, 2014, there is no amount of the valuation allowance for which subsequently recognized benefits will be allocated to reduce goodwill.
At December 31, 2014, the amounts and expiration dates of loss and tax credit carryforwards were as follows:
(in thousands)
Amount as of December 31,
2014 Expire or start
expiring at the end of: U.S. net operating loss (1) .............................. $ 77,423 2028 State net operating loss carryforward (net): State tax net operating losses ...................... 2,903 2015 – 2028 Tax credits: Minimum tax credit .................................... 7,444 Carry forward indefinitely Other tax credits .......................................... 178 2015 – 2021Total tax credits ............................................ $ 7,622
(1) $27.8 million of the U.S net operating loss (NOL) above is related to the VLCY acquisition. The utilization of this NOL is subject to an annual limitation of $7.1 million.
Income taxes paid, net of tax refunds, were $0.2 million and $0.1 million for the years ended December 31, 2014 and 2013, respectively.

48
Uncertain Tax Positions
The Company recognizes the financial statement impacts of a tax return position when it is more likely than not, based on technical merits, that the position will ultimately be sustained. For tax positions that meet this recognition threshold, the Company applies judgment, taking into account applicable tax laws, experience managing tax audits and relevant GAAP, to determine the amount of tax benefits to recognize in the financial statements. For each position, the difference between the benefit realized on the Company’s tax return and the benefit reflected in the financial statements is recorded to Other Liabilities in the Consolidated Balance Sheets as an unrecognized tax benefit (“UTB”). The Company updates its UTBs at each financial statement date to reflect the impacts of audit settlements and other resolution of audit issues, expiration of statutes of limitation, developments in tax law and ongoing discussions with tax authorities.
A reconciliation of the change in the UTB balance for the years ended December 31, 2014 and 2013 is as follows:
Year Ended December 31, (in thousands) 2014 2013 Unrecognized tax benefit, beginning of period .............. $ 6,389 $ 7,141
Increases for tax positions in prior periods ............... 778 — Decreases for effectively settled tax positions .......... (703) — Decreases for expiration of the statute of limitations .............................................................. — (752 )
Unrecognized tax benefit, end of period ........................ $ 6,464 $ 6,389
Included in the balance of unrecognized tax benefits at December 31, 2014 are approximately $1.2 million of tax benefits that, if recognized, would affect the effective tax rate. The recognition of the remaining uncertain tax positions would not affect the effective tax rate, but would instead increase or would have increased available tax attributes. However, the recognition of the tax attribute would be offset by an increase in the deferred tax asset valuation allowance resulting in no net impact in the effective tax rate.
The Company recognizes interest accrued related to unrecognized tax benefits and penalties as income tax expense. Related to the unrecognized tax benefits noted above, the Company recognized $0.3 million for penalties (gross) and $0.2 million for interest (gross) during the year ended December 31, 2014. At December 31, 2014, the Company has liabilities of $0.3 million for penalties (gross) and $0.2 million for interest (gross).
The Company files income tax returns in the U.S. federal jurisdiction and various state jurisdictions. All U.S. tax years prior to 2008 related to the VLCY acquired entities have been audited by the Internal Revenue Service. Cambium and its subsidiaries have been examined by the Internal Revenue Service through the end of 2006. The Company has been audited by the various state tax authorities through 2007. Note 6 — Property, Equipment and Software
Balances of major classes of assets and accumulated depreciation and amortization at December 31, 2014 and 2013 consisted of the following:
December 31, (in thousands) 2014 2013
Software ................................................................... $ 36,863 $ 30,500Machinery, computers and equipment ...................... 8,255 6,870Sublease asset ........................................................... 2,814 2,814Leasehold improvements .......................................... 1,698 1,546Furniture and fixtures ............................................... 1,668 1,494
Property, equipment and software at cost ...................... 51,298 43,224Accumulated depreciation and amortization ............ 30,442 22,909
Property, equipment and software, net ........................... $ 20,856 $ 20,315
See Note 12 — Leases for additional information regarding the sublease asset.

49
Note 7 — Goodwill and Other Intangible Assets Goodwill
The changes in the carrying amount of goodwill for the years ended December 31, 2014 and 2013 are as follows:
(in thousands) Learning
A-Z
Voyager Sopris
Learning ExploreLearning Kurzweil Education Total
Balance at December 31, 2012: Goodwill, gross ............................................. $ 12,777 $ 178,456 $ 6,947 $ 38,806 $ 236,986 Accumulated impairment loss ...................... — (156,438) — (33,144) (189,582)
Goodwill ............................................................ 12,777 22,018 6,947 5,662 47,404 Impairment ................................................. — — — — — Acquisitions ............................................... 438 — — — 438
Balance at December 31, 2013: Goodwill, gross ............................................. 13,215 178,456 6,947 38,806 237,424 Accumulated impairment loss ...................... — (156,438) — (33,144) (189,582)
Goodwill ............................................................ 13,215 22,018 6,947 5,662 47,842 Impairment ................................................. — — — — — Acquisitions ............................................... — — — — —
Balance at December 31, 2014: Goodwill, gross ............................................. 13,215 178,456 6,947 38,806 237,424 Accumulated impairment loss ...................... — (156,438) — (33,144) (189,582)
Goodwill ............................................................ $ 13,215 $ 22,018 $ 6,947 $ 5,662 $ 47,842 Impairment Analysis
In accordance with GAAP, goodwill and other indefinite-lived intangible assets are not amortized but are instead reviewed for impairment at least annually and if a triggering event is determined to have occurred in an interim period. Relevant accounting guidance provides entities with the option of performing a qualitative assessment to determine if it is more likely than not that goodwill might be impaired or a quantitative two-step goodwill impairment test.
When the Company elects to perform the qualitative assessment for a reporting unit, management evaluates relevant events and circumstances, such as macroeconomic conditions, industry and market changes, cost changes in key inputs, overall financial performance, and pertinent entity-specific or reporting unit-specific changes. If after assessing the totality of relevant events and circumstances, the Company determines that it is not more likely than not that the fair value of a reporting unit is less than its carrying amount, the quantitative two-step goodwill impairment test is unnecessary.
When the Company performs the two-step quantitative impairment test for a reporting unit, it first determines the fair market value of the reporting unit using a weighted income and market approach. The income approach is dependent on multiple assumptions and estimates, including future cash flow projections with a terminal value multiple and the discount rate used to determine the expected present value of the estimated future cash flows. Future cash flow projections are based on management’s best estimates of economic and market conditions over the projected periods, including industry fundamentals such as the state of educational funding, revenue growth rates, future costs and operating margins, working capital needs, capital and other expenditures, and tax rates. The discount rate applied to the future cash flows is a weighted-average cost of capital and takes into consideration market and industry conditions, returns for comparable companies, the rate of return an outside investor would expect to earn, and other relevant factors. The fair value of the reporting unit also takes into consideration a market approach, based on historical and projected multiples of certain guideline companies. If the carrying amount of the reporting unit exceeds its fair value in the first step of the impairment test, then a second step is performed to determine the implied fair value of the reporting unit’s goodwill. The second step of the impairment test requires the allocation of the fair value of a reporting unit to all of its assets and liabilities as if the reporting unit had been acquired in a business combination. If the carrying amount of the reporting unit’s goodwill exceeds its implied fair value, then an impairment loss equal to the difference is recognized.
The Company’s performs its annual impairment test on October 1st each year.
2014 Annual Goodwill Impairment Analysis
The Company performed the 2014 annual goodwill impairment analysis using four reporting units: Learning A-Z, Voyager Sopris Learning, ExploreLearning, and Kurzweil Education.

50
During 2014, the Company elected to perform the optional qualitative assessment for the Learning A-Z and ExploreLearning reporting units. The qualitative assessment did not result in a conclusion that it was more likely than not that the fair value of these reporting units was less than their respective carrying amounts, therefore it was unnecessary to perform the quantitative two-step goodwill impairment test for the Learning A-Z and ExploreLearning reporting units.
During 2014, the Company elected to perform the quantitative two-step goodwill impairment test for the Voyager Sopris Learning and Kurzweil Education reporting units. The step one calculated fair values of these reporting units exceeded their respective carrying amounts by at least 10%; therefore it was unnecessary to perform the second step of the quantitative impairment test.
2013 Annual Goodwill Impairment Analysis The Company performed the 2013 annual goodwill impairment analysis using four reporting units: Learning A-Z, Voyager
Sopris Learning, ExploreLearning, and Kurzweil Education.
During 2013, the Company elected to perform the optional qualitative assessment for the Learning A-Z and ExploreLearning reporting units. The qualitative assessment did not result in a conclusion that it was more likely than not that the fair value of these reporting units was less than their respective carrying amounts, therefore it was unnecessary to perform the quantitative two-step goodwill impairment test for the Learning A-Z and ExploreLearning reporting units
During 2013, the Company elected to perform the quantitative two-step goodwill impairment test for the Voyager Sopris Learning and Kurzweil Education reporting units. The step one calculated fair values of these reporting units exceeded their respective carrying amounts by at least 10%; therefore it was unnecessary to perform the second step of the quantitative impairment test.
Intangible Assets The Company’s definite lived intangible assets and related accumulated amortization at December 31, 2014 and 2013 consisted
of the following:
(in thousands) December 31,
2012 Additions Disposals Impairments December 31,
2013 Additions Disposals ImpairmentsDecember 31,
2014 Intangible assets, gross:
Publishing rights .............. $ 26,200 $ — $ — $ — $ 26,200 $ — $ — $ — $ 26,200 Trademark ........................ 5,469 280 (1) (58) 5,690 — (580 ) — 5,110 Customer relationships ..... 7,717 — — — 7,717 — — — 7,717 Acquired curriculum and technology ..................... 22,001 3,579 (259) (493) 24,828 — — — 24,828 Reseller network .............. 12,300 — — — 12,300 — — — 12,300 Conference attendees ....... 134 — — — 134 — (134 ) — —
Total intangible assets, gross ................................... 73,821 3,859 (260) (551) 76,869 — (714 ) — 76,155 Intangible assets, accumulated amortization:
Publishing rights .............. (18,598 ) (2,897) — — (21,495) (1,943 ) — — (23,438)Trademark ........................ (1,575 ) (492) 1 — (2,066) (452 ) 325 — (2,193)Customer relationships ..... (5,008 ) (771) — — (5,779) (699 ) — — (6,478)Acquired curriculum and technology ..................... (12,681 ) (3,687) 259 — (16,109) (3,510 ) — — (19,619)Reseller network .............. (11,079 ) (537) — — (11,616) (341 ) — — (11,957)Conference attendees ....... (122 ) (7) — — (129) (5 ) 134 — —
Total intangible assets, accumulated amortization ... (49,063 ) (8,391) 260 — (57,194) (6,950 ) 459 — (63,685)
Intangible assets, net ................ $ 24,758 $ (4,532) $ — $ (551) $ 19,675 $ (6,950 ) $ (255 ) $ — $ 12,470

51
2014 Intangible Asset Disposal
During the quarter ended June 30, 2014, the Company disposed of trade names of $0.3 million in conjunction with the sale of the IntelliTools product line.
2013 Intangible Asset Impairments
During the quarter ended December 31, 2013, the Company recorded impairment charges of $0.6 million related to the intangible assets of the Class.com product line. See Note 13 — Fair Value of Financial Instruments for additional information.
Estimated Future Amortization Expense Estimated amortization expense expected for each of the next five years related to intangibles subject to amortization is as
follows:
(in thousands) Cost of Revenues Operating Expense Amortization 2015 .......................................................................... $ 3,780 $ 1,269 $ 5,0492016 .......................................................................... 2,339 1,081 3,4202017 .......................................................................... 1,094 426 1,5202018 .......................................................................... 380 327 7072019 .......................................................................... 253 311 564Thereafter ................................................................. 125 1,085 1,210 $ 7,971 $ 4,499 $ 12,470
Note 8 — Other Current Assets
Other current assets at December 31, 2014 and 2013 consisted of the following:
December 31, (in thousands) 2014 2013 Deferred costs ................................................................ $ 5,908 $ 4,968Prepaid expenses ............................................................ 1,714 1,369Deferred taxes ................................................................ 546 536
Other current assets .................................................. $ 8,168 $ 6,873
Note 9 — Other Assets
Other assets at December 31, 2014 and 2013 consisted of the following:
December 31, (in thousands) 2014 2013 Deferred financing costs ................................................ $ 2,349 $ 4,541Collateral investments .................................................... 3,624 1,971Deferred costs, less current portion ................................ 828 764Other .............................................................................. 834 1,012
Other assets .............................................................. $ 7,635 $ 8,288
Deferred Financing Costs
Deferred financing costs primarily relate to costs incurred with the issuance of the 9.75% senior secured notes due 2017. During the year ended December 31, 2014, the Company wrote-off $0.7 million of unamortized deferred financing costs in conjunction with the repurchase of $35.0 million aggregate principal amount of senior secured notes. Additionally, in the quarter ended March 31, 2014, the Company wrote-off $0.2 million in unamortized deferred financing costs in conjunction with the termination of the ABL Facility. See Note 14 – Long-Term Debt for additional information regarding deferred financing costs.

52
Collateral Investments
The Company maintains certificates of deposit to collateralize its outstanding letters of credit associated with the build-to-suit lease, credit collections, and workers’ compensation activity. At December 31, 2013, the Company had certificates of deposit of $1.1 million to collateralize certain letters of credit outstanding at that date. During the first quarter of 2014, the Company purchased additional certificates of deposit of $2.1 million to serve as collateral for outstanding letters of credit previously collateralized by the ABL Facility that was terminated on March 26, 2014 as described in Note 14 – Long-Term Debt. During the third quarter of 2014, an outstanding certificate of deposit of $0.5 million was redeemed as the associated letter of credit was terminated during the period. As a result of these changes, at December 31, 2014, the Company had $2.7 million in certificates of deposit serving as collateral for its outstanding letters of credit. See Note 18 – Commitments and Contingencies for additional information regarding the Company’s outstanding letters of credit.
Additionally, the Company maintains a money market fund investment to serve as collateral for a travel card program. The balance of the money market fund investment was $0.9 million at December 31, 2014 and 2013. Note 10 — Accrued Expenses
Accrued expenses at December 31, 2014 and 2013 consisted of the following:
December 31, (in thousands) 2014 2013 Salaries, bonuses and benefits ........................................ $ 6,439 $ 9,687Accrued interest ............................................................. 5,119 6,471Headsprout acquisition accrual ...................................... 400 3,600Accrued royalties ........................................................... 1,369 1,649Pension and post-retirement benefit plans ..................... 1,173 1,214Other .............................................................................. 2,932 2,658
Accrued expenses ..................................................... $ 17,432 $ 25,279 Accrued Interest
Accrued interest at December 31, 2014 and 2013 primarily relates to the Company’s 9.75% senior secured notes. The senior secured notes require semi-annual interest payments in arrears on each February 15th and August 15th over the life of the notes.
Headsprout Acquisition Accrual
In December 2013, LAZEL, Inc., a wholly owned subsidiary of the Company, completed the acquisition of certain assets of Headsprout for $4.0 million. Of the total purchase price, $3.6 million was paid in January 2014 with the remaining $0.4 million to be paid 18 months after the closing date, subject to the holdback provisions of the purchase agreement. The holdback liability was reported in Other Liabilities at December 31, 2013 but was subsequently reclassified to Accrued Expenses during 2014. See Note 4 – Acquisition of Headsprout for additional information.
Pension and Post-Retirement Benefit Plans
See Note 15 – Profit Sharing, Pension, and Other Postretirement Benefit Plans for further information regarding the Company’s pension and post-retirement benefit plan liabilities. Note 11 — Other Liabilities
Other liabilities at December 31, 2014 and 2013 consisted of the following:
December 31, (in thousands) 2014 2013 Pension and post-retirement benefit plans, long-term
portion ....................................................................... $ 11,440 $ 10,241Deferred rent .................................................................. 1,043 1,201Long-term income tax payable ...................................... 1,237 902Long-term deferred tax liability ..................................... 559 570Long-term deferred compensation ................................. 359 491Headsprout acquisition accrual ...................................... — 400Other .............................................................................. — 149
Other liabilities ......................................................... $ 14,638 $ 13,954

53
Pension and Post-Retirement Benefit Plans
See Note 15 – Profit Sharing, Pension, and Other Postretirement Benefit Plans for further information regarding the Company’s pension and post-retirement medical benefits liabilities.
Headsprout Acquisition Accrual
In December 2013, LAZEL, Inc., a wholly owned subsidiary of the Company, completed the acquisition of certain assets of Headsprout for $4.0 million. Of the total purchase price, $3.6 million was paid in January 2014 with the remaining $0.4 million to be paid 18 months after the closing date, subject to the holdback provisions of the purchase agreement. The holdback liability was reported in Other Liabilities at December 31, 2013 but was subsequently reclassified to Accrued Expenses during 2014. See Note 4 – Acquisition of Headsprout for additional information.
Note 12 — Leases Capital Lease Obligations
The Company has a build-to-suit lease for warehouse and office space in Frederick, Colorado with a minimum term through October 31, 2016. The lease is renewable at the Company’s option for two additional periods of five years each. The Company has an outstanding letter of credit in the amount of $1.0 million to secure the lease. At the lease inception date, the Company evaluated the provisions of the accounting guidance relating to the effect of a lessee’s involvement in an asset construction and concluded that due to the Company’s collateral to the landlord, in the form of the $1.0 million letter of credit, that it was deemed the owner of the land and building for accounting purposes. As a result, the related costs were capitalized and a corresponding liability was recorded in Capital Lease Obligations, Current and Capital Lease Obligations, Less Current Portion.
On February 15, 2012, the Company’s Board of Directors approved a plan to outsource warehouse operations to a third party logistics provider, Ozburn-Hessey Logistics, LLC (“OHL”), and to cease use of this leased facility. As a result of this decision, the Company determined it was more likely than not that the pattern of usage for the warehouse and related assets would change; therefore the Company evaluated the change in accordance with applicable accounting guidance. This evaluation resulted in an impairment to the value of the land, leasehold improvements, and building associated with the Company’s Frederick, Colorado facility and the estimated useful lives of the remaining assets were reduced to match the remaining minimum term of the lease. The remaining asset primarily represents the discounted cash flows expected from estimated sublease receipts. The sublease of the warehouse facility began in July 2012 and has a minimum term through October 2016 with monthly rental payments totaling $0.1 million. The remaining sublease income through the end of the minimum term is expected to be $1.6 million.
The amount of the depreciation expense associated with the build-to-suit capital assets was $0.7 million and $0.6 million for the years ended December 31, 2014 and 2013, respectively. Additionally, the obligation is reduced over the life of the lease at an interest rate of 5.54%. The gross value of assets leased under the build-to-suit lease of $2.8 million at December 31, 2014 and 2013 are included in Sublease Asset in Note 6 — Property, Equipment and Software. The accumulated amortization of build-to-suit capital assets was $1.7 million and $1.0 million at December 31, 2014 and 2013, respectively.
Future minimum payments under the build-to-suit lease at December 31, 2014 are as follows:
(in thousands)
Minimum Capital Lease
Payments 2015 ...................................................................................... $ 1,160 2016 ...................................................................................... 967 Total minimum lease payments ............................................ 2,127
Less: Amount representing interest ................................ (108 ) Present value of net minimum lease payments..................... 2,019
Less: Current portion ...................................................... (1,076 ) Capital lease obligations, less current portion ...................... $ 943
Operating Leases
The Company leases certain facilities and equipment for production, selling and administrative purposes under agreements with original lease periods up to 10 years. Leases generally include provisions requiring payment of taxes, insurance, and maintenance on leased property. Some leases may include renewal options, rent escalation clauses, or options to purchase the leased property during or at the end of the lease term.

54
Rent holidays and rent escalation provisions are considered in determining straight-line rent expense to be recorded over the applicable lease term. The lease term begins on the commencement date as defined in the relevant lease agreement. Lease renewal periods are considered on a lease-by-lease basis and are generally not included in the initial lease term. Operating rent expense was $2.1 million and $2.0 million for the years ended December 31, 2014 and 2013, respectively. Sublease income for existing operating leases was $0.1 million in the years ended December 31, 2014 and 2013, and is expected to total $11 thousand through February 2015.
Future minimum payments under non-cancelable operating leases are as follows:
(in thousands)
Minimum Operating Lease
Payments 2015 ................................................................................ $ 2,009 2016 ................................................................................ 1,903 2017 ................................................................................ 1,951 2018 ................................................................................ 1,754 2019 ................................................................................ 848 Thereafter........................................................................ 853
Total minimum lease payments ............................................ $ 9,318 Note 13 — Fair Value of Financial Instruments
Fair value is defined as the price that would be received to sell an asset, or paid to transfer a liability (exit price), in the principal or most advantageous market for the asset or liability in an orderly transaction between market participants on the measurement date. Valuation techniques are based on observable or unobservable inputs. Observable inputs reflect market data obtained from independent sources, while unobservable inputs reflect the Company’s market assumptions. These two types of inputs have created the following fair value hierarchy:
Level 1 — Quoted prices for identical instruments in active markets. Level 2 — Quoted prices for similar instruments in active markets; quoted prices for identical or similar instruments in
markets that are not active; and model-derived valuations in which significant value drivers are observable. Level 3 — Valuations derived from valuation techniques in which significant value drivers are unobservable.
Applicable guidance requires an entity to maximize the use of observable inputs and minimize the use of unobservable inputs when measuring fair value.
At December 31, 2014, financial instruments include $34.4 million of cash and cash equivalents, restricted assets of $5.5 million, collateral investments of $3.6 million and $139.7 million of senior secured notes. At December 31, 2013, financial instruments include $68.0 million of cash and cash equivalents, restricted assets of $6.8 million, collateral investments of $2.0 million and $174.5 million of senior secured notes. The fair market values of cash equivalents, restricted assets and collateral investments are equal to their carrying value, as these investments are recorded based on quoted market prices and/or other market data for the same or comparable instruments and transactions as of the end of the applicable reporting period. During the quarter ended September 30, 2013, the Company substantially completed the recovery and sale of property related to the employee embezzlement matter. As the number of shares exercisable under the warrant were substantially finalized and no other significant contingencies remained, these awards were reclassified from Other Liabilities to Capital Surplus in the Consolidated Balance Sheets in accordance with GAAP.
At December 31, 2014, the senior secured notes, with aggregate outstanding principal amount of $140.0 million, had a fair value of $137.4 million based on quoted market prices in active markets for these debt instruments when traded as assets.
Assets and liabilities measured at fair value on a recurring basis at December 31, 2014 and 2013 were as follows:
(in thousands) Fair Value at Reporting Date Using
Description December 31,
2014
Quoted Prices in Active Markets for
Identical Asset (Level 1)
Significant Other Observable
Inputs (Level 2)
Significant Unobservable
Inputs (Level 3)
Restricted Assets: Money Market ................................................... $ 5,497 $ 5,497 $ — $ —
Collateral Investments: Money Market ................................................... 904 904 — —Certificate of Deposit ........................................ 2,720 2,720 — —

55
(in thousands) Fair Value at Reporting Date Using
Description December 31,
2013
Quoted Prices in Active Markets for
Identical Asset (Level 1)
Significant Other Observable
Inputs (Level 2)
Significant Unobservable
Inputs (Level 3)
Restricted Assets: Money Market ................................................... $ 6,835 $ 6,835 $ — $ —
Collateral Investments: Money Market ................................................... 903 903 — —Certificate of Deposit ........................................ 1,068 1,068 — —
(in thousands) Total Gains (Losses)
Years Ended December 31, Description 2014 2013 Restricted Assets:
Money Market .......................................................... $ — $ — Collateral Investments:
Money Market .......................................................... — — Certificate of Deposit ............................................... — —
Warrant .......................................................................... — (53 )Assets held for sale:
Recovered Properties ................................................ — (122 )CVRs ............................................................................. — (74 )
Contingent Value Rights
As part of the 2009 merger with VLCY, each former VLCY shareholder received a CVR to receive cash in an amount equal to the aggregate amount of specified tax refunds received after the closing of the mergers and various other amounts deposited in escrow on or after the closing date, reduced by any payments to be made under the escrow agreement entered into in connection with the mergers, with respect to agreed contingencies, a potential working capital adjustment and allowed expenses, divided by the total number of shares of VLCY common stock outstanding immediately prior to the effective time of the mergers.
The first and second CVR payment dates were in September 2010 and June 2011, with $1.1 million and $2.0 million, respectively, distributed to the escrow agent at those times for distribution to holders of the CVRs.
During the quarter ended June 30, 2013, the remaining contingencies related to the CVR liability were resolved and the final payment of $7.7 million was issued. This payment comprised $5.8 million related to a Michigan state tax matter and $1.9 million related to a potential tax indemnity obligation. Restricted cash in an escrow account for the benefit of the CVRs was $3.0 million for the potential tax indemnity obligation. As the potential tax indemnity obligation was not triggered, the remaining $1.1 million in the escrow account reverted back to the general cash of the Company in the quarter ended June 30, 2013.
See Note 18 — Commitments and Contingencies for further information related to the Michigan tax matter. During the year ended December 31, 2013, losses of $0.1 million, were recorded in general and administrative expense to reflect
changes in the estimated fair value of the CVR liability. A detail of the elements included in the CVR liability along with the detail of related cash payments is as follows:
(in thousands)
Fair Value Measurements Using Significant
Unobservable Inputs (Level 3)
December 31, 2012 ........................................ $ 7,599 Accrued interest ........................................ 74 Payments ................................................... (7,673 )
December 31, 2013 ........................................ $ —
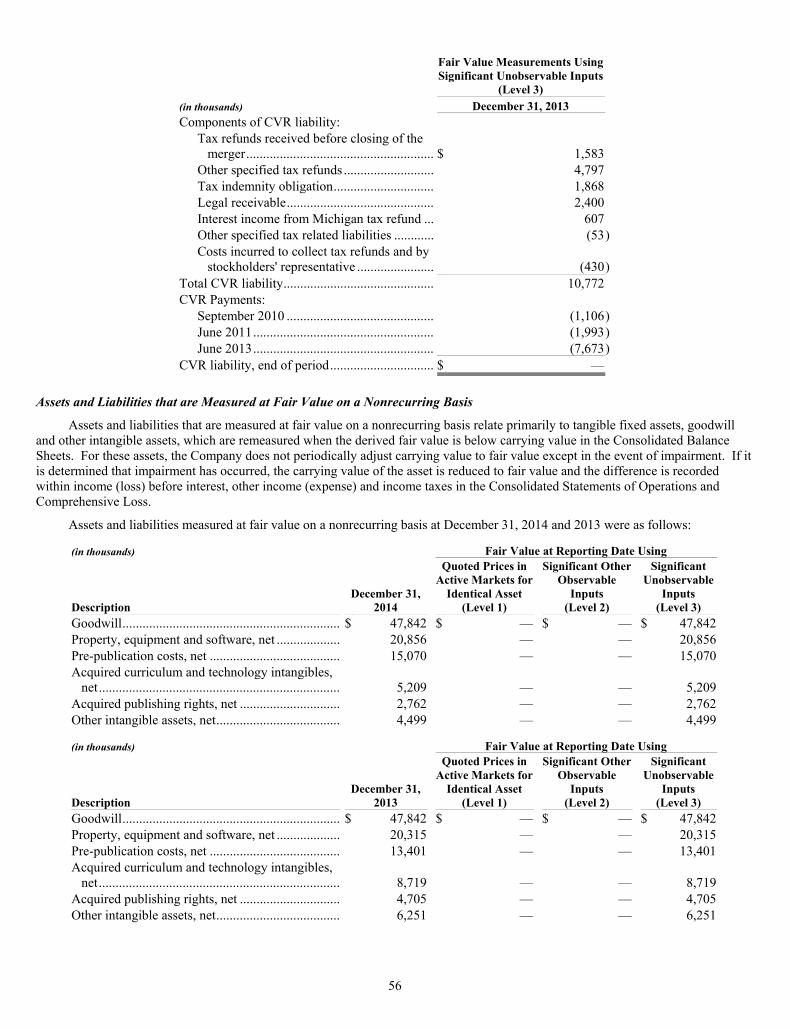
56
Fair Value Measurements UsingSignificant Unobservable Inputs
(Level 3)(in thousands) December 31, 2013 Components of CVR liability:
Tax refunds received before closing of the merger ........................................................ $ 1,583 Other specified tax refunds ........................... 4,797 Tax indemnity obligation .............................. 1,868 Legal receivable ............................................ 2,400 Interest income from Michigan tax refund ... 607 Other specified tax related liabilities ............ (53 ) Costs incurred to collect tax refunds and by stockholders' representative ....................... (430 )
Total CVR liability ............................................. 10,772 CVR Payments:
September 2010 ............................................ (1,106 ) June 2011 ...................................................... (1,993 ) June 2013 ...................................................... (7,673 )
CVR liability, end of period ............................... $ —
Assets and Liabilities that are Measured at Fair Value on a Nonrecurring Basis
Assets and liabilities that are measured at fair value on a nonrecurring basis relate primarily to tangible fixed assets, goodwill and other intangible assets, which are remeasured when the derived fair value is below carrying value in the Consolidated Balance Sheets. For these assets, the Company does not periodically adjust carrying value to fair value except in the event of impairment. If it is determined that impairment has occurred, the carrying value of the asset is reduced to fair value and the difference is recorded within income (loss) before interest, other income (expense) and income taxes in the Consolidated Statements of Operations and Comprehensive Loss.
Assets and liabilities measured at fair value on a nonrecurring basis at December 31, 2014 and 2013 were as follows:
(in thousands) Fair Value at Reporting Date Using
Description December 31,
2014
Quoted Prices in Active Markets for
Identical Asset (Level 1)
Significant Other Observable
Inputs (Level 2)
Significant Unobservable
Inputs (Level 3)
Goodwill ................................................................. $ 47,842 $ — $ — $ 47,842Property, equipment and software, net ................... 20,856 — — 20,856Pre-publication costs, net ....................................... 15,070 — — 15,070Acquired curriculum and technology intangibles, net ........................................................................ 5,209 — — 5,209Acquired publishing rights, net .............................. 2,762 — — 2,762Other intangible assets, net ..................................... 4,499 — — 4,499
(in thousands) Fair Value at Reporting Date Using
Description December 31,
2013
Quoted Prices in Active Markets for
Identical Asset (Level 1)
Significant Other Observable
Inputs (Level 2)
Significant Unobservable
Inputs (Level 3)
Goodwill ................................................................. $ 47,842 $ — $ — $ 47,842Property, equipment and software, net ................... 20,315 — — 20,315Pre-publication costs, net ....................................... 13,401 — — 13,401Acquired curriculum and technology intangibles, net ........................................................................ 8,719 — — 8,719Acquired publishing rights, net .............................. 4,705 — — 4,705Other intangible assets, net ..................................... 6,251 — — 6,251

57
(in thousands) Total Gains (Losses)
Years Ended December 31, Description 2014 2013 Goodwill ........................................................................ $ — $ — Property, equipment and software, net ........................... — (319 )Pre-publication costs, net ............................................... — (633 )Acquired curriculum and technology intangibles, net ... — (493 )Acquired publishing rights, net ...................................... — — Other intangible assets, net ............................................ — (58 )
2013 Impairments
In 2011, the Company completed the acquisition of certain assets of Class.com, a provider of online learning solutions and courseware. To better align its product portfolio with the Company’s strategic focus, during the quarter ended September 30, 2013 the Voyager Sopris Learning segment began considering strategic alternatives, including a potential sale of the Class.com assets.
The Company determined that the potential sale of the Class.com assets was a trigger event for performing a review of the recoverability of the related assets. After reviewing the recoverability of the assets and the fair values, as necessary, it was determined that no impairment was present at September 30, 2013.
The likelihood of completing a sales transaction began to decline during the quarter ended December 31, 2013 and the sales effort was withdrawn in early 2014. The Company determined that this decline in estimated future cash flows related to the product line was a trigger event for performing another review of the recoverability of the related assets. Given that the Company’s plans to cease selling the product line after completion of its remaining service contracts, the related assets were determined to not be recoverable. As such, the Company performed an impairment analysis resulting in a total charge of $1.2 million which was allocated as follows:
(in thousands)
Description Class.com
Impairment Property, equipment and software, net ........................... $ (319 ) Pre-publication costs, net ................................................ (230 ) Acquired curriculum and technology intangibles, net .... (493 ) Other intangible assets, net ............................................. (58 ) Other assets ..................................................................... (89 )
Total Class.com impairment ................................................ $ (1,189 )
Additionally, during the quarter ended December 31, 2013 the Company made a decision to terminate a development agreement with a third party. As a result of this decision, the Company recognized a $0.5 million impairment charge for pre-paid royalties in Other Assets and a $0.1 million impairment charge for contract settlement to Accrued Expenses.
The Company also recognized an impairment charge of $0.4 million during the quarter ended December 31, 2013 for previously capitalized development expenses that were determined to have no ongoing benefit to the Company, with the offset recorded to Pre-Publication Costs.
See Note 7 — Goodwill and Other Intangible Assets above for further information on impairments recognized for the Company’s Acquired Curriculum and Technology Intangibles, Acquired Publishing Rights and Other Intangible Assets.
Note 14 — Long-Term Debt
Long-term debt at December 31, 2014 and 2013 consisted of the following:
December 31, (in thousands) 2014 2013 9.75% senior secured notes due February 15, 2017, interest payable semiannually ..................................... $ 140,000 $ 175,000 Less: Unamortized discount ........................................... (277) (509 )
Long-term debt $ 139,723 $ 174,491

58
Senior Secured Notes Due 2017
In February 2011, the Company closed an offering of $175.0 million aggregate principal amount of 9.75% senior secured notes due 2017 (the “Notes”). Deferred financing costs, net of accumulated amortization, are capitalized in Other Assets in the Consolidated Balance Sheets and are amortized over the term of the related debt using the effective interest method. Unamortized deferred financing costs at December 31, 2014 and 2013 were $2.3 million and $4.5 million, respectively, related to the Notes and the ABL Facility (as defined and described below), which was terminated in the quarter ended March 31, 2014.
Interest on the Notes accrues at a rate of 9.75% per annum from the date of original issuance and is payable semi-annually in arrears on each February 15th and August 15th to the holders of record of the Notes on the immediately preceding February 1st and August 1st. No principal repayments are due until the maturity date of the Notes.
The Notes are secured by (i) a first priority lien on substantially all of the Company’s assets, including capital stock of the guarantors (which are certain of the Company’s subsidiaries), and (ii) a second-priority lien, prior to the termination of the ABL Facility, on substantially all of the inventory and accounts receivable and related assets of the ABL Credit Parties, in each case, subject to certain permitted liens. The Notes also contain customary covenants, including limitations on the Company’s ability to incur debt, and events of default as defined by the agreement. The Company may, at its option, redeem the Notes prior to their maturity based on the terms included in the agreement.
During the year ended December 31, 2014, the Company repurchased $35.0 million aggregate principal amount of Notes for approximately $35.0 million, plus accrued and unpaid interest. The Company recognized a Loss on Extinguishment of Debt of approximately $0.7 million in connection with these repurchases, which was primarily due to the write-off of unamortized deferred financing costs.
ABL Facility
In February 2011, the Company’s wholly owned subsidiary, Cambium Learning, Inc. (together with its wholly owned subsidiaries, the “ABL Credit Parties”), entered into a credit facility (the “ABL Facility”) pursuant to a Loan and Security Agreement (the “ABL Loan Agreement”), by and among the ABL Credit Parties, Harris N.A., individually and as Agent (the “Agent”) for any ABL Lender (as hereinafter defined) which is or becomes a party to said ABL Loan Agreement, certain other lenders party thereto (together with Harris N.A. in its capacity as a lender, the “ABL Lenders”), Barclays Bank PLC, individually and as Collateral Agent, and BMO Capital Markets and Barclays Capital, as Joint Lead Arrangers and Joint Book Runners. The ABL Facility consisted of a four-year $40.0 million revolving credit facility, which included a $5.0 million subfacility for swing line loans and a $5.0 million subfacility for letters of credit.
The ABL Facility was, subject to certain exceptions, secured by a first-priority lien on the ABL Credit Parties’ inventory and accounts receivable and related assets and a second-priority lien (junior to the lien securing the ABL Credit Parties’ obligations with respect to the Notes) on substantially all of the ABL Credit Parties’ other assets.
The ABL Credit Parties were required to pay, quarterly in arrears, an unused lien fee equal to the product of (x) either 0.375% or 0.50% (depending upon the ABL Credit Parties’ fixed charge coverage ratio at the time) and (y) the average daily unused amount of the revolver. The ABL Facility contained a financial covenant that generally required the ABL Credit Parties to maintain, on a consolidated basis, either (i) excess availability of at least the greater of $8.0 million and 15% of the revolver commitment or (ii) a fixed charge coverage ratio of 1.1 to 1.0.
During the quarter ended March 31, 2014, the Company’s excess availability and fixed charge coverage ratios fell below the required thresholds, which put the Company in a Trigger Period, as defined under the ABL Loan Agreement. On March 26, 2014, the Company had no borrowings outstanding under the agreement and terminated the ABL Facility. A Loss on Extinguishment of Debt of approximately $0.2 million was recognized in connection with the termination related to the write-off of unamortized deferred financing costs. Note 15 — Profit-Sharing, Pension, and Other Postretirement Benefit Plans Defined Contribution Plans
The Company’s 401(k) plan provides matching contributions of 50% of participant contributions up to 6%. Additionally, the Company may make discretionary contributions based upon exceeding Company performance targets of up to 2% of eligible earnings for all employees regardless of participation. The 401(k) matching contribution expense was $1.0 million and $1.1 million for the years ended December 31, 2014 and 2013, respectively. No discretionary contributions were made in the years ended December 31, 2014 and 2013.

59
As a result of the acquisition of VLCY, the Company also has contractual obligations under a frozen replacement benefit plan (“RBP”) for a small number of terminated and retired executives. Because the RBP is frozen, no participant can make or is entitled to additional contributions. Instead, the Company has accrued a liability totaling $0.4 million and $0.5 million at December 31, 2014 and 2013, respectively, to reflect its estimated future obligation under the RBP. The current portion of the RBP liability, which was $0.1 million and $0.1 million at December 31, 2014 and 2013, respectively, is included in Other in Note 10 Accrued Expenses. The long-term portion of the RBP liability, which was $0.3 million and $0.4 million at December 31, 2014 and 2013, respectively, is included in Long-Term Deferred Compensation in Note 11 – Other Liabilities.
Defined Benefit Plan
As a result of the acquisition of VLCY, the Company also has a frozen defined benefit pension plan covering certain terminated and retired domestic employees. The benefits are primarily based on years of service and/or compensation during the years immediately preceding retirement. The Company uses a measurement date of December 31st for its pension plan.
GAAP requires reporting of the funded status of defined benefit postretirement plans as an asset or liability in the statement of financial position, recognizing changes in the funded status due to gains or losses, prior service costs, and net transition assets or obligations in other comprehensive income in the year the changes occur, adjusting other comprehensive income when the gains or losses, prior service costs, and net transition assets or obligations are recognized as components of net periodic benefit cost through amortization, and measuring the funded status of a plan as of the date of the statement of financial position, with limited exceptions.
The net costs of the Company’s defined benefit pension plan for the years ended December 31, 2014 and 2013 are as follows:
Year Ended December 31, (in thousands) 2014 2013
Interest cost .............................................................. $ 461 $ 419 Recognized net actuarial loss (gain) ......................... 1,930 (384 )
Net pension and other postretirement benefit cost ......... $ 2,391 $ 35
Obligation and Funded Status
The funded status of the Company’s U.S. defined benefit pension plan as of December 31, 2014 and 2013 is as follows:
December 31, (in thousands) 2014 2013 Change in Benefit Obligation: Benefit obligation, beginning of period ......................... $ 11,413 $ 12,571
Service cost .............................................................. — — Interest cost .............................................................. 461 419 Actuarial loss (gain) ................................................. 1,930 (384 )Benefits paid............................................................. (1,191) (1,193 )
Benefit obligation, end of period ................................... $ 12,613 $ 11,413 Change in Plan Assets: Fair value, beginning of period ...................................... $ — $ —
Company contributions ............................................ 1,191 1,193 Benefits paid............................................................. (1,191) (1,193 )
Fair value, end of period ................................................ $ — $ — Unfunded status ............................................................. $ (12,613) $ (11,413 )Accrued benefit cost ...................................................... $ (12,613) $ (11,413 ) Amounts recognized in the Consolidated Balance Sheets .......................................................................... Current accrued benefit liability .................................... $ (1,173) $ (1,172 )Non-current accrued benefit liability ............................. (11,440) (10,241 )Net amount recognized .................................................. $ (12,613) $ (11,413 )
The Company had a net actuarial loss (gain) of $1.9 million and $(0.4) million for its U.S. pension plan in the years ended December 31, 2014 and 2013, respectively. These amounts are included in Accumulated Other Comprehensive Loss in the Consolidated Balance Sheets. Of this amount, the Company recognized $0.1 million and $0.1 million as a component of net periodic pension cost during the years ended December 31, 2014 and 2013, respectively, and expects to recognize approximately $0.2 million in 2015.

60
Plan Assumptions
Year Ended December 31, 2014 2013 Discount rate .................................................................. 3.50% 4.25%
The discount rate is determined by analyzing the average returns of high-quality fixed income investments defined as AA-rated or better. The Company also utilizes an interest rate yield curve for instruments with maturities corresponding to the benefit obligations.
Additional Information
For the Company’s U.S. defined benefit pension plan, the projected benefit obligation and accumulated benefit obligation at December 31, 2014 and 2013 were as follows:
December 31, (in thousands) 2014 2013 Projected benefit obligation ......................... $ 12,613 $ 11,413 Accumulated benefit obligation ................... 12,613 11,413
Future Contributions
Total contributions expected to be paid under the Company’s frozen U.S. retirement plans or to the beneficiaries thereof during fiscal 2015 are $1.2 million, consisting of $1.2 million to its U.S. defined benefit plan and $22 thousand to the RBP.
Gross benefit payment obligations under the Company’s continuing plans for the next ten years are anticipated to be as follows:
U.S. Retirement Plans (in thousands) (Pension Plan and RBP) 2015 ......................................................................... $ 1,195 2016 ......................................................................... 1,155 2017 ......................................................................... 1,112 2018 ......................................................................... 1,069 2019 ......................................................................... 1,026 2020 - 2024 ............................................................. 4,446
Note 16 — Stockholders’ Equity (Deficit) Common Stock Shares Authorized, Issued, and Outstanding
The Company is authorized to issue 150,000,000 shares of common stock, par value $0.001 per share. At December 31, 2014, there were 52,005,824 shares of common stock issued, 45,473,635 shares of common stock outstanding, and an additional 4,854,305 shares of common stock reserved for issuance pursuant to the Cambium Learning Group, Inc. 2009 Equity Incentive Plan.
Shares of the Company’s common stock are not convertible into or exchangeable for shares of any other class of capital stock. There are no redemption or sinking fund provisions applicable to the common shares.
Treasury Stock
During 2012, the Company’s board of directors authorized a $5 million share repurchase program (the “Program”) through July 5, 2013.
On June 28, 2012, the Company adopted a Rule 10b5-1 plan (the “Plan”) with Robert W. Baird & Company, Inc. under which the Company could repurchase its shares at times when the Company might otherwise be precluded from doing so under insider trading laws. This Plan was established pursuant to, and as part of, the Program. The timing and extent of the repurchases under the Rule 10b5-1 plan were subject to Securities and Exchange Commission regulations as well as certain price, market volume and timing constraints specified in the Plan. The Company began repurchasing shares under the terms of the Plan on July 5, 2012. On March 19, 2013, the Company’s board of directors authorized the termination of the Plan.

61
Although the Plan was cancelled, the Program was extended for an additional one year period, through July 5, 2014, and the remaining authorization was reset to $5 million. The Program terminated on July 5, 2014 and was not renewed or replaced. The table below summarizes share repurchases under both the Plan and the Program occurring from inception to termination.
Shares repurchased
under the Plan
Other shares repurchased
under the Program
Total shares repurchased
under the Program
Cost of sharesrepurchased
under the Program (in thousands)
Year Ended December 31, 2012 ....................... 601,974 1,864,622 2,466,596 $ 2,597Year Ended December 31, 2013 ....................... 193,858 1,861,969 2,055,827 $ 4,619Year Ended December 31, 2014 ....................... — 167,961 167,961 $ 301
Program share repurchases ..................................... 795,832 3,894,552 4,690,384 $ 7,517
In November 2014, the board of directors authorized the repurchase of 193,416 shares of common stock at $1.70 per share for a total repurchase cost of approximately $0.3 million.
Upon repurchase, treasury shares are no longer registered shares of the Company. The repurchased shares are recorded in Treasury Stock at Cost in the Consolidated Balance Sheets with an offset to Common Stock and Capital Surplus.
Voting Rights
Each holder of shares of the Company’s common stock is entitled to one vote for each share held of record on the applicable record date on all matters submitted to a vote of stockholders, including the election of directors.
Dividend Rights
Holders of the Company’s common stock are entitled to receive dividends when, as and if declared by the board of directors out of funds legally available for payment, subject to the rights of holders of the Company’s preferred stock, if any. The Company has not historically paid dividends and does not anticipate doing so in the short term.
Rights Upon Liquidation
In the event of a voluntary or involuntary liquidation, dissolution or winding up, the holders of the Company’s common stock will be entitled to share equally in any of the assets available for distribution after payment in full of all debts and after the holders of all series of the Company’s outstanding preferred stock, if any, have received their liquidation preferences in full.
Preemptive Rights
In general, holders of the Company’s common stock have no preemptive rights to purchase, subscribe for or otherwise acquire any unissued or treasury shares or its other securities. However, under the terms of the stockholders agreement, entered into in connection with the mergers (the “Stockholders Agreement”) except with respect to specified exempt issuances, for so long as VSS-Cambium Holdings III, LLC and funds managed or controlled by Veronis Suhler Stevenson, (individually and collectively “VSS”) beneficially own in the aggregate at least 25% of the outstanding shares of the Company’s common stock, VSS has preemptive rights to purchase the Company’s common stock (or other securities that may be approved by the audit committee of the board of directors), in connection with any proposed securities offering by the Company. These preemptive rights generally give VSS the opportunity to purchase an amount of common stock (or such other securities as may be approved by the audit committee) in the new issuance sufficient to enable VSS to maintain their same collective percentage ownership following the new issuance.
Preferred Stock
Shares Authorized and Outstanding
The Company is authorized to issue 15,000,000 shares of preferred stock, par value $0.001 per share. At December 31, 2014, there are no shares of preferred stock issued or outstanding.
Blank Check Preferred Stock
Under the certificate of incorporation, without further stockholder action, the board of directors is authorized to provide for the issuance of shares of preferred stock in one or more series, to establish from time to time the number of shares to be included in each such series, and to fix the designation, powers, preferences and rights of the shares of each such series and any qualifications, limitations or restrictions on such shares. The board of directors may authorize the issuance of preferred stock with voting or conversion rights that could adversely affect the voting power or other rights of the holders of the Company’s common stock.

62
Note 17 — Stock-Based Compensation and Expense Cambium Learning Group, Inc. 2009 Equity Incentive Plan
In 2009, the Company adopted the Cambium Learning Group, Inc. 2009 Equity Incentive Plan (“Incentive Plan”). Under the Incentive Plan, 5,000,000 shares of common stock were reserved for issuance of awards which may be granted in the form of incentive stock options, non-statutory stock options, stock appreciation rights, restricted stock, restricted stock units, conversion stock options, conversion stock appreciation rights, and other stock or cash awards. The Incentive Plan is administered by the board of directors which has the authority to establish the terms and conditions of awards granted under the Incentive Plan.
Stock Option Activity
Stock option awards generally vest in equal monthly installments on the last day of each month of the four year period beginning on the first day of the month of grant. The term of each option is typically ten years from the date of grant. All outstanding options were granted at exercise prices equal to the fair market value of the Company’s common stock at the date of grant.
The following table summarizes stock option transactions under the Incentive Plan for the year ended December 31, 2014.
Year Ended December 31, 2014
Options
Weighted Average
Exercise Price
Average Remaining Contractual
Term (in years)
Aggregate Intrinsic Value
(in thousands)Outstanding at December 31, 2013 ........................ 2,366,700 $ 1.43
Granted ............................................................. 619,000 $ 2.12 Exercised ........................................................... (40,416) $ 1.30 Cancelled/Forfeited ........................................... (342,909) $ 2.24
Outstanding at December 31, 2014 ........................ 2,602,375 $ 1.49 6.5 $ 718Exercisable at December 31, 2014 ......................... 1,125,725 $ 1.41 6.1 $ 357Vested and Expected to Vest at December 31, 2014 ..................................................................... 2,527,462 $ 1.49 6.5 $ 703
The weighted average grant date fair value of options granted during the years ended December 31, 2014 and 2013 was $1.27 and $0.67, respectively. The aggregate intrinsic value of stock options exercised in the years ended December 31, 2014 and 2013 was $25 thousand and zero, respectively. During the years ended December 31, 2014 and 2013, 648,765 and 856,271 options vested, respectively. The total fair value of the options that vested was $0.5 million and $0.7 million, respectively.
At December 31, 2014, total future compensation costs related to unvested stock options to be recognized in the consolidated statements of operations was $1.2 million, with a weighted average period over which this cost is expected to be recognized of 2.6 years.
2013 Exchange Offer
During the quarter ended September 30, 2013, the Company filed a Tender Offer Statement on Schedule TO with the SEC related to an offer by the Company to certain then current employees who were selected by the Compensation Committee of the Board of Directors of the Company (the “Compensation Committee” and such employees who were selected by the committee, “Eligible Optionholders”) to receive the opportunity to exchange all of their outstanding options to purchase shares of the Company’s common stock, par value $0.001 per share, previously granted under the Incentive Plan for the grant of new options to purchase shares of the Company’s common stock (the “New Options”). The New Options were granted pursuant to the Incentive Plan. The number of shares of the Company’s common stock subject to the New Options was calculated pursuant to an exchange ratio determined by the Compensation Committee for each Eligible Optionholder. On July 30, 2013, options to purchase 1,757,500 shares of the Company’s common stock were exchanged and New Options to purchase 1,902,500 shares of the Company’s common stock were issued. The New Options had grant date compensation costs, net of forecasted forfeitures, of $1.2 million, which was comprised of incremental compensation cost of the New Options of $0.9 million and unamortized compensation cost of the surrendered options of $0.3 million, each as describe below. A total of 40 Eligible Optionholders participated in the exchange offer.
The exercise price per share for each New Option was equal to $1.30. Each of the New Options vests in equal monthly installments on the last day of each month of the four year period commencing on January 1, 2013. Each New Option expires on the expiration date applicable to the option for which it was exchanged.

63
Under Accounting Standards Codification 718, Compensation Stock Compensation, the exchange of options in this transaction were treated as a modification of the existing stock options for accounting purposes. Accordingly, beginning in the quarter ended September 30, 2013, the Company began recognizing the unamortized compensation cost of the surrendered options, as well as the incremental compensation cost of the New Options granted in the exchange offer, ratably over the vesting period of the New Option grants. The incremental compensation cost was measured as the excess of the fair value of each New Option grant granted to employees in exchange for surrendered options over the fair value of the surrendered options in exchange for the New Option grants, each measured as of the date New Options were granted.
Stock Option Valuation Assumptions
The Company utilizes the Black-Scholes option-pricing model to determine the fair value of stock option awards on the date of grant. The following assumptions were used in the Black-Scholes option-pricing model to estimate the fair value of the awards granted during the years ended December 31, 2014 and 2013:
Year Ended December 31, 2014 2013 Expected stock volatility ............................. 64.0% 63.1% – 63.9 % Risk-free interest rate .................................. 1.91% – 2.05% 1.01% – 1.88 % Expected years until exercise ...................... 6.25 4.20 – 6.25 Dividend yield............................................. 0.00% 0.00 %
Due to a lack of exercise history or other means to reasonably estimate future exercise behavior, the Company used the simplified method to estimate the expected years until exercise on new awards as described in applicable accounting guidance for stock-based compensation.
Restricted Stock
The following table summarizes restricted stock transactions under the Incentive Plan for the year ended December 31, 2014.
Year Ended December 31, 2014
Restricted
Stock
Weighted Average
Grant Date Fair Value
Unvested at December 31, 2013 .................................... 2,250 $ 3.00Granted ..................................................................... 2,000 $ 1.96Vested ....................................................................... (1,500) $ 3.41Cancelled/Forfeited .................................................. — $ —
Unvested at December 31, 2014 .................................... 2,750 $ 2.02
The restrictions on the common stock awards granted in the year ended December 31, 2014 lapse equally over a four year period on the anniversary of the grant date or upon a change in control of the Company. The awards were valued based on the Company’s closing stock price on the date of grant.
At December 31, 2014, total future compensation costs related to unvested restricted stock to be recognized in the consolidated statements of operations was $4 thousand, with a weighted average period over which this cost is expected to be recognized of 2.7 years.
Stock-Based Compensation and Expense
Stock-based compensation and expense for the years ended December 31, 2014 and 2013 was allocated as follows:
Year Ended December 31, (in thousands) 2014 2013 Cost of revenues ............................................... $ 34 $ 65 Research and development expense ................. 103 132 Sales and marketing expense ........................... 128 124 General and administrative expense ................ 246 569
Stock-based compensation and expense ..... $ 511 $ 890
The total income tax expense recognized for book purposes in the Consolidated Statements of Operations and Comprehensive Loss related to stock-based compensation was $23 thousand and zero, respectively for the years ended December 31, 2014 and 2013. The total tax benefit realized was zero for all years presented.

64
Warrant
In connection with the completion of the merger with VLCY on December 8, 2009, the Company issued to VSS-Cambium Holdings III, LLC a warrant to purchase shares of the Company’s common stock (the “Holdings Warrant”). As of December 31, 2013, the Holdings Warrant was exercisable for 755,077 shares of the Company’s common stock at an exercise price of $0.01 per share. On November 7, 2014, VSS-Cambium Holdings, III LLC exercised the warrant on a cashless basis and was issued 750,195 shares of the Company’s common stock, with the Company retaining 4,882 shares as settlement of the exercise price.
The number of shares of the Company’s common stock issuable under the Holdings Warrant was based upon the calculation of three separate amounts; the Cambium Specified Asset Recoupment Amount, the Additional Share Amount and the Formula Amount. The 755,077 shares associated with the warrant, represented 299,847 shares originating from the Cambium Specified Asset Recoupment Amount and 455,230 shares originating from the Formula Amount, which are described more fully below.
The Cambium Specified Asset Recoupment Amount was based upon the net amount of recoveries that the Company received on and after June 1, 2009, including periods after the effective time of the mergers, with respect to the embezzlement matter that was discovered in April 2008. The Company has received net recoveries of approximately $4.3 million with respect to this matter. The Cambium Specified Asset Recoupment Amount equals 0.45 multiplied by the quotient of the aggregate net recoveries divided by $6.50. Therefore 299,847 shares were available under the Holdings Warrant related to the Cambium Specified Asset Recoupment Amount. In accordance with applicable accounting guidance for distinguishing liabilities from equity, this award was initially recorded as a liability in the Other Liabilities line on the Consolidated Balance Sheets and measured at fair value. The initial recording of the award attributable to embezzlement recoveries was recorded to Embezzlement-Related Expense in the Consolidated Statements of Operations and Comprehensive Loss and subsequent changes in fair value were recorded to General and Administrative Expense. Because no other significant contingencies remained related to the Cambium Specified Asset Recoupment Amount, it was reclassified from Other Liabilities to Capital Surplus in the Consolidated Balance Sheets during the year ended December 31, 2013.
The Additional Share Amount was calculated over a period commencing at the effective time of the mergers with VLCY and Cambium and ending two years thereafter. The Additional Share Amount was equal to the number of shares of VLCY common stock, if any, that were surrendered upon consummation of the VLCY merger in excess of the sum of the 29,874,145 shares that were known to be outstanding plus the number of shares of VLCY common stock that were issued upon the exercise of options known to be outstanding. Following completion of the merger with VLCY, 29,999 shares of VLCY common stock in excess of 29,874,145 shares were surrendered and, pursuant to the merger agreement, the number of shares of the Company’s common stock issuable to VSS-Cambium Holdings III, LLC was adjusted to increase the number of shares it received. At the effective time of the merger with VLCY all outstanding stock options were terminated. Thus, no Holdings Warrant was issued with respect to any shares relating to the Additional Share Amount.
The Formula Amount added shares to the Holdings Warrant only if, prior to completion of the mergers with Cambium and VLCY, equity cure payments were made under Cambium’s existing credit agreements, debt was retired under those agreements or payments were made to obtain default-related waivers under those agreements. The only applicable event was an equity cure payment of $3.0 million made in August 2009. The Formula Amount equals the equity cure payment of $3.0 million divided by $6.50, or 455,230 shares. Thus, 455,230 shares of the Company’s common stock were available under the Holdings Warrant with respect to the Formula Amount. In accordance with applicable accounting guidance for distinguishing liabilities from equity, this award was recorded to equity with the offset to the capital contribution made to affect the debt cure.
Securities Authorized for Issuance
Securities authorized for issuance under equity compensation plans at December 31, 2014 are as follows:
(in thousands, except per share amounts)
Plan Category
Number of securities to be issued upon exercise of
outstanding options
Weighted-average exercise price of
outstanding options
Number of securities remaining available for future issuance
under equity incentive plans (a)
Equity compensation plans approved by security holders ................................................ 2,602 $ 1.49 2,252Equity compensation plans not approved by security holders ................................................ — $ — —
Total .............................................................. 2,602 $ 1.49 2,252
(a) Excludes securities reflected in the first column, “Number of securities to be issued upon exercise of outstanding options and rights,” and issued restricted stock.

65
Note 18 — Commitments and Contingencies Legal Proceedings
The Company is involved in various legal proceedings incidental to its business. Management believes that the outcome of these proceedings will not have a material adverse effect upon the Company’s consolidated operations or financial condition and the Company has recognized appropriate liabilities as necessary based on facts and circumstances known to management. The Company expenses legal costs related to legal contingencies as incurred.
Contingent Value Rights and Michigan Tax Matter
The Company had a potential contingent liability related to state income taxes and related interest that had been assessed against a former subsidiary. On August 27, 2010, the former subsidiary received a decision and order of determination from the Michigan taxing authority. According to the determination, the former subsidiary was liable to the State of Michigan for unpaid taxes and interest of approximately $10.4 million. In order to expedite resolution of this matter and access the Michigan Court of Claims, the Company paid this liability to the state of Michigan on behalf of the former subsidiary on September 7, 2010 and filed an action in the Michigan Court of Claims to pursue a refund of the assessment. On November 16, 2011, the Michigan Court of Claims ruled in the Company’s favor. The Michigan state taxing authority then appealed the decision of the Court of Claims to the Michigan Court of Appeals. On January 16, 2013, the Michigan Court of Appeals affirmed the verdict of the Court of Claims. As the Michigan state taxing authority declined to appeal the case to the Michigan Supreme Court, the matter was closed and the Company received $11.7 million related to this claim in the quarter ended June 30, 2013.
This liability was identified as an agreed contingency for purposes of the CVRs issued as part of a 2009 merger. In accordance with the terms of the merger agreement, dated June 20, 2009, fifty percent (50%) of any amount paid or due and payable with respect to each agreed contingency would offset payments due under the CVRs from an amount held in escrow for such payments by Wells Fargo Bank, N.A., as escrow agent. Upon payment of the approximate $10.4 million related to the determination, the Company requested a disbursement from the escrow account in an amount equal to fifty percent (50%) of the payment, or approximately $5.2 million. This cash disbursement was received by the Company during the quarter ended September 30, 2010. On September 20, 2010, the Company amended the merger agreement and the escrow agreement to extend the term of the escrow agreement until the later of the full distribution of the escrow funds or the final resolution of the agreed contingency. The final resolution of the tax litigation resulted in a total refund from the taxing authority to the Company of $11.7 million in the quarter ended June 30, 2013, of which $5.8 million was paid to the holders of the CVRs. The total payment to the holders of the CVRs during the quarter ended June 30, 2013 also included $1.9 million related to a potential tax indemnity obligation.
The Michigan Court of Appeals also ruled in the Company’s favor on two other tax matters that resulted in a refund of $0.6 million in the quarter ended June 30, 2013. These tax refunds were retained by the Company and were not subject to payment to the holders of the CVRs.
Purchase Commitments
From time to time, the Company may enter into firm purchase commitments for printed materials included in inventory which the Company expects to use in the ordinary course of business. These commitments are typically for terms less than one year and require the Company to buy minimum quantities of materials with specific delivery dates at a fixed price over the term. These open purchase commitments totaled $0.2 million as of December 31, 2014.
Letters of Credit
The Company has letters of credit outstanding at December 31, 2014 in the amount of $2.0 million to support the build-to-suit lease, credit collections, and workers’ compensation activity. The Company maintains certificates of deposit of $2.7 million to serve as collateral for these letters of credit. The Company also maintains a $0.9 million money market fund investment as collateral for a travel card program. The certificates of deposit and money market fund investment are included in Collateral Investments in Note 9 — Other Assets.

66
Note 19 — Related Party Transactions Agreements with VSS
Jeffrey Stevenson and David Bainbridge, each of whom serves on the Company’s board of directors, are affiliates of VSS. Funds managed by VSS own a majority of the equity interests of VSS-Cambium Holdings III, LLC, which holds approximately 71% of the Company’s outstanding common stock. As such, VSS-Cambium Holdings III, LLC has the ability to determine the outcome of matters submitted to the Company’s stockholders for approval, including the election and removal of directors and any merger, consolidation or sale of all or substantially all of the Company’s assets, and will likely have the ability to control the Company’s management, affairs and operations.
In 2009, the Company entered into a consulting fee agreement, as amended, with VSS Fund Management LLC (the “Consulting Agreement”) entitling VSS to the following fees: (i) a fee equal to 1% of the gross proceeds of any debt or equity financing by the Company, and (ii) a fee equal to 1% of the enterprise value of any entities acquired or disposed of by the Company. These obligations will remain in effect until the earlier of the date on which (i) VSS no longer has any employees serving on the Company’s board of directors, (ii) funds managed by VSS cease to beneficially own at least 10% of the Company’s outstanding common stock and, (iii) unless the Company’s audit committee renews the Consulting Agreement, January 1, 2017. During the quarter ended March 31, 2014, the Company accrued $40 thousand under the Consulting Agreement as a result of the Headsprout acquisition.
The Company and VSS agreed to amend the Consulting Agreement, effective March 19, 2013, and have entered into Amendment No. 1 to the Consulting Agreement (the "Amendment") such that, in addition to the fees currently payable to VSS thereunder, on January 1st of each calendar year, with the first payment payable to VSS as of January 1, 2013, VSS will be entitled to an annual payment of $70,000 for monitoring services for the then-current calendar year, provided that if an employee of VSS serves as Chairman of the Company’s Board of Directors (the "Board"), such fee is subject to a dollar-for-dollar reduction in the amount of the annual retainer received by such VSS employee (as contemplated by the Company’s then current board compensation program).
The Amendment also allows VSS to designate from time to time one or more of its affiliates to receive any of the fees payable under the Consulting Agreement.
The Amendment provides that these obligations will remain in effect until the earlier of the date on which VSS no longer has any employees serving on the Board, the date on which funds managed by VSS cease to beneficially own at least 10% of the Company’s outstanding common stock and, unless the Company’s audit committee renews the Consulting Agreement, January 1, 2017.
VSS also currently receives an annual retainer of $65,000 each for the services of Mr. Stevenson and Mr. Bainbridge on the board of directors. In total, VSS received $0.2 million in cash during the years ended December 31, 2014 and 2013 related to the services of these directors, plus reimbursement of out-of-pocket expenses.
Stockholders Agreement
The Company entered into the Stockholders Agreement on December 8, 2009, at the effective time of the mergers, with VSS-Cambium Holdings III, LLC and Vowel Representative, LLC, the stockholder representative for the former VLCY stockholders.
Preemptive Rights
Except with respect to specified exempt issuances that are described below, so long as VSS-Cambium Holdings III, LLC and funds managed or controlled by VSS beneficially own in the aggregate at least 25% of the outstanding shares of the Company’s common stock, they will have preemptive rights to purchase the Company’s common stock (or such other securities as may be approved by the audit committee) in connection with any proposed issuance of securities after December 8, 2009. These preemptive rights generally give the holders of those rights the opportunity to purchase an amount of the Company’s securities in the new issuance that would enable the holders of those rights to maintain their same collective percentage ownership following the new issuance. Certain specified issuances of securities by the Company constitute “exempt issuances” and will not be subject to these preemptive rights.
Walsh Employment Agreement
On April 30, 2013, the Company entered into an employment agreement with Joe Walsh, Chairman of the Company’s board of directors. For his services as Chairman and as a consultant to the Company, Mr. Walsh is to receive total annual compensation of $300,000.

67
Note 20 — Segment Reporting Geographic Information and Concentrations of Credit Risk
The Company’s geographic area of operation is predominantly the United States. Export or foreign sales to locations outside the United States was approximately 8% and 10% of total sales for the years ended December 31, 2014 and 2013, respectively, with approximately 5% of total sales in Canada in each year. No single customer accounted for more than 10% of consolidated net revenues for any years presented. One single customer accounted for approximately 15% of the accounts receivable balance at December 31, 2014. A different single customer accounted for approximately 14% of the accounts receivable balance at December 31, 2013. Although the loss of a single customer or a few customers would not have a material adverse effect on the Company’s business, schedules of school adoptions, available funding for school districts, and market acceptance of the Company’s products can materially affect year-to-year revenue performance.
Segment Results of Operation
The Company operates in four reportable segments with separate management teams and infrastructures that offer various products and services: Learning A-Z, Voyager Sopris Learning, ExploreLearning, and Kurzweil Education. Segment results of operations presented in the tables below also include Other, which consists of unallocated shared services, such as accounting, legal, human resources and corporate related items. The Company and its chief operating decision maker evaluate reportable segment performance excluding depreciation and amortization, long-lived asset impairment, interest income and expense, other income and expense, and income tax expense. As a result, these captions are also included in Other.
The Company and its chief operating decision maker use net revenues, operating expenses, income (loss) from operations and capital expenditures as measures of the reportable segment’s operating performance. The Company does not track assets by segment and the chief operating decision maker does not use assets as a measure of the reportable segments’ operating performance, therefore this information is not reported. The significant accounting policies of the reportable segments are the same as those for the Company. There were no intersegment revenues or transfers.
In the quarter ended June 30, 2014, the Company completed the sale of the IntelliTools product line for $0.8 million. Net revenues associated with the IntelliTools product line were $0.3 million during 2014 through the date of sale and $1.0 million for the year ended December 31, 2013. Prior to the sale of the IntelliTools product line, the Company referred to the Kurzweil Education segment as Kurzweil/IntelliTools.
The reportable segments’ results of operations for the years ended December 31, 2014 and 2013 are presented in the tables below.
Year Ended December 31, 2014
(in thousands) Learning
A-Z
Voyager Sopris
Learning ExploreLearning Kurzweil Education Other Consolidated
Product revenues .................................... $ 44,385 $ 61,394 $ 18,138 $ 7,995 $ — $ 131,912 Service revenues ..................................... — 9,835 — — — 9,835
Total net revenues ..................................... 44,385 71,229 18,138 7,995 — 141,747 Cost of product revenues ........................ 1,586 25,831 2,867 1,800 — 32,084 Cost of service revenues ......................... — 5,790 — — — 5,790 Amortization expense ............................. — — — — 18,270 18,270
Total cost of revenues ............................... 1,586 31,621 2,867 1,800 18,270 56,144 Other operating expenses .......................... 19,060 24,992 10,213 4,428 14,655 73,348 Depreciation and amortization expense .... — — — — 4,209 4,209 Total costs and expenses ........................... 20,646 56,613 13,080 6,228 37,134 133,701 Income (loss) before interest, other income (expense) and income taxes ....... 23,739 14,616 5,058 1,767 (37,134) 8,046 Net interest expense .................................. — — — — (17,659) (17,659)Loss on extinguishment of debt ................ — — — — (922) (922)Other income, net ...................................... — — — — 1,180 1,180 Income tax expense ................................... — — — — (600) (600)Segment net income (loss) ........................ $ 23,739 $ 14,616 $ 5,058 $ 1,767 $ (55,135) $ (9,955)Expenditures for property, equipment, software and pre-publication costs ......... $ 5,626 $ 7,414 $ 1,602 $ 530 $ 2,703 $ 17,875

68
Year Ended December 31, 2013
(in thousands) Learning
A-Z
Voyager Sopris
Learning ExploreLearning Kurzweil Education Other Consolidated
Product revenues .................................... $ 33,483 $ 78,115 $ 16,279 $ 10,418 $ — $ 138,295 Service revenues ..................................... — 12,225 — — — 12,225
Total net revenues ..................................... 33,483 90,340 16,279 10,418 — 150,520 Cost of product revenues ........................ 908 32,803 2,249 2,290 — 38,250 Cost of service revenues ......................... — 8,438 — — — 8,438 Amortization expense ............................. — — — — 17,519 17,519
Total cost of revenues ............................... 908 41,241 2,249 2,290 17,519 64,207 Other operating expenses .......................... 13,607 31,115 9,152 4,486 16,746 75,106 Depreciation and amortization expense .... — — — — 4,895 4,895 Impairment of long-lived assets ................ — 1,038 — — 1,189 2,227 Embezzlement related expense ................. — — — — 118 118 Total costs and expenses ........................... 14,515 73,394 11,401 6,776 40,467 146,553 Income (loss) before interest, other income (expense) and income taxes ....... 18,968 16,946 4,878 3,642 (40,467) 3,967 Net interest expense .................................. — — — — (18,819) (18,819)Other income, net ...................................... — — — — 764 764 Income tax expense ................................... — — — — (165) (165)Segment net income (loss) ........................ $ 18,968 $ 16,946 $ 4,878 $ 3,642 $ (58,687) $ (14,253)Expenditures for property, equipment, software and pre-publication costs ......... $ 4,401 $ 7,110 $ 1,462 $ 418 $ 2,724 $ 16,115
The capital expenditures disclosed for each segment represent capitalized product development costs, which include pre-publication and capitalized software development costs. The capital expenditures disclosed for Other represent general capital expenditures, which include expenditures for items such as furniture and fixtures, computer equipment and leasehold improvements.

69
Note 21 — Interim Financial Information (Unaudited)
The following table presents the Company’s quarterly results of operations for the years ended December 31, 2014 and 2013.
Three Months Ended (in thousands, except per share data) March 31, June 30, September 30, December 31, Fiscal Year Fiscal 2014 Net revenues ............................................. $ 31,080 $ 36,243 $ 41,144 $ 33,280 $ 141,747 Cost of revenues ....................................... 9,011 9,930 11,045 7,888 37,874 Other operating expenses ......................... 23,849 23,016 25,210 23,752 95,827 Earnings (loss) before income taxes ......... (6,516) (1,265) 1,047 (2,621) (9,355)Income tax (expense) benefit ................... (71) (23) (52) (454) (600)Net income (loss) ..................................... (6,587) (1,288) 995 (3,075) (9,955) Basic income (loss) per share ................... $ (0.14) $ (0.03) $ 0.02 $ (0.07) $ (0.22)Diluted income (loss) per share ................ $ (0.14) $ (0.03) $ 0.02 $ (0.07) $ (0.22) Fiscal 2013 Net revenues ............................................. $ 31,429 $ 42,786 $ 42,957 $ 33,348 $ 150,520 Cost of revenues ....................................... 11,403 12,647 12,950 9,688 46,688 Other operating expenses ......................... 24,679 25,138 25,194 24,854 99,865 Earnings (loss) before income taxes ......... (9,010) 533 255 (5,866) (14,088)Income tax (expense) benefit ................... (68) (102) (127) 132 (165)Net income (loss) ..................................... (9,078) 431 128 (5,734) (14,253) Basic income (loss) per share ................... $ (0.19) $ 0.01 $ — $ (0.13) $ (0.30)Diluted income (loss) per share ................ $ (0.19) $ 0.01 $ — $ (0.13) $ (0.30)
The net loss for the quarter ended December 31, 2013 includes an impairment of long-lived assets charge of $2.2 million. Note 22 — Subsidiary Guarantor Financial Statements
The following tables present condensed consolidated financial information at December 31, 2014 and 2013 and for the twelve month periods ended December 31, 2014 and 2013 for: (a) the Company without its consolidated subsidiaries (the “Parent Company”); (b) on a combined basis, the guarantors of the Notes, which include Cambium Learning, Inc., Voyager Sopris Learning, Inc., LAZEL, Inc., and Kurzweil Education, Inc. (formerly Kurzweil/IntelliTools, Inc.) (collectively the “Subsidiary Guarantors”); and (c) Voyager Learning Company (the “Non-Guarantor Subsidiary”). Separate financial statements of the Subsidiary Guarantors are not presented because the guarantors are unconditionally, jointly, and severally liable under the guarantees, and the Company believes such separate statements or disclosures would not be useful to investors.
Condensed Consolidating Statement of Operations Year Ended December 31, 2014
(in thousands)
Parent Company Subsidiary Guarantors
Non-Guarantor Subsidiary Eliminations Consolidated
Net revenues ....................................................... $ — $ 141,747 $ — $ — $ 141,747 Total costs and expenses .................................... 1,348 131,485 868 — 133,701 Income (loss) before interest, other income and income taxes .................................................... (1,348) 10,262 (868 ) — 8,046 Net interest expense ........................................... (17,383) (270) (6 ) — (17,659)Loss on extinguishment of debt ......................... (745) (177) — — (922)Other income, net ............................................... — 1,180 — — 1,180 Income tax expense ............................................ — (600) — — (600)Net income (loss) ............................................... $ (19,476) $ 10,395 $ (874 ) $ — $ (9,955)

70
Condensed Consolidating Statement of Operations Year Ended December 31, 2013
(in thousands)
Parent Company Subsidiary Guarantors
Non-Guarantor Subsidiary Eliminations Consolidated
Net revenues ....................................................... $ — $ 150,520 $ — $ — $ 150,520 Total costs and expenses .................................... 1,444 144,484 625 — 146,553 Income (loss) before interest, other income and income taxes .................................................... (1,444) 6,036 (625 ) — 3,967 Net interest expense ........................................... (18,604) (209) (6 ) — (18,819)Other income, net ............................................... — 764 — — 764 Income tax expense ............................................ — (165) — — (165)Net income (loss) ............................................... $ (20,048) $ 6,426 $ (631 ) $ — $ (14,253)
Condensed Consolidating Balance Sheet
December 31, 2014 (in thousands)
Parent Company Subsidiary Guarantors
Non-Guarantor Subsidiary Eliminations Consolidated
Investment in subsidiaries .................................. $ 252,333 $ — $ — $ (252,333) $ — Other assets ........................................................ 209,890 272,042 17,686 (328,052) 171,566 Total assets ......................................................... $ 462,223 $ 272,042 $ 17,686 $ (580,385) $ 171,566 Total liabilities ................................................... $ 270,949 $ 281,217 $ 22,507 $ (328,052) $ 246,621 Total stockholders' equity (deficit) ..................... 191,274 (9,175) (4,821 ) (252,333) (75,055)Total liabilities and stockholders' equity (deficit) ............................................................ $ 462,223 $ 272,042 $ 17,686 $ (580,385) $ 171,566
Condensed Consolidating Balance Sheet
December 31, 2013 (in thousands)
Parent Company Subsidiary Guarantors
Non-Guarantor Subsidiary Eliminations Consolidated
Investment in subsidiaries .................................. $ 252,333 $ — $ — $ (252,333) $ — Other assets ........................................................ 211,805 259,776 19,022 (274,393) 216,210 Total assets ......................................................... $ 464,138 $ 259,776 $ 19,022 $ (526,726) $ 216,210 Total liabilities ................................................... $ 253,322 $ 279,346 $ 21,125 $ (274,393) $ 279,400 Total stockholders' equity (deficit) ..................... 210,816 (19,570) (2,103 ) (252,333) (63,190)Total liabilities and stockholders' equity (deficit) ............................................................ $ 464,138 $ 259,776 $ 19,022 $ (526,726) $ 216,210

71
Condensed Consolidating Statement of Cash Flows Year Ended December 31, 2014
(in thousands)
Parent Company Subsidiary Guarantors
Non-Guarantor Subsidiary Eliminations Consolidated
Net cash provided by operating activities .......... $ 35,585 $ (11,942) $ — $ — $ 23,643 Net cash used in investing activities .................. — (20,669) — — (20,669)Net cash used in financing activities .................. (35,585) (995) — — (36,580) Change in cash and cash equivalents ................. — (33,606) — — (33,606)Cash and cash equivalents, beginning of period .............................................................. 12,029 55,964 — — 67,993 Cash and cash equivalents, end of period .......... $ 12,029 $ 22,358 $ — $ — $ 34,387
Condensed Consolidating Statement of Cash Flows
Year Ended December 31, 2013 (in thousands)
Parent Company Subsidiary Guarantors
Non-Guarantor Subsidiary Eliminations Consolidated
Net cash provided by operating activities .......... $ 19,033 $ 26,753 $ — $ — $ 45,786 Net cash used in investing activities .................. (7,673) (16,115) — — (23,788)Net cash used in financing activities .................. (4,619) (1,290) — — (5,909) Change in cash and cash equivalents ................. 6,741 9,348 — — 16,089 Cash and cash equivalents, beginning of period .............................................................. 5,288 46,616 — — 51,904 Cash and cash equivalents, end of period .......... $ 12,029 $ 55,964 $ — $ — $ 67,993 Item 9. Changes in and Disagreements with Accountants on Accounting and Financial Disclosure.
None. Item 9A. Controls and Procedures. (a) Evaluation of Disclosure Controls and Procedures
Management of the Company, with the participation of the Chief Executive Officer and Chief Financial Officer, conducted an evaluation of the effectiveness of the Company’s disclosure controls and procedures (as such term is defined in Rule 13a-15(e) and Rule 15d-15(e) of the Securities Exchange Act of 1934) pursuant to Rule 13a-15 of the Exchange Act. The Company’s disclosure controls and procedures are designed to ensure that information required to be disclosed by the Company in the reports it files or submits under the Exchange Act is recorded, processed, summarized and reported on a timely basis and that such information is communicated to management, including the Chief Executive Officer, Chief Financial Officer and its Board of Directors to allow timely decisions regarding required disclosure.
Based upon that evaluation, the Chief Executive Officer and Chief Financial Officer concluded that the Company’s disclosure controls and procedures were effective as of December 31, 2014.
(b) Management’s Report on Internal Control Over Financial Reporting Management of the Company is responsible for establishing and maintaining adequate internal control over financial reporting
as defined in Rule 13a-15(f) under the Exchange Act.

72
Because of its inherent limitations, internal control over financial reporting may not prevent or detect misstatements. Also, projections of any evaluation of effectiveness to future periods are subject to the risk that controls may become inadequate because of changes in conditions, or that the degree of compliance with the policies or procedures may deteriorate.
It should be noted that the Company’s management, including the Chief Executive Officer and Chief Financial Officer, do not expect that the Company’s internal controls will necessarily prevent all errors or fraud. A control system, no matter how well conceived or operated, can provide only reasonable, not absolute, assurance that the objectives of the control system are met. Further, the design of a control system must reflect the fact that there are resource constraints, and the benefits of controls must be considered relative to their costs.
A material weakness is a deficiency, or a combination of deficiencies, in internal control over financial reporting, such that there is a reasonable possibility that a material misstatement of the Company’s annual or interim financial statements will not be prevented or detected on a timely basis.
Management conducted an assessment of the effectiveness of the Company’s internal control over financial reporting as of December 31, 2014 based on the framework published by the Committee of Sponsoring Organizations of the Treadway Commission, Internal Control — Integrated Framework (2013). Through management’s assessment, management did not identify any material weaknesses in the Company’s internal control over financial reporting as of December 31, 2014.
As a result of the assessment discussed above, management of the Company has concluded that the Company’s internal control over financial reporting was effective as of December 31, 2014.
(c) Changes in Internal Control Over Financial Reporting There were no changes in the Company’s internal control over financial reporting that occurred during the last fiscal quarter that
have materially affected, or are reasonably likely to materially affect, the Company’s internal control over financial reporting. Item 9B Other Information.
None.

73
PART III Item 10. Directors, Executive Officers and Corporate Governance.
Information required by this item is incorporated herein by reference from the Company’s definitive proxy statement for the Company’s 2015 Annual Meeting of Stockholders expected to be held May 27, 2015 to be filed with the SEC pursuant to Regulation 14A under the Exchange Act within 120 days after the year covered by this Annual Report on Form 10-K (the “Proxy Statement”). Certain information regarding the Company’s executive officers is set forth in Part I — Item 1 — Business.
Item 11. Executive Compensation. The information required to be furnished pursuant to this item will be set forth in the Proxy Statement and is incorporated herein
by reference.
Item 12. Security Ownership of Certain Beneficial Owners and Management and Related Shareholder Matters. The information required to be furnished pursuant to this item will be set forth in the Proxy Statement and is incorporated herein
by reference.
Item 13. Certain Relationships and Related Transactions, and Director Independence. The information required to be furnished pursuant to this item will be set forth in the Proxy Statement and is incorporated herein
by reference.
Item 14. Principal Accounting Fees and Services. The information required to be furnished pursuant to this item will be set forth in the Proxy Statement and is incorporated herein
by reference.

74
PART IV Item 15. Exhibits and Financial Statement Schedules. (a) 1. Financial statements:
The following Consolidated Financial Statements of Cambium Learning Group, Inc. are included in Part II, Item 8, Financial Statements and Supplementary Data:
Reports of Independent Registered Public Accounting Firm Consolidated Statements of Operations and Comprehensive Loss for the years ended December 31, 2014 and 2013 Consolidated Balance Sheets at December 31, 2014 and 2013 Consolidated Statements of Cash Flows for the years ended December 31, 2014 and 2013 Consolidated Statements of Stockholders’ Equity (Deficit) for the years ended December 31, 2014 and 2013
2. Financial statement schedules: All financial statement schedules have been omitted because they are not required, not applicable, or the required information is
otherwise included.
3. Exhibits and Financial Statement Schedules: The following exhibits are filed as part of this Annual Report. The exhibit numbers preceded by an asterisk (*) indicate exhibits
previously filed and are hereby incorporated herein by reference. Exhibit numbers preceded by a plus sign (+) indicate a management contract or compensatory plan or arrangement. Exhibit Number
Description
*2.1 Agreement and Plan of Mergers, dated as of June 20, 2009, among Cambium Learning Group, Inc., Voyager Learning Company, VSS-Cambium Holdings II Corp., Consonant Acquisition Corp., Vowel Acquisition Corp. and Vowel Representative, LLC. (incorporated by reference to Annex A to Amendment No. 3 to the Registration Statement on Form S-4 of Cambium Learning Group, Inc. filed with the SEC on November 10, 2009 (File No. 333-161075)).
*2.2 Amendment No. 1, dated September 20, 2010, to Agreement and Plan of Mergers, by and among Cambium Learning Group, Inc., Voyager Learning Company, Vowel Acquisition Corp., VSS-Cambium Holdings II Corp., Consonant Acquisition Corp. and Vowel Representative, LLC (incorporated by reference to Exhibit 10.1 to Cambium Learning Group, Inc.’s Current Report on Form 8-K dated September 20, 2010 (File No. 001-34575)).
*3.1 Second Amended and Restated Certificate of Incorporation of Cambium Learning Group, Inc. (formerly known as Cambium-Voyager Holdings, Inc.) (incorporated by reference to Annex C to Amendment No. 3 to the Registration Statement on Form S-4 of Cambium Learning Group, Inc. filed with the SEC on November 10, 2009 (File No. 333-161075)).
*3.2 Amended and Restated Bylaws of Cambium Learning Group, Inc. (incorporated by reference to Annex D to Amendment No. 3 to the Registration Statement on Form S-4 of Cambium Learning Group, Inc. filed with the SEC on November 10, 2009 (File No. 333-161075)).
3.3 Third Amended and Restated Certificate of Incorporation of Cambium Learning Group, Inc. (formerly known as Cambium Holdings, Inc.).
*4.1 Specimen share certificate of Cambium Learning Group, Inc. (incorporated by reference to Exhibit 4.1 to Amendment No. 1 to the Registration Statement on Form S-4 of Cambium Learning Group, Inc. filed with the SEC on October 9, 2009 (File No. 333-161075)).
*4.2 Form of Cambium Learning Group, Inc. Warrant. (incorporated by reference to Exhibit 4.2 to the Registration Statement on Form S-4 of Cambium Learning Group, Inc. filed with the SEC on August 6, 2009 (File No. 333-161075)).
*4.3 Indenture, dated as of February 17, 2011, by and among Cambium Learning Group, Inc., the Guarantors named therein and Wells Fargo Bank, National Association, as Trustee (incorporated by reference to Exhibit 4.1 to Cambium Learning Group, Inc.’s Current Report on Form 8-K dated February 17, 2011 (File No. 001-34575)).

75
Exhibit Number
Description
*4.4 Form of 9.75% Senior Secured Note due 2017 (included in Exhibit 4.1 to Cambium Learning Group, Inc.’s Current Report on Form 8-K dated February 17, 2011 (File No. 001-34575), which is incorporated by reference herein).
*10.1 Form of Contingent Rights Agreement by and among Cambium Learning Group, Inc. (formerly known as Cambium-Voyager Holdings, Inc.), Vowel Representative, LLC and Wells Fargo Bank, National Association (incorporated by reference to Annex J to Amendment No. 3 to the Registration Statement on Form S-4 of Cambium Learning Group, Inc. filed with the SEC on November 10, 2009 (File No. 333-161075)).
*10.2 Form of Escrow Agreement by and among Cambium-Voyager Holdings, Inc., Vowel Representative, LLC, Voyager Learning Company, Richard Surratt and Wells Fargo Bank, National Association (incorporated by reference to Annex K to Amendment No. 3 to the Registration Statement on Form S-4 of Cambium Learning Group, Inc. filed with the SEC on November 10, 2009 (File No. 333-161075)).
*10.3 Form of Stockholders Agreement by and among Cambium-Voyager Holdings, Inc., VSS-Cambium Holdings III, LLC and Vowel Representative, LLC (incorporated by reference to Annex L to Amendment No. 3 to the Registration Statement on Form S-4 of Cambium Learning Group, Inc. filed with the SEC on November 10, 2009 (File No. 333-161075)).
*+10.4 Cambium Learning Group, Inc. 2009 Equity Incentive Plan (incorporated by reference to Exhibit 10.7 to the Registration Statement on Form S-4 of Cambium Learning Group, Inc. filed with the SEC on August 6, 2009 (File No. 333-161075)).
*+10.5 Employment Agreement, dated April 12, 2007, by and between Cambium Learning, Inc. and David Cappellucci (incorporated by reference to Exhibit 10.23 to the Registration Statement on Form S-4 of Cambium Learning Group, Inc. filed with the SEC on August 6, 2009 (File No. 333-161075)).
*+10.6 Amendment, dated June 26, 2009, by and among David Cappellucci, Cambium Learning, Inc. and Cambium Voyager Holdings, Inc. to Employment Agreement, dated April 12, 2007 (incorporated by reference to Exhibit 10.24 to the Registration Statement on Form S-4 of Cambium Learning Group, Inc. filed with the SEC on August 6, 2009 (File No. 333-161075)).
*+10.7 Employment agreement dated April 9, 2009, between Voyager Learning Company and Ron Klausner (incorporated by reference to Exhibit 10.26 to the Registration Statement on Form S-4 of Cambium Learning Group, Inc. filed with the SEC on August 6, 2009 (File No. 333-161075)).
*+10.8 Employment agreement dated June 19, 2009, between Voyager Expanded Learning and Brad Almond (incorporated by reference to Exhibit 10.27 to the Registration Statement on Form S-4 of Cambium Learning Group, Inc. filed with the SEC on August 6, 2009 (File No. 333-161075)).
*+10.9 Retention Agreement, dated July 13, 2006, by and between Voyager Learning Company (f/k/a ProQuest Company) and Todd Buchardt (incorporated by reference to Exhibit 10.29 to the Registration Statement on Form S-4 of Cambium Learning Group, Inc. filed with the SEC on August 6, 2009 (File No. 333-161075)).
*+10.10 Employment agreement dated May 8, 2009, between Voyager Learning Company and Todd Buchardt (incorporated by reference to Exhibit 10.30 to the Registration Statement on Form S-4 of Cambium Learning Group, Inc. filed with the SEC on August 6, 2009 (File No. 333-161075)).
*+10.11 Employment agreement dated March 4, 2009, between Voyager Expanded Learning and John Campbell (incorporated byreference to Exhibit 10.31 to the Registration Statement on Form S-4 of Cambium Learning Group, Inc. filed with the SEC on August 6, 2009 (File No. 333-161075)).
*+10.12 Amendment to Employment Agreement dated as of August 7, 2009, by and among Cambium-Voyager Holdings, Inc., Voyager Learning Company and Ronald Klausner (incorporated by reference to Exhibit 10.36 to the Registration Statement on Form S-4 of Cambium Learning Group, Inc. filed with the SEC on August 6, 2009 (File No. 333-161075)).
*+10.13 Form of Indemnification Agreement for Directors and Officers (incorporated by reference to Exhibit 99.1 to Cambium Learning Group, Inc.’s Current Report on Form 8-K dated May 25, 2010 (File No. 001-34575)).
*10.14 Amendment No. 1, dated September 20, 2010, to Escrow Agreement, by and among Wells Fargo Bank, National Association, Cambium Learning Group, Inc., Voyager Learning Company, Vowel Representative, LLC and Richard J. Surratt (incorporated by reference to Exhibit 10.2 to Cambium Learning Group, Inc.’s Current Report on Form 8-K dated September 20, 2010 (File No. 001-34575)).

76
Exhibit Number
Description
*10.15 Office Lease Agreement Between Briargrove Place, L.L.C. and Cambium Learning, Inc., dated July 9, 2010 (incorporated by reference to Exhibit 10.1 to Cambium Learning Group, Inc.’s Current Report on Form 8-K dated July 9, 2010 (File No. 001-34575)).
*10.16 Loan and Security Agreement, dated as of February 17, 2011, by and among Harris N.A. as Lender and as Agent, Barclay’s Bank PLC as Collateral Agent, and Cambium Learning, Inc. as Borrower (incorporated by reference to Exhibit 4.3 to Cambium Learning Group, Inc.’s Annual Report on Form 10-K for the year ended December 31, 2010 filed with the SEC on March 10, 2011 (File No. 001-34575)).
*10.17 Purchase Agreement, dated as of February 14, 2011, for $175,000,000 Cambium Learning Group, Inc. 9.75% Senior Secured Notes due 2017 (incorporated by reference to Exhibit 4.4 to Cambium Learning Group, Inc.’s Annual Report on Form 10-K for the year ended December 31, 2010 filed with the SEC on March 10, 2011 (File No. 001-34575)).
*10.18 Registration Rights Agreement, dated as of February 17, 2011, by and among Cambium Learning Group, Inc., as the Guarantors and Barclays Capital Inc. and BMO Capital Markets Corp., as representatives of the several initial purchasers (incorporated by reference to Exhibit 4.4 to Cambium Learning Group, Inc.’s Annual Report on Form 10-K for the year ended December 31, 2010 filed with the SEC on March 10, 2011 (File No. 001-34575)).
*10.19 Amendment No. 1 to Stockholders Agreement, made as of April 12, 2011, to that certain Stockholders Agreement, dated as of December 8, 2009, by and among Cambium Learning Group, Inc. (f/k/a Cambium Holdings, Inc.), VSS-Cambium Holdings III, LLC, and Vowel Representative, LLC, as Stockholders’ Representative (incorporated by reference to Exhibit 99.1 to Cambium Learning Group, Inc.’s Current Report on Form 8-K dated April 12, 2011 (File No. 001-34575)).
*10.20 Stock Purchase Agreement, dated May 20, 2011, by and among Cambium Learning Group, Inc. and each of the persons and entities listed on Schedule I attached to the agreement (incorporated by reference to Exhibit 10.1 to Cambium Learning Group, Inc.’s Current Report on Form 8-K dated May 17, 2011 (File No. 001-34575)).
*10.21 Asset Purchase Agreement, dated September 21, 2011, between Cambium Education, Inc. and Class.com, Inc. (incorporated by reference to Exhibit 10.1 to Cambium Learning Group, Inc.’s Current Report on Form 8-K dated September 21, 2011 (File No. 001-34575)).
*10.22 Logistics Services Agreement, dated February 22, 2012, between Cambium Learning, Inc. and Ozburn-Hessey Logistics, LLC (incorporated by reference to Exhibit 10.22 to Cambium Learning Group, Inc.’s Annual Report on Form 10-K for the year ended December 31, 2011 filed with the SEC on March 15, 2012 (File No. 001-34575)).
*+10.23 Agreement and General Release, dated December 20, 2011, between Cambium Learning Group, Inc. and David Cappellucci (incorporated by reference to Exhibit 10.1 to Cambium Learning Group, Inc.’s Current Report on Form 8-K dated December 20, 2011 (File No. 001-34575)).
*+10.24 Employment agreement dated November 21, 2011, between Cambium Learning Group, Inc. and Vernon Johnson (incorporated by reference to Exhibit 10.24 to Cambium Learning Group, Inc.’s Annual Report on Form 10-K for the year ended December 31, 2011 filed with the SEC on March 15, 2012 (File No. 001-34575)).
*10.25 Stock Purchase Agreement, dated June 22, 2012, by and among Cambium Learning Group, Inc. and each of the persons and entities listed on Schedule I attached to the agreement (incorporated by reference to Exhibit 10.1 to Cambium Learning Group, Inc.’s Current Report on Form 8-K dated June 22, 2012 (File No. 001-34575)).
*10.26 Stock Purchase Agreement, dated December 11, 2012, by and among Cambium Learning Group, Inc. and each of the persons and entities listed on Schedule I attached to the agreement(incorporated by reference to Exhibit 10.26 to Cambium Learning Group, Inc.’s Annual Report on Form 10-K for the year ended December 31, 2012 filed with the SEC on March 8, 2013 (File No. 001-34575)).
*10.27 Stock Purchase Agreement, dated December 11, 2012, by and among Cambium Learning Group, Inc. and each of the persons and entities listed on Schedule I attached to the agreement(incorporated by reference to Exhibit 10.27 to Cambium Learning Group, Inc.’s Annual Report on Form 10-K for the year ended December 31, 2012 filed with the SEC on March 8, 2013 (File No. 001-34575)).
*10.28 Pre-Programmed Corporate Stock Repurchase Plan, dated June 5, 2012, by and among Cambium Learning Group, Inc. and Robert W. Baird & Co(incorporated by reference to Exhibit 10.28 to Cambium Learning Group, Inc.’s Annual Report on Form 10-K for the year ended December 31, 2012 filed with the SEC on March 8, 2013 (File No. 001-34575)).

77
Exhibit Number
Description
*10.29 Amendment No. 1, dated March 19, 2013, to Consulting Agreement, dated July 24, 2009, between Cambium Learning Group, Inc. and Veronis Suhler Stevenson (incorporated by reference to Exhibit 10.1 to Cambium Learning Group, Inc.’s Periodic Report on Form 10-Q for the three months ended March 31, 2013 filed with the SEC on May 9, 2013 (File No. 001-34575)).
*+10.30 Employment agreement, dated March 19, 2013, between Cambium Learning Group, Inc. and John Campbell (incorporated by reference to Exhibit 10.2 to Cambium Learning Group, Inc.’s Periodic Report on Form 10-Q for the three months ended March 31, 2013 filed with the SEC on May 9, 2013 (File No. 001-34575)).
*+10.31 Employment agreement, dated March 19, 2013, between Cambium Learning Group, Inc. and Barbara Benson (incorporated by reference to Exhibit 10.3 to Cambium Learning Group, Inc.’s Periodic Report on Form 10-Q for the three months ended March 31, 2013 filed with the SEC on May 9, 2013 (File No. 001-34575)).
*+10.32 Employment agreement, dated March 19, 2013, between Cambium Learning Group, Inc. and Paul Fonte (incorporated by reference to Exhibit 10.4 to Cambium Learning Group, Inc.’s Periodic Report on Form 10-Q for the three months ended March 31, 2013 filed with the SEC on May 9, 2013 (File No. 001-34575)).
*+10.33 Employment agreement, dated April 30, 2013, between Cambium Learning Group, Inc. and Joe Walsh (incorporated by reference to Exhibit 10.5 to Cambium Learning Group, Inc.’s Periodic Report on Form 10-Q for the three months ended March 31, 2013 filed with the SEC on May 9, 2013 (File No. 001-34575)).
*10.34 Form of Stock Option Agreement for the Cambium Learning Group, Inc. 2009 Equity Incentive Plan (incorporated by reference to Exhibit 10.1 to Cambium Learning Group, Inc.’s Periodic Report on Form 10-Q for the three and six months ended June 30, 2013 filed with the SEC on August 8, 2013 (File No. 001-34575)).
*10.35 Asset Purchase Agreement Between Mimio, LLC and LAZEL, Inc. dated December 23, 2013 (incorporated by reference to Exhibit 10.1 to Cambium Learning Group, Inc.’s Current Report on Form 8-K dated December 23, 2013 (File No. 001-34575)).
*10.36 Note Repurchase Agreement Between Cambium Learning Group, Inc. and GoldenTree Asset Management dated April 22, 2014. (incorporated by reference to Exhibit 10.1 to Cambium Learning Group, Inc.’s Current Report on Form 8-K filed on April 25, 2014 (File No. 001-34575)).
*10.37 Note Repurchase Agreement, dated May 15, 2014 (incorporated by reference to Exhibit 10.1 to Cambium Learning Group, Inc.’s Current Report on Form 8-K/A filed with the SEC on July 10, 2014 (File No. 001-34575)).
*10.38 Form of Note Repurchase Agreement (incorporated by reference to Exhibit 10.1 to Cambium Learning Group, Inc.’s Periodic Report on Form 10-Q for the three and nine months ended September 30, 2014 filed with the SEC on November 6, 2014 (File No. 001-34575)).
*18 Preferability Letter Regarding Change in Accounting Policy relating to Goodwill (incorporated by reference to Exhibit 18 to Cambium Learning Group, Inc.’s Periodic Report on Form 10-Q for the three and nine months ended September 30, 2012 filed with the SEC on November 9, 2012 (File No. 001-34575)).
21.1 Subsidiaries of Cambium Learning Group, Inc.
23.1 Consent of Whitley Penn LLP.
31.1 Certification of the Principal Executive Officer pursuant to Section 302 of the Sarbanes-Oxley Act of 2002.
31.2 Certification of the Principal Financial Officer pursuant to Section 302 of the Sarbanes-Oxley Act of 2002.
32.1 Certification of Chief Executive Officer pursuant to 18 U.S.C. Section 1350, as adopted pursuant to Section 906 of the Sarbanes-Oxley Act of 2002.
32.2 Certification of Senior Vice President and Chief Financial Officer Pursuant to 18 U.S.C. Section 1350, as adopted pursuant to Section 906 of the Sarbanes-Oxley Act of 2002.
*99.1 Form of E-mail Communication to Eligible Optionholders of Cambium Learning Group, Inc. (incorporated by reference to Exhibit 99.(A)(1)(B) to Cambium Learning Group, Inc.’s Tender Offer Statement on Schedule TO filed with the SEC on June 24, 2013(File No. 001-34575)).
*99.2 Form of Communication to Eligible Optionholders of Cambium Learning Group, Inc. (incorporated by reference to Exhibit 99.(A)(1)(C) to Cambium Learning Group, Inc.’s Tender Offer Statement on Schedule TO filed with the SEC on June 24, 2013(File No. 001-34575)) .

78
Exhibit Number
Description
*99.3 Form of Notice of Withdrawal (incorporated by reference to Exhibit 99.(A)(1)(E) to Cambium Learning Group, Inc.’s Tender Offer Statement on Schedule TO filed with the SEC on June 24, 2013(File No. 001-34575)) .
*99.4 Form of Communication to Eligible Optionholders Participating in the Exchange Offer Confirming Receipt of Election Form (incorporated by reference to Exhibit 99.(A)(1)(F) to Cambium Learning Group, Inc.’s Tender Offer Statement on Schedule TO filed with the SEC on June 24, 2013(File No. 001-34575)) .
*99.5 Form of Communication to Eligible Optionholders Confirming Receipt of Notice of Withdrawal (incorporated by reference to Exhibit 99.(A)(1)(G) to Cambium Learning Group, Inc.’s Tender Offer Statement on Schedule TO filed with the SEC on June 24, 2013(File No. 001-34575)) .
*99.6 Form of Confirmation Letter to Eligible Optionholders Participating in the Exchange Offer (incorporated by reference to Exhibit 99.(A)(1)(H) to Cambium Learning Group, Inc.’s Tender Offer Statement on Schedule TO filed with the SEC on June 24, 2013(File No. 001-34575)) .
*99.7 Form of Communication to Eligible Optionholders Rejecting the Election Form under the Exchange Offer (incorporated by reference to Exhibit 99.(A)(1)(I) to Cambium Learning Group, Inc.’s Tender Offer Statement on Schedule TO filed with the SEC on June 24, 2013(File No. 001-34575)) .
*99.8 Form of Communication to Eligible Optionholders Rejecting the Notice of Withdrawal under the Exchange Offer (incorporated by reference to Exhibit 99.(A)(1)(J) to Cambium Learning Group, Inc.’s Tender Offer Statement on Schedule TO filed with the SEC on June 24, 2013(File No. 001-34575)) .
*99.9 Form of Reminder Communication to Eligible Optionholders about the Exchange Offer (incorporated by reference to Exhibit 99.(A)(1)(K) to Cambium Learning Group, Inc.’s Tender Offer Statement on Schedule TO filed with the SEC on June 24, 2013(File No. 001-34575)) .
*99.10 Form of Stock Option Agreement for the Cambium Learning Group, Inc. 2009 Equity Incentive Plan (incorporated by reference to Exhibit 99.(D)(2) to Cambium Learning Group, Inc.’s Tender Offer Statement on Schedule TO filed with the SEC on June 24, 2013(File No. 001-34575)) .
*99.11 Offer to Exchange Certain Outstanding Stock Options for New Stock Options, as amended July 8, 2013 (incorporated by reference to Exhibit 99.(A)(1)(A) to Amendment No. 1 to Cambium Learning Group, Inc.’s Tender Offer Statement on Schedule TO filed with the SEC on July 8, 2013(File No. 001-34575)) .
*99.12 Form of Election Form, as amended July 8, 2013 (incorporated by reference to Exhibit 99.(A)(1)(D) to Amendment No. 1 to Cambium Learning Group, Inc.’s Tender Offer Statement on Schedule TO filed with the SEC on July 8, 2013(File No. 001-34575)) .
*99.13 Form of E-mail Communication to Employees Eligible to Participate In Exchange Offer (incorporated by reference to Exhibit 99.(A)(1)(L) to Amendment No. 1 to Cambium Learning Group, Inc.’s Tender Offer Statement on Schedule TOfiled with the SEC on July 8, 2013(File No. 001-34575)) .
101.ins XBRL Instance Document.
101.sch XBRL Taxonomy Extension Schema Document.
101.cal XBRL Taxonomy Extension Calculation Linkbase Document.
101.lab XBRL Taxonomy Extension Label Linkbase Document.
101.pre XBRL Taxonomy Extension Presentation Linkbase Document.

79
SIGNATURES Pursuant to the requirements of Section 13 or 15(d) of the Securities Exchange Act of 1934, the registrant has duly caused this
report to be signed on its behalf by the undersigned, therefore duly authorized.
Date: March 17, 2015 Cambium Learning Group, Inc.
By:/s/ Barbara Benson Barbara Benson Chief Financial Officer (Principal Financial Officer)
Pursuant to the requirements of the Securities Exchange Act of 1934, this report has been signed by the following persons on behalf of the registrant and in the capacities and on the dates indicated. Signature Title Date
/s/ John Campbell
Director and Chief Executive Officer (Principal Executive Officer)
March 17, 2015 John Campbell
/s/ Barbara Benson
Chief Financial Officer (Principal Financial Officer)
March 17, 2015 Barbara Benson
/s/ Joe Walsh
Executive Chairman of the Board of Directors
March 17, 2015 Joe Walsh
/s/ Harold O. Levy
Director
March 17, 2015 Harold O. Levy
/s/ Thomas Kalinske
Director
March 17, 2015 Thomas Kalinske
/s/ Walter G. Bumphus
Director
March 17, 2015 Walter G. Bumphus
/s/ Clifford Chiu
Director
March 17, 2015 Clifford Chiu
/s/ David F. Bainbridge
Director
March 17, 2015 David F. Bainbridge
/s/ Jeffrey T. Stevenson
Director
March 17, 2015 Jeffrey T. Stevenson

80
EXHIBIT INDEX Exhibit Number
Description
*2.1 Agreement and Plan of Mergers, dated as of June 20, 2009, among Cambium Learning Group, Inc., Voyager Learning Company, VSS-Cambium Holdings II Corp., Consonant Acquisition Corp., Vowel Acquisition Corp. and Vowel Representative, LLC. (incorporated by reference to Annex A to Amendment No. 3 to the Registration Statement on Form S-4 of Cambium Learning Group, Inc. filed with the SEC on November 10, 2009 (File No. 333-161075)).
*2.2 Amendment No. 1, dated September 20, 2010, to Agreement and Plan of Mergers, by and among Cambium Learning Group, Inc., Voyager Learning Company, Vowel Acquisition Corp., VSS-Cambium Holdings II Corp., Consonant Acquisition Corp. and Vowel Representative, LLC (incorporated by reference to Exhibit 10.1 to Cambium Learning Group, Inc.’s Current Report on Form 8-K dated September 20, 2010 (File No. 001-34575)).
*3.1 Second Amended and Restated Certificate of Incorporation of Cambium Learning Group, Inc. (formerly known as Cambium-Voyager Holdings, Inc.) (incorporated by reference to Annex C to Amendment No. 3 to the Registration Statement on Form S-4 of Cambium Learning Group, Inc. filed with the SEC on November 10, 2009 (File No. 333-161075)).
*3.2 Amended and Restated Bylaws of Cambium Learning Group, Inc. (incorporated by reference to Annex D to Amendment No. 3 to the Registration Statement on Form S-4 of Cambium Learning Group, Inc. filed with the SEC on November 10, 2009 (File No. 333-161075)).
3.3 Third Amended and Restated Certificate of Incorporation of Cambium Learning Group, Inc. (formerly known as Cambium Holdings, Inc.).
*4.1 Specimen share certificate of Cambium Learning Group, Inc. (incorporated by reference to Exhibit 4.1 to Amendment No. 1 to the Registration Statement on Form S-4 of Cambium Learning Group, Inc. filed with the SEC on October 9, 2009 (File No. 333-161075)).
*4.2 Form of Cambium Learning Group, Inc. Warrant. (incorporated by reference to Exhibit 4.2 to the Registration Statement on Form S-4 of Cambium Learning Group, Inc. filed with the SEC on August 6, 2009 (File No. 333-161075)).
*4.3 Indenture, dated as of February 17, 2011, by and among Cambium Learning Group, Inc., the Guarantors named therein and Wells Fargo Bank, National Association, as Trustee (incorporated by reference to Exhibit 4.1 to Cambium Learning Group, Inc.’s Current Report on Form 8-K dated February 17, 2011 (File No. 001-34575)).
*4.4 Form of 9.75% Senior Secured Note due 2017 (included in Exhibit 4.1 to Cambium Learning Group, Inc.’s Current Report on Form 8-K dated February 17, 2011 (File No. 001-34575), which is incorporated by reference herein).
*10.1 Form of Contingent Rights Agreement by and among Cambium Learning Group, Inc. (formerly known as Cambium-Voyager Holdings, Inc.), Vowel Representative, LLC and Wells Fargo Bank, National Association (incorporated by reference to Annex J to Amendment No. 3 to the Registration Statement on Form S-4 of Cambium Learning Group, Inc. filed with the SEC on November 10, 2009 (File No. 333-161075)).
*10.2 Form of Escrow Agreement by and among Cambium-Voyager Holdings, Inc., Vowel Representative, LLC, Voyager Learning Company, Richard Surratt and Wells Fargo Bank, National Association (incorporated by reference to Annex K to Amendment No. 3 to the Registration Statement on Form S-4 of Cambium Learning Group, Inc. filed with the SEC on November 10, 2009 (File No. 333-161075)).
*10.3 Form of Stockholders Agreement by and among Cambium-Voyager Holdings, Inc., VSS-Cambium Holdings III, LLC and Vowel Representative, LLC (incorporated by reference to Annex L to Amendment No. 3 to the Registration Statement on Form S-4 of Cambium Learning Group, Inc. filed with the SEC on November 10, 2009 (File No. 333-161075)).
*+10.4 Cambium Learning Group, Inc. 2009 Equity Incentive Plan (incorporated by reference to Exhibit 10.7 to the Registration Statement on Form S-4 of Cambium Learning Group, Inc. filed with the SEC on August 6, 2009 (File No. 333-161075)).
*+10.5 Employment Agreement, dated April 12, 2007, by and between Cambium Learning, Inc. and David Cappellucci (incorporated by reference to Exhibit 10.23 to the Registration Statement on Form S-4 of Cambium Learning Group, Inc. filed with the SEC on August 6, 2009 (File No. 333-161075)).

81
Exhibit Number
Description
*+10.6 Amendment, dated June 26, 2009, by and among David Cappellucci, Cambium Learning, Inc. and Cambium Voyager Holdings, Inc. to Employment Agreement, dated April 12, 2007 (incorporated by reference to Exhibit 10.24 to the Registration Statement on Form S-4 of Cambium Learning Group, Inc. filed with the SEC on August 6, 2009 (File No. 333-161075)).
*+10.7 Employment agreement dated April 9, 2009, between Voyager Learning Company and Ron Klausner (incorporated by reference to Exhibit 10.26 to the Registration Statement on Form S-4 of Cambium Learning Group, Inc. filed with the SEC on August 6, 2009 (File No. 333-161075)).
*+10.8 Employment agreement dated June 19, 2009, between Voyager Expanded Learning and Brad Almond (incorporated by reference to Exhibit 10.27 to the Registration Statement on Form S-4 of Cambium Learning Group, Inc. filed with the SEC on August 6, 2009 (File No. 333-161075)).
*+10.9 Retention Agreement, dated July 13, 2006, by and between Voyager Learning Company (f/k/a ProQuest Company) and Todd Buchardt (incorporated by reference to Exhibit 10.29 to the Registration Statement on Form S-4 of Cambium Learning Group, Inc. filed with the SEC on August 6, 2009 (File No. 333-161075)).
*+10.10 Employment agreement dated May 8, 2009, between Voyager Learning Company and Todd Buchardt (incorporated by reference to Exhibit 10.30 to the Registration Statement on Form S-4 of Cambium Learning Group, Inc. filed with the SEC on August 6, 2009 (File No. 333-161075)).
*+10.11 Employment agreement dated March 4, 2009, between Voyager Expanded Learning and John Campbell (incorporated byreference to Exhibit 10.31 to the Registration Statement on Form S-4 of Cambium Learning Group, Inc. filed with the SEC on August 6, 2009 (File No. 333-161075)).
*+10.12 Amendment to Employment Agreement dated as of August 7, 2009, by and among Cambium-Voyager Holdings, Inc., Voyager Learning Company and Ronald Klausner (incorporated by reference to Exhibit 10.36 to the Registration Statement on Form S-4 of Cambium Learning Group, Inc. filed with the SEC on August 6, 2009 (File No. 333-161075)).
*+10.13 Form of Indemnification Agreement for Directors and Officers (incorporated by reference to Exhibit 99.1 to Cambium Learning Group, Inc.’s Current Report on Form 8-K dated May 25, 2010 (File No. 001-34575)).
*10.14 Amendment No. 1, dated September 20, 2010, to Escrow Agreement, by and among Wells Fargo Bank, National Association, Cambium Learning Group, Inc., Voyager Learning Company, Vowel Representative, LLC and Richard J. Surratt (incorporated by reference to Exhibit 10.2 to Cambium Learning Group, Inc.’s Current Report on Form 8-K dated September 20, 2010 (File No. 001-34575)).
*10.15 Office Lease Agreement Between Briargrove Place, L.L.C. and Cambium Learning, Inc., dated July 9, 2010 (incorporated by reference to Exhibit 10.1 to Cambium Learning Group, Inc.’s Current Report on Form 8-K dated July 9, 2010 (File No. 001-34575)).
*10.16 Loan and Security Agreement, dated as of February 17, 2011, by and among Harris N.A. as Lender and as Agent, Barclay’s Bank PLC as Collateral Agent, and Cambium Learning, Inc. as Borrower (incorporated by reference to Exhibit 4.3 to Cambium Learning Group, Inc.’s Annual Report on Form 10-K for the year ended December 31, 2010 filed with the SEC on March 10, 2011 (File No. 001-34575)).
*10.17 Purchase Agreement, dated as of February 14, 2011, for $175,000,000 Cambium Learning Group, Inc. 9.75% Senior Secured Notes due 2017 (incorporated by reference to Exhibit 4.4 to Cambium Learning Group, Inc.’s Annual Report on Form 10-K for the year ended December 31, 2010 filed with the SEC on March 10, 2011 (File No. 001-34575)).
*10.18 Registration Rights Agreement, dated as of February 17, 2011, by and among Cambium Learning Group, Inc., as the Guarantors and Barclays Capital Inc. and BMO Capital Markets Corp., as representatives of the several initial purchasers (incorporated by reference to Exhibit 4.4 to Cambium Learning Group, Inc.’s Annual Report on Form 10-K for the year ended December 31, 2010 filed with the SEC on March 10, 2011 (File No. 001-34575)).
*10.19 Amendment No. 1 to Stockholders Agreement, made as of April 12, 2011, to that certain Stockholders Agreement, dated as of December 8, 2009, by and among Cambium Learning Group, Inc. (f/k/a Cambium Holdings, Inc.), VSS-Cambium Holdings III, LLC, and Vowel Representative, LLC, as Stockholders’ Representative (incorporated by reference to Exhibit 99.1 to Cambium Learning Group, Inc.’s Current Report on Form 8-K dated April 12, 2011 (File No. 001-34575)).

82
Exhibit Number
Description
*10.20 Stock Purchase Agreement, dated May 20, 2011, by and among Cambium Learning Group, Inc. and each of the persons and entities listed on Schedule I attached to the agreement (incorporated by reference to Exhibit 10.1 to Cambium Learning Group, Inc.’s Current Report on Form 8-K dated May 17, 2011 (File No. 001-34575)).
*10.21 Asset Purchase Agreement, dated September 21, 2011, between Cambium Education, Inc. and Class.com, Inc. (incorporated by reference to Exhibit 10.1 to Cambium Learning Group, Inc.’s Current Report on Form 8-K dated September 21, 2011 (File No. 001-34575)).
*10.22 Logistics Services Agreement, dated February 22, 2012, between Cambium Learning, Inc. and Ozburn-Hessey Logistics, LLC (incorporated by reference to Exhibit 10.22 to Cambium Learning Group, Inc.’s Annual Report on Form 10-K for the year ended December 31, 2011 filed with the SEC on March 15, 2012 (File No. 001-34575)).
*+10.23 Agreement and General Release, dated December 20, 2011, between Cambium Learning Group, Inc. and David Cappellucci (incorporated by reference to Exhibit 10.1 to Cambium Learning Group, Inc.’s Current Report on Form 8-K dated December 20, 2011 (File No. 001-34575)).
*+10.24 Employment agreement dated November 21, 2011, between Cambium Learning Group, Inc. and Vernon Johnson (incorporated by reference to Exhibit 10.24 to Cambium Learning Group, Inc.’s Annual Report on Form 10-K for the year ended December 31, 2011 filed with the SEC on March 15, 2012 (File No. 001-34575)).
*10.25 Stock Purchase Agreement, dated June 22, 2012, by and among Cambium Learning Group, Inc. and each of the persons and entities listed on Schedule I attached to the agreement (incorporated by reference to Exhibit 10.1 to Cambium Learning Group, Inc.’s Current Report on Form 8-K dated June 22, 2012 (File No. 001-34575)).
*10.26 Stock Purchase Agreement, dated December 11, 2012, by and among Cambium Learning Group, Inc. and each of the persons and entities listed on Schedule I attached to the agreement (incorporated by reference to Exhibit 10.26 to Cambium Learning Group, Inc.’s Annual Report on Form 10-K for the year ended December 31, 2012 filed with the SEC on March 8, 2013 (File No. 001-34575)).
*10.27 Stock Purchase Agreement, dated December 11, 2012, by and among Cambium Learning Group, Inc. and each of the persons and entities listed on Schedule I attached to the agreement (incorporated by reference to Exhibit 10.27 to Cambium Learning Group, Inc.’s Annual Report on Form 10-K for the year ended December 31, 2012 filed with the SEC on March 8, 2013 (File No. 001-34575)).
*10.28 Pre-Programmed Corporate Stock Repurchase Plan, dated June 5, 2012, by and among Cambium Learning Group, Inc. and Robert W. Baird & Co(incorporated by reference to Exhibit 10.28 to Cambium Learning Group, Inc.’s Annual Report on Form 10-K for the year ended December 31, 2012 filed with the SEC on March 8, 2013 (File No. 001-34575)).
*10.29 Amendment No. 1, dated March 19, 2013, to Consulting Agreement, dated July 24, 2009, between Cambium Learning Group, Inc. and Veronis Suhler Stevenson (incorporated by reference to Exhibit 10.1 to Cambium Learning Group, Inc.’s Periodic Report on Form 10-Q for the three months ended March 31, 2013 filed with the SEC on May 9, 2013 (File No. 001-34575)).
*+10.30 Employment agreement, dated March 19, 2013, between Cambium Learning Group, Inc. and John Campbell (incorporated by reference to Exhibit 10.2 to Cambium Learning Group, Inc.’s Periodic Report on Form 10-Q for the three months ended March 31, 2013 filed with the SEC on May 9, 2013 (File No. 001-34575)).
*+10.31 Employment agreement, dated March 19, 2013, between Cambium Learning Group, Inc. and Barbara Benson (incorporated by reference to Exhibit 10.3 to Cambium Learning Group, Inc.’s Periodic Report on Form 10-Q for the three months ended March 31, 2013 filed with the SEC on May 9, 2013 (File No. 001-34575)).
*+10.32 Employment agreement, dated March 19, 2013, between Cambium Learning Group, Inc. and Paul Fonte (incorporated by reference to Exhibit 10.4 to Cambium Learning Group, Inc.’s Periodic Report on Form 10-Q for the three months ended March 31, 2013 filed with the SEC on May 9, 2013 (File No. 001-34575)).
*+10.33 Employment agreement, dated April 30, 2013, between Cambium Learning Group, Inc. and Joe Walsh (incorporated by reference to Exhibit 10.5 to Cambium Learning Group, Inc.’s Periodic Report on Form 10-Q for the three months ended March 31, 2013 filed with the SEC on May 9, 2013 (File No. 001-34575)).
*10.34 Form of Stock Option Agreement for the Cambium Learning Group, Inc. 2009 Equity Incentive Plan (incorporated by reference to Exhibit 10.1 to Cambium Learning Group, Inc.’s Periodic Report on Form 10-Q for the three and six months ended June 30, 2013 filed with the SEC on August 8, 2013 (File No. 001-34575)).

83
Exhibit Number
Description
*10.35 Asset Purchase Agreement Between Mimio, LLC and LAZEL, Inc. dated December 23, 2013 (incorporated by reference to Exhibit 10.1 to Cambium Learning Group, Inc.’s Current Report on Form 8-K dated December 23, 2013 (File No. 001-34575)).
*10.36 Note Repurchase Agreement Between Cambium Learning Group, Inc. and GoldenTree Asset Management dated April 22, 2014 (incorporated by reference to Exhibit 10.1 to Cambium Learning Group, Inc.’s Current Report on Form 8-K filed on April 25, 2014 (File No. 001-34575)).
*10.37 Note Repurchase Agreement, dated May 15, 2014 (incorporated by reference to Exhibit 10.1 to Cambium Learning Group, Inc.’s Current Report on Form 8-K/A filed with the SEC on July 10, 2014 (File No. 001-34575)).
*10.38 Form of Note Repurchase Agreement (incorporated by reference to Exhibit 10.1 to Cambium Learning Group, Inc.’s Periodic Report on Form 10-Q for the three and nine months ended September 30, 2014 filed with the SEC on November 6, 2014 (File No. 001-34575)).
*18 Preferability Letter Regarding Change in Accounting Policy relating to Goodwill (incorporated by reference to Exhibit 18 to Cambium Learning Group, Inc.’s Periodic Report on Form 10-Q for the three and nine months ended September 30, 2012 filed with the SEC on November 9, 2012 (File No. 001-34575)).
21.1 Subsidiaries of Cambium Learning Group, Inc.
23.1 Consent of Whitley Penn LLP.
31.1 Certification of the Principal Executive Officer pursuant to Section 302 of the Sarbanes-Oxley Act of 2002.
31.2 Certification of the Principal Financial Officer pursuant to Section 302 of the Sarbanes-Oxley Act of 2002.
32.1 Certification of Chief Executive Officer pursuant to 18 U.S.C. Section 1350, as adopted pursuant to Section 906 of the Sarbanes-Oxley Act of 2002.
32.2 Certification of Senior Vice President and Chief Financial Officer Pursuant to 18 U.S.C. Section 1350, as adopted pursuant to Section 906 of the Sarbanes-Oxley Act of 2002.
*99.1 Form of E-mail Communication to Eligible Optionholders of Cambium Learning Group, Inc. (incorporated by reference to Exhibit 99.(A)(1)(B) to Cambium Learning Group, Inc.’s Tender Offer Statement on Schedule TO filed with the SEC on June 24, 2013(File No. 001-34575)).
*99.2 Form of Communication to Eligible Optionholders of Cambium Learning Group, Inc. (incorporated by reference to Exhibit 99.(A)(1)(C) to Cambium Learning Group, Inc.’s Tender Offer Statement on Schedule TO filed with the SEC on June 24, 2013(File No. 001-34575)) .
*99.3 Form of Notice of Withdrawal (incorporated by reference to Exhibit 99.(A)(1)(E) to Cambium Learning Group, Inc.’s Tender Offer Statement on Schedule TO filed with the SEC on June 24, 2013(File No. 001-34575)) .
*99.4 Form of Communication to Eligible Optionholders Participating in the Exchange Offer Confirming Receipt of Election Form (incorporated by reference to Exhibit 99.(A)(1)(F) to Cambium Learning Group, Inc.’s Tender Offer Statement on Schedule TO filed with the SEC on June 24, 2013(File No. 001-34575)) .
*99.5 Form of Communication to Eligible Optionholders Confirming Receipt of Notice of Withdrawal (incorporated by reference to Exhibit 99.(A)(1)(G) to Cambium Learning Group, Inc.’s Tender Offer Statement on Schedule TO filed with the SEC on June 24, 2013(File No. 001-34575)) .
*99.6 Form of Confirmation Letter to Eligible Optionholders Participating in the Exchange Offer (incorporated by reference to Exhibit 99.(A)(1)(H) to Cambium Learning Group, Inc.’s Tender Offer Statement on Schedule TO filed with the SEC on June 24, 2013(File No. 001-34575)) .
*99.7 Form of Communication to Eligible Optionholders Rejecting the Election Form under the Exchange Offer (incorporated by reference to Exhibit 99.(A)(1)(I) to Cambium Learning Group, Inc.’s Tender Offer Statement on Schedule TO filed with the SEC on June 24, 2013(File No. 001-34575)) .
*99.8 Form of Communication to Eligible Optionholders Rejecting the Notice of Withdrawal under the Exchange Offer (incorporated by reference to Exhibit 99.(A)(1)(J) to Cambium Learning Group, Inc.’s Tender Offer Statement on Schedule TO filed with the SEC on June 24, 2013(File No. 001-34575)) .

84
Exhibit Number
Description
*99.9 Form of Reminder Communication to Eligible Optionholders about the Exchange Offer (incorporated by reference to Exhibit 99.(A)(1)(K) to Cambium Learning Group, Inc.’s Tender Offer Statement on Schedule TO filed with the SEC on June 24, 2013(File No. 001-34575)) .
*99.10 Form of Stock Option Agreement for the Cambium Learning Group, Inc. 2009 Equity Incentive Plan (incorporated by reference to Exhibit 99.(D)(2) to Cambium Learning Group, Inc.’s Tender Offer Statement on Schedule TO filed with the SEC on June 24, 2013(File No. 001-34575)) .
*99.11 Offer to Exchange Certain Outstanding Stock Options for New Stock Options, as amended July 8, 2013 (incorporated by reference to Exhibit 99.(A)(1)(A) to Amendment No. 1 to Cambium Learning Group, Inc.’s Tender Offer Statement on Schedule TO filed with the SEC on July 8, 2013(File No. 001-34575)) .
*99.12 Form of Election Form, as amended July 8, 2013 (incorporated by reference to Exhibit 99.(A)(1)(D) to Amendment No. 1 to Cambium Learning Group, Inc.’s Tender Offer Statement on Schedule TO filed with the SEC on July 8, 2013(File No. 001-34575)) .
*99.13 Form of E-mail Communication to Employees Eligible to Participate In Exchange Offer (incorporated by reference to Exhibit 99.(A)(1)(L) to Amendment No. 1 to Cambium Learning Group, Inc.’s Tender Offer Statement on Schedule TOfiled with the SEC on July 8, 2013(File No. 001-34575)) .
101.ins XBRL Instance Document
101.def XBRL Taxonomy Extension Definition Linkbase Document.
101.sch XBRL Taxonomy Extension Schema Document.
101.cal XBRL Taxonomy Extension Calculation Linkbase Document.
101.lab XBRL Taxonomy Extension Label Linkbase Document.
101.pre XBRL Taxonomy Extension Presentation Linkbase Document.


CORPORATE HEADQUARTERS
Cambium Learning Group, Inc.17855 Dallas Parkway, Suite 400Dallas, TX 75287Toll Free: 888.399.1995www.cambiumlearning.com
ADDITIONAL OFFICES
ExploreLearning110 Avon, Suite 300Charlottesville, VA 22902Telephone: 434.293.7043Toll Free: 866.882.4141www.explorelearning.com
Kurzweil Education24 Prime Parkway, Suite 303Natick, MA 01760Telephone: 508.647.1340www.kurzweiledu.com
Learning A–Z1840 East River Road, Suite 320Tucson, AZ 85718Telephone: 520.327.3730www.learninga-z.com
Voyager Sopris Learning17855 Dallas Parkway, Suite 400Dallas, TX 75287Telephone: 214.932.9500
4093 Specialty PlaceLongmont, CO 80504Telephone: 303.651.2829Toll Free: 800.547.6747www.voyagersopris.com
STOCKHOLDER INFORMATION
Annual Shareholder MeetingMay 27, 2015, 8:00 a.m. CST 17855 Dallas Parkway, Suite 400Dallas, TX 75287
Transfer Agent & RegistrarWells Fargo Shareowner ServiceP.O. Box 64874St. Paul, MN 55164-0874Toll Free: 800.468.9716www.shareowneronline.com
Stock ListingThe NASDAQ Stock MarketSymbol: ABCD
Independent Registered Accounting FirmWhitley Penn LLPDallas, TX
INVESTOR RELATIONS
Cambium Learning Group, Inc.’s Securities and Exchange Commission filings, earnings announcements, news releases, and other investor information are available in the Investor Relations section of our website, www.cambiumlearning.com. Investors seeking additional information about the company may write to Investor Relations at our corporate headquarters, or send an email to [email protected].

Cambium Learning Group, Inc.
17855 Dallas Parkway, Suite 400 Dallas, TX 75287Toll Free: 888.399.1995www.cambiumlearning.com