cambodia national environmental performance assessment ... · pdf fileacknowledgment the...
TRANSCRIPT
� �
National Performance assessment and subregional strategic environment framework for the greater mekong subregion
cambodia national environmental
Performance assessment (ePa)
rePort
ADB T.A. No. 6069-REG
PREPARED By Department of Environmental Quality Promotion, Ministry of Natural Resources and Environment, Thailand and Project Secretariat UNEP Regional Resource Centerfor Asia and the Pacific
DECEMBER �006

� �
This Environmental Performance Assessment (EPA) Report is the first of its kind to be written for Cambodia. The report is an attempt to present an overall picture of the progress made in reaching the goals of sustainable development and environmental health. It covers five concerns: biodiversity loss, suboptimal utilization of water resources, depletion of fish resources, agricultural land degradation, and climate change. To address or mitigate future environmental problems, it is important for Cambodia to be aware of its progress and environmental performance over the past few decades. With this report, gaps in policy can be filled where the country is currently struggling. Achieving development in tandem with good environmental practice is not easy. This EPA report is an initial step for Cambodia toward better understanding of its progress in achieving national sustainable development goals. The report intends to: (i) provide better understanding of environmental conditions, trends, and impacts to facilitate informed decision-making; (ii) help improve environmental program management and public accountability; (iii) and highlight principal trends and performance assessments under environmental issues of national and global importance. The report and its findings will also facilitate the analysis of development assistance in the environment domain, and enhance local capacity in carrying out performance assessments. The second Strategic Environmental Framework has helped the country carry out the process of assessment, identification, and recommendations for its environmental concerns with guidance provided by the teams from the Asian Development Bank (ADB) and the United Nations Environment Programme (UNEP). The EPA method has been continually evolved with internal capacity building to allow the first assessment to be carried out with multistakeholder contribution. The report is written in four parts. Part I introduces the standpoint of the paper, Part II assesses performance under each of the priority concerns selected. This assessment is based on a Pressure-State-Response model that logically links the sources of environmental pressure factors to the resulting state, and the policy and institutional responses intended to stimulate policy review. Part III discusses crosscutting development issues. Part IV draws overall conclusions and recommendations. An Annex gives statistical data supporting parts II, III and IV. In addition to national significance in Cambodia, the report also carries great connotations and use for future planning and improvement of environment management in Cambodia.
foreword
H.E. Dr. Mok Mareth Minister of Environment

� �
acknowledgment
The completion of the Cambodia National Environmental Performance Assessment (EPA) Report would not have been possible without the valuable inputs and assistance of many individuals. A core team of international and national consultants prepared the initial and final draft of the report under the aegis of the Ministry of Environment (the national implementing agency of the project) led by H.E. Dr. Mok Mareth, Senior Minister and Minister of Environment and Chuon Chanrithy, Director, Department of Natural Resources Assessment and Environmental Data Management. We wish to thank international consultants Ivan Ruzicka, Kumar Mohit, and Mike Comeau and national consultants Mak Sithirit and Touch Vina for their very significant work on the report. Acknowledgement is also given to the many people and institutions who participated in the various consultations and workshops organized during the preparation of the report and provided feedback. This includes an EPA technical review team consisting of representatives from the Ministry of Agriculture, Forestry and Fisheries (Forestry Administration and Department of Fisheries); Ministry of Water Resources and Meteorology; Ministry of Industry, Mines and Energy; and Ministry of Land Management, Urban Planning and Construction. The project was made possible through financial and technical support from the Asian Development Bank (ADB), the Global Environment Facility (GEF), the United Nations Environment Programme (UNEP), Institute for Global Environmental Studies (IGES) of Japan, and the National Institute for Environmental Strategies (NIES) of Japan. A note of thanks is given to Masami Tsuji and Herath Gutanilake, both ADB staffs, who provided valuable insight and support throughout the process of preparing this report. Finally, kudos to the team from UNEP who ably coordinated the management of the entire project on Strategic Environmental Framework for the Greater Mekong Subregion (SEF II): Yuwaree In-na and Tin Aung Moe.
Surendra Shrestha Regional Director and Representatives United Nations Environment Programme for Asia and the Pacific

6 �
table of contentsFoREWoRD 2
AckNoWLEDgMENt 3
ExECUTIVE SUMMARY 8
ACRoNYMS AND CAMBoDIAN TERMS 10
I. INTRODUCTION 12thE AssEssMENt MEthoD UsED: thE P-s-R MoDEL 13
II. MaNageMeNT Of PRIORITy CONCeRNs IN CaMbODIa 181. FoREST RESoURCES 181.1. THE CoNTExT 181.2. THE STATE 191.3. THE PRESSURE 201.4. THE RESPoNSE 211.5. coNcLUsIoNs 232. THREAT To BIoDIVERSITY 262.1. THE CoNTExT 262.2. THE STATE 262.3. THE PRESSURE 282.4. THE RESPoNSE 302.5. coNcLUsIoNs 323. FISH RESoURCES 343.1. THE CoNTExT 343.2. THE STATE 343.3. THE PRESSURE 363.4. THE RESPoNSE 373.5. thE coNcLUsIoNs 394. WAtER REsoURcEs 424.1. DRINkINg WAtER 424.1.1. THE CoNTExT 424.1.2. THE STATE 424.1.3. THE PRESSURE 444.1.4. THE RESPoNSE 454.1.5. coNcLUsIoNs 474.2. WAtER FoR AgRIcULtURE 474.2.1. THE CoNTExT 474.2.2. THE STATE 474.2.3. THE PRESSURE 484.2.4. THE RESPoNSE 504.2.5. coNcLUsIoNs 515. AgRIcULtURAL LAND MANAgEMENt (LAND DEgRADAtIoN) 535.1. THE CoNTExT 535.2. THE STATE 53

6 �
5.3. THE PRESSURE 545.4. THE RESPoNSE 565.5. coNcLUsIoNs 586. cLIMAtE chANgE 606.1. THE CoNTExT 606.2. THE STATE 606.3. THE PRESSURE 606.4. THE RESPoNSE 616.5. coNcLUsIoNs 62
III. CROssCUTTINg IssUes IN aN eNVIRONMeNTaL PeRfORMaNCe assessMeNT 641.1. PoLIcy AND INstItUtIoNAL INtEgRAtIoN 641.2. ENvIRoNMENtAL ExPENDItURE AND FINANcINg 652. IMPLEMENtAtIoN IssUEs 682.1. REgULAtoRy AND EcoNoMIc INstRUMENts 712.2. ENFoRCEMENT 713. ENvIRoNMENt AND cIvIL socIEty 723.1. ENvIRoNMENt, hEALth AND sAFEty 743.2. AccEss to INFoRMAtIoN AND PUbLIc AccoUNtAbILIty 753.3. ENvIRoNMENtAL AWARENEss AND EDUcAtIoN 76
IV. CONCLUsIONs aND ReCOMMeNDaTIONs1. FoRESTRY RESoURCES 772. THREAT To BIoDIVERSITY 773. FISHERIES RESoURCES 784. WAtER REsoURcEs 795. MANAgEMENt oF AgRIcULtURAL LAND 806. cLIMAtE chANgE 81

� 9
executive summary
Sustainable management of the country’s natural resources and healthy environments for its population are important strategic priorities for Cambodia, as they are for the other countries of the Greater Me-kong Subregion. The challenges to Cambodian authorities and other national stakeholders in pursuing these priorities are many not least because of Cambodia’s immature market economy and young regula-tory frameworks. This report, a national environmental performance assessment of EPA, is an attempt to present an overall picture of the progress made in reaching the goals of sustainable development and environmental health. The report addresses six key environmental concerns, viz., forest degradation, biodiversity loss, suboptimal utilization of water resources, depletion of fish resources, agricultural land degradation and climate change (as a global environmental issue).
Cambodia remains a predominantly agricultural country. Agriculture and forestry contribute nearly 40% of the country’s gross domestic product (GDP). The country’s forest cover (under Cambodian definition) declined from 73% in 1965 to approximately 60% in 1997. A gradual reversal is observed from 1997 onward. The RGC cancelled a large number of forest concessions that brought the area under conces-sion management down from 6.5 million ha in 1998 to 3.8 million ha in 2003 and reduced the pressure on the forest. Nonetheless, illegal logging has not been eliminated both in and outside the cancelled concessions, and shifting cultivation and agricultural expansion remain significant pressure factors. As a principal line of defense, the Government further increased the area of protected forest to a compara-tively high 23.5% of the total land area by 2002.
Cambodia’s natural habitats have been partly degraded in the course of last three decades, resulting in additional pressure of the country’s rich biodiversity. Despite this, biodiversity appears to be in better condition in Cambodia than in the other GMS countries. Since 1993, the government has been building up a system of protected areas. By now a relatively high total of 32% of Cambodia’s territory has some form of protection status. It remains to be seen how effective the protection has been in the face of continued and widespread pressures.
Fish accounts for three quarters of the animal protein intake of Cambodia’s 13 million people and inland fisheries are essential for local livelihoods. Fish production has grown in recent years due mainly to greater production by small-scale and rice-field fisheries. The production by Tonle Sap appears not to have changed significantly in volume terms but there is evidence of changes in the composition of the catch towards smaller size fish, raising concerns about sustainability. Destructive fishing practices are widely used throughout Cambodia. The responses have featured support for community-based fisher-ies and reduction of commercial fishing lots in favor of community-based management. The change of policy direction is too recent to say whether it has resulted in a more sustainable management of the fish resource.
As the country grows economically and in population size, the demand for safe drinking water increases also. Access to safe water has improved in both urban and rural areas of Cambodia during the past decade but from an extremely low base. Cambodia has by far the lowest overall percentage of access to safe drinking water among the GMS countries. The growth of rural population has increased also the demand for irrigation water. RGC’s policy for the rural sector rests significantly on further expansion of irrigation and reduced dependence on rain-fed farming. The policy target of increasing the percentage of irrigated lands in the cropland total from about 16% in the mid-1990s to 20% in 2003 may have been achieved. There has been a significant decline in the per capita endowment of agricultural land

� 9
from about 0.65 ha in 1961 to about 0.37 ha in 2003 due to a rapid growth of rural population and constraints placed on area expansion. Efficiency of land use has come to be an important policy consid-eration. Additional and special measures such as clearing land of unexploded ordinance have added to the stock of agricultural land (beside reducing risk to life).
Cambodia has the necessary suite of laws and regulations for environmental management, and MoE holds the responsibility for their implementation. However, improved institutional coordination with other development ministries and better technical and financial resource availability is required to strengthen the institutional framework of environmental management in Cambodia.

10 11
ADB Asian Development Bank APHEDA Australian People for Health Education and Development Abroad CBD Convention on Biological Diversity CBNRM Community Based Natural Resource Management CCC Cooperation Committee for Cambodia CCEAP Climate Change Enabling Activity Project CDRI Cambodia Development Resource Institute CFDo Community Fisheries Development office CIAP Cambodia-IRRI-Australia Project CMDG Cambodia Millennium Development Goal DANIDA Danish International Development Agency DFW Department of Forestry and Wildlife DoF Department of Fisheries EIA Environment Impact Assessment EPA Environmental Performance Assessment FA Forestry Administration FAo Food and Agriculture organization GEF Global Environment Facility GMS Great Mekong Subregion GPCC 98 General Population Census of Cambodia in 1998 Habitat United Nations Conference on Human Settlements IcLARM International center for Living Aquatic Resource Management IGES Institute for Global Environmental Strategies IPCC Intergovernment Panel on Climate Change JMP Joint Management Program LAc Law on Administration of commune councils LUcF land use change and forestry MAFF Ministry of Agriculture, Forestry and Fisheries MIME Ministry of Industry, Mines and Energy MLMUPc Ministry of Land Management, Urban Planning and construction MoE Ministry of Environment MoP Ministry of Planning MoWRAM Ministry of Water Resources and Meteorology MRC Mekong River Commission NAPCBD National Action Plan on Conservation of Biological Diversity NGo Nongovernmental organization NIES National Institute for Environmental Studies NRM Natural Resource Management PIP Public Investment Program PoP Persistent organic Pollutants Prakas regulation PRASAC Program for Agriculture Sector Assistance and Credit RGC Royal Government of Cambodia SEDP Socio-Economic Development Plan SEDRP Socio-Economic Development Requirements and Proposals
acronyms and cambodian terms

10 11
SEF Strategic Environmental Framework Seila foundation UNDP United Nations Development Program UNEP United Nations Environment Programme UNCCD United Nations Convention to Combat Desertification UNFCCC United Framework Convention on Climate Change UNITAR United Nations Institute for Training and Research Wb World bank WRI World Resources Institute

1� 1�

1� 1�
1. The present Environmental Performance Assessment (EPA) Report is the first of its kind to be written for Cambodia. It examines the developments under selected environment concerns over a period of time and the degree of success the national authorities have had in influencing environmental outcomes. The report is one of six prepared in a similar format by each of the countries of the Great Mekong Subregion (GMS). The Asian Development Bank (ADB), the Global Environment Facility (GEF), the United Nations Environment Programme (UNEP), the Institute for Global Environmental Studies (IGES) of Japan and the National Institute for Environmental Strategies (NIES) of Japan have provided financial and technical support for the National Performance Assessment and a Strategic Environmental Framework for the Greater Mekong Subregion (“SEF II”) Project under which the EPA reports were formulated. 2. The report is a first step by Cambodia in the direction of gaining a better understanding of its progress towards achieving the goals of national sustainable development. The preparation of the national environmental performance assessment report is intended to support (i) informed decision making through a better understanding of environmental conditions, trends, and impacts; (ii) effective national environmental program management and improved public accountability for the results, and (iii) reporting of principal environmental trends and assessment of performance under environmental issues of national and global importance. The report and its
findings will also facilitate the analysis of development assistance in the environment domain and enhance local capacity for carrying out performance assessments. 3. The Ministry of Environment (MoE) was the lead agency in preparing this report in consultation with other environment-concerned institutions. The preparation of Cambodia’s EPA report was a team effort under the guidance of:
• H.E. Dr. Mok Mareth, Senior Minister and Minister of Environment, National Focal Point
• Mr. Chuon Chanrithy, Director, Department of Natural Resources Assessment and Environmental Data Management, Ministry of Environment, National Coordinator.
National technical consultants prepared the initial draft of the EPA report:
• Mr. Touch Vina, National Consultant on Database Development
• Mr. Mak Sithirith, National Consultant on Environmental Issues
The EPA technical review team included representatives from:
• Forestry Administration, Ministry of Agriculture, Forestry and Fisheries
• Department of Fisheries, Ministry of Agriculture, Forestry and Fisheries
• Ministry of Water Resources and Meteorology
• Ministry of Industry, Mines and Energy • Ministry of Land Management, Urban
Planning and Construction
cambodia national environmental Performance
assessment (ePa) rePort
1 introduction

1� 1�
4. The environmental priority concerns to be studied under the national EPA process were selected at national workshops, held in Sihanouk Ville and Siem Reap in September 2004 and January 2005, respectively. These workshops brought together decision-makers from various national agencies, local and international development organizations, NGos, and other stakeholders and members of civil society, all with a stake in Cambodia’s sustainable development. 5. the First National Workshop identified five (from a list of thirteen potential) environmental concerns viz., loss of forest resources, threats to biodiversity, management of fishery resources, and the state of water resources and land. These five were considered priority concerns requiring immediate attention. They also provided conditions for a meaningful assessment of performance such as data availability, and the existence of clearly defined policy targets against which performance under the chosen concern could be assessed. Climate change was added to the five concerns to strengthen the assessment’s global dimension. the Workshops concluded that other concerns that were not included at this stage of the EPA, could be evaluated in future EPA reports. 6. This EPA report is divided into four parts:
• Part I is an introduction and overview of the objectives of the report including brief information on the EPA team and other institutions involved in the process.
• Part II assesses performance under each of the priority concerns selected. “Performance” is understood to be an assessment of observed outcomes against the targets set under each concern. This assessment is based on a Pressure-State-Response (P-S-R) model that logically links the sources of environmental problems (the “pressure” factors) to the resulting “state” of the environmental concern, and the policy and institutional “responses” intended to influence the pressure factors, and through them, move the state towards the targets set. (see Figure I.1 below) The most telling of the P, S, and R factors are chosen as environmental indicators. Their
past trends and interplay are analyzed to say how effective the responses have been in improving the ‘state’. The method used is described more fully below.
• Part III discusses the crosscutting development issues, i.e. those elements that affect overall environmental performance of the country without necessarily neatly falling under any one of the selected concerns.
• Part IV draws overall conclusions and recommendations. It is a summary of where the country stands under the chosen concerns and what additional efforts are recommended to improve performance and assessment of performance.
• The Annex provides the statistical information (organized in the form of “fact sheets”) that supports the analysis of Parts II to IV of the report.
The report was reviewed by the subregional expert group and international consultants and edited by Messrs. Mike Comeau, Mohit Kumar and Ivan Ruzicka. The Assessment Method Used: The P-S-R model 7. The approach to assessing performance under any selected environmental concern is anchored in a Pressure-State-Response (P-S-R) model that logically links the sources of environmental problems (the “pressure” factors) with the resulting “state” of the variables of concern, and the policy and institutional “responses” intended to influence the pressure factors, and through them, the state (see figure below). The desired values of the state variables typically (but not always) feature in state authorities’ plans and strategies. The assessment of performance is a matter of judging how successful the responses adopted have been in reaching the target values of state (and/or pressure) variables. 8. The P, S and R indicators’ values are the raw material of the EPA. The statistical background of each indicator is summarized in indicator “facts sheets” and these are attached to the report to give the reader an opportunity to judge the underlying basis of the assessment. The assessment itself is a matter of rating (a) individual indicators and (b) the overall

1� 1�
Simplified Representation of a P-S-R model (hypothetical example of air quality management with four indicators of performance, highlighted in green)
A.“Pressure” factors (indicators):
1. Number of vehicles 2. Vehicle characteristics 3. Type of fuel 4. Estimated emissions of selected pollutants 5. etc. .
B. “State” factors (indicators)
1. Concentrations of carbon monoxide 2. Concentrations of atmospheric lead 3. etc.
C. “Response” factors (indicators)
1. Frequency of vehicle inspections 2. Fuel quality standards 3. Expenditure on traffic management 4. etc.
Unlike a state-of-the-environment reporting that tends to focus on the description of the environmental conditions in a given locality and on the underlying pressure factors, an environmental performance assessment (EPA) probes the effectiveness of the responses by environmental managers. It asks not mainly how well the “environment is doing” but how well those in a position to influence environmental outcomes are performing.
performance—an interplay of all indicators—under the concern being studied. A rating structure has been developed for this purpose. 9. A double-word description is utilized to rate each indicator. The first word describes the magnitude of the indicator relative to some benchmark (such as an international standard, an average for several countries, etc.). The second word describes the observed trend of the indicator value, as depicted by long or short-term historical data. The magnitude and the trend keywords are typically combined (e.g. “relatively poor and deteriorating”). In the case of baseline indicators with only one or few observations, the trend-keyword (and the “and” conjunction) is omitted. The descriptions applied to each class of indicators are contained in the tables below:

16 1�
Rating Criteria Utilized to Assess State Indicators
STATE INDICATORS
In order to qualify the magnitude of the state indicator using the recommended keywords below, the values of the state indicator are compared against known benchmark figures. The national policy target for the indicator is one such possible benchmark. In many cases, a GMS average values or an international standard would be more suitable if the indicator is to tell us something about the relative performance of each GMS country. If no such figures exist, the magnitude keyword is omitted. The “poorness” or “goodness” of the magnitude is dependent on the interpretation of the indicator value. In some cases a high state indicator value is “good” (e.g. % forest cover); at other times a low value is preferred (e.g. # threatened species). The trend of the State indicator is easy to rate as either deteriorating, stabilizing or improving, provided it is based on long-term historical data. In other cases or for benchmark indicators, the indicator value may not show any trend at all, in which case the trend keyword is left blank or specified as “Undetermined Trend”.
Relatively Poor and …. Average and ... Relatively Good and …. Unknown State and ….
As evidenced by an indicator value which is far below (or far above) the same indicator value for other GMS countries or far below (or above) other benchmark figures such as international standards or national targets
As evidenced by an indicator value which is close to the same indicator value for other GMS countries or within the range of other acceptable benchmark figures such as international standards or national targets
As evidenced by an indicator value which is far above (or far below) the same indicator value for other GMS countries or far above (or below) other benchmark figures such as international standards or national targets
This rating is used if the value of the indicator cannot be compared against the value of the same indicator in other countries or regions and there are no other benchmark figures, such as international standards or national targets
Deteriorating Stabilizing Improving Undetermined Trend
As evidenced by a steady long-term deteriorating trend and with no immediate signs of improvement.
As evidenced by a steady long-term deteriorating trend but with short-term signs of leveling or even improvement, or a long-term level trend.
As evidenced by a long-term deteriorating trend but with sure signs of improvement based on more than one observation in the positive trend.
This rating is used if the selected indicator is inconclusive in terms of long or short-term trends or if the indicator is based on a single observation over time.

16 1�
Rating Criteria Utilized to Assess Pressure Indicators
PRESSURE INDICATORS
There will always be some magnitude of pressure and the trend over time can simply be rated as increasing or decreasing. Qualifying the magnitude of the indicator value may at times be difficult, especially if the pressure indicator is unique to one country and no comparative figures are available from other countries. It is also unlikely that international benchmark figures will exist for pressure indicator. Judgment is required to rate the magnitude of unique pressure indicators. The trend of pressure indicators should be easy to rate, provided that long-term historical data exists. If only one or few observations exist, the trend keyword can be left blank.
High and Medium and Low and Non-Comparable and
As evidenced by the value of an indicator which is much higher than the value of the same indicator in other GMS countries or much higher than other benchmark figures, such as international standards or national targets
As evidenced by the value of an indicator with a value more or less equal to that of other GMS countries or other benchmark figures such as international standards or national targets.
As evidenced by the value of an indicator which is much lower than the value of the same indicator in other GMS countries or much lower than other benchmark figures, such as international standards or national targets.
This rating is used if, through lack of comparative numbers or other information, an order of magnitude cannot be assigned to the value of the indicator.
Increasing Steady Decreasing (blank)
As evidenced by a long-term trend of increasing pressure, with very little sign of relief or stabilization.
As evidenced by a long-term steady or near-constant pressure that shows no sign of increase or decrease in the past or future.
As evidenced by a long-term trend of declining pressure, with perhaps fluctuating short-term oscillations.
The keyword is left blank if there is only one observation, or if there is no observed trend over time in the indicator value.

1� 19
Rating Criteria Utilized to Assess Response Indicators
RESPONSE INDICATORS
Since responses tend to be very diverse, there may be few benchmarks to rate the magnitude of response indicators other than the national targets for the indicator selected. Once more, judgment is required to rate the magnitude of unique indicators to say how “big” or “small” the response was.
Low and Average and Significant and Non-Comparable
If the magnitude of the response is significantly below the national target or below the average in other GMS countries or other comparable regions.
If the magnitude of the response is in line with na-tional targets or the average responses of other GMS countries or comparable regions.
If the magnitude of the response exceeds national targets of the average of other GMS countries or comparable regions.
This rating is used (or the keyword left blank) if there are no data or information to compare the magnitude of the response with, or there are no other bench-mark figures.
Sporadic Intermittent Consistent (blank)
If the response has been irregularly applied over time with no set program or budgets to continue the response in the future.
If the response has not been consistently applied but there are programs and budgets to continue the application of the response in future.
If the response has been consistently applied, cali-brated to the pressure, with plans to continue until the pressure has been reduced to a desired level.
The keyword is left blank if there is only one ob-servation, or if there is no observed trend over time in the indicator value.
1� 19
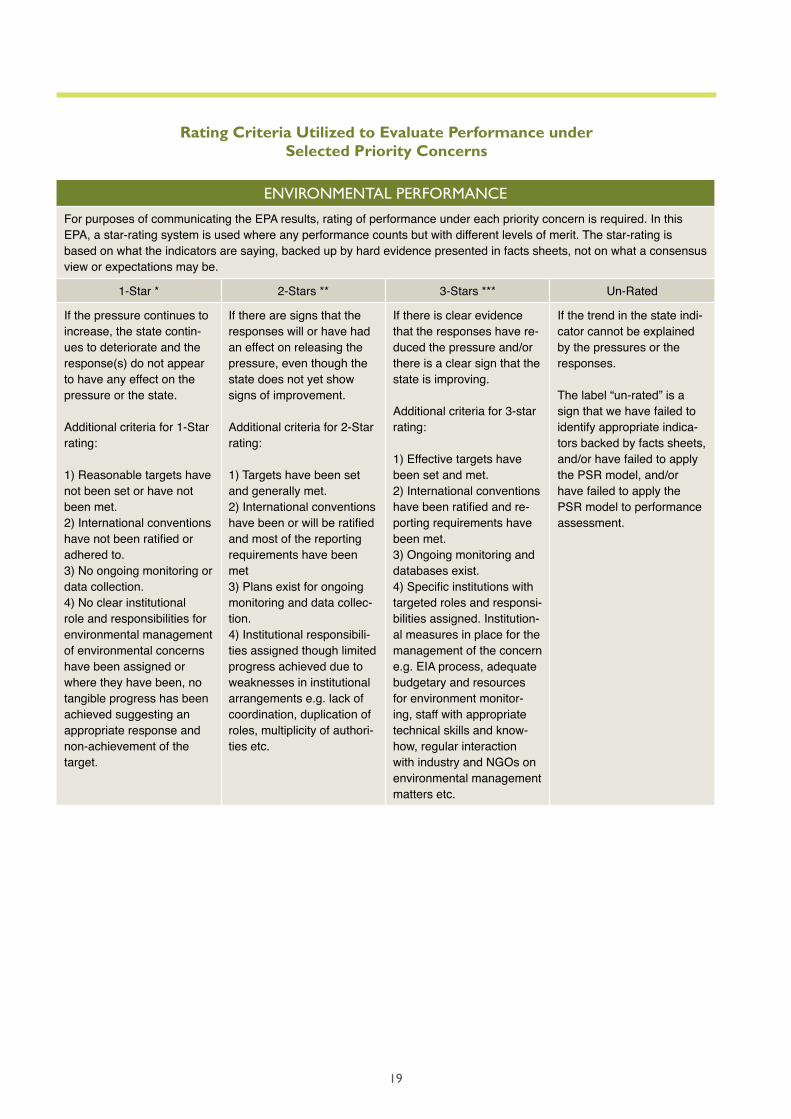
Rating Criteria Utilized to Evaluate Performance under Selected Priority Concerns
ENVIRONMENTAL PERFORMANCE
For purposes of communicating the EPA results, rating of performance under each priority concern is required. In this EPA, a star-rating system is used where any performance counts but with different levels of merit. The star-rating is based on what the indicators are saying, backed up by hard evidence presented in facts sheets, not on what a consensus view or expectations may be.
1-Star * 2-Stars ** 3-Stars *** Un-Rated
If the pressure continues to increase, the state contin-ues to deteriorate and the response(s) do not appear to have any effect on the pressure or the state.
Additional criteria for 1-Star rating:
1) Reasonable targets have not been set or have not been met.2) International conventions have not been ratified or adhered to.3) No ongoing monitoring or data collection.4) No clear institutional role and responsibilities for environmental management of environmental concerns have been assigned or where they have been, no tangible progress has been achieved suggesting an appropriate response and non-achievement of the target.
If there are signs that the responses will or have had an effect on releasing the pressure, even though the state does not yet show signs of improvement.
Additional criteria for 2-Star rating:
1) Targets have been set and generally met.2) International conventions have been or will be ratified and most of the reporting requirements have been met3) Plans exist for ongoing monitoring and data collec-tion.4) Institutional responsibili-ties assigned though limited progress achieved due to weaknesses in institutional arrangements e.g. lack of coordination, duplication of roles, multiplicity of authori-ties etc.
If there is clear evidence that the responses have re-duced the pressure and/or there is a clear sign that the state is improving.
Additional criteria for 3-star rating:
1) Effective targets have been set and met.2) International conventions have been ratified and re-porting requirements have been met.3) Ongoing monitoring and databases exist.4) Specific institutions with targeted roles and responsi-bilities assigned. Institution-al measures in place for the management of the concern e.g. EIA process, adequate budgetary and resources for environment monitor-ing, staff with appropriate technical skills and know-how, regular interaction with industry and NGOs on environmental management matters etc.
If the trend in the state indi-cator cannot be explained by the pressures or the responses.
The label “un-rated” is a sign that we have failed to identify appropriate indica-tors backed by facts sheets, and/or have failed to apply the PSR model, and/or have failed to apply the PSR model to performance assessment.

�0 �1
10. Besides its potential usefulness for Cambodia, the EPA reporting as developed under the SEF II Project offers wider benefits. The method used here can be applied at different levels of analysis, not only the national one (as in the present case). The commonality of approach to indicator selection, data presentation and their analysis facilitates subregional environmental assessments, one of the objectives of GMS environmental program that seeks to respond to transboundary environmental challenges in the Mekong Basin. Additionally at the local level, an EPA can be utilized as a project monitoring and evaluation tool or even a tool for assessing performance of a development initiative at a local (e.g. municipal) level. 11. Finally, the EPA process typically offers assessments of performance under concerns that are simultaneously local and global (such as threat to biodiversity in this report) and it therefore becomes a form of reporting to the bodies set up to help protect the global commons (e.g. most notably gEF). Last but not the least the report can assist the design of future country assistance programs by principal donor agencies active in Cambodia. 12. The EPA team wishes to thank the Royal Government of Cambodia (RGC) and collaborating ministries and departments for making information available for undertaking this EPA.

�0 �1
1. FOREST RESOURCES 1.1.TheContext13. Cambodia is predominantly a low-lying country that occupies the central plains of the lower Mekong basin and is bordered on three sides by dense forested mountainous ranges. Forest in Cambodia tends to be located on the country’s periphery while paddy cultivation is the norm to the lowland areas (see Figure 1.1). 14. Forest is one of the most important economic and environmental resources of the country and an important source of government revenue and employment for the local people. Cambodia’s
forests provide a variety of timber and non-timber products such as wildlife, fuel wood and medicinal plants. About a third of Cambodia’s forests (all of it in the evergreen category) are considered commercially attractive (DFW, 2003). Article 3 of the Regulations on Forest Resources Exploitation prescribes selective cutting and sets the extraction rate at 30% of the total volume available for harvest in evergreen and mixed evergreen forests (all merchantable trees that satisfy prescribed diameter limits). The average forest growth in Cambodia has been estimated to be about 0.3 m3/ha per year. Applied to a cutting
cambodia national environmental Performance
assessment (ePa) rePort
2 management of Priority concerns
in cambodia
Figure 1.1 Forest Cover Map of Cambodia

�� ��
cycle (35 years), this has been used to fix an annual average harvest limit at 10 m3/ha (DFW, 2003). 15. Cambodia’s location in the tropical monsoon zone accounts for marked biological richness of the forests (see Table 1.1 for a partial illustration). Complex interrelationships exist between the country’s forest cover and unique hydrological systems of the Mekong River and tonle sap Lake. 16. The institutional history of forestry in Cambodia during the last fifteen years includes a period of rapid expansion of the role of private forest concessions in the early 1990s followed by a retrenchment when the difficulty of controlling the concession holders’ and other parties’ logging activities became apparent. The current phase in forestry development in Cambodia cautiously makes room for community based management and decentralization and in part follows the trends observed in countries that have lost most of the once abundant forest. 1.2.TheState
Indicator: Forest Cover as a Percentage of Total Land Area – 1965-2002
17. Forest cover, expressed as a percentage of total land area was selected as the most suitable indicator to describe the state of the country’s forest resources. The indicator is common worldwide and, with qualifications, similar to the selection by all other five GMS countries. other indicators (e.g. those relating to the quality of the standing stock) would naturally add to the understanding of underlying conditions provided
Table 1.1: Cambodia Forest Cover, 2002
Forest Type Area (1000ha) Percentage Evergreen Forest 3,720.50 20.5Semi-evergreen forest 1,455.20 8Deciduous forest 4,833.90 26.6Other forest 1,094.70 6Total forest land 11,104.30 61.1Non-forest land 7,056.40 38.8Total 18,160.70 100Source: Forest Administration
reliable values could be generated for them, which is not the case for Cambodia at present. Although suitable, the indicator is not ideal in a GMS context where countries tend to use their own definition of forest cover (e.g. using different percentages of forest canopy). 18. The forest cover as defined in Cambodia (see the relevant fact sheet) steadily declined from 73% in 1965 to 59.8% (or 62.7% under a slightly different definition of forest) in 1993, averaging a loss of approximately 0.4% annually during this 28-year period. 19. The downward trend continued with only a moderate slowing down (to 0.3% per year) until 1997. However, a reversal is observed from 1997 onward. The forest area increased by 1.3% per year from 1997 to 2002 to a total of 61.1% of the total land area. 20. In 2003, RGC set a target of 60% forest cover for the period 2005 to 2015 (CMDG, 2003). If the recent trend can be maintained, Cambodia should not have any problem maintaining the target.
Rating: Relatively Good and Stabilizing Justification: Forest cover in Cambodia has been declining over the long-term but there are signs of a reversal, based on observations between 1997 and 2002. Cambodia has the highest forest cover of all GMS countries in excess of 60% of the total land area. The condition of the existing forest cover however remains a concern.

�� ��
Figure 1.2: Percentage Forest Area over Total Land Area, 1965-2002
73.04
70.02
65.29
61.34 61.1562.16
62.68
59.82
58.6
50
60
70
80
1965 1976 1987 1993 1993 1997 2002 2005
% T
ota
l La
nd
Are
a
Area with Tree Crown Cover >=10% Area with Tree Crown Cover >=20%
1.3.ThePressure
Indicator: Forest Concession Areas – 1994-2002
21. The total area under forest concessions was perceived to be an important factor in contributing to the pressure on the forest cover, together with illegal logging. Typically the two are closely related, and whereas obtaining reliable information on illegal logging is not always easy, data on concession areas are available. In late mid-1990s, RCG set a target of reducing number of forest concessions from 30, operating on 6.5 million ha in 1997 to 12, operating on 3.8 million ha, by 2003. The 12 authorized concessions were required to develop forest concession management plans before resuming operations. 22. As can be observed from Figure 1.3, the area under forest concessions rose steadily from 1994 and peaked in 1998 when it approached 7 million ha. This was more than half of the total forest area at the time. The Government’s policy of sharply reducing the area under concessions, as mentioned earlier, reflected alarm at an apparent inability to control concessionaire activities. The 2003 target of 3.8 million ha was reached one year earlier, in 2002, when the total under concession management was approximately 30%
of the total forest area (See Table 1.2). 23. It is important to note that during the period 1996-2002, forest cover decreased both inside active and cancelled concession areas, suggesting that cancellation of forest concession areas by itself may be insufficient to prevent the loss of forests.
Rating: Non-Comparable and Decreasing Justification: The RGC has succeeded in reducing the pressure on forest resources through cancellation of a large number of forest concessions that brought the area under concession management down from 6.5 million ha in 1998 to 3.8 million ha in 2003. Operating forest concessions are closely monitored based on detailed forest management plans. The rating assigned is not comparable with that for the other GMS countries, since each country uses different indicators to capture the pressure on standing forest.

�� ��
Figure 1.3: Trends in Forest Concession Area – 1994-2002
0
1,000
2,000
3,000
4,000
5,000
6,000
7,000
8,000
1994 1995 1996 1997 1998 1999 2000 2001 2002 2003
Th
ou
san
ds
of
He
cta
res
High Estimate Low Estimate
Concession Area Target
Table 1.2 – Percentage Forest Cover Change in Concession Areas – 1996-2002
1996/97 (ha)
2002(ha)
% of total forest cover% 1996/97 % 1996/97
Concession areas 3,335,232 3,346,453 30.49 30.13Canceled concession 2,095,311 2,072,157 19.15 18.66Source: Trends in Land Cover Changes Detection between 1996/97-2002
1.4.TheResponse
1st Indicator: Reforested Areas – 1985-2002
24. The percentage of reforested areas in the total land area was considered first. It is easily understood, intuitively sound, and good information was available to make an assessment. 25. Between 1985 and 2002, the government’s re-plantation program focused on the severely degraded forest areas in Svay Rieng, and Takeo provinces (see Figure 1.4) 26. The total areas involved, however are very small. only about 10,000 ha (or 0.05% of the total land area) had been re-forested up to 2002 in a country with a total forest area of some 11 million ha. Clearly such a level of effort had little impact on the overall forest cover. The main purpose of these measures was probably to set a good example and initiate reforestation in vulnerable watersheds in the most seriously affected provinces.
Rating: Low and Sporadic Justification: RGC has implemented various re-forestation programs sensibly paying attention to small environmentally important areas of the most deforested provinces. The overall impact of re-forestation programs on the country’s forest cover, however, has been negligible.
2nd Indicator: Protected Forest as a Percentage of Total Land Area – 1993-2002
27. The area of forest placed under a system of protected areas was chosen as the second response indicator. This is a globally accepted indicator and one utilized by several GMS countries under the SEF II Project. The indicator is expressed as a percentage of protected forest in total land area. There is no direct target for this

�� ��
Figure 1.4: Percentage Reforested Area by Total Land Area – 1985-2002
0
1,000
2,000
3,000
4,000
5,000
6,000
7,000
8,000
9,000
10,000
Pre
ah
Vih
ea
rM
ondul K
iri
Stu
ng
Tre
ng
Ra
tta
na
k K
iri
Kro
ng
Pa
ilin
Ko
h K
on
gK
ratie
Pu
rsa
tO
ddar
Meanch
ey
Ka
mp
on
g S
pe
uK
ron
g P
rea
h S
iha
no
uk
Ka
mp
on
g T
ho
mK
am
po
tB
att
am
ba
ng
Sie
m R
ea
pK
am
po
ng
Ch
hn
an
gB
ante
ay
Meanch
ey
Kro
ng
Ke
pK
am
po
ng
Ch
am
Ka
nd
al
Ta
keo
Sva
y R
ieng
Pre
y V
eng
Ph
no
m P
en
hT
ota
l –
Ca
mb
od
ia
He
cta
res
0.00
0.01
0.02
0.03
0.04
0.05
0.06
% L
an
d A
rea
indicator but an indirect policy target exists for protected areas, namely to maintain 23 existing protected areas and 6 more recently created forest protected areas (CDMG, 2003), and increase the number of rangers from 600 to 1,200 between 2001 and 2015 (CMDG, 2003). 28. As can be observed in Figure 1.5, the 23 protected areas established by a 1993 royal decree comprised a total of 2.8 million ha of forest amounting to approximately 15% of the total land area. The 23 protected areas comprised: (i) 1.8 million ha of forest under wildlife sanctuaries; (ii) 0.7 million ha of forest under national parks; (iii) 0.3 million ha of forest under multiple-use protected areas and (iv) 0.06 million ha of forest under protected landscapes. In 2001, the Tonle Sap Multiple Use Area became a Biosphere Reserve and its transition zone increased the forest area under protection by 0.2 million ha. 29. The system of protected forests was formalized in 1996 under the jurisdiction of the Ministry of Agriculture, Forestry and Fisheries. Figure 1.5 shows no new areas added to the protected realm between 1993 and 2000. Concerted efforts by the government resulted in an area expansion of the Tonle Sap Multiple Use
Area in 2001. In 2002, a further 1.2 million ha were added bringing the total of forests under protection to approximately 4.2 million in a total of 11.1 million ha of existing forests, amounting to 38% of total forest and 23.5% of the total land area of Cambodia.
Rating: Non-Comparable and Sporadic Justification: Protected forests can significantly contribute to biodiversity and forest cover conservation, and protection of watersheds’ environmental functions. During the period 1993 to 2002, forest area under protection increased to 4.2 million ha or from 15 to 23.5% of the total land area. This increase resulted from two discrete actions by the Government rather than reflecting a steady and sustained trend in government-led protection efforts.
1.5.Conclusions30. Compared to its GMS neighbors, Cambodia’s forest cover exceeds 50% of the country’s total land area. This is a high percentage for a country with topography less demanding than that of cambodia’s two mountainous neighbors, viz., Lao PDR and Viet Nam. The trend of further loss of

�6 ��
Figure 1.5: Protected Forest as a Percentage of Total Land Area – 1993-2002
15
16
17
18
19
20
21
22
23
24
1993 1994 1995 1996 1997 1998 1999 2000 2001 2002
Per
cen
ts o
f la
nd
are
a
forest cover seems to have been arrested. It is less clear how the overall quality of the standing forest compares with the situation in the past. The forest cover has been stabilized at a comfortable overall level but the quality of the standing forest could still be declining. Information pertaining to quality of forest cover in Cambodia would deserve to be organized in the next stage of performance evaluation in order to establish the impact of government efforts on that variable. 31. The success in stabilizing forest cover seems to mirror quite closely the Government’s responses, most notably the limits placed on forests’ commercial exploitation and, to a lesser degree, support for community forestry. However, illegal logging still continues. For Cambodia’s forestry to become truly sustainable, the quality of forest concessions’ management plans and the compliance with the plans need to be closely monitored and the problem of illegal logging, largely unconnected with concession operations by now, must be kept at the forefront of attention. 32. A significant proportion of protected forests now are former concession areas. Improved management and protection of cancelled concession areas could be among the most efficient ways of increasing forest cover. Illegal logging appears to have targeted mainly these areas. 33. Measures need to be undertaken to improve the institutional capacity of the forest
departments to better monitor compliance with the rules of sustainable forestry. Capacity to follow up on policies is still inadequate. Limited financial resources further constrain government’s implementation capacity.
Rating: � – STARS Justification: A 2-star rating is suggested based on evidence that the responses (especially forest protection under the system of protected forests) have or will have an impact on improving the state (forest cover). Demanding targets (60% by 2005 and through to 2015) have been set and there are signs that these targets will be reached. International agreements (e.g. ITTO) have been signed and international benchmarks (e.g. MDG) accepted. Monitoring programs and databases are in place in the MAFF to allow regular monitoring of forest cover and forest conditions.
ReferencesCambodian Millennium Development Goal (CMDG). 2003. Cambodian Millennium Development Goal Report, Ministry of Planning, Royal Government of Cambodia. Phnom Penh, Cambodia DFW.1999. cambodia Forest cover. Forest cover Monitoring in the Lower Mekong basin, Department of Forestry and Wildlife, Ministry of Agriculture, Forestry and Fisheries. Supported by MRC/GTZ. Phnom Penh, Cambodia,

�6 ��
DFW.2003. cambodia: Forestry statistics for 2002, May 2003, Department of Forestry and Wildlife, Ministry of Agriculture, Forestry and Fisheries, Phnom Penh, Cambodia. global Witness. 1995. Forest, Famine and War: key to cambodia’s Future, London, England. global Witness. 1999. Made in vietnam, cut in cambodia, London, England. MAFF. 2004. Cambodia Forest Cover Resources, Ministry of Agriculture, Forestry and Fisheries, Royal Government of Cambodia, Phnom Penh, Cambodia. MoE. 1998. National Environment Action Plan, Ministry of Environment, Royal Government of Cambodia, Phnom Penh, Cambodia. RGC. 2003. Significant Achievements Made by the Royal Government of Cambodia 1998-2002, Phnom Penh, Cambodia. World bank. 1996. cambodia: Forest Policy Assessment. Joint World bank, UNDP and FAo report. Washington D.c. World bank. 1999. background Note, cambodia, A Vision for Forestry Sector Development. Washington, D.c. 2. THREAR BIODIVERSITY 2.1.TheContext34. Cambodia’s geography and hydrology contribute to the country’s rich biological diversity. Four main ecosystems are distinguished besides artificial/ terrestrial (IUCN term used to describe farmed areas): forest, shrubland, grassland and wetlands. The areas with significant biological diversity are the southwest, especially the Cardamom and Elephant mountains, the eastern section of Dangrek Range, northern and northeastern parts of cambodia-Lao PDR and Cambodia-Viet Nam border, central plains of cambodia and the tonle sap Lake and its wetlands which cover 30% of the total land area (MoE, 2003). 35. Cambodia is home to an estimated 2,300 plant species, some of which are of inestimable value to local communities as medicinal plants. In addition, Cambodia is home to 130 mammal species (UNDP-GEF, 2001)1. There are over 500 bird species mainly living in the wetland areas.
Mekong River and its tributaries are home to about 500 species of freshwater fish in Cambodia (Rainboth, 1996). Approximately 70 terrestrial species are recorded in Cambodia (MoE et al., 2001). 36. the tonle sap Lake and the wetland areas in the northeast of the country are unique and natural havens for many wetland species. Since the 1960s, studies of Tonle Sap’s biodiversity have recorded 225 bird species, more than 200 fish species, and 40 reptile species. Moreover, Tonle Sap area is the last stronghold in Southeast Asia of several of the globally threatened bird species. Threatened freshwater dolphin is found in the upper Mekong River (ADB, 2002). 2.2.TheState
Indicator: Threatened Species as a Percentage of Globally Threatened Species – 1996-2004
37. Percentage of globally threatened species was selected as the state indicator. The indicator tracks over a period of time the number of globally threatened species present in Cambodia. It is expressed as a percentage of threatened species at the national level in the number of threatened species at the global level. Expressing the indicator as a ratio has the merit of placing the national protection efforts in a global context. Threatened species are those defined as vulnerable, endangered or critically endangered (IUcN Red List, 2004). 38. The Government has set no specific targets for this indicator value. For this indicator, of relevance is the Convention on Biological Diversity, which Cambodia ratified on 09/02/95. 39. Figure 2.1 presents the values of the indicator in 2004. What happened between 1996 and 2004 is less relevant; it is 2004 which forms the baseline for the future development of this indicator. 40. It can be observed that Cambodia is a sanctuary to approximately 1.6% of the globally threatened species. This figure consists of approximately 2.5% of globally threatened mammals, 2% of globally threatened birds, 5% of
1 UNDP-GEF, 2001, The Tonle Sap Conservation Project; Draft Inception Report.

�� �9
globally threatened reptiles, 1.6% of globally threatened fish and less than 1% of globally threatened amphibians. 41. By habitat, the species at risk are presented in Table 2.1. As can be observed, forests are the dominant habitat for approximately 33% of the threatened species in Cambodia including threatened mammals, birds and amphibians but loss of wetlands is also an important factor. Interestingly, terrestrial habitats, which include arable land and pasture land (i.e. areas by definition disturbed), are also important habitats for some of Cambodia’s threatened bird species. 42. Cambodia’s 1.6% of globally threatened species is relatively low compared to the overall average of 2.13% for all six GMS countries. Its low-lying topography (for the most part) contrasting with the mountainous topography of its neighbors viet Nam and Lao PDR, influences this low percentage. Nevertheless it appears that the current state of biodiversity in Cambodia is relatively good, with no observable past trends and an expectation that the global share of Cambodia’s threatened species will remain constant in the very near future. However, loss or changes to habitat and intensity of harvesting should be closely monitored.
Figure 2.1: Threatened Species as a Percentage of Global Threatened Species – 1996-2004
0.0%
1.0%
2.0%
3.0%
4.0%
5.0%
6.0%
1996 1997 1998 1999 2000 2001 2002 2003 2004% o
f G
lob
ally
Th
rea
ten
ed
Sp
eci
es
Mammals Birds Reptiles
Amphibians Fish All Species
Rating: Relatively Good with Undetermined Trend Justification: The state of biodiversity is relatively stable in Cambodia and in better condition than in the other GMS countries. The focus should be on preserving the key habitats and also monitoring the ten species endemic to Cambodia, Viet Nam & Thailand.
2.3.ThePressure
Indicator: Loss of Critical Habitat between 1993 and 1997
43. Loss of critical habitats is taken as the most suitable indicator of pressure on the country’s biodiversity. It tracks the loss of critical habitats over time and expresses it as a percentage of the country’s total land area. 44. Habitat loss has a direct impact on the fate of the species that depend on it for survival. The IUcN Red List (2004) cites loss of key habitats as the major threat to the survival of non-plant threatened species in Cambodia. Critical habitats for the purpose of this indicator are Forests,

�� �9
Table 2.1 – Threatened Species by Major Habitat Type – 2004
Habitat Mammals Birds Reptiles Amphibians Fish TotalCitations
%Forest 21 20 0 3 0 44 33.59%Wetlands 2 15 0 3 5 25 19.08%Artificial/Terrestrial 0 14 0 0 0 14 10.69%Grasslands 4 9 0 0 0 13 9.92%Shrubland 6 6 0 0 0 12 9.16%Sea 1 5 1 0 1 8 6.11%Coastlines 1 1 1 0 4 7 5.34%Savanna 4 2 0 0 0 6 4.58%Artificial/Aquatic 1 1 0 0 0 2 1.53%Rocky Areas 0 0 0 0 0 0 0.00%Caves and Sub-Terrananean Habitats
0 0 0 0 0 0 0.00%
Desert 0 0 0 0 0 0 0.00%Introduced Vegetation 0 0 0 0 0 0 0.00%Other 0 0 0 0 0 0 0.00%Unknown 0 0 0 0 0 0 0.00%Total Citations 40 73 2 6 10 131 100.00%Source: IUCN Red List – 2004
Wetlands, Artificial/terrestrial, grasslands, and Shrublands. No national targets for the area of these habitats, however, exist. Cambodia is signatory to several international conventions and agreements of direct relevance to biodiversity management, use and protection (see the fact sheet for details). 45. Loss of critical wildlife habitats has several well know causes that are predominantly anthropogenic. In spite of the tragic decline during the Khmer Rouge period, the population of Cambodia has doubled from 1960 to 2000. The increase was accompanied by the expansion of human activities into wildlife habitat. Logging, clearance for agricultural expansion, growth of settlements and urban areas all contributed to the loss of natural ecosystems and the inherent biological diversity. 46. Deforestation and conversion of forest lands to agriculture played an important role. As established earlier, Cambodia’s forest cover declined from 73% in 1965 to approximately 59% in 1996. Logging spread into protected areas. For instance, a biodiversity survey of the Cardamom
Mountains, considered the richest biodiversity area in the country, confirmed that logging was taking place inside the protected areas (MoE et al. 2000). 47. Agricultural land increased from 3 million ha in 1960 to 3.8 million and 4.3 million in 1992-93 and 1996-97 respectively. It is estimated that about 2.1 million ha of forestlands were converted to agriculture and other uses between 1960 and 1992-93. Around the tonle sap Lake, clearance of flooded forest for agriculture and settlements has been significant. Areas under inundated forest and mangrove declined by nearly 10% in the space of 5 years from 0.43 million ha in 1992 to 0.40 million ha in 1997 (IREF, 1958; Tichit, 1981; MAFF & MRC, 1991). 48. The changes in the areas of the four critical habitats relevant to this indicator are illustrated in Table 2.2. The rate of designated habitat loss is measured as the loss of forestland, shrubland, grassland and wetlands between 1993 and 1997 as a percentage of the total country’s land area. The forest habitat decreased by 1.22% between 1992/93 and 1996/97, followed by shrubland

�0 �1
(0.80% loss). 49. However, the artificial/terrestrial habitat increased by 1.85% during the same period, wetlands by 0.08% and grasslands by 0.07%. The increase in artificial/terrestrial class agrees with the common perception about the direction of land use changes in most GMS countries in which farming and urban expansion (components of “artificial/terrestrial” class) gain at the expense of other land categories. 50. It is important to add that habitat loss may not be neatly correlated with the loss of underlying biodiversity. The relationship between the two is complex and lagged. If periods of evaluation are too short to establish trends, it is possible to observe increases in habitats coexisting with high threat and vice versa.
Rating: Non-Comparable with Undetermined Trend Justification: Although pressure exists on biodiversity, there is not enough information to establish a long-term trend. The pattern of habitat loss in Cambodia defies easy generalizations. The pressure on biodiversity furthermore depends on the intensity of hunting and gathering in each habitat and trade in wildlife for which systematic data are not available.
Table 2.2: Loss of Critical Habitats as a Percentage of Total Land Area – 1993-1997
Ecosystem type1992/93 1996/97 Loss of Ha-
bitat%
Area (ha)% of Total Land Area
Area (ha)% of Total Land Area
Forest 10,891,918 60 10,671,936 58.79 -1.21Wetland 537,242 2.96 552,478 3.04 0.08Artificial/Terrestrial 4,022,304 22.16 4,358,435 24.01 1.85Grassland 476,804 2.63 488,643 2.69 0.07Shrubland 2,204,223 12.14 2,059,449 11.34 -0.8Total Land Area 18,152,985Source: Forestry Administration, Ministry of Agriculture, Forestry and Fisheries
2.4.TheResponse
Indicator: Protected Areas as a Percentage of Total Land Area – 1993-2002
51. Total protected areas as percent of total land area is taken as the indicator of response to the threats on biodiversity. The numerator is the area of habitats given a protected status. It is assumed that the higher the percentage of the indicator, the better the performance of the country in protection and conservation. RGC has established an indirect target for this indicator i.e. to maintain the 23 protected areas at the 1993 level of 3.3 million ha through 2015 and 6 post-2001 forest protected areas at the present level of 1.35 million ha through 2015 (CMDG, 2003). 52. Figure 2.2 depicts the trend of protected area development in Cambodia between 1993 and 2002 since the proclamation of 1993 Royal Decree on Protected Area that designated 3,273,200 ha or 18.08% of the total land area as protected area. This consisted of 23 protected areas divided into National Parks (742,000 ha), Wildlife sanctuaries (2,030,000 ha) and Multiple Use Area (403,950 ha) (MoE, 1993). 53. The protected areas increased slightly from 18.08% 1993 to 18.27% in 2000 due to the inclusion of 3 additional sites designated as Protected Forests and another 3 Ramsar sites, between 1996 and 2000. However, it increased sharply from 18.27% in 2000 to 24.72% in 2001 as a result of RGC’s designation of the Tonle Sap Multiple Use Area as biosphere reserve and

�0 �1
extending its area to 1,167,000 ha. By 2002, large forest areas formerly under forest concessions and other areas totaling 1,332,218 ha were added to the system of protected areas bringing the total to 32% of the total land area (see Figure 2.2), the highest among all GMS countries. 54. Figure 2.3 further describes the system of protected areas in terms of different habitats. It can be observed that the protected areas as a whole are composed of 70.18% forest, 9.34% wetlands, 9.5% artificial/terrestrial and the remaining 10.98% of grasslands, shrublands and other land covers. While loss of forest habitat was identified as the single most important threat to endangered species in Cambodia (see Table 2.1), loss of wetland habitat was cited as being the second dominant threat, followed by loss of artificial/terrestrial habitats, including arable land and pasture land.
Rating: Significant and Consistent Justification: Over the years, RGC has stepped up its efforts to improve the state of biodiversity. Since 1993, the government has been building up a system of protected areas. By now a total of 32% of Cambodia’s territory has some form of protection status. However it remains to be seen how effective the protection is in the face of continued and widespread pressure on biological and other natural and cultural resources in Cambodia.
Figure 2.2: Protected Areas as a Percentage of Total Land Area – 1993-2002
32.04
18.09 18.12 18.20 18.27
24.72
18.0818
20
22
24
26
28
30
32
34
1993 1994 1995 1996 1997 1998 1999 2000 2001 2002
Per
cen
t
2.5.Conclusions55. The RGC has taken concrete measures to protect key ecosystems and habitats. With recent inclusion of cancelled forest concessions into the system of protected areas, forest areas enjoying some sort of legal protection amounted to 37% of the forests’ total. All habitats taken together under legal protection now account for 32% of the total country’s land area. 56. Among all threatened species listed in Cambodia, 45% of wildlife inhabits the forest. That habitat declined by 1.22% between 1992/3 and 1996/7. 25% of threatened species are found in wetlands. Their area decreased by 0.04% over the same period. Besides a decrease in area, there are indirect indications of the reduced quality of these habitats that are under pressure by hunters. 57. The cancellation of the majority of forest concessions and their inclusion into the protected realm speaks of RGC’s commitment to biodiversity conservation. Cambodia’s performance compares favorably with that of other GMS countries, especially in terms of the area set aside for protection.

�� ��
Figure 2.3: 1997 Habitat Composition of Existing Protected Areas
Wetland,
9.34%
Artif icial/
Terrestrial,9.50%
Grasslands,
3.86%
Shrublands,
7.06%
Forests,
70.18%
Suggested Rating: �-Stars Justification: Although there is no observable trend in the loss or gain of threatened species, Cambodia’s share of globally threatened species (1.6%) is relatively small when compared to that of other GMS countries. Also, none of these threatened species are endemic to Cambodia, and this cannot be said of other GMS countries. While it cannot yet be shown that the pressure (loss of habitat) is decreasing and that the state shows signs of improvement, there are signs of improvement in other related indicators. Forest habitat for example, which used to suffer the most, has shown signs of improvement, at least in terms of area. Consistent with the guidelines associated with this rating, international conventions (CBD, CITES, etc.) have been ratified and the reporting requirements of these conventions have been adhered to. Institutional responsibilities have been assigned and the Biodiversity Unit within MAFF which is responsible for continuous monitoring and database development of threatened species.
ReferencesADB. 2002. Report and recommendations of the President to the Board of Directors on a Proposed
Loan and technical Assistance grant to the Royal Government of Cambodia for the Tonle Sap Environmental Management Project Manila. Cambodian Millennium Development Goal (CMDG). 2003. Cambodian Millennium Development Goal Report. Ministry of Planning, Royal Government of Cambodia, Phnom Penh, Cambodia. Institute de Rechere d’Enseignement Forestier (IREF).1958. Forestry in Cambodia. Cambodia. MAFF & MRc. 1991. cambodia Land cover Atlas 1985/87-. 1992/92. Mekong River Commission, Bangkok. MoE, DFW and UNDP/gEF. 2001. biodiversity the Life of cambodia: cambodia’s biodiversity status Report 2001. Phnom Penh, Cambodia MoE, DoF and Flora and Fauna International. 2000. Cardamom Mountains Biodiversity Survey, edited by Daltry, J.C. and Momberg, F. Phnom Penh, Cambodia MoE, 1993. The Royal Decree on the Creation and Designation of the Protected Areas. Phnom Penh, Cambodia. MoE. 2002. Cambodia’s National Biodiversity Strategy and Action Plan. Ministry of Environment, Phnom Penh, Cambodia. MoE, 2002. Initial National Communication under the UN Framework Convention on Climate Change.

�� ��
MoE, Phnom Penh, Cambodia Rainboth, W.J. 1996. Fishes of the cambodian Mekong, FAo, Rome stuart, b.L. et al 2000. homalopsine Watersnakes: the harvest and trade from tonle Sap. Cambodia’s Traffic Bulletin 18:3. Available: www.traffic.org/bulletin/ watersnakes.htm. tana, t. s., Prak, L.h., chul, t., Lieng s., chun, s., and Heng, K., 2000. overview of the Turtle Trades in Cambodia’s in Asian Turtle Trade. Proceeding of the Workshop on conservation and trade of Freshwater Turtles and Tortoises in Asia. In: van Dijk, P.P., stuart, b.L., and Rhodin, A.g.J. (Eds.). Asian turtle trade: Proceedings of a Workshop on Conservation and Trade of Freshwater Turtles and Tortoises in Asia. Chelonian Research Monographs 2:55-57. tichit, L., 1981. L’agriculture au cambodge. Paris, France Timmins, R and ou, R. 2001. The Importance of Phnom Pich Wildlife sanctuary and Adjacent Areas for the Conservation of Tigers and other key species: A summary. Published by WWW Phnom Penh, Cambodia. UNDP-GEF. 2001. The Tonle Sap Conservation Project, Draft Inception Report, Phnom Penh, Cambodia. World conservation Union (IUcN). 2004. the IUcN Red List of threatened species. Available: www.iucn.org/themes/ssc/red_list_2004/main.End.htm
3. FISH RESOURES 3.1.TheContext58. Inland fisheries are an important component of rural economic growth and key to local livelihoods in Cambodia. Fish is a staple diet for local people accounting for three quarters of the animal protein intake of Cambodia’s 13 million people. Along with rice it forms the basis of food security. the tonle sap Lake and Mekong River are home to many inland fish species, and the richness of fisheries is intimately linked to the floodplain areas around the Lake, its flooded forest and the water flow regime of the Mekong. More than 200 fish species reside in the Tonle sap Lake. some of them migrate upward and downward of Mekong River. Together with fish in tonle sap Lake, the Mekong River basin in Cambodia is home to about 500 out of 1,200 Mekong fish species (ADB, 2003). 59. Given the above, protecting the exceptionally rich inland fisheries is vital. If fish availability were to deteriorate the nutritional and health status, especially among the poor would be seriously affected. 3.2.TheState
Indicator: Inland Fish Consumption – 1981-2003
60. The indicator is based on data of live weight fish catch. output data are recorded by the Department of Fisheries, Ministry of Agriculture, Forestry and Fisheries (MAFF). These and other sources used to construct the values of the indicator are described in the relevant fact sheets.
Table 2.3: Protected Areas in GMS Countries
Country Percentage of Total Land Area Future Target
Cambodia 32.0% as of 2002 Maintain existing and extend protected forest area.
Lao PDR 14.3 % as of 2002 Maintain existing which is above IUCN rec-ommendation of 10%.
Myanmar 7.2% of as 2004 IUCN recommendation of 10%.Include another 18% as Class 1 Watersheds.Thailand 18.2% as of 2004
Viet Nam 6.2% as of 2004 IUCN recommendation of 10%Maintain existing which is above 8% target.Yunnan 8.8% as of 2004
Source: Findings of the SEF-II Project

�� ��
An indicator that closely (but not perfectly, given the existence of fish exports) tracks fish output has the disadvantage of possibly not revealing the threat of over-fishing. Abundance today may mask scarcity tomorrow. This disadvantage was in part offset by the existence of a long time series of data and supplementary information about the changes in the quality of the catch. 61. The official objective of government policy (DoF, Fisheries Policy Briefing, 2004) is to ensure that by 2010 all living aquatic resources are harvested within their sustainable limits. No specific figures have been given for these sustainable limits but the policy provides an overall policy direction for fisheries management. 62. Fish consumption per capita was estimated by different groups of researchers in various locations across Cambodia and throughout the 1990s. The estimates ranged from 13-16 kg to 21-40 kg in the south of Cambodia to 70-80 kg in the Tonle Sap Region (see Table 3.1). The national average consumption per capita has been estimated at about 30 kg and is projected to stay at that level through to 2010. 63. Estimates of per capita fish consumption
based on total inland fish catch excluding exports, marine catch, aquaculture production, and imported fish are shown in Figure 3.1. Per capita consumption during 1980 to 1991 was stable at around 6 kg per year, but dropped below that level between 1992 and 1998. It increased again from 1999 to 16 kg and peaked in 2001 at 27 kg per year. However, 2003 saw a decrease to about 19 kg. A figure of 20 kg per year is considered a reasonable estimate of average per capita fish consumption during the period 1999-2003. 64. The data of per capita fish consumption between 1980 and 1998 do not include the output of small scale and rice field fisheries. Since 1999, upon the advice of MRC, the figures do include these categories and substantially increase the totals. 65. Fish consumption in Cambodia has steadily increased over the years especially in the last five years. Combined with the avian flu, increased living standards among urban dwellers and increased health and nutrition awareness, fish is becoming more popular than any other food item. The domestic price of fish is increasing and remains high relative to incomes.
Table 3.1: Estimate of Per Capita Fish Consumption in Cambodia
Fish consumption per capita (kg/year)
Sources*
20 - 25 (Lagler, 1976)13.3 - 16 (MS, 1992) with increased population (annual growth rate: 2.5-3%), (World Bank, 1992).
25 (Tana, 1993) in the South-Eastern Cambodia13.5 (Csavas, 1994)40 (CIAP unpublished) in the South38 (APHEDA, 1997) in the Southwest71 FAO Participatory Natural Resource Management in the Tonle Sap Region in the floating
villages32 in the up-land areas of Siem Reap province (Hy, 1995)
86.8 MRC/DoF/DANIDA Freshwater Capture Fisheries Management Project (1995) in fishing dependent communes
71 (Ahmed et al., 1998)21.5 - 33.8 - 39.5 Gregory (1997) in Svay Rieng.
24.2 - 32.2 (MRC/DoF, 1998/1999)30 National average of fish consumption per annum (MRC/DoF, 1998)
Note: * Detailed references are given at the end of this section

�� ��
Rating: Relatively Good and Improving Justification: Fish consumption in Cambodia has grown in recent years due to further shifts in consumer preferences towards fish and greater production by small-scale and rice-field fisheries. The production by Tonle Sap appears not to have changed significantly in volume terms. Fish consumption per capita in Cambodia is higher than in other GMS countries.
3.3.ThePressure66. No single pressure indicator has been chosen as several factors contribute to affecting fish catch in Cambodia. These are all discussed in the accompanying paragraphs. 67. Pressure on fisheries in Cambodia comes from various directions the principal one being the use of more sophisticated fishing gear and equipment. Figure 3.1 shows the catch to have been fairly stable between 1990s and 1998s. The annual commercial fish catch data before 1998 recorded by the DoF was estimated at around 55,000 to 75,000 tons annually. Fish catch from the Tonle Sap was between 36,000 to 45,000 tons per year (van Zalinge, 2002), constituting about 60% of the total inland fish catch of Cambodia
Figure 3.1: Annual Fish Consumption per Capita in Cambodia
0
5
10
15
20
25
30
35
19
80
19
82
19
84
19
86
19
88
19
90
19
92
19
94
19
96
19
98
20
00
20
02
20
10
Kilo
gra
ms/
Ye
ar
Actual inland catch for consumption Consumption estimation
(Ahmed and Tana., 1998). After 1999, figures lose comparability. The annual fish catch increased to between 290,000 and 430,000 tons due to the inclusion of fish catch from small scale and rice field fisheries (van Zalinge et al., 2000). 68. Although there may have been an increase in stable commercial fish catch, the share of large and medium size i.e. higher–value, fish has declined because of intensive fishing and inadequate regulation of fishing techniques and gear. This resulted in a higher proportion of small fish used for fishmeal and fermented fish paste production in the total catch (MRC 2004).
Table 3.2 MRC - Freshwater Fish Capture (ton) (Cambodia Fishery Project, 1999)
Large-scale
Fishing lots 30,000 - 60,000
Bagnet lots 15,000 - 20,000
Middle-scale 85,000 - 100,000Small-scale 115,000 - 140,000Rice Fields 50,000 - 100,000Total 295,000 - 420,000Source: Van Zalinge, et al.
69. In addition to meeting the demands of domestic fish consumption, there is also flourishing fish export business. About 25% of the total fish catch is exported (about 100,000 tons),

�6 ��
half of that through illegal channels. Approximately 75% of exports are delivered to Thailand2, as fresh fish. The bulk of the balance goes to Viet Nam (MoC, 2002). 70. Destructive fishing practices are widely used throughout Cambodia, due to the use of prohibited fishing gear, electricity, explosives and poisonous substances, and encroachments of fishing grounds. Small- to medium-scaled fishermen resort to illegal fishing practices in order to meet their basic subsistence needs whereas large-scale fishing enterprises often overfish driven by the profit motive. 71. over-harvesting of smaller fish and/or less-valuable fish for animal feed also contributes to the problem. The collection of fingerlings (newly hatched fish) for aquaculture3, pumping around the tonle sap Lake and elsewhere within fishing areas are all illegal forms of fishing. Pumping disrupts the ecological balance by removing virtually all aquatic life from the pond including juvenile fish. It has also caused problems for communities who lose their access to water that is essential for irrigation. Electrocuting fish is the preferred option for illegal fishers as it is the cheap method of mass capture of fish.
Rating: High and Increasing Justification: The pressure on fisheries is high due to increased human activities, whether over- or illegal fishing for consumption and commercial purposes or destructive fishing practices. The composition of inland fish catch has been changing towards smaller fish suggesting threats to sustainability exist. The trend will continue unless enforcement of existing legal provisions improves.
3.4.TheResponse
Indicator: Number of Community Fisheries 1996-2005
72. This indicator tracks the development of community fisheries; it is expressed in absolute numbers of fishing lots in the country, both inland
and marine areas. The indicator has a basis in the recent development trend in fisheries management in many countries (Cambodia included) that encourages decentralized management of fisheries as an alternative to the centralized approach predominating until recently. The change of direction is motivated mainly be equity and poverty-reduction concerns as well as a presumed positive effect on sustainability. RGC has formulated two targets that feature in Cambodia’s Millennium Development Goals (CMDGs) for sustainable fisheries management. The targets are:
• To increase the CMDG target of community-based fisheries from 264 in 2000 to 589 in 2015.
• To increase the proportion of fishing lots released to local communities from 56% of the total in 1998 to 60% in 2015.
73. The number of commercial fishing lots in Cambodia has been reduced since 1994 (see Figure 3.2). In 2000, RGC reformed the fisheries sector in an attempt to regulate fishery activities. Commercial fishing lots were reduced from 307 in 1988 to 162 in 2003. 74. Fishing areas released from the commercial sector were re-allocated to community fisheries. The number of community fisheries has grown rapidly since the beginning of the program in 1996 (see Figure 3.3) to reach a total of 382 communities with fishing lots in 2005, exceeding the CMDG’s target of 375 communities for 2005. 75. Furthermore, RGC in collaboration with ADB has launched a program of environmental management of tonle sap Lake 2003-2008. Under the Program, 500 community fisheries are to be established around the Lake. (ADb, 2003).
2 About 50,000 tons of inland fish have been exported every year to Thailand (FACT and EJF, 2000).
3 Scrogging, Lucrative Trade in Baby Fish a Deadly Business, Phnom Penh Post, 4-17 September 1998.

�6 ��
Figure 3.2: Numbers of Commercial Fishing Lots (1980-2003)
0
50
100
150
200
250
300
3501
98
0
19
82
19
84
19
86
19
88
19
90
19
92
19
94
19
96
19
98
20
00
20
02
Nu
mb
er
of
Lo
ts
Fishing lots
Figure 3.3: Community Fisheries in Cambodia 1996-2005
0
100
200
300
400
500
600
700
19
96
19
98
20
00
20
02
20
04
20
06
20
08
20
10
20
12
20
14
Nu
mb
er
of
Lo
ts
Community Fisheries CMDG Target

�� �9
Rating: Significant and Intermittent Justification: The increasing number of community fisheries (over 382) has improved the access of communities to fisheries while curbing the pressure of commercial fishing. Cambodia has placed tighter controls on commercial access to its fishery resource and is on track to meet the CMDG goals for sustainable fisheries. The change of policy direction is too recent to say whether it has resulted in a more sustainable management of the fish resource.
3.5.TheConclusions76. Current levels of inland fish catch are not significantly different from those of ten years ago. However, as a result of local intensive use combined with other pressures from the economic development of the Mekong basin, the fish resource is under increasing pressure. Behind a relatively stable total volume of fish catch, is a significantly changed composition of fish catch (more small fish being caught than larger fish), that suggests that sustainability of the catch is in doubt. This has been accompanied by changes in fish biodiversity. 77. There is a trend towards higher fish consumption amongst the local population and a greater awareness of the role of fish in nutrition and health. Fish has become more expensive in real terms. 78. RGC has taken steps towards regulating the fisheries sector in its drive to meet the target set by CMDG i.e. to release a total of 56% of commercial fishing lots for development by community fisheries by 1998, and 60% by 2015. In 2005, about 382 community fisheries were established. If the RGC maintains this effort, the target of 589 community fisheries for 2015 may be achievable.
Rating: �-Stars Justification: Per capita fish consumption in Cambodia is relatively high and increasing. It has grown in recent years due to further shifts in local consumption patters towards fish, and greater attention to small-scale and rice-field fish production. However there is a high pressure on the resource evidenced by an unfavorable trend in the quality of the inland catch, and destructive fishing practices that continue undiminished. Both of these invite doubts about the two star rating. The two stars are finally chosen only because of the strong equity content of the policy re-orientation towards community fishing. Here too, however, caution is justified as the effect of this change on sustainability of the resource in Cambodian conditions is yet to be demonstrated. RGC has signed international treaties and conventions related to fisheries resources such as Ramsar, CITES, CBD and Mekong Agreement as part of its commitments to the protection of the fisheries resources. Institutional responsibilities have been assigned and the Department of Fisheries is responsible for ongoing monitoring and management of fisheries resources though clearly unable to curb illegal practices.
ReferencesADB. 2003. Tonle Sap Environmental Management Project. Asian Development Bank, Manila, Philippines. Ahmed, M.H. and Tana T.B. 1998, Management of Freshwater Capture Fisheries in Cambodia , MRC Fisheries Program, MRC , Phnom Penh, Cambodia. DoF. 2001. Fisheries data collection, 1980-2000, February 2001. Phnom Penh, Cambodia. Fisheries Action Coalition Team and Environmental Justice Foundation. 2001. Feast or Famine: Solution to Cambodia’s Fisheries Conflict. Available: www.onefish.org FAo. 1994. Cambodia Rehabilitation and development needs of fisheries sector, Bangkok, Thailand, June 1994. McKenney, B. and McKenney, T. 2002. Natural resources and rural livelihoods in Cambodia: A baseline assessment; Working paper 23; cDRI, Phnom Penh, Cambodia. Ministry of Commerce (MoC). 2000. A Pro-Poor Trade Sector Strategy for Cambodia, Royal

�� �9
Government of Cambodia, Ministry of Commerce, Phnom Penh, Cambodia. MoE. 2003. National Capacity Development Project, Cambodian state of Biodiversity, Phnom Penh, Cambodia. MoE and UNDP. 2003. Cambodia Biodiversity Enabling Activity Project, Biodiversity, Phnom Penh, Cambodia MoE and UNDP, 2001. Cambodia’s Biodiversity Status Report-2001, Phnom Penh, pp.105-106, Phnom Penh, Cambodia. MoWRAM and ADb. 2001. National water section profile Kingdom of Cambodia. Royal Government of Cambodia, Phnom Penh, Cambodia. MRC and UNDP. 1998. Natural resources-based development strategy for the Tonle Sap Area, Cambodia, Final report, Volume I., Phnom Penh, Cambodia. MRCS. 1998. Agriculture and Irrigation Program for Cooperation towards the Sustainable Development in the Lower Mekong basin. Mekong River Commission and UNDP. MRC. 2004. State of the Basin Report, pp.101-132, Mekong River Commission, Phnom Penh, Cambodia. Tana, T.S. and Todd, B. 2002. Economic model of the freshwater and marine trade of Cambodia, oxfam America, Phnom Penh, Cambodia van Zalinge, N.P. 2000. “Where there is water there is fish? Cambodian fisheries issues in the Mekong River Basin Perspective”, in M. Ahmad and P. Hirsh (eds.). Common Property in the Mekong: Issues of sustainability and subsistence, IcLARM, Manila. van Zalinge, N.P. 2002. “Update on the State of the Cambodia Inland Capture Fisheries with special Reference to the tonle spa great Lake”, Catch and Culture, Mekong Fisheries Network Newsletter, Phnom Penh, Cambodia. DetailsofreferencesinTable3.1:Ahmed, M., h. Navy, L. vuthy & M. tiongco, 1998. Socio-economic Assessment of Freshwater Capture Fisheries of Cambodia. Report on a Household Survey. pp185. MRC/DoF/DANIDA. Mekong River Commission, Phnom Penh, 186 p APHEDA.1997. Baseline Survey Report (Angkor Chey, Banteay Meas, Chhouk and KompongTrach District), Report prepared by N.C.Paul, Domestic
Fish Farming Program, Australian People for Health Education and Development Abroad (APHEDA) – Department of Agriculture, Forestry and Fisheries Kampot Province, Cambodia, pp29. Csavas, I., Doulman D., Peter T., Padr J., and Debas L. 1994. cambodia Rehabilitation and Development Needs for the Fisheries Sector. FAo Fisheries Circular No. 873, FAo, Rome. Gregory R. 1997. Rice Field Fisheries Handbook, Cambodia IRRI Australia Project, Cambodia. Gregory R. and Guttman H.,999. A Diverse Monoculture, Aquatic Animal Production from Rice Fields in South East Asia. Cat and Culture Mekong Fisheries Network Newsletter. Vol. No. 1, September 1999. Hy H. 1995. Fish Production and Consumption in Siem Reap Province. Participatory Management of Natural Resources in the Tonle Sap Region, Siem Reap, Cambodia. Lagler k.F. 1976. Fisheries and Integrated Mekong River Basin Development. Terminal report of the Mekong Basin- wide fisheries studies, University of Michigan. Ann Arbor. Appendix 1. pp367 Tana T.S. 1993. Fish Supply and Demand in Rural Svay Rieng Province, Cambodia. Asian Institute of Technology, Bangkok World bank.1992. cambodia Agenda for Rehabilitation and Reconstruction. Washington D.C. pp219 plus appendices 4. WATER RESOURCES 4.1.DrinkingWater4.1.1.TheContext79. Cambodia has abundant water resources due to its geographical and physical setting with wide central plains surrounded by highland areas at the periphery. The main rivers are the Mekong, Tonle Sap and Bassac Rivers. of Cambodia’s 181,035 km2, 86% (156,000 km2) is drained by the Mekong-Tonle Sap system. on average, the annual inflow from the Mekong’s upstream is estimated at 410 billion cum. (MoWRAM, 2001). Although the surface water may be abundant in simple volume terms, the effective use of this resource for irrigation, household- and other purposes is costly as generations of irrigation, drainage and other projects have amply demonstrated.

�0 �1
80. With increased economic activity in Cambodia, utilization of water resources becomes an aspect of natural resource and environment management. The main concerns are depletion of the resource, its inefficient use, and deterioration of water quality. 4.1.2. TheState
Indicator: Percentage of Population with Access to Safe Potable Water – 1998-2002
81. The indicator tracks the proportion of the population with access to safe drinking water at home or within reasonable distance. It is expressed as the percentage of the population with access to an “improved water source” following the definition adopted by the Joint Monitoring Program (JMP) for Water and sanitation of the World health organization (Who) and of the United Nations children’s Fund (UNICEF). An “improved” source is one that is likely to provide “safe” water, such as a household connection, public standpipe, borehole, protected dug well, protected spring, rainwater collection, etc. “Not improved” source is one that is unlikely
to provide “safe” water, such as a unprotected well, unprotected spring, vendor provided water, bottled water, tanker truck water. 82. Likewise water supply service is defined as the availability of water, at least 20 liters per person per day from an improved source within one kilometer of the user’s dwelling. Estimates of the percentage of households with access to improved/safe drinking water in urban and rural areas are currently available for 1998, 2000 and 2002. 83. The national target, as set in the 2003 Cambodia Millennium Development Goals (CMDGs) and expressed separately for urban and rural population is to increase the proportion of the rural population with access to a safe water source from 24% in 1998 to 40% in 2010 and 50% in 2015, and the urban population from an assumed 60% in 1998 to 80% in 2015. Expressed as nation-wide average, the target is to improve access to safe drinking water from 30% in 1998 to 38% and 48% in 2005 and 2010 respectively and to 58% in 2015.
Figure 4.1: Percentage of Households with Access to Safe Drinking Water (Urban and Rural) 1998-2002
0
10
20
30
40
50
60
70
80
90
19
98
20
00
20
02
20
05
20
10
20
15
Urban household Urban TargetRural household Rural TargetTotal estimated population Total estimated target

�0 �1
84. An earlier RGC’s mid-1990s target was to improve urban access from 60% in 1998 to 68% in 2005. However, in 1998, only 53% of the urban population had access to safe drinking water, increasing to 58% in 2002. It is unlikely that the 2005 target will be met. In rural areas, the progress –from a very low base-- was somewhat better with 25% of rural population with access to safe drinking water in 1998, increasing to 27% in 2002. Between 1998 and 2002, access grew at an annual rate that fluctuated between 1 and 1.5%. only if the higher rate is maintained will the 2005 target be achieved. To achieve the 2015 target under conditions of rapid population increase, the rate of improvement will have to be reach about 2% per annum. 85. The proportion of population with access to safe drinking water in Cambodia is low when compared with other countries in the GMS. Indeed, Cambodia has the lowest percentage of population with access to safe drinking water (see Table 4.1).
Table 4.1 Percentage of Population with Access to Safe Potable Water
CountryAccess to Safe Potable Water
% Population, 2002Cambodia 34%PRC 77%Lao PDR 43%Myanmar 80%Thailand 85%Viet Nam 73%Source: WHO/UNICEF-JMP
Rating: Relatively Poor and Improving Justification: Access to safe drinking for both urban and rural population in Cambodia has improved during the last decade to 58% and 27% of the population, respectively, in 2002 with a greater rate of improvement in rural than in urban areas, but improved from an extremely low baseline. Cambodia continues to lag behind other GMS countries.
4.1.3.ThePressure
Indicator: Urban and Rural Population 1961-2003
86. Population growth in urban and rural areas is the main factor affecting access to drinking water supply. In the assessment here the population data going back to 1962 were used. 87. The first population census for Cambodia in 1962 recorded the total population at 5.7 million and the second4 in 1998, at 11.4 million (The General Population Census, 1998) which is lower than FAo estimation considered 12.5 million in 1998. However, Cambodian population thus doubled in the space of less than 40 years despite the decrease experienced between 1975 and 1979 during the Khmer Rouge period. The most recent estimate of population of Cambodia is 14.1 million. In 2003. The population remains predominantly (81%) rural. 88. Cambodia recorded a high population growth rate (2.49% per annum) during the 1990s compared to other developing countries in the region. Among AsEAN countries only Lao PDR had a similar population growth rate (2.90% per annum). 89. The population decline of about 6% during the Khmer Rouge years was followed by the 1979 famine. Since 1980, in spite of civil war and political instability, population growth exceeded the pre-war levels. The growth rate in the early 1980s is believed to have been the highest ever recorded for the country (MoP 2002). 90. The rapid population growth has naturally led to increased demand for water both in rural and urban areas. Population growth at this stage in Cambodia’s socio-economic development is considered a healthy trend by RGC and it is likely to continue. The Government sees its role as managing the country’s water resources and principal infrastructure in a way that steadily improves access of people to water.
4 The General Population Census of Cambodia (GPCC), 1998, by NIS-MoP/UNFPA

�� ��
Figure 4.2: Urban and Rural Population
0
2,000
4,000
6,000
8,000
10,000
12,000
14,000
16,000
1961
1964
1967
1970
1973
1976
1979
1982
1985
1988
1991
1994
1997
2000
2003
Po
pu
latio
n i
n 1
00
0's
Urban Population Rural Population Total Polulation
Rating: Low but Increasing Justification: Cambodia’s population has been increasing in both rural and urban areas resulting in increased demand for safe drinking water. The average annual growth rate of 2.5% is relatively high compared with other GMS countries.
4.1.4.TheResponse
Indicator: Urban and Rural Drinking Water Provision – 1998-2003
91. Expansion in drinking water provision to urban and rural areas in Cambodia is the composite of efforts made by the government as well as rural households acting on their own. Information exists for urban and rural areas of Cambodia as well as for the city of Phnom Penh. In the case of urban townships and Phnom Penh, “provision” is measured by the volume supplied (in m3) while for rural areas it is measured by the number of safe water outlets. 92. The volume of drinking water supplied to Phnom Penh increased from about 40 million m3 in 1998, to about 46 million m3 in 2003. In other urban areas taken together, the volume increased from 4.6 million m3 in 1998 to 8.8 million m3 in 2003. 93. For the country as a whole, the total volume of
urban drinking water supplied thus increased from 44 million m3 in 1998 to 55 million m3 in 2003 (see Figure 4.3). The expenditure on drinking water supply in Phnom Penh steadily increased from about US$ 4 million in 1998 to about US$ 10 million in 2003 (see Figure 4.4). 94. In rural areas, many people normally collected rainwater in large water jars during the wet season and use other means of water access during the remainder of the year – for many households, especially women and children. This may entail a long walk to fetch water. 95. Information on the volume of safe water available in rural areas is incomplete besides presenting several conceptual difficulties. The response is therefore more easily measured through estimating the number of drinking water facilities (wells, drilled wells, water basins, ponds and giant jars) available in the rural areas. Figure 4.5 plots their number between 1998 and 2003. 96. Groundwater reserves currently estimated at 17.6 billion m3 are an important potential source of water supply for rural Cambodia. They have been exploited only in part, mainly by shallow tube wells used for community water supply and irrigation (MoWRAM, 2001). Dug and drilled wells increased from 3,000 in 1998 to approximately. 15,000 in 2003. This five-fold increase, supported by internationally funded rural water supply and sanitation projects, demonstrates the

�� ��
Figure 4.3: Urban Drinking Water Provision (1998-2003)
0
10
20
30
40
50
60
1998 1999 2000 2001 2002 2003
Mill
ion
Cub
ic M
eter
s
PNH's Volumes Other Town's Volumes Total Urban Volumes
Figure 4.4: Expenditure on Drinking Water Supply in Phnom Penh – 1998-2003
0
2
4
6
8
10
12
1998 1999 2000 2001 2002 2003
Mill
ion
US
D
government’s commitment to improving rural water supply. Nevertheless it presents an incomplete picture of the rural drinking water infrastructure and a more comprehensive accounting for the entire expenditure on improved rural water supply is needed. 97. the United Nations Water conference recommended that Governments reaffirm their commitment made at Habitat II to adopt programs with realistic standards for quality and quantity to provide water for urban and rural areas.
Rating: Low and Consistent Justification: RGC has consistently invested in improving access to safe water to both rural and urban areas. Water supply projects have increased the volume of water and in rural areas, and diversified the type of access. However, the level of investment was clearly inadequate given the extremely low percentages of rural access in Cambodia. Comparisons with other GMS countries are difficult but possible to make, given the well developed WHO and UNICEF methodology, and these comparisons are unfavorable to Cambodia.

�� ��
4.1.5.Conclusions98. Whereas progress has been made in improving access to safe water in various parts of the country, the overall access to safe water remains low in Cambodia, and extremely low in rural areas. Considerable differences continue to exist between Phnom Penh and the rest of the country. Further efforts are needed to reduce this gap and bring Cambodia up to the world and GMS average. By itself, the rapidly growing population of Cambodia is not a major obstacle to improved water availability. 99. More systematic information needs to be collated of expenditure and details of improved water supply in rural areas of Cambodia. only when the extent of the problem is fully understood, will appropriate investments be allocated to improve the situation both from the national budget as well as internationally funded projects.
Rating: 1-STAR Justification: Access to safe water has improved in both urban and rural areas of Cambodia has improved but improved from an extremely low base. The target of rural population access to safe drinking water appears to have been achieved but the adequacy of the target deserves to be questioned. Cambodia has by far the lowest overall percentage of access to safe drinking water among all GMS countries.
4.2.WATERFORAGRICULTURE4.2.1.TheContext100. Cambodia’s economy is agrarian with about 85% of its population living in rural areas and most of them engaged in rainfed and subsistence agriculture with one crop a year. Agriculture accounts for 39% of Cambodia’s GDP (2001). Water plays an important role in agriculture productivity, largely coming from rainfall, and water extraction from the Mekong River. 101. The overall estimated water resources from the Mekong and tributaries are about 500 km3 per year but total withdrawals of water are estimated to be a mere 0.75km3, per year of which 94% is for agricultural purposes (see Table 4.2) (MRc, 2003; MoWRAM, 2001).
Table 4.2 Water Use by SectorSector Km3/year
Domestic 0.136Livestock 0.1Agriculture 0.455Industry 0.03Miscellaneous 0.079Total 0.75Source: MOWRAM, 2001
4.2.2.TheState
Indicator: Areas under Rice Cultivation 1980-2003
102. Given the dominance of irrigation in the overall pattern of surface water use in Cambodia, the area under irrigated rice was taken as an indicator of the state of surface water resources. 103. presenting 2003, the cultivable land area of Cambodia was approximately 4.8 million ha, or 26% of the total land area; about 2.3 million ha was rice paddy field. of this, about 2 million ha are under wet season cultivation. Both wet and dry season rice are irrigated where irrigation infrastructure exists. In other areas, the cultivation is rainfed. 104. The total area under rice cultivation increased significantly from 1.4 million ha in 1980 to 2.4 million ha in 2000 (Figure 4.6). The growth in the area under rice has led to increased demand for irrigation supplies, especially during the dry season despite the fact that only 16.6% of the total rice-growing areas were irrigated at the end of 1990s. Irrigation capacity is still low in Cambodia and the capacity to store water for the dry season is limited. Most agricultural areas continue to be rain-fed only. Irrigated areas produce approximately 40% of the total rice production (MoWRAM, 2001). Although the country is largely self-sufficient in food in an average or good year, seasonal and year-to-year variations in rainfall can easily upset the self-sufficiency. 105. The RGC’s “Socio-Economic Development Requirements and Proposals for 2001-2005” envisaged an increase in the irrigated area from 16.6% to 20% of the total by 2003, and an average rice yield of 2 tons per ha by 2001 (MoWRAM, 2001).

�� ��
Figure 4.6: Total Area under Rice Cultivation – 1980-2003
0
500
1,000
1,500
2,000
2,500
3,000
19
80
19
82
19
84
19
86
19
88
19
90
19
92
19
94
19
96
19
98
20
00
20
02
Tho
usan
d H
ecta
res
Wet Season Dry Season Total Cultivated Areas
Rating: Average and Stabilizing Justification: The area under rice cultivation has slowly but steadily grown from 1.4 million ha in 1980 to 2.3 million ha in 2003. Most rice producing areas are rain-fed only. The percentage of rice-growing areas regularly irrigated was 16.6% in the late 1990s. Increases in the rice-growing areas recorded in the last fifteen years exposed the limited capacity for irrigation water storage.
4.2.3.ThePressure
Indicator: Agricultural Population – 1980-2003
106. A growing population leads to a higher demand for food and land on which to grow food. Agriculture continues to be the principal user of surface water in Cambodia. Given these simple but powerful relationships, agricultural population was chosen as an indicator of the pressure on existing water resources usable by agriculture. 107. A Figure 4.7 plots the trend of agricultural population over the period of 1980 and 2002. on average, agricultural population increased by about 200,000 people every year.
Figure 4.7: Total Agricultural Population – 1980-2003
0
2,000
4,000
6,000
8,000
10,000
12,000
1980
1982
1984
1986
1988
1990
1992
1994
1996
1998
2000
2002
Pop
ulat
ion
in 1
000'
s

�6 ��
108. Within gMs (see table 4.3), cambodia is third ranked amongst the six GMS countries in terms of the proportion of the population which is termed agricultural. 109. The agricultural population in Cambodia, as shown in Figure 4.7, has grown at a rate of 2.4% per annum, inevitably increasing the demand for irrigation water. MAFF’s target for 2005-06 was to increase rice production by 18% from the 1999/2000 levels. Expansion of the area under irrigation is considered by RGC the principal means of achieving this target. 110. on the assumption that irrigation can contribute to a 50% increase in yields, MoWRAM estimated that an additional 180,000 ha of irrigated area would be required up to 2000-2005 (i.e. 36,000 ha per year). A number of irrigation rehabilitation projects are underway or under investigation, such as Stung Chinit (7,000 ha), but the total area still falls short of the aforementioned target (MoWRAM, 2001).
Rating: Medium and Increasing Justification: Demand for agriculture water has increased as population engaged in agriculture increases. Cambodia has the highest share of rural population in all of GMS countries. Indications are that the pressure on agriculture water demand from a growing population will continue to rise.
Table 4.3 Agricultural Population in GMS Countries, 2003
CountryAgricultural
Population (000)Non-Agricultural Popula-
tion (000)Agricultural Population %
Lao PDR 4,297 1,360 76Cambodia 9,747 4,397 68.9Thailand 29,269 33,564 46.6Myanmar 34,278 15,208 69.3Viet Nam 53,797 27,580 66.1PRC 851,028 460,682 64.9Source: FAOSTAT, Last update: 02 March 2005
4.2.1.TheResponse
Indicator: Expenditure on Irrigation System Construction and Maintenance, 1999-2003
111. This indicator gives a picture of the government’s (and donors’) efforts to improve the state of irrigated agriculture, the assumption being that increased expenditure for irrigation would increase the areas irrigated and ensure better maintenance of existing systems. There have been a number of assessments of the scope for irrigation extension and rehabilitation, and extensive investments by RGC and its development partners in recent years. 112. Agriculture is still the key economic driver in Cambodia, and improving the state of irrigation infrastructure an important element of overall efforts. In the five years from 1998 to 2003, the plan was to increase the percentage of irrigated lands from 16.6 % to 20% of total farmland, or about 4% annually (RGC, 1998-2003). 113. Information is only available since 1999, the year after the election that gave a measure of political stability to Cambodia. Most of the existing irrigation systems had deteriorated until then due to inadequate maintenance and lack of support for improved irrigation management. Government expenditure since 1999 has been significant, increasing from US$ 0.21 million in 1999 to US$ 50 million in to 2003 (see Figure 4.8). Data on average rice yields and percentage of lands irrigated are not yet available to determine how effective those investments have been.

�6 ��
114. Government support for the irrigation system construction and maintenance has amongst others included investment for drainage and flood protection works, dyke rehabilitation, canal building and maintenance and installation of pumping stations. This expenditure has been continuous though fluctuating from year to year.
Rating: Non-Comparable and Intermittent Justification: Most existing irrigation systems do not function well as a result of decay during the time of Khmer Rouge and insufficient budgets in the decade immediately following. The RGC has since increased expenditure to rehabilitate and construct new irrigation systems in an effort to increase the percentage and area of lands served by irrigation. During the period 1999-2003, RGC’s target was to increase the percentage to 20%.
4.2.2.Conclusions115. In a predominantly agrarian economy with rice cultivation as a major element, water availability becomes an important factor in determining Cambodia’s self-sufficiency in the crop as well as maintaining its contribution to national economy. For now, agriculture (including rice cultivation) in Cambodia is largely rain-fed.
Figure 4.8: Expenditure on Irrigation System Construction and Maintenance – 1999-2003
2.32
50.37
13.79
26.53
0.210
5
10
15
20
25
30
35
40
45
50
55
1999 2000 2001 2002 2003
(Mill
ions
) U
S$
116. The area under rice cultivation has steadily grown leading to greater demand for water. In addition, rural agricultural population continues to grow, adding to that pressure. over the years, government’s efforts have been directed at reducing the nation’s reliance upon rain-fed agriculture and expanding the irrigation network. This is demonstrated by the rise in government expenditure on the sub-sector that increased from $0.21 million in 1999 to $50 million in 2003. The percentage of agricultural land now irrigated is believed to have reached 20%.
Rating: �-Stars Justification: Cultivated land for both irrigated and non-irrigated cultivation has increased. Growth in rural population has added to the demand for water for agriculture. The RGC has been steadily increasing its agriculture sector expenditure in particular to improve the irrigation infrastructure systems and reduce the reliance on rain-fed agriculture. However, compared with several other GMS countries, Cambodia still has some way to go in expanding and modernizing its irrigation management.
ReferencesMinistry of Commerce (MoC). 2000. A Pro-Poor Trade Sector Strategy for Cambodia, Royal Government of Cambodia, Ministry of Commerce, Phnom Penh, Cambodia.

�� �9
MoWRAM, 2001. the cambodia Water Profile. Ministry of Water Resources and Meteorology, Royal Government of Cambodia, Phnom Penh, Cambodia. MRC, 2003. The State of the Mekong Report. Mekong River Commission, Phnom Penh, Cambodia. RGC. 2002. National Poverty Reduction Strategy 2003-2005. Council for Social Development, Phnom Penh, Cambodia. RGC, 2003. The Cambodian Millennium Development Report. Ministry of Planning, Royal Government of Cambodia, Phnom Penh, Cambodia. Who/UNIcEF JMP 2004. Meeting the MDg Drinking Water and sanitation target: A Mid-term Assessment of Progress. Geneva and New York. Available: www.wssinfo.org/pdf/JMP_04_text.pdf . 5. AGRICULTURAL LAND MANAGEMENT (LAND DEGRADATION) 5.1.TheContext117. The total land area of Cambodia is approximately 18.1 million ha, of which 2.7 million ha are cultivated under subsistence (Wb, 2002). An estimated 85% of the people live in rural areas; some 70% of the people live in the lowland provinces along the Mekong and the Tonle Sap, which occupy 25% of the land area of the country (UNDP, 1990). Most of rural population is engaged in agriculture as primary occupation and access to agricultural land is important for rural population. 118. Up to early 1970s, allocation of farmland presented few complications (Thion, 1993). Following the upheavals of the Khmer Rouge period and instability of the period immediately after that the situation became more complex. In 1989, the Government decided to redistribute land with ceilings of 0.2 ha per family for residential construction, and 5 ha for cultivated land, and awarded concession rights to plantation land greater than 5 ha (Wb, 2002). the decision resulted in land speculation. Coupled with poor implementation of the policy, the result was widespread dispossession of some peasants and various abuses. Arable land is clearly coming under pressure especially since 60% of the total
land area is under forest and is to remain under forest leaving only 40% of the total land area or about 7.2 million ha to be managed by about 11 million rural inhabitants, i.e. with about 0.68 ha of arable land per capita before deductions are made for areas occupied by settlements and infrastructure. RGC considers that Cambodia’s population density is still low. The concern addressed here is the extent to which the increasing demand for land resources can be accommodated through productivity increases rather than through expansion of farming into fragile, let alone protected, ecosystems. 5.2.TheState
Indicator: Average Rice Yield – 1961-2004
119. This indicator measures the changes in the productivity of cultivated lands helping to judge the degree to which greater pressure on land can be met without requiring further area expansion. Average rice yield data are available on an annual basis from 1961 to 2004. Rice is the staple food of Cambodia, providing 75% of the average daily caloric intake of Cambodian people. Most of the country’s agricultural land is used for rice production, employing 77% of the rural population. The RGC’s “Socio-Economic Development Requirements and Proposals for 2001-2005” sets a yield target of 2 tons/ha. 120. The average rice yield has approximately doubled over a period of 40 years, from about 1-1.2 tons/ha in the early 1960s to about 2.0 tons in 2004, broadly meeting the target of the RGC’s (Figure 5.1). However, the Cambodian average yields are the lowest of all GMS countries, reflecting a low percentage of lands regularly irrigated. Also, the yield increases have lagged behind the population growth. 121. The increase in rice yield in the 1990s is due mainly to higher fertilizer use and the adoption of improved varieties. Improvements to the irrigation network were too limited to have played a significant role.

�� �9
Figure 5.1: Rough Rice Yields in Metric Tons per Hectare – 1960-2004
0
0.5
1
1.5
2
2.5
1961
1965
1969
1973
1977
1981
1985
1989
1993
1997
2001
To
ns
pe
r H
ect
are
Rating: Relatively Poor but Improving Justification: Although the lowest in GMS, rice yields in Cambodia have shown signs of improvement since the early 1990s. Nevertheless it has taken about 40 years between 1960 and 2004 to increase rice yield from 1 to 2 tons/ha. Rice yields have lagged behind population increases recorded during the same period.
5.3.ThePressure
Indicators: Agriculture Land as Percent of Total Land – 1961-2002 Agricultural Land per Capita – 1961-2002
122. Availability of agriculture land, expressed either in per capita terms or as a percentage of total land area, is a simple and widely accepted way of describing the pressure on land resources. 123. Demand for farmland often comes into conflict with the demand for the same land from other segments of the economy, especially once limits are placed on further area expansion as they are in Cambodia by the official objective to keep at least 60% of the total land under forest. Figure 5.2 plots the long-term percentage of agricultural land in the total land area. That
percentage fluctuated over the years, from 20% of the total land in the 1960s to about 13-15% in the war years of 1970s and 1980s and back to 19% in the beginning of the 1990s with the return of political stability. 124. Since then, the share of agricultural land increased further to 29.3% of the total land area mainly as a result of forest clearance. Compared with its GMS neighbors, the share of agricultural land in Cambodia is among the highest. 125. While the percentage of agricultural land in the total land areas grew, agricultural land per capita has shown a reverse trend, due to the increase in rural population. Rural population in Cambodia accounts for about 84% of the national total. 126. Agricultural land per capita declined from 0.63 ha in 1961 to about 0.35 ha in early 1970s. (Figure 5.3). The figure began to increase in the late 1980s from 0.39 ha in 1985 to about 0.56 ha in 1990 as a result of the land redistribution program initiated by the Government of Cambodia that re-instituted private ownership of land. Since the beginning of the 1990s, however, the population explosion in the countryside took the per capita endowment back to where it was in the early 1970s. Important to note that, despite the decline, Cambodia’s per capita endowment of farmland is among the highest in GMS

�0 �1
Figure 5.2: Agricultural Land as a Percentage of Total Land Area – 1961-2002
0
1000
2000
3000
4000
5000
6000
1961 1966 1971 1976 1981 1986 1991 1996 2001
Th
ou
san
d H
ect
are
s
0
5
10
15
20
25
30
35
% T
ota
l La
nd
Are
a
Figure 5.3: Agricultural Land per Capita – 1961-2002
0
0.1
0.2
0.3
0.4
0.5
0.6
0.7
1961
1964
1967
1970
1973
1976
1979
1982
1985
1988
1991
1994
1997
2000
He
cta
res
pe
r C
ap
ita
Rating: Low but Increasing Justification: Cambodia used to be a land-abundant country. However, agricultural land per capita declined from about 0.65 per capita in 1961 to about 0.37 ha per capita in 2003 due to a rapid growth of the rural population and constraints placed on area expansion. The efficiency of land use has become an important policy consideration.
5.4.TheResponse
1st Indicator: Growth of Agricultural Irrigated Area 1961-2004
127. Provision of irrigation supplies is a standard response to potential scarcity of land. It normally involves creation of irrigation infrastructure to serve areas already farmed. In some cases, it may involve opening of new land for farming. As was mentioned earlier, the Government’s target is 20% of farmland irrigated by 2003.

�0 �1
128. Figure 5.4 provides the trend of irrigated agricultural area over a period of 40 years between 1960 and 2000 based on FAo data. The area irrigated increased from 62,000 ha in 1961 to 270,000 ha in 1994. 129. In 2000, MoWRAM estimated that a 180,000 ha increase in total irrigated area would be required by 2005 to reach Government objectives for the rural sector (MoWRAM, 2001). This translates into an increase of irrigated agricultural areas by about 36,000 ha per year. Most of this increase was to come from RGC’s program of rehabilitation of existing irrigation schemes. 130. To pursue the target, the RGC has nearly doubled the expenditure on irrigation construction, rehabilitation and maintenance between 2001 and 2003. The effectiveness of these investments is yet to be verified.
Rating: Significant and Intermittent Justification: Cambodia used to be a land-abundant country. However, agricultural land per capita declined from about 0.65 per capita in 1961 to about 0.37 ha per capita in 2003 due to a rapid growth of the rural population and constraints placed on area expansion. The efficiency of land use has become an important policy consideration.
Figure 5.4: Agricultural Irrigated Area – 1961-2003
0
50
100
150
200
250
300
1961
1964
1967
1970
1973
1976
1979
1982
1985
1988
1991
1994
1997
2000
10
00
He
cta
res
Irrigated Agricultural Area (1000 ha.)
2nd Indicator: Demined Areas 1992-2004
131. In Cambodian conditions, clearing farmland of unexploded ordinance (Uxos), is a way of adding to productive agricultural land besides its obvious role in reducing the risk to life and property. Most if not all of the land cleared of Uxo reverts to farming. Demand for land, especially agricultural land, has been increasing and will continue to do so. 132. Following the end of the civil war large areas of land had been put beyond use under the cover of landmines and lay abandoned. Cambodia Mine Action Center (CMAC) has been conducting land mine/Uxo de-contamination in Cambodia, so that the maximum number of people - predominantly rural but also urban - can go about their lives free from the threat of Uxo, thus permitting reconstruction, re-integration and development activities to take place in a safe environment, making further progress towards the target of zero landmine victims by 2020. 133. Figure 5.5 illustrates the total area under landmines cleared between 1992 and 2004. This increased steadily from 500 ha in 1992 to reach 12,000 ha in 2004. This amounts to approximately 1,000 ha of land recovered annually.

�� ��
Figure 5.5: Cummulative Demined Area – 1992-2004
0
2,000
4,000
6,000
8,000
10,000
12,000
14,000
92-93 92-94 92-95 92-96 92-97 92-98 92-99 92-00 92-01 92-02 92-03 92-04
He
cta
res
Cummulative De-mined Area since 1992
Rating: Significant and Consistent Justification: Cambodia Mine Action Center has been clearing mine-contaminated land at a rate of about 1000 ha annually. This has added meaningfully to the area of land available for farming besides eliminating the danger to life.
5.5.Conclusions134. The rate of increase of Cambodia’s rural population has been exceeding the rate of additions to farmland. Rapid population growth in 1990s in response to greater political stability and the end of civil strife has led to a healthy growth in agricultural output and a growing demand for farmland. Farmland is no longer as plentiful as it used to be and its per capita availability, though still comfortable by GMS standards, has been declining. Greater attention given to environmental protection and a determined action by RGC in establishing and expanding the system of protected areas, has placed limits on simple farmland area expansion. 135. Making land available for agriculture, especially for rice cultivation, therefore remains a challenge for Rgc. Land reform and re-institution of private ownership of farmland has been one element of RCG’s policy and attention to farmland
productivity has been the other policy element. Increasing the percentage of land area that is irrigated has played the central role. Investments in improved irrigation and irrigation rehabilitation have been stepped up, especially in the last five years. Average rice yields have been improving and are now at a historically high level of about 2 tons per ha.
Suggested Rating: � – STARS Justification: The total area of agricultural lands has been increasing in Cambodia as land reform and other complementary measures such as land de-mining have exerted a positive overall influence, although land conflict and land grabbing have not been adequately addressed. Because of a rapidly growing rural population, the per capita farmland availability has declined during the last decade and will probably decline further. RGC policy has appropriately made increased productivity through expansion of irrigation the cornerstone of its policy of reconciling the increasing demands for farmland with its environmental objectives. RCG’s budget has been re-oriented in line with the stated priority.

�� ��
ReferencesADB, 2003. ADB Draft Poverty Analysis: Executive Summary. Manila. ASEAN, 2000. ASEAN State of Environment Report 2000. ASEAN Secretariat, Jakarta, Indonesia. CDRI. 2002. Natural Resources and Rural Livelihoods in cambodia: A baseline Assessment, Phnom Penh, Cambodia. CDRI, 1998. Food security in an Asian Transitional Economy. The Cambodian Experiences. Phnom Penh, Cambodia. cDRI, 2000. Land ownership, sales and Concentration in Cambodia. A preliminary review of secondary data and primary data from four recent survey, September 2000. Phnom Penh, Cambodia. cDRI. 1999. Land tenure: hitting a stone with an Egg? Vol. 3, No. 3. Phnom Penh, Cambodia. cDRI 2000. Landlessness: A growing Problem, Vol.4, No. 4.Phnom Penh, Cambodia cDRI. 2001. An Assessment of Land ownership in Cambodia, Vol. 5, No.4. Phnom Penh, Cambodia. MoWRAM. 2001. National Water sector Profile Kingdom of Cambodia. Royal. Government of Cambodia. Phnom Penh, Cambodia. oxfam great britain. 1999. Where has All Land gone: Review of Land Issue Literature, May 1999, Phnom Penh, Cambodia. oxfam Great Britain. 2000. Interim Report on Findings of Landlessness and Development Information tool (LADIt) Research, sept. 1999 to April 2000. Phnom Penh, Cambodia. oxfam great britain. 2000. Landlessness and Development. Proceedings of National Conference on Landlessness and Development in Phnom Penh, 22-24 August 2000. Phnom Penh, Cambodia. RGC, MoP. 2001. Second Socio-Economic Development Plan (SEDP II) 2001-2005, Ministry of Planning. thion, s.1993. Watching cambodia, White Lotus: Bangkok UNDP.1990. Human Development Report 1990.UNDP Cambodia. Phnom Penh World bank. 2002. the Land Management and Administration Project, World bank, cambodia, January 2002. Unpublished
6. CLIMATE CHANGE 6.1.TheContext136. Cambodia has been a participant in the international debate about climate change, its causes and possible consequences. In a country with a costal zone the prime concern has been a possible impact of global warming and sea level rise on that zone as well as a possible effect on the seasonal patterns of rainfall. The principal consideration under this concern, however, is the extent to which Cambodia has acted upon its obligations under UNFCC. 6.2.TheState137. The status of climate change is determined by factors that are overwhelmingly outside the control of Cambodia or GMS authorities. In principle, a single report on climate change is prepared for the whole world by, organisations such as IPCC. For that reason, this EPA report does not attempt to formulate a separate state indicator at a national level. A general description of Cambodia’s climatic cycle is presented in the relevant factsheet. 6.3.ThePressure
Indicator: Greenhouse Gases Emissions – 1994
138. The quantity of greenhouse gas (GHG) emissions is taken as the indicator of pressure, i.e. the country’s contribution to global climate change. The three main greenhouse gases are carbon dioxide (Co2), methane (CH4) and nitrous oxide (N2o). As customary under UNFCCC reporting, the emissions are expressed in Gigagrams (Gg) of Co2 equivalent. 139. In 1994, Cambodia contributed about 68,000 Gigagrams (Gg) of Co2-equivalent emissions, primarily form land use change and forestry (LUcF) sector (see table 6.1). As can be observed, LUcF contributed approximately 81% of total GHG emissions, while agriculture and energy contributed approximately 16% and 3% respectively. The contribution of the industrial sector to total GHG emissions was insignificant. 140. However, Cambodia also sequestered almost 73,000 Gg of Co2-equivalent through land use change and forestry sector. Therefore, in 1994,

�� ��
Table 6.1: Past and Projected GHG Emissions by Sector – 1994-2020
Emissions1994 2000 2010 2020
Gg % Gg % Gg % Gg %Energy 1,853 2.8 2,622 3.6 4,780 5.9 8,761 9Industry 50 0.1 - - -Agriculture 10,560 15.5 12,030 16.4 17,789 22.1 26,821 27.5Waste 273 0.4 331 0.4 425 0.5 523 0.5LUCF 55,216 81.2 58,379 79.6 57,627 71.5 61,512 63Total Emissions 67,952 100 73,362 100 80,621 100 97,617 100Removal by LUCF -73,122 -67,118 -61,090 -53,769Net Emissions -5,170 6,244 19,531 43,848- Figures of 1994 were inventoried GHG Emissions (IPCC Methodology)- Figures of 2000-2020 were projected based on 1994.- LUCF – Land Use Change and Forestry.Source: Climate Change Enabling Activity Project, Ministry of Environment, August 2002.
Figure 6.1: Past and Projected GHG Emissions by Sector – 1994-2020
-100,000
-80,000
-60,000
-40,000
-20,000
0
20,000
40,000
60,000
80,000
100,000
120,0001
99
4
20
00
20
06
20
12
20
18
Gig
ag
ram
s in
CO
2 E
qu
iva
len
t
Energy Agriculture Waste
LUCF Total Emissions Removal by LUCF
Net Emissions
Cambodia was a net sink country. The overall assessment of Cambodia’s contribution to greenhouse gas emissions using global Warming Potential showed that Cambodia could offset approximately 5 thousand Gg of Co2-equivalents of global GHG emissions in 1994. 141. The results of the simulation analysis of GHG emissions and removals by sectors (see Figure 6.1 and Table 6.1) indicate that in 2000 Cambodia may have already been a net emitter of
GHGs with net emissions of approximately 60 thousand Gg of Co2-equivalent. In 2020, the net emissions were projected to increase to almost 100,000 Gg of Co2-equivalent. Among the sectors, LUcF would remain the main source of GHG emissions (63%), followed by agriculture (28%). Energy would only contribute approximately 9% of the total national emissions. Increase of GHG emissions by the agriculture sector would be higher than that of others

�� ��
sectors, from 16% to 28% of total national GHG emissions.
Rating: Low and Increasing Justification: By 2000, Cambodia had probably changed from a net GHG sink to a net contributor of GHG emissions. Agriculture and land use/forestry were the principal emitters. Projections are for net emissions to increase up to 2020.
6.4.TheResponse142. Cambodia ratified the United Nations Framework Convention on Climate Change (UNFCCC) in December 1995. The Convention entered into force in Cambodia in March 1996. 143. A Climate Change office was established in the MoE to provide technical information to the government about possible impacts resulting from climate change. A national greenhouse gas inventory had been completed shortly before that, in 1994, as a step towards implementing Cambodia’s commitments under UNFCCC. The donor community (gEF, ADb, Wb, UNDP, FAo, DANIDA, Belgian Government, German Government, and the European Union), and nongovernmental organizations played a decisive role in organizing the information related to GHG emissions, supporting small research projects and developing research capacity during the last decade. 144. The UNDP/GEF-funded CCEAP is the only project on climate change in Cambodia to date. A supplementary UNDP/GEF financing for Second National Communication was approved in early 2002. As a least developed country, Cambodia participated in a UNITAR-executed project “Building Human and Institutional Capacities to Address climate change Issues in Least-Developed Countries”. This project was complementary to information technology capacity building activities that were initiated by the CCEAP. The ADB’s Promotion of Renewable Energy, Energy Efficiency and GHG Abatement (PREGA) project is still at an initial stage. 145. There are other projects that are not normally considered climate change projects but can reduce GHG emissions, once implemented.
these include Wb/MIME “cambodia Renewable Energy Promotion Project”, JICA’s “Transport Master Plan of Phnom Penh” and DANIDA’s “Natural Resource and Environment Programme”. Preparation of several climate change-related project proposals is underway and will be submitted to potential donors for funding. 146. The Japanese New Energy and Industrial Technology Development organization (NEDo) has expressed interest in climate change projects under the Clean Development Mechanism (CDM). the Worldwide Fund for Nature (WWF) will possibly initiate its climate change programme in Cambodia with a focus on the linkage between climate change impacts and biodiversity in the Mekong drainage basin.
Rating: Low and Intermittent Justification: Climate change will increasingly become a concern for Cambodia as its economy expands. The current programs of donor-assisted studies and projects have helped created conditions for the formulation of necessary mitigation strategies.
6.5.Conclusions147. Climate change is recognized as a policy concern by the Cambodian authorities that have responded positively under Cambodia’s participation in UNFCCC. Because of the importance of land use change and forestry and agriculture in GHG emissions, attention has been directed mainly at them. Existing estimates of actual emissions are based on work conducted in 1994 and all remaining figures are only projections.

�6 ��
Suggested Rating: � – STARS Justification: Cambodia is a signatory to UNFCCC and initial efforts have been made to understand GHG emissions and other aspects of climate change as they relate to Cambodia. As Cambodia embarks upon the path of industrialization and urbanization, it will move from being a net “sink” to a net contributor of GHGs. The task ahead will be to adopt more stringent measures on controlling GHG emissions and creating an industrial base that respects climate change concerns. To enable Cambodia to fully and actively participate in the implementation of climate change convention, additional technical and institutional capacity building programs are very important.
ReferencesMoE. 2002. Cambodia’s Initial National Communication under the United Framework Convention on Climate Change, August 2002. Ministry of Environment, Phnom Penh, Cambodia. MoE & UNDP/GEF. 2001. Final Draft. Greenhouse gas Mitigation Analysis, Land Use, Land change and Forestry, and Agriculture. Cambodia Climate Chang Enabling Activities Project CMB/97/G31, Phnom Penh, Cambodia. MoE & UNDP/GEF. 2001. Final Draft. Vunlerability and Adaptation Assessment to Climate Change in Cambodia. Cambodia Climate Change Enabling Activities Project CMB/97/G31, Phnom Penh, Cambodia.

�6 ��
1. INTEGRATION OF ENVIRONMENTAL CONCERNS IN ECONOMIC DECISIONS 148. The primary objective of the Second Socio-Economic Development Plan (SEDP II, 2001-2005), the overarching development plan document for Cambodia, is to reduce poverty in the country through: (i) broad based, sustainable economic growth with equity; (ii) social and cultural development; and (iii) sustainable management and use of natural resources and the environment. SEDP II highlights the need to maintain macro economic stability and good governance to promote equitable and sustainable economic growth. SEDP II addresses most of the concerns assessed in the national EPA, particularly forestry, fisheries, water and land resources. Special emphasis is placed on the role of natural resources in supporting rural livelihoods and national economic growth. The need to balance local and national needs as well as ensure protection of the environment is recognized in the national development planning process. 149. In relation to land tenure and land titling, SEDP II emphasizes the need to rationalize existing land and natural resource law in order to create the basis for market driven agricultural development, and to resolve the growing numbers of land disputes. This requires strengthening the institutional capacity of the Department of Land Titling and improved land use planning and zoning based on economic and environmental considerations.
150. In fisheries, the SEDP II notes that both inland and marine catches have stagnated since 1992. However, aquaculture production has increased. The main strategy is to expand and improve rice-fish farming in lowland farming areas and further development of aquaculture combined with improved protection of aquatic resources from over-exploitation. It recognizes the stagnation of inland fisheries production due to over-exploitation, conversion of inundated forest into agricultural land, poor management and environment degradation. 151. For forestry, SEDP II notes that Cambodia’s forest resources if managed well could generate a sustainable flow of Government revenues of an estimated $100 million annually. A new Forestry Policy is being drafted that will take into account food security concerns and poverty alleviation and the potential of community based forestry for improved rural livelihoods. 152. SEDP II attaches considerable importance to good governance by advocating the implementation of the Governance Action Plan (GAP) (1998) which covers four crosscutting areas of judicial and legal reform, public finance, civil service reform and anti-corruption as well as two related issues of natural resources management and demobilization of the armed forces. In the context of natural resource management, good governance assumes added meaning. Forest sector management and the prevention of illegal logging are largely dependent upon the political and will of institutions such as MAFF.
cambodia national environmental Performance
assessment (ePa) rePort
3. crosscutting issues in an environmental Perfor-
mance assessment

�� �9
153. In addition to SEDP II, MoE’s National Environmental Action Plan (NEAP) deals in detail with sustainable development of forestry, biodiversity and protected areas, fisheries and floodplain agriculture in the tonle sap Lake. the annual inflow into Tonle Sap is essential for the national and subregional economy and the 1995 Agreement on Cooperation for Sustainable Development of the Mekong River Basin involving four out of six riparian countries assumes particular importance in this context. A Royal Decree on the Creation of the Tonle Sap Biosphere Reserve was issued in February 2001. 1.1.PolicyandInstitutionalIntegrationPolicyFramework154. The new Constitution tasks the State with ensuring rational use of natural resources and environmental protection. Legislation to support sustainable development exists and is centered on the Law on Environmental Protection and Natural Resources. other major environment-related acts are the Royal Decree on the Creation and Designation of Protected Areas, Land Law, Mineral Law, Forestry Law, Fisheries Law, Pollution Control Sub-decrees, and Sub-decree on Environmental Impact Assessment. others under preparation are: Wildlife Law and Law on Protected Area Management. 155. The first environmental act of Cambodia was the 1993 Royal Decree on the Creation and Designation of Protected Areas, which adopted the World conservation Union’s (IUcN’s) concepts of protected area management. It designated 23 areas of fragile and critical habitats constituting approximately 18% of the total area of Cambodia, one of the largest percentages in the region. The Government has since increased that area to 25% by establishing additional forest reserves. 156. the 1996 Law on Environmental Protection and Natural Resource Management contains the general principles to be followed by the Government in developing the legal basis of environmental management. the Law also requires the RGC to prepare national and regional environmental plans and formulate sub-decrees concerning a wide range of environmental issues, including environmental impact assessment,
pollution prevention and control, public participation and access to information. 157. Sub-decrees on water pollution control, solid waste management, air pollution control and noise disturbance, and environmental impact assessment (EIA) have recently been promulgated. A new Land Law was promulgated in 2001. other key pieces of legislation include the Forestry Law, Fisheries Law, Wildlife Law, and Law on Protected Area Management. 158. The Government is currently implementing major reforms in key natural resources management sectors, i.e. forestry, fisheries, and land. RGC’s campaign to prevent illegal logging and uncontrolled deforestation in Cambodia began in 1995. In 1996, a National Steering Committee to manage forest policy within the Department of Forestry and Wildlife was formed to steer the forest reform process. The drafting of the new forest legislation to govern the allocation and management of forest resources, began in 1998 and is on-going. The new legislation will include a new Forestry Law, a sub-decree on Forest Concession Planning, Management and Control, and a Sub-decree on Community Forestry. 159. Reform in the fisheries sector is currently underway with the introduction and expansion of community-based fisheries management. Land reform, which started recently, aims at supporting the poor by providing land titles and strengthening traditional land use rights. 160. The translation of the above legislative framework into detailed regulations and guidelines is far from complete and the regulatory gaps need to be closed if the legislative framework is to become fully functional. InstitutionalFramework161. Cambodia has made significant efforts to create institutions to support sustainable development. In 1993, the Government established the Ministry of Environment and gave it a broad mandate to promote environmental protection and conserve natural resources throughout the country. Two new ministries with direct mandates to ensure sustainable use of natural resources were created after the 1998 election, i.e., Ministry of Water Resources and

�� �9
Meteorology and Ministry of Land Management, Urban Planning and Construction. To support implementation of programs related to sustainable development, the Government has created several cross-sectoral National Committees, such as those for Biodiversity, Protected Areas, Coastal and Marine Management, and the Management of the Tonle Sap Biosphere Reserve. 162. The overall direction of the Ministry of Environment’s activities is an extension of the general principles to which the Cambodian Government is committed. These include: (i) recognition of the links between poverty and environmental degradation; (ii) commitment to a participatory approach to deal with environmental issues; (iii) acceptance of the need for an integrated approach to solving environmental problems; and (iv) importance attached to strengthening relevant institutions and awareness building. The Ministry of Environment is responsible for promoting environmental protection and conservation of natural resources throughout the Kingdom, contributing to improving environmental quality, public welfare, national culture and the economy. It facilitates the formulation and implementation of policies, plans and legal instruments relating to the use of the country’s natural resources. Simultaneously, the Ministry has the role of informing and motivating the public and supporting public participation in decision-making to resolve environmental and natural resource use issues. 163. The Ministry of Agriculture, Forestry and Fisheries (MAFF) has a significant role to play in sustainable development in Cambodia since its mandate covers the management of forest and fisheries resources. MAFF is engaged in the development of policies and strategies for agriculture, forestry, and fisheries that have significant implications for the management of the water resources required for irrigation and capture fisheries/aquaculture.
164. the Ministry of Land Management, Urban Planning and construction (MLMUPc)5 established in 1998 is responsible for land management, urban planning, construction and titling, in coordination with other ministries. MLMUPc’s responsibilities extend to industrial zoning, and resolution of conflicts relating to mapping and land titling. 165. In the water sector, the principal vehicles for inter-agency cooperation are the Cambodian National Mekong Committee, the Ministry of Economy and Finance, and the Council for the Development of Cambodia. The Cambodia National Mekong Committee (CNMC) is a national institution formed as a response to the 1995 Mekong Agreement to coordinate the work of 10 ministries6 related to policy, management, conservation, rehabilitation and research involving water and related natural resources of the Mekong River Basin. 166. In addition, the Ministry of Water Resources and Meteorology (MoWRAM) was established in 1998. Its responsibilities include development of strategies and plans for water resource development and conservation, managing common water resources, mitigating water-related disaster and conducting research and monitoring of water resources. 167. Cambodia’s National Biodiversity Strategy and Action Plan was completed in 2001 but many of its recommendations remain unimplemented. This situation, however, is not unusual given the status of NAPBC in most GMS countries as documents prepared in response to the country’s international obligations under UNCBD rather than a document tight woven into the Government budget and Public Investment Program. Important in the present context is the ongoing UNDP/GEF Cambodia National Capacity Self-Assessment for Global Environmental Management (2004-2006) conceived to coordinate responses to the threats of biodiversity loss, climate change, and land degradation. The
5 MLMUPC has five departments, namely (1) Administration, (2) Land Management and Urban Planning, (3) Construction, (4) Cadastre and Geography and (5) Inspection.
6 These ministries include Ministry of Public Works and Transport, Ministry of Water Resources and Meteorology, Ministry of Environment, Ministry of Agriculture Forestry and Fisheries, Ministry of Foreign Affairs and International Cooperation, Ministry of Industry, Mines and Energy, Ministry of Planning, Ministry of Land Management, Urban Planning and Construction, Ministry of Rural Development, and Ministry of Tourism.

60 61
project is overseen by the National Biodiversity Steering Committee (NBSC). Chaired by the Minister for Environment and vice-chaired by the Secretary of State for Agriculture, Forestry and Fisheries, the Committee with its 15 members plus 3 members from MoC, MoH, and MEF, represents a serious attempt at institutional integration. 168. Each of the key ministries has departments at the provincial level within a structure headed by Provincial governors (who are responsible to the Minister of the Interior). Provincial departments receive their budget allocations from their parent ministries and in principle receive technical support from and report to them. However, their linkages to national parent ministries are often overshadowed by those within the provinces, with a balance of advantages and disadvantages this represents. Coordination among ministry/departmental staff at provincial level may be stronger than at national level, because of more immediate oversight by governors. Coordination is particularly strong in the context of project implementation at Provincial and local levels, e.g. of projects like PRASAC. Provincial Rural Development Committees also provide a coordinating mechanism, at provincial level. 169. Cross sector activities in the environment field are carried out mostly through international funded projects and coordination or steering committees created to facilitate these projects’ implementation. The work of such committees is usually donor-funded. 170. With a high level of involvement of international organizations (Ios) and NGos in Cambodia’s water sector, coordination of their activities with those of government agencies is a major issue. The Government has expressed dissatisfaction with the extent to which many NGos and Ios operate quasi-independently, and outside the framework of the SEDRP and PIP. However, much of the NGo/Io activity is administered through provincial-level agencies. A consequence of weak inter-agency coordination is that NGo/Io interventions themselves are frequently also not well coordinated (despite the existence of three NGo umbrella agencies and six sectoral committees). An example in the water sector is the weak coordination between the
national strategy for agriculture developed by MAFF/FAo/UNDP before 2001 and the directions developed since then by MoWRAM and several Ios that channel their assistance through MoWRAM. 171. The Environment Impact Assessment (EIA) process was officially launched in Cambodia in March 2000, providing a framework for assessing the environmental impacts of development projects. EIA is an important legal tool for environmental assessment and planning aiming at safeguarding the environment at each stage of project or program development. MoE’s Department of EIA is responsible for the implementation of EIA Sub-decree and to do this, it needs to collaborate with other departments within the MoE and other ministries. The EIA procedures embody a principle of initial screening that determines the intensity of subsequent environmental assessment and is modeled on practices common worldwide. EPAManagerInstitution172. The preparation of the present EPA and the continuity of the EPA process has raised the question of who should be responsible for future EPAs in cambodia. With its broad mandate for environmental management and conservation and experience acquired during the preparation of the current EPA, MoE seems the natural home of future EPAs. Within MoE, various departments have responsibility for environmental management including the Department of Natural Resources Assessment and Environmental Data Management (DoNRAEDAM) and Department of Environment Impact Assessment (DEIA). The Department of EIA is responsible for assessing the impacts of projects on the environment while DoNRAEDAM is responsible for the overall assessment of performance related to the environment management. DoNRAEDAM is also equipped with the facilities for GIS, mapping and data analysis. 173. Within the MoE “home”, the Department of Natural Resources Assessment and Environmental Data Management would be responsible for the EPA task, in association with MoE technical departments and in conjunction with concerned institutions. 174. As MAFF also plays a vital even if indirect role in environmental management, MAFF should

60 61
have a role in the conduct of future EPAs. Department of Fisheries, Forestry Administration and other departments under MAFF could play an important role in EPA and provide essential inputs. 1.2.EnvironmentalExpenditureandFinancing175. The RGC’s combined budget resources are limited and this is reflected in budget allocations to the agencies directly or indirectly involved in environmental management. Table 1 summarizes the expenditure incurred by various sectors over the period 1995-2003. Environmental management does not receive a separate allocation and instead, its elements are found mainly under agriculture and marginally under other expenditures. Even without unraveling the details, the totals make it clear that financial resources for environment management are a very small percentage of the total. 176. Table 2 shows MoE’s budgets for the period 2001-2003. Within its modest totals, the bulk of expenditure is for administration, staff salaries and support of provincial departments. 177. In these circumstances, it is not surprising to learn that most development activities in fields such as biodiversity conservation and protected areas management, climate change, as well
sustainable fisheries and forest management are funded by international donors. 178. Foreign aid financed about 75% of the US$100 million capital expenditure in 1998 as well as a large program of Technical Assistance (TA), budgetary support and emergency relief. In 2001, donors pledged a total of around US$645 million to Cambodia. Several major aid agencies are involved in development activities in Cambodia. Japan, the largest donor, mainly supports construction of bridges, roads and ports, power and health care. ADb, the World Bank, the United Nations agencies, the European Commission, Sweden, France, Australia, DANIDA, and about 400 non-government organizations are working in Cambodia. 179. Environment and conservation receives an allocation of 3.6% split roughly equally between investment projects (notably construction of a new sanitary landfill for Phnom Penh and sustainable development of coastal wetlands) and technical assistance projects for capacity building in environmental management. The Ministry of Environment has been receiving support from international donor agencies since its birth in 1993 and has since implemented a number of different environment-related projects, in some cases jointly with other line ministries.
Table 1: Expenditure by Sector, Central Government (Million Riel)
1995 1999 2000 2001 2002 2003General public service 72.6 133.7 187.9 253.7 268 285Defense 456.1 473.5 455 404.4 423 413Education 77.9 166.8 183.2 212.3 268 323Health 26.1 76.3 121 130.3 149 202Social security and welfare 37.6 25.4 26.9 29.6 30 33Housing and community amenities 0 0 0 0 0 0Agriculture 13.1 24 26 31.4 38 34Industry 4.7 5.3 6.1 6 6.9 8Electricity, gas and water 0 0 0 0 0 0Transport and communication 18.7 83 41.9 61.4 66 57.7Other services 18.9 38.3 10 78.4 73.1 81.3Others 11 83 71 47.1 243 319Total 736.7 1109.3 1129 1254.6 1565 1756Source: ADB, 2004

6� 6�
Table 2: Ministry of Environment Budget, 2001-2003 (Million Riels)
Expense CategoryAmount
2001%
Amount 2002
%Amount
2003%
Salaries 670 13.9 790 11.3 1,230 14.2Administration and small scale repairs
2,390 49.8 4,370 62.6 5100 58.8
Social and cultural expenses 110 2.3 100 1.4 100 1.1Provincial Department budgets 1,600 33.3 1,680 24.1 2,195 25.3Contributions 30 0.6 40 0.6 50 0.6Total 4,800 100 6,980 100 8,675 100Source: MoE Strategic Plan 2004-2008
Table 3: Ongoing International Assistance for Environmental Program in Cambodia
Program DonorAmount
(US$)Year
Tonle Sap Environnemental Management Project ADB 15,000,000 2003-2008Biodiversity Management and Conservation in the Tonle Sap Bio-sphere Reserve
UNDP 4,000,000 2003-2008
Environmental Management of the Coastal Zone (Step III) DANIDA 3,170,000 2002-2006Capacity development for the Clean Development Mechanism (CDM) GEF 305,000 2003-2004Formulation of the National Adaptation Program of Action to Climate Change (NAPA)
GEF 199,500 2003-2006
Community Forestry research Project in Cambodia (Phase III) IDRC 234,000 2003-2006Development of Bio-safety Framework UNEP/GEF 223,000 2004-2006WWW Conservation Program in Cambodia WWF.USA 3,515,000 1999-2006Biodiversity and Protected Area Management WB/RGC 4,910,000 2000-2002Support in the Installation of Additional Equipment for LAB JICA 2,500,000 2001-2004Strengthening the Industrial Pollution Monitoring DANIDA 500,000 2002-2006Stung tren RAMSAR Site Management GEF 300,000 2001-2003Support Program for LAB French 20,964 2002-2003Basel Project Basel 39,342 2003-2004Ozone Project UNEP 130,000 2002-2005POPs Project UNEP/GEF 490,000 2003-2005Capacity Strengthening and development in Urban Waste Manage-ment
DANIDA 200,000 2001-2006
Total Budget 35,736,806Source: MoE, 2004

6� 6�
180. The UNDP provided early support to environmental education and awareness building under the “Environmental Technical Advisory Program (EtAP)”. the World bank also provided support for a forest reform and underwrote the preparation of the National Environmental Action Plan in 1998. U.K.’s Department of International Development (DFID) has contributed significantly to fisheries management in Cambodia. The ADB provided support for marine and coastal management in the early 1990s. In the mid-1990s, ADB launched a GMS-wide program of technical assistance supporting also long-term capacity building in environmental management (the present SEF II Project one of its recent components). Many other agencies and international NGos have contributed financially and otherwise and their full listing is not attempted here. 181. Instead, Table 3 contains only the largest recent donor-funded projects in the environment management sector. It is estimated that more than US$35 million are being currently (2003-2006) spent in Cambodia for environment-related projects; mostly implemented by MoE. This total does not include activities funded under DANIDA’s subregional fund for fisheries management implemented by MRC and a similar fund for forestry established by GTZ. ADB’s assistance to Ministry of Water Resources and Meteorology, especially for the preparation of a water resource management strategy is also not included. 182. International assistance has long played a key role in supporting environment management in Cambodia but coordination between the funding agencies is poor and leads to overlapping projects and agendas. In terms of state-of-the-environment assessment and reporting an initial assessment was prepared in 1994 by UNDP. In 2004, DANIDA sponsored an update due for completion in 2005. The current EPA with its different approach explained in Part II of this report is the first of its kind in Cambodia. 2. IMPLEMENTATION ISSUES 183. In spite of various institutional and financial constraints, RGC has been making steady progress in several dimensions of the country’s environmental management. Key legislation
targeting environmental concerns is in place or is being finalized. other legislation being revised includes the Fisheries Law, Water Law and the Wildlife Law. No legislation is perfect and most needs periodic revision even in the best of circumstances but, at least the obvious gaps that once marked Cambodian legislation, are no longer present. 184. Implementation of environmental policies is constrained to a large degree by lack of financial resources, limited capacity and poor inter-agency coordination. This is a major challenge for the RGC, especially the MoE which has a critical role to play in harmonizing the approach to environmental management in the country. The Environmental Law (1996) makes it MoE’s responsibility to ensure adequate coordination with other relevant ministries such as MAFF, MoWRAM, MIME, MLMUPc. however, the technical and other resources of MoE are not always sufficient to discharge this task adequately. 2.1.RegulatoryandEconomicInstruments185. The regulatory framework for environmental management in Cambodia is becoming more comprehensive by the day as mentioned earlier. The challenge now is to effectively implement and enforce these regulations. 186. In terms of the command and control approach to environmental management, most Cambodian laws contain articles either specifying charges for different forms of use or fines for violations of regulatory provisions. For instance, the Forestry Law (2002) allows transport of forest and non-timber forest products under permits issued by the Forestry Administration (Article 69). the Law also utilizes the system of fines for offenders who violate the relevant provisions (article 90 to 101). the Fisheries Law (1987) classifies fishing operations into commercial, medium and small scale so as to regulate the sector. the Fisheries Law applies a permit system and provides for payments for the transportation of fisheries products as well. Land Law uses the permit system as a basis of temporary land concessions of up to 10,000 ha against payments of rental fees to the government. (Land Law, Article 48 to 59).

6� 6�
187. A Sub-decree on EIA identifies projects that are subject to EIA e.g. all types of garment factories, forestland concession and processing industry, land concession, agriculture concession and tourist development. All forest concessions and land concession greater than 500 ha are subject to EIA provisions. 188. the sub-decree on solid Waste Management and Sub-decree on Air Pollution Control and Noise Disturbance creates a permit system to control and manage solid waste and pollution. The two sub-decrees refer to public health and Who standards although exact benchmarks are not provided. A Sub-Decree on solid Waste Management restricts the trans-boundary movement of hazardous waste in compliance with the Basel Convention. 189. While these regulatory and economic instruments exist, the effectiveness of their use remains low. This is due mostly to lack of appropriate technical and institutional capacity in the government. Institutions lack the necessary technical know-how and equipment often needed to implement the regulatory provisions. Lack of budget is a major, though not the sole, cause. 2.2.Enforcement190. As mentioned earlier, enforcement of regulations and policies remains a weak link in the chain to improved environmental management. Key factors include weak institutional capacity of the responsible agencies; multiplicity of authorities and overlapping mandates. In spite of these problems,, some advances have been made and groundwork is being laid for further improvements. The preparation of this EPA report has, among other factors, demonstrated that despite various limitations discussed above, RGC and its agencies can organize information in a purposeful manner in support of environment performance monitoring. This is a good beginning. 191. In forestry, the RGC has adopted appropriate measures that led to cancellation of poorly performing forest concessions and a more disciplined approach to forest concession supervision. The requirement for forest concessionaires to develop a management plan including environmental protection and community forestry elements indicates that RGC
has endeavored to adopt a balanced but firm approach in forest concession management and further reform of the sector. 192. The RGC has undertaken reforms in the fisheries sector as well, releasing 56% of the commercial fishing lot areas for community fisheries development reinforcing fisheries management and protection of aquatic resources. In the water sector, the RGC has undertaken measures to improve drinking water provision for both urban and rural areas. The RGC also plans to rehabilitate and build new irrigation systems to improve rice and agricultural production. Land management has seen reforms as well including land registration and private ownership. 193. Despite these advances it is recognized that effective implementation of policies and enforcement of regulations has some way to go. Improving internal consistency of policies, laws and regulations related to some of the priority concerns addressed in the EPA would facilitate this journey. Some examples of inconsistencies are presented below:
• the Law on commune Administration, Article 43 assigns the responsibility for protection and conservation of natural resources to Commune Councils, but Article 45 indicates that Commune Council has no authority over forest.
• the Law on Environmental Protection and Natural Resource Management assigns the overarching role and responsibility for environment protection and management to MoE. However, there are institutional and regulatory overlaps with Forestry Administration and the Department of Fisheries of MAFF that also have a mandate on forestry, fisheries and water resources. MoE’s jurisdiction extends to 23 protected areas declared by the Royal Decree in 1993. MAFF, at the same time, has the overriding authority on forest and fishery including protected forests.
• Within Forestry Administration in MAFF, a Community Forestry Unit has been established to facilitate community forestry development. A similar unit has been set up in the MoE. It is questionable whether MoE’s Community Forestry’s office uses the

6� 6�
Environmental Law or the sub-decree on community forestry to enforce the principles of Community Forestry.
• In the tonle sap Lake, three sites designated as Biosphere Reserves namely Prek Toal, Boung Tonle Schmar and Stung Sen, are included in the 23 protected areas list. However, the same areas are also listed among the Department of Fisheries’ fishing lots, making parts of the areas potentially available for auctioning off to fishing operators. This raises the question of enforcement jurisdiction of MoE and DoF over the same area. Likewise, several national parks (such as Bokor, Kirirom, and Boeung Per) are located inside valid forest concessions.
• MoWRAM is responsible for water resource management and has planned irrigation systems throughout the country e.g. the Stung Chinit Irrigation Project being built under a loan from the ADB. other schemes have been proposed such as the Northwestern Irrigation Project in the floodplain of the tonle sap Lake. however, the Fisheries Law (1987) prohibits any form of irrigation activity inside the floodplain as it could impact on the fishery habitats in the floodplain. This is a case where DoF and/or MAFF need to work more closely with MoWRAM to address any potential conflicts and impacts arising from such development.
• the Land Law and sub-decree on EIA apply to land concessions of up to 10,000 ha. These regulations were adopted after concessions much larger than 10,000 ha had been granted to private concessionaires. This raises the issue of enforcement and monitoring limits set by these regulations. The RGC has now drafted a Law on Economic Land concessions which addresses the issues of large forest and agricultural land concession allocation of such type. The draft is yet to be adopted.
• Areas of potential conflict also exist between national and provincial level authorities. In the case of community fisheries and forestry, for instance, key initiatives have been adopted by the agencies at the local level;
however technical support and legal sanction from the national offices are not readily forthcoming. The coordination between provincial level and national level is poor, especially in resource management.
194. Given Cambodia’s natural resource wealth, its vulnerability to conflicting demands is understandable. As RGC’s sustainable development agenda matures, it is expected that the regulatory framework and institutional roles will gain in coherence. Community participation will take a firmer hold as time progresses as RGC’s community based natural resource management programs become more securely integrated into the development planning process and the Cambodian Millennium Development Goals framework. 3. ENVIRONMENT AND CIVIL SOCIETY 195. Civil society plays an important role in environmental and natural resource management in Cambodia. Sustainable use of natural resources demands such a role. Directly or indirectly, NGos have affected environmental management in Cambodia for some time. The NGo forum in Cambodia is made up of local and international non-governmental organizations grounded in their experience of humanitarian and development assistance to Cambodia. The NGo Forum exists for information sharing, debate and advocacy on priority issues affecting Cambodia’s development. The NGo Forum highlights the impact of development processes and economic, social and political changes on Cambodians. It has several programs under its purview including those with important repercussions for land use, livelihood and natural resource conservation. 196. The NGos have been active participants in the shaping and implementation of the national sustainable development agenda. Besides various forms of field involvement, not least in education and environmental awareness, the NGos have regularly commented on many aspects of the nation’s quest for sustainable development. These reports have sometimes been critical and harsh. Yet the overall impact has been positive, the constructive elements and the often good knowledge of local conditions outweighing the less constructive and ideological ingredients.
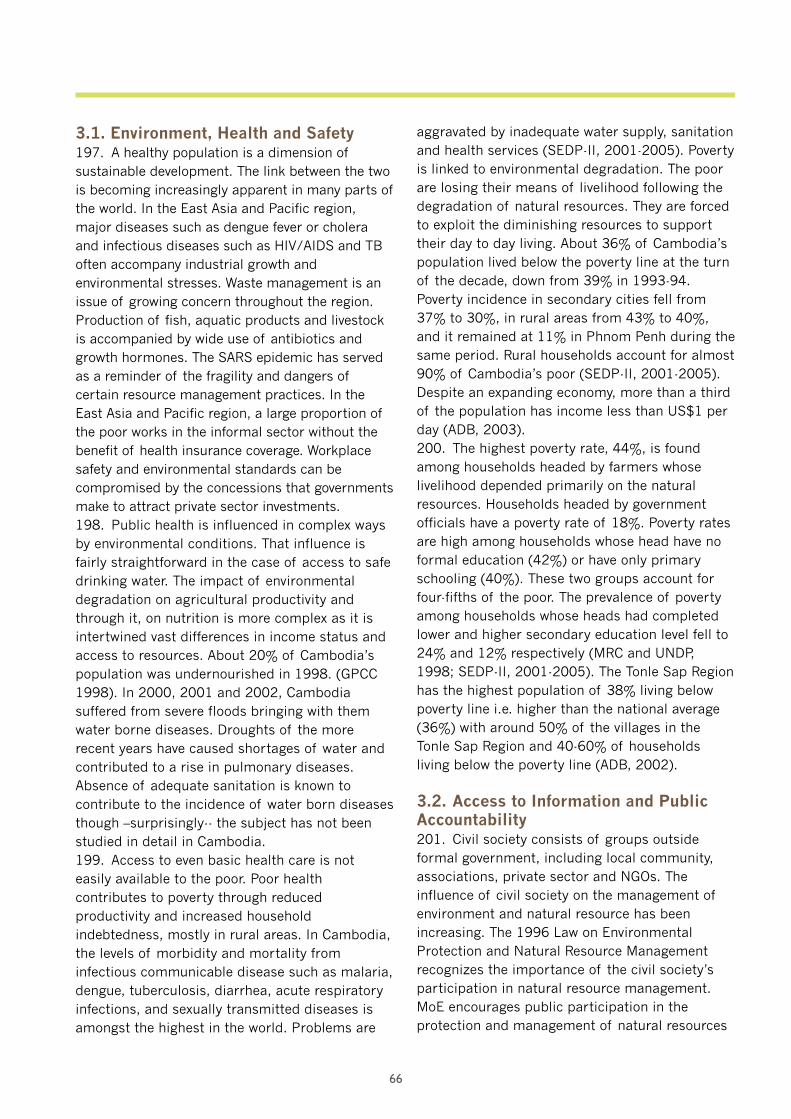
66 6�
3.1.Environment,HealthandSafety197. A healthy population is a dimension of sustainable development. The link between the two is becoming increasingly apparent in many parts of the world. In the East Asia and Pacific region, major diseases such as dengue fever or cholera and infectious diseases such as HIV/AIDS and TB often accompany industrial growth and environmental stresses. Waste management is an issue of growing concern throughout the region. Production of fish, aquatic products and livestock is accompanied by wide use of antibiotics and growth hormones. The SARS epidemic has served as a reminder of the fragility and dangers of certain resource management practices. In the East Asia and Pacific region, a large proportion of the poor works in the informal sector without the benefit of health insurance coverage. Workplace safety and environmental standards can be compromised by the concessions that governments make to attract private sector investments. 198. Public health is influenced in complex ways by environmental conditions. That influence is fairly straightforward in the case of access to safe drinking water. The impact of environmental degradation on agricultural productivity and through it, on nutrition is more complex as it is intertwined vast differences in income status and access to resources. About 20% of Cambodia’s population was undernourished in 1998. (GPCC 1998). In 2000, 2001 and 2002, Cambodia suffered from severe floods bringing with them water borne diseases. Droughts of the more recent years have caused shortages of water and contributed to a rise in pulmonary diseases. Absence of adequate sanitation is known to contribute to the incidence of water born diseases though –surprisingly-- the subject has not been studied in detail in Cambodia. 199. Access to even basic health care is not easily available to the poor. Poor health contributes to poverty through reduced productivity and increased household indebtedness, mostly in rural areas. In Cambodia, the levels of morbidity and mortality from infectious communicable disease such as malaria, dengue, tuberculosis, diarrhea, acute respiratory infections, and sexually transmitted diseases is amongst the highest in the world. Problems are
aggravated by inadequate water supply, sanitation and health services (SEDP-II, 2001-2005). Poverty is linked to environmental degradation. The poor are losing their means of livelihood following the degradation of natural resources. They are forced to exploit the diminishing resources to support their day to day living. About 36% of Cambodia’s population lived below the poverty line at the turn of the decade, down from 39% in 1993-94. Poverty incidence in secondary cities fell from 37% to 30%, in rural areas from 43% to 40%, and it remained at 11% in Phnom Penh during the same period. Rural households account for almost 90% of Cambodia’s poor (SEDP-II, 2001-2005). Despite an expanding economy, more than a third of the population has income less than US$1 per day (ADB, 2003). 200. The highest poverty rate, 44%, is found among households headed by farmers whose livelihood depended primarily on the natural resources. Households headed by government officials have a poverty rate of 18%. Poverty rates are high among households whose head have no formal education (42%) or have only primary schooling (40%). These two groups account for four-fifths of the poor. The prevalence of poverty among households whose heads had completed lower and higher secondary education level fell to 24% and 12% respectively (MRC and UNDP, 1998; SEDP-II, 2001-2005). The Tonle Sap Region has the highest population of 38% living below poverty line i.e. higher than the national average (36%) with around 50% of the villages in the Tonle Sap Region and 40-60% of households living below the poverty line (ADB, 2002). 3.2.AccesstoInformationandPublicAccountability201. Civil society consists of groups outside formal government, including local community, associations, private sector and NGos. The influence of civil society on the management of environment and natural resource has been increasing. the 1996 Law on Environmental Protection and Natural Resource Management recognizes the importance of the civil society’s participation in natural resource management. MoE encourages public participation in the protection and management of natural resources

66 6�
(Article 16). The 1998 National Environmental Action Plan was formulated with inputs from representatives of civil society (as well as international agencies like UNDP, World bank and IUCN). 202. The preparation of the National Biodiversity Strategy and Action Plan, too, benefited from inputs by large sections of the civil society. The Plan recognizes that success is likely to rest to an important degree on the involvement of the local populations in critical decisions affecting biodiversity. The drafting of SEDP II is yet another example of a wider consultation effort that took place during the period 2001-2005. To gain a deeper understanding of the lives of the poor, 169 focused group discussions were convened among low-income groups in 154 villages throughout rural areas and 15 non-rural socially disadvantaged groups. This face-to-face method of working was an innovation that the Government has since adopted more widely to supplement formal surveys. 203. the Forestry Law, sub-decree on community Forestry and Fisheries and Draft Fisheries Law were widely discussed with local community representatives, NGos and the private sector, even if the quality of civil society representation left something to be desired. 204. In general, participation of stakeholders is promoted by various projects, depending on the nature of the project and the institutions involved. Most donor-funded projects actively encourage stakeholder participation. However, the question of participation’s quality and real influence on decision-making or design of a project still needs to be firmly established. Also, the question of the type of consultation that might be appropriate (or even mandatory) for private sector-led projects involving resource management (e.g. tree crop plantations) is yet to be answered. 205. Despite widening consultation, access to environmental information remains limited in Cambodia. Release of information held by government agencies requires permission and authorization from various levels of government authority. The process is slow and frustrating. 206. Information exchange within the NGo community is more open (and often used by the Government especially in reporting to the donors).
It is organized around networks such as the NGo Forum, the Cooperation Committee for Cambodia, the Environmental NGo Network, the Fisheries NGo Network, the Forestry NGo Network and the Agriculture NGo Network. 3.3.EnvironmentalAwarenessandEducation207. Public awareness about the environmental problem is increasing. The media have been widely covering the environmental problems ranging from forest to fisheries and from water to wastewater. In the MoE, there is a Department of Environment Education. In 1998, the Department worked closely with UNDP’s Program on Environmental Technical Advisory Program (ETAP) to raise public awareness of environmental issues. The Program was instrumental in the Government’s decision to include environmental matters into the primary school curriculum. 208. ETAP supported 12 NGos to work on monk environmental education in collaboration with the Department of Environment Education of MoE. These NGos have programs to provide environmental education in various provinces of Cambodia using monks as leaders. The NGo network on monk environmental education has produced a book called the ‘Cry of the Forest’ in which Buddhist religious concepts are used to explain environmental problems and seek environmental improvement through the Buddhist way of life. 209. The Environment Day is celebrated every year on 5th June in an effort to raise awareness of environmental issues. The Environment Day activities are extended to the provincial levels as well. NGos work closely with the Ministry of Environment to implement these activities at the grassroots level. The local NGo known as Mlup Baitong has developed a radio program on the environment that often raises pertinent local issues such as over-fishing, deforestation, wildlife poaching and land degradation. 210. For higher education, the Department of Environmental Science was set up in 2000 at the Royal University of Phnom Penh to provide bachelor-level degree courses in environmental sciences.

6� 69
211. The natural resources of Cambodia are under pressure from different segments of the society in an expanding economy and in conditions of rapidly growing population. In a still mainly rural based country the brunt of economic growth is likely to be borne by the natural and biological resources unless suitable safeguards are built into existing policies and institutional arrangements. 212. Supported by international donors, the RGC has been taking steps to address the environmental and sustainability issues and draw a balance between economic growth and environmental protection. However, more work is still required. Management of natural resources (especially fish and forests) is undergoing a difficult transition from a revenue-driven to sustainability-oriented approach. The share of national budget devoted to environmental management is low relative to the values at stake. Cambodia continues to rely on the donor community for most of its environmental funding. 213. Civil society and the NGos are emerging as an important voice in the implementation of the environmental and sustainable development agenda in the country. However, their contribution to environmental protection is still limited at the central level and constrained by insufficient decentralization of natural resource utilization decisions. 214. With cambodia more clearly moving in the direction of a market economy, the need for environmental safeguards has become
cambodia national environmental Performance
assessment (ePa) rePort
4. conclusions and recommendations
increasingly apparent. The road to improved environmental performance in Cambodia passes through a more complete integration of environmental concerns into sectoral and economic decision-making, improved institutional capacity, policy development and involvement of civil society in environment management together with greater budget support for environmental management. The sections below highlight the key conclusions of the assessment of Part 2 of the report and make recommendations. 1. FORESTRY RESOURCES 215. Part II described the success of the country’s authorities in meeting, ahead of schedule, their target of maintaining the forest cover of at least 60% between 2005 and 2025. Part III mentioned some of the institutional improvements. However, this progress needs to be consolidated and, furthermore, the quality of the assessment in future EPA’s can be further improved. The following recommendations are made: A.TheEPAprocessanddata1) Future assessments should contain information about the quality of the standing forest, not merely about the area defined to be “under forest”. The quality parameters of greatest relevance include the percentage of canopy cover and suitably organized information about the composition of the standing stock.

6� 69
2) Cambodia may want to take the lead in (finally!) working towards GMS-wide comparability in the one area (i.e. forest cover) that is of the greatest public interest in each of the countries and globally. This is not an easy task technically and bureaucratically but the status quo (no or little comparability) seems less defensible with each year that passes by. 3) Cambodia seems to have somewhat better data on the habitat composition of different protected areas than most other GMS countries. Despite that, recent expansion of the protected realm would justify efforts to update estimates of the standing forest –appropriately defined—contained in each of the protected areas. 4) The monitoring of the conditions of cancelled forest concessions should be the acid test of the effectiveness of Government’s enforcement. A performance indicator specifically targeting these areas should be created. B.Otherrecommendations5) The policy on selection of reforestation and forest rehabilitation projects undertaken by the Government and choice of community-based projects has not been formulated. The case for reforestation in a country with a high forest cover can be made but it has not been to date and should be made. Ensure that the Community Forestry Sub-decree is in line with such a policy. 6) once the case for community forestry has been strengthened, integrate forest management into RGC’s “Seila” Program and ensure that local government, especially the Commune Councils, play a role in resource management at local level. 7) Eliminate dysfunctional arrangements and amend conflicting legislation following the examples given in the report and any other. In particular improve (a) institutional coordination and reconcile the policies of the Forestry Administration and the Ministry of Environment with respect to the management of forest in protected areas; and (b) compatibility between forestry policies and the Law on commune Administration. 8) Propose the best way of monitoring compliance with the forest concessionaires’ development and management plans that would make room for local populations (that can either
gain or lose depending on how the concession holders operate). Ensure that such monitoring does not detract from attention to non-concession violations of the Forest Law. 2. THREAT TO BIODIVERSITY 216. The assessment of Part II notes the substantial areas of different habitats and areas placed under protection in Cambodia while Part III mentions the beginnings of efforts to situate biodiversity conservation within a broader “multi-convention” space alongside UNCCD and UNFCCC. Here, too, more needs to be done. A.TheEPAprocessanddata1) Information is needed for the next EPA that would allow the authorities and the public to judge how effective the protected status has been in conserving the biodiversity potential of the designated areas. As a minimum, this requires data, at well chosen intervals, of the changes of the areas of key and subsidiary habitats within each protected area as well as subsidiary parameters such as protection expenditure. B.OtherrecommendationsThe following proposals are made: 2) Study the best ways of reconciling the targets of the National Biodiversity Strategy and Action Plan with RGC’s budget and the Public Investment Program. Use the insights to begin to modify the approach to the preparation of new national action plans under international environmental conventions or their updates. The plans need to change from being “shopping lists” for donors to being components of documents (such as poverty reduction strategies that command a consensus of the Government and the donor community) that drive the budget process. 3) Monitor the achievement of RGC’s Cambodia Development Millennium Goal stated target of increasing the number of park rangers from 600 to 1,200 between 2001 and 2015. 4) Approve and pass the latest draft of the Law on Wildlife with its intent to discourage trade in endangered wildlife and hunting of endangered species. Following the adoption of the Law on Wildlife, prepare appropriate sub-decrees or prakas including those dealing with community

�0 �1
based biodiversity protection and management. Accompany such regulations by a supply of equipment to forest and park rangers. 3. FISHERIES RESOURCES217. Fishery resources were described in Part II as being under pressure by a growing population, and an apparently non-diminishing use of destructive fishing practices. Yet the inland fish catch has been increasing but the sources of this increase are not well described. The marine catch and its importance are poorly documented. This suggests the following agenda ahead of the next EPA: A.TheEPAprocessanddata1) Gather better data on the output of small-scale and rice-field fisheries and explain if it is they or other factors that have been supporting the apparent increase in per capita fish consumption in Cambodia. 2) Produce a complete time-series of the estimates of fish production in Tonle Sap by different categories of operators. The seeming inability to derive such a series is hard to justify. 3) Assemble information about the output and exports of marine fisheries. 4) Consider the scope for using direct and indirect indicators of the pressure exerted by illegal fishing practices and it change over time. B. other recommendations 5) Assemble available evidence that demonstrates that the community model of fisheries results in a more sustainable management of the resource. once satisfied, support the Fisheries Law that sanctions the ongoing fishery sector reform with its sub-decree on community fisheries. 6) Promote decentralized fisheries management to Commune Councils and local community consistent with the RGC program of decentralization. 7) Improve coordination and cooperation between DoF, MoE and Ministry of Water Resources and Meteorology to avoid the overlapping roles and responsibilities following the examples given in this EPA. 8) Explain to the public why it is difficult to reduce destructive fishing practices. 9) Place greater emphasis on the protection of
the wetlands now overshadowed by the attention to Tonle Sap. 4. WATER RESOURCES 218. The earlier sections of this EPA described the moderate improvements in access to safe potable water in Cambodia in the last few years from extremely low levels. They also noted the diversity of the ways in which rural water supply can be improved that makes the quantification of this improvement difficult. Addressing irrigation water, Part II suggested that shortages of irrigation capacity, especially water storage capacity, have been a constraint on further growth of agricultural productivity. The environmental importance of increasing irrigation in Cambodia lies in the potential for increased agricultural productivity that may well hold the key to de-fusing a potential conflict between a growing demand for farmland and the policy of increasing the area of protected habitats. At the same time, judging water resource adequacy only by reference to irrigation performance or agricultural productivity may be too narrow an approach. The following recommendations are : A.TheEPAprocessanddata1) Review the application of the existing methodology to estimating the percentage of access to safe potable water supply in rural areas and provide an indication of the margin of error inherent in that methodology. Make the case for improving the accuracy of the existing estimates. Make an attempt to separate the improvements in water supply due to government and donor efforts and those made by the rural households without outside assistance. 2) Begin to assemble data about the quality of rural water supply, in particular information about possible deterioration or contamination of rural water supply attributable to economic and other anthropogenic activities. 3) In future EPAs, consider modifying the indicator of response from expenditure on irrigation management to expenditure on integrated water resource development, having first agreed on its definition. 4) Given the importance of Tonle Sap, include into future EPAs an assessment of performance with

�0 �1
respect to the pollution of the Tonle Sap by non-point sources, with particular attention to fertilizer and agro-chemicals’ use. B.Otherrecommendations5) the Ministry of Water Resources & Meteorology (MoWRAM) has recently been established with the task of developing and implementing a long-term development strategy for water resources in Cambodia. Facilitate regular consultations between MoWRAM and MoE on the most meaningful ways of measuring the quality of overall water resource management. 5. MANAGEMENT OF AGRICULTURAL LAND 219. Part II structured performance assessment around the effect of farmland availability and irrigation coverage on average yields, and through them on additional pressure (or not) for converting non-farm lands to agriculture. The assessment pointed to increasing average farmland productivity that however lagged behind the population growth. The increase in irrigation coverage and areas de-contaminated of Uxo added to the supply of farmland. The structure of indicators chosen places agricultural productivity at the center of the assessment without looking further into the question of whether increases in farm productivity are sustainable or whether they are achieved at the cost of adverse environmental impacts (such as excessive use of agro-chemicals etc.). Future EPAs may want to explore some of these questions, in particular A.TheEPAprocessanddata1) Consider developing secondary indicators of the state of agricultural land such soil erosion or humus content 2) Assemble evidence on the levels of pollution by fertilizer and agro-chemicals’ run-off B.Otherrecommendations3) Provide data on the cost effectiveness of de-mining operations to judge whether a good case can be made for an acceleration of this activity. 4) Strengthen the land management committee at all administrative levels to help resolve land conflict issues
6. CLIMATE CHANGE 220. Cambodia has prepared an initial estimate of its GHG emissions and sequestration. These estimates, made only once in 1994, however, are now increasingly out of date. The following are recommended: A.TheEPAprocessanddata1) Re-estimate the actual GHG emissions in today’s economic circumstances. B.Otherrecommendations2) Pay attention to renewable energy development and other cross-sectoral initiatives that have the potential of delivering multiple benefits besides GHG emission reduction, such as assessment of climate change impacts of biodiversity conservation policies, the climate change repercussions of different variants of the Tonle Sap ecosystem management, etc. 3) Support the work of UNDP/GEF Cambodia National Capacity Self-Assessment for Global Environmental Management Project (2004-2006) conceived to address the threats of biodiversity loss, climate change, and land degradation in a coordinated and planned manner. Place new institutional initiatives in the area of climate change within a broader multi-convention framework. 4) Continue to support climate change awareness raising programme and technology transfer. ReferencesADB. 2002. Report and recommendations of the President to the Board of Directors on a Proposed Loan and technical Assistance grant to the Royal Government of Cambodia for the Tonle Sap Environmental Management Project. Manila. ADB, 2003. ADB Draft Poverty Analysis: Executive Summary, Manila, Philippines. ARD. 1998. Strengthening Institutions for Implementation of Forest Policy in Cambodia, 1998. Phnom Penh, Cambodia. ASEAN .2000. Second ASEAN State of the Environment Report, 2000. Published? Baltzer, M.C., T.D. Nguyen, and R.G. Shore. 2001. 2001. Towards a Vision for Biodiversity conservation in the Forests of the Lower Mekong Eco-region complex. World Wildlife Fund For

�� ��
Nature. World Wildlife Fund, Washington Dc. Botomley R. 2000. Structural Analysis of Deforestation in Cambodia. Phnom Penh, Cambodia. Bruce, M and Tola, P. 2002. Natural Resources and Rural Livelihoods in cambodia, cDRI, Phnom Penh, Cambodia. chea, y. and Mckenney, b. 2003. “great Lake Fish Exports: An Analysis of the Fee System” in Cambodia Development Review (CDRI) Phnom Penh, Cambodia. Chuon, C. 2002. Tonle Sap watershed issues and implications, Department of Natural Resources Assessment and Enviornmental Data Management, Ministry of Environment, Phnom Penh, Cambodia. CDRI, 1998. Food security in an Asian Transitional Economy: The Cambodian Experiences. Phnom Penh, Cambodia. cDRI, 2000. Land ownership, sales and Concentration in Cambodia: A preliminary review of secondary data and primary data from four recent survey, September 2000. Phnom Penh, Cambodia. DFW. 2003. cambodia: Forestry statistics for 2002 May 2003. Department of Forestry and Wildlife, Ministry of Agriculture, Forestry and Fisheries, Phnom Penh, Cambodia. DoF.2001. Fisheries data collection, 1980-2000, Department of Fisheries, Ministry of Agriculture, Forestry and Fisheries, Phnom Penh, Cambodia. global Witness. 1995. Forest, Famine and War: key to cambodia’s Future. London, England. global Witness. 1999. Made in vietnam, cut in cambodia. London, England. Hach, S and Acharya, S. 2002. Cambodia’s Annual Economic Review-2002, CDRI, August 2002, Phnom Penh, Cambodia. MoE (1998). National Environmental Action Plan (NEAP, 1998-2002). Ministry of Environment, Phnom Penh, Cambodia. MoE/UNDP-GEF.2001. Greenhouse Gas Mitigation Analysis. Ministry of Environment, Phnom Penh, Cambodia. MoE/UNDP-GEF. 2002. Vulnerability and Adaptation Assessment to Climate Change in Cambodia. MoE. 2002. Cambodia’s National Biodiversity Strategy and Action Plan. Ministry of
Environment, Phnom Penh, Cambodia. MoE .2000. Cambodian Biodiversity Issues & strategy Workshop Report, october 18, 2000, Sunway Hotel, Phnom Penh, Cambodia. MoE, MAFF, FFI. 2000. Cardamom Mountains: Biodiversity Survey, Edited by J. C. Daltry and F. Momberg, Phnom Penh, Cambodia. MoE, FAo & UNDP/GEF. 2001. Biodiversity: The Life of cambodia: cambodia’s biodiversity status Report - 2001, Phnom Penh, Cambodia. MRCS/UNDP (1998). Natural Resources Based Development Strategy for the Tonle Sap Area, Cambodia. Mekong River Commission Secretariat / United Nations. Neath N. 2001. A Wildlife survey of bokor National Park, cambodia. Wildlife conservation Society. Phnom Penh Post. 1998, Lucrative trade in baby Fish a Deadly Business, Phnom Penh Post, 4-17 September 1998. RGC 2003. Significant Acquirements made by the Royal Government of Cambodia, 1998-2002, PNH, Cambodia. RGC, MoP. 2001. Second Socio-Economic Development Plan (SEDP II) 2001-2005, Ministry of Planning, Phnom Penh, Cambodia. Saroeun, B. 1999. Pesticide Killing the Great Lake, Phnom Penh Post, May 14-27. Sokhun, T. 1997. Review of the Forestry Sector in cambodia. DFW/MAFF, PNh, cambodia. stuart, b.L., smith, J., Davey, k., Prom Din, and Platt, s.g. 2000. homalopsine Water snakes: the Harvest and Trade from Tonle Sap Area. Cambodia’s Traffic Bulletin. Available: www.traffic.org/bulletin/ watersnakes.html tana, t. s., Prak, L.h., chul, t., Lieng, s., chun, s. and Heng, K., 2000. overview of the Turtle Trades in Cambodia’s in Asian Turtle Trade. Proceeding of the Workshop on conservation and trade of Freshwater Turtles and Tortoises in Asia. In: van Dijk, P.P., stuart, b.L., and Rhodin, A.g.J. (Eds.). Asian turtle trade: Proceedings of a Workshop on Conservation and Trade of Freshwater Turtles and Tortoises in Asia. Chelonian Research Monographs 2:55-57. Tana, S and Todd, B. 2001. The inland and marine trade of Cambodia; oxfam America, Phnom Penh, Cambodia. Timmins, R and ou, R. 2001. The Importance of

�� ��
Phnom Pich Wildlife sanctuary and Adjacent Areas for the Conservation of Tigers and other key species: A summary. Worldwide fund for Nature (WWW). Phnom Penh, cambodia. World bank. 1996.cambodia: Forest Policy Assessment. Joint World bank, UNDP and FAo report. the World bank, UNDP & FAo. Washington D.C World bank. 1999. background Note, cambodia, A Vision for Forestry Sector Development. The World bank. Washington, D.c. World health organization. 1989. Environmental Health Criteria; DDT and its derivatives: Environmental effects. geneva, 1989. World Health organization

74 75
CAMBODIA NATIONAL ENVIRONMENTAL PERFORMANCE
ASSESSMENT (EPA) REPORT
FACT SHEET APPENDIX
CAMBODIA
1.FactSheettemplateandGuidelineS
2.ForeStreSourceSFactSheetS
3.WaterreSourceSFactSheetS
4.landdeGradationFactSheetS
5.inlandWaterpollutionFactSheetS
6.SolidWaStemanaGementFactSheetS
7.hazardouSWaStemanaGementFactSheetS
8.climatechanGeFactSheetS

74 75
GreatermekongSubregionindicatorFactSheettemplate
dataBaSeinFormation
Indicator ID Use as appropriate of leave blank
Indicator Name The name or title, assigned to the indicator, e.g. “Population density in the Uplands”, followed by the time range of the indicator data. e.g. “1914 to 2003” or “1990 and 2000”
Year of Assessment The year in which the fact sheet was developed, e.g. 2004
Type of Indicator Pressure, State or Response
Frequently Asked Question (FAQ) The non-scientific FAQ that the indicator attempts to answer. e.g. “ Is the water safe to drink?” for an indicator that reports on BOD levels in water
Priority Concern The name of the priority concern that this indicator relates to. Normally it should relate to only one concern
Geographic Area The name of the country or province in the GMS
Magnitude & Trend (for pressure indicator) or State & Trend (for state indicator) or Impact & Trend (for response indicator)
See Fact sheet and EPA Evaluation Criteria for vocabulary to be placed here for the final rating.
Key Message In answer to the FAQ above, the “super-executive summary” of the fact sheet analysis results, including, if appropriate a statement of observed trend and a statement of the current situation in terms of targets.

76 77
technicalinFormationA. Definition This section should define very precisely what “the indicator” is and in what units the indicator is expressed. It should also include a precise definition of the terms that make up the indicator. The section should start out with a generic statement such as “ This indicator attempts to track the amount of …(give precise definition of what you are tracking) over … (usually time); it is expressed as. (give the precise units of the indicator, both numerator and denominator). Follow this definition with the definition of other terms you have utilized for the definition of the indicator (e.g. define more precisely what “forest cover” means, what “expenditure” means, what “threatened species” means, etc. B. Data Source If the data originates from a known information system, give the name of such information (e.g. FAOSTAT) along with the name of the organization which maintains such information system (e.g. FAO). If the data were taken from a publication, give the full reference of that publication. If the data were extracted from the Internet, give the generic name of the website homepage but do not include the URL. Otherwise specify where or from whom you obtained the data. C. Geographic Area / Population Coverage If the data covers the entire country or province, or if the data represents 100% of the population you are describing, then simply state so (e.g. “the data and the indicator is representative of ……. For the country as a whole”). Otherwise describe any gaps or restrictions on the geography (e.g. “excluding province X” or “only on agricultural soils’) or on the population (e.g. “only commercial fisheries” or “only reported cases”). If the data is only for a representative sample of the population (e.g. “only major rivers” or “only X cities”), then provide more details on the sub-sample (e.g. “Cities X and Y” or “X rivers with discharge greater than Y cms”. D. Temporal Coverage If the data represents a one-time measurement (e.g. land cover), state as precisely as you can the place in time when this measurement was taken (e.g. “represents ground condition in 1999”). If the data is expressed as a time series, given the start and end times along with an explanation of any gaps which may occur in the time series and/or how those gaps may have been filled in. E. Methodology and Frequency of Coverage Whenever possible, describe the methodologies that the originator utilized to compile the datasets that you are utilizing ( e.g. “using un-supervised remote sensing classification on a Landsat-7 satellite image” or “using a 1km by 1km random stratified grid’). Comment on the frequency of measurement and/or update (e.g. “a one-time measurement from a project” or “based on year 2000 data which will be updated shortly”) and on the likelihood that the measurement will be repeated ( e.g. “maintained by a UN organization for the past four decades”). F. Methodology of Data Manipulation The focus here is on the manipulation that you may have made to the original data to get it into a form where it has become useful to you as an indicator; the focus is not on the methods that the originator utilized to obtain the data in the first place. Describe all the manipulations you have done on the original data, ensuring that enough detail is given so that the methodology can be repeated by others at a late data in time.

76 77
QualitatiVeinFormationA. Strength and Weakness (data level) Comment on the strengths and weaknesses of the data you have utilized, in relation to the phenomenon you were trying to measure. If the indicator is to show a trend over time, comment on the strengths (or weaknesses) of the data to show variance over time (present and future). Comment on any bias that is inherent with the data in respect of the phenomenon you are trying to measure. B. Reliability, Accuracy, Robustness, Uncertainty (data level) Comment on the reliability of the data, especially in relation to whom or where you got it from; quote all endorsements that were made on the data during the review process. Quote any accuracy measures that were given or published with the original data (e.g. “according to IHO standards” or “according to national mapping standards”. Comment on the robustness of the data in terms of how it may have been used elsewhere and how it can still be applicable to the GMS. State any assumptions you have made with the data and any relevant uncertainties. C. Future Work Required (for data level and indicator level) If applicable, comment of how the data could be improved to better serve the purposes of the indicator, or how the indicator could be improved with additional or alternative sources of data.
SupportinGdatataBleS,GraphSandmapS The section should start with a graph (Figure 1) and a table (Table 1) which summarizes the value of the indicator over time. The graph will normally be re-produced in the EPA report, without the table. The table therefore should contain all the necessary data to re-produce the graph and, as much as possible, not too much else. The title of the graph and table should correspond to the name of the indicator. If the indicator is expressed as a time series, the x-axis of the graph should also be expressed as a time series. Add as many supplemental graphs and tables, or maps, as required to further expand on the indicator or to include non-indicator specific information that might supplement the fact sheet but make sure supplemental information is used and referenced in the final Analysis Section of the fact sheet. All graphs should be followed by the table with the data that was utilized to generate them. Graph titles and table titles should be placed outside the graph and table, as a bolded title on top of the figure or table. All tables should identify the source of the data in the last row of the table. Try and keep the graphs and maps to the minimum size, but with sufficient resolution and detail so as to portray the trend or spatial distributions that are being evaluated. Number each table and each graph (or map) so that they can be referenced in the evaluation text. Give the same number to the table and the corresponding graphic; if you generate more than one graphic from the same table, use alphabetical sub-numbering.

78 79
SummarYA. Policy Reference This section on policy reference may not apply to some pressure and state indicators and to some very specific response indicators where related policies and regulations cannot be inferred. In these cases, the entire section can be omitted. But for normal response indicators, the lack of policy or regulation should be noted and highlighted as a “gaps”. 1. Purpose: Comment on the purpose of the indicator and (i) what function it performs in terms of environment performance assessment i.e. what parameter it assesses and what resource it protects, (ii) what objective’s compliance it monitors and (iii) what potential corrective action (s) it requires. 2. Relevance to Environment Planning and Management: Comment on the broad/general importance of this indicator for assessing other related environmental issues e.g. socio-economic relevance, link with any public health, quality of life related issues etc. 3. Linkage to Other Indicators: Give a list of other indicators this indicator is linked to i.e. what other indicator values this indicator directly or indirectly affects. 4. Targets: Give details on what targets have been set by the national environment agency or ministry for this indicator to comply with i.e. what are the quantifiable environmental standard this indicator has to comply with. 5. International Environment Treaties: If applicable, give the name, scope, status of implementation of the international environmental treaty(s) your country has signed for this indicator and give an update on the progress of its implementation. Otherwise state “None applicable”. 6. Laws If applicable, name national laws that have some implication to the indicator. Otherwise leave out this sub-section. B. Analysis This section is dedicated to the analysis of the indicator and the final rating of the results. The first paragraphs should be focused on the description of the observed results, as observed in the tables and graphs (e.g. “As can be observed from Table 1 and Figure 1”, describe the observed value and the observed trend of the indicator). State if the indicator values comply with the stipulated national target or standard and (in relevant cases) international standard. Comment on the size of the discrepancy between the two and its trend (can a reliable trend be established? Does it point to an underlying improvement or deterioration? Can the fluctuating values of the indicator be related to distinct policy interventions such as mitigation measures, changed pattern of economic incentives, or other corrective actions?). Say whether the results might be indicative of inappropriate or moving targets/standards rather than simply reflecting performance. Comment on the role, if any, of factors outside management control (climatic factors, natural disasters, etc.). Identify the factors most relevant to observed outcomes and specify key related indicators. Keep in mind the ultimate purpose of your effort, i.e. to review performance by environmental concerns and groups of concerns such review normally resting on several indicators rather than a single one. Analysis of a single indicator to be performed below is important but it is in combining it with the analysis of other indicators that policy insights are generated and performance assessment gains depth.

78 79
The last paragraph of this analysis section should be focused on the justification of the indicator ranking, based on the vocabulary and guidelines given in “Fact sheet and EPA Evaluation Criteria”. The last sentence should highlight (in bold) the final ranking of the indicator results.

80 81
GreatermekongSubregionindicatorFactSheetdataBaSeinFormation
Indicator ID
Indicator Name Forest Cover as a Percentage of Total Land Area – 1965 to 2002
Year of Assessment 2004
Type of Indicator State
Frequently Asked Question (FAQ) Is forest cover in Cambodia increasing or decreasing?
Priority Concern Forest Resources
Geographic Area Cambodia
State & Trend See Fact sheet and EPA Evaluation Criteria for vocabulary to be placed here for the final rating.
Key Message Forest cover in Cambodia has been declining over the long-term but there are signs of a reversal, based on observations between 1997 and 2002. Cambodia has the highest forest cover of all GMS countries in excess of 60 per cent of the total land area. The condition of the existing forest cover however remains a concern.

80 81
technicalinFormationA. Definition This indicator attempts to track the amount of natural and plantation forest area over time. As utilized here for Cambodia, it also includes degraded forest, shrub-lands and bamboo forest. It is expressed as the percentage of total forest area over the total land area. The historical data utilized for this indicator originate from three different sources (see section 2 below) using two or three differing criteria for the definition of “forest area” (see section 5 below). B. Data Source Earlier records of forest cover originate from the Food and Agriculture Organization of the United Nations (FAO) from various in-country assessments. More recent assessments were conducted by the Mekong River Commission (MRC) Secretariat and the German Technical Assistance (GTZ). The latest assessment was conducted by the Forest Resource Management (FRM) division of the Ministry of Agriculture, Forestry and Fisheries (MAFF) in association with Indufor Oy and Société Générale de Surveillance (SGS). C. Geographic Area / Population Coverage All assessments have considered the entire land surface of Cambodia. Although MRC data are normally limited to the area within the Mekong basin, these MRC data are for the country as a whole. Year 2002 results are also presented on a provincial basis to illustrate regional variations. There are no official figures for total provincial area and some provincial land areas have changed after the census 1998. The provincial land areas in this fact sheet were calculated according to the new updated coverage provided by Department of Geography, which is a government agency responsible for land administration boundaries. D. Temporal Coverage The earliest FAO figures provide an estimate of forest cover for 1965. Later FAO estimates span the periods between 1973 to 1976 and 1985 to 1987. The last FAO estimate and the first MRC estimate are for the period of 1992-1993. MRC provides another comparable estimate covering the periods between 1992-1993 and 1996-1997. The last estimate provided by MAFF is based on ground conditions during 2002. E. Methodology and Frequency of Coverage FAO classified land cover as forested area if the crown cover was at least 10%; the tree height using these criteria can be assumed to be about 5 m or more. MRC/GTZ and FRM classified land cover as forest area if the crown cover was at least 20%; tree height can be assumed to be about 10 m or more. If the tree-cover is equal, or more than, 20% but tree height ranges only between 5 m and 10 m an assignment to the class ‘forest re-growth’ appears to be appropriate, even if some stunted forests will be included. FRM also utilized the 20% crown cover criteria. The Forestry Administration has plans to produce another forest cover assessment in 2007. F. Methodology of Data Manipulation Forest area and percentage forest cover for the period of 1965 to 2002 were not calculated in this fact sheet and are quoted directly from the stated sources.

82 83
Percentage land cover is based on different total land areas from which an average total of each coverage area was calculated/interpreted. For example, FAO/UNDP reported that total land area in 1965, 1973-1976, 1985-1987 and 1992-1993 was 18,110,500 ha, 18,153,400 ha, 18,153,100 ha, and 18,153,500 ha, respectively. Whereas, MRC/GTZ reported that total land area was 18,152,985 ha in 1992-1993 and 1996-1997, and total land area in 2002, reported by FRM was 18,160,677 ha. The percentage forest area by province in year 2002 was calculated by dividing the total forest area of the province by its corresponding land area.
QualitatiVeinFormationA. Strength and Weakness (data level) These percentage figures of forest area are indicative of long-term forest cover conditions or forest resource existing in the country. They can also illustrate the forest distribution within provinces to identify more or less forest areas. However, they are less indicative of the forest condition, without measuring the change of forest types, which remain from logging. B. Reliability, Accuracy, Robustness, Uncertainty (data level) While the historical data produced by FAO are available for the past period, there are some inconsistencies associated with the recent data developed by MRC/GTZ due to different methodologies used in the determination or interpretation of forest cover. The Forestry Administration’s definition cites that the 20% threshold was chosen in regards to dry dipterocarp forests, which by their nature are quite open. A 10% threshold, as utilized by FAO, appeared to be rather low for the forest in South East Asia. However, in order to compare with the historical data, The Forestry Administration has adjusted the recent MRC/GTZ’s data to be compatible for the analysis of long-term trends. The latest data produced by FRM may be unreliably estimated because the images utilized for interpretation were for the dry season, and it may be difficult to distinguish between woodland and shrubland, and deciduous forests. Hence, it may be an over-estimation of the total forest area. C. Future Work Required (for data level and indicator level) The indicator and the fact sheet should be updated on the latest or revised forest cover figures produced by the FRM.

82 83
SupportinGdatataBleS,GraphSandmapSFigure1:percentageForestareaovertotallandarea,1965-2002
73.04
70.02
65.29
61.34 61.1562.16
62.68
59.82
58.6
50
60
70
80
1965 1976 1987 1993 1993 1997 2002 2005
% T
ota
l La
nd
Are
a
Area with Tree Crown Cover >=10% Area with Tree Crown Cover >=20%
table1:percentageForestareaovertotallandarea,1965-2002
Years areasofForest(ha) %
Areas with tree crown cover >=10%
1965 13,227,100 73.04
1973/76 (FAO/UNDP) 12,711,100 70.02
1985/87 (FAO/UNDP) 11,852,400 65.29
1992/93 (FAO/UNDP) 11,284,200 62.16
1992/93 (MRC/GTZ)* 11,378,664 62.68
1996/97 (MRC/GTZ)* 11,134,615 61.34
Areas with tree crown cover >=20%
1992/93 (MRC/GTZ) 10,859,695 59.82
1996/97 (MRC/GTZ) 10,638,209 58.6
2002 11,104,293 61.15* (MRC/GTZ) including wood/shrubland evergreen and bamboo, but excluding plantation

84 85
Figure2a:percentageForestcoverbyprovince–cambodia2002
0
10
20
30
40
50
60
70
80
90
100
Pre
ah
Vih
ea
r
Mo
nd
ul K
iri
Stu
ng
Tre
ng
Ra
ttan
ak K
iri
Kro
ng
Pa
ilin
Ko
h K
on
g
Kra
tie
Pu
rsat
Od
da
r Me
an
che
y
Ka
mp
on
g S
pe
u
Kro
ng
Pre
ah
Sih
an
ou
k
Ka
mp
on
g T
ho
m
Ka
mp
ot
Ba
ttam
ba
ng
Sie
m R
ea
p
Ka
mp
on
g C
hh
na
ng
Ba
nte
ay M
ea
nch
ey
Kro
ng
Ke
p
Ka
mp
on
g C
ha
m
Ka
nd
al
Ta
keo
Sva
y Rie
ng
Pre
y Ve
ng
Ph
no
m P
en
h%
Pro
vin
cia
l La
nd
Are
a
Figure2b:mapofpercentageForestcoverbyprovince–cambodia2002

84 85
table2:percentageForestareabyprovince–2002
province provincialarea(ha) Forestedarea(ha) %ForestareaPreah Vihear 1,403,088 1,324,519 94.4
Mondul Kiri 1,366,892 1,234,694 90.32
Stung Treng 1,201,661 1,058,881 88.12
Rattanak Kiri 1,178,460 965,497 81.93
Krong Pailin 107,712 88,206 81.89
Koh Kong 1,211,595 970,643 80.11
Kratie 1,197,306 948,683 79.23
Pursat 1,158,589 888,227 76.66
Oddar Meanchey 663,166 495,726 74.75
Kampong Speu 696,471 425,768 61.13
Krong Preah Sihanouk 149,205 85,380 57.22
Kampong Thom 1,244,764 640,199 51.43
Kampot 471,815 235,779 49.97
Battambang 1,187,210 585,534 49.32
Siem Reap 1,054,450 519,671 49.28
Kampong Chhnang 529,462 212,474 40.13
Banteay Meanchey 614,818 154,521 25.13
Krong Kep 15,174 3,238 21.33
Kampong Cham 948,297 181,866 19.17
Kandal 356,372 31,239 8.76
Takeo 349,042 29,711 8.51
Svay Rieng 286,824 12,066 4.21
Prey Veng 476,159 9,384 1.97
Phnom Penh 37,374 0 0
Total - Cambodia 18,160,677 11,104,291 61.15Note: This table excludes Tonle Sap Lake ( area equal 254,770 ha.)Source: Cambodia Forestry Administration
Figure3:Forestcondition–2002–BasedonForestadministrationestimates
Evergreen Forest
, 20.5%
Semi-evergreen
Forest, 8.0%
Deciduous
Forest, 26.6%Other Forest,
6.0%
Non-forest Land,
38.9%

86 87
table3:Forestcondition–2002–basedonForestadministrationestimates
Foresttypes area(000ha) percentageEvergreen Forest 3,720.50 20.5
Semi-evergreen forest 1,455.20 8
Deciduous forest 4,833.90 26.6
Other forest 1,094.70 6
Total forest land 11,104.30 61.1
Non-forest land 7,056.40 38.9
Total 18,160.70 100Source: Cambodia Forestry Administration
table4:comparativeForestcoverinGmScountries
country Yearofassessment
%Forestcover trend target
Cambodia 2002 61 Signs of leveling after 30-year decline
Maintain 60% through to 2015
Lao PDR 2002 41.5 Down from 49.1% in 1982 70 % by year 2020
Myanmar 1998 52 Down from 61% in 1975 Not less than 35%
Thailand 2000 33.2 Increased from 25.8% in 1998
50% by year 2016
Viet Nam 2002 36.1 Increased from 28% in mid 1990s
39% by 2005 and 44% by 2010
Yunnan 2003 50 Substantial improvement from 28% in 1960
48% by 2005
Source: Findings of the SEF-II Project

86 87
SUMMARY
A. Policy Reference 1. Purpose: The purpose of the indicator is to show the area covered by the forest formations of a region or country over time.2. Relevance to Environmental Planning and Management: Forests provide many significant resources and functions such as wood products, recreational opportunities, wildlife habitats, water and soil conservation, and a filter for pollutants. They support employment and traditional uses, and biodiversity. There is general concern over human impact on forest health, and the natural processes of forest growth and regeneration. Combating deforestation to preserve soils, water, air and biological diversity is explicitly stated in the United Nations (UN)’s Agenda 21. The forest area is not directly related to sustainable or unsustainable development. However, a continuing and fast decreasing forest area might be an alarm signal of unsustainable practices in the forestry and agricultural sector. A change in the forested area over time can be negative showing a loss of forest area or positive showing an increase . The availability of accurate data on forest area, which is a basic characteristic of forest resources, is an essential requirement for forest policy and planning within the context of environment planning and management.3. Linkage to Other Indicators: This indicator may also serve as an indicator of forest habitat loss as a threat to biodiversity..4. Targets: While most other GMS countries have set a target to increase the percentage of forest cover (see Table 4), the target of Cambodia is to maintain a 60% level from 2000 to 2015.5. International Environment Treaties: Cambodia is party to the UN Millennium Development Goals (MDGs) which aims to “integrate the principles of sustainable development into country policies and programs and reverse the loss of environmental resources” (Goal 7, Target 9). The Indicator 25 of the UN also utilizes “forest land area as a percentage of land area”, according to FAO definition of forest land, with the expectation that there will be no further loss from the 2000 levels until 2015. Hence, for Cambodia, this was translated to the maintenance of a 60% forest cover until 2015.6. Laws None applicable to this indicator. B. Analysis Figure 1 and Table 1 illustrate the trend in percentage forest cover during 1965-2002, using different but consistent definitions of “forest area” based on crown cover. The first set of estimates is based on a 10% crown cover; the second set of estimates is based on a more conservative criterion of 20% crown cover. The earlier estimates provided by FAO and based on a 10% crown cover (for 1965, 1976, 1987 and 1993) show a steady decline from 73% in 1965 to 62% in 1993. The annual average loss was approximately 0.4% during the 28-year period. Using the same 10% crown cover criterion and adjusting the MRC/GTZ to include shrub-land and bamboo areas and excluding plantation area, the downward trend can be extrapolated to approximately 61% in 1997. The second set of estimates is based on a 20% crown cover, starting with the 1993 and 1997 data provided by MRC/GTZ. The downward trend, at a comparable rate of 0.3% per annum, is evident as the forest cover declines from 59.8% (in 1993) to 58.6% (in 1997). At this rate, Cambodia may fall short of its 60% target throughout the period of 2000 and 2015, regardless of the criteria used to define forest area.

88 89
The latest estimation of forest area provided by FRM in 2002, using the 20% crown cover criterion, suggests that the trend has been reversed and that the forest area has increased by 2.55%, from 1997 to 2002 , to 61.15% of the total land area. If this recent trend can be maintained, Cambodia should be able to maintain a 60% forest cover until 2015. Table 2 and Figures 2a and 2b illustrate the variation in percentages of forest cover throughout the 24 provinces, based on the 2002 FRM estimates. As indicated in Figure 2a, forest cover ranges from 94% in Preah Vihear Province to less than 2% in Prey Veng Province. There are also regional variations from the North to the South and from the East to the West, as illustrated in Figure 2b. These provincial and regional variations in forest cover may be of interest when evaluating government responses to forest resource priority concerns. As noted earlier, percentage forest cover is not indicative of forest condition and while overall forest cover may have increased, the volume of standing timber may have actually decreased, or vice versa. Data to estimated timber volume are not available for Cambodia as a whole, and such estimates may never be made available in the future. As an alternative indicator of forest condition, Table 3 illustrates the current forest condition based on broad categories of forest cover as reported in the Forest Administration monitoring survey (2002). Table 4 shows a comparison of the current forest cover of Cambodia with that of other GMS countries. It is observed that Cambodia’s forest cover is the highest (61%) amongst all GMS countries, followed by Myanmar (52%) and Yunnan province (50%). However, this comparison with other GMS countries may not be appropriate for the purpose of rating the indicator results. Different countries have different targets of percentage forest cover, normally based on the topographic characteristics of the country and no country is aiming for 100% forest cover. The 60% target figure set for Cambodia is assumed to be appropriate. Based on this target and the trend observed in Figure 1, it is concluded the state of forest resources in Cambodia, based solely on percentage forest cover, is relatively good and stabilizing.

88 89
GreatermekongSubregionindicatorFactSheetdataBaSeinFormation
Indicator ID
Indicator Name Forest Concession Area – 1994 to 2002
Year of Assessment 2005
Type of Indicator Pressure
Frequently Asked Question (FAQ) What effects are forest concessions having on forest resource?
Priority Concern Forest Resources
Geographic Area Cambodia
Magnitude & Trend Non-Comparable and Decreasing
Key Message At its peak in 1998, more than half of the remaining forest area in Cambodia was managed by forest concession holders under the Government’s oversight. Since 1998 the area under concessions has been reduced from 6.5 to 3.8 million ha. The remaining forest concessionaires are subject to stricter government control. However, forest areas continue to decline in both existing and cancelled concession areas.

90 91
technicalinFormationA. Definition This indicator attempts to track the amount of forest area under concession; it is expressed as the number of hectares assigned to forest concessionaire on an annual basis. B. Data Source Areas under concession data are extracted from a book “Cambodia: Forestry Statistics to 2002” published by Statistic Section, Planning and Accounting Office, Department of Forest and Wildlife, May 2003 and printing supported by Japan International Cooperation Agency (JICA). The legal status of forest areas are extracted from “Trend in Land Cover Changes Detection between 1996/97 and 2002” published by Forestry Administration, Ministry of Agriculture, Forestry and Fisheries, September 2003. C. Geographic Area / Population Coverage Although figures were available by individual concession areas, they have been summarized for the whole country.. D. Temporal Coverage Figures for forest concessions were available only for the period of 1994 to 2002. The figures for 1994-1998 were unclear where forest concessions were cancelled in 1999 and the date of initial approval was not specified. For this period, a range of estimated values are given. E. Methodology and Frequency of Coverage The Forestry Administration (FA) maintains data on forest concession areas and will be the probable source for future information on concession areas. Likewise, the Forestry Administration will probably conduct the future forest cover assessments. F. Methodology of Data Manipulation The original data were recorded by forest concessionaire showing the area in hectares along with the dates of approval and cancellation. Annual totals, or range of annual totals, were calculated by adding the total area across all concessionaires.
QualitatiVeinFormationG. Strength and Weakness (data level) The number of hectares under concession is seen as having a negative impact on the overall forest resources, as evidenced by the government attempting to reduce the number of forest area under concession since the peak period in 1998. H. Reliability, Accuracy, Robustness, Uncertainty (data level) FA had some reservation in making its data public prior to 1998 and only those in the published reports were available for this indicator development. More precise figures may enhance this indicator, but it may not change the observed trends. I. Future Work Required (for data level and indicator level) Since the 2003 target has been met, this indicator may no longer be of value for future performance assessments.

90 91
SupportinGdatataBleS,GraphSandmapSFigure1:trendsinForestconcessionarea–1994-2002
0
1,000
2,000
3,000
4,000
5,000
6,000
7,000
8,000
1994 1995 1996 1997 1998 1999 2000 2001 2002 2003
Th
ou
san
ds
of
He
cta
res
High Estimate Low Estimate
Concession Area Target
table1:annualareaunderconcession–1994-2002
Year areas(ha)1994 3,767,552—766,082
1995 3,767,552—766,082
1996 5,298,938—2,297,468
1997 5,298,938—2,297,468
1998 6,875,498
1999 4,702,452
2000 4,362,728
2001 4,362,728
2002 3,874,028 Source: Department of Forest and Wildlife
table2:percentageForestcoverchangeinconcessionareas–1996-2002
1996/97(ha) 2002(ha)%oftotalforesta
1996/97 2002Concession areas 3,335,232 3,346,453 30.49 30.13
Canceled concession 2,095,311 2,072,157 19.15 18.66 Source: Trends in Land Cover Changes Detection between 1996/97-2002

92 93
table3:evergreenandSemi-evergreenForests
evergreenandsemi-evergreenforests
totalarea(ha) 2002area(ha) %oftotalarea
%evolution1996/97-2002
In existing forest concessions
3,760,000 2,060,000 54.7 V 9.2
In cancelled forest concessions
2,600,000 827,000 31.7 V 8.2
Source: Trends in Land Cover Changes Detection between 1996/97-2002

92 93
SummarYA. Policy Reference 1. Purpose: The purpose of this indicator is to track the total forest area under concession which is perceived as having a negative impact on the sustainable use of forest resources in Cambodia. 2. Relevance to Environment Planning and Management: Forest concession areas may or may not be perceived as detrimental to forest resources, depending on sustainable use. 3. Linkage to Other Indicators: This indicator may have linkages to other forest resource indicators such as a percentage forest cover and protected forest area. 4. Targets: The Royal Government of Cambodia (RGC) has set the target to reduce the number of forest concessions from 30, covering 6.5 million ha in 1997 to 12 concessions, covering 3.8 million ha by 2003. The remaining operating forest concessionaires have been required to develop forest concession management plans. 5. International Environment Treaties: On 31 December 1996, the RGC imposed a ban on all exports of logs. On 29 April 1997, RGC issued the Decision No. 17 on timber exports , signed by the co-Prime Ministers, which specified what comprised legal and illegal exports. On 26 December 1996, the RGC wrote to the Prime Ministers of Thailand, Lao PDR and Viet Nam to ask for their cooperation in enforcing the export ban and received assurances that such cooperation would be forthcoming. In July 1997, the Thai National Security Council (NSC) issued Policy Guidelines on timber imports from Cambodia stating that Thailand will comply with the Decision No. 17. On 25 July 1997 the Thai NSC issued the document no. 0509/2532, its ‘Policy and Practice Guidelines on Timber Trade with Cambodia’. In brief, this document stated that Thailand would comply with the RGC’s Decision No. 17 regarding timber exports, and collaborate closely with Cambodia to ensure transparency and clarity of the export operations. On 31 January 1997, in response to the RGC 31 December 1996 export ban and the co-Prime Ministers request for cooperation, the Vietnamese Government stated:
“Vietnam firmly respects Cambodia’s [forestry] policy....and has advised all provinces and competent authorities to carry out the Vietnamese Prime Minister’s order to ban logging exports from Cambodia on 31 December 1996”.
(Cambodia’s Future on the Move, Global Witness, March 1998 http://www.globalwitness.org/ campaigns/forests/cambodia/goingplaces/policy.htm) B. Analysis It can be observed in Figure 1 and Table 1 that the forest area under concession rose steadily from 1994 and peaked in 1998 to a total land area approaching 7 million ha. Based on more recent figures of concession areas and forest cover (see Table 2), this may well have been in excess of 50% of the total forest area in 1998. Since 1999, a substantial number of forest concessions have been cancelled and the rate of decline has continued to be marginally below the 2003 target of 3.8 million ha. Under 2002 forest cover conditions, this represents approximately 30% of the total forest area.

94 95
It is interesting to note that during the period of 1996-2002, overall forest cover decreased in both the concession areas and in the cancelled concession areas (see Table 2). In terms of forest condition (see Table 3), evergreen and semi-evergreen forests, which are recognized internationally as areas of ecological importance, follow the same decreasing trend. Although the issuance and cancellation of concession areas is probably part of the history of managing forest resources in other GMS countries, a similar indicator to monitor pressure on forest resources has not been constructed. Comparative figures for countries outside the GMS are also difficult to obtain, therefore the final conclusion is that the magnitude of the pressure is non-comparable. However, based on the trend of the indicator and the decrease in the overall area of concession forest, it is obvious that the pressure has been decreasing over the time span of the indicator.

94 95
Greater Mekong Subregion Indicator Fact Sheet DATABASE INFORMATION
Indicator ID
Indicator Name Reforested Areas – 1985 to 2002
Year of Assessment 2005
Type of Indicator Response
Frequently Asked Question (FAQ) What have been the impacts of reforestation programs on the overall forest cover in Cambodia?
Priority Concern Forest Resources
Geographic Area Cambodia
Impact & Trend Low and Sporadic
Key Message While reforestation programs may play a positive role in small well-defined small areas especially within vulnerable watersheds, the overall impact of re-forestation programs on forest cover has been insignificant. From 1985 to 2002, about 10,000 ha have been replanted but this figure represents less than 0.1 % of the total land area.

96 97
TECHNICAL INFORMATION A. Definition This indicator tracks the area of forest re-plantation over time. It is expressed as the percentage of total re-plantation area over total land area. B. Data Source Forest plantation data are extracted from statistic book “Cambodia: Forestry Statistics to 2002” published by Statistic Section, Planning and Accounting Office, Department of Forest and Wildlife, May 2003 and printing supported by Japan International Cooperation Agency (JICA). C. Geographic Area / Population Coverage Figures are given for the country as a whole and also differentiated by provinces. D. Temporal Coverage Total areas of forest plantation are calculated in the period 1985 to 2002. E. Methodology and Frequency of Coverage Forestry Administration records data annually from different tree planting stations, provincial departments and other organization. Final draft figures for 2003 and 2004 were not yet approved in time for preparation of this fact sheet. F. Methodology of Data Manipulation The original data were recorded according to the specific locations of tree planting stations, forest plantation by provinces and other organizations and arbor day tree plantation activities in the entire country. They have been recalculated by province for purposes of this fact sheet. Original figures for re-plantation area were obtained in hectares by province. For convenience and to show the impact in certain provinces, these have been expressed in terms of total provincial area.
QUALITATIVE INFORMATION A. Strength and Weakness (data level) The area of forest plantation is indicative of the amount of forest that is planted in the provincial lands. It is also indicative of whether the forests are planted in appropriate locations, which is the response to forest distribution in the country. Furthermore, they are indicative of the response of the reforested areas to replace the forest loss if the proportion of deforestation is low. This indicator attempts to capture the output of all government re-plantation programs and re-greening activities by governments and NGO’s and to measure their impact on the overall percentage forest cover of the country. B. Reliability, Accuracy, Robustness, Uncertainty (data level) The forest plantation statistics recorded from different Forestry Administrations’ tree planting stations is reliable, because the trees are maintained after re-plantation. Statistics recorded from provinces, other organizations and arbor day tree plantation activities are less indicative, because the re-planted trees receive less maintenance. C. Future Work Required (for data level and indicator level) Forestry Administration records data annually from different tree planting stations, provincial departments and other organization. Final draft figures for 2003 and 2004 should be added once approved.

96 97
SUPPORTING DATA TABLES, GRAPHS AND MAPS Figure 1: Percentage of Reforested Area by Total Land Area – 1985-2002
0
1,000
2,000
3,000
4,000
5,000
6,000
7,000
8,000
9,000
10,000
Pre
ah
Vih
ea
rM
on
du
l Kiri
Stu
ng
Tre
ng
Ra
tta
na
k K
iri
Kro
ng
Pa
ilin
Ko
h K
on
gK
ratie
Pu
rsa
tO
ddar
Meanch
ey
Ka
mp
on
g S
pe
uK
ron
g P
rea
h S
iha
no
uk
Ka
mp
on
g T
ho
mK
am
po
tB
att
am
ba
ng
Sie
m R
ea
pK
am
po
ng
Ch
hn
an
gB
ante
ay
Meanch
ey
Kro
ng
Ke
pK
am
po
ng
Ch
am
Ka
nd
al
Ta
keo
Sva
y R
ieng
Pre
y V
eng
Ph
no
m P
en
hT
ota
l –
Ca
mb
od
ia
He
cta
res
0.00
0.01
0.02
0.03
0.04
0.05
0.06
% L
an
d A
rea
Table 1: Reforested Land Area by Province, 1985-2002
ProvinceLand Area
(ha)Forest Area2002 (ha)
Reforested Area (Ha)
% Land Area reforested
Preah Vihear 1,403,088 1,324,519 0 0.0000%Mondul Kiri 1,366,892 1,234,694 50 0.0003%Stung Treng 1,201,661 1,058,881 0 0.0000%Rattanak Kiri 1,178,460 965,497 0 0.0000%Krong Pailin 107,712 88,206 0 0.0000%Koh Kong 1,211,595 970,643 0 0.0000%Kratie 1,197,306 948,683 0 0.0000%Pursat 1,158,589 888,227 159 0.0009%Oddar Meanchey 663,166 495,726 0 0.0000%Kampong Speu 696,471 425,768 433 0.0024%Krong Preah Sihanouk 149,205 85,380 630 0.0035%Kampong Thom 1,244,764 640,199 0 0.0000%Kampot 471,815 235,779 427 0.0024%Battambang 1,187,210 585,534 56 0.0003%Siem Reap ,054,450 519,671 726 0.0040%Kampong Chhnang 529,462 212,474 1,439 0.0079%Banteay Meanchey 614,818 154,521 40 0.0002%Krong Kep 15,174 3,238 0 0.0000%Kampong Cham 948,297 181,866 554 0.0031%Kandal 356,372 31,239 269 0.0015%Takeo 349,042 29,711 1,956 0.0108%Svay Rieng 286,824 12,066 2,227 0.0123%Prey Veng 476,159 9,384 981 0.0054%Phnom Penh 37,374 0 34 0.0002%
Total – Cambodia 18,160,677 11,101,906 9981 0.0550%

98 99
SUMMARY A. Policy Reference 1. Purpose: This indicator measures the coverage of reforestation in various programs implemented by several agencies. It is understood that the higher the reforestation area is, the better the performance of the country in rehabilitating forests and increasing forest cover. 2. Relevance to Environment Planning and Management: Reforestation programs also contribute to restoring degraded areas, protecting watersheds and re-greening urban and rural living areas. 3. Linkage to Other Indicators: This indicator will have some relevance to indicators that attempt to track percentage forest cover. 4. Targets: No specific targets have been set. 5. International Environment Treaties: None applicable. B. Analysis As can be observed from Figure 1 and Table 1, significant re-forestation has been attempted in Svay Rieng and Takeo Provinces where forest cover was already depleted but these reforestation programs have a small impact on increasing the overall forest cover of these two provinces. For the whole country, although a total area of approximately 10,000 ha has been reforested, this also has a small impact on increasing the overall forest cover, which, was estimated at 1.1 million ha in 2002. Based on this comparison with the extent of the current forest area and the trends observed in the indicator value, it is concluded that the impact of re-forestation programs on improving the overall forest cover has been low and sporadic. Regardless of the rating, the importance of re-forestation on re-greening specific areas and protecting vulnerable watersheds is recognized.

98 99
Greater Mekong Subregion Indicator Fact Sheet DATABASE INFORMATION
Indicator ID
Indicator Name Protected Forest as a Percentage of Total Land Area 1993-2002
Year of Assessment 2005
Type of Indicator Response
Frequently Asked Question (FAQ) What impact is the Cambodian system of protected areas having on the protection of forest resources?
Priority Concern Forest Resources
Geographic Area Cambodia
Impact & Trend Non-Comparable and Sporadic
Key Message Protected forests have a significant impact on protecting biodiversity, watersheds and maintaining forest cover. During the period 1993 to 2002, forest area under protection increased to 4.2 million ha, from 15% to 23.5% of the total land area. This increase is a result of two discrete actions by the Government rather than reflecting a steady and sustained trend in government-led protection efforts.

100 101
TECHNICAL INFORMATION A. Definition This indicator attempts to track the amount of forest area which is classified under the system of protected areas and the system of protected forests that includes: national parks, wildlife sanctuaries, protected landscape, multiple use areas and protected forests. The end result is expressed as a percentage of total land area. Forest area, as tracked by a separate indicator fact sheet, includes the area of natural and plantation forests, as well as the area of degraded forest, shrubland and bamboo forest. B. Data Source The official area of protected areas and protected forest areas including their dates of approval are extracted from the report on Cambodian Forest Cover Resources, published by the Forest Administration, Ministry of Agriculture, Forestry and Fisheries in January 2004. The protected areas were approved by the Royal Decree on 1 November 1993 and the protected forest was approved by different criteria, Royal Decree, Sub-decree and Declaration (Prakas) from 1996 to 2002. The Geographic Information system (GIS) dataset of protected areas used for the development of this indicator originates from the Department of Natural Resources Assessment and Environmental Data Management, Ministry of Environment (MoE). The GIS dataset of protected forest areas and 2002 forest cover used for the development of this indicator originates from the Forestry Administration (FA), Ministry of Agriculture, Forestry and Fisheries. The GIS dataset of forest cover between 1992-1993 and 1996-1997 was from the Mekong River Commission Secretariat and German Technical Assistance (MRC/GTZ). C. Geographic Area / Population Coverage Data are representative of all protected areas and protected forest for the entire country. D. Temporal Coverage The figure of percentage of forest under protection is based on a land cover mapping by FA which represents ground conditions in 2002, under the assumption that the forest cover would not have changed much since the bulk of the protected areas were established in 1993 or as new protected area/forest were added up to and including 2002. E. Methodology and Frequency of Coverage While the protected areas were established in 1993, some may have been expanded. The spatial extent of protected areas are being continuously maintained by the Department of Natural Resources Assessment and Environmental Data Management, MoE, and the spatial extent of protected forest areas are continuously maintained by FA. The assessment of forest cover is periodically performed by FA. Using the same GIS methodology described in this fact sheet, subsequent updates for this indicator can be derived when a new forest cover assessment is made, or based on the 2002 forest cover, when new protected areas or protected forest areas are added.

100 101
F. Methodology of Data Manipulation A GIS “overlay” was performed between the digital dataset of protected areas/forest and the digital dataset of 2002 land cover. The result of this GIS procedure is a table of forest area within each of the individual protected areas. This resulting forest area was then expressed as a percentage of the total land area for the individual protected area which in turn may or may not have been consistent with the official area figure for the protected area. This percentage figure (of forest cover) was then applied to the official area of the protected area and the results were tallied across all protected areas, using the date of decree of the protected area as the time element of the final indicator value.
QUALITATIVE INFORMATION A. Strength and Weakness (data level) The indicator is very similar to a United Nations (UN) recommended indicator, which is expressed as a percentage of total forest area. This UN indicator was considered but after further analysis it was concluded that the UN indicator is too sensitive to the situation outside the protected forest area. For example, if everything remains stable within the protected forest area and the remainder of the forest area is reduced, the indicator value will artificially rise. Expressing the result as a percentage of total land area overcomes this weakness and the results can better be related to the state indicator, that is also based on total land area of the country. Nevertheless, the computation is simple and the results are actually shown in this fact sheet using both denominators. The true indicator however is based on total land area. At the data level, the indicator is ideally suited because digital datasets of protected areas are continuously maintained and land cover mappings are available from time to time, usually as a result of a periodic forest cover assessment. B. Reliability, Accuracy, Robustness, Uncertainty (data level) The indicator value and the results are only as good as the digital datasets of protected areas and land cover represents the actual reality. The differences in the area of protected areas between the digital datasets and the official figures have not been recorded and this aspect is very sensitive to the scale and accuracy of the datasets utilized. C. Future Work Required (for data level and indicator level) There is no need to update this fact sheet and indicator on an annual basis and the indicator, as currently designed, need only be updated if new protected areas are added, or if gross errors are detected in the digital dataset of protected areas. If the aerial extent of the protected areas remains static over the next decade or so, and remembering that the protected areas are multiple use areas, the indicator could also be utilized to monitor the progress on forest protection within these protected areas. This would require further GIS overlays with future land cover mappings, hoping that the changes detected are not a result of improvements in the digital protected areas dataset, or differences between the different forest cover mappings.

102 103
SUPPORTING DATA TABLES, GRAPHS AND MAPS Figure 1: Protected Forest as a Percentage of Total Land Area – 1993-2002
15
16
17
18
19
20
21
22
23
24
1993 1994 1995 1996 1997 1998 1999 2000 2001 2002
Per
cen
ts o
f la
nd
are
a
Table 1: Total Forest Area 1992/93, 1996/97 and 2002 and
Forest Area Under Protection in 2002
Year Total Forest Area (ha)2002 Forest Area
Under Protection (ha)Protected Forest as a
Percentage of Total Land Area
1993 11,284,200 2,827,766 15.62
1996 10,638,209 2,829,945 15.63
1998 2,833,796 15.65
2000 2,834,826 15.66
2001 3,020,926 16.69
2002 11,104,293 4,233,963 23.39Source: Forestry Administration, MAFF and Department of Natural Resources Assessment and Environmental Data Management, MoE.Notes:- The total forest area for 1993, 1996 and 2002 are originally extracted from “Cambodian Forest Cover Resources 2004, FA, MAFF”.- The calculation of forest area under protection and its percentages are based on GIS layers of land cover 2002 matched by the protected area under official approval dates.- Percentage of forest cover is estimated within the total country’s land area of 18,103,500 ha.
Figure 2: Map of Protected Areas in Cambodia

102 103
Table 2: Percentage of Forest Cover by Protected Areas – 2002
Name Date of ApprovalForest Area 2002
(ha)% Forest Area in total land area
Multiple UseTonle Sap 1-Nov-93 195,761 1.08Samlaut 1-Nov-93 55,228 0.31Dong Peng 1-Nov-93 14,214 0.08Sub-Total in Multiple Use 265,203 1.46National ParkVirachey 1-Nov-93 329,157 1.82Phnom Kulen 1-Nov-93 33,557 0.19Botum Sakor 1-Nov-93 132,356 0.73Kirirom 1-Nov-93 28,061 0.16Phnom Bokor 1-Nov-93 132,742 0.73Ream 1-Nov-93 12,887 0.07Kep 1-Nov-93 1,071 0.01Sub-Total in National Park 669,831 3.7Protected LandscapePreah Vihear 1-Nov-93 3,555 0.02Banteay Chhmar 1-Nov-93 53,669 0.3Angkor 1-Nov-93 2,745 0.02Subtotal in Protected Landscape 59,969 0.33Wildlife SanctuaryKulen Promtep 1-Nov-93 382,845 2.11Roniem Daun Sam 1-Nov-93 92,744 0.51Lomphat 1-Nov-93 220,284 1.22Beng Per 1-Nov-93 229,069 1.27Phnom Prich 1-Nov-93 206,781 1.14Phnom Namlyr 1-Nov-93 47,864 0.26Phnom Samkos 1-Nov-93 323,668 1.79Aural 1-Nov-93 248,741 1.37Snuol 1-Nov-93 64,294 0.36Peam Krasop 1-Nov-93 16,475 0.09Subtotal in Wildlife Sanctuary 1,832,763 10.12Additional Area of Tonle Sap Bio-sphere Reserve, Transition Zone
18-Apr-01 186,100 1.03
Protected ForestPhnom Tamao Zoo 22-May-96 2,179 0.01Prek Teouk Sap 29-Oct-98 3,851 0.02Ang Trapang Thmar 22-Feb-00 1,030 0.01Mondul Kiri 30-Jul-02 392,463 2.17Preah Vihear 30-Jul-02 185,503 1.02Centre Cademon Mountain 30-Jul-02 370,716 2.05Seima, Snuol 12-Aug-02 264,354 1.46Sub-Total in Protected Forest 1,220,096 6.74Total Forest Areas under protection 4,233,963 23.39Notes: - Protected areas and protected forest names and their date approval originate from MoE, and FA, MAFF.- The forest area within protected areas/forest is calculated using GIS datasets based on Land Cover 2002.- Percentage of forest cover is estimated within the total country’s land area of 18,103,500 ha.

104 105
SUMMARY A. Policy Reference 1. Purpose: This indicator measures the part of the forest area which has been delineated for protection purposes. It is understood that the higher the percentage of the indicator, the better the performance of the country in protecting and conserving its forest resources. 2. Relevance to Environment Planning and Management: Forests serve multiple ecological, socio-economic, and cultural roles in many countries. They are among the most diverse and widespread ecosystems of the world. Forests provide many significant resources and functions including: wood products, recreational opportunities, habitat for wildlife, water and soil conservation, and a filter for pollutants. They support employment and traditional uses, and biodiversity. There is general concern over human impact on forest health, and the natural processes of forest growth and regeneration. Combating deforestation to preserve soils, water, air and biological diversity is explicitly considered in Agenda 21. This indicator measures societal response to protect biodiversity and landscapes through the creation of representative reserves of various forest ecosystems. It represents only one element of a sound forest conservation policy aimed at sustainable development. 3. Linkage to Other Indicators: This indicator is closely linked to others which relate to natural resource use and management. Closely associated indicators would include: protected area percentage of total land area, wood harvesting intensity, forest area, land use change, and threatened species. It is also linked to such socioeconomic and institutional indicators as population density and ratification of international agreements. 4. Targets: The Royal Government of Cambodia (RGC) has established a target indirectly related to this indicator to maintain the surface of 23 protected areas at the 1993 level of 3.3 million ha through 2015 and the surface of 6 new forest protected areas at the present level of 1.35 million ha through 2015 (CDMG, 2003). 5. International Environment Treaties: Many international agreements deal with forests within the context of natural resources and environment conservation, for example Convention on International Trade in Endangered Species (CITES), Convention on the Conservation of Wetlands of International Importance (Ramsar Convention), Convention on Biological Diversity, Convention on Climate Change, Conservation of Nature and Natural Resources. Cambodia signed the CITES convention in December 1975, but did not adhere to it until 1999. In 1996, Cambodia’s National Assembly approved a ministerial request to accede to the Convention on Wetlands of International Importance (Ramsar Convention), and in 1999 became a Contracting Party to the Convention. On 9 February 1995, Cambodia ratified the Convention on Biological Diversity (CBD). Cambodia ratified the Convention on Climate Change on 18 December 1995. Cambodia also became a signatory to the ASEAN Agreement on The Conservation of Nature and Natural Resources in April 1999.

104 105
B. Analysis In Cambodia, part of the total forest area is protected under both systems of protected areas and protected forest. As summarized in Figure 1 and Table 1, the 23 protected areas established in 1993 by the Royal Decree included 2.8 million ha of forest area, which corresponds to approximately 15% of the total land area of 18,103,500 ha. These 23 individual protected areas included 1.8 million ha of forest under Wildlife Sanctuaries, 0.7 million ha of forest under National Parks, 0.3 million ha of forest under the Multiple Use Protected Areas and 0.06 million ha of forest under the Protected Landscapes. In 2001, the Tonle Sap Multiple Use Area was nominated as a Biosphere Reserve and its transition zone increased the forest area under protection by 0.2 million ha. Additionally, the protected forest system is undertaken by Ministry of Agriculture, Forestry and Fisheries has been established since 1996 and continuously included approximately 1.2 million ha until 2002. Totally, 4.2 million ha of forest areas (23.4%) were under protection in 2002 (see Table 1). From Figure 1 and Table 1, it can be observed that the percentage of forest area within protected areas remained constant from 1993 to 2000 at approximately 16% of total land area. Since 2001, the Tonle Sap Multiple-Use Area has been nominated as the Biosphere Reserve and some protected forest was established in 2002, therefore, forest area under protection has increased to 17% in 2001and 23% in 2002.

106 107
Greater Mekong Subregion Indicator Fact Sheet DATABASE INFORMATION
Indicator ID
Indicator Name Threatened Species as a Percentage of Globally Threatened Species -1996 to 2004
Year of Assessment 2005
Type of Indicator STATE
Frequently Asked Question (FAQ) What share of globally threatened wildlife species have range within Cambodia?
Priority Concern Threats to Biodiversity
Geographic Area Cambodia
State & Trend Relatively Good with Undetermined Trend
Key Message As of the latest 2004 assessment, Cambodia could be providing sanctuary to approximately 1.6% of the globally threatened species. This percentage is relatively low when compared to other GMS countries where the average is around 3%. The main focus should be on some 10 individual species where the responsibility for the conservation of the species is shared with either Viet Nam or Thailand.

106 107
TECHNICAL INFORMATION A. Definition This indicator tracks the number of globally threatened species in Cambodia over time. It is expressed as the percentage of the number of threatened species at the national level over the number of threatened species at the global level. Threatened species are those defined by the International Union for the Conservation of Nature (IUCN) as vulnerable, endangered or critically endangered in the “Red List of Threatened Species”. Extinct and lower risk species (conservation dependent, near threatened or least concern) were not included in this indicator. Species under consideration include mammals, birds, reptiles, amphibians and fish; plant and insect species, for which the process of evaluation has only just begun, are excluded from the indicator figures. Sub-indicator values are also given for mammals, birds, reptiles, amphibians and fish species. For more information on the criteria utilized to classify threatened species as critically endangered, endangered or vulnerable, see the “Categories & Criteria” at www.redlist.org. For more information on the species habitat definitions utilized in the IUCN Red List, see the Major Habitats Authority File at www.redlist.org. For more information on the major threats definition utilized in the IUCN Red List, see the Major Threats Authority File at www.rdlist.org. B. Data Source All data utilized to construct this indicator were extracted from the IUCN Red List on the Internet (see www.redlist.org), in early 2005 and based on the 2004 online version of the IUCN Red List. C. Geographic Area / Population Coverage Figures are representative of the country as a whole and are not differentiated by any other spatial sub-category. The indicator value is computed for the total number of threatened mammals, birds, reptiles, amphibians and fish species; sub-indicator values are also given for each later category of species. D. Temporal Coverage Figures correspond to the contents of the 1996, 1998 (plants only), 2000, 2002, 2003 and 2004 IUCN Red Books. E. Methodology and Frequency of Coverage The IUCN Red List is continuously updated and the equivalent of the paper IUCN Red Book is being produced on an annual basis. The IUCN online Red List (see www.redlist.org) will be the most probable source for updating this indicator in the future. F. Methodology of Data Manipulation All the figures given in this fact sheet were either extracted from the online IUCN Red List database, through successive search criteria, or computed from the results of such searches. The search criterion for the online IUCN Red List is flexible; the flexibility also adds to the complexity. Two forms of search are available: simple search or expert search. For the compilation of this fact sheet, only the simple search menu was used since the expert search menu did not offer any added advantage.

108 109
Except for plants which are not part of the indicator definition, all searches were made against the entire database using an exact phrase search for keyword “Mammals” or “Birds” or “Reptiles” or “Amphibians” or “Fish”. For plants, the search was made against the taxonomy database using the “Plantae” keyword. For plants, using a keyword of “plants” against the entire database resulted in fewer hits. Likewise, keywords of “mammalia”, “aves”, “reptilia”, etc. against the taxonomy database may lead to unpredictable results. For the purpose of reporting progress to date in the evaluation of potential threatened species (see Table 2), the Red List category of “All Evaluated (excluding Least Concern)” was utilized to report the number of evaluated species. For the purpose of reporting the overall number of threatened species, a multiple selection of “CR-Critically Endangered” + “EN-Endangered” + “VU–Vulnerable” categories were selected. For the reporting of threatened species by Red List over time, multiple queries were conducted, with the above screening criteria and with the Red List assessment year criteria added. For the purpose of reporting threatened species by major habitat type or by major threat, the above threatened species criteria were applied against all years of the Red List year of assessment with the 1st level definition of the habitat or threat as additional search criteria. The calculation of ratios or percentages related to the downloaded figures should be obvious from the contents of the data tables. It is noted however that the percentage figure associated with the main indicator is based on the cumulative number of species added to the Red List, since 1996, and not just the annual figure.
QUALITATIVE INFORMATION A. Strength and Weakness (data level) The IUCN Red Books, or the IUCN online Red List, is a relatively new instrument to measure the degree of biodiversity loss of a particular country or region. It was initiated in 1996 without plant species, updated with only plant species in 1998, updated in 2000 but not in 2001, and it is only since year 2002 that it shows some degree of completeness and annual updating. This will improve in the next few years but the temporal trends which can be observed to 2004 are largely based on the level of effort that IUCN biologists have placed on certain species groups in certain years. The IUCN Red List is nevertheless the best source of consistent information of threatened species. For reasons stated above, the absolute number of threatened species that is placed on the Red List on an annual basis is not very indicative of the trends of biodiversity loss in a particular country or region. A cumulative number might be more indicative but the indicator demands a denominator so that the result can be compared with other countries or regions, and so that the indicator value is less biased by the progress of the work of the IUCN biologists. The annual ratio of (new) threatened species over the number of evaluated species was considered (see Table 2) but once again this indicator would be biased by the progress of the individual species assessments. Other denominators were considered, such as the annual number of threatened species over the cumulative number of threatened species for a particular country or region, but the number of globally threatened species, or the number of known threatened species to date, was finally selected as the denominator. The number of globally threatened species as the denominator provides a neutral denominator for the purpose of comparing one country or region to the other; it is also self-adjusting in terms of the progress that IUCN is having in terms of identifying and mapping the (country) range of all threatened species. IUCN provides these totals including the 2004 assessment year in the statistics section of their homepage (see www.redlist.org).

108 109
The indicator value, somewhat representing the global responsibility that the specific country or region has to protect the enumerated species at the start of the assessment, may appear extreme at the start of the assessment period but may well be reduced as assessments for other countries or continents, for related species or species groups, continues. In other cases, it may increase as the assessment regime approaches non-evaluated species in the biome of specific countries or regions. The selected indicator value and denominator is far from being perfect, but at the time of this initial assessment it appears to be the one best suited (given the room for improvement as discussed in one of the following sub-sections). The main weakness of the indicator (as discussed in the Future Work Required section below, is that is does not give added weight to the threatened species that are endemic to the country or region being considered, or to the lesser concern for species that are globally threatened but abundant in one specific country or region. B. Reliability, Accuracy, Robustness, Uncertainty (data level) As with all indicators that attempt to track environmental phenomena over time, this indicator is subject to much international debate and peer review with respect to choice of indicator (based on data availability), reliability, accuracy, robustness and uncertainty. The reliability of the indicator, especially its denominator, is very much hinged on the future success of IUCN in developing a true global perspective database on threatened species. The accuracy (of IUCN) is not questioned and the future use of the indicator (given IUCN’s future perspective) appears quite robust. As with all other indicators which attempt to reduce a complex phenomenon into a single variable, there is some level of uncertainty as to the appropriate (future) use of the indicator as new information sources emerge. One note is inserted here with respect to uncertainty and the targeting of one threatened species to a specific country. The IUCN online database sometimes targets one threatened species to a country with an implied level (a question (?) mark) of uncertainty. For the purpose of this indicator development and, limited by the IUCN Red List query capability, these questionable cases have been included with country or region-specific tabulations. C. Future Work Required (for data level and indicator level) The indicator value, with incremental annual figures, and especially the denominator, should be updated annually, provided IUCN provides such facility on an ongoing basis. It is expected the indicator value will converge to its intended purpose within less than half a decade, if not earlier. It is assumed that IUCN will provide updated global totals to serve as denominator in subsequent versions of this indicator As was previously mentioned above in the discussion on strengths and weaknesses of the indicator, the indicator could be improved, given time and Internet access resources, in giving added weight to threatened species which are endemic to the country or region of concern, and less weight to species which are threatened but which have a larger geographic range. The current online search facility is not ideal for this kind of tabulation (depends on manual count of enumerated countries), but such a tabulation and weight-ranking is not impossible.

110 111
SUPPORTING DATA TABLES, GRAPHS AND MAPS Figure 1: Threatened Species as Percent of Global Threatened Species – 1996-2004
0.0%
1.0%
2.0%
3.0%
4.0%
5.0%
6.0%
1996 1997 1998 1999 2000 2001 2002 2003 2004% o
f G
lob
ally
Th
rea
ten
ed
Sp
eci
es
Mammals Birds Reptiles
Amphibians Fish All Species
Table 1: Percentage of Threatened Species Over Global Threatened
Mammals
Assessment YearGlobally Threatened(cumulative number)
Nationally Threatened(cumulative number)
National/Global(%)
1996 1096 10 0.91%
2000 1130 20 1.77%
2002 1137 25 2.20%
2003 1130 26 2.30%
2004 1101 28 2.54%
Birds
Assessment YearGlobally Threatened(cumulative number)
Nationally Threatened(cumulative number)
National/Global(%)
1996 1107 0 0.00%
2000 1183 0 0.00%
2002 1192 0 0.00%
2003 1194 0 0.00%
2004 1212 26 2.15%
Reptiles
Assessment YearGlobally Threatened(cumulative number)
Nationally Threatened(cumulative number)
National/Global(%)
1996 253 2 0.79%
2000 291 14 4.81%
2002 293 14 4.78%
2003 293 14 4.78%
2004 304 15 4.93%

110 111
Amphibians
Assessment YearGlobally Threatened(cumulative number)
Nationally Threatened(cumulative number)
National/Global(%)
1996 124 0 0.00%
2000 146 0 0.00%
2002 157 0 0.00%
2003 157 0 0.00%
2004 1770 3 0.17%
Fish
Assessment YearGlobally Threatened(cumulative number)
Nationally Threatened(cumulative number)
National/Global(%)
1996 734 4 0.54%
2000 752 8 1.06%
2002 742 8 1.08%
2003 750 11 1.47%
2004 801 13 1.62%
All Threatened Mammals, Birds, Reptiles, Amphibians and Fish
Assessment YearGlobally Threatened(cumulative number)
Nationally Threatened(cumulative number)
National/Global(%)
1996 3314 16 0.48%
2000 3502 42 1.20%
2002 3521 47 1.33%
2003 3524 51 1.45%
2004 5188 85 1.64%Source: IUCN Red List 2004
Table 2: Species Evaluated and Threatened – 1996-2004
Mammals
Assessment YearEvaluated Species(annual number)
Threatened Species(annual number)
Ratio(%)
1996 24 10 41.67%
2000 13 10 76.92%
2002 5 5 100.00%
2003 1 1 100.00%
2004 5 2 40.00%
Birds
Assessment YearEvaluated Species(annual number)
Threatened Species(annual number)
Ratio(%)
1996 0 0
2000 0 0
2002 0 0
2003 0 0
2004 46 26 56.52%

112 113
Reptiles
Assessment YearEvaluated Species(annual number)
Threatened Species(annual number)
Ratio(%)
1996 3 2 66.67%
2000 13 12 92.31%
2002 0 0
2003 0 0
2004 1 1 100.00%
Amphibians
Assessment YearEvaluated Species(annual number)
Threatened Species(annual number)
Ratio(%)
1996 0 0
2000 0 0
2002 0 0
2003 0 0
2004 3 3 100.00%
Fish
Assessment YearEvaluated Species(annual number)
Threatened Species(annual number)
Ratio(%)
1996 8 4 50.00%
2000 17 4 23.53%
2002 0 0
2003 8 3 37.50%
2004 6 2 33.33%
Plants
Assessment YearEvaluated Species(annual number)
Threatened Species(annual number)
Ratio(%)
1996 66 30 45.45%
2000 5 0 0.00%
2002 0 0
2003 4 2 50.00%
2004 0 0Source: IUCN Red List 2004

112 113
Table 3: Threatened Species by Major Habitat Type – 2004
Habitat Mammals Birds Reptiles Amphibians Fish TotalCitations
%Forest 21 20 0 3 0 44 33.59%
Wetlands 2 15 0 3 5 25 19.08%
Artificial/Terrestrial 0 14 0 0 0 14 10.69%
Grasslands 4 9 0 0 0 13 9.92%
Shrubland 6 6 0 0 0 12 9.16%
Sea 1 5 1 0 1 8 6.11%
Coastlines 1 1 1 0 4 7 5.34%
Savanna 4 2 0 0 0 6 4.58%
Artificial/Aquatic 1 1 0 0 0 2 1.53%
Rocky Areas 0 0 0 0 0 0 0.00%
Caves and Sub-Terrananean Habitats
0 0 0 0 0 0 0.00%
Desert 0 0 0 0 0 0 0.00%
Introduced Vegetation 0 0 0 0 0 0 0.00%
Other 0 0 0 0 0 0 0.00%
Unknown 0 0 0 0 0 0 0.00%
Total Citations 40 73 2 6 10 131 100.00%Source: IUCN Red List – 2004
Table 4: Threatened Species by Major Threat Category
Major Threat Mammals Birds Reptiles Amphibians Fish TotalCitations
%Habitat Loss - Human Induced
19 26 5 3 1 54 32.93%
Harvesting (hunting- gathering)
15 18 6 0 39 23.78%
Human Disturbance 2 16 0 0 18 10.98%
Pollution (affecting habitat)
2 12 0 1 1 16 9.76%
Persecution 3 7 0 0 0 10 6.10%
Changes in native species dynamics
6 3 0 0 1 10 6.10%
Accidental Mortality 2 1 1 0 3 7 4.27%
Unknown 4 0 0 0 0 4 2.44%
Intrinsic Factors 2 0 1 0 3 1.83%
Invasive alien species 2 1 0 0 3 1.83%
Natural Disasters 0 0 0 0 0 0 0.00%
Other 0 0 0 0 0 0 0.00%
Total Citations 57 84 13 4 6 164 100.00%Source: IUCN Red List – 2004

114 115
Table 5: List of Individual Threatened Species
Scientific Name ClassYear
EvaluatedStatus
Population Trend
EndemicCountry GMS
Bos frontalis Mammals 2000 Vulnerable Declining no No
Bos javanicus Mammals 2000 Endangered Declining no No
Bos sauveli Mammals 2000 Critically Endangered
Declining no Yes
Capricornis sumatraensis
Mammals 1996 Vulnerable ? no No
Catopuma temminckii
Mammals 2002 Vulnerable Declining no No
Cervus eldii Mammals 1996 Vulnerable no with India
Cuon alpinus Mammals 2004 Endangered Declining no No
Dicerorhinus suma-trensis
Mammals 1996 Critically Endangered
? no No
Dugong dugon Mammals 1996 Vulnerable no No
Elephas maximus Mammals 1996 Endangered no No
Hylobates pileatus Mammals 2000 Vulnerable ? no Yes
Hylopetes alboniger Mammals 1996 Endangered ? no no
Lutrogale perspicillata
Mammals 2004 Vulnerable Declining no no
Macaca arctoides Mammals 2000 Vulnerable ? no no
Macaca leonina Mammals 2000 Vulnerable ? no no
Neofelis nebulosa Mammals 2002 Vulnerable Declining no no
Nomascus gabriellae
Mammals 2000 Vulnerable ? no yes
Nycticebus pygmaeus
Mammals 2000 Vulnerable ? no yes
Panthera tigris Mammals 2002 Endangered Declining no no
Pardofelis marmorata Mammals 2002 Vulnerable Declining no no
Prionailurus viverrinus Mammals 2002 Vulnerable Declining no no
Pseudonovibos spiralis Mammals 1996 Endangered ? with Viet Nam
yes
Pygathrix nemaeus Mammals 2000 Endangered ? no yes
Pygathrix nigripes Mammals 2000 Endangered ? with Viet Nam
yes
Rattus sikkimensis Mammals 1996 Vulnerable no no
Rhinoceros sondaicus Mammals 1996 Critically Endangered
? no no
Tapirus indicus Mammals 2003 Vulnerable Declining no with Malaysia
Ursus thibetanus Mammals 1996 ? no no
Acrocephalus tangorum
Birds 2004 Vulnerable Declining no no
Aquila clanga Birds 2004 Vulnerable Declining no no

114 115
Scientific Name ClassYear
EvaluatedStatus
Population Trend
EndemicCountry GMS
Aquila heliaca Birds 2004 Vulnerable Declining no no
Arborophila cambo-diana
Birds 2004 Vulnerable Declining with Thailand
yes
Arborophila davidi Birds 2004 Endangered Declining with Viet Nam
yes
Cairina scutulata Birds 2004 Endangered Declining no no
Columba punicea Birds 2004 Vulnerable Declining no no
Fregata andrewsi Birds 2004 Critically Endangered
Declining no no
Grus antigone Birds 2004 Vulnerable Declining no no
Gyps bengalensis Birds 2004 Critically Endangered
Declining no no
Gyps tenuirostris Birds 2004 Critically Endangered
Declining no no
Haliaeetus leucory-phus
Birds 2004 Vulnerable Declining no no
Heliopais personata Birds 2004 Vulnerable Declining no no
Houbaropsis benga-lensis
Birds 2004 Endangered Declining no no
Leptoptilos dubius Birds 2004 Endangered Declining no no
Leptoptilos javanicus Birds 2004 Vulnerable Declining no no
Mycteria cinerea Birds 2004 Vulnerable Declining no no
Oriolus mellianus Birds 2004 Vulnerable Declining no yes
Pavo muticus Birds 2004 Vulnerable Declining no no
Pelecanus philippensis
Birds 2004 Vulnerable Declining no no
Platalea minor Birds 2004 Endangered Declining no no
Polyplectron germaini Birds 2004 Vulnerable Declining with Viet Nam
yes
Pseudibis davisoni Birds 2004 Critically Endangered
Declining no with Indonesia
Rynchops albicollis Birds 2004 Vulnerable Declining no no
Thaumatibis gigantea Birds 2004 Critically Endangered
Declining no yes
Tringa guttifer Birds 2004 Endangered Declining no no
Crocodylus siamensis Reptiles 1996 Critically Endangered
no no
Eretmochelys imbricata
Reptiles 1996 Critically Endangered
no no
Amyda cartilaginea Reptiles 2000 Vulnerable no no
Batagur baska Reptiles 2000 Critically Endangered
no no

116 117
Scientific Name ClassYear
EvaluatedStatus
Population Trend
EndemicCountry GMS
Cuora amboinensis Reptiles 2000 Vulnerable no no
Cuora galbinifrons Reptiles 2000 Critically Endangered
no yes
Heosemys grandis Reptiles 2000 Vulnerable no with Malaysia
Hieremys annandalii Reptiles 2000 Endangered no with Malaysia
Indotestudo elongata Reptiles 2000 Endangered no no
Malayemys subtrijuga Reptiles 2000 Vulnerable no with Indonesia
Manouria emys Reptiles 2000 Endangered no no
Manouria impressa Reptiles 2000 Vulnerable no with Malaysia
Pelochelys cantorii Reptiles 2000 Endangered no no
Siebenrockiella crassi-collis
Reptiles 2000 Vulnerable no no
Chelonia mydas Reptiles 2004 Endangered Declining no no
Limnonectes tou-manoffi
Amphib-ians
2004 Vulnerable Declining with Viet Nam
yes
Paa fasciculispina Amphib-ians
2004 Vulnerable Declining with Thailand
yes
Rhacophorus anna-mensis
Amphib-ians
2004 Vulnerable Declining with Viet Nam
yes
Chela caeruleostig-mata
Fish 1996 Critically Endangered
with Thailand
yes
Probarbus jullieni Fish 1996 Endangered no with Malaysia
Scleropages formosus Fish 1996 Endangered no no
Tenualosa thibaudeaui Fish 1996 Endangered no yes
Dasyatis laosensis Fish 2000 Endangered ? no yes
Himantura oxyrhyncha Fish 2000 Endangered ? with Thailand
yes
Pristis zijsron Fish 2000 Endangered ? no no
Rhincodon typus Fish 2000 Vulnerable Declining no no
Aetomylaeus nichofii Fish 2003 Vulnerable Declining no no
Pangasianodon gigas Fish 2003 Critically Endangered
Declining no yes
Stegostoma fasciatum Fish 2003 Vulnerable Declining no No
Cheilinus undulatus Fish 2004 Endangered Declining no No
Haliaeetus leucory-phus
Fish 2004 Vulnerable no No
Note: On Population Trend, where ? means uncertain or don’t know, while a blank indicates that this has not yet been assessed)

116 117
Summary Statistics – 2004Number of Vulnerable Species 45
Number of Endangered Species 26
Number of Critically Endangered Species 14
Endemic to Cambodia 0
Endemic to Cambodia plus one other country 10
Endemic to GMS 21
Endemic to GMS countries plus one other country 8Source: IUCN Red List – 2004
Table 6: Comparative Indicator Values in 2004 for All GMS Countries
Country Mammals Birds Reptiles Amphibians Fish TotalCambodia 2.54% 2.15% 4.93% 0.17% 1.62% 1.64%
Lao PDR 3.09% 2.06% 3.95% 0.23% 0.75% 1.56%
Myanmar 3.63% 4.04% 8.55% 0.00% 1.25% 2.41%
Thailand 3.45% 4.13% 7.24% 0.17% 4.74% 2.91%
Viet Nam 4.00% 3.63% 8.88% 0.85% 3.50% 3.05%
Yunnan Province 2.91% 1.49% 3.95% 0.11% - 1.23%
GMS Average: 3.27% 2.92% 6.25% 0.26% n/a 2.13%Source: Findings of the SEF-II Project

118 119
SUMMARY A. Policy Reference 1. Purpose: The purpose of this indicator is to describe the maintenance of, or conversely, the loss of spe-cies diversity. It is understood that the smaller this number is for a specific country or region, the better the country or region is at the maintenance of species diversity. However the rise and fall of the indicator value over the years may or may not be indicative of the government responses within the country or region. Assessment of species outside the country or region leading to a rise in the denominator may result in the fall of the indicator value. Further assessments for species contained primarily within the country or region may temporarily inflate the value of the indicator.2. Relevance to Environment Planning and Management: Maintenance of biodiversity is essential for ecosystem wellbeing. Species diversity is one of the three main levels of biodiversity, the others being ecosystem and genetic diversity.3. Linkage to Other Indicators: This indicator is linked to other indicators that have implications for biodiversity. These include: protected area as a percentage of total area, loss of designated habitat, protected species, etc. 4. Targets: No specific targets for this indicator value have been set by the Government of Cambodia.5. International Environment Treaties: For this indicator, the more relevant convention is the Convention on Biological Diversity, which Cambodia ratified on 9 Feb 1995. Other relevant conventions and agreements that Cambodia ratified include:The Convention on International trade in Endangered Species, Cambodia signed in December 1975, but did not adhere to it until 1999. The Convention on Wetlands of International Importance (Ramsar Convention); in 1996 Cam-bodia’s National Assembly approved a ministerial request to accede to this convention and in 1999 became a Contracting Party. The Convention on Climate Change, which Cambodia ratified on 18 December 1995.The Agreement on Conservation of Nature and Natural Resources, which Cambodia became a signa-tory to the ASEAN Agreement in April 1999. B. Analysis As can be observed from Figure 1 and Table 1, Cambodia is a tentative sanctuary to approxi-mately 1.6% of the globally threatened species. This standing includes approximately 2.5% of glob-ally threatened mammals, 2% of globally threatened birds, 5% globally threatened reptiles, 1.6% of globally threatened fish and less than 1% of globally threatened amphibians. As can be observed from Table 2, the rise in the share of globally threatened species from 0.48% in 1996 to 1.64% in 2004 is largely attributed to the progress of the evaluation work and is not necessarily indicative of a trend of loss of biodiversity. As can be observed from Table 2, the 0.48% value in 1996 is based on the first version of the IUCN Red Book at which time only 50% of the relevant mammals had been evaluated, few reptile and fish species had been evaluated and at which time amphibians and birds were not included. The relevant amphibians and birds were in fact not evaluated until 2004 and therefore the indicator value and trend before 2004 has very little meaning.

118 119
But now that the indicator value is inclusive of all threatened species types, the future value of the indicator will be more indicative of the trend in the loss of biodiversity in Cambodia. It is not expected to vary dramatically from the 2004 figures. It may artificially rise if new globally threatened species also have sanctuary in Cambodia; it may artificially fall if new threatened species have sanc-tuary outside of Cambodia. While the indicator serves well to measure Cambodia’s share of global priority, only changes in the status of individual species (see Table 5) can be utilized to measure progress at the national level. Apart from the indicator value itself, the IUCN database of threatened species has also provid-ed some insight as to what are the habitats of those species relevant to Cambodia and what are the major threats to those threatened species. As can be observed from Table 3, forests are the dominant habitat for approximately 33% of the threatened species in Cambodia for threatened mammals, birds and amphibians but loss of wetlands is also an important factor. Artificial/terrestrial habitats, which include arable land and pasture land, are also an important habitat for some of Cambodia’s threat-ened bird species. Therefore societal responses which attempt to protect non-forest areas may be of equal importance and the last column of Table 3 might be a model for the ideal composition of protected areas in Cambodia. Based on the same IUCN database, Table 4 provides some insight as to the major threats rel-evant to the threatened species in Cambodia. Loss of habitat is the dominant threat for one third of the threatened species but harvesting is a close second. Therefore societal responses which deal with the hunting and gathering of these threatened species may be of equal importance as those societal responses which attempt to protect their habitats. Table 5 lists all of the currently threatened species which have sanctuary in Cambodia along with their current 2004 standing on the IUCN Red List. As of 2004, 45 species were listed as vulner-able, 26 as endangered and 14 as critically endangered. Any future decrease in the level of endanger-ment of these species, or the removal of the species from this list, is indicative of progress in con-serving biodiversity; any future increase in the level of endangerment will be a negative indication of progress. It can also be noted from Table 5 that none of Cambodia’s share of the globally threatened species are endemic to Cambodia and therefore Cambodia alone is not solely responsible for its 1.6% share of globally threatened species. However, for 10 of the threatened species, Cambodia and one of its GMS neighbors share the total responsibility. It can also be observed from Table 5 that 21 of Cambodia’s current 85 threatened species are endemic to GMS countries. Table 6 provides the basis for comparing the current value of the indicator with other GMS countries, or with GMS countries as a whole. As can be observed from Table 6, Cambodia’s 1.6% of globally threatened species is relatively low compared to an average of 2.13% for all six GMS coun-tries and the third lowest of all other GMS countries after Yunnan Province and Lao PDR. Reptiles are the largest contribution to Cambodia’s share of the threatened species; however none of these reptiles are endemic to Cambodia. Based on this comparison of this indicator with the indicator value of other GMS countries, it is concluded that the current state of biodiversity in Cambodia is relatively good, with no observable past trends and an expectation that the global share of Cambodia’s threatened species will remain constant in the very near future.

120 121
Greater Mekong Subregion Indicator Fact Sheet DATABASE INFORMATION
Indicator ID
Indicator Name Loss of Critical Habitat between 1993 and 1997
Year of Assessment 2005
Type of Indicator Pressure
Frequently Asked Question (FAQ) What are the trends in the loss of critical habitat to support biodiversity in Cambodia?
Priority Concern Threats to Biodiversity
Geographic Area Cambodia
Magnitude & Trend Non-Comparable with Undetermined Trend
Key Message Although pressure exists on biodiversity, there is not enough information to establish a long term trend. The pattern of habitat loss in Cambodia defies easy generalizations. The pressure on biodiversity furthermore depends on the intensity of hunting and gathering in each habitat and trade in wildlife for which systematic data are not available.

120 121
TECHNICAL INFORMATION A. Definition This indicator attempts to track the amount of loss of critical habitats over time. It is expressed as the percentage gain or loss, over total land area, of critical habitat areas. Critical habitats for the purpose of constructing this indicator are defined as Forests, Wetlands, Artificial/Terrestrial, Grasslands, and Shrublands, according to the International Union for the Conservation of Nature (IUCN) Habitat Authority File (see www.redlist.org). However the data utilized for the construction of this indicator, which originates from the Mekong River Commission Secretariat (MRC) and the German Technical Assistance (GTZ) utilizes a slightly different definition of these critical habitats whereby:
• Forest: is a combination of evergreen forest, semi-evergreen forest, deciduous forest, re-growth of secondary forest, forest plantation and bamboo.
• Wetlands: include swamps, marshes and other open water surfaces such as rivers, streams, ponds, lakes, etc., and inundated shrub.
• Artificial/Terrestrial: is a combination of shifting cultivations, agriculture and urban areas such as village gardens and build-up areas.
• Grasslands: includes grasslands and savanna. • Shrublands: is a combination of wood and shrub-land evergreen and dry.
B. Data Source Figures are extracted from “Cambodian Forest Cover Resources” published by Forest Administration under Ministry of Agriculture, Forestry and Fisheries in January 2004. Land cover and land use data originates from the 1998 Mekong River Commission Secretariat and German Technical Assistance (MRC/GTZ) based on two separate LANDSAT land cover mappings. C. Geographic Area / Population Coverage Estimates of critical habitat loss are representative of the country as a whole based on a total land area of 18,152,985 ha. Note that this denominator value may be different from that utilized for the construction of other indicator fact sheets. D. Temporal Coverage Estimates of land cover change utilized in this fact sheet are the period 1993 to 1997, describing a very short segment of what is probably a long history of critical habitat loss. 1997 is the last year for which data are available for habitats other than forest. E. Methodology and Frequency of Coverage The MRC/GTZ land cover mapping was based on Landsat-TM satellite imagery and digitized from 1:250,000 scale prints. This land cover mapping, with a 50 ha resolution, is a time-bound effort by the MRC/GTZ unlikely to be repeated in the future. Forestry Administration may be producing future land cover mappings but their focus is on forest cover and their classification may or may not differentiate the critical habitats required for this indicator.

122 123
F. Methodology of Data Manipulation The original figures were available in hectares and also as a percentage of total land area (based on total land area of 18,152,985 ha) and have not been manipulated for the purpose of this fact sheet. In accordance with the previous IUCN definitions of critical habitats and the MRC/GTZ definitions of land cover, the MRC/GTZ land cover classes and their associated figures have been re-compiled such that:
• Forest Habitat includes 15 MRC/GTZ land cover classes known as: Evergreen Dense, Evergreen Disturbed, Evergreen Mosaic, Mixed Dense, Mixed Disturbed, Mixed Mosaic, Deciduous, Deciduous Mosaic, Forest Re-growth, Inundated Forest, Inundated Forest Re-growth, Mangrove Forest, Forest Plantation and Bamboo.
• Wetland Habitat includes Open Water, Wetland and Shrub Inundated. • Artificial/Terrestrial Habitat includes Mosaic of Cropping, Agriculture Land and Urban Area; • Shrubland Habitat includes Wood/Shrubland Evergreen and Wood/Shrubland Dry. • Grassland Habitat is according to the MRC/GTZ definition of Grasslands.
QUALITATIVE INFORMATION A. Strength and Weakness (data level) The definition of critical habitats utilized for this indicator is based on an analysis of the major habitats associated with each of the threatened non-plant species on the IUCN Red List. According to Table 3 of the related state indicator for this priority concern, reproduced in this fact sheet as Table 2, loss of forest habitat was cited as the major threat for approximately 33% of the threatened wildlife species. Likewise, wetland habitat accounted for 19% of the citations, artificial/terrestrial habitat, which includes arable land and pasture land, was cited in approximately 11% of the cases, followed by grasslands and shrublands (approx. 10% and 9% of the citations, respectively). The percentages taken together total 82.44 %, i.e. some IUCN Red List species are found outside the five selected habitats. These other habitats are then considered non-critical and are not included in this indicator. The indicator is therefore aimed at these five critical habitats where wildlife species are threatened. At the data level, the indicator is based on only two and very recent observations of habitat area. The indicator may therefore not be indicative of the long-term trends of habitat destruction in Cambodia. The historical nature of that process should be considered when interpreting the results of this indicator. B. Reliability, Accuracy, Robustness, Uncertainty (data level) The multi-temporal land cover data utilized to construct this indicator was produced from satellite imagery and is subject to all the inaccuracies and uncertainties associated with this type of activity. The 1:250,000 working scale is also not very accurate for the detection of smaller habitats. The more recent forest cover mapping completed by the Forest Resource Management (FRM) division of the Ministry of Agriculture, Forestry and Fisheries (MAFF) reflects ground conditions in 2002 and offers greater accuracy of estimates of forest cover without, however, making it possible to identify critical habitats. C. Future Work Required (for data level and indicator level) The MRC and GTZ figures of land cover utilized here are based on only two points in time (1993 and 1997). Although the land cover is not expected to change rapidly in the near future, any work related to the mapping and monitoring of non-forest land cover classes at the national level would be beneficial to the further development of this indicator.

122 123
SUPPORTING DATA TABLES, GRAPHS AND MAPS Figure 1: Loss of Critical Habitats as a Percentage of Total Land Area – 1993-1997
-1.40
-1.20
-1.00
-0.80
-0.60
-0.40
-0.20
0.00
0.20
0.40
0.60
0.80
1.00
1.20
1.40
1.60
1.80
2.00
Forest
Wetland Artificial/Terrestrial Grassland
Shrubland
Table 1: Loss of Critical Habitats as a Percentage of Total Land Area – 199-1997
Ecosystem type1992/93 1996/97 Loss of Habitat
Area (ha)% of Total Land Area
Area (ha)% of Total Land Area
%
Forest 10,891,918 60 10,671,936 58.79 -1.21
Wetland 537,242 2.96 552,478 3.04 0.08
Artificial/Terres-trial
4,022,304 22.16 4,358,435 24.01 1.85
Grassland 476,804 2.63 488,643 2.69 0.07
Shrubland 2,204,223 12.14 2,059,449 11.34 -0.8
Total Land Area 18,152,985Source: Forest Administration, Ministry of Agriculture, Forestry and Fishery

124 125
Table 2: Threatened Species by Major Habitat Type - 2004
Habitat Mammals Birds Reptiles Amphibians Fish TotalCitations
%
Forest 21 20 0 3 0 44 33.59%
Wetlands 2 15 0 3 5 25 19.08%
Artificial/ Terrestrial
0 14 0 0 0 14 10.69%
Grasslands 4 9 0 0 0 13 9.92%
Shrubland 6 6 0 0 0 12 9.16%
Sea 1 5 1 0 1 8 6.11%
Coastlines 1 1 1 0 4 7 5.34%
Savanna 4 2 0 0 0 6 4.58%
Artificial/ Aquatic
1 1 0 0 0 2 1.53%
Rocky Areas 0 0 0 0 0 0 0.00%
Caves and Sub-terranean Habitats
0 0 0 0 0 0 0.00%
Desert 0 0 0 0 0 0 0.00%
Introduced Vegetation
0 0 0 0 0 0 0.00%
Other 0 0 0 0 0 0 0.00%
Unknown 0 0 0 0 0 0 0.00%
Total Citations 40 73 2 6 10 131 100.00%Source: IUCN Red List – 2004

124 125
SUMMARY A. Policy Reference There is no direct government policy on converting more land to agriculture or urban land expansion, but the policy has focused on land administration. An important element in land management by the government is the provision of improved tenure security. The government is focusing on accelerating the provision of private land titles in the hopes that secure title will lead to improved management of natural resources, improved land husbandry, and poverty alleviation. Government will also need to improve its overall coordination of land use planning and land allocation. This includes improving the land inventory system and the national classification system and developing land use plans for forests, agricultural development areas, key urban areas, and road corridors. (Cambodia Environment Monitor 2003) 1. Purpose: The purpose of this indicator is to measure the loss of critical habitat known to be the prime determinant to the threat to wildlife species in Cambodia. 2. Relevance to Environment Planning and Management: Habitats are as diverse as the plants and animals that live in them. Most plants and animals are uniquely adapted to survive in a specific habitat, and if that habitat is destroyed, the plant or animal’s survival is severely threatened. Emphasis on the preservation of habitats’ integrity should then become one of the guiding principles in zoning and land use planning decisions at both central and local levels. 3. Linkage to Other Indicators: The indicator is directly related to its state indicator “cousin” for which some of the analysis in the choice of this indicator can be found in the state indicator fact sheet for the related priority concern. This indicator of the loss of critical habitat may also be useful for the analysis of other priority concerns such as natural resources use, land use change, and threatened species. 4. Targets: No specific targets have been set by the government of Cambodia to reduce the loss of critical habitats. 5. International Environment Treaties: Cambodia has become a signatory to a variety of international conventions and agreements of direct relevance to biodiversity management, use and protection; they include:
• The Convention on Biological Diversity (CBD), which Cambodia ratified on 9 Feb 1995. • The Convention on International Trade in Endangered Species (CITES), Cambodia signed in
December 1975, but did not adhere to it until 1999. • The Convention on Wetlands of International Importance (Ramsar Convention); in 1996
Cambodia’s National Assembly approved a ministerial request to accede to this convention and in 1999 became a Contracting Party.
• The International Plant Protection Conservation (IPPC), Cambodia adhered to the Convention in 1952.
• The Agreement on Conservation of Nature and Natural Resources, Cambodia became a signatory to ASEAN’s Agreement in April 1999.
B. Analysis Changes in the area of selected habitats as percentage of the country’s total land area have been estimated for five habitats identified as critical ((forestland, wetland, artificial/terrestrial, grassland and shrubland – see Table 2) between 1993 and 1997.

126 127
As can be observed from Figure 1 and Table 1, in the 4 year period from 1993 to 1997, forest habitat declined by 1.21%, followed by shrubland which declined by 0.8%. Conversely, land classified as artificial/terrestrial increased by 1.85% during the same period, wetlands by 0.08% and grasslands by 0.07%. The increase in artificial/terrestrial class agrees with the common perception about the direction of land use changes in most GMS countries in which farming and urban expansion (components of “artificial/terrestrial” class) gain at the expense of other land categories. These results need to be compared with other results to correctly gauge their relevance and importance, especially with Tables 3 and 4 of the related state indicator fact sheet. Table 2 ranks habitats by the number of threatened species found there and was the basis for our selection of habitats as critical. The results presented in Figure 1 and Table 1 here suggest that changes in the area of habitats need not be well correlated with the pattern of threats to underlying biodiversity despite the widely accepted (and confirmed – see Table 3 of the related state indicator fact sheet) view that habitat loss is a prime threat to species. Especially where periods of evaluation are too short to establish trends, it is possible to observe increases in habitats coexisting with high threat (such as under the category “artificial/terrestrial”) and vice versa. For the relationship between habitat changes and threats to species being established more securely, both (i.e. not only the change of the area of habitats) would need to be expressed in terms of the rate of change. Only then would we be able to say –still imperfectly—how habitat loss is related to species threats. This suggests that periodic updating of Table 2 would add significantly to our understanding of that relationship among other factors. That such updating would be ideally accompanied by fresh estimates of the areas of habitats should be clear by now. Based on these observations, it can be concluded that:
• Changes in the area of critical habitats have been relatively slow (though it would be beneficial to have data for a longer period than 1993-1997).
• Our interpretation may be crucially affected by the results of Table 3 of the related state indicator fact sheet that asserts that habitat loss is the prime cause of threat.
• If Tables 3 and 4 of the state indicator provide a solid basis and that it is indeed the area of habitats that “rules”, our conclusion should be that the pressure on biodiversity in Cambodia has not changed significantly during the studied period. If, on the other hand, Table 4 provides a poor basis and if another factor(e.g. number of hunters) “rules”, then we may have constructed a less useful indicator of pressure.
The high incidence of threatened biodiversity in “artificial/terrestrial” land class should be an invitation to reconsider the view that farming and peri-urban development is necessarily an enemy of biodiversity. In any event, our choice of that category as “critical habitat” in itself is worth reflection.

126 127
Greater Mekong Subregion Indicator Fact Sheet DATABASE INFORMATION
Indicator ID
Indicator Name Protected Areas as a Percentage of Total Land Area - 1993 to 2002
Year of Assessment 2005
Type of Indicator Response
Frequently Asked Question (FAQ) Is the system of protected areas in Cambodia providing adequate sanctuary to threatened and endangered species?
Priority Concern Threats to Biodiversity
Geographic Area Cambodia
Impact & Trend Significant and Consistent
Key Message Since its initial establishment in 1993, Cambodia’s system of protected areas has designated a relatively high proportion of the total land area to conservation. However, it remains to be determined what the effective level of protection is in the face of continued and widespread pressure on biological and other natural and cultural resources in Cambodia.

128 129
TECHNICAL INFORMATION A. Definition This indicator attempts to track the extent of protected areas over time; it is expressed as the percentage of protected area over total land area. Protected areas under the Cambodian system of protected areas and protected forests include: national parks, wildlife sanctuaries, protected landscapes, multiple use areas, protected forests, wetlands of international importance (Ramsar sites) and biosphere reserves. Protected areas are managed by the Ministry of Environment (MoE) whereas protected forests are managed by the Ministry of Agriculture, Forestry and Fisheries (MAFF). Protected forests are not aimed to protect only forests; they are only designated protected forest by nature of their management jurisdiction. Protected forests include a Flora and Fauna Conservation Area (Mondul Kiri), a Wildlife Conservation Area (Preah Vihear), a Biodiversity Conservation Area (Central Cardamom), a Zoo (Ta Mao) and a Sarus Crane Conservation Area (Ang Trapang Thmar). According to the World Conservation Union (IUCN), a protected area is an area dedicated to the protection and maintenance of biological diversity, and of natural and associated cultural resources, and managed through legal or other effective means. In November 1993, H.M. King Norodom Sihanouk issued a Royal Degree designating 23 protected areas, including 7 national parks, 10 wildlife sanctuaries, 3 protected landscapes and 3 multiple use areas. The 4 categories reflect the different characteristics and management objectives for these areas and correspond to international classifications such of those of the IUCN. Another seven protected forests were established by the Forest Administration under the Ministry of Agriculture, Forestry and Fisheries after 1996. The Boeung Chmar portion of Tonle Sap Multiple-Use Area, the Koh Kapik wetland and associated islets in the Peam Krasop Wildlife Sanctuary, and the middle stretches of the Mekong River Area between Stoeng Treng and the border with Lao PDR were designated as Ramsar Sites at the time of Cambodia’s accession to the Convention, 23 October 1999. In April 2001, the Royal Government of Cambodia nominated the Tonle Sap Multiple-Use Area as Biosphere Reserve and extended the area as transition zone. The transition zone is an integrated economic zone, which is managed for sustainable agriculture, human settlement and land use, without having adverse effects on the flooded forest, water quality and soils of the region around the Tonle Sap Lake. Designating additional protected areas is clearly relevant but may not be sufficient to ensure calibrated and effective protection of biodiversity. In order to judge better the effectiveness of response it is necessary to examine how administrative steps (protected area designation) match the biological reality (distribution of habitats). For the purpose of quantifying the major habitats types within protected areas, the following Mekong River Commission Secretariat and German Technical Assistance (MRC/GTZ) land cover definitions were adopted: Evergreen Forest Evergreen forest usually contains multi-storied forests where trees keep their leaves throughout the year. They are always found on hills and along the course of streams and rivers. They comprise the lowland tropical rain forests, the hill evergreen forests and dry evergreen forests. A certain percentage of the deciduous trees may be included as well and most moist deciduous forests may not be distinguishable from the evergreen forests.

128 129
Semi-Evergreen Forest Semi-evergreen forest appears evergreen during the whole year, even though the variable feature of the forest is the trees’ height. Since the upper layers drop their leaves in the dry season, the trees which have no leaves are intermixed with the evergreen forest type. The signature can be quite similar to evergreen forests although the former appear more brownish or grayish in the dry season. The texture is usually rougher than evergreen forests. The images taken within the dry season clearly reveal variability that is difficult to separate under conditions of variable crown cover. This class also includes mixed deciduous forests types. Coniferous forest is also included in this class. Deciduous Forest This class contains dry mixed deciduous forests and dry dipterocarp forest. Deciduous forests drop their leaves more or less completely during the dry season. The signatures vary form reddish violet to yellowish brown at the end of the wet season, and from brownish green to bluish grey during the dry season with the medium to smooth texture. Human impact such as fire is usually much higher compared to other forest types. Dry dipterocarp forests naturally have an open character. Undisturbed, they may have a crown cover of only 40%. The soil and the grass layer can have significant impact on the reflection of these forests, it is impossible to separate crown cover differences consistently. The separation to deciduous shrub-land is difficult during the wet season and almost impossible during the dry season. Regrowth of Secondary Forest The class “forest re-growth” stands for a continuous, usually dense layer of smaller tree. The spectral signature can be described as saturated red with a fine to medium texture, on shaded slopes the signature maybe dark brown red. Stunted forests, which grow very slowly due to poor site conditions, may look quite similar to forest re-growth and may be included in this class. The forest re-growth class does not include re-growth of shrubs, small bamboo or small trees growing as a result of shifting cultivation. The separation between this class and “Wood and Shrub-land” was not always easy, and may have utilized addition information such as aerial photos or knowledge of local conditions. Forest Plantation This class contains “forest plantation” such as rubber, teak (Tectona grandis) and pine. However, only the areas actually covered by tree layer should be mapped, excluding plantation areas under preparation or without a tree layer. Wood and Shrubland, Evergreen Wood and shrub-land includes mixed shrubs, grass and trees, the tree cover remaining between 0 to 20 percent. The evergreen sub-type of this class can be found mainly on shallow soils, on the top of mountains under climax condition or as a result of non-sustainable land use (degraded land, frequent forest fire). The signature remains light red during the whole year. A sub-variant of this class represents forest re-growth after shifting cultivation. There is usually a dense layer of shrub and grass with some small trees and a significant proportion of bamboo. Wood and Shrubland Dry A dry variant of this class can be found in the dry plains or on the plateaus of the southern part of the L.M.B, but also on dry and sun exposed slopes. The appearance often remains of a dry savanna where the signature is light grey during the dry season light brownish grey to violet during the wet season, and the texture is medium to rough. Grassland In dry conditions grassland is displayed in bluish grey tones during the dry season showing a smooth texture. In the humid domain grassland is light red with a component of yellow to white almost the whole year.

130 131
Bamboo Large areas of dense bamboo are usually discernible due to their pink and orange color and their typical texture. A sparse bamboo coverage or small bamboo will not be discernible and will remain in one of the classes before analysis of the medium and smooth texture. Mosaic of Regrowth, Shrubs and Recent Cropping (sifting cultivation) This class contains a mixture of fields actually under cropping or in various stages of fallow with shrubs and re-growth. The pattern shows a mosaic of red, white, grey, and black patches. Re-growth is found in the sifting cultivation areas after the land has been abandoned and also contains young trees. If not cleared again, the chances of becoming forest are theoretically high. Small tree blocks can also be found within this class. However the percentage of forest blocks should be below 40%, or they would have to be classified “mosaic of forest” (fragmented forests). Agriculture The class agriculture is delineated as one class without further differentiation. It contains permanent fields, mainly paddy fields, or mixed agricultural land, as long as the agricultural component appears to be dominant. Additional knowledge of the areas is often required for a good interpretation. Permanent mixed agriculture on the slope, as occurs frequently in the Central Highland of Viet Nam is difficult to separate from shifting cultivation. Urban Areas If a village can be found (check also the line structure), the class should be classified. Small village contain fruit tree and tree without clear boundaries. The urban extent of villages may have been done after the classification using GIS. Wetland Wetland contains swamps and marshes. Due to the high water content the signatures are usually dark grey, in case of a grass layer the dark tones are mixed with light red pink tones. For our purposes, the above MRC/GTZ land cover classes were reclassified in the following five biodiversity habitat classes: Forest: includes evergreen forest, semi-evergreen forest, deciduous forest, re-growth of secondary forest, forest plantation and bamboo. Wetland: includes swamps, marshes and other open water surfaces such as rivers, streams, ponds, lakes… etc. and inundated-shrub. Artificial/Terrestrial: includes shifting cultivations, agriculture and urbanized areas such as village gardens and build-up areas. Grasslands: considered and mapped as a single class. Shrublands: includes wood and shrub-land evergreen and dry. B. Data Source The official figures for protected areas and protected forest areas, including the dates of their approval, are extracted from “Cambodian Forest Cover Resources” published by the Forest Administration under Ministry of Agriculture, Forestry and Fishery in January 2004. Wetlands of international importance (Ramsar sites) and biosphere reserves are extracted from a list of Protected Areas available at the Department of Natural Resources Assessment and Environmental Data Management under the Ministry of Environment. The GIS dataset of protected areas utilized for the development of this indicator originates from the Department of Natural Resources Assessment and Environmental Data Management under the Ministry of Environment. The GIS dataset of protected forest areas utilized for the development of this indicator originates from the Forestry Administration under the Ministry of Agriculture, Forestry and Fisheries. The GIS dataset of land cover for 1996-97 originates from the Mekong River Commission Secretariat and the German Technical Assistance (MRC/GTZ).

130 131
C. Geographic Area / Population Coverage Data are representative of all protected areas and protected forest for the country as a whole based on a total land area of 18,103,500 ha. D. Temporal Coverage Protected areas were approved by a Royal Decree signed on 1 November 1993. Protected forests were approved by several Royal Decrees, Sub-decrees and Declarations (Prakas) from 1996 to 2002. As to habitats, figures for the areas of each of the five biodiversity habitats are based on a land cover mapping reflecting the ground conditions in 1997. E. Methodology and Frequency of Coverage Figures and GIS datasets for the spatial extent of protected areas are being continuously maintained by Department of Natural Resources Assessment and Environmental Data Management under the Ministry of Environment. The spatial extents of protected forest areas are being continuously maintained by Forestry Administration under the Ministry of Agriculture, Forestry and Fisheries. Land cover mapping at the national scale is periodically conducted by the Forestry Administration under Ministry of Agriculture, Forestry and Fisheries. F. Methodology of Data Manipulation Area figures for individual protected areas were obtained from official sources and are quoted as given. Figures based on the proportion of total land area are based on a total land area of 18,103,500 ha. The match of the official protected area structure and the habitats, i.e. the representativeness with which each habitat is reflected in the composition of the protected area system, was determined by a GIS overlay of protected areas against a 1997 land cover mapping (and the habitats inherent in this mapping). Each of the habitats is then expressed as a percentage of the official protected area figure. These selected habitat areas have been expressed as a percentage of the official protected area figure, assuming that the balance of the protected area falls under the category of “other land covers”.
QUALITATIVE INFORMATION A. Strength and Weakness (data level) As shown in Table 4 of the state indicator fact sheet for threats to biodiversity, loss of habitat is cited as the major threat to almost 33% of the threatened species, followed by hunting and gathering at 24%. Therefore a response indicator which captures the level of habitat protection is appropriate and could be complemented by one which attempts to track the level of protection given to individual species. However, a response indicator that tracks only protected areas has two main weaknesses. First, it does not capture the quality of management, i.e. whether the areas are in fact protected from incompatible uses. Second, the indicator does not show how representative the protected areas are of the country’s ecological diversity.

132 133
To overcome the above weaknesses, the system of protected areas has been mapped to IUCN protection categories to give an indication of the level of protection which is associated with each of the protection categories in the Cambodian system of protected areas. The habitat composition of each protected area has also been added to give an indication of the types of habitats that the system of protected areas is attempting to protect. As a result, the habitat composition of all existing protected areas can be compared with the ideal habitat composition as dictated by the threatened species (Table 3 of the related state indicator). B. Reliability, Accuracy, Robustness, Uncertainty (data level) Area figures for protected areas are based on official country estimates and are subject to refinement and improvement as boundaries are demarcated by the Department of Natural Resources Assessment and the Environmental Data Management unit of the Department of Natural Conservation and Protection. C. Future Work Required (for data level and indicator level) The indicator figures should be revised as any protected areas change or as new protected areas are added. Any work related to the improvement of the accuracy of the GIS datasets which are utilized to represent these protected areas and protected forests would be beneficial to the reliability of this indicator. If feasible, the coordinates of the protected area definition should be based on boundary demarcations and not on the manual digitization of such boundaries. The extension of this indicator to match protected areas to habitat types was based on a time-bound effort in mapping land cover by the MRC and GTZ in 1997. More recent forest cover mappings conducted by the Ministry of Agriculture, Forestry and Fisheries (MAFF) could not be utilized for this purpose because the mapping of non-forest classes is not very reliable. Although the land cover of protected areas is not expected to change rapidly over the years, any work related to the mapping of non-forest land covers at the national level would be beneficial to the further development of this indicator.

132 133
SUPPORTING DATA TABLES, GRAPHS AND MAPS Figure 1: Protected Areas as a Percentage of Total Land Area – 1993-2002
32.04
18.09 18.12 18.20 18.27
24.72
18.0818
20
22
24
26
28
30
32
34
1993 1994 1995 1996 1997 1998 1999 2000 2001 2002
Per
cen
t
Table 1a: Protected Areas as a Percentage of Total land Area – 1993-2002
Year Protected Areas (ha) %of Total Land Area
1993 3,273,200 18.08
1996 3,274,400 18.09
1998 3,280,427 18.12
1999 3,295,027 18.2
2000 3,307,677 18.27
2001 4,474,677 24.72
2002 5,800,895 32.04 Note: Total Land Area = 18,103,500 ha Source: Ministry of Environment and Ministry of Agriculture, Forestry and Fisheries

134 135
Figure 2: Map Protected Areas and Protected Forests in Cambodia – 2002
Table 1b: Individual Protected Areas with their IUCN Designation
Name Area (ha) Year Approved IUCN Category
Multiple Use Areas
Tonle Sap 316,250 1-Nov-93 VI
Samlaut 60,000 1-Nov-93 VI
Dong Peng 27,700 1-Nov-93 VI
Sub-Total: Multiple Use Areas 403,950
National Parks
Virachey 332,500 1-Nov-93 II
Phnom Kulen 37,500 1-Nov-93 II
Botum Sakor 171,250 1-Nov-93 II
Kirirom 35,000 1-Nov-93 II
Phnom Bokor 140,000 1-Nov-93 II
Ream 21,000 1-Nov-93 II
Kep 5,000 1-Nov-93 II
Sub-Total: National Parks 742,250
Protected Landscapes
Preah Vihear 5,000 1-Nov-93 V
Banteay Chhmar 81,200 1-Nov-93 V
Angkor 10,800 1-Nov-93 V
Subtotal: Protected Landscapes 97,000
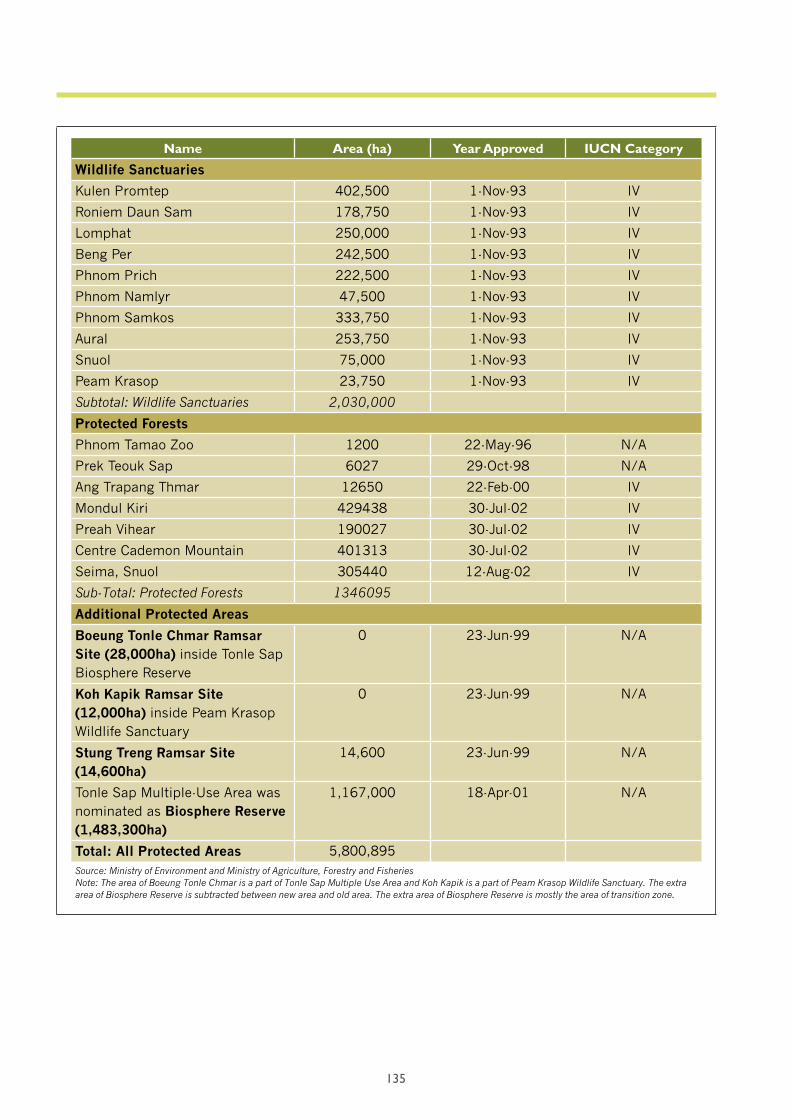
134 135
Name Area (ha) Year Approved IUCN Category
Wildlife Sanctuaries
Kulen Promtep 402,500 1-Nov-93 IV
Roniem Daun Sam 178,750 1-Nov-93 IV
Lomphat 250,000 1-Nov-93 IV
Beng Per 242,500 1-Nov-93 IV
Phnom Prich 222,500 1-Nov-93 IV
Phnom Namlyr 47,500 1-Nov-93 IV
Phnom Samkos 333,750 1-Nov-93 IV
Aural 253,750 1-Nov-93 IV
Snuol 75,000 1-Nov-93 IV
Peam Krasop 23,750 1-Nov-93 IV
Subtotal: Wildlife Sanctuaries 2,030,000
Protected Forests
Phnom Tamao Zoo 1200 22-May-96 N/A
Prek Teouk Sap 6027 29-Oct-98 N/A
Ang Trapang Thmar 12650 22-Feb-00 IV
Mondul Kiri 429438 30-Jul-02 IV
Preah Vihear 190027 30-Jul-02 IV
Centre Cademon Mountain 401313 30-Jul-02 IV
Seima, Snuol 305440 12-Aug-02 IV
Sub-Total: Protected Forests 1346095
Additional Protected Areas
Boeung Tonle Chmar Ramsar Site (28,000ha) inside Tonle Sap Biosphere Reserve
0 23-Jun-99 N/A
Koh Kapik Ramsar Site (12,000ha) inside Peam Krasop Wildlife Sanctuary
0 23-Jun-99 N/A
Stung Treng Ramsar Site (14,600ha)
14,600 23-Jun-99 N/A
Tonle Sap Multiple-Use Area was nominated as Biosphere Reserve (1,483,300ha)
1,167,000 18-Apr-01 N/A
Total: All Protected Areas 5,800,895Source: Ministry of Environment and Ministry of Agriculture, Forestry and FisheriesNote: The area of Boeung Tonle Chmar is a part of Tonle Sap Multiple Use Area and Koh Kapik is a part of Peam Krasop Wildlife Sanctuary. The extra area of Biosphere Reserve is subtracted between new area and old area. The extra area of Biosphere Reserve is mostly the area of transition zone.

136 137
Figure 2: 1997 Habitat Composition of Existing Protected Areas
Wetland,
9.34%
Artif icial/
Terrestrial,9.50%
Grasslands,
3.86%
Shrublands,
7.06%
Forests,
70.18%
Table 2a: 1997 Habitat Composition of Existing Protected Areas
Habitat % All Protected Areas
Forests 70.18
Wetland 9.34
Artificial/Terrestrial 9.5
Grasslands 3.86
Shrublands 7.06
Other Land Cover 0.07
Total 100
Table 2b: 1997 Habitat Composition of Individual Protected Areas
Protected Area%
Forest%
Wetland
% Artificial/ Terrestrial
% Grassland
% Shrubland
% Other LC
Tonle sap 19.43 34.84 28.35 12.1 5.28 0
Samlaut 94.64 0 1.94 1.04 1.66 0.72
Dong peng 49.52 6.94 31.31 5.92 6.31 0
Virachey 95.58 0 0.28 0.63 3.5 0
Phnom kulen 80.96 0 16.16 0 2.88 0
Botum sakor 86.12 0.79 4.23 4.05 4.34 0.47
Kirirom 98.19 0 0 0 1.81 0
Phnom bokor 92.06 0.03 3.96 0.23 3.73 0
Ream 80.82 3.48 15.36 0.34 0 0
Kep 40.27 0.14 55.76 0 3.83 0
Preah vihear 53.32 0 1.41 0 45.27 0

136 137
Protected Area%
Forest%
Wetland
% Artificial/ Terrestrial
% Grassland
% Shrubland
% Other LC
Banteay chmar 78.63 0.23 12.63 0.15 8.36 0
Angkor 20.15 6.42 64.02 0 8.44 0.98
Kulen promtep 92.95 0 2.33 0.11 4.61 0
Roniem daun sam 78.33 0 10.16 1.49 10.03 0
Lomphat 84.89 1.19 0.64 0 13.28 0
Beng per 90.1 0.02 3.81 0.08 6 0
Phnom prech 84.12 0 0.9 0 14.98 0
Phnom nam lyr 87.73 0.1 9.59 2.26 0.32 0
Phnom samkos 90.81 0.03 0.36 0.67 8.12 0
Aural 90.51 0 1.02 1.05 7.27 0.15
Snuol 97.63 0 1.48 0 0.89 0
Peam krasop 75.27 19.42 1.21 1.85 2.06 0.19
Phnom ta moa 0 0 12.84 0 87.16 0
Prek teouk sap 63.92 0 29.15 4.37 0.07 2.49
Ang trapeng thmor 3.45 25.7 22.22 33.19 15.43 0
Mondul kirri 86.18 0.49 2.02 0 11.31 0
Preah vihear_fa 82.07 0.01 3.43 1.28 13.2 0
Center cardamom 92.7 0 0 1 6.14 0.16
Seima, snoul 86.2 0 1.5 3.65 8.64 0
Stung treng ramsar 33.31 42.32 10 2.43 1.33 10.61
Total - All Protected Areas
70.18 9.34 9.5 3.86 7.06 0.07
Source: - Forest cover 1997 originates from MRC/GTZ - Protected areas originate from MoE. - Protected forest originate from FA, MAFF
Table 3: Comparative Indicator Values for GMS Countries
Country Percent of Total Land Area Future Target
Cambodia 32.0% as of 2002 Maintain existing and extend protected forest area.
Lao PDR 14.3 % as of 2002 Maintain existing which is above IUCN recommenda-tion of 10%.
Myanmar 7.2% as of 2004 IUCN recommendation of 10%.
Thailand 18.2% as of 2004 Include another 18% as Class 1 Watersheds.
Viet Nam 6.2% as of 2004 IUCN recommendation of 10%
Yunnan 8.8% as of 2004 Maintain existing which is above 8% target.Source: Findings of the SEF-II Project

138 139
SUMMARY A. Policy Reference 1. Purpose: This indicator measures the importance attached to protected areas established to safeguard biological diversity and natural and cultural resources. It is understood that the higher the percentage of the indicator, the better the performance of the country in protecting and conserving its biodiversity. 2. Relevance to Environment Planning and Management: Protected areas are an essential tool for ecosystem conservation, with functions going well beyond the conservation of biological diversity. As such, they are one of the building blocks of sustainable development. 3. Linkage to Other Indicators: This indicator is closely linked to others which relate to natural resource use and management. Closely associated indicators would include: protected forest area, land use change, and threatened species. 4. Targets: The Royal Government of Cambodia has established a target indirectly related to this indicator to maintain the surface of 23 protected areas at the 1993 level of 3.3 million ha through 2015 and the surface of 6 new forest protected areas at the present level of 1.35 million ha until 2015 (Cambodia Millennium Development Goals - 2003). 5. International Environment Treaties: For this indicator, the more relevant convention is the Convention on Biological Diversity, which Cambodia ratified on 9 Feb 1995. Other relevant conventions and Agreement that Cambodia ratified include::
• The Convention on International Trade in Endangered Species (CITES), Cambodia signed in December 1975, but did not adhere to it until 1999.
• The Convention on Wetlands of International Importance (Ramsar Convention); in 1996 Cambodia’s National Assembly approved a ministerial request to accede to this convention and in 1999 became a Contracting Party.
• The Convention Concerning the Protection of World Cultural and Natural Heritage (World Heritage Convention), Cambodia became a signatory in January 1994.
• International Plant Protection Conservation (IPPC), Cambodia adhered to the Convention in 1952.
• Agreement on Conservation of Nature and Natural Resources, Cambodia became a signatory to ASEAN’s Agreement in April 1999.
B. Analysis In Cambodia, the system of protected areas was first established in 1993 when 3,273,200 ha or 18.08% of the total land area was designated as protected areas by a royal decree (see Table 1a). These 23 individual protected areas (see Table 1b) included 742,000 ha as National Parks (IUCN category II), 2,030,000 ha in Wildlife Sanctuaries (IUCN category IV) and 403,950 ha in Multiple Use Areas (IUCN category VI). The system of protected areas was increased marginally, to 18.27% of the total land area, between 1996 and 2000 to include 3 additional sites designated as Protected Forests and another 3 as Ramsar Sites. Two of these Ramsar Sites were associated with previous protected areas (see Table 1b).

138 139
In 2001, the Royal Government of Cambodia nominated the Tonle Sap Multiple-Use Area as a Biosphere Reserve and extended its area 1,167,000 ha. Therefore, the total system of protected areas was increased to 24.72% of the total land area. In 2002, an additional 1,332,218 ha of Protected Forests were added to the system of protected areas, increasing the total amount to 32% of the total land area. The increase over time of the Cambodian system of protected areas on which the main indicator is based is summarized in Figure 1 and Table 1b. Figure 2 and Tables 2a and 2b attempt to further describe the system of protected areas in terms of the habitat which they attempt to protect. As can be observed from Table 2a, the protected areas as a whole are composed of 70.18% forest, 9.34% wetland, 9.5% artificial/terrestrial and the rest 11% grassland, shrubland and other land cover. While loss of forest habitat was identified as the single most important threat to vulnerable and endangered species in Cambodia (see Table 3 of State Indicator Fact sheet), loss of wetland habitat was cited as being the second dominant threat, followed by loss of artificial/terrestrial habitats, including arable land and pasture land. Table 3 provides the basis for comparing the value of the main indicator with that of other GMS countries. As can be observed, Cambodia ranks highest among all other GMS countries in terms of the proportion of the total land area which is under its system of protected areas. But as noted earlier and as the major weakness of this indicator, it does not capture the quality of management and whether the areas are in fact protected from incompatible uses. Also, the indicator alone does not show how representative the protected areas are of the country’s ecological diversity. Based on this comparison and observed trends, it is concluded that the government response with respect to the establishment of protected areas has been significant and consistently applied.

140 141
Greater Mekong Subregion Indicator Fact Sheet DATABASE INFORMATION
Indicator ID
Indicator Name Inland Fish Consumption - 1981-2003
Year of Assessment 2005
Type of Indicator State
Frequently Asked Question (FAQ) Has domestic fish consumption increased?
Priority Concern Fish Resources
Geographic Area Cambodia
State & Trend Relatively Good and Improving
Key Message Fish consumption in Cambodia has grown in re-cent years due to further shifts in consumer pref-erences towards fish and greater production by small-scale and rice-field fisheries. The produc-tion by Tonle Sap appears not to have changed significantly in volume terms. Fish consumption per capita in Cambodia is higher than in other GMS countries.

140 141
TECHNICAL INFORMATION A. Definition This indicator is intended to serve as a state indicator for fish resources. It aims to measure the amount of inland fish catch that is used as domestic consumption per capita per annum and is expressed in kilogram live weight. Domestic fish consumption is defined as the quantity of the country’s freshwater fish derived products available for human consumption. Data were calculated by taking the country’s inland fish production excluding aquaculture products, import and export fish products. However, this assess-ment also included the use for consumption by domestic animals. B. Data Source Fisheries data is annually recorded by Department of Fisheries, Ministry of Agriculture, Forestry and Fisheries (DoF, MAFF). However, the fisheries figures used for this indicator were extracted from three publications, (i) Technical Paper on Marine Fisheries Review, prepared by Project Implementa-tion Unit (PIU) - the Fisheries Component, DoF, February 2001, (ii) Annual Conference on Agriculture, Forestry and Fisheries 10-11 April 2003, published by Statistics Office, Department of Planning, Statistics and International Cooperation, MAFF, and (iii) Agricultural Statistics 2003-2004 published by Statistics Office, Department of Planning, Statistics and International Cooperation, MAFF. Population figures from 1981 to 2003 were extracted from the Statistical Year Book 2003 pub-lished by National Institute of Statistics, Ministry of Planning (NIS, MoP). C. Geographic Area / Population Coverage The figures are representative of inland fisheries for the entire country; they do not include ma-rine fisheries. D. Temporal Coverage Per capita fish consumption figures are estimated for the period 1981 to 2003.The figure of fish consumption per capita which was estimated and projected by the Mekong River Commission Secretariat and Department of Fisheries (MRC/DoF) is provided for 1990, 1998, 2000 and 2010. E. Methodology and Frequency of Coverage DoF records and updates its own data sets of Fisheries Statistics annually since 1980 which are reported by each provincial fisheries office. Fish consumption per capita for Cambodia was estimated by many other experts and surveyed in different locations in the country with different results being obtained. However, the national rate of fish consumption per capita was estimated and projected by the Mekong River Commission and Department of Fisheries as 30 kg per annum. The Cambodian population, 1980 to 1996, was estimated/projected by Jerrold W. Hugget, NIS/UNPF in May 1997. The total population 1981 to 1993 was estimated from the population count at the end of 1980 and assumed a growth rate of 2.8% annually from 1981 to 1989 and 2.5% from 1990 to 1993. The population estimated for 1994 was based on provincial reports.Population figures for 1998 are the result of the 1998 General Population Census of Cambodia. Based on these census results, the National Institute of Statistics has projected the population from 1998 to 2020.

142 143
F. Methodology of Data Manipulation Per capita fish consumption figures originate from two different sources and are presented in kilogram live weight. The estimated consumption is based on the total amount of inland fish catch minus export fish production and divided by the total population. The per capita fish consumption for 1990, 1998, 2000 and 2010 was originally extracted from the Technical Paper on Marine Fisher-ies Review, prepared by Project Implementation Unit (PIU) - the Fisheries Component, Department of Fisheries, February 2001.
QUALITATIVE INFORMATION A. Strength and Weakness (data level) Fish consumption is indicative of demand of food protein intake of the population. It is not very indicative of the state of fish resource without an estimate of the size of the biomass. It might be or might not be related to fish resources if fish consumption increases. B. Reliability, Accuracy, Robustness, Uncertainty (data level) DoF’s datasets provide an estimate for Cambodia fish consumption since 1980 to 2003. How-ever, they are less indicative of the absolute amount of fish production due to data deficiencies to represent the entire country. Furthermore, fisheries production before 1998 failed to estimate the family and rice field fisheries productions. C. Future Work Required (for data level and indicator level) Fisheries Statistics are updated annually by the Department of Fisheries, Ministry of Agricul-ture, Forestry and Fisheries. Estimates of fish stock, if and when available, are recommended as an alternative to this state indicator based on fish consumption.
SUPPORTING DATA TABLES, GRAPHS AND MAPS Figure 1: Annual Fish Consumption Per Capita in Cambodia
0
5
10
15
20
25
30
35
19
80
19
82
19
84
19
86
19
88
19
90
19
92
19
94
19
96
19
98
20
00
20
02
20
10
Kilo
gra
ms/
Ye
ar
Actual inland catch for consumption Consumption estimation

142 143
Table 1a: Fish Consumption Per Capita in Cambodia, 1981-2003
YearActual inland catch for con-
sumption (Tons)Total population (Thou-
sands)Fish consumption per
Capita (Kg/Year)
1981 50,780 6,682 7.6
1982 65,700 6,900 9.52
1983 58,717 7,100 8.27
1984 55,093 7,300 7.55
1985 56,400 7,500 7.52
1986 64,181 7,700 8.34
1987 62,154 7,900 7.87
1988 61,200 8,100 7.56
1989 62,154 8,300 7.49
1990 64,614 8,600 7.51
1991 74,268 8,800 8.44
1992 34,529 9,000 3.84
1993 35,568 9,300 3.82
1994 37,327 9,752 3.83
1995 48,684 10,200 4.77
1996 38,810 10,340 3.75
1997 36,130 10,368 3.48
1998 35,460 11,438 3.1
1999 186,400 11,599 16.07
2000 203,300 12,573 16.17
2001 347,000 12,803 27.1
2002 307,800 13,041 23.6
2003 253,466 13,287 19.08Note – Actual inland catch for consumption is the real fish capture minus fish export and excludes marine catch, aquaculture production, and import fish. – Total Population extracted from Statistical Year Book 2003, published by National Institute of Statistics.
Table 1b: Past, Present and Projected of Fish Consumption in Cambodia,1982-2010 (MRC/DoF Estimation)
1982 1990 1998 2000 2010Consumption per capita (kg) ** - 16 - - -
Consumption per capita (kg) *** - - 30 30 30** Mekong Secretariat (1992) and*** Cambodian Department of Fisheries (2000) data.- Data not available.
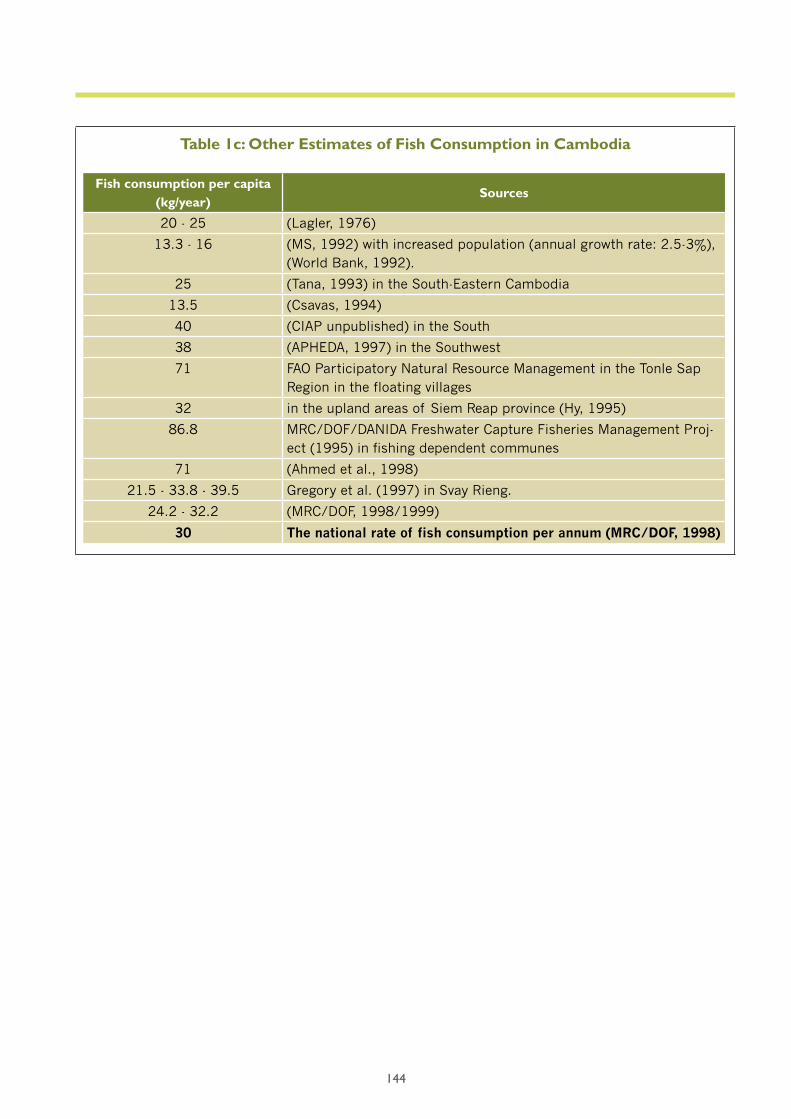
144 145
Table 1c: Other Estimates of Fish Consumption in Cambodia
Fish consumption per capita (kg/year)
Sources
20 - 25 (Lagler, 1976)
13.3 - 16 (MS, 1992) with increased population (annual growth rate: 2.5-3%), (World Bank, 1992).
25 (Tana, 1993) in the South-Eastern Cambodia
13.5 (Csavas, 1994)
40 (CIAP unpublished) in the South
38 (APHEDA, 1997) in the Southwest
71 FAO Participatory Natural Resource Management in the Tonle Sap Region in the floating villages
32 in the upland areas of Siem Reap province (Hy, 1995)
86.8 MRC/DOF/DANIDA Freshwater Capture Fisheries Management Proj-ect (1995) in fishing dependent communes
71 (Ahmed et al., 1998)
21.5 - 33.8 - 39.5 Gregory et al. (1997) in Svay Rieng.
24.2 - 32.2 (MRC/DOF, 1998/1999)
30 The national rate of fish consumption per annum (MRC/DOF, 1998)

144 145
SUMMARY A. Policy Reference 1. Purpose: The purpose of this indicator is to measure the state of the fish resources which can be impact-ed from the demands of human consumption. It is directly relative to a country’s inland fish production. 2. Relevance to Environment Planning and Management: In Cambodia, fisheries play an important role in the daily life and in strengthening the national economy. For the contribution of fish capture to the economy, the discussions will further confine to the roles in fish contribution to GDP, as protein diet or per capita consumption, and employment. On average, fish and fishery products are believed to account for 40-60% of the protein intake of the population.3. Linkage to Other Indicators: None.4. Targets: The Department of Fisheries in Cambodia has set a target (Goal 1) to ensure all living aquatic resources are harvested within their sustainable limits by 2010. According to the Fisheries Sector Policy and Action Plan Briefing, accomplishing Goal 1 requires that the following objectives are real-ized:
• The extraction of living aquatic resources follows what is safe and prudent under precautionary principles for the management and administration of living aquatic resources;
• A scientific base to support the management and administration of Cambodia’s living aquatic resources is established and operational; and
• The authorities in close collaboration with local communities carry out monitoring and enforcement.
B. Analysis From Figure 1 and Table 1a, it can be observed that the annual fish consumption per capita over the period 1980 to 1991 was stable at approximately 6 kg per year. It fell below this level be-tween 1992 and 1998 and then increased rapidly thereafter. It reached 16 kg in 1999 and then peaked in 2001 at 27 kg per year. However, in 2003 fish consumption per capita decreased to ap-proximately 19 kg. Between 1999 and 2003, fish consumption per capita can be estimated at ap-proximately 20 kg per year. The fish consumption per capita between 1980 and 1998 was low because the total inland fish catch figures did not include the small scale fisheries and the rice field fisheries. As summarized in Tables 1b and 1c, fish consumption per capita, as estimated by various experts in Cambodia and in different locations, ranged from 13kg to 87kg per year. However, the Department of Fisheries and the Mekong River Commission Secretariat estimate the per capita con-sumption rate at approximately 30 kg per annum when allowing for aquaculture production, imported fish and marine fisheries. These later fish consumption rates were estimated based on field observa-tions and interviews.

146 147
Greater Mekong Subregion Indicator Fact Sheet DATABASE INFORMATION
Indicator ID
Indicator Name Number of Community Fisheries 1996 - 2005
Year of Assessment 2005
Type of Indicator Response
Frequently Asked Question (FAQ)
Priority Concern Fish Resources
Geographic Area Cambodia
Impact & Trend Significant and Intermittent
Key Message An increasing number of community fisheries (382 of them by 2005) has improved the access of communities to fisheries while curbing the pressure of commercial fishing. Cambodia has placed tighter controls on commercial access to its fishery resource and is on track to meet the CMDG goals for sustainable fisheries. The change of policy direction is too recent to say whether it has resulted in a more sustainable management of the fish resource.

146 147
TECHNICAL INFORMATION A. Definition This indicator attempts to track the extent of community fisheries over time; it is expressed as the total numbers in country, both inland and marine areas. The fishing lot numbers/areas are the additional information that are related to the targets considered to increase the proportion of fishing lots released to local communities. A community fisheries is a group of Khmer people who agree to volunteer co-operatively together with the objective of sustainable management of fisheries resources in the local area and to protect Khmer peoples’ rights and benefits in accordance with the laws and regulations related to fisheries and guidelines, management plans, statutes and agreements of community fisheries. B. Data Source Figures of community fisheries are originally recorded from Community Fisheries Development Office, Department of Fisheries, Ministry of Agriculture, Forestry and Fisheries (DoF, MAFF). Information on Fishing lots, including inland and marine areas, is taken by DoF, MAFF. However, the figures used for this indicator are extracted from Agricultural Statistics 2003-2004, published by Statistics Office, Department of Planning, Statistics and International Cooperation, MAFF and Major Activities and Action Plan for Good Governance in Fisheries Sector 2002. C. Geographic Area / Population Coverage The figures are presented for both inland and marine fisheries and are representative of the country as a whole. D. Temporal Coverage The figures for community fisheries originate from the Community Fisheries Development Office (CFDO), Department of Fisheries and are provided for the period 1996 to 2005. The numbers of fishing lots have been recorded since 1980 by DoF, MAFF. However, figures for the area removed from commercial fishing lots are available only since 2001. E. Methodology and Frequency of Coverage The Community Fisheries Development Office at the Department of Fisheries (CFDO, DoF), has facilitated the provincial fisheries offices and local authorities to establish community fisheries. CFDO has also recorded the numbers of communities including the approval dates in its statistics database. Furthermore, DoF records and updates its own data sets of fishing lots annually which are reported by each provincial fisheries office. F. Methodology of Data Manipulation Community fisheries statistics are maintained by individual provinces and consist of communities’ names, administrative locations and dates of approval. For purposes of this indicator, the numbers of communities are calculated and subtotalled by dates of approval. The numbers of fishing lots and their areas subtracted from commercial fishing lots have been expressed as numbers and hectares.

148 149
QUALITATIVE INFORMATION A. Strength and Weakness (data level) The numbers of community fisheries are indicative of government response in fisheries resource management in term of sustainable use and protection. However, it might or might not be indicative of appropriate fisheries resource response because community fisheries are not fisheries sanctuaries. B. Reliability, Accuracy, Robustness, Uncertainty (data level) Only the number of community fisheries is utilized for the indicator, independent of the size and area of the community fisheries. C. Future Work Required (for data level and indicator level) Community fisheries statistics are recorded and updated annually by the Department of Fisheries, Ministry of Agriculture, Forestry and Fisheries. The areas of each community fishery may be available in future statistics from the Community Fisheries Development Office.
SUPPORTING DATA TABLES, GRAPHS AND MAPS Figure 1: Number of Community Fisheries in Cambodia 1996-2005
0
100
200
300
400
500
600
700
19
96
19
98
20
00
20
02
20
04
20
06
20
08
20
10
20
12
20
14
Nu
mb
er
of
Lo
ts
Community Fisheries CMDG Target

148 149
Table 1: Number of Community Fisheries in Cambodia 1996-2005
Year Existing No. of Community Fisheries CMDG Target
1996 5
1997 12
1998 36
1999 55
2000 88 264
2001 198
2002 275
2003 333
2004 372
2005 382 375
2010 486
2015 598 Source: Community Fishery Development Office, DoF, Cambodia
Figure 2a: Area to be removed from Commercial Fishing Lots
55
56
57
58
59
60
61
1998 2001 2005 2010 2015
Pe
rce
nt
CMDG Target Cut out areas of f ishing lots

150 151
Table 2a: Fishing Lot Area Reduction, by Province, to 31 December, 2001, (Unit: ha)
No. ProvincesTotal Fishing
Lot AreasReduced
AreaRemaining
AreaReduced Area in %
1 Battambang 146,532 43,814 102,718 29.9
2 Kampong Thom 127,126 57,773 69,353 45.45
3 Siem Reap 83,941 61,216 22,725 72.93
4 Kampong Chhnang 62,256 17,172 45,084 27.58
5 Pursat 55,120 30,272 24,848 54.92
6 Takeo 46,007 30,806 15,201 66.96
7 Kandal 179,728 128,088 51,640 71.27
8 Kampong Cham 65,005 40,874 24,131 62.88
9 Prey Veng 143,069 87,729 55,340 61.32
10 Bantey Meanchey 32,756 26,345 6,411 80.43
11 Kratie 8,725 8,725 0 100
12 Phnom Penh 3,475 3,475 0 100
Total 953,740 536,289 417,451 56.23Source: Department of Fisheries, Ministry of Agriculture, Forestry and Fisheries
Figure 2b: Reduction of the Number of Commercial Fishing Lots between 1980-2003
0
50
100
150
200
250
300
350
19
80
19
82
19
84
19
86
19
88
19
90
19
92
19
94
19
96
19
98
20
00
20
02
Nu
mb
er
of
Lo
ts
Fishing lots

150 151
Table 2b: Number of Fishing Lots – 1980-2003
Year Numbers of Fishing lots
1980 to 1988 307
1989 302
1990 302
1991 301
1992 301
1993 298
1994 298
1995 279
1996 279
1997 279
1998 279
1999 270
2000 164
2001 164
2002 164
2003 162

152 153
SUMMARY A. Policy Reference In October 2000 the government of Cambodia announced a major change in fisheries management policy. The core elements of the new policy are the reduction of fishing lot concession areas by 56%, the broader participation of fishing communities in the management of fisheries and a focus on the efficient, sustainable and equitable use of the living aquatic resources. 1. Purpose: The purpose of this indicator is to measure the response on the fish resources to be used in sustainable ways. It is understood that the higher the numbers of community establishment are, the better the management of the country in sustainable use of fisheries resource. 2. Relevance to Environment Planning and Management: Community fisheries management is broadly defined as a voluntary partnership among stakeholders, including village members, relevant authorities and commercial fishers, with the objective of sustainable fisheries resource management for the benefit of all stakeholders. 3. Linkage to Other Indicators: This indicator is closely linked to other indicators which relate to fisheries resource use and management and closely associated with fishing areas or fishing lots, fishery sanctuary areas, and protected areas. 4. Targets: The Government Cambodia has set two targets as stated in the Cambodia Millennium Development Goals to ensure within the sustainable use of fisheries resource. The targets are stated as:
• Increasing the number of community-based fisheries from 264 in 2000 to 589 in 2015. • Increasing the proportion of fishing lots released to local communities from 56% in 1998 to
60% in 2015. 5. International Environment Treaties: None applicable. 6. Laws Article 1, Draft sub-decree on community fisheries management dated: 01/02/2002, stipulates that “Community Fisheries are established and facilitated in support their operation for an efficient, sustainable and equitable use of living aquatic resources through:
• Creating and disseminating the legal framework (including guidelines, rules and regulations) • Defining the boundaries of Community Fisheries • Accreditation of Community Fisheries • Capacity building for Community Fisheries Management • Monitoring and evaluation of Community Fishery activities • Research on Community Fisheries • Conflict resolution • Sustainable improvement of livelihoods of Community Fisheries.
B. Analysis The fishing areas released from the commercial fishing lots were organized into the community fisheries. In 1996, five of community fisheries were initially established, although government policy just started in 2000. Numbers of community fisheries were drastically increased from 5 to 382 from 1996 to 2005 and matched to Cambodia Millennium Development Goal’s target line in 2003 with 333 communities (see Figure 1 and Table 1).

152 153
As can be observed in Figures 2a and 2b, and Tables 2a and 2b, the number of fishing lots in Cambodia has been reduced since 1994. In 2000, the Royal Government of Cambodia reformed the fisheries sectors and a number of fishing lots has been removed for local people’s use. The fishing lots have been reduced from 307 in 1988 to 164 in 2000, representing 56% of the total commercial fishing lot areas. The release of fishing lot areas continued in 2002 and 2003 and the total number of fishing lots remaining are 162 in 2003.

154 155
Greater Mekong Subregion Indicator Fact Sheet DATABASE INFORMATION
Indicator ID
Indicator Name Percentage of Population with Access to Safe Potable Water - 1998 to 2002
Year of Assessment 2005
Type of Indicator State
Frequently Asked Question (FAQ) What proportion of the population has access to safe potable water?
Priority Concern Water Resources
Geographic Area Cambodia
Impact & Trend Relatively Poor and Improving.
Key Message Access to safe drinking for both the urban and rural populations in Cambodia has marginally improved since 1998 to 58% of the urban population and 27% of rural population. The greater rate of improvement was in the rural population and the urban population is still below the Millennium Development targets in this regard. The baseline figures were initially very low and Cambodia still lags behind other GMS countries in the provision of safe potable water to its population.

154 155
TECHNICAL INFORMATION A. Definition This indicator attempts to track the proportion of the population with safe drinking water available in the home or within reasonable access. It is expressed as the percentage of the population with access to an “improved” water source following the definition adopted by the Joint Monitoring Programme (JMP) for Water and Sanitation of the World Health Organization (WHO) and of the United Nations Children’s Fund (UNICEF). The JMP defines access to water supply and sanitation in terms of the types of technology and levels of service afforded. “Access to water supply services” is defined by JMP as the availability of at least 20 litres per person per day from an “improved” source within 1 kilometer of the user’s dwelling. An “improved” source is one that is likely to provide “safe” water, such as a household connection, public standpipe, borehole, protected dug well, protected spring, rainwater collection, etc. “Not improved” source is one that is unlikely to provide “safe” water, such as unprotected well, unprotected spring, vendor provided water, bottled water, tanker truck water. Current information does not allow JMP to establish a relationship between access to safe water and access to improved sources, but WHO and UNICEF are examining this relationship. B. Data Source The data for 1998 originate from the 1998 General Population Census of Cambodia. Data for 2000 originate from the Cambodia 2000 Demographic and Health Survey. Data for 2002 were obtained from the WHO/UNEP Joint Monitoring Programme. C. Geographic Area / Population Coverage The data are representative of the country as a whole and are differentiated by urban or rural population. Figures for 1998 and 1999 are based of a fixed JMP-reported population estimate of 11,426,000 (9,632,000 rural; 1,794,000 urban). Figures for 2002 are based on a JMP estimated total population of 13,810,000 (82% rural; 18% urban). Population projections for 2005, 2010 and 2015 are based on UNSTAT figures of 14,825,000 (11,898,000 in rural areas; 2,927,000 in urban areas) in 2005, approximately 16,612,000 (12,820,000 rural; 3,792,000 urban) in 2010 and 18,421,000 (13,613,000 rural; 4,808,000 urban) in 2015. These are in line with national estimates based on the 1998 Population Census which projects the total population to 14,798,315 in 2006, 16,608,012 in 2011 and 18,466,086 in 2015 but which does not differentiate between urban and rural populations. D. Temporal Coverage Indicator figures are only available for year 1998, 1999, 2000 and 2002. Projections are provided for years 2005, 2010 and 2015. E. Methodology and Frequency of Coverage The data, percentage of households access to safe drinking water in 1998 which is defined by the Joint Monitoring Program differ from the data in 1998 defined by the National Institute of Statistics. The data collected for the Joint Monitoring Program come from two main sources: assessment questionnaires and household surveys. Assessment questionnaires are normally sent to WHO country representatives, to be completed in liaison with local UNICEF staff and national agencies involved in the sector.

156 157
Household survey results were collected from several sources, including Demographic Health Surveys (DHS), UNICEF’s Multiple Indicator Cluster Surveys (MICS), World Health Surveys (WHS) and national demographic censuses. The data collected by the National Institute of Statistics come directly from the General Population Census of Cambodia 1998. F. Methodology of Data Manipulation The figures of percentage of households with access to safe drinking water in urban and rural locations are originally provided by WHO and UNICEF Joint Monitoring Program (JMP), as percentage figures.
QUALITATIVE INFORMATION A. Strength and Weakness (data level) The main advantage of this indicator is that it conforms to the indicator and the definitions adopted by WHO and UNICEF. It is also based on readily available household surveys, from which affected population estimates can be derived. The main weakness, at the data level, is that it does not conform with national figures and national statistics, as noted below. B. Reliability, Accuracy, Robustness, Uncertainty (data level) The Cambodian National Institute of Statistics (NIS) reported 60% of urban households with access to improved/safe drinking water in 1998 and this is used as benchmark target, while JMP reported 53%. The NIS was probably using a different definition of “access”. According to JMP “piped-in” requirements, it underestimates the true population with access to safe potable water. This will require further investigation and may be the explanation as to why NIS figures are not in agreement. C. Future Work Required (for data level and indicator level) WHO and UNICEF, through their Joint Monitoring Programme, are constantly monitoring water supply and sanitation at the global level. Future figures are likely to be available through their Internet database (see www.wssinfo.org).

156 157
SUPPORTING DATA TABLES, GRAPHS AND MAPS Figure 1: Percentage of Households with Access to Safe Drinking Water,
Urbanand Rural, 1998, 2000, 2002
and Rural, 1998, 2000, 2002
0
10
20
30
40
50
60
70
80
901
99
8
20
00
20
02
20
05
20
10
20
15
Urban household Urban TargetRural household Rural TargetTotal estimated population Total estimated target
Table 1: Urban, Rural and Total Population with Access Safe Drinking Water– 1998 to 2002 and Projections to 2015
Urban Population
YearUrban
PopulationUrban Population Connected (%) Urban Population Connected
1998 1,794,000R 53%R 60%T 950,820E 1,076,400ET
2000 1,794,000R 54%R 968,760E
2002 2,485,800R 58%R 1,441,764E
2005 2,927,000P 68%T 1,990,360ET
2010 3,792,000P 74%T 2,806,080ET
2015 4,808,000P 80%T 3,846,400ET
Rural Population
YearRural Population
(millions)Rural Population Connected (%) Rural Population Connected
1998 9,632,000R 25%R 24%T 2,408,000E 2,311,680ET
2000 9,632,000R 27%R 2,600,640E
2002 11,324,200R 29%R 3,284,018E
2005 11,898,000 P 30%T 3,569,400ET
2010 12,820,000 P 40%T 5,128,000ET
2015 13,613,000P 50%T 6,806,500ET

158 159
Estimated Total Population with Access
YearUrban
(Thousands)Rural
(Thousands)Total
(Thousands)%
1998 951E 1,076ET 2,408E 2,312ET 3,359E 3,388ET 29% E 30%ET
2000 969E 2,601E 3,569E 31% E
2002 1,442E 3,284E 4,695R 34%R
2005 1,990ET 3,569ET 5,560ET 38%ET
2010 2,806ET 5,128ET 7,934TE 48%ET
2015 3,846ET 6,806ET 10,653ET 58%ET
Source: WHO-UNICEF Joint Monitoring ProgrammeE=Estimated, P=Projected by UNSTAT, R=Reported by JMP, T=CMDG Target, ET=Estimated CMDGTarget
Table 2: Proportion of Population with Access to Safe Potable Water GMS – 2002
Country% of Population with Access to Safe Po-
table Water
Cambodia 34
PRC 77
Lao PDR 43
Myanmar 80
Thailand 85
Viet Nam 73Source: WHO/UNICEF-JMP

158 159
SUMMARY A. Policy Reference 1. Purpose: The purpose of this indicator is to monitor the progress in the accessibility of the population to safe drinking water.2. Relevance to Environment Planning and Management: Accessibility to safe drinking water is of fundamental significance to lowering the fecal risk and frequency of associated diseases. In association with other socio-economic characteristics, includ-ing education and income, it is also a good universal indicator of human development. When broken down by geographic (such as rural/urban zones), or social or economic criteria, it provides useful information on inequity.3. Linkage to Other Indicators: This indicator is closely associated with other socio-economic indicators on the proportion of people covered by adequate sanitation. These indicators are among the eight elements of primary health care. It also has close links to other water indicators such as withdrawals, reserves, consump-tion, or quality.4. Targets: The UN Millennium Development Goal related to this indicator is stated as “Halve, by 2015, the proportion of people without sustainable access to safe drinking water (and sanitation).” Stated dif-ferently using the baseline figure of 31% for 2000 for a population with access to safe drinking water or 69% for a population with no access to safe drinking water, this translates to a target of 65.5% of the total population by 2015. The national target, through the 2003 Cambodia Millennium Development Goals is expressed differently in terms of urban and rural population as “Increase the proportion of rural population with access to safe water source from 24% in 1998 to 50% in 2015 and urban population from 60% to 80% in 1998 to 2015”. Based on projected population estimates in both rural and urban areas (see Table 1), this translates to a target of 58 % of the total population with access to safe drinking water by 2015. There are therefore two sets of targets for this indicator.5. International Environment Treaties: The International Drinking Water Supply and Sanitation Decade (IDWSSD) 1980-1990 is an international agreement relevant to this indicator. It is a component of the WHO Global Strategy for Health for All by the Year 2000.
B. Analysis Global Perspective – Developing Countries The population served with improved water supply in developing countries has increased by 8% between 1990 - 2002, which amounts to 1,044 million more people (586 million in urban areas and 459 million in rural settings) served in 12 years (WHO/UNICEF). Regional Perspective – Southeast Asia, including Cambodia, Indonesia, Lao PDR, Malaysia, Myanmar, Philippines, Singapore, Thailand and Viet Nam Between 1990 and 2002, some 99 million more people have gained access to drinking water supply in Southeast Asia. No progress has been made in terms of urban coverage due to an impor-tant increase of population (+ 82 million), whereas in rural areas, the percentage of the population served has improved by some 5%, mainly due to the small increase in population in these areas (+ 13 million). (WHO/UNICEF)

160 161
National Perspective As can be observed from Figure 1 and Table 1, about 1 million urban population or 53% of the urban population had access to drinking water supply in 1998. This increased up to 1.4 million or 58% of the urban population in 2002. Likewise, for the rural population approximately 2.4 mil-lion persons or 25% of the rural population had access to drinking water supply in 1998 and this increased to 3.3 million people or 29% of the rural population in 2002. However, the urban popula-tion with access to drinking water supply throughout the period 1998 to 2002 is still short of CMDG targets. The combined urban and rural population with access to drinking water supply was approxi-mately 34% in year 2002. (see Table 1); This is very low percentage if compared to other GMS coun-tries (see Table 2). Based on this comparison with other GMS countries and observed trends of the indicator, it is concluded that the state of access to safe drinking water in Cambodia is relatively poor and margin-ally improving.

160 161
Greater Mekong Subregion Indicator Fact Sheet DATABASE INFORMATION
Indicator ID
Indicator Name Urban and Rural Population 1961-2003
Year of Assessment 2005
Type of Indicator Pressure
Frequently Asked Question (FAQ) How much of an impact do population growth rates have on the provision of safe drinking water?
Priority Concern Water Resources
Geographic Area Cambodia
Magnitude & Trend Low and Increasing
Key Message Cambodia’s population has been increasing in both rural and urban areas resulting in increased demand for safe drinking water. The average annual growth rate at 2.5% is relatively high compared with GMS countries.

162 163
TECHNICAL INFORMATION A. Definition This indicator attempts to represent the total population within the urban and rural areas for the whole country for the period 1961 to 2003.It is expressed as the total number of human inhabitants of a specified area, such as urban and rural, at a given time. B. Data Source The data sources for this indicator originate from the Food and Agriculture Organization of the United Nations (FAO). Figures of total population in the urban and rural areas existed in the past, were extracted from the Annual Time Series of Population Domain in FAOSTAT-Agriculture database, and the last one updated in 10 December 2004. C. Geographic Area / Population Coverage Total population data are available for both the urban and rural areas for the entire country. D. Temporal Coverage Total populations in urban and rural areas are provided on an annual basis, starting from 1961 and ending in 2003. E. Methodology and Frequency of Coverage The total population for annual time series has been obtained from the UN Population Division, which prepares estimates and projections of the total population by sex and age for 1961-2001. These series are biennially revised and the present ones refer to the 2000 revision (“World Population Prospects: The 2000 Revision”, United Nations, New York, 2001). The annual series of the urban/rural population have been derived from the interpolation of the series underlying the related long-term estimates and projections prepared by the UN (quinquennial series), respectively. For reference see: “World Urbanization Prospects: The 2001 Revision” (UN, New York, 2002). The estimates refer to mid-year assessments. F. Methodology of Data Manipulation The total urban and rural populations are originally downloaded from the Annual Time Series of Population Domain in the FAOSTAT-Agriculture database, and the most recent was updated in 10 December 2004.
QUALITATIVE INFORMATION A. Strength and Weakness (data level) The advantage of using FAOSTAT statistics for this type of indicator is that it provides long-term, ready-made statistics of total urban and rural population. Furthermore, additional data sources other than FAOSTAT statistics on the total population in urban and rural areas are needed to support this indicator to ensure its strength. B. Reliability, Accuracy, Robustness, Uncertainty (data level) These data are available in time series since 1961 to 2003 and are continuously being updated by FAO using the statistic database model named FAOSTAT. There appears to be an uncertainty or unreliability of using this FAOSTAT statistic model data to illustrate the urban population for the period 1975 to 1979 as, during this period of the Khmer Rouge regime, Cambodian people were unable to live in urban areas.

162 163
C. Future Work Required (for data level and indicator level) None anticipated.
SUPPORTING DATA TABLES, GRAPHS AND MAPS Figure 1 : Total, Urban and Rural Population, 1961-2003
0
2,000
4,000
6,000
8,000
10,000
12,000
14,000
16,000
1961
1964
1967
1970
1973
1976
1979
1982
1985
1988
1991
1994
1997
2000
2003
Po
pu
latio
n i
n 1
00
0's
Urban Population Rural Population Total Polulation
Table 1 : Urban, Rural and Total Population-Estimates, 1961-2003
Year Urban Population-Estimates
(1000) Rural Population-Estimates
(1000) Total Population-Estimates
(1000)
1961 573 4,991 5,564
1962 588 5,109 5,698
1963 608 5,229 5,836
1964 633 5,350 5,984
1965 665 5,476 6,141
1966 702 5,609 6,311
1967 740 5,747 6,487
1968 774 5,885 6,659
1969 800 6,013 6,813
1970 812 6,126 6,938
1971 808 6,229 7,037
1972 790 6,322 7,112
1973 765 6,388 7,153
1974 743 6,407 7,150
1975 731 6,367 7,098
1976 731 6,256 6,987
1977 742 6,089 6,831
1978 762 5,915 6,677
1979 788 5,801 6,589
1980 818 5,795 6,613
1981 854 5,913 6,767

164 165
Year Urban Population-Estimates
(1000) Rural Population-Estimates
(1000) Total Population-Estimates
(1000)
1982 894 6,141 7,036
1983 938 6,445 7,384
1984 982 6,776 7,758
1985 1,023 7,096 8,119
1986 1,061 7,395 8,456
1987 1,097 7,682 8,779
1988 1,134 7,960 9,093
1989 1,176 8,236 9,412
1990 1,228 8,516 9,744
1991 1,289 8,798 10,088
1992 1,360 9,077 10,437
1993 1,440 9,349 10,789
1994 1,529 9,611 11,140
1995 1,626 9,859 11,485
1996 1,731 10,093 11,824
1997 1,843 10,315 12,158
1998 1,963 10,525 12,488
1999 2,090 10,727 12,817
2000 2,223 10,924 13,147
2001 2,361 11,117 13,478
2002 2,502 11,307 13,810
2003 2,645 11,498 14,144 Source: FAOSTAT, Last update: 10-Dec-04
Table 2: Population in GMS Countries, 2003
Country Population (000)
Lao PDR 5,657
Cambodia 14,144
Myanmar 49,485
Thailand 62,833
Viet Nam 81,377
PRC 1,311,709 Source: FAOSTAT, Last update: 02 March 2005

164 165
SUMMARY A. Policy Reference 1. Purpose: The purpose of this indicator is to measure the pressure on increases of urban and rural population numbers that impact on drinking water provision. 2. Relevance to Environment Planning and Management: The indicator of urban and rural population yields knowledge important for planning, particularly by governments, in the fields such as health, education, housing, social security, employment, environmental preservation, especially in the field of drinking water management and provision, and its expenditure. 3. Linkage to Other Indicators: The total population is relevant to a pressure indicator on water resources. B. Analysis The Cambodian population has increased from 5.5 million in 1961 to 14.1 million in 2003, while the total rural population is much higher than the total urban population (see Figure 1 and Table 1). Figure 1 and Table 1 show that the urban population has slightly increased within the period 1961 to 2003 from 0.6 to 2.6 millions. The rural population has steadily increased from about 6 to 11.5 millions from 1980 to 2003, while it marginally increased from 1961 to 1980. Based on the estimates in Table 1, it is concluded that the total number of the population, and both urban and rural populations has increased rapidly for the whole country and has resulted in pressure on water resources and created a future national water shortage. Based on the comparison shown in Table 2 of the current population in other GMS countries, Cambodia’s population is lower than the other 5 countries except Lao PDR. Based on the observed trend of the indicator that the Cambodian population has increased, it is concluded that the Cambodian population has been Low but Increasing.

166 167
Greater Mekong Subregion Indicator Fact Sheet DATABASE INFORMATION
Indicator ID
Indicator Name Urban and Rural Drinking Water Provision - 1998 to 2003
Year of Assessment 2005
Type of Indicator Response
Frequently Asked Question (FAQ) How much additional safe water was supplied to urban and rural consumers?
Priority Concern Water Resources
Geographic Area Cambodia
Impact & Trend Low and Consistent
Key Message RGC has consistently invested in improving access to safe water to both rural and urban areas. Water supply projects have increased the volume of water in rural areas, and diversified the type of access. However, the level of investment was clearly inadequate given the extremely low percentages of rural access in Cambodia. Comparisons with other GMS countries are difficult but possible to make given the well developed WHO and UNICEF methodology and these comparisons are unfavorable to Cambodia.

166 167
TECHNICAL INFORMATION A. Definition This indicator attempts to represent the source of drinking water provision as well as its expenditure for domestic consumption by taking into account of safe water provision. Water provision expenditure is expressed as US dollars which are available in the Phnom Penh area. Water provision in other provincial towns was not estimated for expenditure, and it can be expressed as volume in cubic meters. In the rural areas, water provision is expressed as a number by which, concerned with contamination, water from reservoirs and rivers is usually processed in a treatment plant before distribution. Water treatment plants are essential for providing water safe for human consumption. Safe water that is safe for drinking and bathing including treated surface water and untreated but uncontaminated water, such as from springs, sanitary wells, and protected boreholes. B. Data Source The figures used for this indicator are extracted from Significant Achievements of the Royal Government of Cambodia during the Second legislature of the National Assembly (1998-2003). These data on drinking water production and its expenditure originate from the Ministry of Industry, Mine and Energy; and data on drinking water provision such as wells and ponds originate from the Ministry of Rural Development. C. Geographic Area / Population Coverage The data are representative of the country as a whole and are differentiated by urban or rural areas. Figures for the volume of drinking water provision for 1998 to 2003 represent urban sites such as Phnom Penh city, other municipalities and provincial towns. Exceptionally, drinking water provision expenditure is available only for Phnom Penh city. Figures for drinking water provision sources which are provided as the numbers of wells, giant Jar, water basins and ponds could be presented for urban areas, but they are mostly in rural areas. D. Temporal Coverage Figures for volume of drinking water provision and its expenditure are available for the period of 1998-2003. E. Methodology and Frequency of Coverage The data on drinking water volume/production and its expenditure are collected and estimated by the Ministry of Industry, Mine and Energy from different companies that undertake and produce drinking water provision. The data on drinking water provision sources such wells and ponds are recorded by the Ministry of Rural Development and are derived from the different NGOs, companies and other agencies, who provide support to rural population development. F. Methodology of Data Manipulation The figure on drinking water production and its expenditure for Phnom Penh city is extracted from the Significant Achievements of the Royal Government of Cambodia during the Second legislature of the National Assembly (1998-2003) which is expressed as cubic meters and Riels. The expenditure is recalculated and expressed as US Dollars with the exchange rate of 1USD = 4000 Riels. However, the figure for drinking water provision in other provincial towns is represented as volume and expenditure figures were not available.

168 169
The data on drinking water provision source such as of wells, giant jars, water basins and ponds are also extracted from Significant Achievements of the Royal Government of Cambodia during the Second legislature of the National Assembly (1998-2003) which is expressed as a number.
QUALITATIVE INFORMATION A. Strength and Weakness (data level) Drinking water provision and its expenditure are indicative of the government’s response to provide the services on safe drinking water for the population in both urban and rural areas. However, it is less indicative of expenditure for urban areas, because data are available only for Phnom Penh city. Furthermore, the numbers of wells, ponds, giant jar and water basins are only indicative of the government’s effort to provide the support to the rural population, and data for the volume of water provided are not accessible/available. There are no data or study related to the safe drinking water level both for the treated and untreated drinking water. There are also no drinking water quality standards for treated water with concentrations of chemical compounds and bacteria that are considered as safe. B. Reliability, Accuracy, Robustness, Uncertainty (data level) The numbers of wells, ponds, giant jar and water basins are assumed to be used as rural water provision for this purposed indicator, nevertheless they might be provided/ supported for the urban population as well. Moreover, these numbers are not reliable and accountable as the total amount of water provision sources; they cannot be controlled throughout the country. The Ministry of Industry, Mine and Energy is managing and monitoring on drinking water production and its expenditure, and Ministry of Rural Development is managing and monitoring on drinking water supply such providing wells, giant jar, water basins and ponds for the rural population. C. Future Work Required (for data level and indicator level) The Ministry of Industry, Mine, and Energy and Ministry of Rural Development are considered as the key ministries in provision of drinking water source data. Meanwhile, the documentation of Achievements of the Royal Government of Cambodia during the Second legislature of the National Assembly (1998-2003) is also considered as an additional data source. Additional figures could be available through Significant Achievements of the Royal Government of Cambodia that reports every five years of the legislature of the National Assembly.

168 169
SUPPORTING DATA TABLES, GRAPHS AND MAPS Figure 1a : Expenditure on Drinking Water Provision for Phnom Penh,
US Dollars, 1998-2003
0
2
4
6
8
10
12
1998 1999 2000 2001 2002 2003
Mill
ion
US
D
Table 1a : Phnom Penh’s Volume of Drinking Water and Its Expenditure – 1998-2003
Year Drinking water production (m3)
Expenditure (Riels) Expenditure (USD)
1998 39,983,794 16,427,655 4,106,914
1999 40,622,481 18,766,305 4,691,576
2000 39,801,167 20,933,172 5,233,293
2001 37,763,647 23,621,322 5,905,331
2002 41,793,679 32,266,943 8,066,736
2003 46,871,146 39,544,816 9,886,204 Source: Ministry of Industry, Mines and Energy
Figure 1b : Urban Drinking Water Provision, Cubic Meters, 1998-2003
0
10
20
30
40
50
60
1998 1999 2000 2001 2002 2003
Mill
ion
Cub
ic M
eter
s
PNH's Volumes Other Town's Volumes Total Urban Volumes

170 171
Table 1b: Urban Drinking Water Provision, Cubic Meters, 1998-2003
Year PNH’s Volumes (m3) Other Town’s Volumes (m3)
Urban Volumes (m3)
1998 39,983,794 4,591,880 44,575,674
1999 40,622,481 5,520,731 46,143,212
2000 39,801,167 5,586,740 45,387,907
2001 37,763,647 6,013,123 43,776,770
2002 41,793,679 6,289,457 48,083,136
2003 46,871,146 8,767,720 55,638,866 Source: Ministry of Industry, Mines and Energy
Figure 2: Rural Drinking Water Provision – 1998-2003
0
2,000
4,000
6,000
8,000
10,000
12,000
1998 1999 2000 2001 2002 2003
Nu
mb
ers
Concrete wells Drilled wells Water basin Pond Giant Jar
Table 2a: Rural Drinking Water Provision Sources, By Year – 1998-2003
Year Protected dug wells
Repaired wells
Drilled wells
Drilled wells repaired
Water basin
Pond Giant jar
1998 933 460 2747 145 11 243
1999 117 383 924 244 42 299
2000 685 187 1371 286 426 461
2001 308 126 1886 1209 238 127 1851
2002 953 179 1105 565 73 156 796
2003 2741 169 1819 210 90 132 200 Note: These data are expressed as numbers. Source: Ministry of Rural Development

170 171
Table 2b: Rural Drinking Water Provision Sources, By Period – 1998-2003
Year Dug wells Drilled wells Water basin Pond Giant jar
1998 933 2747 11 243 0
1998 - 1999 1050 3671 53 542 0
1998 - 2000 1735 5042 479 1003 0
1998 - 2001 2043 6928 717 1130 1851
1998 - 2002 2996 8033 790 1286 2647
1998 - 2003 5737 9852 880 1418 2847 Note: These data are expressed as numbers. Source: Ministry of Rural Development

172 173
SUMMARY A. Policy Reference 1. Purpose: The purpose of this indicator is to monitor the progress in the safe drinking water provided for both urban and rural populations. 2. Relevance to Environment Planning and Management: Adequate quantities of water for meeting basic human needs are a prerequisite for existence, health, and development. If development is to be sustained, adequate quantity of water supply must be available. As development increases, the demand for water will normally also increase for personal, commercial, and agricultural purposes. 3. Linkage to Other Indicators: This indicator is closely associated with other socio-economic indicators on the water provision. It also has close links to other water indicators such as withdrawals, reserves, consumption, or quality. 4. Targets: The UN Millennium Development Goal indirectly related to this indicator is stated as “Halve, by 2015, the proportion of people without sustainable access to safe drinking water (and sanitation).” The national target, through the 2003 Cambodia Millennium Development Goals is expressed differently in terms of urban and rural population as “Increase the proportion of rural population with access to safe water source from 24% in 1998 to 50% in 2015 and urban population from 60% to 80% in 1998 to 2015”. 5. International Environment Treaties: The United Nations Water Conference recommended that Governments reaffirm their commitment made at Habitat to “adopt programmes with realistic standards for quality and quantity to provide water for urban and rural areas. B. Analysis As can be observed from Figure 1a and Table 1a, drinking water expenditure for Phnom Penh (PNH) increased from approximately USD4 million in 1998 to USD10 million in 2003. The annual rate of increase is approximately USD0.5 million for the first 3 years (1998-2001) and USD2 million during 2001-2003. Figure 1b and Table 1b represent the volume of drinking water for other urban areas in the whole country during 1998 to 2003. It can be observed that the volume of drinking water provision for Phnom Penh is much higher than the volume for the total of all other provincial towns about 35 million m3 each year. Drinking water provision for both Phnom Penh and other provincial towns slightly increased. The annual rate of increaseI is about 4 million m3 of total urban water provision. Figure 2 and Tables 2a and 2b show that the number of dug wells, drilled wells, water basin, pond and giant jars increased steadily, due to the Government’s effort for both new water provision sources and maintenance, and attempts to achieve the national target to increase the proportion of the rural population with access to safe drinking water sources from 24% in 1998 to 50% in 2015, and for the urban population from 60% in 1998 to 80% in 2015. Drinking water provision for other GMS countries is not yet provided. The magnitude of the response indicator is therefore non-comparable with outside countries However based on the trend of the indicator and the overall increase in of urban and rural drinking water provision, it is clear that the response has been consistent over the time span of the indicator.

172 173
Greater Mekong Subregion Indicator Fact Sheet DATABASE INFORMATION
Indicator ID
Indicator Name Area under Rice Cultivation 1980-2003
Year of Assessment 2005
Type of Indicator State
Frequently Asked Question (FAQ) Is rice cultivation increasing the demand for additional irrigation water?
Priority Concern Water Resources
Geographic Area Cambodia
State & Trend Average and Stabilizing
Key Message The area under rice cultivation has slowly but steadily grown from 1.4 million ha in 1980 to 2.4 million ha in 2003. Most rice producing areas are rain-fed only. The percentage of rice-growing areas regularly irrigated was 16.6% in the late 1990s. Increases in the rice-growing areas recorded in the last fifteen years exposed the limited capacity for irrigation water storage.

174 175
TECHNICAL INFORMATION A. Definition This indicator attempts to measure the state indicator of water resource or potential irrigation that is supplied to rice cultivated areas in both dry and rainy seasons. It is an indirect measurement by measuring rice cultivated area instead of irrigated area. The result is expressed in hectares of rice cultivated area on an annual basis. Rice cultivated area is an area for cropping rice. In Cambodia, most cultivated rice farmers depend on weather (rainy) so that rice fields can be filled up by water for the whole period of growing rice until it is harvested. The Food and Agriculture Organization (FAO) also notes that the irrigation potential has never been estimated in terms of physical area which could be irrigated considering water and land resources. However, an assessment has been made of the total potential cropped area if existing and past irrigation systems were rehabilitated and improved. B. Data Source The figures were extracted from the Year Book 2003, published by the National Institute of Statistics, and the Agricultural Statistics (2003-2004), published by the Statistics Office, Department of Planning, Statistics and International Cooperation. The original source of the data was the Ministry of Agriculture, Forestry and Fisheries (MAFF). C. Geographic Area / Population Coverage Data are available for both wet and dry seasons of rice cultivated areas for the entire country. D. Temporal Coverage The amount of rice cultivated area is provided on annual basis, from 1998 to 2003. E. Methodology and Frequency of Coverage The data is provided in both wet and dry season. It is collected and estimated by each provincial department and reported to the National Agricultural Statistics Office at MAFF annually. F. Methodology of Data Manipulation Figures are quoted exactly as stated in the Year Book 2003.
QUALITATIVE INFORMATION A. Strength and Weakness (data level) The figure of rice cultivated areas is indicative of potential irrigated land which is supplied for growing rice, although it is indirectly measured. However it is less indicative of the state of agricultural water provision if some areas were filled by water, but it is not cultivated rice. B. Reliability, Accuracy, Robustness, Uncertainty (data level) This data set provides an estimate for agricultural water provision of rice production from 1980 to 2003. However, it is less indicative of the absolute amount of irrigated land due to the data not being a real physical area measurement and it could not be estimated over the country’s total area. C. Future Work Required (for data level and indicator level) Figures are recorded and updated by MAFF annually. The Year Book appears to be published annually or frequently by the National Institute of Statistics, Ministry of Planning.

174 175
SUPPORTING DATA TABLES, GRAPHS AND MAPS Figure 1 : Total Rice Cultivated Areas During Wet and Dry Season, 1980-2003
0
500
1,000
1,500
2,000
2,500
3,000
19
80
19
82
19
84
19
86
19
88
19
90
19
92
19
94
19
96
19
98
20
00
20
02
Tho
usan
d H
ecta
res
Wet Season Dry Season Total Cultivated Areas
Table 1 : Total Rice Cultivated Areas During Wet and Dry Season, 1998-2003
Year Total Cultivated Areas
(thousand ha) Wet Season (thousand ha) Dry Season (thousand ha)
1980 1,441.00 1,346.00 95
1981 1,493.00 1,343.00 150
1982 1,674.00 1,546.00 128
1983 1,740.00 1,624.00 116
1984 1,418.00 1,299.00 119
1985 1,462.00 1,345.00 117
1986 1,535.00 1,413.00 122
1987 1,378.00 1,249.00 129
1988 1,879.00 1,735.00 144
1989 1,932.00 1,787.00 145
1990 1,890.00 1,740.00 150
1991 1,910.00 1,761.00 149
1992 1,853.00 1,710.00 143
1993 1,856.60 1,701.60 155
1994 1,924.00 1,753.90 170.1
1995 2,086.00 1,870.00 216
1996 2,170.90 1,936.90 234
1997 2,076.00 1,827.30 248.7
1998 2,094.70 1,873.10 221.6
1999 2,157.60 1,915.60 242
2000 2,389.50 1,915.50 474
2001 2,241.00 1,974.10 266.9
2002 2,137.10 1,821.10 316
2003 2,314.00 2,030.70 283.3 Source: Ministry of Agriculture, Forestry and Fisheries.

176 177
SUMMARY A. Policy Reference 1. Purpose: The purpose of this indicator is to measure the state of water resource to be supplied for rice cultivation. 2. Relevance to Environment Planning and Management: Cambodian socio-economic development requirements and proposals make several references to water resources and their management. Water is seen as contributing to Government priorities including poverty alleviation and economic growth principally as irrigated agriculture, seen as essential to addressing poverty by achieving food security and promoting income generation in rural areas. The importance of water is recognized also in the context of water for irrigation (Source: FAO Corporate Document Repository, by Mr. Chann Sinath, Deputy Director, Irrigated Agriculture Department, Ministry of Water Resources and Meteorology). 3. Linkage to Other Indicators: Not applicable. 4. Targets: None applicable. 5. International Environment Treaties: Cambodia is a signatory of the 1995 Agreement on the Cooperation for the Sustainable Development of the Mekong River Basin, together with Lao PDR, Thailand, and Viet Nam. Member countries agree to cooperate in all fields of sustainable development, utilization, management and conservation of the water and related resources of the Mekong River Basin, such as navigation, flood control, fisheries, agriculture, hydropower, and environmental protection [source: Cambodia Environment Monitor 2003]. B. Analysis Agriculture is the backbone of the Cambodian economy, and it depends on irrigation/water provision for wet season crops and full irrigation for dry season crops. Table 1 and Figure 1 show that the total rice cultivated area steadily increased from 1.44 million ha in 1980 to 2.31 million ha in 2003. Most of the rice cultivation occurs in the wet season, while the cultivated areas in the dry season were very small in comparison to cultivated areas in the wet season and it very slightly increased from about 95,000 in 1980 to 283,000 ha in 2003.. The small increase in rice production may be caused by the lack of an irrigation system or water management.

176 177
Greater Mekong Subregion Indicator Fact Sheet DATABASE INFORMATION
Indicator ID
Indicator Name Agricultural Population 1980 - 2003
Year of Assessment 2005
Type of Indicator Pressure
Frequently Asked Question (FAQ) Does the increase in the agricultural population threaten the availability of water for irrigation?
Priority Concern Water Resources
Geographic Area Cambodia
Magnitude & Trend Medium and Increasing
Key Message Demand for agriculture water is on the rise as the population engaged in agriculture increases. Cambodia has the highest share of rural agricultural population in all of GMS countries. Indications are that the pressure on agricultural water demand from a growing population will continue to rise.

178 179
TECHNICAL INFORMATION A. Definition This indicator aims to represent the total agricultural population which demands water supply for agriculture in the period 1980 to 2003. It is expressed as the total number of human inhabitants at a given time. B. Data Source The data sources for this indicator originate from the Food and Agriculture Organization of the United Nations (FAO). Figures of total agricultural population were extracted from the Annual Time Series of Population Domain in FAOSTAT-Agriculture database, and the last one was updated on 10 December 2004. C. Geographic Area / Population Coverage The data are representative of the total agricultural population for the country as a whole. D. Temporal Coverage Total agricultural population is provided on annual basis, starting from 1980 and ending in year 2003. E. Methodology and Frequency of Coverage In deriving estimates and projections of agricultural population presented in FAOSTAT-Statistics, FAO has largely relied on the close relationship existing between the ratio of economically active population in agriculture to the total economically active population (EAPA/EAP) and the ratio of agricultural population to total population (AP/TP). For most countries the ratios were assumed to be equal, so that the agricultural population is derived by applying the EAPA/EAP ratio to the total population. The estimates refer to mid-year assessments. F. Methodology of Data Manipulation The agricultural populations are originally downloaded from the Annual Time Series of Population Domain in FAOSTAT-Agriculture database, and the last one was updated on 10 December 2004.
QUALITATIVE INFORMATION A. Strength and Weakness (data level) The advantage of using FAOSTAT statistics for this type of indicator is that it provides long-term, ready-made statistics of total agricultural population. Furthermore, additional data sources other than FAOSTAT statistics on the total agricultural population are needed to support this indicator to ensure its strength. B. Reliability, Accuracy, Robustness, Uncertainty (data level) These data are available in time series since 1980 to 2003 and are continuously being and ongoing updated by FAO using the statistic database model named FAOSTAT. C. Future Work Required (for data level and indicator level) The data and the fact sheet should be updated on an annual basis as new annual data are published in FAOSTAT.

178 179
SUPPORTING DATA TABLES, GRAPHS AND MAPS Figure 1 : Total Agricultural Population, 1980-2003
0
2,000
4,000
6,000
8,000
10,000
12,000
1980
1982
1984
1986
1988
1990
1992
1994
1996
1998
2000
2002
Pop
ulat
ion
in 1
000'
s
Table 1: Total Agricultural Population Estimates, 1980-2003
Year Agricultural Population (1000)
1980 5,004
1981 5,110
1982 5,301
1983 5,548
1984 5,814
1985 6,069
1986 6,305
1987 6,531
1988 6,749
1989 6,969
1990 7,197
1991 7,414
1992 7,633
1993 7,851
1994 8,064
1995 8,271
1996 8,471
1997 8,664
1998 8,851
1999 9,035
2000 9,216
2001 9,395
2002 9,572
2003 9,747 Source: FAOSTAT, Last update: 10 Dec 2004

180 181
Table 2: Agricultural Population in GMS Countries, 2003
CountryAgricultural Population
(000)Non-Agricultural Population (000)
Agricultural Population %
Lao PDR 4,297 1,360 76
Cambodia 9,747 4,397 68.9
Thailand 29,269 33,564 46.6
Myanmar 34,278 15,208 69.3
Viet Nam 53,797 27,580 66.1
PRC 851,028 460,682 64.9Source: FAOSTAT, Last update: 2 Mar 2005
SUMMARY A. Policy Reference 1. Purpose: The purpose of this indicator is to measure the pressure on increases of agricultural population numbers which impacts on the demand for agricultural water provision. 2. Relevance to Environment Planning and Management: The indicator of agricultural population yields knowledge important for planning, particularly by governments, in the fields such as labor force, employment, economy, housing, social security, environmental preservation, especially in the field of agricultural water management and provision, and its expenditure. B. Analysis As can be observed in Figure 1 and Table 1, agricultural population has doubled in during 1980-2003 from 5 to 10 million with the average growth rate per year of approximately 0.2 million for the whole country. This has resulted in double the pressure on agricultural water provision for agricultural production. Based on the comparison as shown in Table 2 of the current agricultural population in other GMS countries, Cambodia is third ranked amongst the six GMS countries in terms of the proportion of the population which is termed agricultural. Based on this comparison and observed trends of the indicator, it is concluded that the pressure on water resources coming from the demand from the agricultural population is Medium and Increasing.

180 181
Greater Mekong Subregion Indicator Fact Sheet DATABASE INFORMATION
Indicator ID
Indicator Name Expenditure on Irrigation System Construction and Maintenance 1999-2003
Year of Assessment 2005
Type of Indicator Response
Frequently Asked Question (FAQ) Is government expenditure making a significant contribution to the overall percentage of farmland served by irrigation?
Priority Concern Water Resources
Geographic Area Cambodia
Impact & Trend Non-Comparable and Intermittent
Key Message Many existing irrigation systems do not function well as a result of decay during the time of Khmer Rouge and insufficient budget in the decade immediately following. The RGC, supported by international donors, have since increased expenditure on the rehabilitation and construction of new irrigation systems. During 1999-2003, the irrigation coverage increased from 16.62% of all farmlands to 20% or by about 3.3 to 4% of total farmland areas annually.

182 183
TECHNICAL INFORMATION A. Definition This indicator attempts to track government expenditure on the construction and maintenance of irrigation systems; it is expressed as an annual amount in US dollars. B. Data Source The figures are extracted from Significant Achievements of the Royal Government of Cambodia during the Second Legislature of the National Assembly (1998-2003), published by Office of Council of Ministers, Phnom Penh, October 2004. The data originate from the Ministry of Water Resources and Meteorology (MOWRAM). C. Geographic Area / Population Coverage The data are representative of government expenditure on rural irrigation systems for the country as a whole. D. Temporal Coverage Expenditure on irrigation system construction and maintenance is provided on an annual basis, beginning in 1998 and ending in the year 2003. E. Methodology and Frequency of Coverage A variety of construction and maintenance expenditure includes: expenditure on irrigation and drainage, flood protection, polder protection, colmatage, rehabilitation and maintenance of structure, dike rehabilitation, excavation and restoring canals, and rehabilitation and installation of pumping stations. The expenditure originates from government budgets, loans and grants. F. Methodology of Data Manipulation The original data were provided in both Riel and US Dollar (USD) currencies. For the purpose of standardizing the indicator values over time, all expenditures were aggregated and re-calculated from Riels to USD based on an exchange rate of USD1 equal to 4000Riels.
QUALITATIVE INFORMATION A. Strength and Weakness (data level) The figure of expenditure on irrigation is indicative of the government’s response on water provision and management for the agricultural sector. However, it is less indicative of how much areas and water can be provided or supplied. B. Reliability, Accuracy, Robustness, Uncertainty (data level) The data may be slightly under-representative of the total expenditure on irrigation systems since it does not include non-government expenditure funded by NGO’s and other non-government contributors. C. Future Work Required (for data level and indicator level) Significant Achievements of the Royal Government of Cambodia is published every five years. However, annual data may be available from MOWRAM for further updating of this indicator and fact sheet.

182 183
SUPPORTING DATA TABLES, GRAPHS AND MAPS Figure 1 : Expenditure on Irrigation System Construction
and Maintenance, 1999-2003
2.32
50.37
13.79
26.53
0.210
5
10
15
20
25
30
35
40
45
50
55
1999 2000 2001 2002 2003
(Mill
ions
) U
S$
Table 1 : Total Expenditure on Irrigation System Construction and Maintenance,
Description Unit 1999 2000 2001 2002 2003
Irrigation and drainage
Riel 1,834,602,000 1,545,130,750
USD 196,663 1,312,711 8,240,785 6,651,533 40,559,246
Flood protection Riel 998,040,000
USD 2,209,513 6,778,772
Polder project Riel 806,360,000
USD 4,043,472 176,730 4,292,660
Colmatage project Riel
USD 11,724,682
Rehabilitation and maintenance of structures
Riel 19,882,100 16,420,000 45,244,000 10,970,000 26,385,740
USD 83,916 15,060 18,504 6,270
Dike rehabilitation Riel 19,964,100 137,765,500 63,830,496 208,178,224 51,232,000
USD 7,602 2,273 720
Excavation and restoring canals
Riel 60,499,900 17,869,900 105,440,000
USD 3,700 4,016 80,000
Rehabilitation and installation of pumping stations
Riel 867,198,000 1,730,000 2,424,000 1,524,000
USD 96,000 5,000,000
Sub-Total Riel 39,846,200 3,662,345,500 1,169,344,396 239,442,124 1,729,712,490
USD 196,663 1,407,930 26,235,785 13,726,277 49,938,176
Total USD 206,625 2,323,517 26,528,122 13,786,138 50,370,605
Exchange rate: 1US$ = 4000RielsSource: Ministry of Water Resources and Meteorology (MOWRAM)

184 185
SUMMARY A. Policy Reference 1. Purpose: The purpose of this indicator is to measure the response of expenditure on irrigation system construction and maintenance which support water resources for agricultural production. 2. Relevance to Environment Planning and Management: Cambodian socio-economic development requirements and proposals make several references to water resources and their management. Water is seen as contributing to Government priorities including poverty alleviation and economic growth principally as irrigated agriculture, seen as essential to addressing poverty by achieving food security and promoting income generation in rural areas. This indicator illustrates the government’s effort to expend many funds for agricultural water provision. 3. Linkage to Other Indicators: Not applicable. 4. Targets: The main economic infrastructure of Cambodia is agriculture. The Royal Government of Cambodia (RGC) would enhance the irrigation systems, because agriculture activities in Cambodia are solely dependent on the weather. In five years from 1998-2003, it would increase the irrigation capacity from 16.62% to 20% on farmland, an annual rate of about 3.32% to 4% (source: Significant Achievements of RGC during the Second legislature of the National Assembly 1998-2003). 5. International Environment Treaties: Cambodia is a signatory of the 1995 Agreement on the Cooperation for the Sustainable Development of the Mekong River Basin, together with Lao PDR, Thailand, and Viet Nam. Member countries agree to cooperate in all fields of sustainable development, utilization, management and conservation of water and related resources of the Mekong River Basin, such as navigation, flood control, fisheries, agriculture, hydropower, and environmental protection. B. Analysis Most existing irrigation systems were damaged by natural deterioration due to inadequate finance to support farmers to operate and maintain irrigation systems. Since 1999, the Government of Cambodia has expended about USD0.2 million on irrigation system construction and maintenance (see Figure 1 and Table 1). This expenditure has grown steadily during the 5-year period, to approximately USD50 million in 2003. Owing to the lack of comparable figures for other GMS countries and based on the observed trends in Figure 1, it is concluded that government expenditure on irrigation system development and maintenance for the period of record is non-comparable and intermittent.
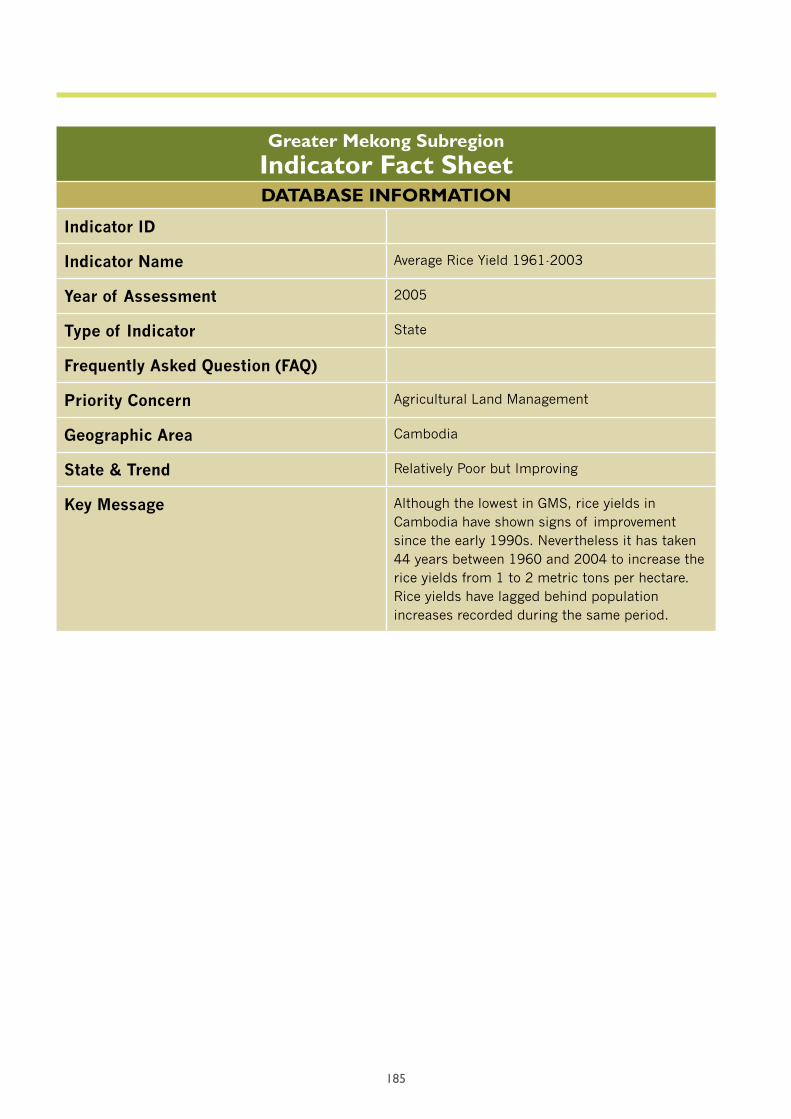
184 185
Greater Mekong Subregion Indicator Fact Sheet DATABASE INFORMATION
Indicator ID
Indicator Name Average Rice Yield 1961-2003
Year of Assessment 2005
Type of Indicator State
Frequently Asked Question (FAQ)
Priority Concern Agricultural Land Management
Geographic Area Cambodia
State & Trend Relatively Poor but Improving
Key Message Although the lowest in GMS, rice yields in Cambodia have shown signs of improvement since the early 1990s. Nevertheless it has taken 44 years between 1960 and 2004 to increase the rice yields from 1 to 2 metric tons per hectare. Rice yields have lagged behind population increases recorded during the same period.

186 187
TECHNICAL INFORMATION A. Definition This indicator attempts to track, over time, the average yield of one hectare of rice field, as an indicator of the state of the agricultural land resource. The result is expressed as the annual rice yield, in metric tons, from one hectare of cultivated rice field. B. Data Source The data utilized for the construction of this indicator originate from the Food and Agriculture Organization of the United Nations (FAO). Figures for average rice yield were extracted from the Crop Primary of Agricultural Production Database, FAOSTAT-Agriculture, last updated on 20 December 2004. C. Geographic Area / Population Coverage The data are representative of rice production and rice yields for the country as a whole. D. Temporal Coverage Average rice yields are provided on an annual basis starting in 1961 and ending in 2004. E. Methodology and Frequency of Coverage Estimates of average rice yield for Cambodia are continuously being updated by FAO as an ongoing activity. The compilation of the Agricultural Production Database has been made possible by the cooperation of governments, which have supplied most of the information in the form of replies to annual FAO questionnaires. FAO has continued to collaborate with various agencies in order to achieve conformity in the presentation of international figures. F. Methodology of Data Manipulation The original data were downloaded in hectograms per hectare. For compatibility with national measurements use, they were converted to metric tons per hectare.
QUALITATIVE INFORMATION A. Strength and Weakness (data level) The advantage of using the FAOSTAT statistic for this type of indicator is that it provides a long-term trend for evaluation. Nevertheless, it is less indicative of land degradation where fertilizers are used for agricultural purposes. B. Reliability, Accuracy, Robustness, Uncertainty (data level) The FAO data source is recommended for this indicator because it is the only data source which can provide a long-term trends for evaluation. National statistics are available for the period 1993 to 2002, as is published in the proceedings of the Annual Conference on Agriculture, Forestry and Fisheries 10-11 April 2003 by Ministry of Agriculture, Forestry and Fisheries (MAFF), but these can only provide short-term trends. C. Future Work Required (for data level and indicator level) For the purpose of updating this indicator and this fact sheet, FAOSTAT figures and MAFF’s statistics are published annually.

186 187
SUPPORTING DATA TABLES, GRAPHS AND MAPS Figure 1: Rough Rice Yield in Metric Tons Per Hectare – 1961-2004
0
0.5
1
1.5
2
2.5
1961
1965
1969
1973
1977
1981
1985
1989
1993
1997
2001
To
ns
pe
r H
ect
are
Table 1: Rough Rice Yields in Metric Tons Per Hectare – 1961-2004
Year Yield 1961 1.09
1962 0.89
1963 1.17
1964 1.16
1965 1.07
1966 1.09
1967 1.22
1968 1.4
1969 1.29
1970 1.59
1971 1.45
1972 1.38
1973 1.29
1974 1.14
1975 1.2
1976 1.1
1977 1
1978 1
1979 0.7
1980 1.19
1981 1.13
1982 1.21
1983 1.26
1984 1.29
1985 1.25
1986 1.38

188 189
Year Yield 1987 1.32
1988 1.37
1989 1.44
1990 1.35
1991 1.4
1992 1.32
1993 1.31
1994 1.49
1995 1.79
1996 1.83
1997 1.77
1998 1.79
1999 1.94
2000 2.12
2001 2.07
2002 1.92
2003 2.15
2004 2.05 Source: FAOSTAT 2004
SUMMARY A. Policy Reference 1. Purpose: The purpose of this indicator is to measure the state of land resource or land quality through indirect measures of the rice production which is represented as metric tons per hectare of agricultural land. However, it is less indicative because the quantity of rice yield depends on fertilizer use to meet the demands of production and water supply is also essential for rice production. 2. Relevance to Environment Planning and Management: Rice plays an important role in Cambodia for the national economy and food security. Most of the country’s land developed for agriculture is used for rice production. Rice is the staple food of Cambodia, providing 75% of the daily caloric intake. 3. Linkage to Other Indicators: This indicator may be linked to other land resource indicators, such as fertilizer use and water supply for irrigation. B. Analysis Rice production in Cambodia is mainly dependent on rainwater. Some populations are using fertilizers for increasing yields. The average rice yield was estimated around 1.2 tons/ha during the 1960s (see Figure 1 and Table 1), and increased significantly by 1970 when rice yield reached 1.6 tons/ha. After 1970, the yield decreased to around 1 tons/ha in the late 1970’s. However, after the 1980’s, the rice yield increased significantly and reached the pre-war level in the mid 1990’s. From the late 1990s and in the early 2000’s, the yield increase significantly and reached an all-time high of 2 tons/ha. It can be concluded that average rice production in Cambodia has increased slightly to feed the increased population for their food security. Since it cannot be compared with other GMS countries, it is concluded that the average rice yield has been Average and Stabilizing.

188 189
Greater Mekong Subregion Indicator Fact Sheet DATABASE INFORMATION
Indicator ID
Indicator Name Available Agriculture Land per Capita – 1961 to 2002
Year of Assessment 2005
Type of Indicator Pressure
Frequently Asked Question (FAQ) Is availability of farmland becoming a significant factor in the pattern of land use and environmental impacts?
Priority Concern Agricultural Land Management
Geographic Area Cambodia
Magnitude & Trend Low and increasing
Key Message Cambodia has traditionally had sizeable areas of agricultural land. However, the agricultural land per capita has seen a decline (from about 0.65 per capita in 1961 to about 0.37 ha per capita in 2003) due to the rapid growth of the rural population and constraints placed on area expansion.

190 191
TECHNICAL INFORMATION A. Definition This indicator was developed as an indicator of the pressure that the agriculture sector imposes on a limited land resource and often in conflict with other sectors such as forestry. It is expressed as the ratio of available agricultural area divided by the total population, in hectares per person. It represents the area in hectares that is required to support the agricultural production for one person. It also expressed the agricultural area as a percentage of total land area, 18,103,500 ha, to represent the available agricultural land area in the country over the period. Agriculture Area in the Food and Agriculture Organization of the United Nations (FAO) land use tables is defined as the sum of the area of arable land, permanent crops and permanent pastures. Arable land in turn is defined as land under temporary crops (double-cropped areas are counted only once), temporary meadows for mowing or pasture, land under market and kitchen gardens and land temporarily fallow (less than five years). The abandoned land resulting from shifting cultivation is not included in this category. Data for “Arable land” are not meant to indicate the amount of land that is potentially cultivable. Permanent crop area is defined as land cultivated with crops that occupy the land for long periods and need not be replanted after each harvest, such as cocoa, coffee and rubber; this category includes land under flowering shrubs, fruit trees, nut trees and vines, but excludes land under trees grown for wood or timber. Permanent pasture is defined as land used permanently (five years or more) for herbaceous forage crops, either cultivated or growing wild (wild prairie or grazing land). The dividing line between this category and the category “Forests and woodland”; is rather indefinite, especially in the case of shrubs, savannah, etc., which may have been reported in either of these two categories. B. Data Source Both data sources for this indicator originate from FAO. Figures for past and existing Agriculture Areas were extracted from the Land domain and Land Use Database of FAOSTAT, last updated in July, 2004. Corresponding population tables and population projections were extracted from the same FOASTAT source in November, 2004. C. Geographic Area / Population Coverage The data and the estimates are representative of agricultural land availability for the country as a whole. D. Temporal Coverage Land cover statistics are provided on an annual basis starting in 1961 and ending in 2002. Population figures and estimates are provided for the same period of record. E. Methodology and Frequency of Coverage Estimates of agriculture land area are continuously being updated by FAO as an ongoing activity. F. Methodology of Data Manipulation For past performance, the amount of agricultural land (in 1000’s of hectares) was divided by population, or population estimate, (also in 1000’s) to arrive at annual per capita rate. In order to express the available agricultural land area as a percentage of total land area, the amount of agricultural land (in 1000’s of hectares) was divided by total land area of 18,104 thousand ha.

190 191
QUALITATIVE INFORMATION A. Strength and Weakness (data level) The advantage of using FAOSTAT statistics for this type of indicator is that it provides long-term, ready-made statistics of land cover and population in a consistent manner. B. Reliability, Accuracy, Robustness, Uncertainty (data level) Although the definition of agriculture area is clearly defined in the FAO database, this definition may not agree with the national definition. As a result of the misinterpretation of this definition, the numbers may not agree with the national figures. Nevertheless, the data, within its level of accuracy, should be adequate to provide long-term trends. C. Future Work Required (for data level and indicator level) None anticipated.
SUPPORTING DATA TABLES, GRAPHS AND MAPS Figure 1: Agriculture Land as a Percentage of Total Land Area – 1961-2002
10
12
14
16
18
20
22
24
26
28
30
19
61
19
63
19
65
19
67
19
69
19
71
19
73
19
75
19
77
19
79
19
81
19
83
19
85
19
87
19
89
19
91
19
93
19
95
19
97
19
99
20
01
Pe
rce
nt
Table 1: Agriculture Land as a Percentage of Total Land Area – 1961-2002
Year Total-Agriculture Land
(Thousands ha) Agriculture Land %
1961 3518 19.4 1962 3533 19.5 1963 3542 19.6 1964 3595 19.9 1965 3627 20 1966 3627 20 1967 3629 20 1968 3577 19.8 1969 3477 19.2 1970 3419 18.9 1971 2450 13.5 1972 2450 13.5 1973 2450 13.5

192 193
Year Total-Agriculture Land
(Thousands ha) Agriculture Land %
1974 2500 13.8 1975 2500 13.8 1976 2550 14.1 1977 2550 14.1 1978 2600 14.4 1979 2600 14.4 1980 2650 14.6 1981 2650 14.6 1982 2680 14.8 1983 2690 14.9 1984 2691 14.9 1985 3170 17.5 1986 3680 20.3 1987 4280 23.6 1988 4930 27.2 1989 5285 29.2 1990 5349 29.5 1991 5300 29.3 1992 5300 29.3 1993 5319 29.4 1994 5305 29.3 1995 5307 29.3 1996 5307 29.3 1997 5307 29.3 1998 5307 29.3 1999 5307 29.3 2000 5307 29.3 2001 5307 29.3 2002 5307 29.3
Total Land Area = 18,103,400 ha Source: FAOSTAT July 2004 – Land Use Database
Figure 2: Agricultural Land Per Capita (ha) – 1961-2002
0.3
0.4
0.5
0.6
0.7
19
61
19
64
19
67
19
70
19
73
19
76
19
79
19
82
19
85
19
88
19
91
19
94
19
97
20
00
He
cta
re

192 193
Table 2: Agricultural Land Per Capita (ha) – 1961-2002
Year Total Agricultural Land
(thousand ha) Total Population
(thousand) Agricultural Land
Per Capita (ha) 1961 3518 5564 0.63 1962 3533 5698 0.62 1963 3542 5836 0.61 1964 3595 5984 0.6 1965 3627 6141 0.59 1966 3627 6311 0.57 1967 3629 6487 0.56 1968 3577 6659 0.54 1969 3477 6813 0.51 1970 3419 6938 0.49 1971 2450 7037 0.35 1972 2450 7112 0.34 1973 2450 7153 0.34 1974 2500 7150 0.35 1975 2500 7098 0.35 1976 2550 6987 0.36 1977 2550 6831 0.37 1978 2600 6677 0.39 1979 2600 6589 0.39 1980 2650 6613 0.4 1981 2650 6767 0.39 1982 2680 7036 0.38 1983 2690 7384 0.36 1984 2691 7758 0.35 1985 3170 8119 0.39 1986 3680 8456 0.44 1987 4280 8779 0.49 1988 4930 9093 0.54 1989 5285 9412 0.56 1990 5349 9744 0.55 1991 5300 10088 0.53 1992 5300 10437 0.51 1993 5319 10789 0.49 1994 5305 11140 0.48 1995 5307 11485 0.46 1996 5307 11824 0.45 1997 5307 12158 0.44 1998 5307 12488 0.42 1999 5307 12817 0.41 2000 5307 13147 0.4 2001 5307 13478 0.39 2002 5307 13810 0.38
Source: FAOSTAT July 2004 – Population Database

194 195
SUMMARY A. Policy Reference 1. Purpose: The indicator was developed to address the concern for conflicting land resources. It is not meant to be an indicator for land degradation. It could also be utilized as a pressure for forest resources. 2. Relevance to Environment Planning and Management: For various reasons, the average value of this indicator will vary dramatically. The absolute value of the result is not the purpose of the indicator. It is the downward trend of the indicator that is the most important factor as more efficient use of the agriculture area is made.The downward trend must continue unless serious compromises are to be made in the country to meet the demands from the agricultural sector. 3. Linkage to Other Indicators: A similar indicator could be developed to monitor the pressure from the forestry sector but with the reduced domestic consumption of wood product and the high level of imports and exports, the per capita basis may be in-appropriate. Likewise, a similar indicator could be developed for urban land use to monitor the per capita area of land which is being consumed by urbanization. 4. Targets: As a pressure indicator, there are normally no set targets for the value of this indicator. However, as the analysis below will show, and once the land allocation is fixed, the decreasing value of this indicator over time becomes the target. B. Analysis Figure 1 and Table 1 illustrate the amount of agricultural land as a percentage of total land area for the period 1961 to 2002. It can be observed that the amount of land allocated for agricultural usage stabilized from 1961 to 1970. However, it dramatically declined within the period 1970 to 1984, as a consequence of the civil wars. Since 1985, the available agricultural land increased consistently to a peak in 1989 and continuously stabilized until 2002. It may be interesting to note the large variance in the percentage of total area that is being utilized by the agricultural sector after 1985. Figure 2 and table 2 show population or population estimates for the same period of record and the land allocated for agriculture per capita which is obtained by dividing the total agricultural area by the population. It can be observed that the per capita rate has been declining since 1989 following an increase from the low figure for 1984. During the conflict period farmland was lost and the population had difficultly in participating in agriculture practices. The pressure on the land resulting from the agriculture sector would increase significantly and this in some cases would result in a serious conflict with targets set out by the forestry sector. Additionally, there will probably be limited additional land allocated to agriculture due to other conflicting needs and a limited land resource. The relative value of the per capita indicator and it’s continued steady decline will be the mark of success in trying to avoid future land use conflicts.

194 195
Greater Mekong Subregion Indicator Fact Sheet DATABASE INFORMATION
Indicator ID
Indicator Name Growth of Agricultural Irrigated Area 1961-2002
Year of Assessment 2005
Type of Indicator Response
Frequently Asked Question (FAQ) Have areas served by irrigation infrastructure increased sufficiently to remove some of the pressure on clearing new land for farming?
Priority Concern Agricultural Land Management
Geographic Area Cambodia
Impact & Trend Significant and Intermittent
Key Message There has been a significant increase of the areas of irrigated farmlands in Cambodia since the late 1970s to a total of about 270,000 ha. It is not clear whether the increase is sustainable and accompanied by adequate maintenance of the larger areas irrigated.

196 197
TECHNICAL INFORMATION A. Definition Agricultural Irrigated Area was developed as an indicator of the response that the agriculture sector imposes on a limited land resource. It is expressed as areas equipped to provide water to the crops. These include areas equipped for full and partial control irrigation, spate irrigation areas, and equipped wetland or inland valley bottoms. B. Data Source The data source for this indicator originates from the Food and Agriculture Organization of the United Nations (FAO). Agricultural Irrigated Area and was extracted from FAOSTAT-Agriculture, Land and Irrigation Database last updated in 2 June 2004. C. Geographic Area / Population Coverage The data are representative of irrigated agricultural areas for the country as a whole. D. Temporal Coverage Figures for irrigated agricultural area are provided on an annual basis, starting in 1961 and ending in 2002. E. Methodology and Frequency of Coverage Agricultural statistics, including irrigated area, are continuously being updated by FAO as an ongoing activity.The compilation of irrigated agricultural area figures has been made possible by the cooperation of governments, which have supplied most of the information in the form of replies to annual FAO questionnaires. FAO has continued to collaborate with various agencies in order to achieve conformity in the presentation of international figures. F. Methodology of Data Manipulation The figures are repeated from the quoted source and have not been manipulated in any way.
QUALITATIVE INFORMATION A. Strength and Weakness (data level) The advantage of using FAOSTAT statistics for this type of indicator is that it provides long-term trend for evaluation. B. Reliability, Accuracy, Robustness, Uncertainty (data level) While the data are indicative of long-term trends, the FAO estimates may at times not agree with national estimates. C. Future Work Required (for data level and indicator level) None anticipated.

196 197
SUPPORTING DATA TABLES, GRAPHS AND MAPS Figure 1: Irrigated Agricultural Area – 1961-2003
0
50
100
150
200
250
3001
96
1
19
64
19
67
19
70
19
73
19
76
19
79
19
82
19
85
19
88
19
91
19
94
19
97
20
00
Year
area in 1000hectar
Agricultural Irrigated Area(1000 Ha)
Table 1: Irrigated Agricultural Area – 1961-2003
Year Area (1000 ha.)
1961 62
1962 65 F
1963 65 F
1964 68
1965 100
1966 100
1967 100
1968 100 *
1969 89
1970 89
1971 89
1972 89
1973 89 *
1974 89 *
1975 89 *
1976 95 F
1977 100 F
1978 110 F
1979 115 F
1980 120 F
1981 125 F
1982 130 F

198 199
Year Area (1000 ha.) 1983 140 F
1984 160 F
1985 180 F
1986 200 F
1987 210 F
1988 220 F
1989 230 F
1990 240 F
1991 250 F
1992 260 F
1993 269 *
1994 270 F
1995 270 F
1996 270 F
1997 270 F
1998 270 F
1999 270 F
2000 270 F
2001 270 F
2002 270 F Legend: * = Unofficial figure, F= FAO estimate Source: FAOSTAT-Agriculture, 2004

198 199
SUMMARY A. Policy Reference 1. Purpose: The purpose of this indicator is to monitor the growth of irrigated agricultural area over time. 2. Relevance to Environment Planning and Management: Water management has been one of the primary concerns for the rural population. Agricultural production is central to the economy of Cambodia. 3. Linkage to Other Indicators: This indicator could be used and linked with Agricultural land per capita to monitor the per capita amount of agricultural land which is accessible to irrigation. 4. Targets: There are no targets directly associated with this indicator. 5. International Environment Treaties: Cambodia is a signatory of the 1995 Agreement on the Cooperation for the Sustainable Development of the Mekong River Basin, together with Lao PDR, Thailand, and Viet Nam. Member countries agree to cooperate in all fields of sustainable development, utilization, management and conservation of the water and related resources of the Mekong River Basin, such as navigation, flood control, fisheries, agriculture, hydropower, and environmental protection. B. Analysis In Cambodia, agriculture or rice production is dependent on irregular patterns of rainfall, but with dry spells during the growing season or the annual inundation, water management is quite difficult. As can be observed from Figure 1 and Table 1, irrigated agricultural area has steadily increased from 60,000 ha in 1961 to 270,000 ha in1994. However, during the war period from 1969 to 1975, the irrigated area declined slightly. After 1975, the irrigated area rose rapidly to approximately 270,000 ha in 1993 and, according to estimates, has remained stable since then. As can be observed from the trend, the agricultural irrigated area has increased to increase rice production. Hence it can is concluded that the government response to irrigated agriculture has been Significant and Intermittent.

200 201
Greater Mekong Subregion Indicator Fact Sheet DATABASE INFORMATION
Indicator ID
Indicator Name Demined areas 1992-2004
Year of Assessment 2005
Type of Indicator Response
Frequently Asked Question (FAQ) How much impact do de-mining activities have on making more land available for agricultural production?
Priority Concern Agricultural Land Management
Geographic Area Cambodia
Impact & Trend Significant and consistent
Key Message Cambodia Mine Action Center has been clearing UXO-contaminated land at a rate of approximately 1000 ha per year. As well as eliminating risks to life, this has added significantly to the area of land available for farming.

200 201
TECHNICAL INFORMATION A. Definition This indicator attempts to track the demined areas which are cleared to support the poor people that either benefit by having access to land for resettlement and for agricultural production. Demined areas refer to land which is cleared or made free of mines, Unexploded Ordnance (UXOs) and bombs which were laid during the civil war. B. Data Source The data source for this indicator originates from the Cambodian Mine Action Centre (CMAC). Figures of demined areas were extracted from web-based CMAC progress reports, last updated in 2005. C. Geographic Area / Population Coverage The figures are representative of demined areas for the country as a whole. D. Temporal Coverage Figures are published annually starting in 1992. E. Methodology and Frequency of Coverage Land mines are continuously being cleared by CMAC, working closely with local communities and through the provincial authorities and by coordinating efforts towards the relief of people who were living in close proximity to mine fields. F. Methodology of Data Manipulation Area figures were originally quoted in square meters but have been converted to hectares for comparison with other indicators and fact sheets.
QUALITATIVE INFORMATION A. Strength and Weakness (data level) The indicator is indicative of rehabilitated land to support the demands of agricultural land. However, demined areas are not only important for agricultural land, they are equally important for settlement areas, roads, infrastructure, tourist sites …etc. B. Reliability, Accuracy, Robustness, Uncertainty (data level) The area figures reported by CMAC are not qualified for accuracy but can be considered quite reliable for indicator development. C. Future Work Required (for data level and indicator level) The indicator and the fact sheet should be updated annually as new figures are published by the CMAC.

202 203
SUPPORTING DATA TABLES, GRAPHS AND MAPS Figure 1: Cumulative Demined Area – 1992-2004
0
2000
4000
6000
8000
10000
12000
14000
92-93 92-94 92-95 92-96 92-97 92-98 92-99 92-00 92-01 92-02 92-03 92-04
Period
Area (ha)
De-mined areas
Table 1: Cumulative Demined Area – 1992-2004
Period Demined Area (ha) 92-93 547.99 92-94 1334.51 92-95 2349.51 92-96 3398.88 92-97 4955.42 92-98 6193.67 92-99 7273.44 92-00 8110.41 92-01 9074.15 92-02 10232.38 92-03 11203.24 92-04 12021.82
Source: Cambodia Mine Action Centre
Table 2: Annual Demined Area – 1992-2004
Period Demined Area (ha) 92/93 547.99 93/94 786.52 1995 1015 1996 1049.37 1997 1556.54 1998 1238.25 1999 1079.77 2000 836.96 2001 963.75 2002 1158.22 2003 970.87 2004 818.57
Source: Cambodia Mine Action Centre

202 203
SUMMARY A. Policy Reference 1. Purpose: The purpose of this indicator is to measure the rehabilitated land to support the demands of agricultural land. It is understood that the higher the total of demined areas, the better the performance of the country in rehabilitating land to support poor people. 2. Relevance to Environment Planning and Management: The true positive impact of de-mining is not only the amount of square meters cleared, but also the number of people that either benefit by having access to land for resettlement and production, or preventing them from becoming victims of land mines and UXOs. 3. Linkage to Other Indicators: This indicator is linked to land rehabilitation, management and indicator of population growth. 4. Targets: CMAC is to continue to reduce land mine/UXO contamination in Cambodia in a transparent, prioritized, cost-effective and safe manner, so that the maximum number of people - predominantly rural but also urban - can go about their lives free from the threat of landmines/UXO, thus permitting reconstruction, re-integration and development activities to take place in a safe environment, making further significant progress towards the target of zero landmine victims by 2020. (The contaminated landmine/UXO represented approximately 4,466 square kilometers which was recorded by CMAC’s National Level 1 Survey) B. Analysis Demand for land, especially agricultural land, is increasing and is expected to continue. The land that was mined during the civil war is now required for rural arable land. As can be observed from Figure 1 and Table 1, the demined areas were consistently increased from 500 ha in 1992 to 12,000 ha in 2004. Approximately 1,000 ha of land was freed from landmines annually and the CMAC’s effort supported the rural population by creating agricultural land and settlements etc.. However, mine information, survey and marking is one of the major core activities of CMAC in identification, recording and marking of mined areas to prevent people from unknowingly entering into mined areas. As a long-term vision, CMAC believes that only this activity will support the Government of Cambodia to achieve its end state “Zero Victim” by 2020. (CMAC’s Integrated Work Plan 2004)

204 205
Greater Mekong Subregion Indicator Fact Sheet DATABASE INFORMATION
Indicator ID
Indicator Name Emissions of Greenhouse Gases 1994
Year of Assessment 2005
Type of Indicator Response
Frequently Asked Question (FAQ) Pressure
Priority Concern Climate Change
Geographic Area Cambodia
Magnitude & Trend Low and Increasing
Key Message In 1994, Cambodia sequestered more GHG than it emitted. However, by 2000, it has probably become a net emitter of greenhouse gases and the indications are that the country’s GHG emissions have been rising since then. Activities from agriculture and land use/forestry sectors are the major contributing factors.

204 205
TECHNICAL INFORMATION A. Definition This indicator attempts to measure the anthropogenic emissions of Greenhouse Gases (GHGs) in Cambodia contributing to global warming. Three main greenhouse gases are carbon dioxide (CO2), methane (CH4) and nitrous oxide (N2O). It is expressed as Gigagrams (Gg) of CO2 equivalent emissions per Gg of GHG emissions. B. Data Source The figures utilized for the construction of this indicator were extracted from “Cambodia’s Initial National Communication” under the United Nations Framework Convention on Climate Change (UNFCCC), published by the Climate Change Enabling Activity Project under the Ministry of Environment, August 2002. C. Geographic Area / Population Coverage The figures are representative of the country’s greenhouse gas emissions in 1994 and Cambodia’s contribution to global warming from various sectors such as energy, industry, agriculture, waste, and land use change and forestry. D. Temporal Coverage As required by the UNFCCC, the baseline year of the greenhouse gas inventory is 1994. Estimates for year 2000, 2010 and 2020 are also provided and based on the 1994 baseline figures. E. Methodology and Frequency of Coverage For Cambodia, as a developing country (a Non-Annex I party to the United Nation Framework Convention on Climate Change, UNFCCC), it is mandatory that the national GHG inventory covers three main greenhouse gases: carbon dioxide (CO2), methane (CH4), and nitrous oxide (N2O). Following the recommendation of UNFCCC Secretariat, the Cambodian National GHG inventory was developed using the 1996 revised Intergovernmental Panel on Climate Change (IPCC) methodology with the base year of 1994. The first-ever GHG inventory in Cambodia covers five sectors: (i) energy, (ii) industry, (iii) agriculture, (iv) waste, and (v) land use change and forestry (LUCF). Each of the GHG’s has different contributions to the total greenhouse effect, which can be expressed as global warming potential (GWP). The GWP is expressed in tons (or units) of CO2 equivalent (CO2-e) emissions per ton (or unit) of GHG emissions. CH4 has 21 tons of CO2-e per ton of methane emitted. Nitrous oxide (N2O) has 310 tons of CO2-e per ton of N2O emitted. The methane and nitrous oxide emissions were converted to tons of CO2-e by multiplying the methane emissions by 21 and the tons of nitrous oxide emission by 310. F. Methodology of Data Manipulation The figures are quoted directly from the Initial National Communication and have not been manipulated for the purpose of this indicator development.

206 207
QUALITATIVE INFORMATION A. Strength and Weakness (data level) The figures for this indicator provide the long-term trend of GHG emissions by the various sources which contribute to global warming. The values of GHGs emissions in 1994 were estimated according to inventory data; figures for 2000 to 2020 are merely future projections of those data based on 1994 baseline data. B. Reliability, Accuracy, Robustness, Uncertainty (data level) The data utilized for the construction of this indicator are based on 1994 activity data collected from different stakeholders. However, some activity data needed for developing the inventory for certain sectors were not available. In such cases, the data were estimated from related available data by using several assumptions. Some available data which were held and reported from other institutions, however, some uncertainties still exist due to the current weak data management in most agencies. Furthermore, local emission factors were not available for Cambodia. In most cases, the emission factors used for the analysis were IPCC default values or emission factors developed by regional countries such as Thailand, Philippines or Indonesia. C. Future Work Required (for data level and indicator level) The indicator and the fact sheet should be updated if and when Cambodia conducts further greenhouse gas inventories.
SUPPORTING DATA TABLES, GRAPHS AND MAPS Figure 1: Past and Projected GHG Emissions by Sector – 1994-2020
-100,000
-80,000
-60,000
-40,000
-20,000
0
20,000
40,000
60,000
80,000
100,000
120,000
19
94
20
00
20
06
20
12
20
18
Gig
ag
ram
s in
CO
2 E
qu
iva
len
t
Energy Agriculture Waste
LUCF Total Emissions Removal by LUCF
Net Emissions

206 207
Table 1: Past and Projected GHG Emissions by Sector – 1994-2020
Emissions1994 2000 2010 2020
Gg % Gg % Gg % Gg %
Energy 1,853 2.8 2,622 3.6 4,780 5.9 8,761 9
Industry 50 0.1 - - -
Agriculture 10,560 15.5 12,030 16.4 17,789 22.1 26,821 27.5
Waste 273 0.4 331 0.4 425 0.5 523 0.5
LUCF 55,216 81.2 58,379 79.6 57,627 71.5 61,512 63
Total Emis-sions
67,952 100 73,362 100 80,621 100 97,617 100
Removal by LUCF
-73,122 -67,118 -61,090 -53,769
Net Emissions
-5,170 6,244 19,531 43,848
- Figures of 1994 were inventoried GHG Emissions (IPCC Methodology)- Figures of 2000-2020 were projected based on 1994.- LUCF – Land Use Change and Forestry.Source: Climate Change Enabling Activity Project, Ministry of Environment, August 2002.
Table 2: Inventory and Projected GHG Emissions by Gases – 1994-2020
1994 2000 2010 2020Gg % Gg % Gg % Gg %
CO2 54,587 80 58,345 79 59,698 74 67,304 69
CH4 9,472 14 10,908 15 14,882 18 20,813 21
N2O 3,844 6 4,109 6 6,040 8 9,500 10
Total CO2-eqv.
67,902 100 73,362 100 80,620 100 97,617 100
- Figures for 1994 were inventoried GHG Emissions (IPCC Methodology)- Figures for 2000-2020 were projected based on 1994 figures- All emission gases are expressed as CO2–equivalents.Source: Climate Change Enabling Activity Project, Ministry of Environment, August 2002.
s

208 209
Table 3: Inventory and Projection GHG Emissions by Gases from Different Sectors – 1994-2020
1994 2000 2010 2020
GHG Emissions from Energy Sector (Gg of CO2-e)
CO2 1,101 1,775 3,713 7,434
CH4 634 712 892 1,099
N2O 118 135 175 228
Total CO2-e 1,853 2,622 4,780 8,761
GHG Emissions from Agriculture Sector (Gg of CO2-e)
CH4 7,125 8,379 12,270 17,942
N2O 3,435 3,652 5,518 8,878
Total CO2-e 10,560 12,030 17,789 26,821
GHG Emissions from Waste Sector (Gg of CO2-e)
CH4 142 173 220 272
N2O 131 158 205 251
Total CO2-e 273 331 425 523
GHG Emissions from Land Use Change and Forestry Sector (Gg of CO2-e)
CO2 53,486 56,570 55,985 59,870
CH4 1,570 1,644 1,499 1,499
N2O 160 164 143 143
Total CO2-eqv. Emissions 55,216 58,379 57,627 61,512
Total CO2-eqv. Uptake -73,122 -67,118 -61,090 -53,769
Total CO2-eqv. Net Emissions -17907 -8739 -3462 7744- Figures for 1994 were inventoried GHG Emissions (IPCC Methodology)- Figures for 2000-2020 were projected based on 1994 figures.- All emission gases are expressed as CO2 – equivalents.Source: Climate Change Enabling Activity Project, Ministry of Environment, August 2002.

208 209
SUMMARY A. Policy Reference 1. Purpose: The purpose of this indicator is to measure the quantity of GHG emissions contributing to global warming. It is understood that the higher the amount of GHG emissions, the greater the country’s contribution. 2. Relevance to Environment Planning and Management: The GHG emissions inventory allows Cambodia not only to better estimate the various emissions but also to focus on a more climate sensitive development program, which entails the formulation of mitigation and vulnerability and adaptation policies. The main greenhouse gases (GHGs) are carbon dioxide (CO2), methane (CH4), nitrous oxide (N2O). While there are natural emissions of GHGs, anthropogenic emissions have been identified as a source of climate change (IPCC Second Assessment Report, 1995) and are the subject of an international instrument (the UN Framework Convention on Climate Change). Such emissions are largely influenced by a country’s energy use and production systems, its industrial structure, its transportation system, its agricultural and forestry sectors, and the consumption patterns of the population. Methane and nitrous oxide emissions are particularly influenced by a country’s agricultural production, waste management, and livestock management. Climate change results in part from the increased concentration of greenhouse gases in the atmosphere. At one level, global warming due to anthropogenic emissions of greenhouse gases can be said to have no adverse effect on ecosystems if the increase in global temperature is within 0.1 degree C per decade, with a maximum total warming of 2 degrees C above the pre-industrial situation (IPCC, 1992). In this case, it is suggested that ecosystems can adjust or adapt to the temperature changes within these limits. The Intergovernmental Panel on Climate Change (IPCC) has worked out levels for the most important greenhouse gases that should lead to a stabilization of total GHGs at the no-adverse effect level. This is known as the accelerated policies scenario. However, given the increase in the atmospheric concentration of GHG from 280 ppmv in the pre-industrial period (that is, before 1850) to 356 ppmv in 1994, the temperature increase may be occurring more rapidly and randomly than ever before. Based on the findings of three working groups, the IPCC says that the earth’s temperature could rise by between one and 3.5 degrees Celsius by 2010; an average rate of warming probably higher than any in the last 10,000 years 3. Linkage to Other Indicators: None. 4. Targets: The objective of the Climate Change Convention (Article 2) is to achieve the stabilization of GHG concentrations in the atmosphere at a level that would prevent dangerous anthropogenic interference with the climate system. 5. International Environment Treaties: Cambodia ratified the United Nations Framework Convention on Climate Change (UNFCCC) on 18 December 1995. The Convention came into force in Cambodia on 17 March 1996. UNFCCC entered into force in March 1994 and, as of end January 1996, it had been ratified by 152 Parties. Article 4 of the Convention, among other commitments, calls for Annex I Parties to return by 2000 (individually or jointly) their anthropogenic emissions of carbon dioxide and other GHGs not controlled by the Montreal Protocol to their 1990 level. Additionally, some Annex I Parties to the Convention have set national targets that go beyond those of the Convention.

210 211
B. Analysis In 1994, Cambodia was contributing GHG emissions of approximately 68,000 Gg of CO2-equivalents which are primarily from land use change and forestry (LUCF) sector (see Table 1). As observed by sector, LUCF contributed to approximately 81% of total GHG emissions, while agriculture and energy contributed to approximately 16% and 3%. The contribution of the industrial sector to the total GHG emissions was insignificant. However, Cambodia removed approximately 73,000 Gg of CO2-equivalents by land use change and forestry sector. Therefore, in 1994 Cambodia was a net sink country. The overall assessment of Cambodia’s contribution to greenhouse gas emissions using Global Warming Potential showed that Cambodia could offset approximately 5,000 Gg of CO2-equivalents of global GHG emissions. As can be observed from Table 2 and Table 3, GHG emissions consist of three main gases: CO2, CH4 and N2O. CO2 emissions were about 80% of total CO2-equivalents, followed by CH4, 14% and N2O emissions, 6%. The main source of CO2 emissions contributed from LUCF sector. The results from this projection analysis of greenhouse gas emissions and removals by sectors (see Figure 1 and Table 1) indicated that, in 2000, Cambodia was already a net emitter of GHGs. The net emissions were approximately 6,000 Gg of CO2-e It was prediceted that the net emissions will increase to approximately 44,000 Gg of CO2-e in 2020. Among different sectors, LUCF would be the main source of GHG emissions (63%), followed by agriculture (28%). Energy would only contribute to approximately 9% of the total national emissions. However, projected GHG emissions from the agricultural sector increased more than other sources from 16% to 28% of total national GHG emissions.

211
COMMUNITY FISHERIES: A CASE STUDY OF PERFORMANCE IN ALONG RAING, PURSAT PROVINCE 1. The Background 1. AnlongRaingisafloatingcommunitylocatedinKampongPouCommune,KrakorDistrict,PursatProvince.ItfloatsonwaterforninemonthsandisbasedonlandfromMarchtoMay.Thelocationof thevillagedependsonthewaterlevelof theTonleSapLake.
2. Thevillagehasexistedformorethan100yearsinthepresentarea.Currently,itishometo93familieswithatotalpopulationof 431peopleandanadultpopulationof 186people(100males,and86females).Thevillagerscompletelydependonfishing,andnoneof themownfarms.Fishcaughtisusedbothforconsumptionbythevillagersandforsale.Thecashincomeisusedtobuyclothes,medicines,kitchenitems,ceremonycontribution,schoolfees,etc.3. Thevillagefloatsupanddownbetweenfishinglotno.7andtheKampongPrakfishsanctuary.In
Case Study 1
CAMBODIA NATIONAL ENVIRONMENTAL PERFORMANCE
ASSESSMENT (EPA) REPORT

212 213
thenorth,itbordersfishinglotno.7forabout480m.InthesouthitbordersMatPreyVillage,PorRobongvillageandO’sandanCommune;inthewesttheKanchorCommuneandintheeast,theFishConservationlotforabout250m.In2000,theRGCreleased41%of theareaof fishinglotno.7forusebythelocalcommunitywhohaveorganizedcommunityfisheriesonthesewaterswiththesupportof alocalNGO–CambodiaFamilyDevelopmentService(CFDS).
Table 1.1: Areas of the Along Raing Community Forestry
Type of fishing
groundArea (ha)
areasunderinundatedforest
572
areaunderwater 1,015
Total 1,587
Source: Statute of Anlong Raing Community Fishery, 2005
4. TheAnlongRaingCommunityFisheriescoveranareaof 1587ha,including572haof inundatedforestand1,015haof waterareas.5. Theobjectiveof thiscasestudyistoassessthesuccessof thelocalcommunityinmanagingthefishresourceandtheuseof theperformanceassessmentframeworkdevelopedunderSEFIIprojectforthispurpose.2. The State
The Indicator: Fish Consumption Per Capita
6. Thefishconsumptionpercapitaistakenastheprincipalindicatorof thestateof fisheriesresourcesinAnlongRaingarea.Itmeasurestheamountof inlandfishcatchthatisusedforhouseholdconsumptionpercapitaperannumandismeasuredinkilogramof liveweight.Asanindicatorof thehealthof theresource,theindicatorhasthedisadvantageof possibly
masking—behindfiguresof stableorevenincreasingoutput—aloomingscarcity.Provided,however,thatitiscollectedoverasufficientlylongperiodthisriskisreduced.7. OfficialdataonfishcatchinAnlongRaingCommunityFisheriesarenotavailable.Instead,householdfishconsumptionpresentedinthisreportisbasedoninformationgatheredfromfieldsurveysandinterviewswithcommunitymembers.8. Asvillagersownnoland,fishingistheexclusivemethodof obtainingfoodandgeneratingcashincome.Table2.1showstheestimatedaverageannualfishconsumptionpercapitainAnglingof 81kilograms(kg).Withanaveragefamilysizeof 5personsperfamily,thetotalannualaveragehouseholdconsumptionis405kg.Thefishconsumptionvariesthroughouttheyear,dependingonthequantityandcompositionof thefishcatch.Inanopenfishingseason,particularlyfromJanuarytoMay,AnlongRaingcommunitymemberscouldcatchandconsumemorefish,approximately2kgof fishperhouseholdperday.However,fromMayonwards,thewaterlevelincreasesintheTonleSapLakeandfishingactivityisreduced.Thefishingseasonisclosedandallfishingactivities,exceptsubsistencefishing,areprohibited.Duringthisperiod,theoutputfallstoabout0.5kgperhouseholdperday.9. Notallfishisconsumed,somearesoldorexchanged.Table2.2providesdetailedinformationaboutthepatternof householdexpenditureof afishingfamilyinAlingRaing.Onaverage,eachfishingfamilyspends7,500Riels(1.9US$)1perdayforfood.Thisexpendituredependsonafamily’scondition:arichfamilyspendsaround10,000Rielsandthepooronespendsaround5,000Rielsperfamily.Basedonthesefigures,itisestimatedthattheannualexpenditureperfamilyisabout547,500Riels,excludingotherexpenditurefornon-fooditemssuchassocialactivitiesincludingweddingsandreligiousceremonies,etc.
1 The exchange rate is about 4,000 Riels = 1 US$

212 213
Table 2.1: Fish Consumption Per Annum in Anlong Raing Village
kg/HH/Day kg/HH/Year kg/Capita/YearFishconsumption(Jan–May) 2 300 60
Fishconsumption(Jun–Dec) 0.5 105 21
Totalannualfishconsumption 405 81Note:- On average there are 5 persons per Household.- kg – Kilogram- HH – Household
Table 2.2: Expenditure for Food Supply
Riels/HH/Day Riels/HH/Year Riels/Capita/Year
Minimumexpenditure 5,000 1,825,000 365,000
Maximumexpenditure 10,000 3,650,000 730,000
Averageexpenditure 7,500 2,737,500 547,500Note:- This expenditure is paid only for food such as: rice, vegetable, meat etc.- The exchange rate is about 4,000 Riels = 1 US$
Suggested Trend and Rating of the State: Relatively good with undetermined trend Justification: Fish consumption in Anlong Raing is high by Cambodian and GMS standards. However, no trend has been established. The data collected for this case study can serve as a benchmark for future assessments of changes in fish abundance in Anlong Raing areas.
3. Pressure
Pressure Indicator: Fishing nets per household, 1995-2005
10.Thepressureonfisheriescomesfromincreasedintensityof fishingandfrompracticesthatthreatentheresource’ssustainableexploitation.Theinlandfishcatchcouldbetakenasanindicatorof thepressureonfisheriesresourcesinAnlongRaing,eventhoughitisrelatedto(butnotidenticalwith)fishconsumptionusedabove.11.Table3.1providesdetailsof fishcatchinAnlongRaingcommunityinthecourseof ayear(2004).FromJanuarytoMay—anopenfishing
season—thedailyfishcatchisestimatedatabout20kgof fishinAnlongRaingperhouseholdwithafamilysizeof 5people.ThetotalhouseholdfishcatchfromJanuarytoMayisestimatedatabout600kg.However,fromJunetoDecember,thefishcatchisreducedduepartlytoitbeingaclosedfishingseason,andpartlytothehighwaterlevel.Thedailyfishcatchduringthisperiodisestimatedatabout5kgperhouseholdand,withinthisperiod,thetotalcatchisestimatedabout210kgperhouseholdof 5familymembers.Basedonthesefigures,ayearlyfishcatchperhouseholdinAnlongRaingisestimatedatabout810kg.12.However,amoresuitableindicatorexistsintheformof changesinthetypeof equipmentusedbythelocalfishers(here,thelengthof thefishingnetsusedperfamily)thatisagoodproxyforthefishingeffort.Thevaluesof theindicatorswereoncemorebasedoninformationgatheredduringinterviewswithcommunitymembers.13.TheAnlongRaing’scommunitymembersaresmall-scalefisherswhousesimplegearsuchasharpoon(sang,chbok,snor,sam,changrop),orhandled-scoopingbasket(chheangdai)aswellasfishingnets.Thefamilyscalefishingisallowedyearround,withoutaneedforalicense.14.Thefishcatchvariesfromhouseholdtohouseholddependingonthefishinggearused.Table3.2andFigure3.1illustratethetrendof

214 215
Table 3.1: Inland Fish Capture in Anlong Raing Village, 2004
Kg/HH/Day Kg/HH/Year Kg/Capita/YearFishcatch(Jan–May) 20 3000 600
Fishcatch(Jun–Dec) 5 1050 210
Totalannualfishcatch 4050 810Note:- On average, there are 5 persons per household.- Kg – Kilogram- HH – Household
fishinggearuseoveraperiodof 10years.Itisobservedthatthedailyfishcatchperhouseholdthroughouttheyearismaintainedataboutthesamelevel.Thisdoesnotnecessarilymeanthatfishremainsabundant,butfishersintensifytheirefforttomaintainthesamecatch.Thisisbestdemonstratedbythechangesinthetypeof equipmentused.Indoingthis,fishershaveenlargedthefishinggear.Table3.2indicatesthatinthelast10years,fishersinAnlongRainghaveprogressivelyusedmorefishingnetsthanbefore.Approximately200metersof fishingnetsusedperhouseholdwereused10yearsagowhichhasincreasedto1300metersatpresent.Intensifieduseof fishingnetsisillegalundercurrentlegislation.
Figure 3.1: Fishing Nets Per Household 1995-2005
0
200
400
600
800
1000
1200
1400
5002s5991
Met
ers
Fishing nets per household
Table 3.2: Fishing Nets Per Household
1995-2005
1995 2005MinimumFishingnets(meters/HH)
100 600
MaximumFishingnets(meters/HH)
300 2000
Averagefishingnets(meters/HH)
200 1300

214 215
Suggested Trend and Rating of the Pressure: High and Increasing Justification: The pressure on fisheries resource in Anlong Raing has been steadily increasing as the intensity of fishing efforts has increased. On average, local fishers use seven times the length of fishing nets per family than they did ten years ago.
4. Response 15.Noindicatorhasbeenselectedasthemostrelevantresponses(thesettingupof thecommunityfisheryenterprise)havenotbeenfullyimplementedandotherresponseshavebeentoosporadictoserveasabasisforanindicatorthatdisplaysameaningfultrend.16. In2002,AnlongRaingcommunityorganizedacommunityfisheryonthefishingareasreleasedfromthecommercialfishing(lotno.7).Thiscommunityenterpriseisheadedby12peopleelectedbycommunitymembersasthefisheriescommitteeunderAnlongRaingCommunityFisheriesby-Law,2002.ThecommunityenterpriseissupportedbytheNGOCambodiaFamilyDevelopmentService(CFDS)basedinPursatProvince.17.TheSub-decreeonCommunityFisherieswasdraftedin2001andpassedinmid-2005.ThisSub-decreeprovidesalegalsupportforcommunityfisheriescountrywide.Theby-lawof AnlongCommunityFisheries(seeabove)ispassedbythecommunitymembers.Ataprovinciallevel,theby-lawhasbeenapprovedbydistrictandprovincialauthoritiesanditnowawaitsnationalapproval.18.TheAsianDevelopmentBankhasapprovedaloanof US$10.91millions,whiletheGlobalEnvironmentFundandtheUnitedNationsDevelopmentProgrammehaveprovidedgrantsof US$3.93millionsandUS$0.61millions,respectively,includinganin-kindcontributionbytheRoyalGovernmentof Cambodiaof US$3.91millionsfortheTonleSapEnvironmentalManagementProjectcoveringtheentireLake.Oneof thecomponentsof thisprogramsupports
communitybasedfisheriesmanagementaroundtheTonleSapLakeandAnlongRaingcommunityisoneof them.ADBhasalsobeenprovidingothertypesof assistanceundertheTonleSapInitiativethatexaminesthelivelihoodsof thecommunitieslivingaroundtheTonleSapLake.5. Conclusion 19.ThefishcatchinAnlongRaingisbeingmaintainedevenif theevidenceforthisisbasedoninterviewsonly.Therefore,itisnotpossibletosaythatthelocalfisherieshavedeclined.However,itisclearthatfishershaveintensifiedtheireffortstomaintainthesamelevelof output.Asaminimum,thissuggestsunderlyingchangesinthesizecompositionof thefishstockanditcouldmeanthatthesustainabilityof theresourceisbeingunderminedbythisillegalintensificationof fishingefforts.20. Itistooearlytosaywhattheeffectof theestablishmentof thecommunityfishingenterprisewillbe.InanyeventtheSub-decreeonCommunityFisherieshasyettobepassedbytheCentralGovernment.

216 217
BIODIVERSITY CONSERVATION IN BOENG CHHMAR, TONLE SAP BIOSPHERE RESERVE’S CORE AREA, PEAM BANG COMMUNE, STOUNG DISTRICT, KAMPONG THOM PROVINCE 1. Background 1. BoengChhmarLakeandtheassociatedcreeksystemarepartof theTonleSapfloodplainintheMekongRiverBasin.TheBoengChhmarareais
locatednearthemiddleof TonleSaponthenorthsideof thelake.Thesouthernandwesternboundariesof BoengChhmarareaoverlapwithTonleSaplakeshoreandthenorthernandtheeasternboundariesareinthefloodplainforest.AdministrativelyitlieswithinPeamBangcommune,Stoungdistrict,KampongThomprovince.Therearesixfloatingvillages,PovVeung,StuengChrov,Pechakrei,DoungSdaeng,PeamBangandBaLatvillage,intheneighborhoodof BoengChhmararea.
Case Study 2
CAMBODIA NATIONAL ENVIRONMENTAL PERFORMANCE
ASSESSMENT (EPA) REPORT
Figure 1: Map of Boeng Chhmar Lake

216 217
2. BoengChhmarLakeandtheassociatedcreeksystemweredesignatedasRamsarSitein1996gainingformalrecognitionbytheConventioninlate1999.Theareaisalsodesignatedas‘CoreAreaof theTonleSapBiosphereReserve’alongwithothertwositeswithintheTonleSapfloodplain.Itsdesignationowesprimarilytoitshighbiologicaldiversityandconservationvalue;andtheroleof forestryinsubsistencelivelihood.AnnexIpresentsthefaunaspeciesintheBoengChhmarLakeareaof TonleSap.3. TonleSapLakeandthesurroundingareas,especiallyBoengChhmar,arecompletelyinundatedduringthewetseason.BoengChhmarCoreAreaholdsagreatdiversityof floodedvegetationsuchasinundatedforest,inundatedforestmosaicandinundatedwoodandshrub.TheareainBoengChhmarisanimportanthabitatformolluskspeciesandhastremendousscenicvalue.Theareaservesasanimportantfeedinggroundformigratorybirds.2. State
Indicator: Threatened Plant and Animal Species in Boeng Chhmar
4. BoengChhmarareaisrichinbiodiversity.Theseasonalhydrologicalfluctuation,associatedhabitatformationandresultingfaunalspecies
variationandnumbershaveleadtosuchdiversebiodiversity.FromthePreliminaryFloristicChecklistfortheFloodedForestSystemof theTonleSapLake,190vascularplantspeciesof 69familieshavebeenidentified(McDonaldetal.1997).Generallythevegetationcommunitiesintheareacanbedistinguishedbetweenthosethatgrowalongthefringeof waterways,ontheleveesof creeksandinthebackswamp..5. MammalsandothervertebratesarelargelyunknowninBoengChhmararea.However,recentsurveysinBoengChhmarandassociatedareasobservedsmallpopulationof Long-tailedMacaque(Maccafascicularis)andCappedLangur,Fishingcat(Felisviverrina),andOtter(Lutrasumatrana).Civetsarealsoamongcommonspeciesreportedinthearea(McDonaldetal.1997;Doroshenkoetal.1998).Elephantswerereportedtomigratetothefloodedforestduringthedryseason;howevertheyhaverecentlydisappeared(McDonaldetal.1997).6. BoengChhmarisoneof theimportantfeedingsitesforlargewaterbirdsinCambodia,particularlyduringthepost-breedingperiod,andregularlysupportssignificantnumbersof Sport-billedPelican(Pelecanusphilippensis),IndianCormorant(Phalacrocoraxfuscicollis),PaintedStork(Mycterialeucocephala)andGreaterAdjutant(Leptoptilosdubius)(DFW/DNCP/BLII/WCSCP.2003).However,20of atotalof 69
Figure 2: Species in Boeng Chhmar and Tonle Sap Lake
0
2040
6080
100120
140
160180
200220
240
Mammals Birds Reptiles Fish Plants
Nu
mb
ers
of
Sp
ecie
s
Boeng Chhmar Tonle Sap Lake Threatened Species

218 219
existingspeciesinthisareaareconsideredtobethreatenedspecies.NostudyonfishhasbeenconductedspecificallywithintheBCArea.However,regardlessof largenumberof fishspeciesbeingreportedintheLowerMekongBasin,Rainboth(1996)hasrecordedapproximately500fishspeciesfromtheMekongandTonleSap.FAO(1994)reported215fishspeciesintheTonleSapLakeof which19speciesareof principalcommercialvalueandanother36specieshavesomecommercialsignificance.Moreover,11speciesareconsideredextinctwithanother17speciesregardedasnearextinctinthewatersintheMekongsystem(MoE&MRC1999).7. Some23speciesof snakeswereidentifiedinBoengChhmararea(Doroshenkoetal.1998).Turtleswereonceabundantinthefloodplainof TonleSap,buthavenowbecomerare.Some7specieswereidentifiedbyNedeco&Midas1998and4speciesrecordedasthreatenedbytheIUCNRedList.Nevertheless,someturtlesaslargeas15kgwerereportedlycaughtonceamonthinanareaadjacenttothenorthwestedgeof BCArea(McDonaldetal.1997).Nostudyonamphibianshasbeenreported.
Suggested Rating: Relatively good with undetermined trend Justification: State of biodiversity is relatively good in Boeng Chhmar and Tonle Sap Lake area by GMS standards. However, no trend has been established. The data collected for this case study can serve as a benchmark for future assessments of changes in threatened species.
3. Pressure
Indicator: Population growth 1998 - 2003
8. Populationgrowthinruralareasisnormallyassociatedwithincreasedhuntingandcollectionof wildlife,andoften,withhabitatdestruction.ThisappearstohavebeenthecasealsoinBoengChhmar.Figure3showsthatthepopulationincreasedinthe6villagesduring1998to2003from2,290to3,154;representinganincreaseof 37%inonlyfiveyears.
Table 1: Species in Boeng Chhmar and Tonle Sap Lake
Classes Number of Species (Boeng Chhmar)
Number of Species (Tonle Sap Lake)
Number of Threat-ened & Near
Threatened SpeciesMammals**** 4 NA 0
Birds* 69 NA 20
Reptiles** 23 30 4+
Fish*** NA 215 17
Plants**** NA 190 NASources: * Mundkur et al. 1995; Edwards 1996; Parr et al. 1996; and Goes et al. 1998** Doroshenko, et al. 1998; Nedeco & Midas 1998*** MoE & MRC 1999; Nedeco & Midas 1998; Rainboth 1996; and Chew Nan Phy, pers. comm. 1998**** McDonald et al. 1997; Doroshenko et al. 1998#NAME?

218 219
Figure 3: Population increase from 1998-2003
0
100
200
300
400
500
600
700
800
900
1000
Per
son
s
Pov Veuy Pechakrei Peam Bang Ba Lat Doun Sdaeng Stueng Chrov
Population 1998 Population 2003
9. Thedependenceonlocalnaturalresourcesisstrong.Fisherieshavetraditionallybeenthemostimportantformof livelihoodintheareawith72%of adultsengagedinfishingincludingcageculturein1996(Table2).Othersourcesof livelihoodincludedbirdcollection,wildlifecollection,woodcollection,smallbusinessesandwagelabor.
Table 2: Sources of income in Boeng Chmar, 1996
Alternative income
TotalFrequency Percentage
Raisingfishincage
42 72.4
Birdcollection 2 3.4
Wildlifecollection 3 5.1
Smallbusiness 25 43.1
Woodcollection 4 6.9
Wagelabor 10 17.2
Totalrespondents 58Source: Loeung Kesaro, 1996.
Suggested Rating: Low but rising Justification: Population pressure is growing in this region of Tonle Sap area; and its impact on local resources and underlying biodiversity is being felt. The livelihood patterns identified here should be studied further to establish a relationship between increased fisheries and wildlife collection and habitat loss.
4. Response 10.BoengChhmarisanimportantareaintheTonleSapLake.ItisprotectedbytheCambodiansystemof protectedareas,wetlandsof internationalimportance(Ramsarsites)andbiospherereserves.ItismanagedbytheMinistryof Environment(MoE)andtheMinistryof Agriculture,ForestryandFisheries(MAFF),Departmentof Fisheries.
Indicator: Protected Species in Boeng Chhmar
11. InNovember1993,RoyalDegreedesignating23protectedareas,including7nationalparks,10wildlifesanctuaries,3protectedlandscapesand3multipleuseareaswereestablishedunderaRoyalDecree,BoengChhmaramongthem.TheBoengChmarportionof TonleSapMultiple-UseAreaisoneof threeareasdesignatedasaRamsarSiteatthetimeof Cambodia’saccessiontotheInternationalConventiononRamsarSiteon23October1999.12. InApril2001,RGCnominatedtheTonleSapMultiple-UseAreaincludingBoengChhmarasaBiosphereReserveanddesignatedtheareaas‘transitionzone’.Transitionzoneisanintegratedeconomiczone,whichismanagedforsustainableagriculture,humansettlementandlanduse,withprotectionforthefloodedforest,waterqualityandsoilconditionsof theareaaroundtheTonleSapLake.

220 221
13.Table3,abovegivesthenumberof protectedspeciesinBoengChhmarareafollowingtheissuanceof ‘PrakasonWildlifeProtectionbySpecies’,releasedin1994.Thereare1of 4mammals,23of 69birdsand3of 23speciesunderprotection.
Suggested Rating: Significant Justification: The Boeng Chhmar area of Tonle Sap area has been accorded appropriate protection status by the Government of Cambodia; including issuance of necessary government decree and declaring it a Ramsar site. However; the impact of these actions on improvement to the biodiversity status in the area remains to be seen; and more information collected over a number of years is needed to assess it.
5. Conclusions 14.WetlandbiodiversityinBoengChhmarof TonleSapareafacesthreatfromgrowingpopulationandassociatedhumanactivities.RGC’sresponsetothesethreatshasbeeninlinewithnationalandinternationalconventions;howevertheactualimpactonthestatusof biodiversityintheareaisnotknown,duetotheabsenceof relevantdata.15.Morestudiesneedtobeconductedtobetterassessthestatusof protectedspeciesandhabitatqualityfollowingtheprovisionsof ‘PrakasonWildlifeProtection’andmonitoringprovisionof Ramsarsites.
Table 3: Protected Species in Boeng Chhmar and Tonle Sap Lake
Classes Number of Species (Boeng Chhmar)
Number of Species (Tonle Sap Lake)
Number of Pro-tected Species +
Mammals**** 4 NA 1
Birds* 69 NA 23
Reptiles** 23 30 3
Fish*** NA 215 NA
Plants**** NA 190 NASources: * Mundkur et la. 1995; Edwards 1996; Parr et al. 1996; and Goes et al. 1998** Doroshenko, et al. 1998; Nedeco & Midas 1998*** MoE & MRC 1999; Nedeco & Midas 1998; Rainboth 1996; and Chew Nan Phy, pers. comm. 1998**** McDonald et al. 1997; Doroshenko et al. 1998+ Prakas on Protected Species 1994

220 221
Annex: Animal Species in Boeng Tonle Chhmar Area
No. English Name Scientific Name Threatened ProtectedMammals
1 Long-tailedMacaque Maccafascicularis
2 FishingCat Felisviverrina yes
3 Otter Lutrasumatrana
4 Civet
Birds1 EasterMarshHarrier Circusspilonotus yes
2 BrahminyKite Haliasturindus RT yes
3 Grey-headedFish-eagle Ichthyophagaichthyaetus GNT
4 Osprey Pandionhaliaetus
5 PiedKingfisher Cerylerudis RT
6 CommonKingfisher Alcedoatthis
7 Stock-billedKingfisher Pelargopsiscapensis
8 WhiteThroatedKing-fisher
Haleyonsmyrnensis yes
9 White-breastedKing-fisher
10 Spot-billedDuck Anaspoecilorhyncha
11 White-wingedDuck Cainrinascutulata GT
12 White-wingedWoodDuck
13 LesserWhistlingDuck Dandroeygnajavanica yes
14 CottonPygmy-Goose Nettapuscoromandelinaus
15 LesserTreeDuck
16 AsianPalm-swift Cypsiurusbalasiensis
17 GreyHeron Ardeacinerea RT yes
18 PurpleHeron Ardeapurpurea RT
19 LittleGreenHeron
20 ChinesePondHeron Ardeolabacchus yes
21 JavanPondHeron Ardeolaspeciosa
22 CattleEgret Bubulcusibis yes
23 BlackBittern Dupetorflavicollis
24 GreatEgret Egrettaalba yes
25 ImmediateEgret Egrettaintermedia
26 LittleEgret Egrettagarzetta yes
27 UnidentifiedWhiteEgret
28 CinnamonBittern Ixobrychuscinnamomeus
29 YellowBittern Ixobrychussinensis yes
30 Black-crownedNight-Heron
Nycticoraxnycticorax
31 PaintedStork Mycterialeucocephala GNT
32 AsianOpenbill Anastomusoscitans GNT yes
33 Black-neckedStork Ephippiorhynchusasiaticus RT
34 GreaterAdjutant Leptoptilusdubius GT yes

222 223
No. English Name Scientific Name Threatened Protected35 LesserAdjutant Leptoptilusjavanicus GT yes
36 CommonIora Aegithinatiphia
37 SpottedDove Streptopeliachinensis
38 Large-billedCrow Corvusmacrorhyncos
39 Green-billedMalkoha Phaenicophaeustristis
40 LesserCoucal Centropusbengalensis
41 GreaterCoucal Centropussinenais
42 MaskedFinfoot Heliopaispersonata GT
43 Pheasant-tailedJacana Hydrophasianuschirurgus
44 Bronze-wingedJacana Metopidiusindicus
45 BarnSwallow Hirundorustica
46 Brown-headedGull Larusbrunnicephalus
47 CommonTern Sternahirundo
48 WhiskeredTern Chlidoniashybridus
49 Olive-backedSunbird Nectariniajungularis
50 EurasianTree-Sparrow Passermontanus
51 Spot-billedPelican Pelecanusphilippensis GT yes
52 OrientalDarter Anhingamelanogaster GNT yes
53 GreatCormorant Phalacrocoraxcarba RT yes
54 LittleCormorant Phalacrocoraxniger RT yes
55 IndianShag Phalacrocoraxfuscicollis RT yes
56 LacedWoodpecker Picusvittatus yes
57 Blue-wingedPitta Pittamoluccensis
58 BayaWeaver Ploceusphilippinus RT
59 LittleGrebe Tachybaptusruficollis
60 Streak-earedBulbul Pycnonotusblandfordi
61 White-breastedWaterhen Amaurornisphoenicurus yes
62 CommonMoorhen Gallinulachloropus
63 PurpleSwamphen Porphyrioporphyrio
64 Black-wingedStilt Himantopushamantopus
65 White-ventedMyna Acridotheresjavanicus
66 Dark-neckedTailorbird Orthotomusatrogularis
67 Black-headedIbis Threskiornismelanocephalus GNT yes
68 GlossyIbis Plegadisfaicinellus RT yes
69 OrientalMagpie-Robin Copsychussaulasis yes
Reptiles1 BloodPhyton Pythoncurtus yes
2 RockPhyton Pythonmelurusbivittatus yes
3 ReticulatedPhyton Pythonreticulatus yes
4 Red-tailedPipeSnake Cylindrophisrufus
5 IridescentEarthSnake Xenopeltisunicolor
6 Elephant’sTrunkSnake Acrochordusjavanicus
7 FileSnake Chersydrusgramulatus
8 PaintedBronzeback Dendrelaphispictuss
9 ElegantBronzeback Dendrelaphisformosus

222 223
No. English Name Scientific Name Threatened Protected10 ChequeredKeelback Xenochrophispiscator
11 ParadiseTreeSnake Chrysopeleaparadisi
12 OrientalWhipSnake Ahaetullaprasina
13 Long-nosedWhipSnake Ahaetullanasuta
14 Puff-facedWaterSnake Homalopsisbuccata
15 Doc-facedWaterSnake Cerberusrhynchops
16 Bocourt’sWaterSnake Enhydrisbocourti
17 PlumbeousWaterSnake Enhydrisplumbea
18 RainbowWaterSnake Enhydrisenhydris
19 TentacledSnake Herpetontebaculatum
20 Dog-toothedCatSnake Boigacynodon
21 MonocledCobra Najanajakaouthia
22 KingCobraorHamadryad
Ophiophagushannah
23 Popes’PitViper TrimeresuruspopciorumSources:- Mundkur et la. 1995; Edwards 1996; Parr et al. 1996; and Goes et al. 1998;- Doroshenko, et al. 1998; Nedeco & Midas 1998;- MoE & MRC 1999; Nedeco & Midas 1998; Rainboth 1996; and Chew Nan Phy, pers. comm. 1998;- McDonald et al. 1997; Doroshenko et al. 1998; and- Prakas on Protected Species 1994Note:• GT – Globally Threatened;• GNT – Globally Near Threatened• RT – Regionally Threatened.
References DFW/DNCP/BLII/WCSCP.2003.Directoryof ImportantBirdAreainCambodia,KeySitesforConservation.Doroshenko,N.,LongKengandMeasRithy1998.ReptilesandsmallwildlifeatTonleSaplake.SPEC/TCUMoE.PhnomPenh,CambodiaEdwards,P.J.1996.CambodiaWetland:Ornithologicalsurvey.UnpublishedreporttoWetlandsInternationalAsiaPacific,KualaLumpur.XenusEcology,Newmarket,England.Goes,F.,HongChamnan,SuonMean,LuonKengandMeasRithy1998.WaterbirdcountingandsurveyatPrekToalandBoengChhmar/MoatKhla,CoreprotectedareaTonleSapBiospherereserve,Kingdomof Cambodia.SPEC/TCU/MoE.PhnomPenh,Cambodia.Kesaro,L.1996.Casestudyof BoengChhma,TonleSaplake,Cambodia.AIT,Bangkok,Thailand.McDonald,A.,PechBunnat,PhaukVirakandLeenBunton1997.PlantCommunitiesof TonleSapFloodplainreporttoUNESCO,IUCNandWetlandInternational,PhnomPenh,Cambodia.MoEandMRC.1999.InventoryandManagement
of CambodiaWetlandsProject.Ministryof environmentandMekongRiverCommission.PhnomPenh,Cambodia.MoE/DoF/WI.2002.DraftManagementPlanfortheBoeungChhmarRamsarSiteinCambodia.PhnomPenh,Cambodia.Mundkur,T.,Carr,P.SunHeanandChhimSomean1995.SurveyforLargeWaterbirdsinCambodia,MarchApril1994.IUCNSpeciesSurvivalCommission.IUCN.Gland,SwitzerlandandCambridgeUK.NedecoandMidas.1998.PotentialforEco-TourismintheTonleSapArea.DraftReportMarch1998.CambodianNationalMekongCommittee.Arnhem,theNetherlands.Parr,J.W.K.,Eames,J.C.,SunHean,HongChamnan,SomHan,ViLaPichandSengKimHout1996.BiologicalandSocio-economicAspectsof WaterbirdsExploitationandNaturalResourceUtilizationatPrekToal,TonleSapLake,Cambodia.IUCNSpeciesSurvivalCommission.IUCN.Gland,SwitzerlandandCambridgeUK.Rainboth,W.1996.Fishesof theCambodianMekong.FAO,Rome.