cambridge industrial trust - esr-reitesr-reit.listedcompany.com/misc/201210181547594_en.pdf · 5.1%...
TRANSCRIPT
Cambridge Industrial TrustThird Quarter 2008 Results
30 October 2008
2
References in this presentation
• Unless otherwise stated, all capitalised terms used shall have the same meaning as in the Offer Information Statement of CIT (“OIS”) dated 1 Oct 2007. This presentation should be read in conjunction with CIT’s “Unaudited Financial Statement Announcement for the Quarter ended 30 Sep 2008”made on SGXNET.
• Actual refers to the results for the quarter ended 30 Sep 2008, unlessotherwise specified.
• Forecast means pro-rated forecast figures derived from the Projection Year 2008 (from 1 Jan 2008 to 31 Dec 2008) based on the 40 investmentproperties as disclosed in the OIS dated 1 Oct 2007, for the quarter ended 30 Sep 2008, unless otherwise specified.
3
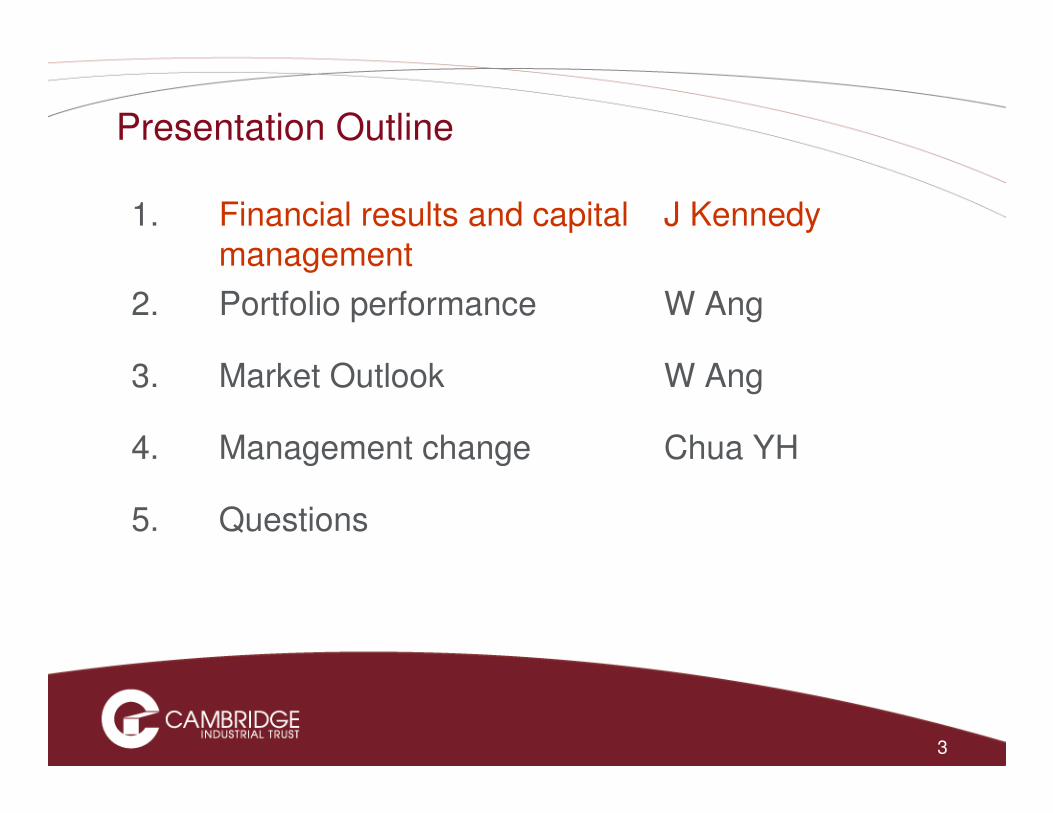
Presentation Outline
Questions5.
Chua YHManagement change4.
W AngMarket Outlook3.
W AngPortfolio performance2.
J KennedyFinancial results and capital management
1.
11.010.2
15.0
17.4
11.911.4
16.2
18.3
0
2
4
6
8
10
12
14
16
18
20
Gross Revenue Net Property
Income
Net Income Distributable
Income
S$m
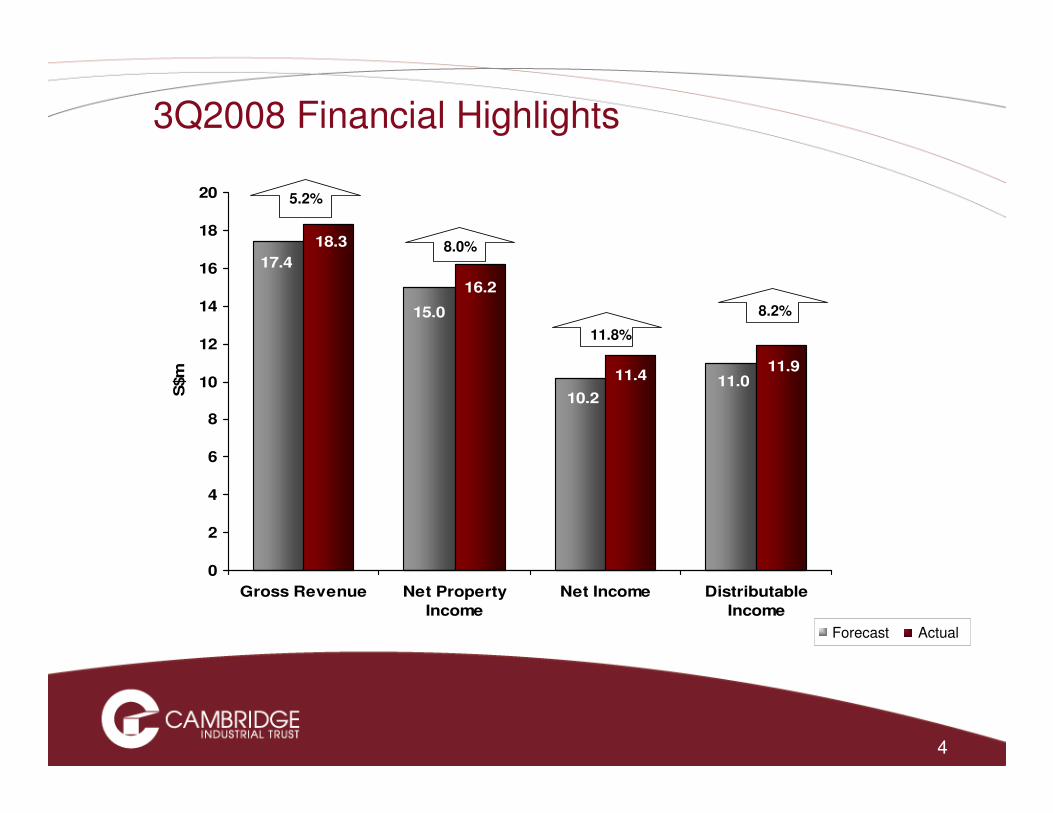
3Q2008 Financial Highlights
Forecast Actual
8.0%
11.8%
8.2%
5.2%
4
5
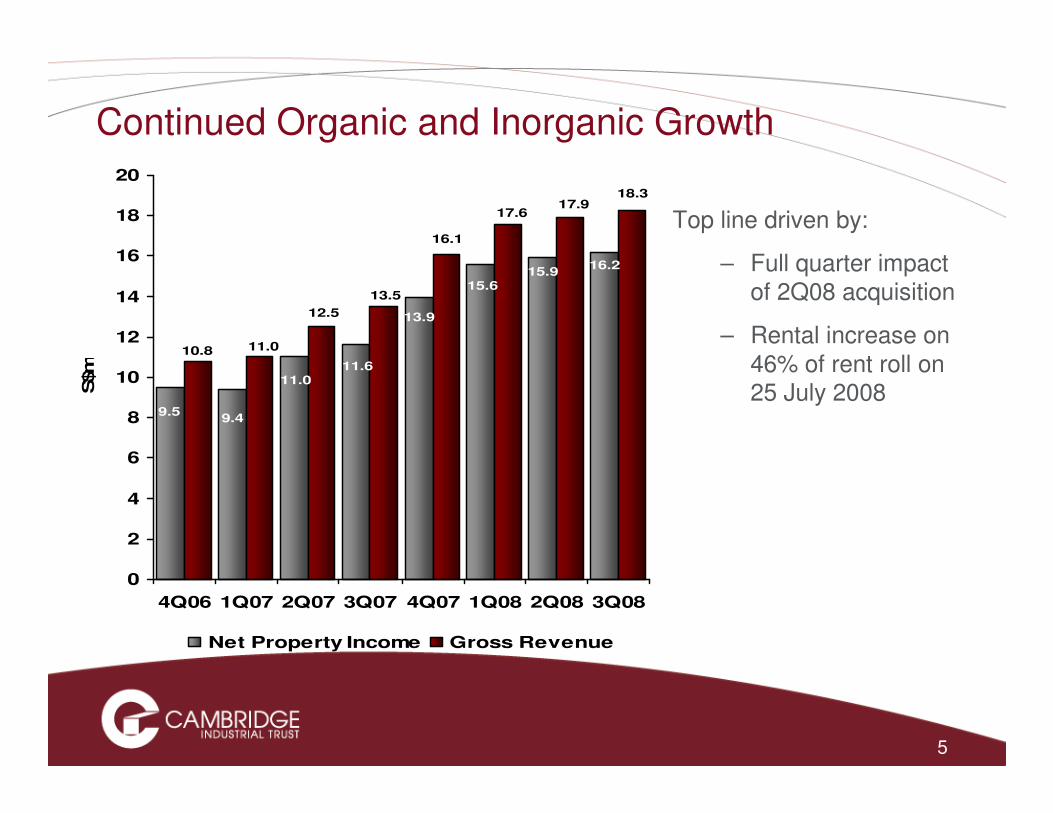
Continued Organic and Inorganic Growth
Top line driven by:
– Full quarter impact of 2Q08 acquisition
– Rental increase on 46% of rent roll on 25 July 2008
16.215.9
15.6
13.9
11.611.0
9.49.5
18.317.9
17.6
16.1
13.5
12.5
11.010.8
0
2
4
6
8
10
12
14
16
18
20
4Q06 1Q07 2Q07 3Q07 4Q07 1Q08 2Q08 3Q08
S$m
Net Property Income Gross Revenue
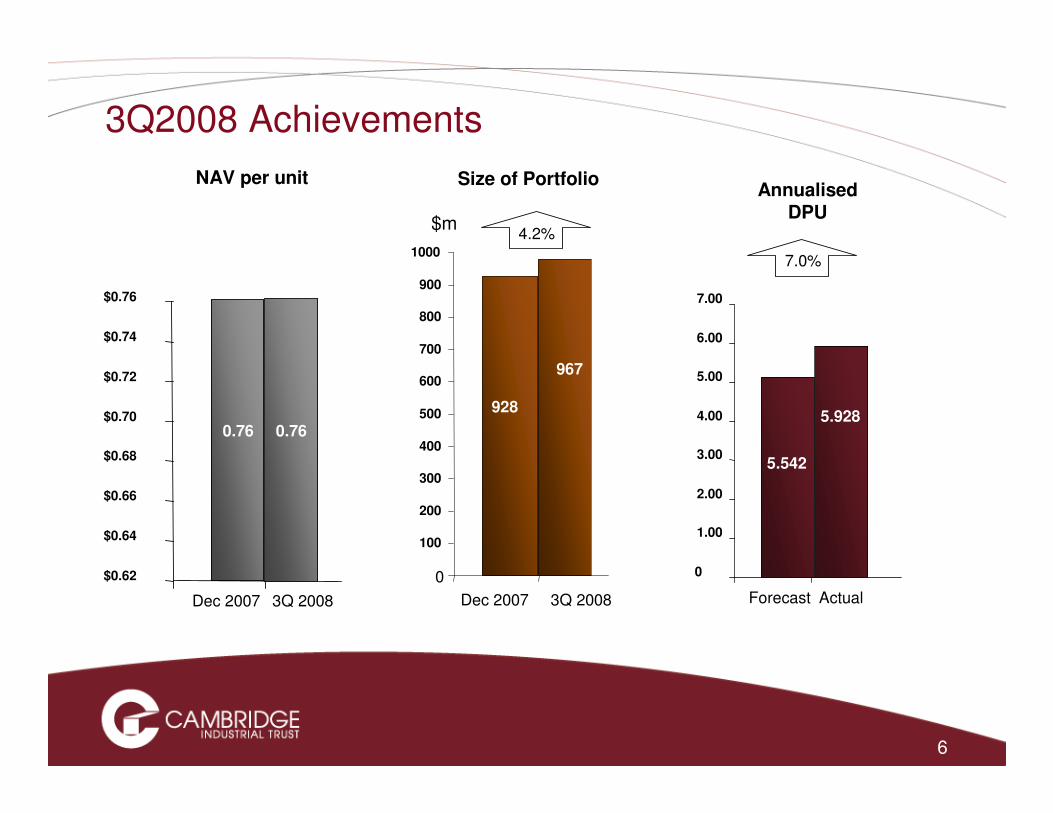
3Q2008 Achievements
$0.62
$0.64
$0.66
$0.68
$0.70
$0.72
$0.74
$0.76
Dec 2007 3Q 2008
NAV per unit
0.76
Size of Portfolio
0
100
200
300
400
500
600
700
800
900
1000
Dec 2007 3Q 2008
$m
967
928
4.2%
0
1.00
2.00
3.00
4.00
5.00
6.00
7.00
Forecast Actual
Annualised DPU
5.542
5.928
7.0%
0.76
6
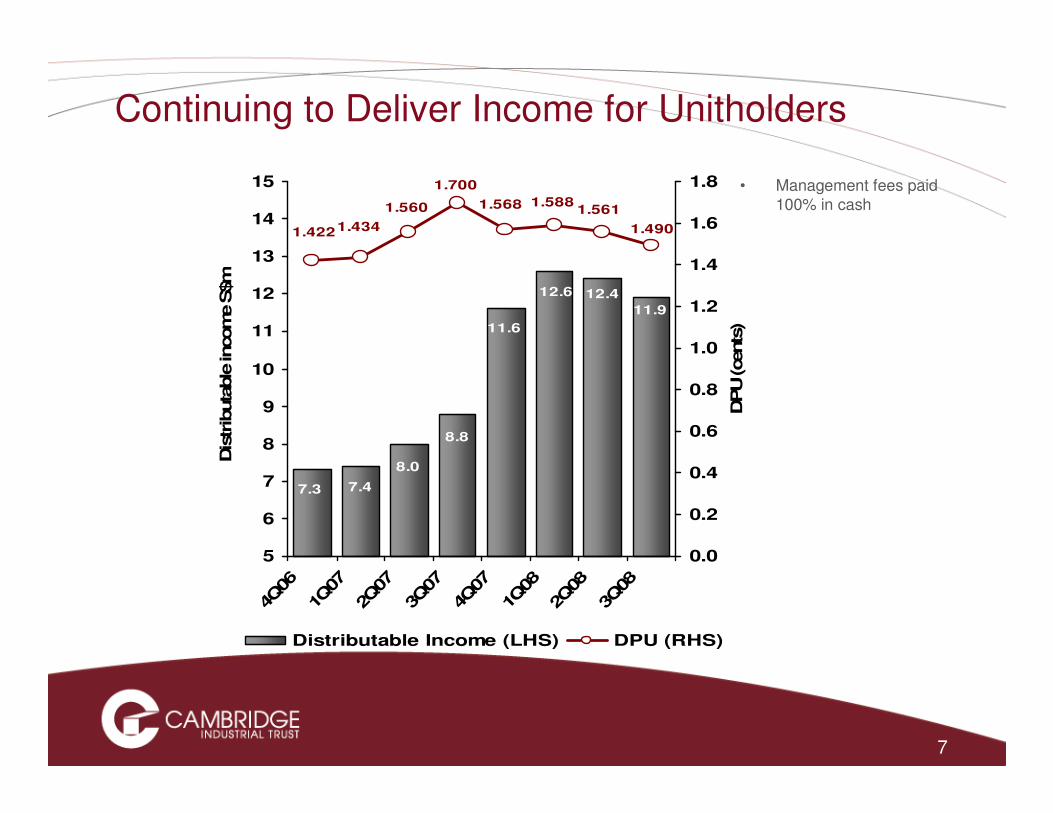
Continuing to Deliver Income for Unitholders
11.9
12.412.6
11.6
7.47.3
8.0
8.8
1.490
1.5611.5881.5681.560
1.4341.422
1.700
5
6
7
8
9
10
11
12
13
14
15
4Q06
1Q07
2Q07
3Q07
4Q07
1Q08
2Q08
3Q08
Dis
trib
uta
ble
incom
e S
$m
0.0
0.2
0.4
0.6
0.8
1.0
1.2
1.4
1.6
1.8
DPU (cents
)
Distributable Income (LHS) DPU (RHS)
• Management fees paid 100% in cash
7

2Q2008
Actual Actual Forecast (1) Change %
Gross Revenue S$17.9 m S$18.3 m S$17.4 m 5.2%
Net Property Income (NPI) S$15.9 m S$16.2 m S$15.0 m 8.0%
Net Income S$11.4 m S$11.4 m S$10.2 m 11.8%
Distributable Income S$12.4 m S$11.9 m S$11.0 m 8.2%
Available Distribution Per Unit (DPU) 1.561 cents 1.490 cents
Actual Actual Forecast Change %
Annualised DPU 6.278 cents 5.928 cents(2) 5.542 cents(3) 7.0%
Annualised Distribution Yield:
EFR price (S$0.70) 8.97% 8.47% 7.92%
Current price (S$0.435) (4) 14.43% 13.63% 12.74%
1 July to 30 September 2008
_____________
(1) Forecast means prorated forecast figures derived from the Projection Year 2008 (from 1 Jan to 31 Dec 2008) based on the portfolio of 40 properties as disclosed in the Offering Circular dated 1 Oct 2007, for the quarter ended 30 Sep 2008
(2) Annualised DPU computed by annualising 1.490 cents based on 92 days from 1 Jul 2008 to 30 Sep 2008
Financial Results 3Q2008
(3) Based on the weighted average number of applicable units of 796,916,400 as disclosed in the Offering Circular dated 1 Oct 2007.
(4) Computed based on closing price of S$0.435 as at 30 Sep 2008
8
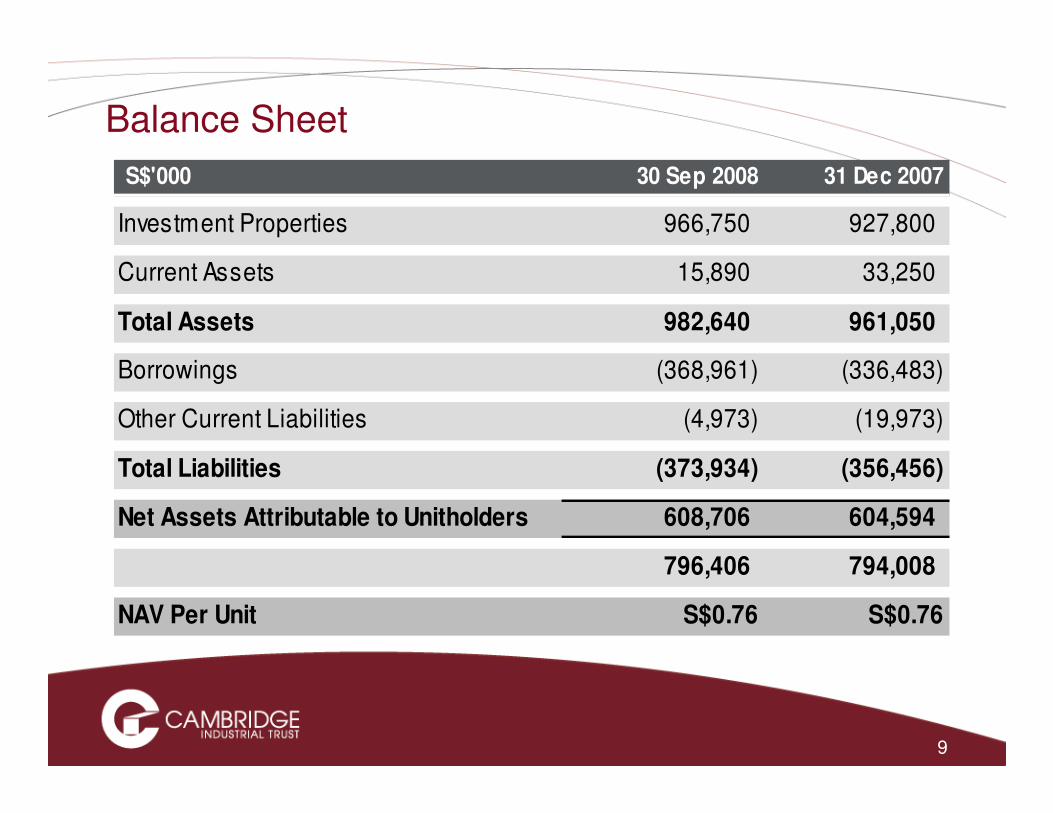
Balance Sheet
S$'000 30 Sep 2008 31 Dec 2007
Investment Properties 966,750 927,800
Current Assets 15,890 33,250
Total Assets 982,640 961,050
Borrowings (368,961) (336,483)
Other Current Liabilities (4,973) (19,973)
Total Liabilities (373,934) (356,456)
Net Assets Attributable to Unitholders 608,706 604,594
796,406 794,008
NAV Per Unit S$0.76 S$0.76
9
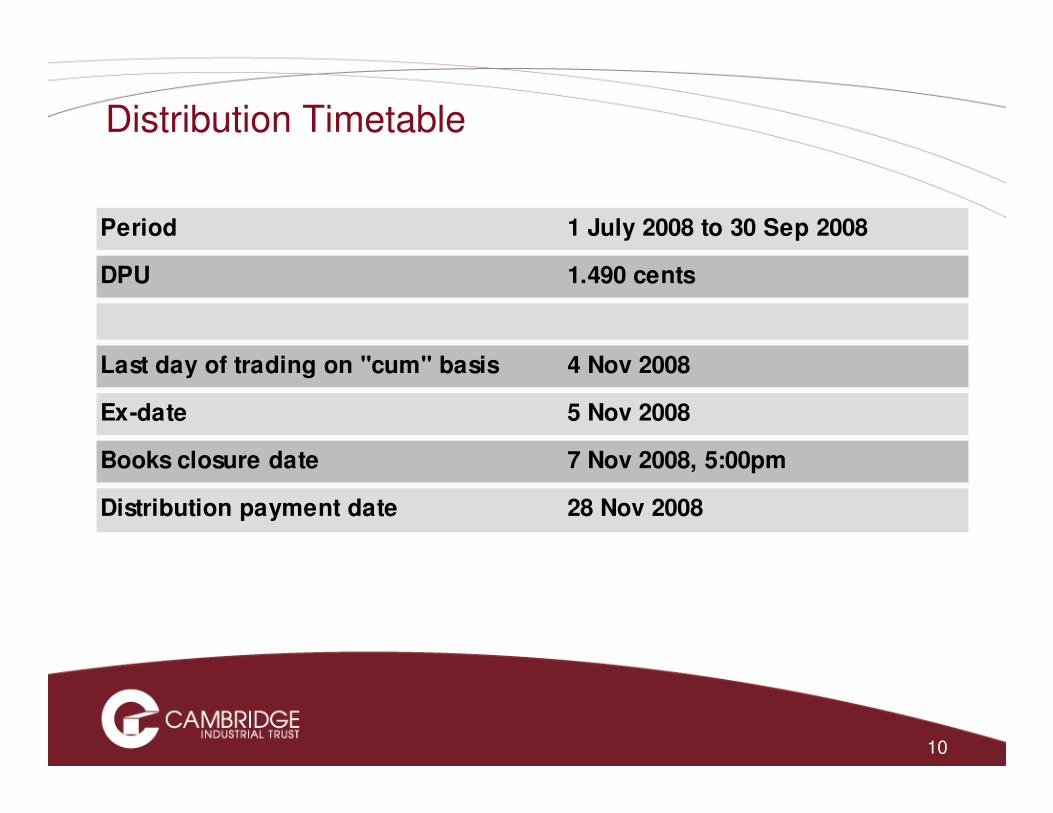
Distribution Timetable
Period 1 July 2008 to 30 Sep 2008
DPU 1.490 cents
Last day of trading on "cum" basis 4 Nov 2008
Ex-date 5 Nov 2008
Books closure date 7 Nov 2008, 5:00pm
Distribution payment date 28 Nov 2008
10

11
Capital Management at end September 2008
30 Sep 08
Gearing ratio 37.6%
Target gearing <40%
Weighted average effective interest rate YTD 3.2%
Interest cover 3Q2008 4.9x
VFN(1) Facility term to expiry 4 Months
RCF(2) term to expiry 14 Months
Net Asset Value Per Unit 0.76$ __________
(1) Variable Funding Note (“VFN”) Facility expires in February 2009
(2) Revolving Credit Facility (“RCF”) expires in January 2010
12
Presentation Outline
1. Financial results and J Kennedycapital management
2. Portfolio performance W Ang
3. Market outlook W Ang
4. Management changes Chua YH
Questions

1313
Strategically Located Portfolio
1510
1
14
16
17-19
20-2122-25
26-27
9
8
7 2-311-124-6
29
283031
33
3213
34
37
35
39
40
36
38
41
42
44
Existing PropertiesExisting PropertiesExisting PropertiesExisting PropertiesExisting PropertiesExisting PropertiesExisting PropertiesExisting Properties New Properties New Properties New Properties New Properties New Properties New Properties New Properties New Properties acquiredacquiredacquiredacquiredacquiredacquiredacquiredacquired Under optionUnder optionUnder optionUnder optionUnder optionUnder optionUnder optionUnder option43
45
LegendLegendLegendLegendLegendLegendLegendLegend
5.1%
2.6%
8.3%
14.7%
35.2%
34.1%
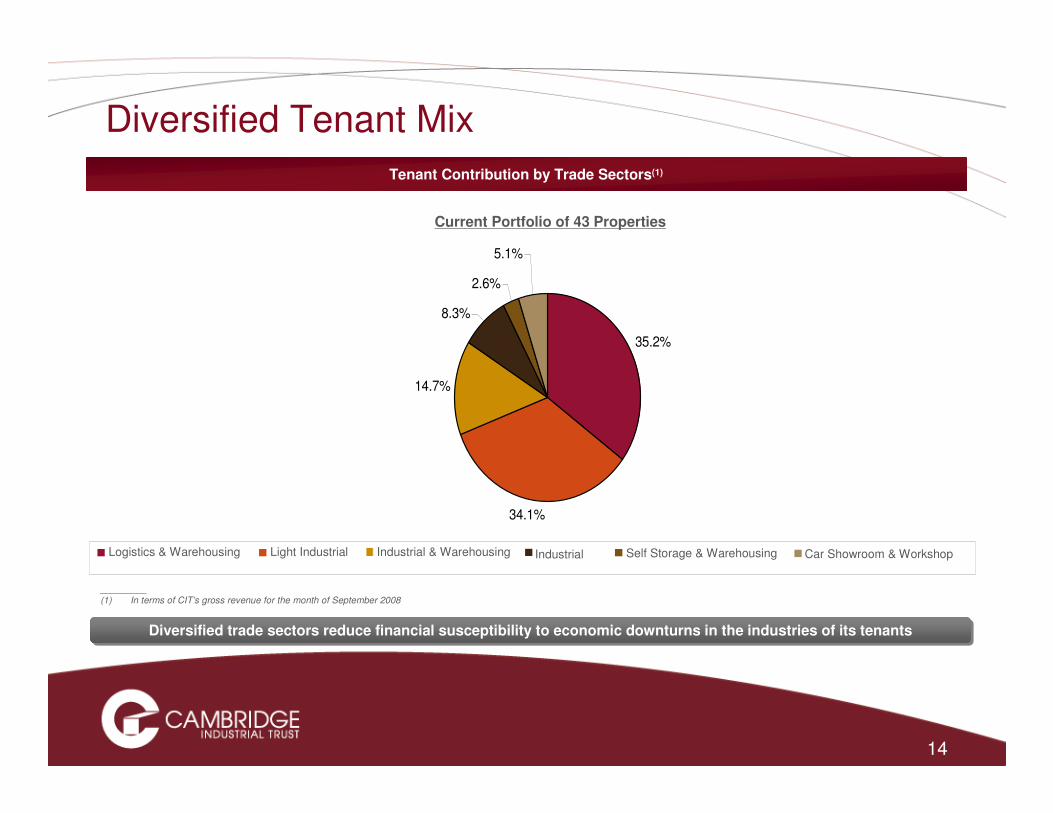
Diversified Tenant Mix
Tenant Contribution by Trade Sectors(1)
Current Portfolio of 43 Properties
Diversified trade sectors reduce financial susceptibility to economic downturns in the industries of its tenantsDiversified trade sectors reduce financial susceptibility to economic downturns in the industries of its tenants
_________(1) In terms of CIT’s gross revenue for the month of September 2008
Logistics & Warehousing Light Industrial IndustrialIndustrial & Warehousing Self Storage & Warehousing Car Showroom & Workshop
14
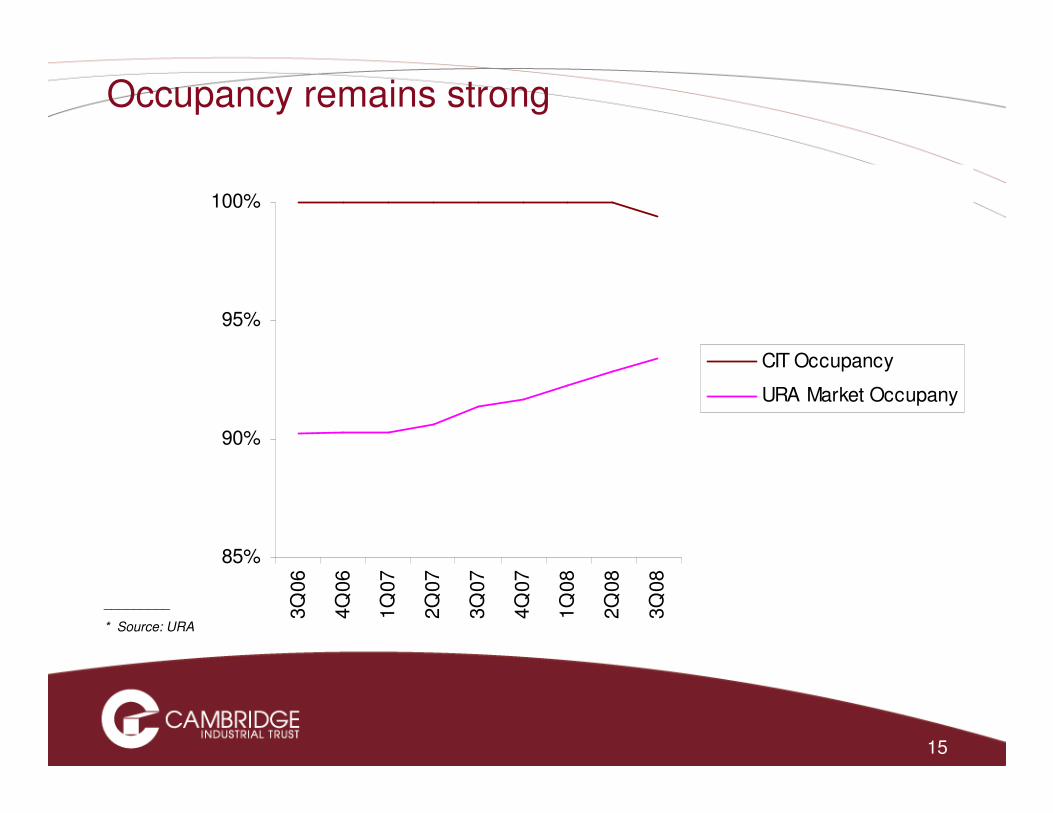
85%
90%
95%
100%
3Q
06
4Q
06
1Q
07
2Q
07
3Q
07
4Q
07
1Q
08
2Q
08
3Q
08
CIT Occupancy
URA Market Occupany
15
Occupancy remains strong
_________
* Source: URA
_________(1) Based on gross revenue for the month of September 2008.
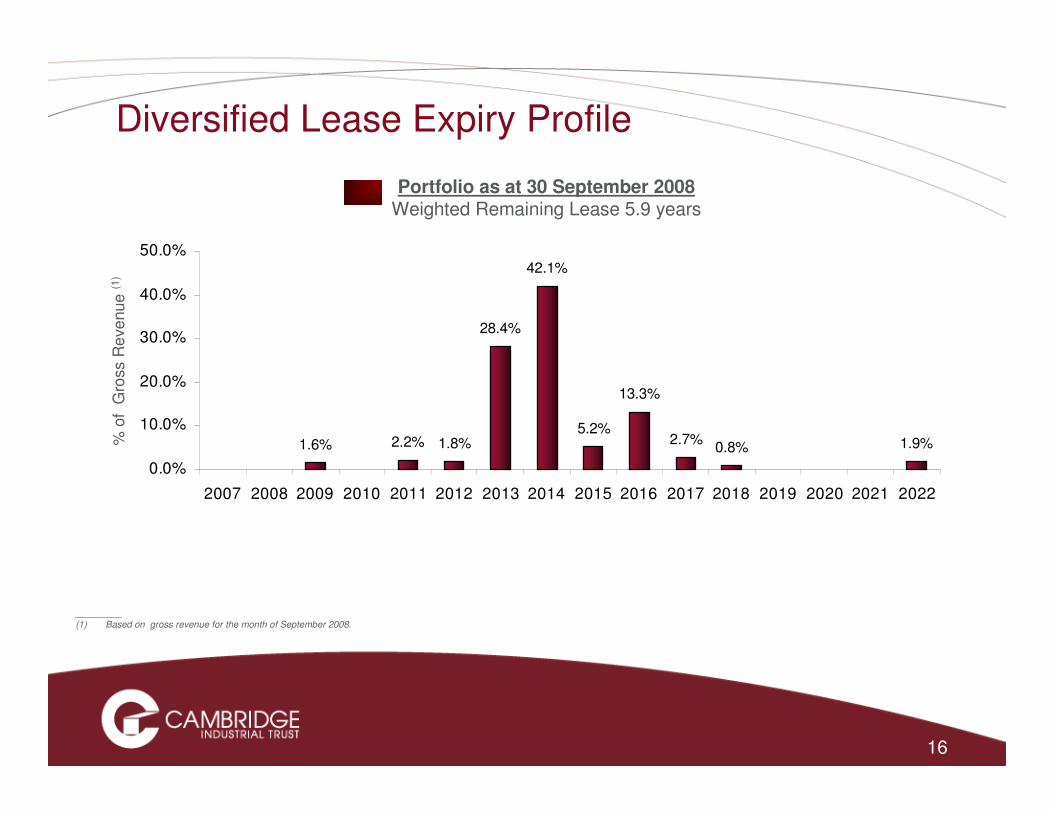
Diversified Lease Expiry Profile
1.6% 2.2% 1.8%
28.4%
42.1%
5.2%2.7%
0.8% 1.9%
13.3%
0.0%
10.0%
20.0%
30.0%
40.0%
50.0%
2007 2008 2009 2010 2011 2012 2013 2014 2015 2016 2017 2018 2019 2020 2021 2022
% o
f G
ross R
eve
nue
(1)
Portfolio as at 30 September 2008Weighted Remaining Lease 5.9 years
16
17
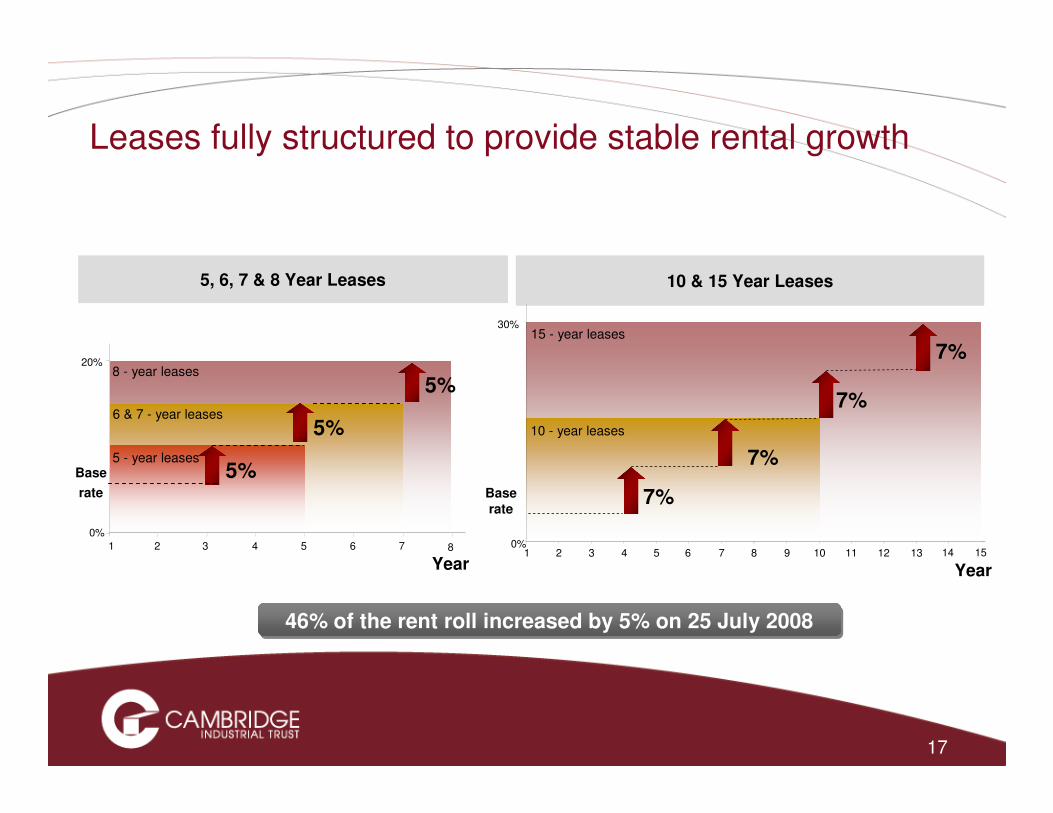
Leases fully structured to provide stable rental growth
5, 6, 7 & 8 Year Leases
Baserate
10 & 15 Year Leases
7%
7%
0%
30%
1 2 3 4 5 6 7 8 9 10 11 12 13
7%
10 - year leases
15 - year leases
7%
Base
rate
5%
0%
1 2 3 4 5 6 7
8 - year leases
6 & 7 - year leases
5 - year leases
20%
5%
5%
814 15
YearYear
46% of the rent roll increased by 5% on 25 July 200846% of the rent roll increased by 5% on 25 July 2008
18
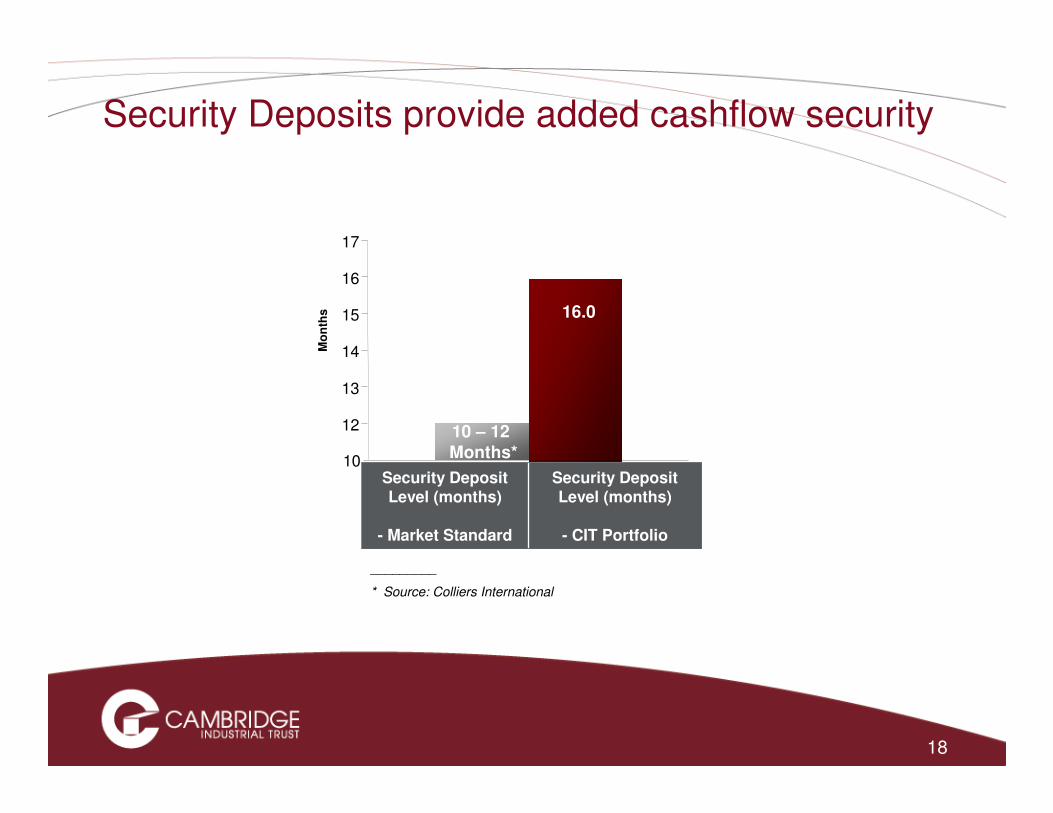
Security Deposits provide added cashflow security
Security Deposit Level (months)
- Market Standard
Security Deposit Level (months)
- CIT Portfolio
16.0
12
13
14
15
16
17
Mo
nth
s
10
10 – 12 Months*
_________
* Source: Colliers International

19
Diversified Portfolio Of Quality Tenants
_____________
(1) Jurong Districentre Pte Ltd, a 70%-owned subsidiary of CWT Limited
Top Ten Tenants
4.6%
2.6%
2.6%
5.0%
5.1%
5.5%
6.8%
6.9%
9.1%
14.3%
0% 2% 4% 6% 8% 10% 12% 14% 16%
CWT
YCH
Soon Lee
Lam Soon
Nidec Brilliant
Exklusiv
Jurong Districentre (1)
ODC Logistics
Compact Metal
StorHub
% of Gross Rent, September 2008 - 43 properties
Listed or subsidiary of listed companies
Unlisted companies

20
Presentation Outline
1. Financial results and J Kennedycapital management
2. Portfolio performance W Ang
3. Market outlook W Ang
4. Management changes Chua YH
Questions
21
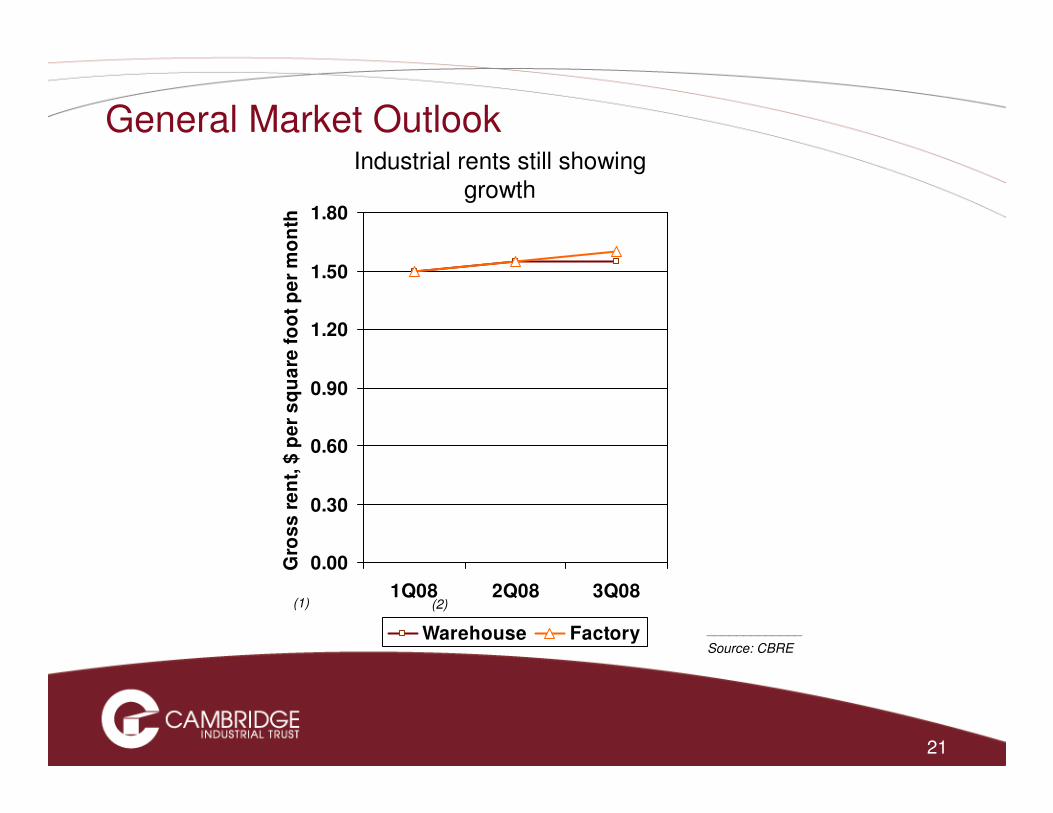
General Market Outlook
0.00
0.30
0.60
0.90
1.20
1.50
1.80
1Q08 2Q08 3Q08
Gro
ss
re
nt,
$ p
er
sq
ua
re f
oo
t p
er
mo
nth
Warehouse Factory
Industrial rents still showing growth
_____________
Source: CBRE
(1) (2)

Industrial Market Outlook
Demand for industrial space exceeds supply
0
50
100
150
200
250
300
350
400
2Q 08 3Q 08 3Q 08
'00
0 s
qu
are
me
tre
s
Increase in factory space occupied
Factory space completed
_____________
Source: URA
• Capital Values for factories up to 2.3% during 3Q (1)
• Sales of industrial properties have slowed as REITS
cease to be buyers:
• No evidence of distress sales
• Estimated supply of private industrial space of
34.5 million square feet until 2011 (2)
• Approx 11% of total stock as at 31 December 2007 (3)
_____________
Source: (1) CBRE (2) DTZ (3) Colliers
23
Presentation Outline
1. Financial results and J Kennedycapital management
2. Portfolio performance W Ang
3. Market outlook W Ang
4. Management changes Chua YH
Questions

24
Shareholders Bring Depth and Breadth to CITM
nabInvest Oxley Singapore Pte Ltd
80%1
Mitsui & Co., Ltd
20%
24
1 Stake acquired in August 2008
Oxley GroupNational Australia Bank
Limited (nabInvest)
30%70%
CITM
2525
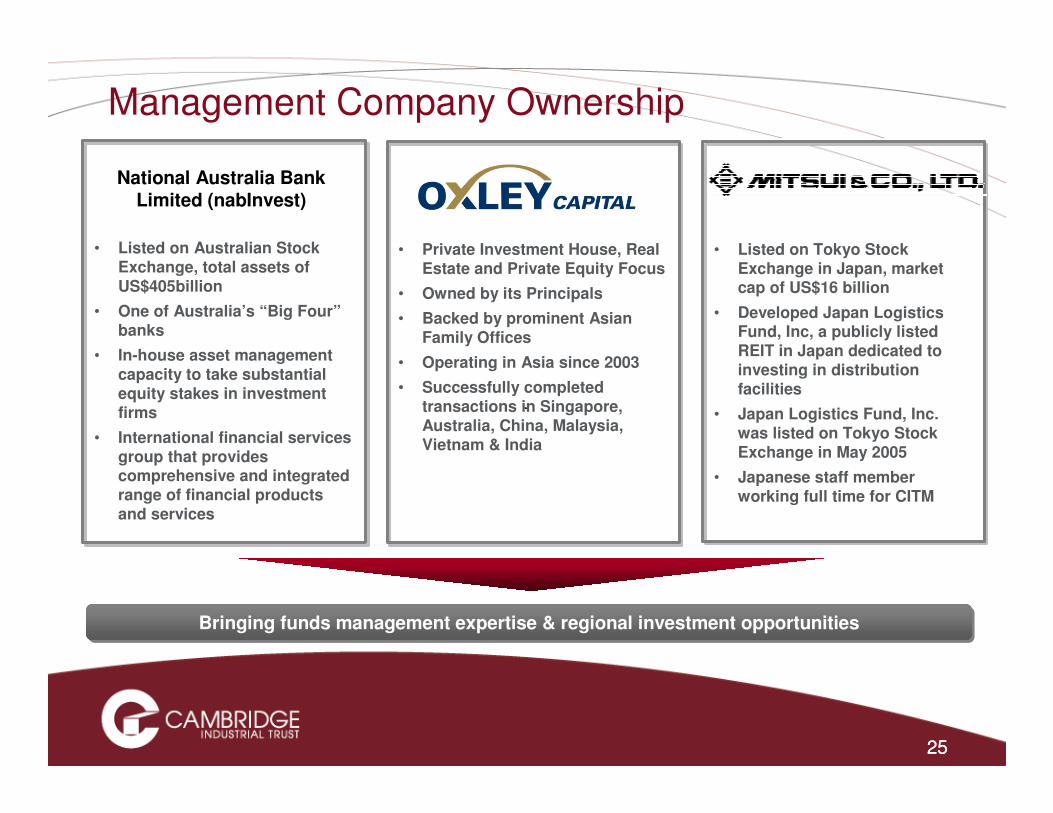
Management Company Ownership
• Private Investment House, Real Estate and Private Equity Focus
• Owned by its Principals
• Backed by prominent Asian Family Offices
• Operating in Asia since 2003
• Successfully completed transactions in Singapore, Australia, China, Malaysia, Vietnam & India
Bringing funds management expertise & regional investment opportunities Bringing funds management expertise & regional investment opportunities
• Listed on Tokyo Stock Exchange in Japan, market cap of US$16 billion
• Developed Japan Logistics Fund, Inc, a publicly listed REIT in Japan dedicated to investing in distribution facilities
• Japan Logistics Fund, Inc. was listed on Tokyo Stock Exchange in May 2005
• Japanese staff member working full time for CITM
• Listed on Australian Stock Exchange, total assets of US$405billion
• One of Australia’s “Big Four”banks
• In-house asset management capacity to take substantial equity stakes in investment firms
• International financial services group that provides comprehensive and integrated range of financial products and services
National Australia Bank Limited (nabInvest)
2626
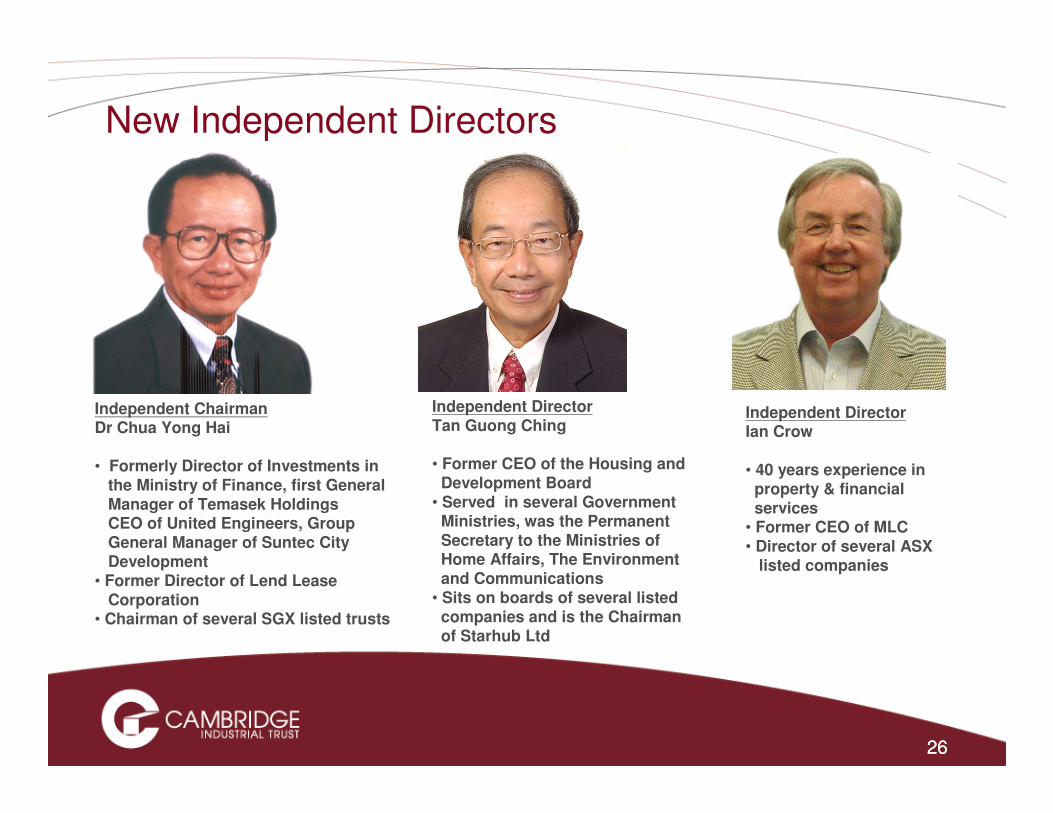
New Independent Directors
Independent Chairman Dr Chua Yong Hai
• Formerly Director of Investments in the Ministry of Finance, first General Manager of Temasek Holdings CEO of United Engineers, Group General Manager of Suntec City Development
• Former Director of Lend Lease Corporation
• Chairman of several SGX listed trusts
Independent Director Tan Guong Ching
• Former CEO of the Housing and Development Board
• Served in several Government Ministries, was the Permanent Secretary to the Ministries of Home Affairs, The Environment and Communications
• Sits on boards of several listed companies and is the Chairman of Starhub Ltd
Independent Director Ian Crow
• 40 years experience in property & financial services
• Former CEO of MLC• Director of several ASX
listed companies

2727
New Non –Executive Directors National Australian Bank Limited
(nabInvest)
Non-executive Director Michael Dwyer
• Executive Chairman of Oxley Capital
• Former CEO of AllcoREIT & Country Head of Allco Finance Group’s Real Estate Practice
Non-executive Director Ian Smith
• GM Real Estate at nabInvest
• 17 years at Lend Lease• Former CEO of one of
Lend Lease’s listed REITs
Non-executive Director John Wood
• Director of Antares CapitalFormer partner of top tier Australian law firm
• Director of 3 ASX listed resource companies
• 20 years finance and legal experience
28
The information contained in this presentation is for information purposes only and does not constitute an offer to sell or any solicitation of an offer or invitation to purchase or subscribe for units in Cambridge Industrial Trust (“CIT”, and units in CIT, “Units”) in Singapore or any other jurisdiction, nor should it or any part of it form the basis of, or be relied upon in any connection with, any contract or commitment whatsoever.
The past performance of the Units and Cambridge Industrial Trust Management Limited (the “Manager”) is not indicative of the future performance of CIT and the Manager. Predictions, projections or forecasts of the economy or economic trends of the markets which are targeted by CIT are not necessarily indicative of the future or likely performance of CIT.
The value of units in CIT (“Units”) and the income derived from them may fall as well as rise. Units are not obligations of, deposits in, or guaranteed by, the Manager or RBC Dexia Trust Services Singapore Limited (in its capacity as trustee of CIT), or any of their respective affiliates. An investment in Units is subject to investment risks, including the possible loss of theprincipal amount invested. Investors have no right to request that the Manager redeem or purchase their Units while the Units are listed. It is intended that holders of Units (“Unitholders”) may only deal in their Units through trading on Singapore Exchange Securities Trading Limited (the “SGX-ST”). Listing of the Units on the SGX-ST does not guarantee a liquid market for the Units.
This presentation may contain forward-looking statements that involve risks and uncertainties. Actual future performance, outcomes and results may differ materially from those expressed in forward-looking statements as a result of a number of risks, uncertainties and assumptions. Representative examples of these factors include (without limitation) general industry and economic conditions, interest rate trends, cost of capital and capital availability, competition from similar developments, shifts in expected levels of property rental income and occupancy, changes in operating expenses, including employee wages, benefits and training, property expenses and governmental and public policy changes and the continued availability of financing in the amounts and the terms necessary to support future business. You are cautioned not to place undue reliance on these forward-looking statements, which are based on the Manager's current view of future events.
Important Notice
29
This presentation has been prepared by the Manager. The information in this presentation has not been independently verified. No representation, warranty, express or implied, is made as to, and no reliance should be placed on, the fairness, accuracy, completeness or correctness of the information and opinions in this presentation. None of the Manager or any of its agents or advisers, or any of their respective affiliates, advisers or representatives, shall have any liability (in negligence or otherwise) for any loss howsoever arising from any use of this presentation or its contents or otherwise arising in connection with this presentation.
Neither this presentation, nor any copy or portion of it, may be sent, taken, transmitted or distributed, directly or indirectly, in or into the United States, Japan or Canada, or to any U.S. person (as such term is defined in Regulation S under the Securities Act of 1933, as amended). It is not an offer of securities for sale into the United States. The Units may not be offered or sold into the United States, Canada or Japan or to, or for the account or benefit of, U.S. persons unless they are registered or exempt from registration. The Units have not been and will not be registered under the Securities Act or the securities laws of any state of the United States. There will be no public offer of securities in the United States.
Important Notice
30
Thank You
CAMBRIDGE INDUSTRIAL TRUST MANAGEMENT LIMITED61 ROBINSON ROAD, #12-01 ROBINSON CENTRE, SINGAPORE 068893
TEL: (65) 6222 3339 FAX: (65) 6827 9339 WWW.CAMBRIDGEINDUSTRIALTRUST.COM
Anthony White SVP, Corporate Finance & DID: (65) 6827 9352 [email protected]
Investor Relations
Tay Chiew Sheng Manager, Investor Relations DID: (65) 6827 9330 [email protected]