cambridge vce accounting units 3 & 4 teacher cd-rom...
TRANSCRIPT
Cambridge VCE Accounting Units 3 & 4 Teacher CD-ROM
© Simmons, Hardy 2006 Cambridge University Press 1
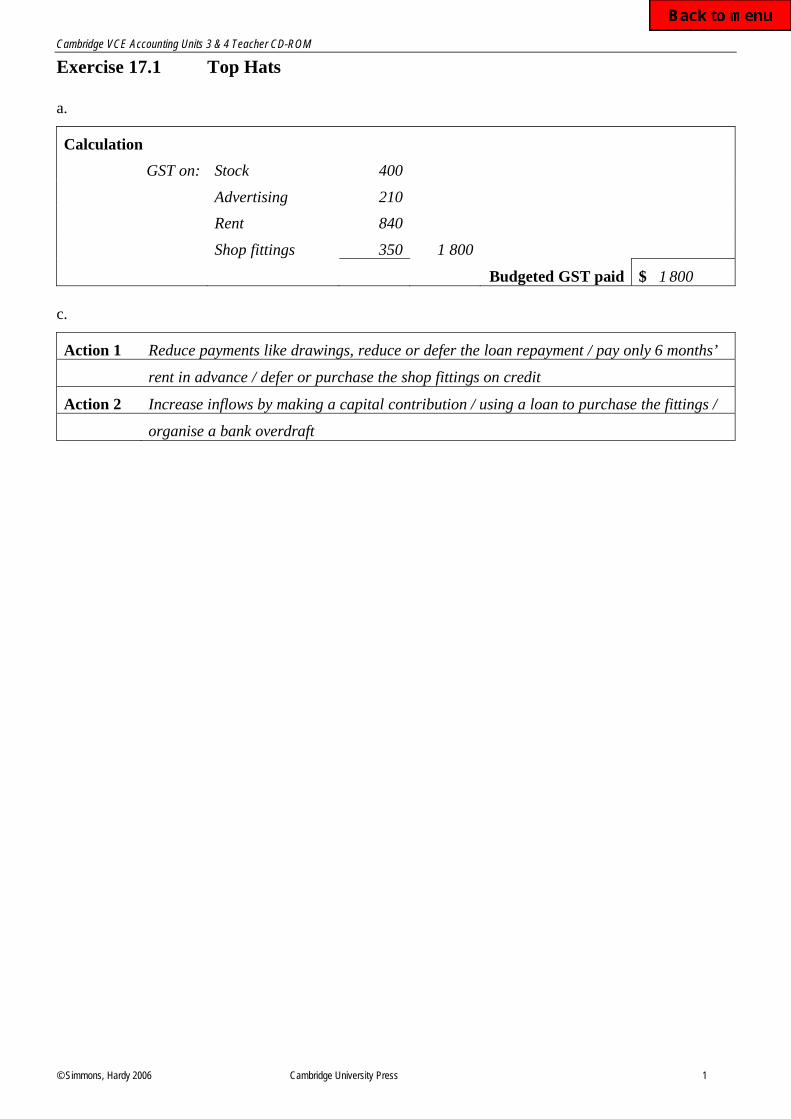
Exercise 17.1 Top Hats
a.
Calculation
GST on: Stock 400
Advertising 210
Rent 840
Shop fittings 350 1 800
Budgeted GST paid $ 1 800
c.
Action 1 Reduce payments like drawings, reduce or defer the loan repayment / pay only 6 months’
rent in advance / defer or purchase the shop fittings on credit
Action 2 Increase inflows by making a capital contribution / using a loan to purchase the fittings /
organise a bank overdraft
Cambridge VCE Accounting Units 3 & 4 Teacher CD-ROM
© Simmons, Hardy 2006 Cambridge University Press 2
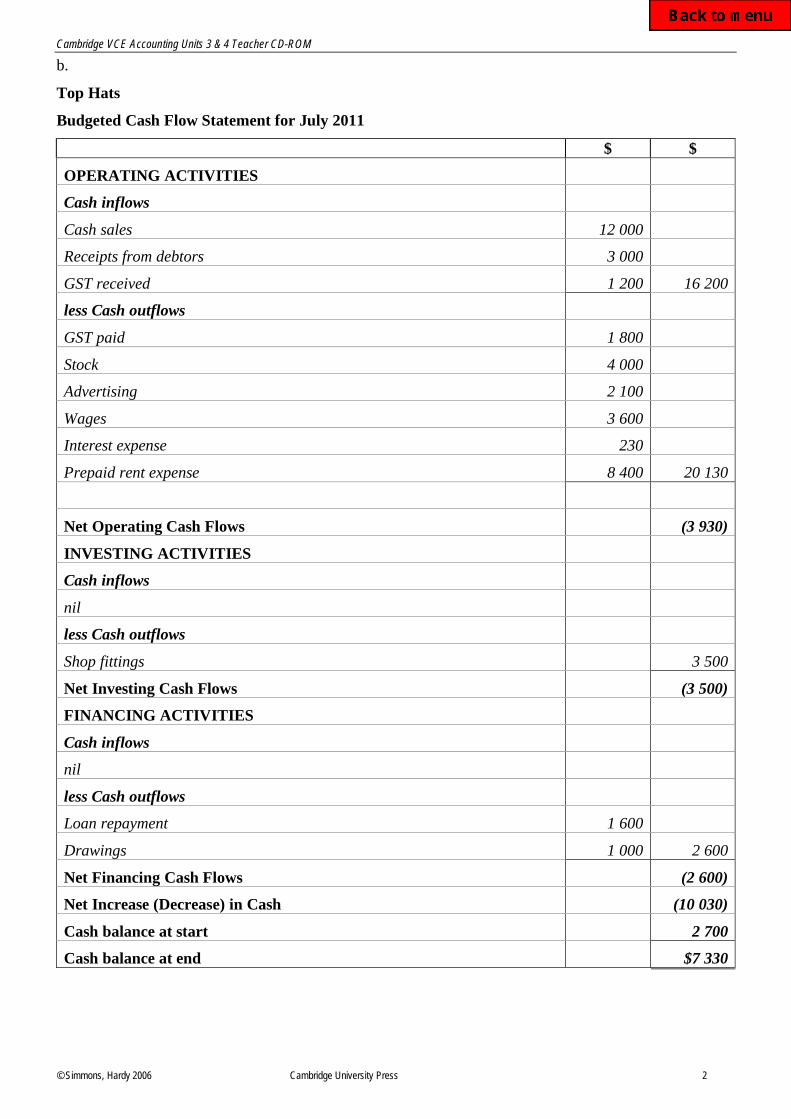
b.
Top Hats
Budgeted Cash Flow Statement for July 2011
$ $
OPERATING ACTIVITIES
Cash inflows
Cash sales 12 000
Receipts from debtors 3 000
GST received 1 200 16 200
less Cash outflows
GST paid 1 800
Stock 4 000
Advertising 2 100
Wages 3 600
Interest expense 230
Prepaid rent expense 8 400 20 130
Net Operating Cash Flows (3 930)
INVESTING ACTIVITIES
Cash inflows
nil
less Cash outflows
Shop fittings 3 500
Net Investing Cash Flows (3 500)
FINANCING ACTIVITIES
Cash inflows
nil
less Cash outflows
Loan repayment 1 600
Drawings 1 000 2 600
Net Financing Cash Flows (2 600)
Net Increase (Decrease) in Cash (10 030)
Cash balance at start 2 700
Cash balance at end $7 330
Cambridge VCE Accounting Units 3 & 4 Teacher CD-ROM
© Simmons, Hardy 2006 Cambridge University Press 3
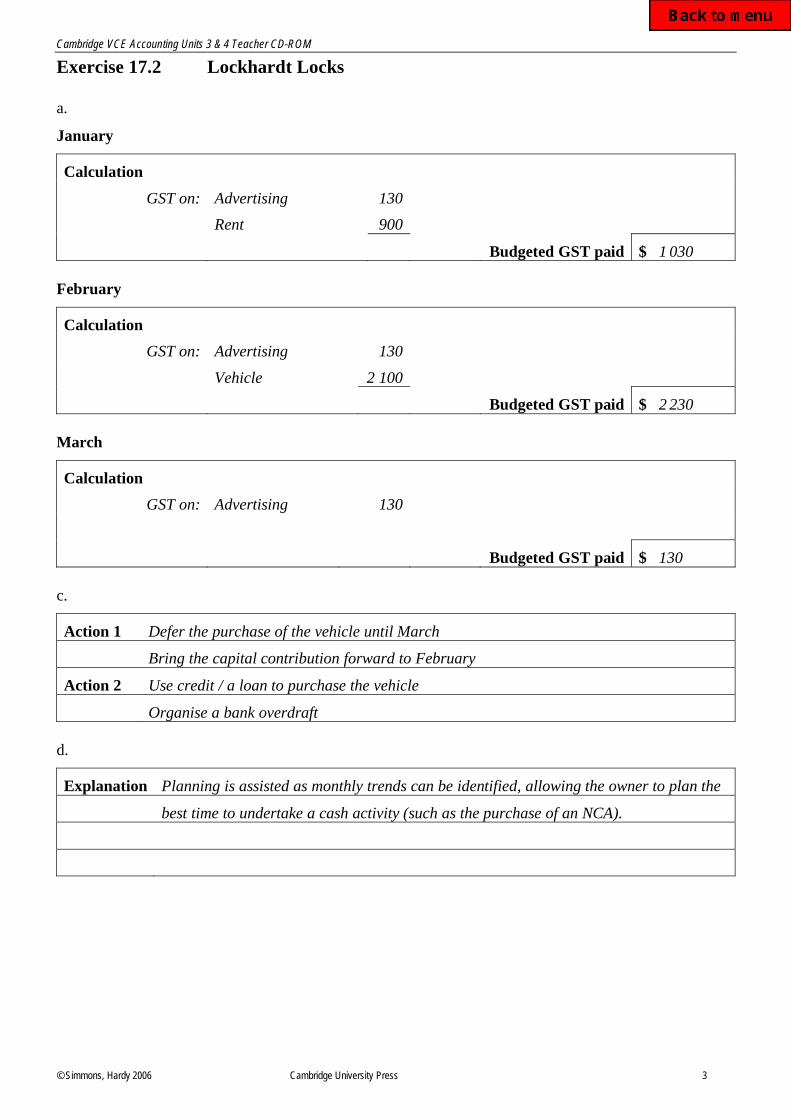
Exercise 17.2 Lockhardt Locks
a.
January
Calculation
GST on: Advertising 130
Rent 900
Budgeted GST paid $ 1 030
February
Calculation
GST on: Advertising 130
Vehicle 2 100
Budgeted GST paid $ 2 230
March
Calculation
GST on: Advertising 130
Budgeted GST paid $ 130
c.
Action 1 Defer the purchase of the vehicle until March
Bring the capital contribution forward to February
Action 2 Use credit / a loan to purchase the vehicle
Organise a bank overdraft
d.
Explanation Planning is assisted as monthly trends can be identified, allowing the owner to plan the
best time to undertake a cash activity (such as the purchase of an NCA).
Cambridge VCE Accounting Units 3 & 4 Teacher CD-ROM
© Simmons, Hardy 2006 Cambridge University Press 4
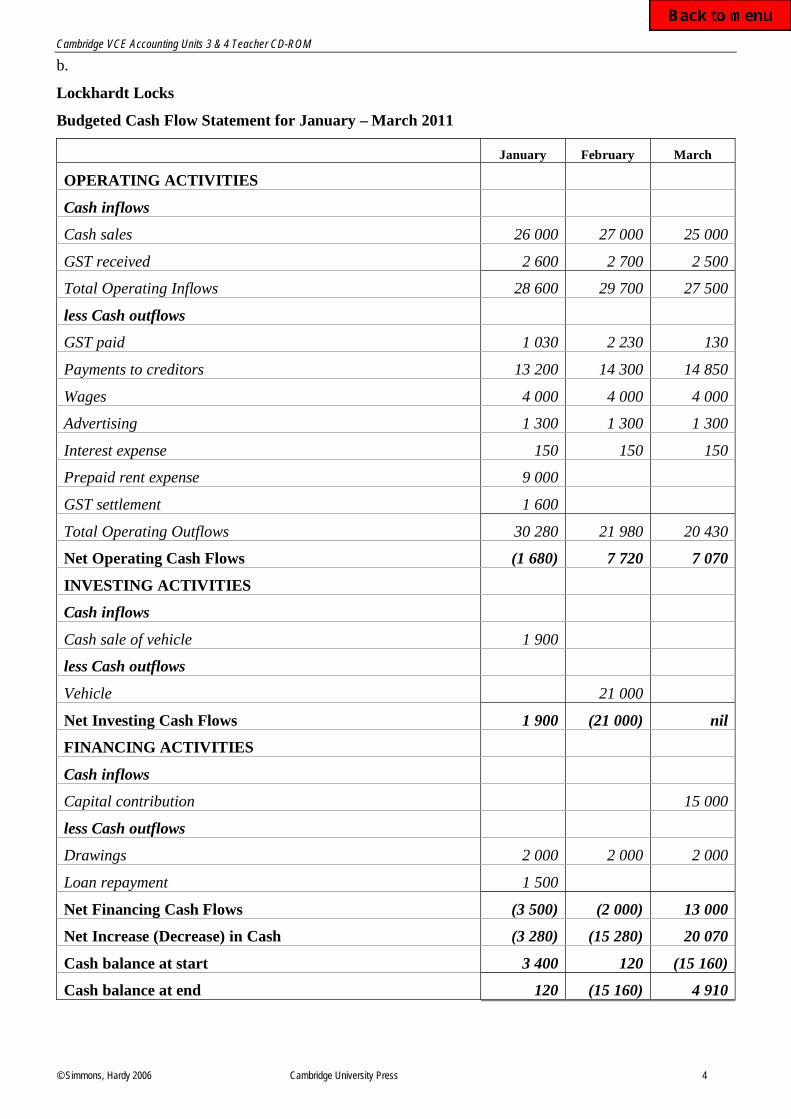
b.
Lockhardt Locks
Budgeted Cash Flow Statement for January – March 2011
January February March
OPERATING ACTIVITIES
Cash inflows
Cash sales 26 000 27 000 25 000
GST received 2 600 2 700 2 500
Total Operating Inflows 28 600 29 700 27 500
less Cash outflows
GST paid 1 030 2 230 130
Payments to creditors 13 200 14 300 14 850
Wages 4 000 4 000 4 000
Advertising 1 300 1 300 1 300
Interest expense 150 150 150
Prepaid rent expense 9 000
GST settlement 1 600
Total Operating Outflows 30 280 21 980 20 430
Net Operating Cash Flows (1 680) 7 720 7 070
INVESTING ACTIVITIES
Cash inflows
Cash sale of vehicle 1 900
less Cash outflows
Vehicle 21 000
Net Investing Cash Flows 1 900 (21 000) nil
FINANCING ACTIVITIES
Cash inflows
Capital contribution 15 000
less Cash outflows
Drawings 2 000 2 000 2 000
Loan repayment 1 500
Net Financing Cash Flows (3 500) (2 000) 13 000
Net Increase (Decrease) in Cash (3 280) (15 280) 20 070
Cash balance at start 3 400 120 (15 160)
Cash balance at end 120 (15 160) 4 910
Cambridge VCE Accounting Units 3 & 4 Teacher CD-ROM
© Simmons, Hardy 2006 Cambridge University Press 5
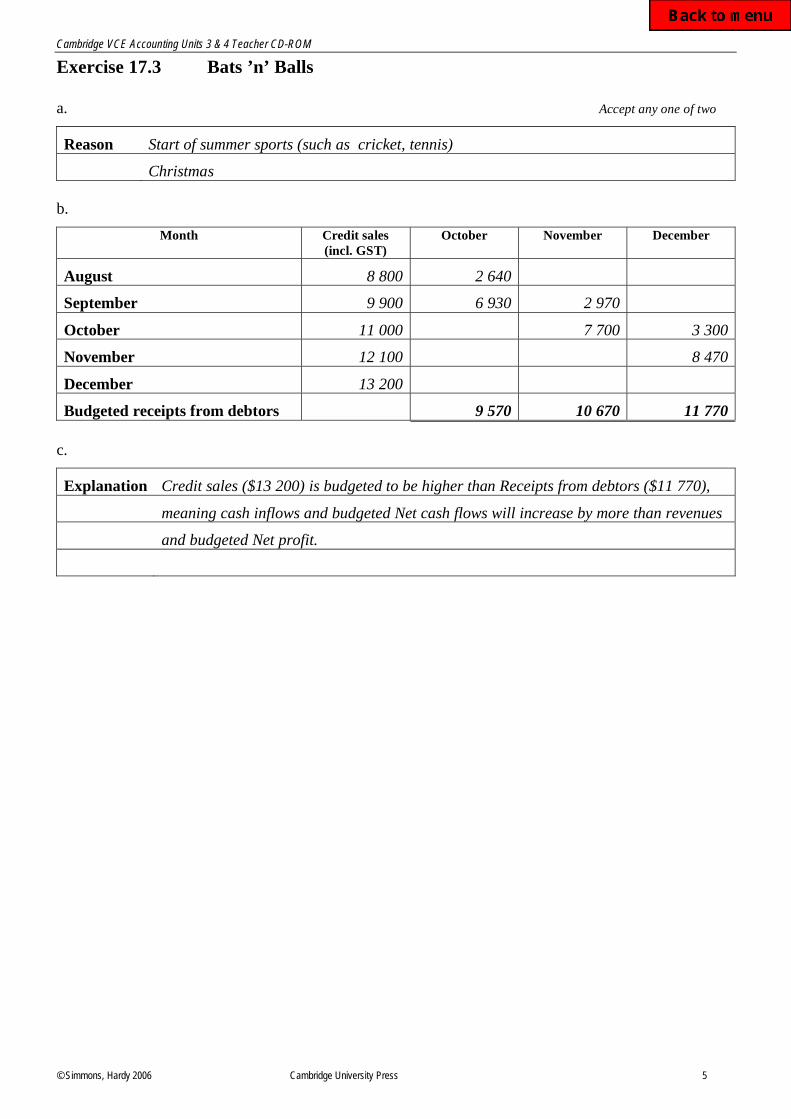
Exercise 17.3 Bats ’n’ Balls
a. Accept any one of two
Reason Start of summer sports (such as cricket, tennis)
Christmas
b.
Month Credit sales
(incl. GST)
October November December
August 8 800 2 640
September 9 900 6 930 2 970
October 11 000 7 700 3 300
November 12 100 8 470
December 13 200
Budgeted receipts from debtors 9 570 10 670 11 770
c.
Explanation Credit sales ($13 200) is budgeted to be higher than Receipts from debtors ($11 770),
meaning cash inflows and budgeted Net cash flows will increase by more than revenues
and budgeted Net profit.
Cambridge VCE Accounting Units 3 & 4 Teacher CD-ROM
© Simmons, Hardy 2006 Cambridge University Press 6
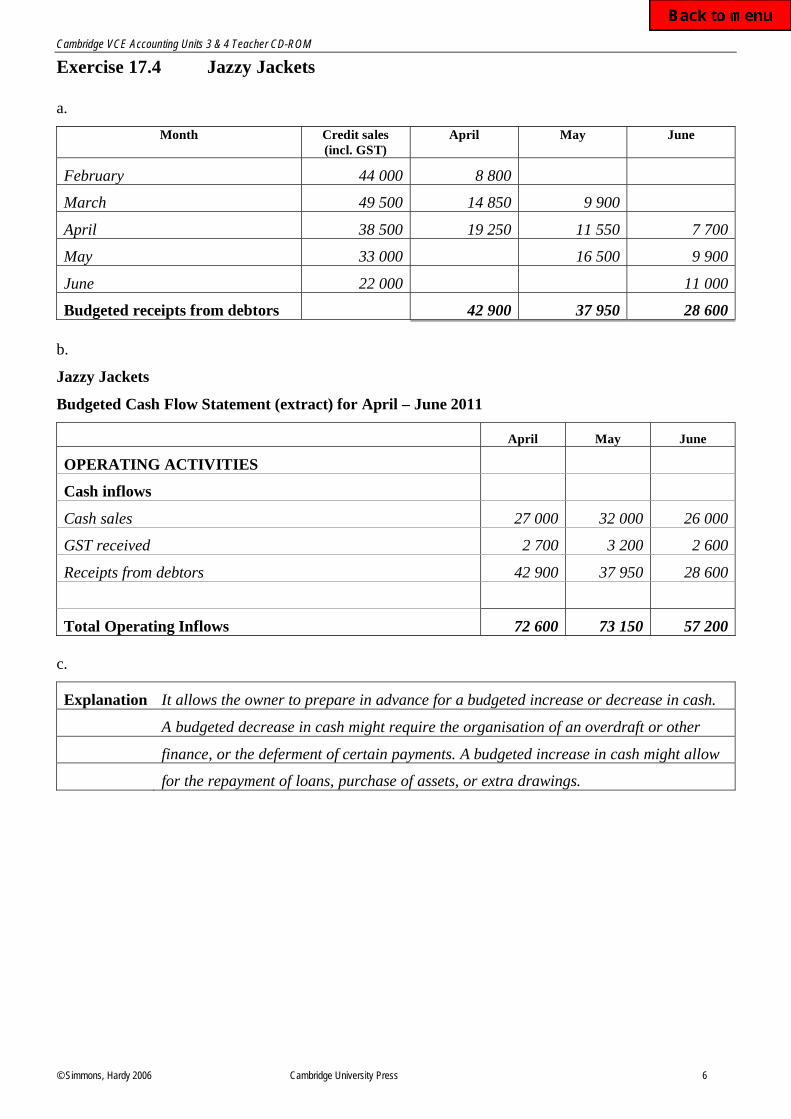
Exercise 17.4 Jazzy Jackets
a.
Month Credit sales
(incl. GST)
April May June
February 44 000 8 800
March 49 500 14 850 9 900
April 38 500 19 250 11 550 7 700
May 33 000 16 500 9 900
June 22 000 11 000
Budgeted receipts from debtors 42 900 37 950 28 600
b.
Jazzy Jackets
Budgeted Cash Flow Statement (extract) for April – June 2011
April May June
OPERATING ACTIVITIES
Cash inflows
Cash sales 27 000 32 000 26 000
GST received 2 700 3 200 2 600
Receipts from debtors 42 900 37 950 28 600
Total Operating Inflows 72 600 73 150 57 200
c.
Explanation It allows the owner to prepare in advance for a budgeted increase or decrease in cash.
A budgeted decrease in cash might require the organisation of an overdraft or other
finance, or the deferment of certain payments. A budgeted increase in cash might allow
for the repayment of loans, purchase of assets, or extra drawings.
Cambridge VCE Accounting Units 3 & 4 Teacher CD-ROM
© Simmons, Hardy 2006 Cambridge University Press 7
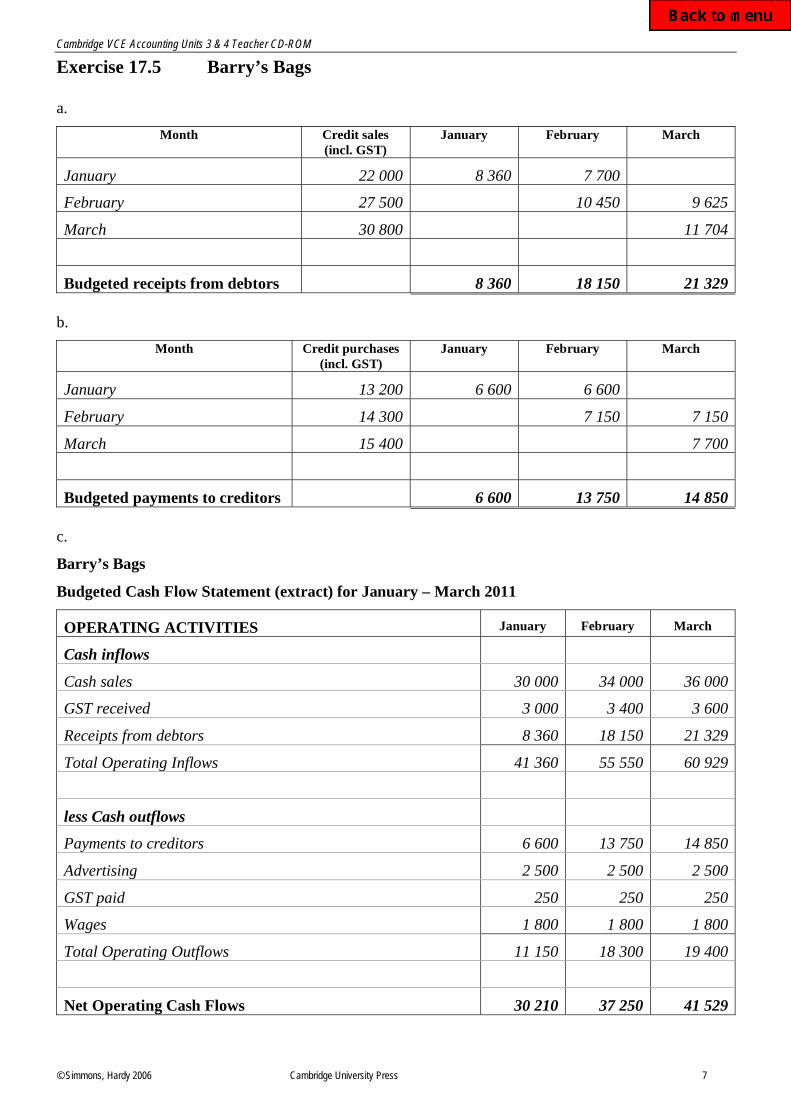
Exercise 17.5 Barry’s Bags
a.
Month Credit sales
(incl. GST)
January February March
January 22 000 8 360 7 700
February 27 500 10 450 9 625
March 30 800 11 704
Budgeted receipts from debtors 8 360 18 150 21 329
b.
Month Credit purchases
(incl. GST)
January February March
January 13 200 6 600 6 600
February 14 300 7 150 7 150
March 15 400 7 700
Budgeted payments to creditors 6 600 13 750 14 850
c.
Barry’s Bags
Budgeted Cash Flow Statement (extract) for January – March 2011
OPERATING ACTIVITIES January February March
Cash inflows
Cash sales 30 000 34 000 36 000
GST received 3 000 3 400 3 600
Receipts from debtors 8 360 18 150 21 329
Total Operating Inflows 41 360 55 550 60 929
less Cash outflows
Payments to creditors 6 600 13 750 14 850
Advertising 2 500 2 500 2 500
GST paid 250 250 250
Wages 1 800 1 800 1 800
Total Operating Outflows 11 150 18 300 19 400
Net Operating Cash Flows 30 210 37 250 41 529
Cambridge VCE Accounting Units 3 & 4 Teacher CD-ROM
© Simmons, Hardy 2006 Cambridge University Press 8
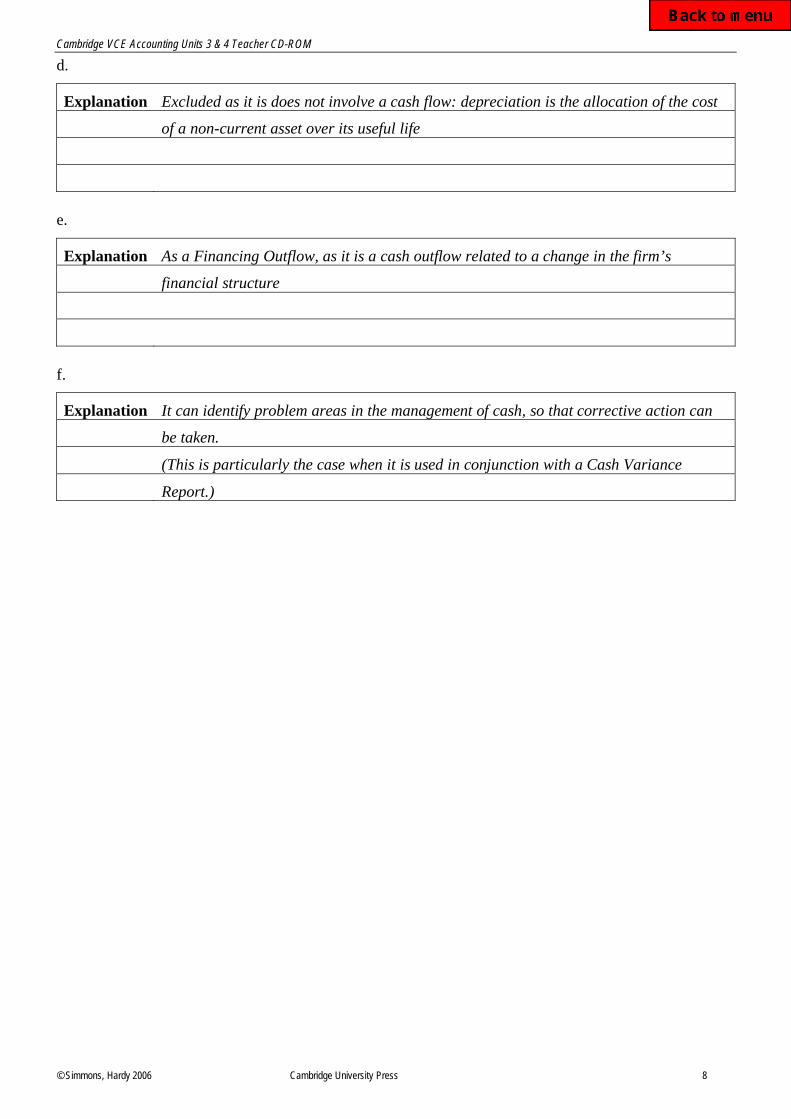
d.
Explanation Excluded as it is does not involve a cash flow: depreciation is the allocation of the cost
of a non-current asset over its useful life
e.
Explanation As a Financing Outflow, as it is a cash outflow related to a change in the firm’s
financial structure
f.
Explanation It can identify problem areas in the management of cash, so that corrective action can
be taken.
(This is particularly the case when it is used in conjunction with a Cash Variance
Report.)
Cambridge VCE Accounting Units 3 & 4 Teacher CD-ROM
© Simmons, Hardy 2006 Cambridge University Press 9
Exercise 17.6 Dan’s Detergents
a.
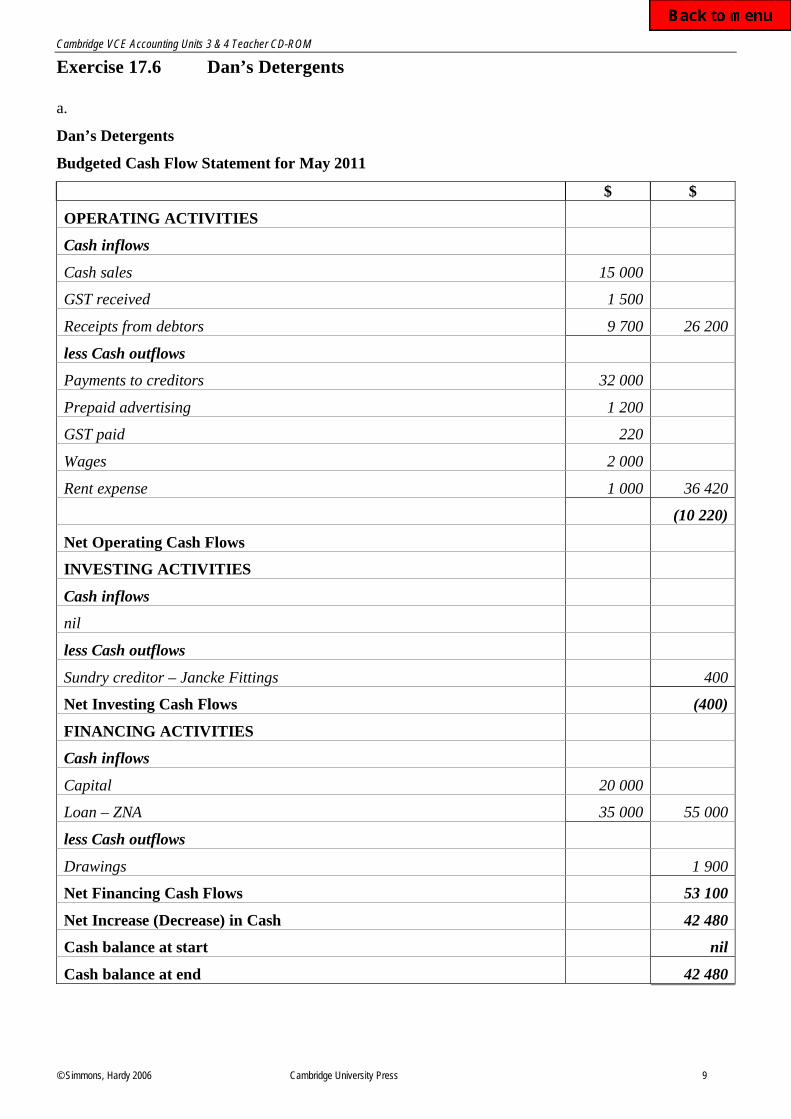
Dan’s Detergents
Budgeted Cash Flow Statement for May 2011
$ $
OPERATING ACTIVITIES
Cash inflows
Cash sales 15 000
GST received 1 500
Receipts from debtors 9 700 26 200
less Cash outflows
Payments to creditors 32 000
Prepaid advertising 1 200
GST paid 220
Wages 2 000
Rent expense 1 000 36 420
(10 220)
Net Operating Cash Flows
INVESTING ACTIVITIES
Cash inflows
nil
less Cash outflows
Sundry creditor – Jancke Fittings 400
Net Investing Cash Flows (400)
FINANCING ACTIVITIES
Cash inflows
Capital 20 000
Loan – ZNA 35 000 55 000
less Cash outflows
Drawings 1 900
Net Financing Cash Flows 53 100
Net Increase (Decrease) in Cash 42 480
Cash balance at start nil
Cash balance at end 42 480
Cambridge VCE Accounting Units 3 & 4 Teacher CD-ROM
© Simmons, Hardy 2006 Cambridge University Press 10
b.
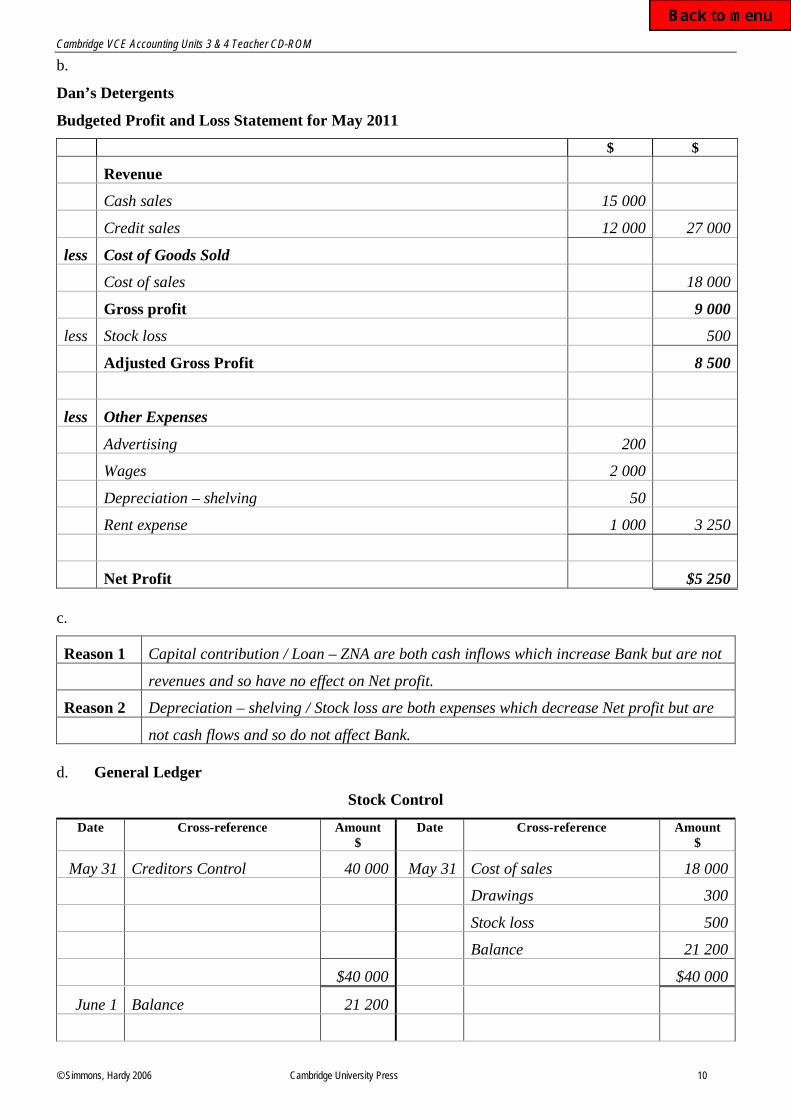
Dan’s Detergents
Budgeted Profit and Loss Statement for May 2011
$ $
Revenue
Cash sales 15 000
Credit sales 12 000 27 000
less Cost of Goods Sold
Cost of sales 18 000
Gross profit 9 000
less Stock loss 500
Adjusted Gross Profit
8 500
less Other Expenses
Advertising 200
Wages 2 000
Depreciation – shelving 50
Rent expense 1 000 3 250
Net Profit $5 250
c.
Reason 1 Capital contribution / Loan – ZNA are both cash inflows which increase Bank but are not
revenues and so have no effect on Net profit.
Reason 2 Depreciation – shelving / Stock loss are both expenses which decrease Net profit but are
not cash flows and so do not affect Bank.
d. General Ledger
Stock Control
Date Cross-reference Amount
$
Date Cross-reference Amount
$
May 31 Creditors Control 40 000 May 31 Cost of sales 18 000
Drawings 300
Stock loss 500
Balance 21 200
$40 000 $40 000
June 1 Balance 21 200
Cambridge VCE Accounting Units 3 & 4 Teacher CD-ROM
© Simmons, Hardy 2006 Cambridge University Press 11
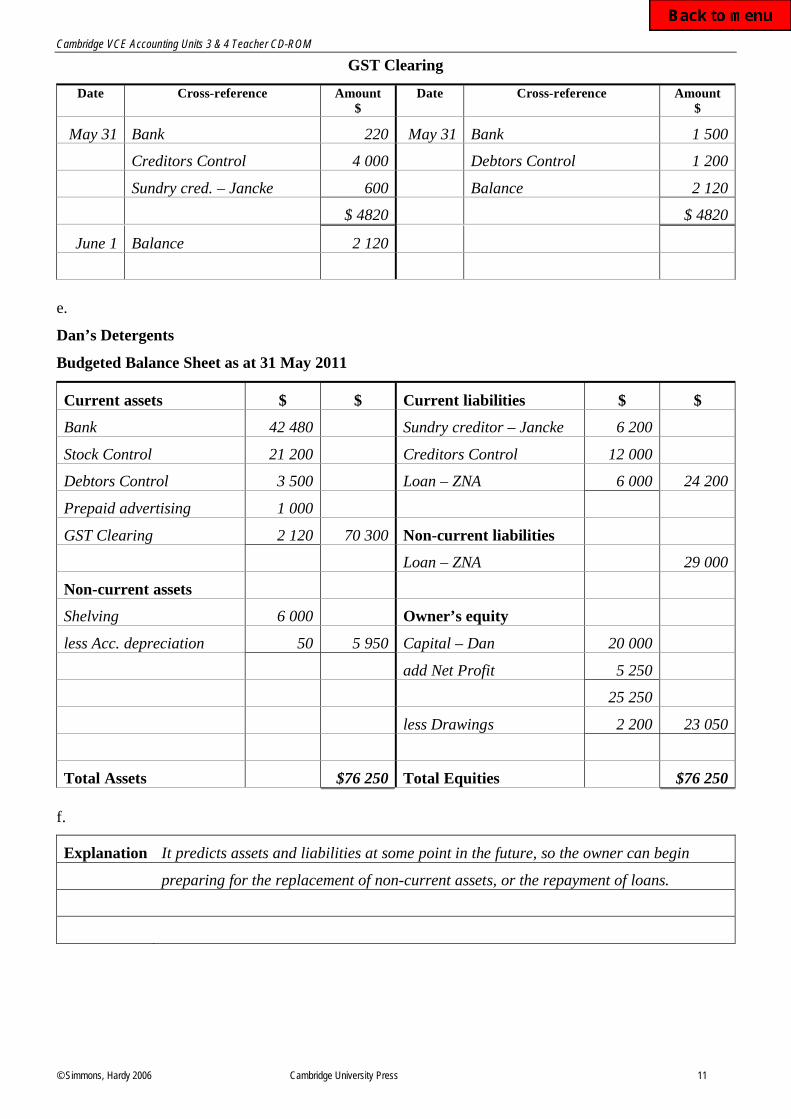
GST Clearing
Date Cross-reference Amount
$
Date Cross-reference Amount
$
May 31 Bank 220 May 31 Bank 1 500
Creditors Control 4 000 Debtors Control 1 200
Sundry cred. – Jancke 600 Balance 2 120
$ 4820 $ 4820
June 1 Balance 2 120
e.
Dan’s Detergents
Budgeted Balance Sheet as at 31 May 2011
Current assets $ $ Current liabilities $ $
Bank 42 480 Sundry creditor – Jancke 6 200
Stock Control 21 200 Creditors Control 12 000
Debtors Control 3 500 Loan – ZNA 6 000 24 200
Prepaid advertising 1 000
GST Clearing 2 120 70 300 Non-current liabilities
Loan – ZNA 29 000
Non-current assets
Shelving 6 000 Owner’s equity
less Acc. depreciation 50 5 950 Capital – Dan 20 000
add Net Profit 5 250
25 250
less Drawings 2 200 23 050
Total Assets $76 250 Total Equities $76 250
f.
Explanation It predicts assets and liabilities at some point in the future, so the owner can begin
preparing for the replacement of non-current assets, or the repayment of loans.
Cambridge VCE Accounting Units 3 & 4 Teacher CD-ROM
© Simmons, Hardy 2006 Cambridge University Press 12
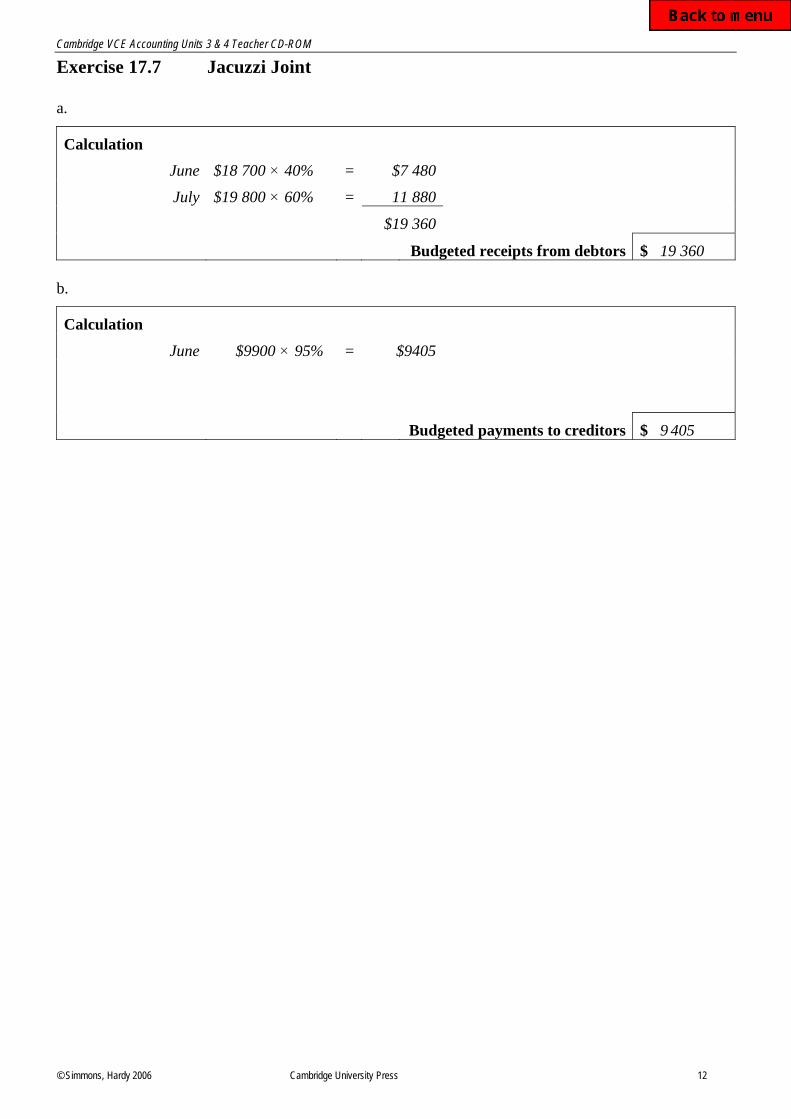
Exercise 17.7 Jacuzzi Joint
a.
Calculation
June $18 700 40% = $7 480
July $19 800 60% = 11 880
$19 360
Budgeted receipts from debtors $ 19 360
b.
Calculation
June $9900 95% = $9405
Budgeted payments to creditors $ 9 405
Cambridge VCE Accounting Units 3 & 4 Teacher CD-ROM
© Simmons, Hardy 2006 Cambridge University Press 13
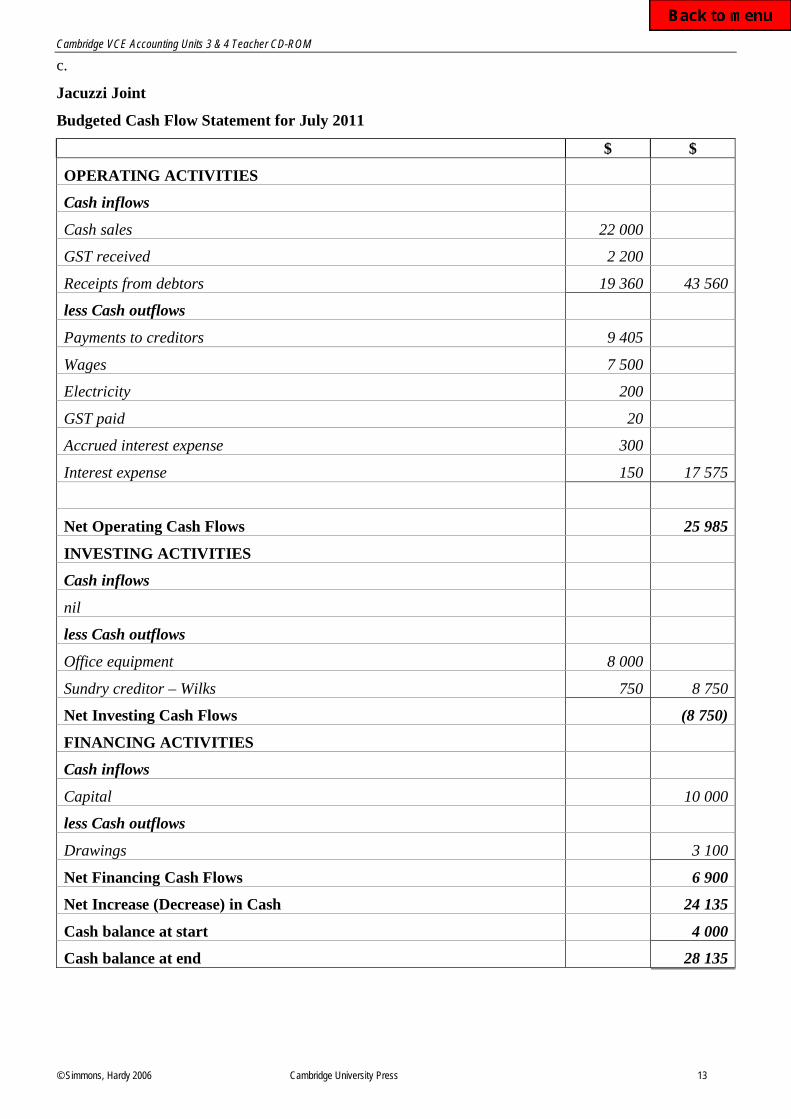
c.
Jacuzzi Joint
Budgeted Cash Flow Statement for July 2011
$ $
OPERATING ACTIVITIES
Cash inflows
Cash sales 22 000
GST received 2 200
Receipts from debtors 19 360 43 560
less Cash outflows
Payments to creditors 9 405
Wages 7 500
Electricity 200
GST paid 20
Accrued interest expense 300
Interest expense 150 17 575
Net Operating Cash Flows 25 985
INVESTING ACTIVITIES
Cash inflows
nil
less Cash outflows
Office equipment 8 000
Sundry creditor – Wilks 750 8 750
Net Investing Cash Flows (8 750)
FINANCING ACTIVITIES
Cash inflows
Capital 10 000
less Cash outflows
Drawings 3 100
Net Financing Cash Flows 6 900
Net Increase (Decrease) in Cash 24 135
Cash balance at start 4 000
Cash balance at end 28 135
Cambridge VCE Accounting Units 3 & 4 Teacher CD-ROM
© Simmons, Hardy 2006 Cambridge University Press 14
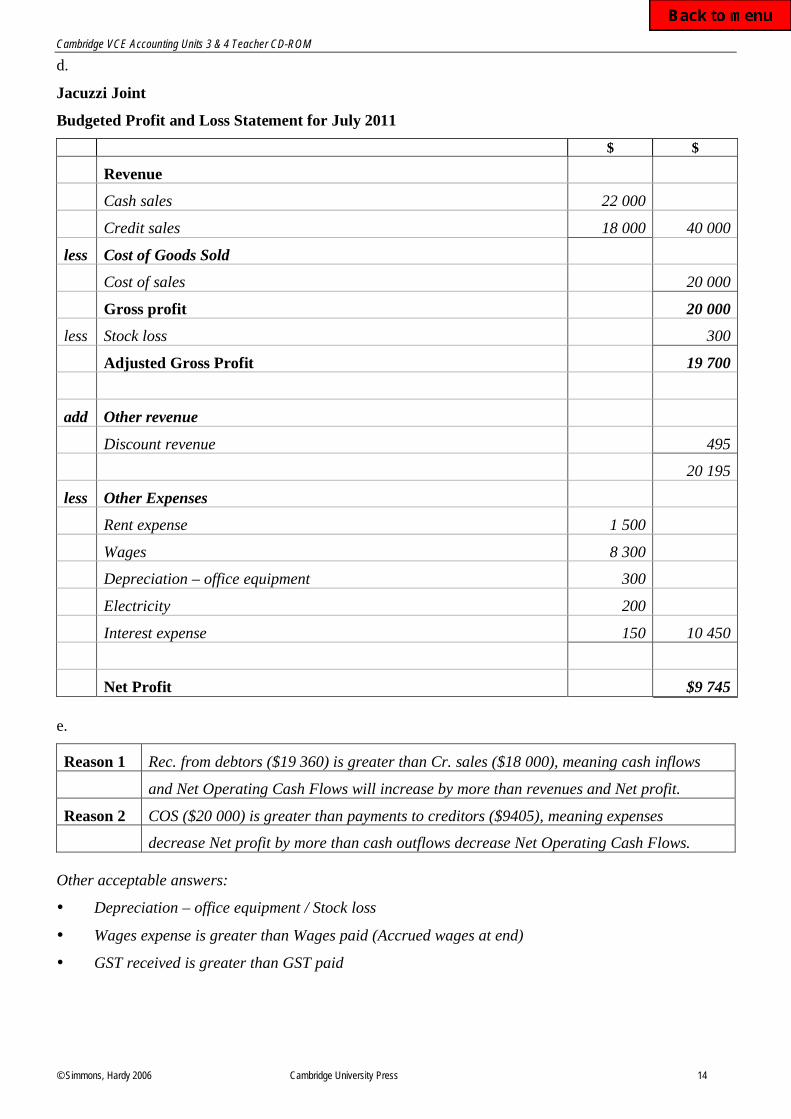
d.
Jacuzzi Joint
Budgeted Profit and Loss Statement for July 2011
$ $
Revenue
Cash sales 22 000
Credit sales 18 000 40 000
less Cost of Goods Sold
Cost of sales 20 000
Gross profit 20 000
less Stock loss 300
Adjusted Gross Profit
19 700
add Other revenue
Discount revenue 495
20 195
less Other Expenses
Rent expense 1 500
Wages 8 300
Depreciation – office equipment 300
Electricity 200
Interest expense 150 10 450
Net Profit $9 745
e.
Reason 1 Rec. from debtors ($19 360) is greater than Cr. sales ($18 000), meaning cash inflows
and Net Operating Cash Flows will increase by more than revenues and Net profit.
Reason 2 COS ($20 000) is greater than payments to creditors ($9405), meaning expenses
decrease Net profit by more than cash outflows decrease Net Operating Cash Flows.
Other acceptable answers:
• Depreciation – office equipment / Stock loss
• Wages expense is greater than Wages paid (Accrued wages at end)
• GST received is greater than GST paid
Cambridge VCE Accounting Units 3 & 4 Teacher CD-ROM
© Simmons, Hardy 2006 Cambridge University Press 15
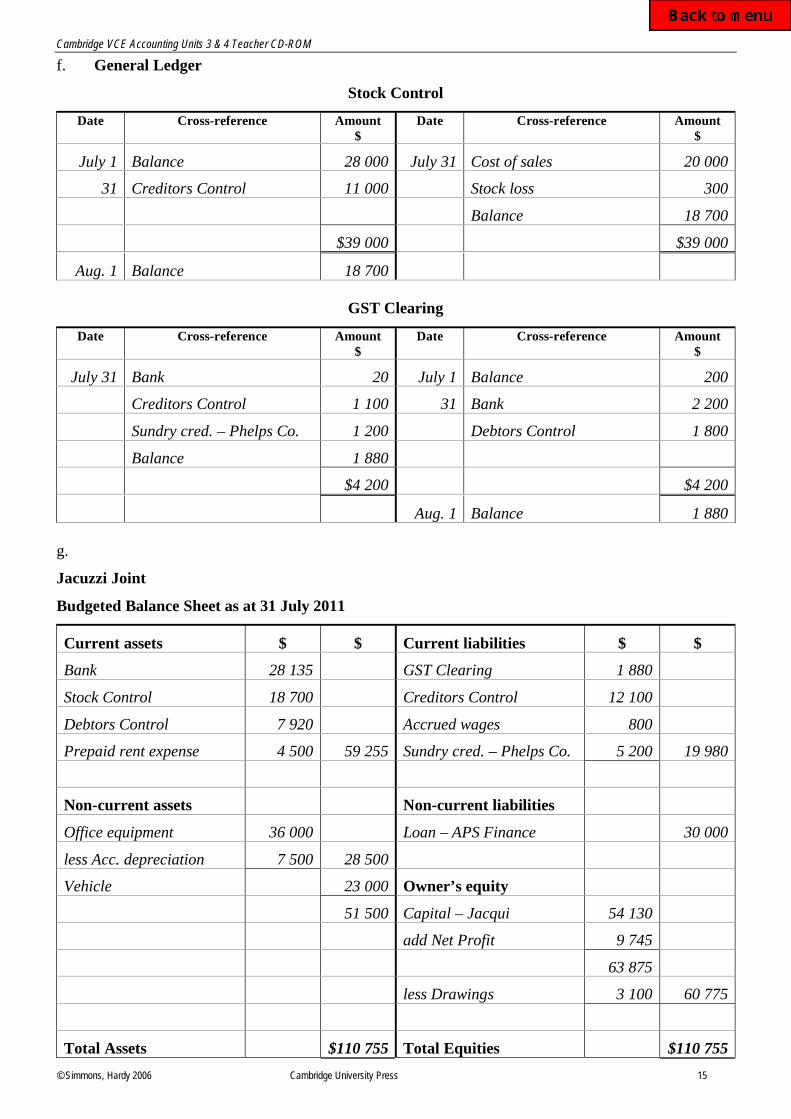
f. General Ledger
Stock Control
Date Cross-reference Amount
$
Date Cross-reference Amount
$
July 1 Balance 28 000 July 31 Cost of sales 20 000
31 Creditors Control 11 000 Stock loss 300
Balance 18 700
$39 000 $39 000
Aug. 1 Balance 18 700
GST Clearing
Date Cross-reference Amount
$
Date Cross-reference Amount
$
July 31 Bank 20 July 1 Balance 200
Creditors Control 1 100 31 Bank 2 200
Sundry cred. – Phelps Co. 1 200 Debtors Control 1 800
Balance 1 880
$4 200 $4 200
Aug. 1 Balance 1 880
g.
Jacuzzi Joint
Budgeted Balance Sheet as at 31 July 2011
Current assets $ $ Current liabilities $ $
Bank 28 135 GST Clearing 1 880
Stock Control 18 700 Creditors Control 12 100
Debtors Control 7 920 Accrued wages 800
Prepaid rent expense 4 500 59 255 Sundry cred. – Phelps Co. 5 200 19 980
Non-current assets Non-current liabilities
Office equipment 36 000 Loan – APS Finance 30 000
less Acc. depreciation 7 500 28 500
Vehicle 23 000 Owner’s equity
51 500 Capital – Jacqui 54 130
add Net Profit 9 745
63 875
less Drawings 3 100 60 775
Total Assets $110 755 Total Equities $110 755
Cambridge VCE Accounting Units 3 & 4 Teacher CD-ROM
© Simmons, Hardy 2006 Cambridge University Press 16
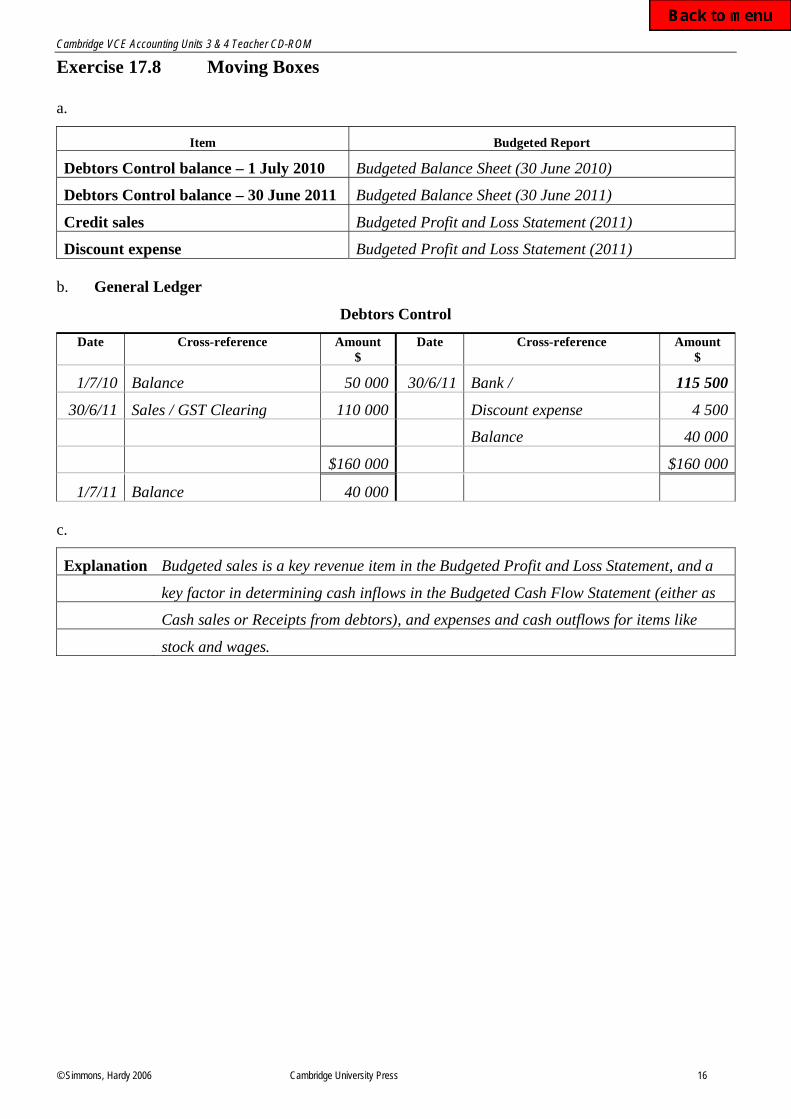
Exercise 17.8 Moving Boxes
a.
Item Budgeted Report
Debtors Control balance – 1 July 2010 Budgeted Balance Sheet (30 June 2010)
Debtors Control balance – 30 June 2011 Budgeted Balance Sheet (30 June 2011)
Credit sales Budgeted Profit and Loss Statement (2011)
Discount expense Budgeted Profit and Loss Statement (2011)
b. General Ledger
Debtors Control
Date Cross-reference Amount
$
Date Cross-reference Amount
$
1/7/10 Balance 50 000 30/6/11 Bank / 115 500
30/6/11 Sales / GST Clearing 110 000 Discount expense 4 500
Balance 40 000
$160 000 $160 000
1/7/11 Balance 40 000
c.
Explanation Budgeted sales is a key revenue item in the Budgeted Profit and Loss Statement, and a
key factor in determining cash inflows in the Budgeted Cash Flow Statement (either as
Cash sales or Receipts from debtors), and expenses and cash outflows for items like
stock and wages.
Cambridge VCE Accounting Units 3 & 4 Teacher CD-ROM
© Simmons, Hardy 2006 Cambridge University Press 17
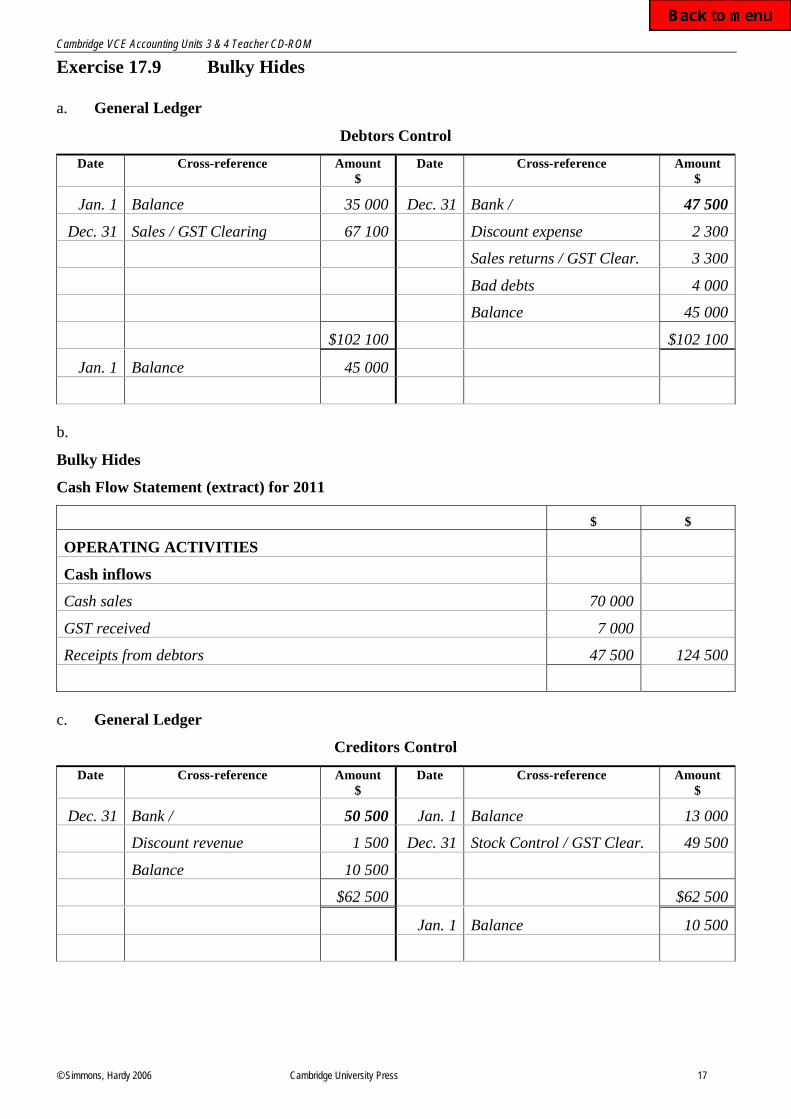
Exercise 17.9 Bulky Hides
a. General Ledger
Debtors Control
Date Cross-reference Amount
$
Date Cross-reference Amount
$
Jan. 1 Balance 35 000 Dec. 31 Bank / 47 500
Dec. 31 Sales / GST Clearing 67 100 Discount expense 2 300
Sales returns / GST Clear. 3 300
Bad debts 4 000
Balance 45 000
$102 100 $102 100
Jan. 1 Balance 45 000
b.
Bulky Hides
Cash Flow Statement (extract) for 2011
$ $
OPERATING ACTIVITIES
Cash inflows
Cash sales 70 000
GST received 7 000
Receipts from debtors 47 500 124 500
c. General Ledger
Creditors Control
Date Cross-reference Amount
$
Date Cross-reference Amount
$
Dec. 31 Bank / 50 500 Jan. 1 Balance 13 000
Discount revenue 1 500 Dec. 31 Stock Control / GST Clear. 49 500
Balance 10 500
$62 500 $62 500
Jan. 1 Balance 10 500
Cambridge VCE Accounting Units 3 & 4 Teacher CD-ROM
© Simmons, Hardy 2006 Cambridge University Press 18
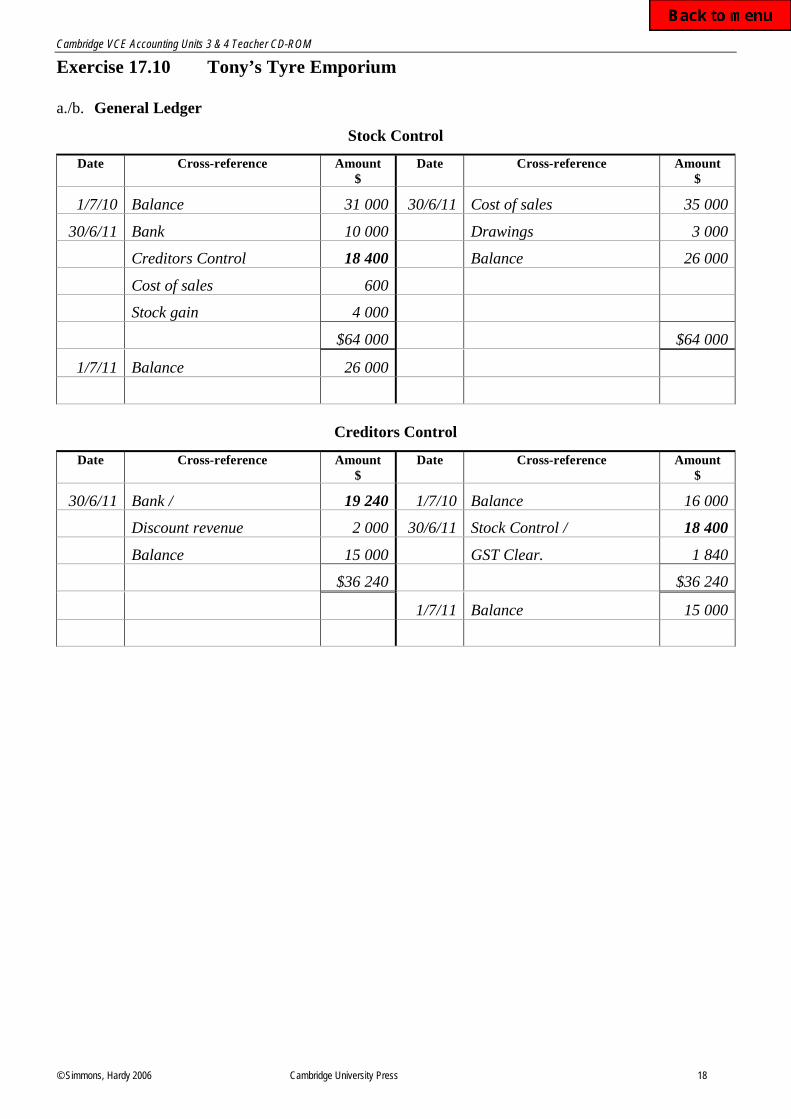
Exercise 17.10 Tony’s Tyre Emporium
a./b. General Ledger
Stock Control
Date Cross-reference Amount
$
Date Cross-reference Amount
$
1/7/10 Balance 31 000 30/6/11 Cost of sales 35 000
30/6/11 Bank 10 000 Drawings 3 000
Creditors Control 18 400 Balance 26 000
Cost of sales 600
Stock gain 4 000
$64 000 $64 000
1/7/11 Balance 26 000
Creditors Control
Date Cross-reference Amount
$
Date Cross-reference Amount
$
30/6/11 Bank / 19 240 1/7/10 Balance 16 000
Discount revenue 2 000 30/6/11 Stock Control / 18 400
Balance 15 000 GST Clear. 1 840
$36 240 $36 240
1/7/11 Balance 15 000
Cambridge VCE Accounting Units 3 & 4 Teacher CD-ROM
© Simmons, Hardy 2006 Cambridge University Press 19
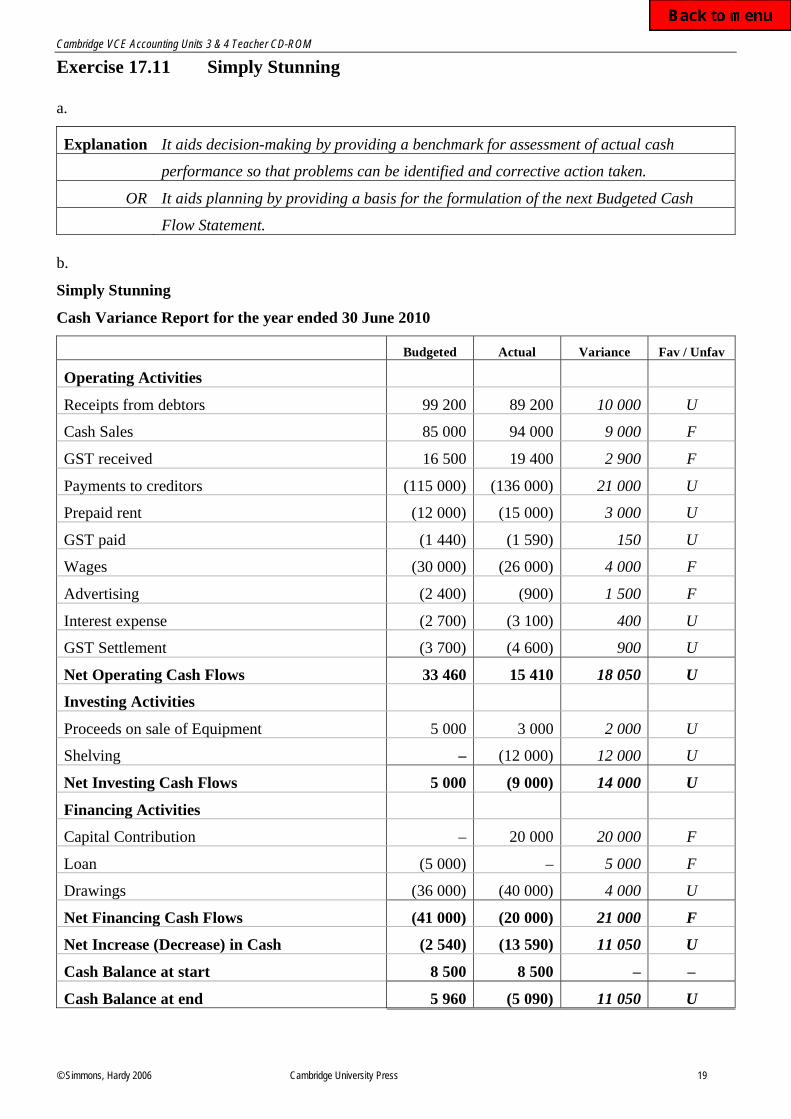
Exercise 17.11 Simply Stunning
a.
Explanation It aids decision-making by providing a benchmark for assessment of actual cash
performance so that problems can be identified and corrective action taken.
OR It aids planning by providing a basis for the formulation of the next Budgeted Cash
Flow Statement.
b.
Simply Stunning
Cash Variance Report for the year ended 30 June 2010
Budgeted Actual Variance Fav / Unfav
Operating Activities
Receipts from debtors 99 200 89 200 10 000 U
Cash Sales 85 000 94 000 9 000 F
GST received 16 500 19 400 2 900 F
Payments to creditors (115 000) (136 000) 21 000 U
Prepaid rent (12 000) (15 000) 3 000 U
GST paid (1 440) (1 590) 150 U
Wages (30 000) (26 000) 4 000 F
Advertising (2 400) (900) 1 500 F
Interest expense (2 700) (3 100) 400 U
GST Settlement (3 700) (4 600) 900 U
Net Operating Cash Flows 33 460 15 410 18 050 U
Investing Activities
Proceeds on sale of Equipment 5 000 3 000 2 000 U
Shelving – (12 000) 12 000 U
Net Investing Cash Flows 5 000 (9 000) 14 000 U
Financing Activities
Capital Contribution – 20 000 20 000 F
Loan (5 000) – 5 000 F
Drawings (36 000) (40 000) 4 000 U
Net Financing Cash Flows (41 000) (20 000) 21 000 F
Net Increase (Decrease) in Cash (2 540) (13 590) 11 050 U
Cash Balance at start 8 500 8 500 – –
Cash Balance at end 5 960 (5 090) 11 050 U
Cambridge VCE Accounting Units 3 & 4 Teacher CD-ROM
© Simmons, Hardy 2006 Cambridge University Press 20
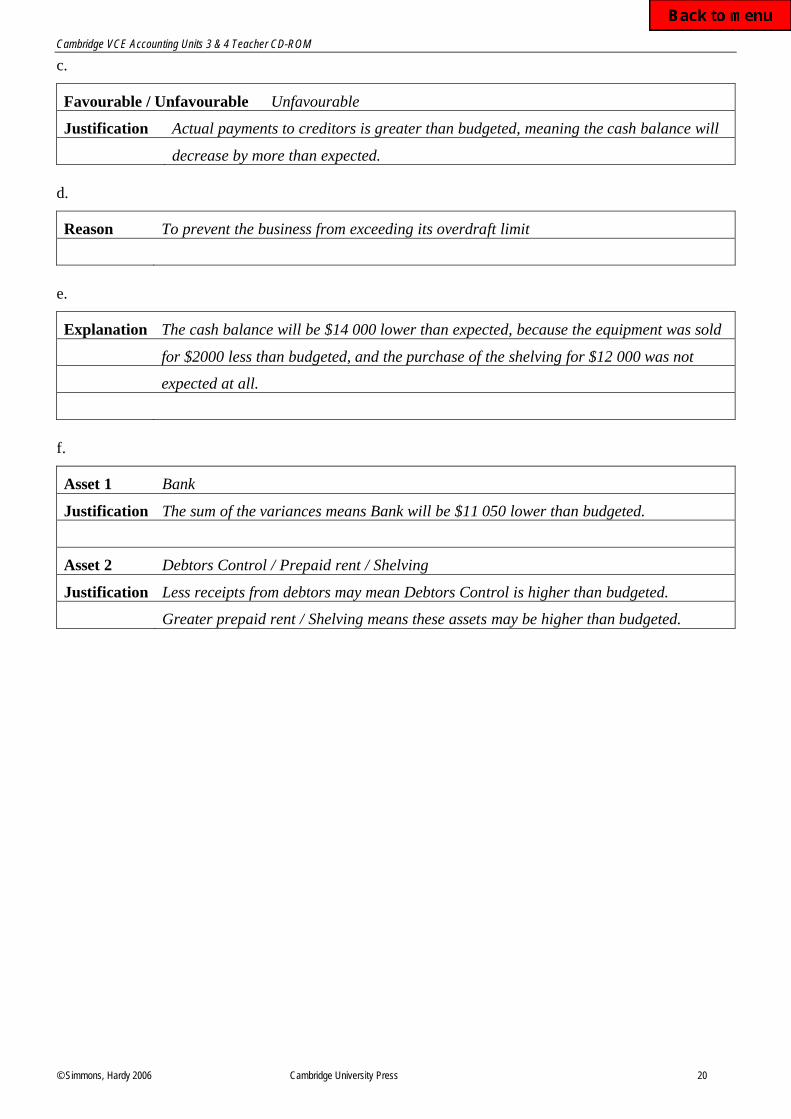
c.
Favourable / Unfavourable Unfavourable
Justification Actual payments to creditors is greater than budgeted, meaning the cash balance will
decrease by more than expected.
d.
Reason To prevent the business from exceeding its overdraft limit
e.
Explanation The cash balance will be $14 000 lower than expected, because the equipment was sold
for $2000 less than budgeted, and the purchase of the shelving for $12 000 was not
expected at all.
f.
Asset 1 Bank
Justification The sum of the variances means Bank will be $11 050 lower than budgeted.
Asset 2 Debtors Control / Prepaid rent / Shelving
Justification Less receipts from debtors may mean Debtors Control is higher than budgeted.
Greater prepaid rent / Shelving means these assets may be higher than budgeted.
Cambridge VCE Accounting Units 3 & 4 Teacher CD-ROM
© Simmons, Hardy 2006 Cambridge University Press 21
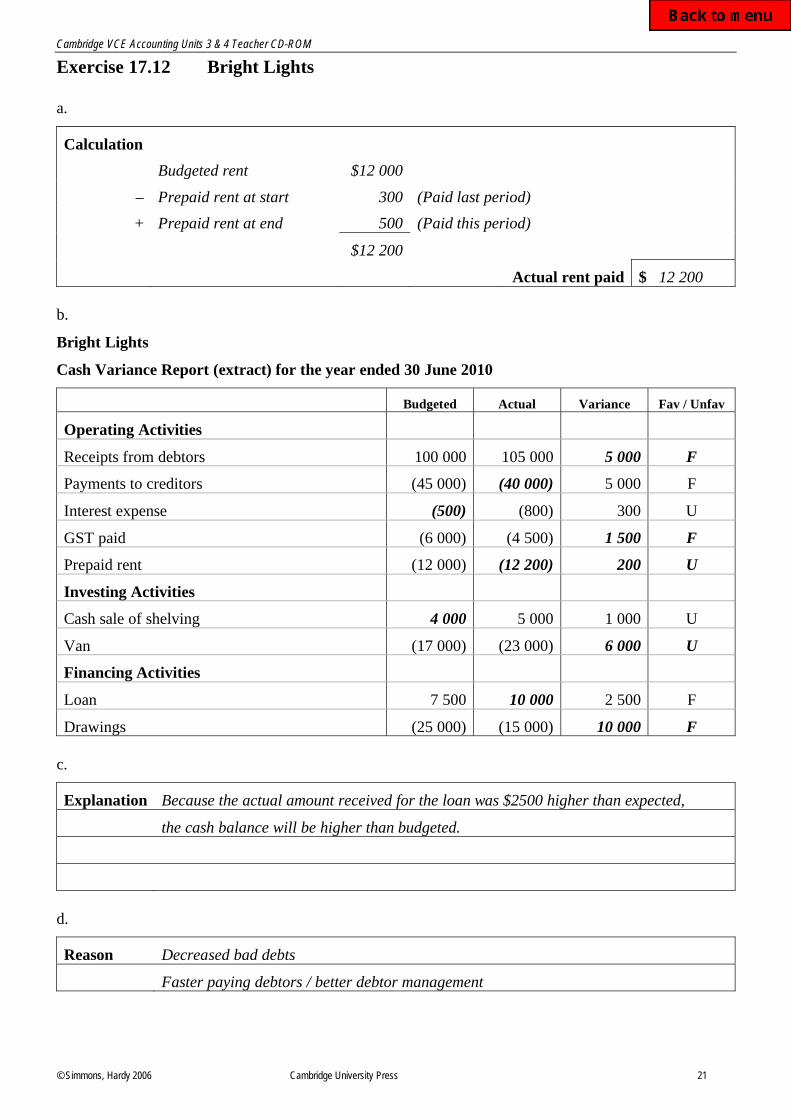
Exercise 17.12 Bright Lights
a.
Calculation
Budgeted rent $12 000
– Prepaid rent at start 300 (Paid last period)
+ Prepaid rent at end 500 (Paid this period)
$12 200
Actual rent paid $ 12 200
b.
Bright Lights
Cash Variance Report (extract) for the year ended 30 June 2010
Budgeted Actual Variance Fav / Unfav
Operating Activities
Receipts from debtors 100 000 105 000 5 000 F
Payments to creditors (45 000) (40 000) 5 000 F
Interest expense (500) (800) 300 U
GST paid (6 000) (4 500) 1 500 F
Prepaid rent (12 000) (12 200) 200 U
Investing Activities
Cash sale of shelving 4 000 5 000 1 000 U
Van (17 000) (23 000) 6 000 U
Financing Activities
Loan 7 500 10 000 2 500 F
Drawings (25 000) (15 000) 10 000 F
c.
Explanation Because the actual amount received for the loan was $2500 higher than expected,
the cash balance will be higher than budgeted.
d.
Reason Decreased bad debts
Faster paying debtors / better debtor management
Cambridge VCE Accounting Units 3 & 4 Teacher CD-ROM
© Simmons, Hardy 2006 Cambridge University Press 22
e.
Explanation The higher than expected loan could mean higher interest charges, and thus a lower
budgeted Net profit.
Cambridge VCE Accounting Units 3 & 4 Teacher CD-ROM
© Simmons, Hardy 2006 Cambridge University Press 23
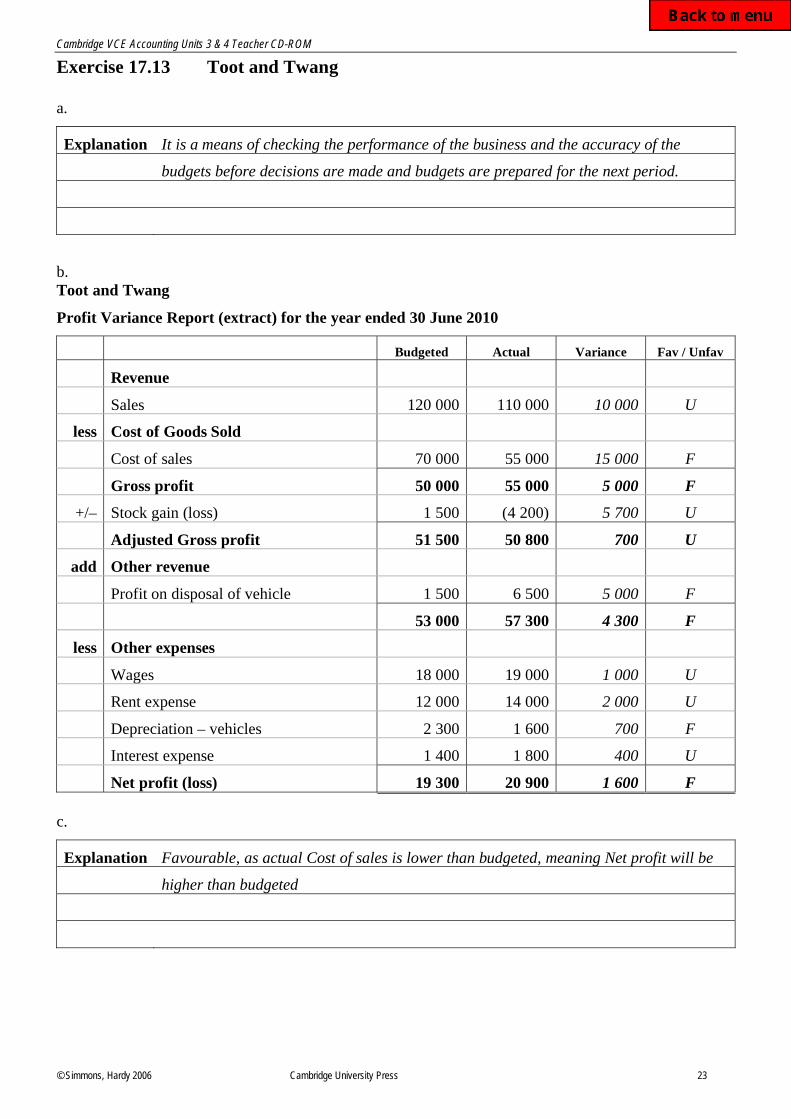
Exercise 17.13 Toot and Twang
a.
Explanation It is a means of checking the performance of the business and the accuracy of the
budgets before decisions are made and budgets are prepared for the next period.
b.
Toot and Twang
Profit Variance Report (extract) for the year ended 30 June 2010
Budgeted Actual Variance Fav / Unfav
Revenue
Sales 120 000 110 000 10 000 U
less Cost of Goods Sold
Cost of sales 70 000 55 000 15 000 F
Gross profit 50 000 55 000 5 000 F
+/– Stock gain (loss) 1 500 (4 200) 5 700 U
Adjusted Gross profit 51 500 50 800 700 U
add Other revenue
Profit on disposal of vehicle 1 500 6 500 5 000 F
53 000 57 300 4 300 F
less Other expenses
Wages 18 000 19 000 1 000 U
Rent expense 12 000 14 000 2 000 U
Depreciation – vehicles 2 300 1 600 700 F
Interest expense 1 400 1 800 400 U
Net profit (loss) 19 300 20 900 1 600 F
c.
Explanation Favourable, as actual Cost of sales is lower than budgeted, meaning Net profit will be
higher than budgeted
Cambridge VCE Accounting Units 3 & 4 Teacher CD-ROM
© Simmons, Hardy 2006 Cambridge University Press 24
d.
Reason Sold a vehicle (which was not replaced)
e.
Explanation Without the higher than expected profit on disposal of the vehicle, the profit variance
would have been unfavourable, and such a profit is unlikely to happen every period.
(Sales is lower than expected, yet some expenses have increased.)
Cambridge VCE Accounting Units 3 & 4 Teacher CD-ROM
© Simmons, Hardy 2006 Cambridge University Press 25
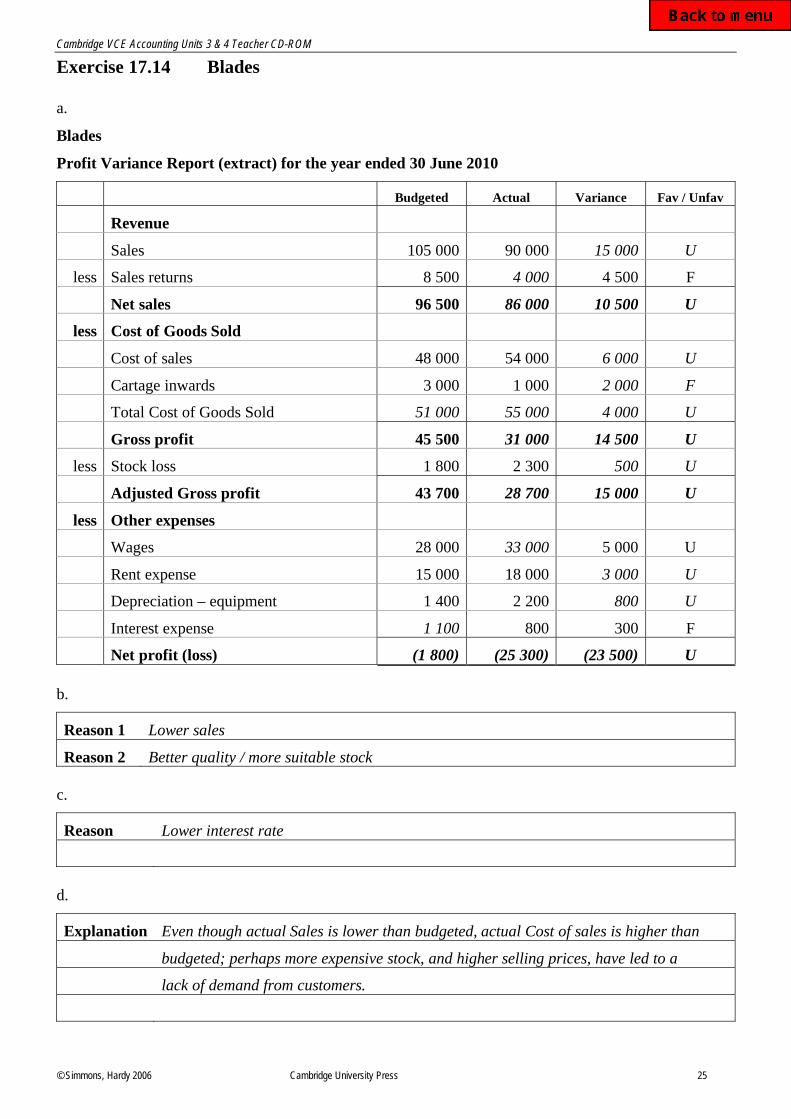
Exercise 17.14 Blades
a.
Blades
Profit Variance Report (extract) for the year ended 30 June 2010
Budgeted Actual Variance Fav / Unfav
Revenue
Sales 105 000 90 000 15 000 U
less Sales returns 8 500 4 000 4 500 F
Net sales 96 500 86 000 10 500 U
less Cost of Goods Sold
Cost of sales 48 000 54 000 6 000 U
Cartage inwards 3 000 1 000 2 000 F
Total Cost of Goods Sold 51 000 55 000 4 000 U
Gross profit 45 500 31 000 14 500 U
less Stock loss 1 800 2 300 500 U
Adjusted Gross profit 43 700 28 700 15 000 U
less Other expenses
Wages 28 000 33 000 5 000 U
Rent expense 15 000 18 000 3 000 U
Depreciation – equipment 1 400 2 200 800 U
Interest expense 1 100 800 300 F
Net profit (loss) (1 800) (25 300) (23 500) U
b.
Reason 1 Lower sales
Reason 2 Better quality / more suitable stock
c.
Reason Lower interest rate
d.
Explanation Even though actual Sales is lower than budgeted, actual Cost of sales is higher than
budgeted; perhaps more expensive stock, and higher selling prices, have led to a
lack of demand from customers.
Cambridge VCE Accounting Units 3 & 4 Teacher CD-ROM
© Simmons, Hardy 2006 Cambridge University Press 26
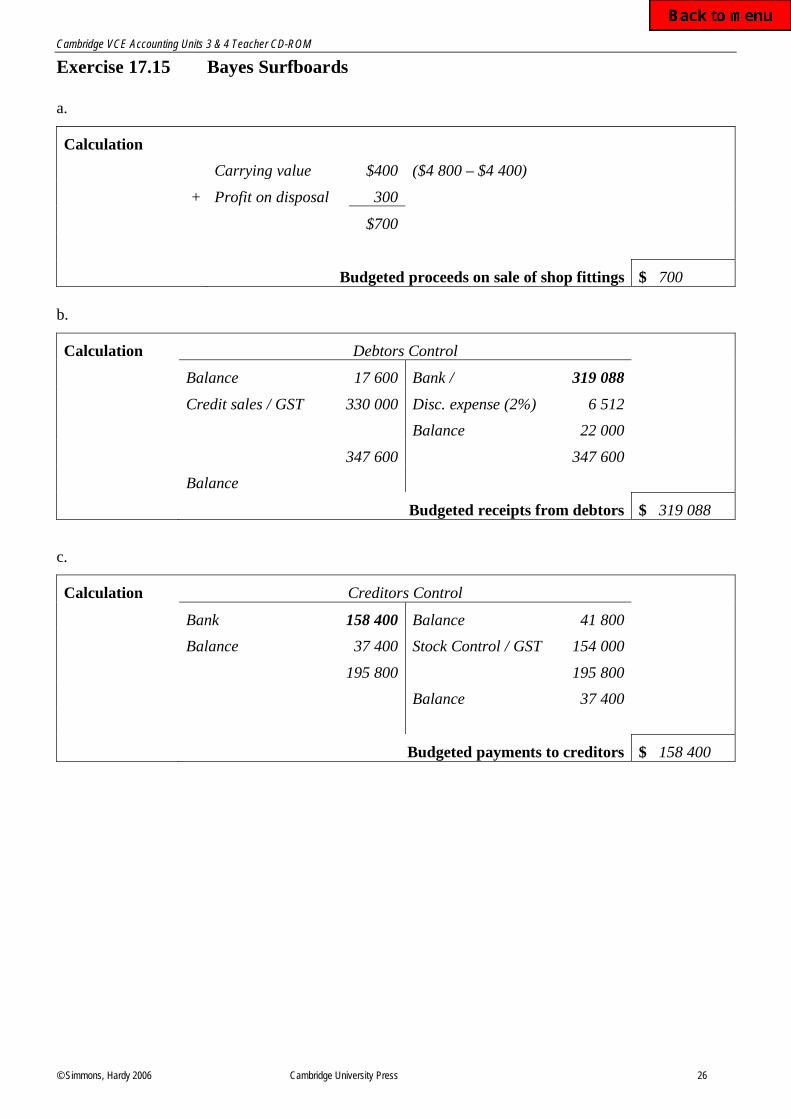
Exercise 17.15 Bayes Surfboards
a.
Calculation
Carrying value $400 ($4 800 – $4 400)
+ Profit on disposal 300
$700
Budgeted proceeds on sale of shop fittings $ 700
b.
Calculation Debtors Control
Balance 17 600 Bank / 319 088
Credit sales / GST 330 000 Disc. expense (2%) 6 512
Balance 22 000
347 600 347 600
Balance
Budgeted receipts from debtors $ 319 088
c.
Calculation Creditors Control
Bank 158 400 Balance 41 800
Balance 37 400 Stock Control / GST 154 000
195 800 195 800
Balance 37 400
Budgeted payments to creditors $ 158 400
Cambridge VCE Accounting Units 3 & 4 Teacher CD-ROM
© Simmons, Hardy 2006 Cambridge University Press 27
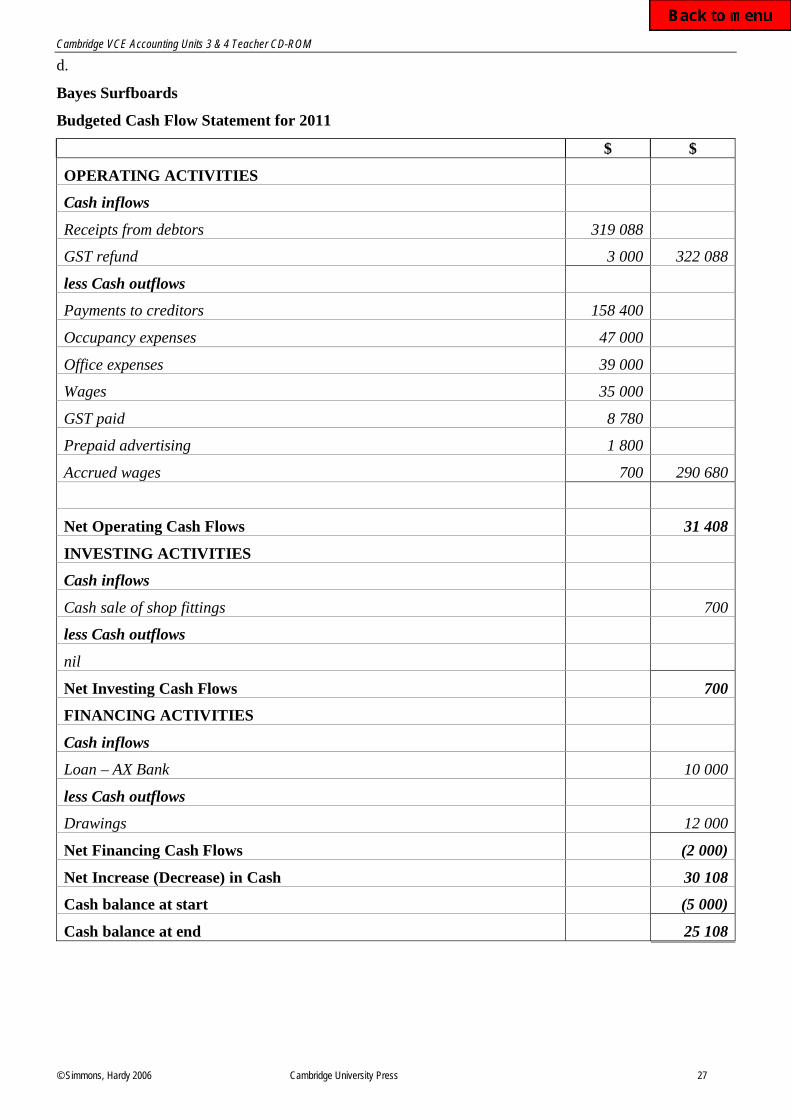
d.
Bayes Surfboards
Budgeted Cash Flow Statement for 2011
$ $
OPERATING ACTIVITIES
Cash inflows
Receipts from debtors 319 088
GST refund 3 000 322 088
less Cash outflows
Payments to creditors 158 400
Occupancy expenses 47 000
Office expenses 39 000
Wages 35 000
GST paid 8 780
Prepaid advertising 1 800
Accrued wages 700 290 680
Net Operating Cash Flows 31 408
INVESTING ACTIVITIES
Cash inflows
Cash sale of shop fittings 700
less Cash outflows
nil
Net Investing Cash Flows 700
FINANCING ACTIVITIES
Cash inflows
Loan – AX Bank 10 000
less Cash outflows
Drawings 12 000
Net Financing Cash Flows (2 000)
Net Increase (Decrease) in Cash 30 108
Cash balance at start (5 000)
Cash balance at end 25 108
Cambridge VCE Accounting Units 3 & 4 Teacher CD-ROM
© Simmons, Hardy 2006 Cambridge University Press 28
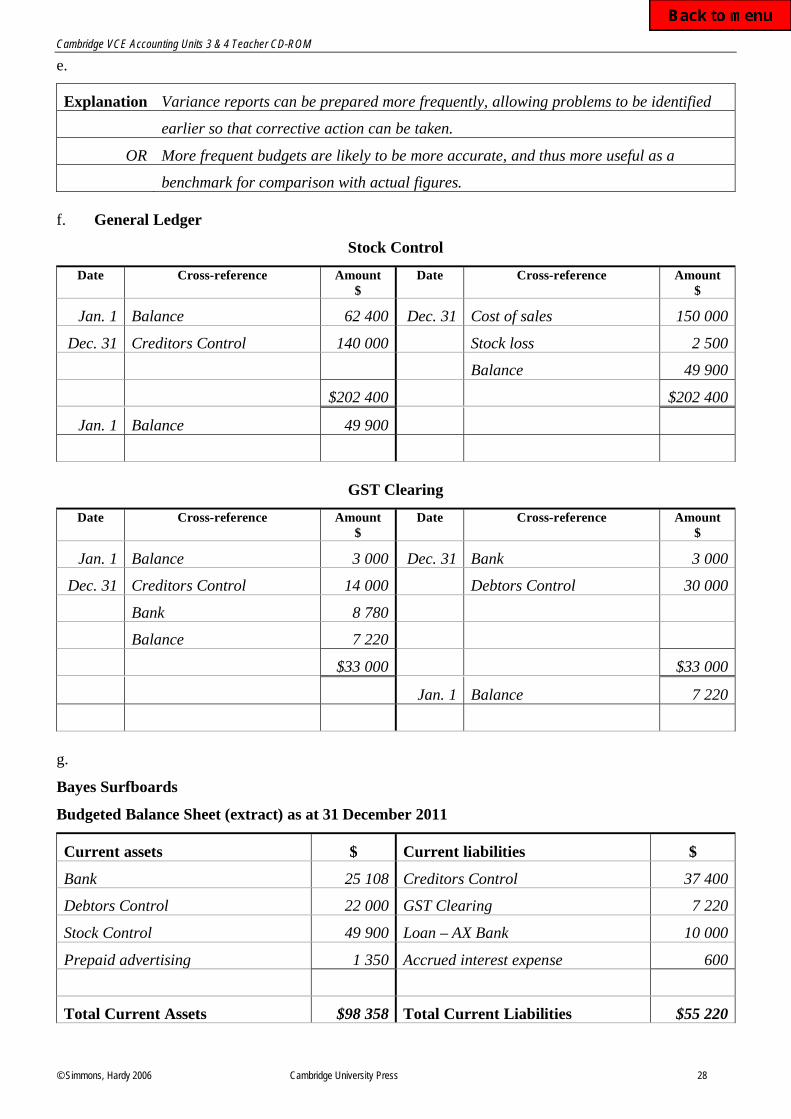
e.
Explanation Variance reports can be prepared more frequently, allowing problems to be identified
earlier so that corrective action can be taken.
OR More frequent budgets are likely to be more accurate, and thus more useful as a
benchmark for comparison with actual figures.
f. General Ledger
Stock Control
Date Cross-reference Amount
$
Date Cross-reference Amount
$
Jan. 1 Balance 62 400 Dec. 31 Cost of sales 150 000
Dec. 31 Creditors Control 140 000 Stock loss 2 500
Balance 49 900
$202 400 $202 400
Jan. 1 Balance 49 900
GST Clearing
Date Cross-reference Amount
$
Date Cross-reference Amount
$
Jan. 1 Balance 3 000 Dec. 31 Bank 3 000
Dec. 31 Creditors Control 14 000 Debtors Control 30 000
Bank 8 780
Balance 7 220
$33 000 $33 000
Jan. 1 Balance 7 220
g.
Bayes Surfboards
Budgeted Balance Sheet (extract) as at 31 December 2011
Current assets $ Current liabilities $
Bank 25 108 Creditors Control 37 400
Debtors Control 22 000 GST Clearing 7 220
Stock Control 49 900 Loan – AX Bank 10 000
Prepaid advertising 1 350 Accrued interest expense 600
Total Current Assets $98 358 Total Current Liabilities $55 220
Cambridge VCE Accounting Units 3 & 4 Teacher CD-ROM
© Simmons, Hardy 2006 Cambridge University Press 29
Exercise 17.16 Digital Masters
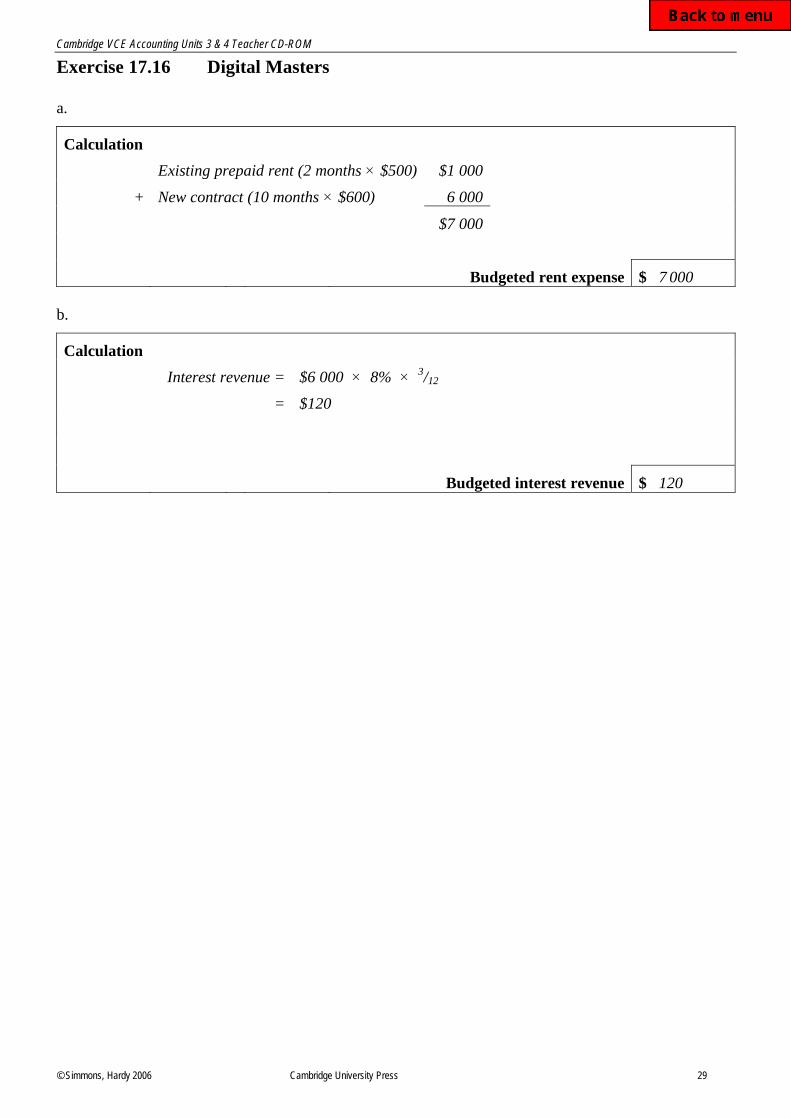
a.
Calculation
Existing prepaid rent (2 months $500) $1 000
+ New contract (10 months $600) 6 000
$7 000
Budgeted rent expense $ 7 000
b.
Calculation
Interest revenue = $6 000 8% 3/12
= $120
Budgeted interest revenue $ 120
Cambridge VCE Accounting Units 3 & 4 Teacher CD-ROM
© Simmons, Hardy 2006 Cambridge University Press 30
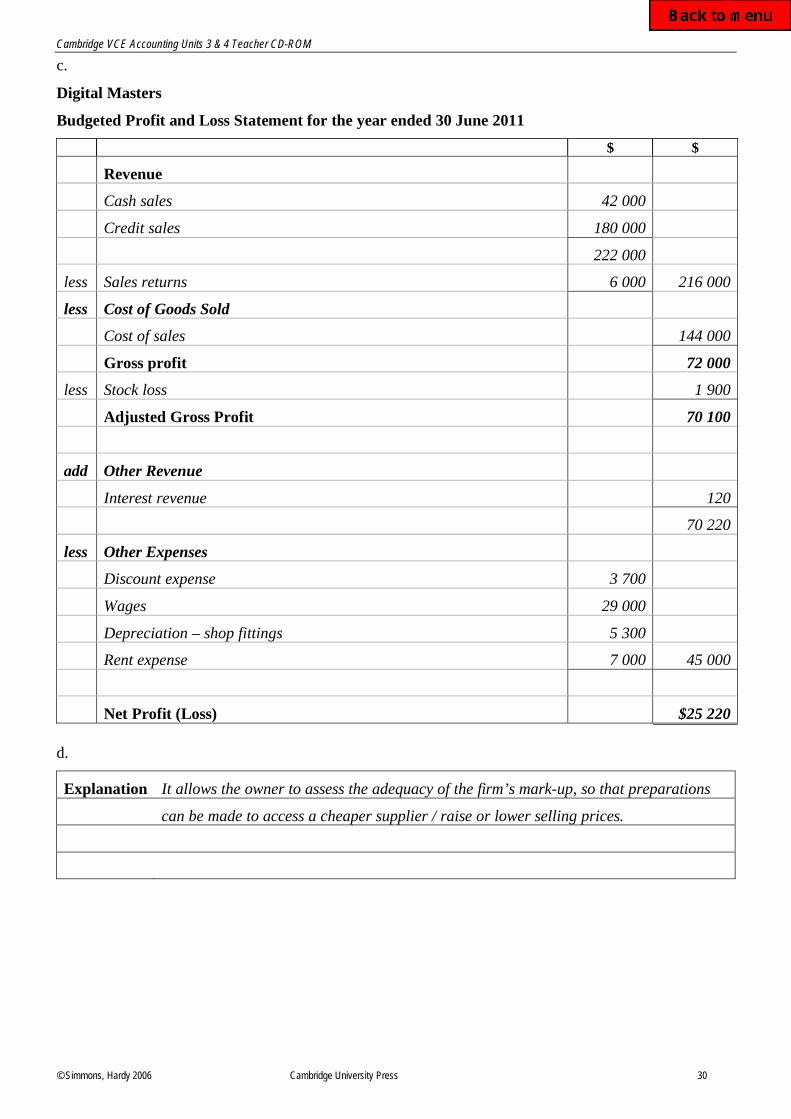
c.
Digital Masters
Budgeted Profit and Loss Statement for the year ended 30 June 2011
$ $
Revenue
Cash sales 42 000
Credit sales 180 000
222 000
less Sales returns 6 000 216 000
less Cost of Goods Sold
Cost of sales 144 000
Gross profit 72 000
less Stock loss 1 900
Adjusted Gross Profit
70 100
add Other Revenue
Interest revenue 120
70 220
less Other Expenses
Discount expense 3 700
Wages 29 000
Depreciation – shop fittings 5 300
Rent expense 7 000 45 000
Net Profit (Loss) $25 220
d.
Explanation It allows the owner to assess the adequacy of the firm’s mark-up, so that preparations
can be made to access a cheaper supplier / raise or lower selling prices.
Cambridge VCE Accounting Units 3 & 4 Teacher CD-ROM
© Simmons, Hardy 2006 Cambridge University Press 31
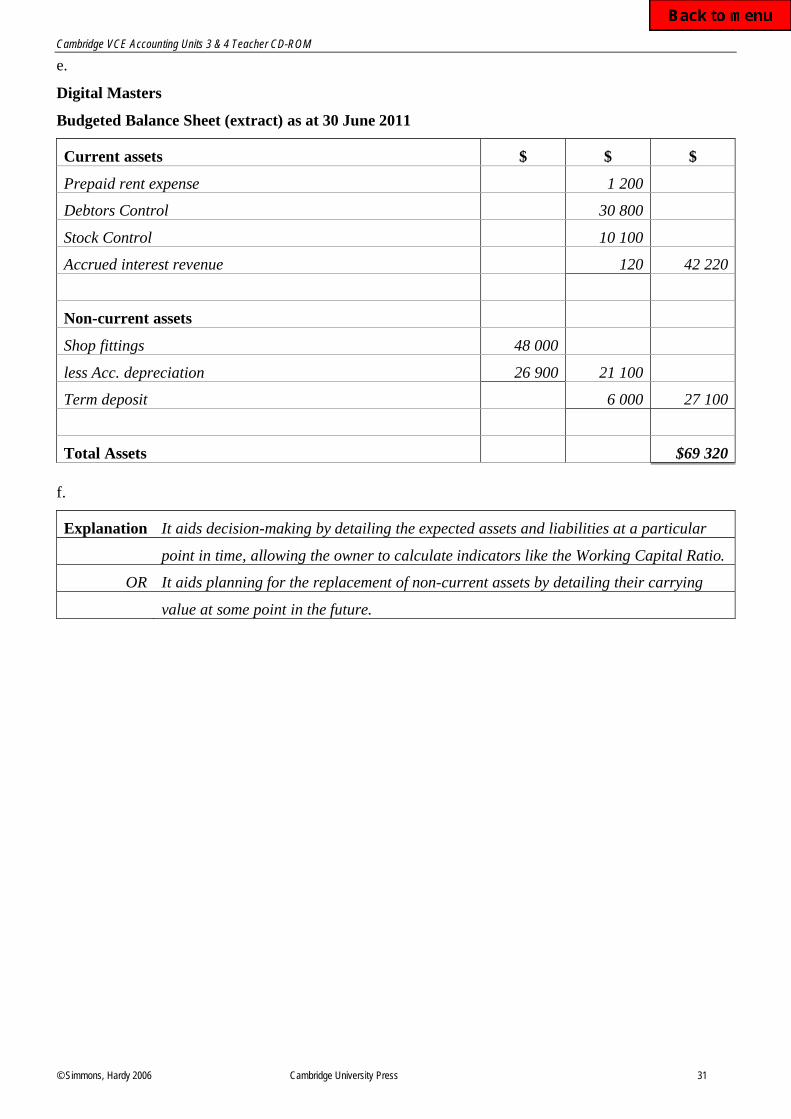
e.
Digital Masters
Budgeted Balance Sheet (extract) as at 30 June 2011
Current assets $ $ $
Prepaid rent expense 1 200
Debtors Control 30 800
Stock Control 10 100
Accrued interest revenue 120 42 220
Non-current assets
Shop fittings 48 000
less Acc. depreciation 26 900 21 100
Term deposit 6 000 27 100
Total Assets $69 320
f.
Explanation It aids decision-making by detailing the expected assets and liabilities at a particular
point in time, allowing the owner to calculate indicators like the Working Capital Ratio.
OR It aids planning for the replacement of non-current assets by detailing their carrying
value at some point in the future.