cameroon nutrition profile
TRANSCRIPT

CAMEROON NUTRITION
PROFILE(Unicef Cameroon data source)

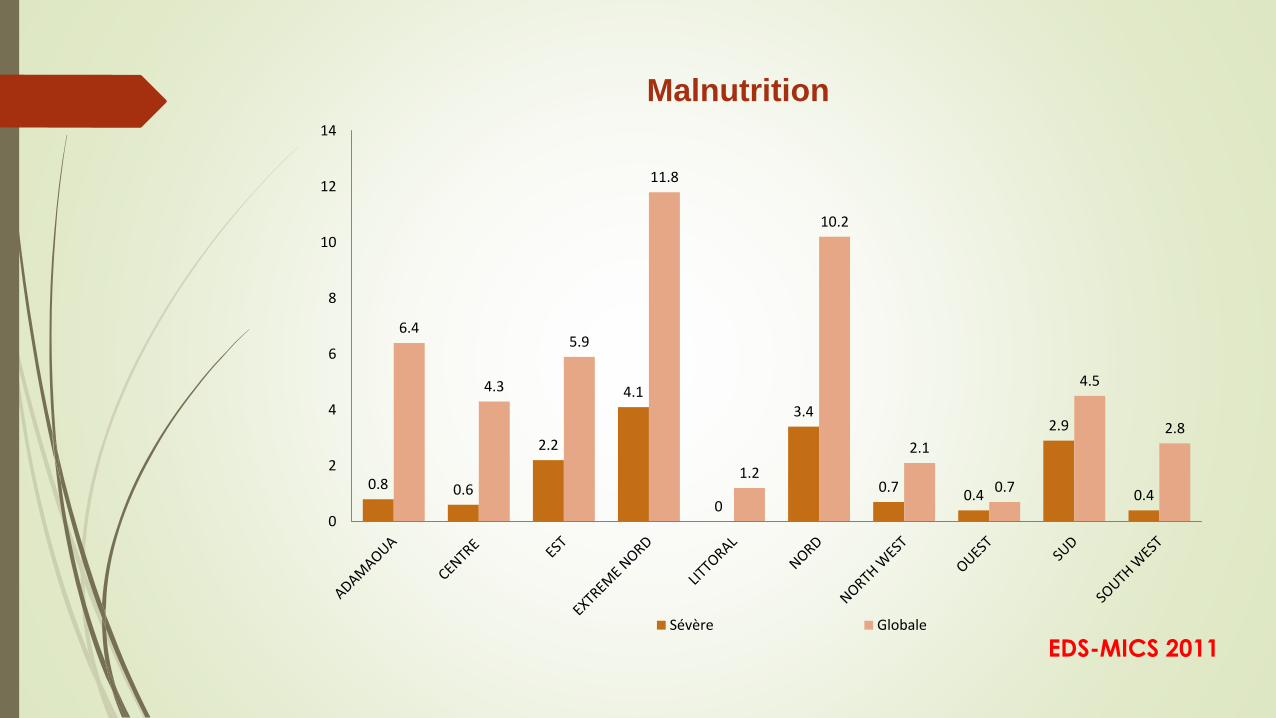
Malnutrition
Region MAG MAS MCG MCS IP
ADAMAOUA 6,4 0,8 39,8 18,2 20,8
CENTRE 4,3 0,6 23,4 8,5 8,3
EST 5,9 2,2 37,3 16,5 15,4
EXTREME
NORD11,8
4,144,9 25,5 31,6
LITTORAL 1,2 0 24,4 7,3 4,7
NORD 10,2 3,4 40,2 17,9 23,6
Nord ouest 2,1 0,7 35,6 14,4 7,1
OUEST 0,7 0,4 32 10,1 4,9
SUD 4,5 2,9 33,1 12,8 10,1
Sud ouest 2,8 0,4 27 8,1 8
Yaoundé 2,3 1,3 12,8 3,5 3,6
Douala 2,4 1,2 12,9 4,3 3,2
TOTAL 4,6 1,5 30,3 12,3 11,8
EDS-MICS 2011
Malnutrition
0.8 0.6
2.2
4.1
0
3.4
0.70.4
2.9
0.4
6.4
4.3
5.9
11.8
1.2
10.2
2.1
0.7
4.5
2.8
0
2
4
6
8
10
12
14
Sévère Globale
EDS-MICS 2011

Percentage of children <5 years
old suffering from:
Percentage of children<5 years
old underweight (WHO growth
standards)
Percentage of under-five stunted (WHO
growth standards)
EDS-MICS 2011
14
2118 19
15
0
5
10
15
20
25
1991DHS
1998DHS
2004DHS
2006MICS
2011MICS
%
24
29 32 3033
0
5
10
15
20
25
30
35
1991 DHS 1998 DHS 2004 DHS 2006MICS
2011MICS
%
32.5
14.6
5.6
0 20 40
Stunting
Underweight
Wasting
%
Nutritional status

Total population (000) 20 637 2012
Taux Mortalité Enfants Moins de 5 ans
Total underfive population (000) 3 468 2012
Total number of births (000) 711 2011
Under-five mortality rate (per 1000 live births) 63 2011
Total number of under-five deaths (000) 108 2011
Infant mortality rate (per 1000 live births) 62 2011
Neonatal mortality rate (per 1,000 live births) 31 2011
HIV prevalence rate (15-49 years, %) 4,3 2011
Population below international poverty line of 1.25 USD per day (%) 39,9 2007
IGME 2009, DHS 2011, SOWC 2012
149
131136
63
50: MDG target
0
20
40
60
80
100
120
140
160
1990 2008 2010 2011 2015
Demographics

Neonatal, 0.25
Malaria, 0.19
Orther, 0.17
Diarrheoa, 0.16
Pneumonia, 0.16
HIV/AIDS, 0.05 Trauma, 0.02 Measles, 0.01
Malnutrition
responsible for
38% of deaths
Causes of underfive mortality
WHO/CERG 2010

0%
10%
20%
30%
40%
50%
60%
70%
80%
90%
100%
0-1 2/3 4/5 6/8 9/11 12/17 18-23
Age en (mois)
Infant feeding practises, by age Weaned
Breastfed and solid/semisolid foods
Breastfed and other milk/formulas
Breastfed and non milk liquids
Breastfed and plain water only
Exclusively breastfed

7
12
2421 20
0
5
10
15
20
25
30
1991 DHS 1998 DHS 2004 DHS 2006 MICS 2011 MICS
Exclusively breastfeeding (percentage of infant<6 months exclusively breastfed)

92.796.9
89
97.691.4
0
20
40
60
80
100
120
2008 2009 2010 2011 2012
92.7
102.9 103.45 103.79
91.22
0
20
40
60
80
100
120
2008 2009 2010 2011 2012
Percentage of children 6-59 months receiving 2 doses of vitamine A during a calendar year
Percentage of children underfive receiving a tablet during biannual campaign
MICRONUTRIENTS
SASNIMs, SOWC 2012

Pregnancy
•Used of iron supplement: 80%
•Household consumption of iodized salt: 91%
Birth
•early initiation of breastfeeding 40%
• Infants not weighed at birth: 41%
0-5 months
•Exclusive breastfeeding 20%
6-12-23 months
• Timely introduction of complementary food (with breastfeeding) 65.9%
•Continued breastfeeding at 2 yrs: 77.9%
6,12-24-59 months
•Coverage of Vitamin A supplementation 91.4
•Deworming: 91.22
Essential nutrition interventions during the life cycle

4451
6882
40
60
0
10
20
30
40
50
60
70
80
90
Non pregnantwomen DHS 2004
Pregnant womenDHS 2004
preschool childrenDHS 2004
Children <5 DHS2004
women MICS2011
Children 6-59months MICS
2011
Prevalence of anemia among selected populations
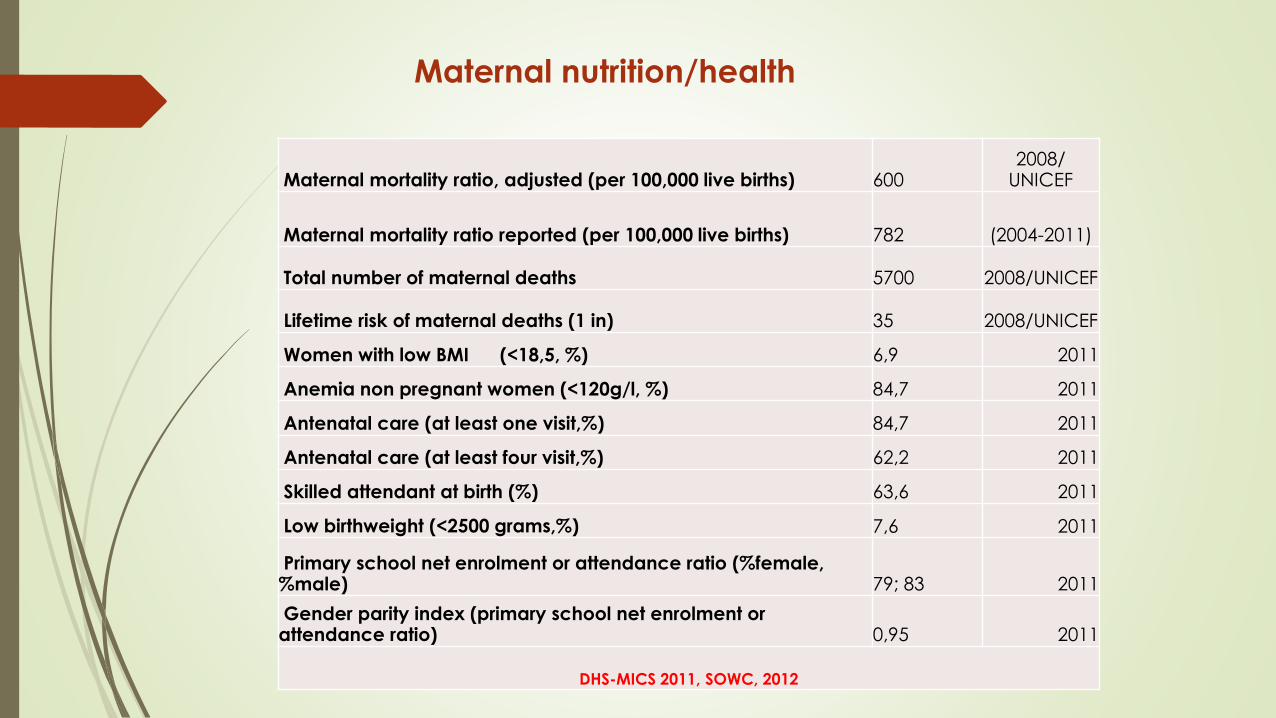
Maternal mortality ratio, adjusted (per 100,000 live births) 6002008/
UNICEF
Maternal mortality ratio reported (per 100,000 live births) 782 (2004-2011)
Total number of maternal deaths 5700 2008/UNICEF
Lifetime risk of maternal deaths (1 in) 35 2008/UNICEF
Women with low BMI (<18,5, %) 6,9 2011
Anemia non pregnant women (<120g/l, %) 84,7 2011
Antenatal care (at least one visit,%) 84,7 2011
Antenatal care (at least four visit,%) 62,2 2011
Skilled attendant at birth (%) 63,6 2011
Low birthweight (<2500 grams,%) 7,6 2011
Primary school net enrolment or attendance ratio (%female, %male) 79; 83 2011
Gender parity index (primary school net enrolment or attendance ratio) 0,95 2011
DHS-MICS 2011, SOWC, 2012
Maternal nutrition/health