campbell research & consulting - food standards australia new
TRANSCRIPT
CAMPBELL RESEARCH & CONSULTING PTY LTD ACN 073 813 144 ABN 29 073 813 144SUITE 2, 45 WATKINS STREET, NORTH FITZROY, VICTORIA 3068 PO BOX 441, CLIFTON HILL, VICTORIA 3068
PHONE (03) 9482 4216 FAX (03) 9482 6799 [email protected]
A report of two Australian surveys of food businessesacross the States and Territories of Australia
prepared for
The Australia New Zealand Food Authority
National Food Handling Benchmark
2000/2001
Report
December 2001

2000/2001 National Food Safety Report CR&C 0413Australia New Zealand Food Authority
Table of Contents1 Executive Summary .......................................................................................................... i2 Interpretive Summary of Findings ................................................................................... ii
2.1 Telephone (CATI) survey of food businesses ........................................................................... iii2.1.1 Temperature control ........................................................................................................... iii2.1.2 Receiving food ..................................................................................................................... iv2.1.3 Temperature probes............................................................................................................ iv2.1.4 Storing chilled food............................................................................................................. iv2.1.5 Holding hot food................................................................................................................. iv2.1.6 Cooling cooked food .......................................................................................................... iv2.1.7 Protecting food from contamination................................................................................. v2.1.8 Personal hygiene and staff illness....................................................................................... v2.1.9 Cleaning and sanitation........................................................................................................ v2.1.10Washing containers and utensils ........................................................................................ v2.1.11Chemical sanitisers .............................................................................................................. vi2.1.12Staff training and food safety information ...................................................................... vi2.1.13The new Food Safety Standards........................................................................................ vi
2.2 EHO/PHU On-site surveys among food businesses............................................................... vi2.2.1 Temperature control .......................................................................................................... vii2.2.2 Transporting potentially hot hazardous food................................................................ viii2.2.3 Protecting food from contamination.............................................................................. viii2.2.4 Personal hygiene .................................................................................................................. ix2.2.5 Staff illness............................................................................................................................. x2.2.6 Cleaning and sanitising ........................................................................................................ x2.2.7 General assessment of food businesses ............................................................................ x2.2.8 Food recall plans.................................................................................................................. xi2.2.9 Food safety programs ......................................................................................................... xi
2.3 Comparison between the two survey sample groups ............................................................... xi2.3.1 Business type ........................................................................................................................ xi
3 Reading this report......................................................................................................... xii3.1 Acronyms used in this report ..................................................................................................... xiii3.2 References ..................................................................................................................................... xiii
4 Background and Objectives of the Project .......................................................................14.1 Background to the Project ............................................................................................................. 14.2 Objectives of the Project ............................................................................................................... 24.3 Questionnaire development........................................................................................................... 24.4 Pilot ................................................................................................................................................... 3
5 Introduction to the project ............................................................................................... 45.1 Overview .......................................................................................................................................... 4
5.1.1 Telephone surveys................................................................................................................ 4

2000/2001 National Food Safety Report CR&C 0413Australia New Zealand Food Authority
5.1.2 On-site food business surveys ............................................................................................ 45.2 Methodology .................................................................................................................................... 4
5.2.1 Sample selection ................................................................................................................... 45.2.2 ANZFA involvement .......................................................................................................... 65.2.3 Telephone survey methodology ......................................................................................... 65.2.4 Telephone survey response rate results............................................................................. 65.2.5 EHO survey methodology.................................................................................................. 85.2.6 EHO survey response rates ................................................................................................ 95.2.7 Classification of Business Food Safety Risk (low, medium & high)........................... 10
5.3 Sampling error ............................................................................................................................... 11
6 Businesses involved in the National Food Handling Benchmark survey......................126.1.1 Business type ....................................................................................................................... 126.1.2 Manufacturing, processing, catering and transport food businesses .......................... 136.1.3 Food safety business classification................................................................................... 136.1.4 Food supplied off-site........................................................................................................ 146.1.5 Food types ........................................................................................................................... 156.1.6 Providing food to “at risk” consumer groups................................................................ 176.1.7 Location of business .......................................................................................................... 196.1.8 Business size ........................................................................................................................ 226.1.9 Risk classification and business type................................................................................ 246.1.10Type of respondent ............................................................................................................ 26
7 Telephone survey among food businesses .....................................................................277.1 Temperature control ..................................................................................................................... 27
7.1.1 Receiving hot and chilled food......................................................................................... 277.1.2 Thermometers..................................................................................................................... 297.1.3 Temperature check by business classification and business size................................. 307.1.4 Temperature controlled storage ....................................................................................... 357.1.5 Hot holding of food........................................................................................................... 387.1.6 Cooling................................................................................................................................. 407.1.7 Holding food at room temperature ................................................................................. 437.1.8 Ready to eat foods requiring refrigeration ...................................................................... 44
7.2 Protecting food from contamination ......................................................................................... 467.2.1 Food handling ..................................................................................................................... 46
7.3 Personal hygiene and staff illness................................................................................................ 497.3.1 Food handling ..................................................................................................................... 50
7.4 Cleaning and sanitation ................................................................................................................ 517.4.1 Washing containers and utensils ...................................................................................... 517.4.2 Chemical sanitisers ............................................................................................................. 52
7.5 Staff training................................................................................................................................... 547.6 Source of food safety information.............................................................................................. 57
7.6.1 Information about food safety ......................................................................................... 57

2000/2001 National Food Safety Report CR&C 0413Australia New Zealand Food Authority
8 EHO/PHU On-site surveys among food businesses ....................................................628.1 Temperature control ..................................................................................................................... 62
8.1.1 Receiving food .................................................................................................................... 638.1.2 Thermometers and checking temperature of food........................................................ 638.1.3 Checking food temperature .............................................................................................. 668.1.4 Temperature controlled storage of potentially hazardous food .................................. 678.1.5 Cooking potentially hazardous food................................................................................ 698.1.6 Hot holding of potentially hazardous food .................................................................... 708.1.7 Cooling cooked potentially hazardous food to correct temperature .......................... 728.1.8 Reheating cooked and cooled potentially hazardous food........................................... 738.1.9 Display ................................................................................................................................. 748.1.10Transport of potentially hazardous food ........................................................................ 75
8.2 Protecting food from contamination ......................................................................................... 788.2.1 Receiving food and protection from contamination..................................................... 798.2.2 Food storage and protection from contamination ........................................................ 808.2.3 Display and protection from contamination.................................................................. 818.2.4 Processing of food and protection from contamination .............................................. 838.2.5 Transport and protection from contamination.............................................................. 84
8.3 Personal hygiene and staff illness................................................................................................ 858.3.1 Hand washing facilities ...................................................................................................... 858.3.2 Clothing ............................................................................................................................... 908.3.3 Staff sickness policies......................................................................................................... 91
8.4 Cleaning and sanitising ................................................................................................................. 928.4.1 Commercial dishwashers ................................................................................................... 928.4.2 Domestic dishwashers ....................................................................................................... 938.4.3 Glass washers ...................................................................................................................... 948.4.4 Chemical sanitisers ............................................................................................................. 948.4.5 Manually sanitising using hot water ................................................................................. 95
8.5 General assessment ....................................................................................................................... 968.5.1 Equipment........................................................................................................................... 968.5.2 Cleaning & sanitation......................................................................................................... 978.5.3 Lighting & ventilation........................................................................................................ 988.5.4 Pest control.......................................................................................................................... 998.5.5 Chemical storage............................................................................................................... 100
8.6 Food recall plans ......................................................................................................................... 1018.7 Food safety programs ................................................................................................................. 102

2000/2001 National Food Safety Report CR&C 0413Australia New Zealand Food Authority
AppendicesAppendix A ...............................................................................................CATI questionnaireAppendix B............................................................... EHO questionnaire with briefing notesAppendix C ......................................................................... Attachments to the Survey: EHOAppendix D ......................................................Risk classification for specialised businessesAppendix E............................................................................................................ Pilot ReportAppendix F ..................................Sample procedures and Yellow Pages business categories
\\ironbark2\crc\jobs\413 food handling\reports\final report\413 food safety final ver26 with es.doc

2000/2001 National Food Safety Report CR&C 0413Australia New Zealand Food Authority
Index of TablesTable 1: Survey estimates of 50%, 60%, 80% and 90% at 95% confidence interval (CI) ........... 11
Table 2: Food type by business classification ..................................................................................... 16
Table 3: Providing food to “at risk” consumer groups by business classification ........................ 18
Table 4: Business types by regional location....................................................................................... 20
Table 5: Business classification by regional location.......................................................................... 20
Table 6: Regional location by state ....................................................................................................... 21
Table 7: Business type by state.............................................................................................................. 22
Table 8: Business type by business size ............................................................................................... 23
Table 9: Business size by regional location ......................................................................................... 24
Table 10: Business type by business classification................................................................................ 24
Table 11: State/ Territory by business classification............................................................................ 25
Table 12: Check temperature of delivered food by business classification and business size ....... 30
Table 13: Check temperature of delivered food by use of temperature probe................................ 31
Table 14: Temperature control for different types of food by business classification andbusiness size.............................................................................................................................. 33
Table 15: Check temperature of delivered food by staff knowledge and gender ofrespondent ................................................................................................................................ 34
Table 16: Temperature for chilled food storage by business classification and business size ....... 36
Table 17: Temperature for chilled food storage by staff knowledge and gender ofrespondent ................................................................................................................................ 37
Table 18: Temperature control for holding hot food by business classification andbusiness size.............................................................................................................................. 39
Table 19: Temperature for holding hot food by staff knowledge and gender................................. 39
Table 20: Cooling/Chilling cooked food by staff knowledge and gender........................................ 42
Table 21: Potentially hazardous food needing refrigeration by gender and region......................... 45
Table 22: Storing chilled potentially hazardous food by business classification and businesssize.............................................................................................................................................. 68
Table 23: Holding hot potentially hazardous food by risk classification and business size ........... 71
Table 24: Holding hot potentially hazardous food by temperature probe, region andwritten food safety program................................................................................................... 71
Table 25: Hand wash facilities by business classification and business size ..................................... 86
Table 26: Preparation and processing raw food by safety program, sickness policies andregion ....................................................................................................................................... 103

2000/2001 National Food Safety Report CR&C 0413Australia New Zealand Food Authority
Index of FiguresFigure 1: Description of business........................................................................................................... 12
Figure 2: Manufacturing or processing of food ................................................................................... 13
Figure 3: Business classification ............................................................................................................. 14
Figure 4: Business supplies food off-site............................................................................................... 14
Figure 5: Providing food to “at risk” consumer groups ..................................................................... 17
Figure 6: State location of business........................................................................................................ 19
Figure 7: Rural/regional and metro ....................................................................................................... 19
Figure 8: Small business........................................................................................................................... 23
Figure 9: Title of respondent .................................................................................................................. 26
Figure 10: Delivery of temperature sensitive food ................................................................................ 28
Figure 11: Frequency of checking temperature of delivered food ...................................................... 28
Figure 12: Temperature probe.................................................................................................................. 29
Figure 13: Method for checking temperature of delivered food ......................................................... 32
Figure 14: Food types to check temperature when delivered .............................................................. 32
Figure 15: Storing chilled food ................................................................................................................. 35
Figure 16: Temperature for storing chilled food.................................................................................... 35
Figure 17: Holding hot food ..................................................................................................................... 38
Figure 18: Temperature for holding hot food........................................................................................ 38
Figure 19: Cooking food and cooling for re-use.................................................................................... 40
Figure 20: Temperature and time for safely cooling cooked food...................................................... 41
Figure 21: Safely cooling large amounts of cooked food ..................................................................... 41
Figure 22: Safely leaving potentially hazardous food at room temperature....................................... 43
Figure 23: Ready-to-eat foods needing refrigeration............................................................................. 44
Figure 24: Gloves and food handling ...................................................................................................... 46
Figure 25: Wearing gloves for multiple food handling tasks................................................................ 47
Figure 26: Handling raw vegetables and cooked food.......................................................................... 48
Figure 27: Food handling: touching food and cleaning utensils.......................................................... 49
Figure 28: Safe food handling and staff illness....................................................................................... 50
Figure 29: Method of washing containers and utensils......................................................................... 51
Figure 30: Temperature of final rinse in dishwasher............................................................................. 52
Figure 31: Hand washing and food safety............................................................................................... 52
Figure 32: Use chemical sanitiser ............................................................................................................. 53
Figure 33: Mixing chemical sanitisers ...................................................................................................... 53
Figure 34: Detergent and micro-organisms ............................................................................................ 54

2000/2001 National Food Safety Report CR&C 0413Australia New Zealand Food Authority
Figure 35: Sanitising chopping boards..................................................................................................... 54
Figure 36: Staff training ............................................................................................................................. 55
Figure 37: Type of staff training............................................................................................................... 55
Figure 38: Sources of food safety information....................................................................................... 57
Figure 39: Ease of locating food safety information............................................................................. 58
Figure 40: Usefulness of information about food safety ...................................................................... 59
Figure 41: Informed about current food safety regulation................................................................... 60
Figure 42: Awareness of new Food Safety Standards ........................................................................... 60
Figure 43: Food delivered outside business hours................................................................................. 63
Figure 44: Probe thermometer ................................................................................................................. 64
Figure 45: Use of probe thermometer..................................................................................................... 64
Figure 46: Methods for checking food temperature.............................................................................. 65
Figure 47: Staff checks the temperature of potentially hazardous food delivered to thebusiness ..................................................................................................................................... 66
Figure 48: Potentially hazardous frozen food is frozen upon delivery............................................... 66
Figure 49: Chilled potentially hazardous food stored at or below 5°C .............................................. 67
Figure 50: Adequate space for potentially hazardous food in cool room.......................................... 68
Figure 51: Potentially hazardous food cooked at correct temp for correct amount of time........... 69
Figure 52: Hot potentially hazardous food held at correct temperature ............................................ 70
Figure 53: Appropriate equipment for holding hot potentially hazardous food............................... 70
Figure 54: Cooling cooked potentially hazardous food to correct temperature ............................... 72
Figure 55: Cooked and cooled potentially hazardous food is reheated rapidly................................. 73
Figure 56: Potentially hazardous food on display is held at the correct temperature....................... 74
Figure 57: Potentially hazardous food transported................................................................................ 75
Figure 58: Type of potentially hazardous food transported................................................................. 75
Figure 59: Method of transporting chilled potentially hazardous food ................................................ 76
Figure 60: Maximum time of transporting chilled potentially hazardous food ................................... 76
Figure 61: Method for transporting hot potentially hazardous food ................................................... 77
Figure 62: Maximum time for transporting hot potentially hazardous food ...................................... 77
Figure 63: Potentially hazardous food transported at appropriate temperature ............................... 78
Figure 64: Delivery of food outside business hours.............................................................................. 79
Figure 65: Protecting delivered food from contamination................................................................... 79
Figure 66: Raw food separated in cool room ......................................................................................... 80
Figure 67: Adequate space for potentially hazardous food in cool room.......................................... 80
Figure 68: Protected from contamination in cool room....................................................................... 80
Figure 69: Dry goods protected from contamination ........................................................................... 81

2000/2001 National Food Safety Report CR&C 0413Australia New Zealand Food Authority
Figure 70: Dry goods free from pests...................................................................................................... 81
Figure 71: Protection of displayed food.................................................................................................. 81
Figure 72: Displayed ready-to-eat food supervised by staff ................................................................. 82
Figure 73: Food removed from display mixed with new food ............................................................ 82
Figure 74: Separate equipment used for raw & ready-to-eat food?..................................................... 83
Figure 75: Hands are not used to handle food....................................................................................... 83
Figure 76: Gloves are changed ................................................................................................................. 83
Figure 77: Hand washing........................................................................................................................... 84
Figure 78: Wound covering....................................................................................................................... 84
Figure 79: Transport of food .................................................................................................................... 84
Figure 80: Sufficient hand washing facilities........................................................................................... 85
Figure 81: Accessible hand washing ........................................................................................................ 85
Figure 82: Staff wash their hands in designated facilities ..................................................................... 87
Figure 83: Soap or hand cleanser supplied ............................................................................................. 88
Figure 84: Warm running water available ............................................................................................... 88
Figure 85: Single use towels supplied ...................................................................................................... 89
Figure 86: Recent use of hand washing facilities ................................................................................... 89
Figure 87: Staff wash & dry hands correctly........................................................................................... 90
Figure 88: Staff wear clean outer clothing .............................................................................................. 90
Figure 89: Personal clothing storage........................................................................................................ 90
Figure 90: Policy for unwell staff ............................................................................................................. 91
Figure 91: Use commercial dishwasher to wash and sanitise............................................................... 92
Figure 92: Correct sanitising temperature ............................................................................................... 92
Figure 93: Domestic dishwasher to sanitise eating & drinking utensils ............................................. 93
Figure 94: Domestic dishwasher at correct temp .................................................................................. 93
Figure 95: Glass washer to sanitise eating & drinking utensils ............................................................ 94
Figure 96: Glass washers operate at correct temperature ..................................................................... 94
Figure 97: Chemical sanitisers used ......................................................................................................... 94
Figure 98: Appropriate use of sanitisers.................................................................................................. 94
Figure 99: All equipment sanitised manually .......................................................................................... 95
Figure 100: Sanitising temperature is 77°C or above ............................................................................. 95
Figure 101: Record of temperature ............................................................................................................ 95
Figure 102: Adequate equipment for food preparation .......................................................................... 96
Figure 103: Utensils are clean & sanitised................................................................................................. 97
Figure 104: Overall business is clean ......................................................................................................... 98
Figure 105: Identify problem areas ............................................................................................................ 98
2000/2001 National Food Safety Report CR&C 0413Australia New Zealand Food Authority
Figure 106: Adequate lighting for food preparation................................................................................ 98
Figure 107: Adequate ventilation for food preparation .......................................................................... 98
Figure 108: Premises free of pests.............................................................................................................. 99
Figure 109: Has pest control ....................................................................................................................... 99
Figure 110: Chemicals are stored safely................................................................................................... 100
Figure 111: Wholesale/ Manufacturers/ Importers have food recall plan ........................................ 101
Figure 112: Has written food safety program......................................................................................... 102

2000/2001 National Food Safety Benchmark CR&C 0413Australia New Zealand Food Authority Page i
1 Executive SummaryThis National Food Handling Benchmark study documents research on the awareness and knowledgeof safe food handling practices and actual food handling practices by food businesses within Australia.The Australia New Zealand Food Authority (ANZFA) commissioned Campbell Research &Consulting to conduct the benchmark study, which was undertaken between February and May 2001.
The National Food Handling Benchmark study was conducted to support one of six activitiesidentified in the ANZFA Evaluation Strategy. These activities aim to collect baseline data either priorto adoption of new food standards or during the transition period from the old Food Standards Codeto the new Australia New Zealand Food Standards Code (new Code). These baseline data will be usedby ANZFA as a benchmark to evaluate the impact of implementing new regulatory measures on keystakeholders.
The Australia New Zealand Food Standards Council agreed in July 2000 that three national FoodSafety Standards be included in the new Code. Previously, each State and Territory had their ownregulations. The Australian States and Territories are currently adopting these standards into theirlegislation. At the time of this survey, no State or Territory had adopted the new standards. The FoodSafety Standards do not apply in New Zealand.
The National Food Handling Benchmark study was undertaken by means of telephone survey ofmanagers of food businesses and an observational on-site survey of food businesses by environmentalhealth officers and public health unit officers. Questionnaires for each survey were developed aroundkey result areas identified in the new Food Safety Standards such as temperature control, preventingcontamination, cleaning and sanitation and personal hygiene and health of food handlers. In addition,data were sought on common sources of information and training on safe food handling practices, aswell as on the use of written food recall plans and food safety programs.
An interpretative summary of results from the telephone survey and observational survey is presented,followed by the results from each survey. Results have been analysed against a number of variables,including the priority classification of the business (level of risk relating to handling of potentiallyhazardous food and the customer base).
The research indicates that there is a relatively high level of awareness and knowledge of basic safefood handling practices in food businesses, though the theoretical knowledge did not always matchactual practices on–site. Food businesses with written food safety programs more often undertookcorrect safe food handling procedures than those with no written program. The businesses withwritten programs tended to be large, high risk businesses. Results in the key areas of protection offood from contamination and personal hygiene indicate that there is a significant minority ofbusinesses that lack knowledge on these issues, particularly amongst medium or low risk businessesand small businesses.

2000/2001 National Food Safety Benchmark CR&C 0413Australia New Zealand Food Authority Page ii
2 Interpretive Summary of FindingsIn July 2000, the Australia New Zealand Food Standards Council agreed to the inclusion of threeFood Safety Standards in the Australia New Zealand Food Standards Code (Standards 3.1.1, 3.2.2 and3.2.3). The three standards contain requirements relating to food safety practices, premises andequipment. The States and Territories are currently adopting these standards into their legislationcommencing with New South Wales on May 16th 2001. They will replace existing State and Territoryhygiene regulations. The Food Safety Standards do not apply in New Zealand.
In order to evaluate the impact of the changes, the Australia New Zealand Food Authority (ANZFA)has commissioned Campbell Research & Consulting to conduct benchmark measures of foodhandling practices in Australian food businesses prior to the commencement of the new standards.This Australian Food Safety Benchmark has two primary objectives. These objectives are to provideseparate independent measures of:
the level of awareness of safe food handling practices, using a Computer AssistedTelephone Interview (CATI) with the owners and managers of 1,200 food businesses; and
the extent to which safe food handling practices are used in food businesses through anon-site survey by Environmental Health Officers or Public Health Unit Officers (referredto as EHOs) of 483 food businesses.
Both surveys included questions on areas of food safety where compliance with required standards orregulations are important indicators in preventing foodborne illness, for example, temperature controlof potentially hazardous food. However, substantially different sampling techniques and surveyinstruments were used.
The telephone (CATI) survey explored knowledge and awareness of food businesses, while the EHOsurvey used the expertise of EHOs to evaluate actual practices used by food businesses. The EHOsurvey measured adherence with specific practices, and also identified whether the business had analternative system to meet safe food handling requirements outlined in the new Food Safety Standards.However, the EHOs were not able to observe all practices in the course of the one hour site visits.The observed/ not observed status of the responses was recorded, and is reported throughout thisreport where appropriate. Even so, the validity of the EHOs survey responses would be considered tobe more rigorous than the CATI responses because of the EHOs ability to probe for appropriateevidence.
Questionnaires for the surveys were developed around four of the five key result areas identified in thenew standards:
temperature control; prevention from contamination; cleaning; and sanitation; and personal hygiene and staff sickness policy.
In addition the questionnaires identified: information sources used by food businesses (CATI); training issues (CATI); food recall plans (EHO); and food safety programs (EHO).
Both surveys were pilot tested before full enumeration. The pilot included substantial input fromANZFA to achieve a survey instrument that provided baseline measures against which the

2000/2001 National Food Safety Benchmark CR&C 0413Australia New Zealand Food Authority Page iii
implementation of the new standards could be evaluated, as well as providing relevant information forjurisdictions and EHOs.
Businesses in both surveys were classified using the Priority Classification System (PCS) to enableanalysis of results by high, medium or low risk business. The PCS has been developed by ANZFA inconsultation with Senior Food Officers from each State and Territory. The PCS classifies foodbusinesses into priority ratings based on the risk that the business presents to public health and safety.The system was intended for use by EHOs in the field and uses a short cut manual assignment ofpriority rating according to a table of business types. The PCS classified businesses as high, mediumor low risk according to a scoring system based on the food type, intended customer use, activity ofthe business, method of processing and customer base. The PCS also specifies criteria for classifyingbusinesses as ‘large’ or ‘small’.
This was the first time the PCS had been trialed in a survey where results were electronically coded.Some modifications to the questions were required for this purpose.
It is important that the classification system be applied consistently in all jurisdictions once Standard3.2.1 Food Safety Programs is implemented in States and Territories in Australia.
Some comparison has been made to provide a contrasting perspective. However, comparisons between the two surveysshould be used with caution because there were different instruments, modes of enumeration, sample frames and samplesizes.The benchmark measures in this report are pre-implementation measures. The CATI survey wasconducted in February 2001 and the EHO survey from February- May 2001, prior to adoption by anyState or Territory of the new Food Safety Standards. Evaluation of the effectiveness of the FoodSafety Standards and the impact of the strategies developed to improve awareness of safe foodhandling in Australian food businesses will be undertaken by ANZFA at a later date.
2.1 Telephone (CATI) survey of food businesses
The CATI survey measured awareness of food safety practices in food businesses and the extent ofknowledge of persons in supervisory positions in these businesses. There were four key areas of foodsafety that were the focus of the survey:
temperature control and knowledge of temperatures and times for safe food handlingpractices;
protection of food from contamination; personal hygiene and staff illness; and cleaning and sanitation.
Most food businesses knew about, and implemented, safe food handling practices. However, therewas a small, but substantial, proportion of businesses (between 10% and 20%) that did not knowcorrect food handling practices or were not implementing the practices. The majority of this groupcomprised persons who did not know the answer to the detailed questions. The proportion that gaveincorrect answers (in contrast to “did not know”) was relatively low (around 5% of businesses).
Personal hygiene and approaches to staff illness were the areas of most concern.
2.1.1 Temperature controlKnowledge of temperature control during the transport, preparation and storage of food is critical inmaintaining safe food practices. The survey identified the proportion of food businesses engaged in

2000/2001 National Food Safety Benchmark CR&C 0413Australia New Zealand Food Authority Page iv
these different activities. Further, the survey tested knowledge using a number of specific questionsthat identified awareness of measures and conditions associated with unsafe practices.
Knowledge of specific temperatures and times for storage or cooking of potentially hazardous foodindicated room for improvement. Mostly, respondents did not know the detail of specific temperatureand times required for safe food handling and some also gave incorrect responses. For example, one infive (21%) food businesses did not know (15%) or incorrectly stated (6%) the temperature at whichchilled food should be stored.
However, the EHO survey found businesses were generally using practices in receiving, storing,cooking, displaying and holding hazardous food that provided safe systems for temperature and time.The EHOs found that only 7% did not have a system in place for ensuring that chilled food wasstored safely.
This suggests that specific knowledge is not necessarily a good indicator of adherence to safe foodhandling practices.
It should be kept in mind when considering the low levels of awareness of specific technicalinformation reported in the CATI survey, that the EHO survey found that safe practices were beingimplemented.
2.1.2 Receiving foodNearly all (87%) businesses had temperature sensitive foods delivered to their premises. Most (77%)of these businesses at least occasionally checked the temperature of foods delivered. Larger foodbusinesses, which tended to be higher risk, were more likely to check food temperature.
2.1.3 Temperature probesHaving a temperature probe was an indicator that businesses had a higher awareness of the need tocheck temperatures of delivered food, and was associated with a higher likelihood of appropriate safepractice. One quarter (24%) of businesses that had temperature sensitive food delivered, and whoreported that they checked the temperature of food that was delivered, did not have a probethermometer. Large high-risk businesses were more likely to have a probe thermometer. Businesseswere much more likely to check the temperature of chilled or frozen items delivered than hot foods.
2.1.4 Storing chilled foodNearly all food businesses (92%) store chilled food. One in five businesses storing chilled food eitherdid not know the temperature at which chilled food should be stored or incorrectly reported thatchilled food should be stored higher than 5ºC. Businesses were more likely not to know (15%) than tore give a wrong temperature answer (5%).
2.1.5 Holding hot foodFour in ten (38%) businesses needed to hold hot food for periods of time. One quarter (23%) ofthese businesses, either “did not know” the correct temperature (19%) or stated a temperature lowerthan 60ºC (4%) (temperatures below 60ºC are too low for safely holding hot food). One in five (17%)businesses did not know how long cooked potentially hazardous food (meant to be served hot) couldbe safely left at room temperature. Only 1% mentioned a time that was not safe.
2.1.6 Cooling cooked foodThree in ten (31%) businesses reported that they cooked food and cooled it for later re-use. One inten (10%) businesses that cooled cooked food for later re-use did not know that large amounts of foodshould be placed in small containers and put in a cool room or refrigerator for cooling. A further two

2000/2001 National Food Safety Benchmark CR&C 0413Australia New Zealand Food Authority Page v
in ten (19%) incorrectly said that this should not be done. A separate question about cooked riceidentified that two in ten (19%) did not consider it necessary to keep cooked rice in the refrigerator.
2.1.7 Protecting food from contaminationPoor staff hygiene and lack of policies about staff illness are the aspects of food handling thatultimately lead to high risk of contamination. There was a relatively high proportion of staff whoperceived that they could safely touch some forms of food. Two in ten (21%) businesses surveyedincorrectly believed that it was safe for food handlers to directly touch bread. These were more likelyto be low risk businesses (29%), and businesses where staff training was not implemented (30%). Thisfinding was supported by the EHO survey. Food handlers may wear gloves to prevent foodcontamination, but wearing gloves is not an assurance of safe food handling practices. A relativelyhigh proportion of staff did not wear gloves (22%). Very few (2% - 4%) indicated that gloves werenot changed between different tasks.
General knowledge about safe food handling practices was directly proportional to the level of stafftraining and risk category of the business. High risk businesses that catered to vulnerable populationswere more likely to have staff training programs, to have displayed correct knowledge about foodsafety issues and to have implemented safe food handling practices (e.g. were more likely to have useda temperature probe).
Some gender differences were also observed. Females, who were more likely to be holding juniorpositions within food businesses, had a lower level of knowledge about safe food handling practices.
2.1.8 Personal hygiene and staff illnessThere were poor practices and knowledge of washing and sanitising procedures. Half of foodbusinesses thought it would be acceptable for employees experiencing diarrhoea to undertake foodhandling tasks such as “handling unpackaged food”, “serving food” or “setting the table”.
2.1.9 Cleaning and sanitationThe CATI survey identified poor knowledge and practices of cleaning and sanitising. The EHOsurvey identified a higher proportion of unsafe practices in regard to cleaning and sanitising thanidentified in the CATI survey. This was an exception to the general findings that safe practices werebeing implemented despite an apparent lack of awareness and knowledge from the CATI survey forsome businesses.
2.1.10 Washing containers and utensilsThe most frequent method of cleaning containers and utensils was washing by hand. The majority ofbusinesses (59%) only washed by hand, while a further quarter (24%) used a dishwasher in combinationwith hand washing.
There was a high proportion of businesses with poor knowledge of temperatures for safe washingpractices. This was the case for both hand and machine washing.
One third (36%) of businesses that used hand washing for food preparation materials did not knowthe temperature at which hot water would kill bacteria on utensils. One quarter of business reportedhand washing at temperatures below 70°C, though it should be noted that using hot water above 70°Chand washing has occupational health and safety implications. Use of a dishwasher is preferable.
There was a substantial proportion that did not know key elements of safe practices for the use ofdishwashers. One third (35%) did not know the temperature of the final rinse of their dishwasher.One in ten (9%) reported temperatures below 70°C.

2000/2001 National Food Safety Benchmark CR&C 0413Australia New Zealand Food Authority Page vi
2.1.11 Chemical sanitisersBusinesses are required under the new Food Safety Standards to ensure utensils and food contactsurfaces are clean and sanitary. Chemical sanitisers may be used to achieve this outcome. One quarter(24%) of businesses “never” used a chemical sanitiser for washing cups, plates and eating utensils.Three in ten (30%) believed that all chemical sanitisers should be mixed with hot water and one half(51%) correctly indicated this was false. Two in ten (18%) businesses incorrectly believed that“detergent would kill micro-organisms”.
2.1.12 Staff training and food safety informationOne quarter (26%) of businesses reported that they did not provide training for staff on food handlingsafety. Businesses that were less likely to provide staff training external to the workplace were morelikely to be low risk, rural and not supplying to vulnerable groups.
One quarter (24%) of businesses did not find it easy to locate information on food safety.
The majority of food businesses used their “local council” (47%) or “State and Territory HealthDepartment” (42%) when they needed information about food safety issues. The third mostfrequently mentioned point of call was “industry associations and specialist consultants” (24%).
Neither ANZFA nor the Internet was identified as sources of food safety information.
One third of businesses reported the “most useful” information came from “food safety authorities”(30%), including food safety inspectors, or “food safety brochures and magazines” (27%).
Most (80%) of businesses felt informed about current food safety regulations. Few businesses (5%)reported they felt they were “not informed” about food safety.
2.1.13 The new Food Safety StandardsThree in five (57%) businesses were aware of the new Food Safety Standards.
2.2 EHO/PHU On-site surveys among food businesses
While the CATI survey measured knowledge and awareness of the businesses, the EHO surveymeasured actual practice, based on observation during a site visit. The observation provided strongervalidity measures by using the skills of the experienced Environmental Health and Public Health UnitOfficers to establish the baseline measures. These personnel are trained in food hygiene and conductinspections of food practice as part of their everyday work.

2000/2001 National Food Safety Benchmark CR&C 0413Australia New Zealand Food Authority Page vii
The EHO Survey included the four key areas covered by the CATI survey: temperature control; protection of food from contamination; personal hygiene and staff illness; and cleaning and sanitation.
In addition the EHOs made a general assessment of each business and identified the extent to whichformal policies were in place for food safety and recall of unsafe food.
2.2.1 Temperature controlThe key measures assessed by EHOs for safe practices relating to temperature control related to:
receiving food; storing chilled and holding hot food; cooking food; cooling cooked food; reheating cooled food; transporting food; and displaying food.
The EHO survey was also able to identify where businesses had alternative systems to ensure safefood handling practices.
ThermometersTemperature checking was frequently done using “practical” or “common sense” approaches ratherthan formally checking. This is reflected in the relatively low proportion of businesses (39%) withprobe thermometers.
Six in ten (60%) businesses handling food that should be checked with a probe thermometer did nothave a probe thermometer. Staff did not know how to use a temperature probe thermometer in onein ten (9%) businesses that reported they had a probe thermometer. Six in ten (57%) businesses used“sight” when assessing food temperatures. Four in ten (43%) businesses used “touch” as a methodfor checking the temperature of food.
In spite of the lack of formal measures, businesses were generally found to have safe food handlingpractices in regard to temperature control. A small proportion of businesses were not assessed ashaving safe food handling practices. Apart from checking the temperature of received food, theproportion of businesses without a safe system was less than 10%. It is these businesses that shouldbe the focus of any campaign to improve food-handling practices. Specific areas of concern identifiedinclude:
Receiving food. Nearly all businesses evaluated by the EHOs received potentially hazardousfood. One in three (35%) of businesses checked the temperature of potentially hazardousfood delivered to their businesses, four in ten (39%) used an alternative system to ensurethat food delivered to their business was safe while two in ten (21%) did not check thetemperature or use an alternative system.
Storing chilled food. One in ten businesses (7%) neither stored their chilled food at or below5°C or had an alternative system High risk businesses were more likely to store chilled foodat the correct temperature than medium risk businesses.

2000/2001 National Food Safety Benchmark CR&C 0413Australia New Zealand Food Authority Page viii
Holding hot food. One in ten (8%) businesses, where hot food was held, did not holdpotentially hazardous food at the correct temperature. Few (4%) businesses holding hotfood lacked the adequate equipment for holding hot food.
Cooking potentially hazardous food. Most food businesses checked that potentially hazardousfood was cooked at the correct temperature for the correct time (53%) or had an alternativesystem in place (33%). One in ten had no system at all.
Cooling cooked food. 10% did not have a system for cooling cooked food safely.
Reheating cooled food. 6% had no system for ensuring that cooked food is reheated safely.
Displaying food. One in ten (9%) businesses displaying potentially hazardous food did nothave it held at the correct temperature or have an alternative system for ensuring foodsafety.
2.2.2 Transporting potentially hazardous foodA total of seven in ten (72%) businesses surveyed transported food. Three in ten (28%) of businessestransporting food also transported potentially hazardous food. Chilled food was more likely to betransported. Eight in ten (81%) businesses transporting potentially hazardous food carried chilledfood; and half (51%) carried hot food – one third (34%) transported both hot and cold food.Three in ten (29%) businesses transporting chilled potentially hazardous food used a “refrigeratedvehicle” and one quarter (25%) used “eskies with ice”. Very few (3%) did not use a temperature-controlled vehicle or other device that would keep the food at 5ºC or below. Most businessestransporting chilled food did so for short periods of time with only one in ten (10%) transporting foodfor longer than four hours.In contrast, there was a high proportion of businesses that transported hot food without using a“temperature controlled vehicle” or “temperature controlling tools” (42%). Hot food was transportedfor shorter periods than chilled foods. 94% of hot food was transported for less than one hour whileonly 75% of chilled food was transported for less than one hour.One in ten (12%) businesses transporting potentially hazardous foods (chilled or hot) were not doingso at the correct temperature and did not have an alternative system in place. These alternativesystems may use time as a control. For example, restricting the time taken to transport food.
2.2.3 Protecting food from contaminationThe majority of food businesses protected food from contamination. However, a small proportiondid not. Specific issues identified by the EHOs included:
More than one in ten (14%) businesses that used a cool room did not adequately protecttheir food in the cool room from contamination.
One in ten (8%) businesses storing raw food in the cool room did not have raw foodseparated from “ready-to-eat food”.
One in twenty (6%) businesses handling dry goods did not have adequate protection fromcontamination of their dry goods and one in twenty (4%) appeared to have pests in theirdry goods area.
Just under one in ten (8%) businesses that had food on display did not adequately protectthat food from contamination.
One in seven (15%) businesses with food on display which needed to be supervised, didnot have staff supervising displayed ready-to-eat food.

2000/2001 National Food Safety Benchmark CR&C 0413Australia New Zealand Food Authority Page ix
When displayed food was removed from display, over one in ten (14%) businesses mixedthe displayed food with new food for storage to be re-served the next day.
One in ten (9%) businesses did not separate the equipment used for preparing raw andready-to-eat food preparation or clean and sanitise that equipment between uses.
One in twenty (6%) businesses where staff handled ready-to-eat food with hands ratherthan utensils such as tongs were at risk of contamination from staff directly touching food.
Businesses may use gloves as an everyday practice to prevent food contamination. However, wearinggloves is not sufficient to completely protect food from contamination; gloves may actually increasethe risk of contamination if incorrectly used. Gloves should be changed when moving from one taskto the next and on the same occasions when hands should be washed. One in ten (9%) staff whowore gloves did not change gloves when necessary.
2.2.4 Personal hygieneStaff personal hygiene is critical in minimising the spread of foodborne disease. The survey addressedactual practices of personal hygiene as well as examining the adequacy of the hand washing facilities.Adequate facilities influenced the likelihood of good staff practices in regard to personal hygiene.While most food businesses were found to have staff following good personal hygiene practices, onein ten (9%) had staff who did not wash their hands when necessary and one in twenty (6%) had staffthat did not cover open wounds with waterproof dressings.The provision of appropriate hand washing facilities for staff handling food is critical to ensure staffcan maintain appropriate standards of personal hygiene. Just under one in five (17%) businesses didnot have sufficient hand washing facilities. One in ten businesses (10%) did not provide adequateaccess for employees, 7% did not supply soap or hand cleanser, 14% did not have warm runningwater, and 20% did not supply single use towels. Standard 3.2.2 indicates food handlers should usesoap or other effective means such as warm running water to wash their hands and thoroughly drytheir hands using a single use towel or in another way that will not transfer pathogenic organisms tothe hands.Just over one in ten (14%) food businesses with hand washing facilities did not show evidence ofrecent use of those facilities.

2000/2001 National Food Safety Benchmark CR&C 0413Australia New Zealand Food Authority Page x
2.2.5 Staff illnessOne fifth (21%) of businesses did not have a staff policy relating to staff sickness.
2.2.6 Cleaning and sanitisingCleaning and sanitising is an important aspect of food safety. Use of commercial or domesticdishwashers can help achieve safe practices. Only a minority of businesses used dish or glass washerswhere such facilities would have been appropriate. In a small proportion of cases, staff did not knowthe correct temperature required for effective sanitising using hot water.
DishwashersThree in ten (30%) businesses where a dishwasher was appropriate (i.e. businesses that needed to washutensils used for eating, drinking and food preparation) used a commercial dishwasher to wash andsanitise eating utensils. One in ten (12%) used a domestic dishwasher. Just under two in ten (16%)businesses used glass washers where a glass washer was appropriate to the business.One in ten (10%) commercial dishwashers were not working at the correct sanitising temperaturewhile two in ten (19%) domestic dishwashers were not working at the correct temperature.Staff were unsure of the correct sanitising temperature in 5% of businesses using a commercialdishwasher and 10% that used a domestic dishwasher.
SanitisingThree quarters (74%) of businesses used chemical sanitisers. When chemical sanitisers were used, onein ten (9%) did not use them appropriately.Nearly six in ten (57%) businesses used manual sanitising processes where manual sanitising wasappropriate. Nearly two thirds (60%) of businesses utilising manual sanitising processes did notmaintain the temperature of the hot water at the appropriate temperature (i.e. 77°C or above).Over one in ten (12%) businesses did not clean and sanitise food contact surfaces and utensils beforeusing them where it was appropriate to do so.
2.2.7 General assessment of food businessesThe final component of the EHO survey comprised a general assessment of the food businessessurveyed. 62% of EHO surveyed businesses were reported to have no problem areas. However, asmall proportion of businesses were identified as having problem areas:
one in ten (10%) food premises were not considered clean and well maintained; over one in ten (12%) businesses did not clean and sanitise food contact surfaces before
using utensils where such sanitation was appropriate; over one in ten (12%) EHO surveyed businesses identified food preparation, processing
and cooking areas as problematic; one in ten (10%) identified a cool room as a problem area; one in ten (10%) food premises showed evidence of pests; and one quarter (24%) did not have adequate pest control measures in place where such
controls were appropriate.

2000/2001 National Food Safety Benchmark CR&C 0413Australia New Zealand Food Authority Page xi
2.2.8 Food recall plansTwo thirds (66%) of businesses in the “wholesale/ manufacturing/ importing” sectors did not have awritten food recall plan. Businesses more likely to have a written food recall plans included high risklarger metropolitan businesses.
2.2.9 Food safety programsFood businesses are not currently required to have a food safety program. However, one in five(19%) were found to have written food safety programs. Businesses with food safety programs inplace were most likely to be classified as “ large businesses” and were more likely to have safe practiceschecking the temperature of food, owning a temperature probe and having a staff sickness policy andpest control program.
2.3 Comparison between the two survey sample groups
The sample for the two surveys was drawn to achieve a representative selection of food businesses.The sample for the CATI survey was randomly selected from the electronic Yellow Pages directoriesusing food business categories and filtered at the commencement of interview to ensure the businessmet the relevant specifications. The EHO survey was conducted using interviews with a randomselection of businesses in a random selection of 55 Local Government Areas (LGAs).
The EHO survey sample comprised primarily high and medium risk businesses with very few low riskbusinesses. This should be kept in mind when making comparisons with the CATI survey that had ahigher proportion of low risk businesses.
2.3.1 Business typeThe CATI and EHO samples contained similar types of business, which were proportionallydistributed across all States and Territories in both surveys. Just under two in ten businesses served orprovided food to “at risk” groups (CATI 17% and EHO 15%). One half of both CATI (52%) andEHO (50%) businesses surveyed were located in rural regions. The over-representation of rural foodbusinesses was a function of the sampling to ensure that sample segments were of sufficient size toenable confidence. In general, there was little difference by rural/ metropolitan region. Nine in tenCATI (93%) and EHO (90%) businesses surveyed were classified as “small businesses”.
Six in ten (60%) businesses in both surveys were medium risk. The EHO survey had a higherproportion of businesses that were classified as high risk (34%) compared to the CATI sample (15%).There were few (5%) businesses classified as low risk in the EHO survey with one in four (23%) of theCATI sample of the CATI sample were classified as low risk.

2000/2001 National Food Safety Benchmark CR&C 0413Australia New Zealand Food Authority Page xii
3 Reading this reportReading the tables
Questions are written in italics. Angle brackets <> around a word or phrase in the survey question indicate terms that may
be substituted in a CATI script. The base for each table is identified under the left hand column of the table. The base for each column is given in parentheses under the column header. “n/a” means that the particular cell is not applicable and no result can be reported. “-” means that there were no responses for the cell or the responses were too low to
provide a percentage. Subtotals are right justified and printed in parentheses. Proportions are rounded to the nearest whole percent.
A superscript capital letter in a column means that the survey estimate noted in thatcolumn is significantly greater (at the 95% confidence level) than comparable estimates
shown in the column(s) noted. The corresponding capital letters for comparison may befound in the column header.
Reading the graphs
The relevant survey questions are identified underneath the graph header. Each column is a percentage of the base. The base for the graphs refers to the total number of responses upon which the
percentages have been calculated. This is identified under the left hand corner of thegraph.
DisclaimerPlease note that, in accordance with our Company’s policy, we are obliged to advise that neither theCompany nor any member nor employee undertakes responsibility in any way whatsoever to anyperson or organisation (other than Australia New Zealand Food Authority) in respect of informationset out in this report, including any errors or omissions therein, arising through negligence orotherwise however caused.

2000/2001 National Food Safety Benchmark CR&C 0413Australia New Zealand Food Authority Page xiii
3.1 Acronyms used in this report
ANZFA Australia New Zealand Food Authority.
CATI Computer Assisted Telephone Interview.
EHO Environmental Health Officers (includes NSW Public HealthUnit Officers).
LGA Local Government Area.
PCS Priority Classification System. A system developed by ANZFA torank food businesses by exposure to risk.
PHU Public Health Unit.
SFO Senior Food Officers.
3.2 References
Australia New Zealand Food Authority. (ANZFA). (2001). Food Safety: The priority classification systemfor food businesses.
Australia New Zealand Food Authority. (ANZFA). (2001). Safe Food Australia 2nd edition. January2001: A Guide to the Food Safety Standards

2000/2001 National Food Safety Benchmark CR&C 0413Australia New Zealand Food Authority Page 1
4 Background and Objectives of the Project
4.1 Background to the Project1
There are four national Food Safety Standards. The Australia New Zealand Food Authority(ANZFA) developed these standards in consultation with State and Territory health authorities, thefood industry, and other interested organisations and individuals.
The four Food Safety Standards are: 3.1.1 Interpretation and Application; 3.2.1 Food Safety Programs; 3.2.2 Food Safety Practices and General Requirements; and 3.2.3 Food Premises and Equipment.
In July 2000, the Australia New Zealand Food Standards Council2 agreed to the adoption of Standards3.1.1, 3.2.2 and 3.2.3. These Food Safety Standards form part of the Australia New Zealand FoodStandards Code. They apply only in Australia.
The Australia New Zealand Food Standards Council had previously deferred consideration of thefourth standard, Standard 3.2.1 Food Safety Programs, and requested further study of the efficacy of theseprograms for a range of food businesses. Pending the results of this work, the Council agreed inNovember 2000 that Standard 3.2.1 should be adopted as a voluntary standard. It did so as someStates planned to proceed with the introduction of food safety programs without waiting for theresults of the study requested earlier by the Australia New Zealand Food Standards Council.
As a voluntary standard, Standard 3.2.1 Food Safety Programs will apply only in those States or Territoriesthat choose to implement this standard.
Standards 3.1.1, 3.2.2 and 3.2.3 become enforceable from February 2001, depending on the regulatorysituation in each State and Territory. The notification provision and the requirement that foodhandlers and supervisors have food safety skills and knowledge commensurate with their duties withinthe food business, both in Standard 3.2.2, come into effect from February 2002 to give businesses timeto comply with these requirements.
The Food Safety Standards will replace existing State and Territory food hygiene regulations. Theseregulations were nationally inconsistent and tended to be prescriptive and sometimes significantly outof date. They presented businesses with unnecessary costs and difficulties. In addition, they includedrequirements that could not be justified in terms of public health and safety.
The new standards reflect international best practice. Taken together, they are based on a preventativeapproach to the incidence of foodborne illness in Australia and are designed to help ensure that foodbusiness in Australia produce food that is safe to eat.
1 From Safe Food Australia 2nd edition, ANZFA, January 2001, p. 12 Ministers of Health from the States, Territories and Commonwealth of Australia and from New Zealand meet as
the Australia New Zealand Standards Council to approve food standards for Australia and New Zealand.

2000/2001 National Food Safety Benchmark CR&C 0413Australia New Zealand Food Authority Page 2
4.2 Objectives of the ProjectThe objectives of the study were to establish benchmark measures within Australian food business of:
the level of awareness and knowledge of safe food handling practices; and the extent to which safe food handling practices are used.
Two different methodologies were used to achieve these objectives.
1. A telephone survey of 1,200 food business owners or managers; and
2. An on-site survey of 483 food businesses conducted by Environmental Health Officers orPublic Health Unit Officers.
The telephone survey measured the level of awareness and the on-site survey measured the extent towhich safe food practices were applied.
Campbell Research & Consulting was commissioned to undertake the two surveys as part of anevaluation strategy to assess the effectiveness of the new Food Safety Standards. The current projectprovides benchmark, baseline data of knowledge prior to implementation of new food regulations thatprescribe safe food handling practices. Over the next few years ANZFA will conduct additionalsurveys to monitor change in food handling practices over time.
The questions in the current surveys are designed to measure broadly the key areas of safe foodhandling as outlined in the new Food Safety Standards (see Safe Food Australia, 2nd edition, ANZFA,January 2001), and target businesses handling potentially hazardous food.
The project was not conducted as a part of any formal inspection or enforcement regime, and theinformation gained will be used to inform future policy decisions and adjustments to the Food SafetyStandards setting system.
4.3 Questionnaire development
Questionnaires were developed around four of the five key result area identified in the new standards.These are:
temperature control; prevention from contamination; cleaning, sanitation and some testing; and personal hygiene and staff sickness policy.
In addition the questionnaires identified: information sources used by food businesses (CATI); training issues (CATI); food recall plans (EHO); and food safety programs (EHO).

2000/2001 National Food Safety Benchmark CR&C 0413Australia New Zealand Food Authority Page 3
4.4 Pilot
Prior to full enumeration, a pilot study for both the telephone and on-site EHO surveys wasconducted. A separate report was produced to summarise the methodological procedural outcomesfrom the pilot study for both the telephone and on site EHO surveys encompassing:
testing of project methodology; testing of flow, organisation and length of telephone and EHO surveys; and telephone interviewer and EHO feedback.
A copy of the full pilot report is included in Appendix E of this report.

2000/2001 National Food Safety Benchmark CR&C 0413Australia New Zealand Food Authority Page 4
5 Introduction to the project
5.1 Overview
5.1.1 Telephone surveysThe aim of the telephone survey was to obtain benchmark data on the extent to which food business“owners / managers3” were aware of safe food handling practices prior to implementation of the newFood Safety Standards. The questions were designed to assess the level of general knowledge aboutfood safety and food handling prior to implementation of the new Food Safety Standards.The telephone survey was designed to be implemented across a broad range of food service and foodbusiness types, and among “owners / managers” who were directly involved in overseeing thehandling and processing of food, particularly potentially hazardous food4.
5.1.2 On-site food business surveysThe aim of the EHO survey was to obtain benchmark data on the extent to which safe food handlingpractices were already being carried out within food businesses prior to implementation of the newFood Safety Standards. The questions were designed to be answered by Environmental HealthOfficers who have a high degree of specialist food handling knowledge. Owners, managers orsupervisors from the business could assist with the survey, but the intention was for the questions tobe answered based on what the surveying officer observed within the premises. (N.B. A note has beenadded in the text where a practice was not observed at the time of the survey).The EHO survey was designed to be conducted across a broad range of food service and foodbusiness categories taken from the electronic Yellow Pages. The sample of businesses was randomlyselected from food business categories where food regulations were likely to apply to achieve arepresentative national sample.
5.2 MethodologyPrior to the full scale project, pilot surveys were conducted with a sample of businesses using both theCATI and EHO methodologies. A full copy of the pilot report, including a detailed methodologysection, has been included in Appendix G of this report. The information presented here in Section5.2 outlines the methodology for the final project.
5.2.1 Sample selectionFor both the CATI and EHO surveys random lists of businesses were generated from the electronicYellow Pages. For the purposes of this project, food businesses were defined as:
Business directly involved in handling potentially hazardous food intended for human consumption.Medium to high risk businesses were targeted over low risk businesses (based on the ANZFApriority classification system). Manufacturers of flavourings, mixers, processing agents andbusinesses solely involved in storage or transport of pre-packaged foods (e.g. potato chips or softdrinks) were excluded from the surveys:
3 Target respondents were persons responsible for managing staff directly involved in food handling. In most small
businesses this was the owner/proprietor.4 Potentially hazardous food includes: cooked and raw meat, fish, egg, chicken and other poultry, desserts with
dairy or egg ingredients, rice and pasta salads, as well as other prepared salads.

2000/2001 National Food Safety Benchmark CR&C 0413Australia New Zealand Food Authority Page 5
Business categories utilised from the Yellow Pages for generating the sample selection can be found inAppendix H.
To obtain a nationally representative sample, target samples were stratified across States andTerritories and LGAs (Local Government Areas) in proportion to the population as follows:
Target Sample stratification by State and Territory
State / Territory CATI targetsample
EHO targetsample
Target LGAs(EHOs)
NSW 240 120 12
VIC 240 120 12
QLD 240 120 12
SA 160 80 8
WA 160 80 8
TAS 80 40 4
NT 40 30 3
ACT 40 30 1
Total 1200 620 60
Sixty-four (64) LGAs were selected for the EHO surveys with an expectation that ten (10) surveyswould be returned from sixty (60) of the LGAs. Of these sixty-four LGAs, 483 surveys from fifty-five(55) LGAs were actually received.
The exclusion of low risk businesses resulted in a sample bias toward high risk businesses includinghospitals and childcare centres.
In addition, butchers and small goods manufacturers were commonly not included in the EHOsurveys. In many States and Territories the monitoring of meat based businesses was reported to beundertaken by a separate authority and the EHOs and PHUs did not feel able or comfortable withsurveying these businesses. In some cases the surveying officer called the business to seek permissionand in others they contacted the meat authority and went to the business together. However due tolimited resources within LGAs, it was not always seen as appropriate to survey outside the‘jurisdiction’ and thus, including these businesses was not common with only 5% of the EHO surveysconducted with businesses in the meat industry. Individual EHOs used their discretion regardingwhether or not they were able to survey any butchers or small goods manufacturers, and we are unableto account for frequency of exclusion as LGAs may not have informed us of a decision to eitherinclude or exclude these businesses.

2000/2001 National Food Safety Benchmark CR&C 0413Australia New Zealand Food Authority Page 6
5.2.2 ANZFA involvementAt the commencement of the project ANZFA established a project team with members external toANZFA to supplement the knowledge and expertise of ANZFA team members and the consultant.The team comprised representatives from State government (NSW, Queensland and Victoria), thefood industry (the Australian Food and Grocery Council and the Restaurant & Caterers Association)and the Food Policy Unit of the Commonwealth Department of Health and Aged Care.
ANZFA was involved at key points of the project including: formulating the questionnaires and briefing materials and obtaining comments and
suggestions on these materials from the Project Team; keeping the Project Team and Senior Food Officers of all States and Territories informed
of the progress of the project; assisting to obtain cooperation from LGAs; clarifying issues with LGAs and answering queries raised during the surveys by individual
EHOs; responding to queries from surveyed businesses; and seeking comments and suggestions from the Project Team on the reports of the pilot
surveys and the mains surveys.
In particular, ANZFA was instrumental in liasing with the States and Territories, as well as individualEHOs to gain co-operation for participating in the survey. At various points a representative fromANZFA provided progress summary to the Senior Food Officers.
5.2.3 Telephone survey methodologyAn electronic file of the Yellow Pages random business list was generated and telephone interviewerscalled businesses until target samples were achieved for each State and Territory. Individual targetswere not set for metropolitan and rural and regional businesses rather the allocation of businesses wasrandomised.
Interviewers were briefed extensively on definitions of terminology and the meaning of questions,however they were also instructed not to guide businesses into ‘correct’ responses. This wasparticularly important in undertaking a benchmark survey of this type where depth of knowledge andunderstanding were key measures. Hence, the survey identified particular areas where businesses hadless knowledge about food handling practices or the terminology used in standard food handlingdocumentation.
5.2.4 Telephone survey response rate resultsThe telephone interviews were conducted between February 13th and 26th 2001 and lasted on average13.8 minutes. Calls were made at all times of the day, seven days a week, avoiding peak mealpreparation and serving times. Businesses could also schedule call-back appointments at a time moresuitable for them.
Conducting interviews with food businesses during February (at the end of summer school holidays)was beneficial to the response rate, as this was a slow period in many food businesses.
The following table of call results illustrates that of a total sample of 12,157 business numbers, nearlyhalf (47%) were incorrect or out of date and 46% were able to be contacted. Seven per cent (7%) ofnumbers were not needed and therefore not called.
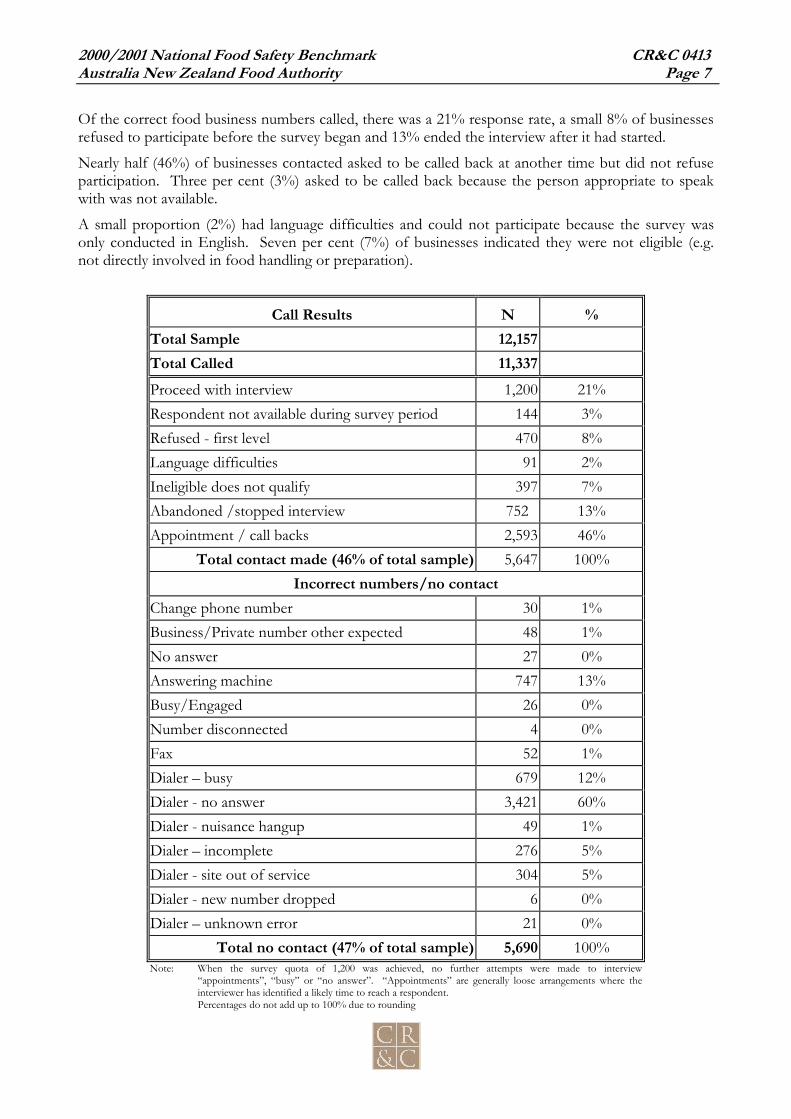
2000/2001 National Food Safety Benchmark CR&C 0413Australia New Zealand Food Authority Page 7
Of the correct food business numbers called, there was a 21% response rate, a small 8% of businessesrefused to participate before the survey began and 13% ended the interview after it had started.
Nearly half (46%) of businesses contacted asked to be called back at another time but did not refuseparticipation. Three per cent (3%) asked to be called back because the person appropriate to speakwith was not available.
A small proportion (2%) had language difficulties and could not participate because the survey wasonly conducted in English. Seven per cent (7%) of businesses indicated they were not eligible (e.g.not directly involved in food handling or preparation).
Call Results N %Total Sample 12,157Total Called 11,337Proceed with interview 1,200 21%Respondent not available during survey period 144 3%Refused - first level 470 8%Language difficulties 91 2%Ineligible does not qualify 397 7%Abandoned /stopped interview 752 13%Appointment / call backs 2,593 46%
Total contact made (46% of total sample) 5,647 100%Incorrect numbers/no contact
Change phone number 30 1%Business/Private number other expected 48 1%No answer 27 0%Answering machine 747 13%Busy/Engaged 26 0%Number disconnected 4 0%Fax 52 1%Dialer – busy 679 12%Dialer - no answer 3,421 60%Dialer - nuisance hangup 49 1%Dialer – incomplete 276 5%Dialer - site out of service 304 5%Dialer - new number dropped 6 0%Dialer – unknown error 21 0%
Total no contact (47% of total sample) 5,690 100%Note: When the survey quota of 1,200 was achieved, no further attempts were made to interview
“appointments”, “busy” or “no answer”. “Appointments” are generally loose arrangements where theinterviewer has identified a likely time to reach a respondent.Percentages do not add up to 100% due to rounding

2000/2001 National Food Safety Benchmark CR&C 0413Australia New Zealand Food Authority Page 8
5.2.5 EHO survey methodologyFood safety regulations are enforced primarily by Local Government Councils and specifically EHOsand PHUs within those Local Government Areas (LGAs). The first step in conducting the surveyswas to choose a random selection of the Local Government or Council Areas in which to conduct thesurveys.
To provide optimal confidence in results at the 95% confidence interval (see the discussion ofsampling error in Section 5.3 below) within breakdowns across States and Territories, a target of 600returned surveys was set. It was anticipated that in light of the on-going and impending changes inFood Safety Standards that EHOs/PHUs would be interested in undertaking the survey and thereforeco-operative.
It was also anticipated that each LGA would be able to undertake 10 surveys within a 2-4 week periodand therefore to obtain the optimal target of 600 returned surveys, a total of 64 LGAs were targeted.During sample generation, some of the LGAs were identified to have a very small number of staffand/or businesses and therefore 65 LGAs were ultimately included.
Selection of LGAs by State and Territory was stratified to be proportionately representative of thepopulation. A random sample of LGAs was generated in each State and Territory and the SeniorFood Officers in each State and Territory were notified of those LGAs to be included in the project.
Once LGAs were selected to participate, they were matched with postcodes and then random lists offood businesses within those postcodes were generated from the electronic Yellow Pages. A total of30 businesses were included in the sample for each LGA. To avoid sampling bias at the LGA levelonly 12 businesses were sent to each LGA at a time, and when that list was exhausted they wererequested to seek additional business names from Campbell Research & Consulting). This processidentified particular types of business to be excluded (e.g. butchers). Through this method CampbellResearch & Consulting maintained day to day contact with many LGAs and could gain a clearunderstanding of why specific businesses were not surveyed. Reasons for EHOs excluding a businesson their list included:
business no longer operating; type of business not applicable to the survey (e.g. no handling of potentially hazardous
food, see definition on page 4); business had recently been inspected and surveying officer did not want to ‘pester’ the
business; business located in another LGA (due to overlap of postcodes); or business located a long distance away from where the EHO/PHU was stationed and it
would not be feasible for them to attend the business during the survey period.
Information about the project, expected time lines and requirements from EHOs/PHUs was faxeddirectly from Campbell Research & Consulting to an EHO/PHU point of contact within each LGA.The information from Campbell Research & Consulting stressed the voluntary nature of participationand the importance of involvement.
Extensive briefing instructions and information about how to conduct the survey was provided to theEHOs, both in hard copy documents, and in a pre-prepared briefing video tape sent out to each LGA.While Campbell Research & Consulting constructed the briefing materials, ANZFA was intimatelyinvolved with on-going feedback to ensure instructional materials were correct and appropriate. Thisdetailed involvement included providing written instructions and definitions for most survey questionsdirectly on the survey form.

2000/2001 National Food Safety Benchmark CR&C 0413Australia New Zealand Food Authority Page 9
A key element of the EHO survey was the actual observation of practices. However food businesseswere not likely to undertake all practices within the one-hour site visit allowed for the survey. Onaverage, the interview took 54 minutes. Twelve percent (12%) took less than 30 minutes, and twentythree percent (23%) took longer than one hour. The survey relied on the competency, skill andexperience of EHOs to make the judgement about whether practice was undertaken safely. Where thepractice was not observed directly, EHOs identified the “not observed” status. This is reported in theEHO survey results.
5.2.6 EHO survey response ratesPreliminary faxed information was sent out to LGAs in late February 2001 and survey materials wereposted to LGAs in early March 2001. A much longer than expected survey return process followedand the final surveys were returned on May 30th, 2001.
Once the survey period commenced, telephone calls, faxes and emails were sent to all participatingLGAs on a regular basis to either provide additional information or follow-up on the status of thesurveying process. Some individual LGAs negotiated extensions to the survey returns when neededand these were accommodated where reasonable to ensure an adequate sample was obtained.
The primary issue delaying the return of surveys, or ultimately the number of surveys completed, wasthe availability of resources within each LGA. Some LGAs requested funding for an additional staffmember to complete the surveys, or responded they were unable to make the time to complete therequired number of surveys due to a lack of staff. No funding was supplied to the LGAs forconducting the surveys.
In a few LGAs, some EHOs and PHUs were particularly interested in the survey and volunteered toundertake more surveys than required.
By the end of the survey period some LGAs who did not have staff available at the beginning did havestaff appointed or available and subsequently asked to be included at that time.
Wherever possible interested LGAs were included and time lines extended. Reasons for extensions oftime lines and smaller numbers of surveys returned from various LGAs included:
allocation of priorities (such as outbreaks of illness, floods and other natural disasters); availability of staff (such as one EHO shared between multiple LGAs, or staff
resignations); lack of food based businesses; and restructuring of EHO duties and/or councils (such as combining councils and
restructuring roles and responsibilities).
In the end, 47 LGAs were represented in the sample and 499 surveys returned, including 16 that wereunusable due to inadequate information. A total of 483 surveys were included in the final sampleincluding 28 from the ACT, as there was only a single LGA in the ACT5. An overall 78% responserate was achieved from the original target sample of 620 surveys.
5 Although there is also only one LGA in the Northern Territory, the sample was able to be stratified by town /
urban areas.
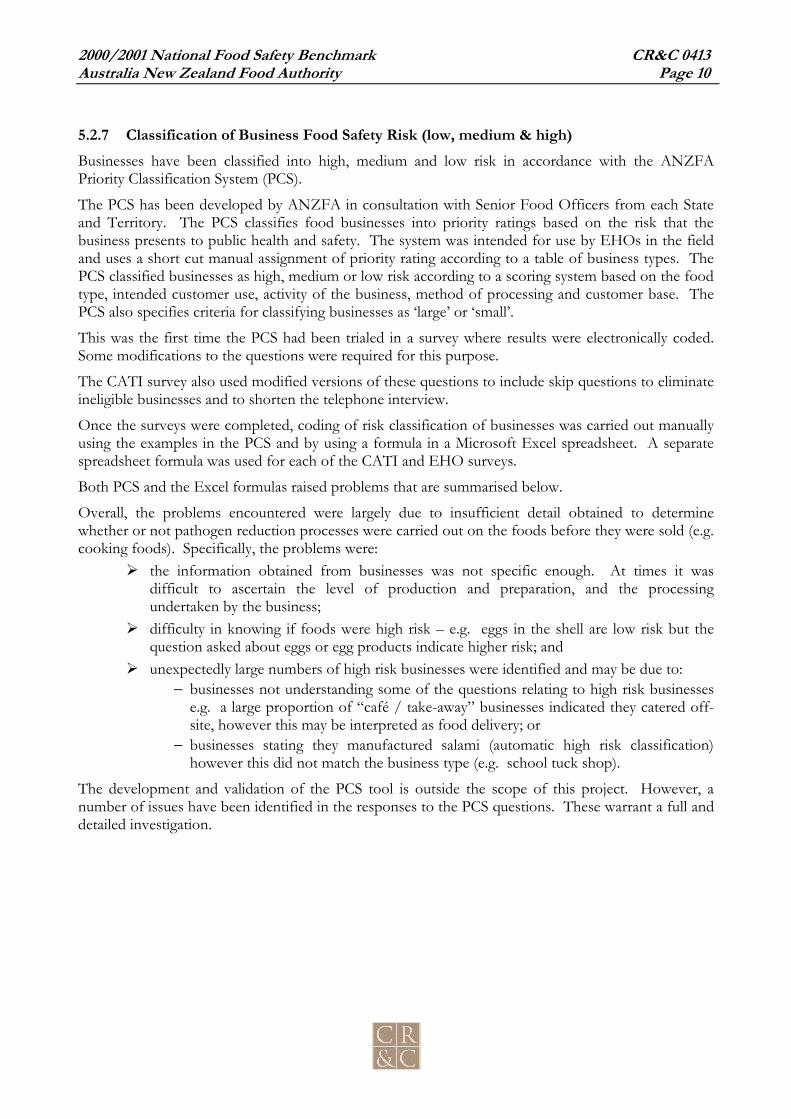
2000/2001 National Food Safety Benchmark CR&C 0413Australia New Zealand Food Authority Page 10
5.2.7 Classification of Business Food Safety Risk (low, medium & high)Businesses have been classified into high, medium and low risk in accordance with the ANZFAPriority Classification System (PCS).
The PCS has been developed by ANZFA in consultation with Senior Food Officers from each Stateand Territory. The PCS classifies food businesses into priority ratings based on the risk that thebusiness presents to public health and safety. The system was intended for use by EHOs in the fieldand uses a short cut manual assignment of priority rating according to a table of business types. ThePCS classified businesses as high, medium or low risk according to a scoring system based on the foodtype, intended customer use, activity of the business, method of processing and customer base. ThePCS also specifies criteria for classifying businesses as ‘large’ or ‘small’.
This was the first time the PCS had been trialed in a survey where results were electronically coded.Some modifications to the questions were required for this purpose.
The CATI survey also used modified versions of these questions to include skip questions to eliminateineligible businesses and to shorten the telephone interview.
Once the surveys were completed, coding of risk classification of businesses was carried out manuallyusing the examples in the PCS and by using a formula in a Microsoft Excel spreadsheet. A separatespreadsheet formula was used for each of the CATI and EHO surveys.
Both PCS and the Excel formulas raised problems that are summarised below.
Overall, the problems encountered were largely due to insufficient detail obtained to determinewhether or not pathogen reduction processes were carried out on the foods before they were sold (e.g.cooking foods). Specifically, the problems were:
the information obtained from businesses was not specific enough. At times it wasdifficult to ascertain the level of production and preparation, and the processingundertaken by the business;
difficulty in knowing if foods were high risk – e.g. eggs in the shell are low risk but thequestion asked about eggs or egg products indicate higher risk; and
unexpectedly large numbers of high risk businesses were identified and may be due to:− businesses not understanding some of the questions relating to high risk businesses
e.g. a large proportion of “café / take-away” businesses indicated they catered off-site, however this may be interpreted as food delivery; or
− businesses stating they manufactured salami (automatic high risk classification)however this did not match the business type (e.g. school tuck shop).
The development and validation of the PCS tool is outside the scope of this project. However, anumber of issues have been identified in the responses to the PCS questions. These warrant a full anddetailed investigation.

2000/2001 National Food Safety Benchmark CR&C 0413Australia New Zealand Food Authority Page 11
5.3 Sampling error
The aim of selecting a sample is to be able to limit the cost of interviewing to a small and manageablenumber. However the objective is to make inferences about the population from which thesample is drawn.
In any sample survey a degree of sampling error will occur. The sampling error is the extent to whichthe survey responses can be generalised to the population from which the sample was drawn (i.e. foodbusinesses). As sample size increases, sampling error decreases. The technical term for sampling erroris standard error.
Error! Reference source not found. provides survey estimates 50%, 60%, 80% and 90% at the 95%confidence interval for the sample sizes in the Food Safety Standards EHO surveys and CATIinterviews. For example, if 50% of the EHO sample of 483 gave a particular response, we would be95% certain that between 45.4% and 54.5% of the entire population would give this response.
Table 16: Survey estimates of 50%, 60%, 80% and 90% at 95% confidence interval (CI)
Survey estimates of 50% and 60 at 95% confidence interval (CI)
Survey estimate of 50% Survey estimate of 60%
Sample size Confidenceinterval
Lowerband
Upperband
Confidenceinterval
Lowerband
Upperband
483(EHO surveys)
± 4.5% 45.5% 54.5% 4.4 55.6 64.4
1,200(CATI surveys)
± 2.8% 47.2% 52.8% 2.8 57.2 62.8
Survey estimates of 80% and 90% at 95% confidence interval (CI)
Survey estimate of 80% Survey estimate of 90%
Sample size Confidenceinterval
Lowerband
Upperband
Confidenceinterval
Lowerband
Upperband
483(EHO surveys)
± 3.6% 76.4% 83.6% 2.7 83.7 92.7
1,200(CATI surveys)
± 2.3% 77.7% 82.3% 1.7 88.3 91.7
For example, the EHO survey identified that 20% of businesses supplied potentially hazardous foodoff-site (Section 6.1.4). Using the survey estimate above, we could expect with 95% confidence thatbetween 16.4% and 23.6% of businesses would provide potentially hazardous food off-site.
6 Refer to Section 2, Reading this report for a full explanation of the tables contained in this report.

2000/2001 National Food Safety Benchmark CR&C 0413Australia New Zealand Food Authority Page 12
6 Businesses involved in the National Food HandlingBenchmark survey
The first eight questions in each survey were designed to calculate business risk classification inaccordance with the ANZFA Priority Classification System (PCS) (see Section 5.2.7 for a discussionon this risk classification system). Analysis of these questions also provides independent demographicinformation on the sample of businesses presented in this Section.
6.1.1 Business typeThe CATI and EHO samples contained similar types of business. However, the EHO surveyed ahigher proportion of “restaurant / café / take-away” businesses, while the CATI interviews surveyed ahigher proportion of “schools / child care / hospitals” and “other manufacturing / processing”businesses (Figure 1). Nearly half of the CATI businesses (47%) and just over half of the EHOsurveyed businesses (56%) were classified as “restaurant / café / take away” (Figure 1). Two in ten(19%) of both CATI and EHO surveys were undertaken within “mixed businesses (e.g. Bakery)establishments”.
Figure 1: Description of business7
Q1a: CATI: How would you describe your business in your own words?Q1: EHO: Describe the business
1%
7%
19%
16%
56%
6%
13%
19%
24%
47%
0% 10% 20% 30% 40% 50% 60%
Other
Other Manufacturing /Processing
Mixed business (e.g.Bakery)
School/Child-Care/Hosp
Restaurant/Café/Takeaway
EHO CATI
Base: All respondentsEHO = 483 CATI = 1,200
One quarter (25%) of CATI surveys were conducted with “schools / child care / hospitals”compared with 16% of the EHO surveys. A larger proportion of CATI surveys (13%) wereconducted among “other manufacturing / processing” businesses compared to EHOs (7%).
7 7 Refer to Section 2, Reading this report for a full explanation of the graphs contained in this report

2000/2001 National Food Safety Benchmark CR&C 0413Australia New Zealand Food Authority Page 13
6.1.2 Manufacturing, processing, catering and transport food businessesSimilar proportions of CATI (84%) and EHO surveyed businesses (87%) were involved in “othermanufacturing and/or processing” of food (Figure 2).
Figure 2: Manufacturing or processing of food8
Q1B: CATI: Do you manufacture any products at your business?Q5: CATI: Do you process, prepare or cook the food that you sell, distribute or transport?Q3: EHO: Does the business manufacture or process food before sale or distribution?
Base: All respondentsCATI = 1,200 EHO = 483
6.1.3 Food safety business classificationBusinesses were classified as low, medium or high risk according to a formula based on responses toquestions 1-8 in both of the two surveys. For a discussion of the priority classification system seeSection 5.2.7.
The distribution of risk in the two samples reflects the recruitment procedures that focussed on theinclusion of medium to high-risk businesses. Correct food handling procedures are less likely to berelevant for low risk businesses.
The recruitment of businesses into both surveys was based on excluding businesses where the foodstandards may not have applied, for example, service stations that sold only pre-packaged products.For the EHO survey, this decision was based on local knowledge. Consequently, there is a lowerproportion of low risk food businesses in the EHO survey compared to the CATI survey (see Figure3).
8 ‘Process’, in relation to food, means preparing food for sale including chopping, cooking, drying, fermenting,
heating, pasteurising, or a combination of these activities.
84% 87%
0%
10%20%
30%40%50%
60%70%
80%90%
100%
CATI EHO
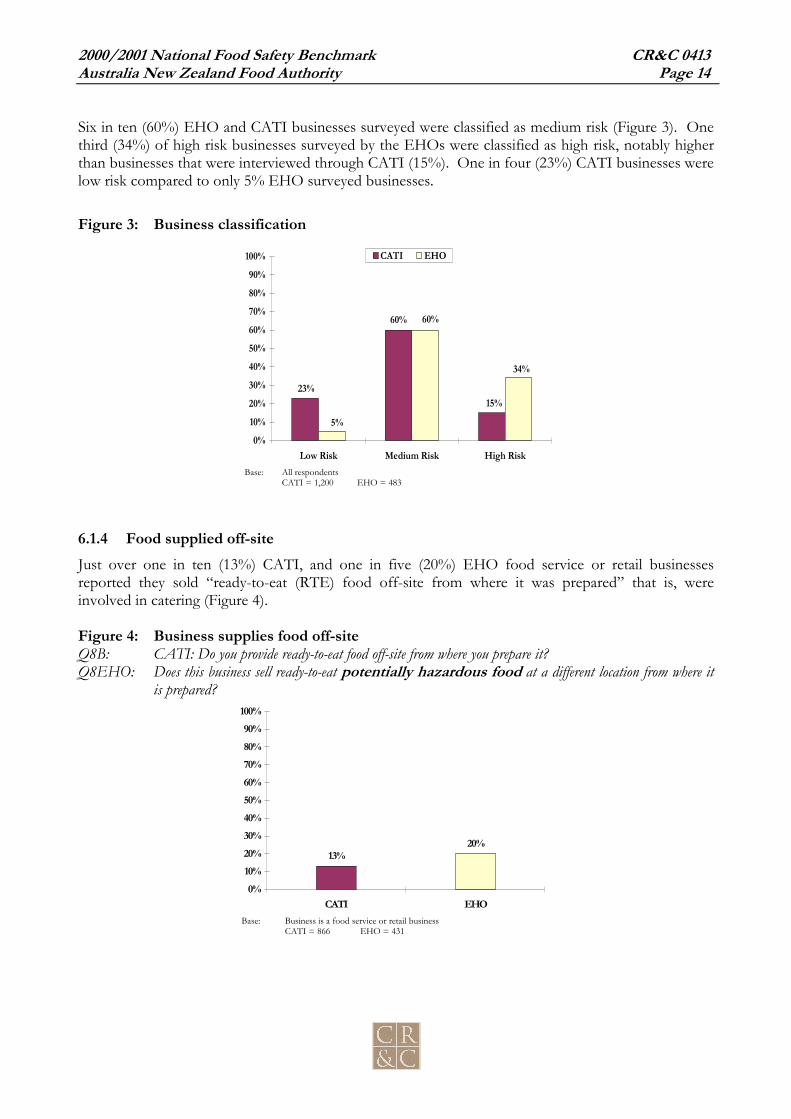
2000/2001 National Food Safety Benchmark CR&C 0413Australia New Zealand Food Authority Page 14
Six in ten (60%) EHO and CATI businesses surveyed were classified as medium risk (Figure 3). Onethird (34%) of high risk businesses surveyed by the EHOs were classified as high risk, notably higherthan businesses that were interviewed through CATI (15%). One in four (23%) CATI businesses werelow risk compared to only 5% EHO surveyed businesses.
Figure 3: Business classification
Base: All respondentsCATI = 1,200 EHO = 483
6.1.4 Food supplied off-siteJust over one in ten (13%) CATI, and one in five (20%) EHO food service or retail businessesreported they sold “ready-to-eat (RTE) food off-site from where it was prepared” that is, wereinvolved in catering (Figure 4).
Figure 4: Business supplies food off-siteQ8B: CATI: Do you provide ready-to-eat food off-site from where you prepare it?Q8EHO: Does this business sell ready-to-eat potentially hazardous food at a different location from where it
is prepared?
Base: Business is a food service or retail businessCATI = 866 EHO = 431
13%20%
0%10%20%30%40%50%60%70%80%90%
100%
CATI EHO
60%
23%15%
5%
60%
34%
0%10%
20%30%
40%50%60%
70%80%90%
100%
Low Risk Medium Risk High Risk
CATI EHO

2000/2001 National Food Safety Benchmark CR&C 0413Australia New Zealand Food Authority Page 15
6.1.5 Food typesAn overview of the types of food handled by businesses revealed a broad cross-section of food typesin large proportions (Table 2). As the majority of businesses surveyed were “restaurant / café /takeaway” businesses, or “hospitals / schools / child care centres” this wide range of foods would beexpected.
An analysis of food types (Table 2) revealed that low risk businesses could still sell high risk foodssuch as:
raw meat, poultry or seafood; cooked or processed meat poultry or seafood; fermented or dried meat products; egg or egg products; dairy products; and/or prepared salads.
It also can be seen that there was a larger proportion of businesses supplying “prepared ready-to-eattable meals” among EHO surveyed businesses and larger proportions of most other food categorieswithin CATI surveyed businesses. This finding suggests that businesses self-report a larger range offood types than what EHOs might classify within the business.
Close to three-quarters of the businesses in the CATI survey produced or manufactured: cooked or processed meat poultry or seafood; soft drinks or juices; bread, pastries or cakes; egg or egg products; and dairy products.
Similar proportions of CATI and EHO surveyed businesses provided “meat pies, sausage rolls or hotdogs”, and “infant or baby food”.
In addition to the foods listed in Table 2, businesses were asked if they provided uncooked, fermentedcomminuted meat. Only 5% of CATI and 2% of EHO surveyed businesses reportedly handled thistype of food. In some States and Territories butchers and meat producers and processors are notregulated by EHOs or PHUs and some surveying officers informed Campbell Research & Consultingthat they were uncomfortable, unwilling or unable to survey meat producers and processors (SeeSection 5.2.1).

2000/2001 National Food Safety Benchmark CR&C 0413Australia New Zealand Food Authority Page 16
Table 2: Food type by business classificationQ2 CATI: We would like some specific information on the foods that you produce, do you provide, produce or
manufacture any of the following foods.EHO: Please list the food types that apply to this business.
High Risk Medium Risk Low Risk TotalCATI(185)
%A
EHO(166)
%B
CATI(719)
%C
EHO(291)
%D
CATI(280)
%E
EHO(26)*
%F
CATI(1,200)
%G
EHO(483)
%H
Prepared ready-to-eattable meals
61E 62 58E 56 11 0 47 55G
Frozen meals 22 20D 30AED 11 15 4 26H 14
Raw meat, poultry orseafood
51EB 38 47ED 30 38 F 0 46 H 31
Cooked/processed meat,poultry or seafood
83EB 42 83ED 38 43F 4 74 H 38
Fermented or dried meatproducts
43CEB 14 33ED 11 18 4 32 H 12
Meat pies, sausage rollsor hot dogs
61EB 49 58ED 49 25 4 51 47
Sandwiches or rolls 77EB 64D 72ED 49 18 0 60 H 52
Soft drinks / juices 78EB 67 88AED 69 54 38 79 H 67
Raw fruit and vegetables 78EB 48D 74ED 33 48 31 69 H 38
Processed fruit andvegetables
63CEB 46D 50ED 27 25 15 46 H 33
Confectionery 42 41 54AED 40 36 15 48 H 39
Infant or baby foods 18CE 21D 10 10 11 4 12 13
Bread, pastries or cakes 84EB 66D 83ED 51 48 38 75 H 55
Egg or egg products 83EB 51D 79ED 39 46 19 72 H 42
Dairy products 83EB 62D 83ED 52 51 27 76 H 54
Prepared salads 69EB 46D 64ED 36 13 0 53 H 37
Base: All respondentsNote: Letters in the cells represent statistically significant differences between columns (see page i for an explanation).• Sample too small to permit statistical significance testing

2000/2001 National Food Safety Benchmark CR&C 0413Australia New Zealand Food Authority Page 17
6.1.6 Providing food to “at risk” consumer groupsLess than two in ten CATI (17%) and EHO surveyed businesses (15%) served or provided food to “atrisk” groups including (Figure 5):
hospitals or sites where sick or frail people reside; nursing homes, hostels or other organisations serving elderly people; organisations serving pregnant women; or child care centres or other organisations serving children less than 5 years old.
Figure 5: Providing food to “at risk” consumer groupsQ6: CATI: Do you directly supply or manufacture food for the following organisations?Q7: EHO: Does the business directly supply or manufacture food for organisations catering to the sick, elderly,
children under 5 or pregnant women?
Base: All respondentsCATI = 1,200 EHO = 483
A breakdown of CATI businesses surveyed within each of these individual risk populationclassifications is presented in Table 3. Individual risk population categories were not classified withinthe EHO surveyed businesses.9
9 EHOs are more familiar with the definition of an “at risk” population due to their training in food safety and
therefore one general question about “at risk” populations was asked of them. Additionally, EHOs were briefed touse the same definition of “at risk”. This was reinforced on each questionnaire. To obtain a similar assessmentfrom CATI surveyed businesses, where the respondent could have very little understanding of “at risk” groups, thisquestion was broken down into population categories.
17% 15%
0%
10%20%
30%40%50%
60%70%
80%90%
100%
CATI EHO

2000/2001 National Food Safety Benchmark CR&C 0413Australia New Zealand Food Authority Page 18
Nearly all CATI and EHO surveyed businesses providing foods to “at risk” populations wereclassified as high risk businesses (Table 3), thus confirming appropriate application of the automatedrisk classification system. Four in ten (42%) of the EHO and eight in ten (77%) of the CATI surveyedbusinesses classified as high risk provided food to “at risk” populations. Differences betweenclassifications of businesses as low or medium risk are likely to be due to differences in the type offood supplied.
Table 3: Providing food to “at risk” consumer groups by business classificationQ6 CATI: Do you directly supply or manufacture food for the following organisations?
High RiskCATI(185)
%A
Medium RiskCATI(719)
%B
Low RiskCATI(280)
%C
Hospitals, or other sites where sickor frail people reside
24BC 4 4
Nursing homes, hostels or otherorganisations serving elderlypeople
46BC 3 5
Organisations serving pregnantwomen
8BC 1 1
Child care centres or otherorganisations serving childrenunder 5 years old
26BC 2 1
Net yes CATI 77% 8% 7%
High RiskEHO(166)
%A
Medium RiskEHO(291)
%B
Low RiskEHO(26)%C
Net yes EHO 42B 1 0Base: All respondentsNote: Letters in the cells represent statistically significant differences between columns (see page i for an explanation).

2000/2001 National Food Safety Benchmark CR&C 0413Australia New Zealand Food Authority Page 19
6.1.7 Location of businessSimilar proportions of businesses were interviewed in most States and Territories for both surveys(Figure 6). There were no significant differences between the two samples by either state or businesssize.
Figure 6: State location of business
Base: All respondentsCATI = 1,200 EHO = 483
Survey target samples were set to achieve a proportional representation of interviews in each statedepending on state population. Targets were more easily achieved on the CATI interviews wherebusinesses were selected through the telephone directory. EHO targets were more difficult to achieve,as the response rates were not known until survey return dates had passed. After this time, decisionsabout whether to extend the deadline to ensure better representation had to be made. In manyinstances individual councils were contacted to negotiate a reasonable extension of time where therewas a possibility of inclusion.One half of both CATI (52%) and EHO (50%) businesses surveyed were located in rural regions andvery similar proportions in metro regions (Figure 7). The over-representation of rural food businesseswas a function of the sampling to ensure that sample segments were of sufficient size to enableconfidence. In general, there was little difference by rural/ metropolitan region.
Figure 7: Rural/regional and metro
Base: All respondentsCATI = 1,200 EHO = 483
6%3%
20%20%
3%
13%7%
13%20%
8%5%8%19%15%
20% 18%
0%10%
20%30%
40%50%60%
70%80%90%
100%
VIC QLD NSW WA SA TAS NT ACT
CATI EHO
52% 50%48% 50%
0%10%
20%30%
40%50%60%
70%80%90%
100%
CATI EHO
Rural Metro

2000/2001 National Food Safety Benchmark CR&C 0413Australia New Zealand Food Authority Page 20
“Schools / child care centers / hospitals” were more often surveyed in metro areas compared withrural and regional areas among both EHO (20%) and CATI (32%) samples (Table 5).
63% of the EHO rural and regional surveys were of “restaurant / cafe / takeaway” businesses,substantially more than in metropolitan areas (49%).
Table 4: Business types by regional locationQ1a CATI: How would you describe your business in your own words?
Metropolitan Rural/Regional TotalCATI(581)
%A
EHO(240)
%B
CATI(619)
%C
EHO(243)
%D
CATI(1,200)
%E
EHO(483)
%F
School / Child Care /Hospital
32C 20D 18 12 24 16
Restaurant / Takeaway 44 49 50 63B 47 56
Mixed business (e.g. bakery) 17 19 21 19 19 19
Other Manufacturing /Processing
12 9 14 5 13 7
Others 4 1 7 - 6 1Base: All respondentsNote: Letters in the cells represent statistically significant differences between columns (see page i for an explanation).
CATI surveyed businesses had similar levels of risk regardless of whether they were located in rural ormetropolitan regions (Table 5). However, EHO surveyed metropolitan-based businesses were moreoften high risk (38%) or low risk (9%) compared with rural businesses (30% and 2% respectively).EHO surveyed rural and regional businesses were comparatively more likely (67%) to be medium riskthan the metropolitan businesses (53%).
Table 5: Business classification by regional locationMetropolitan Rural/Regional Total
CATI(581)
%A
EHO(240)
%B
CATI(619)
%C
EHO(243)
%D
CATI(1,200)
%E
EHO(483)
%F
High risk 17 38D 14 30 15 34
Medium risk 59 53 61 67B 60 60
Low risk 23 9D 24 2 23 5
Base: All respondentsNote: Letters in the cells represent statistically significant differences between columns (see page i for an explanation).
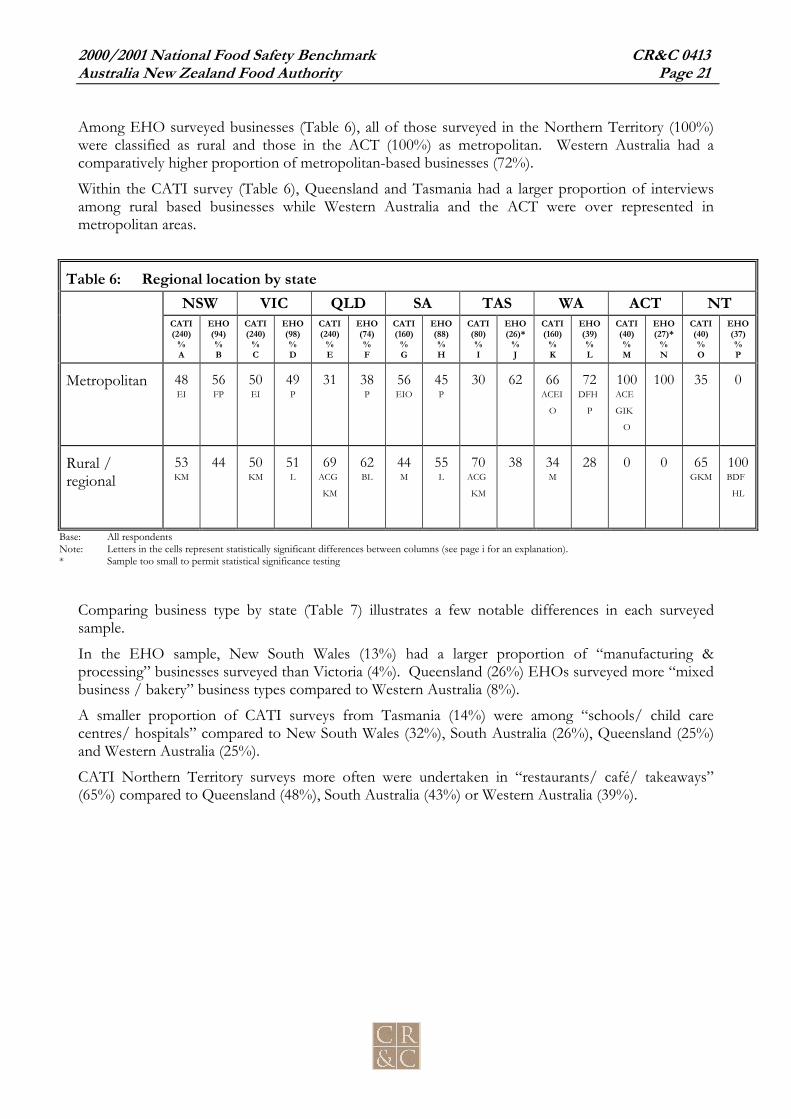
2000/2001 National Food Safety Benchmark CR&C 0413Australia New Zealand Food Authority Page 21
Among EHO surveyed businesses (Table 6), all of those surveyed in the Northern Territory (100%)were classified as rural and those in the ACT (100%) as metropolitan. Western Australia had acomparatively higher proportion of metropolitan-based businesses (72%).
Within the CATI survey (Table 6), Queensland and Tasmania had a larger proportion of interviewsamong rural based businesses while Western Australia and the ACT were over represented inmetropolitan areas.
Table 6: Regional location by stateNSW VIC QLD SA TAS WA ACT NT
CATI(240)
%A
EHO(94)%B
CATI(240)
%C
EHO(98)%D
CATI(240)
%E
EHO(74)%F
CATI(160)
%G
EHO(88)%H
CATI(80)%I
EHO(26)*
%J
CATI(160)
%K
EHO(39)%L
CATI(40)%M
EHO(27)*
%N
CATI(40)%O
EHO(37)%P
Metropolitan 48EI
56FP
50EI
49P
31 38P
56EIO
45P
30 62 66ACEI
O
72DFH
P
100ACE
GIK
O
100 35 0
Rural /regional
53KM
44 50KM
51L
69ACG
KM
62BL
44M
55L
70ACG
KM
38 34M
28 0 0 65GKM
100BDF
HL
Base: All respondentsNote: Letters in the cells represent statistically significant differences between columns (see page i for an explanation).* Sample too small to permit statistical significance testing
Comparing business type by state (Table 7) illustrates a few notable differences in each surveyedsample.
In the EHO sample, New South Wales (13%) had a larger proportion of “manufacturing &processing” businesses surveyed than Victoria (4%). Queensland (26%) EHOs surveyed more “mixedbusiness / bakery” business types compared to Western Australia (8%).
A smaller proportion of CATI surveys from Tasmania (14%) were among “schools/ child carecentres/ hospitals” compared to New South Wales (32%), South Australia (26%), Queensland (25%)and Western Australia (25%).
CATI Northern Territory surveys more often were undertaken in “restaurants/ café/ takeaways”(65%) compared to Queensland (48%), South Australia (43%) or Western Australia (39%).

2000/2001 National Food Safety Benchmark CR&C 0413Australia New Zealand Food Authority Page 22
Table 7: Business type by stateQ1a CATI: How would you describe your business in your own words
NSW VIC QLD SA TAS WA ACT NTNett CATI
(240)%A
EHO(94)%B
CATI(240)
%C
EHO(98)%D
CATI(240)
%E
EHO(74)%F
CATI(160)
%G
EHO(88)%H
CATI(80)%I
EHO(26)*
%J
CATI(160)
%K
EHO(39)%L
CATI(40)%M
EHO(27)*
%N
CATI(40)%O
EHO(37)%P
School/Child Care/Hospital
32CIO
14 21 22 25IO
15 26IO
13 14 12 25IO
18 25 15 10 22
Restaurant/Takeaway
49K
53 51K
57 48 55 43 60 49 38 39 69 45 41 65EGK
62
Mixed business(e.g. bakery)
17 16 15 14 19 26L
19 19 28AC
38 20 8 25 33 18 11
OtherManufacturing/Processing
11 13D 13 4 13 4 19AKM
8 15 8 11 5 5 11 10 3
Others 5 1 6 1 4 0 7 0 4 4 8 0 8 0 8 3
Base: All respondentsNote: Letters in the cells represent statistically significant differences between columns (see page i for an explanation).* Sample too small to permit statistical significance testing
6.1.8 Business sizeBusiness size was identified in terms of number of full time equivalent people employed. This wascalculated by asking:
1. number of full time staff;
2. estimated total hours of part-time or casual staff;
3. converting part-time or casual hours to full time equivalent in the most recent week; and
4. estimating the total staff by adding full time to full time equivalent.
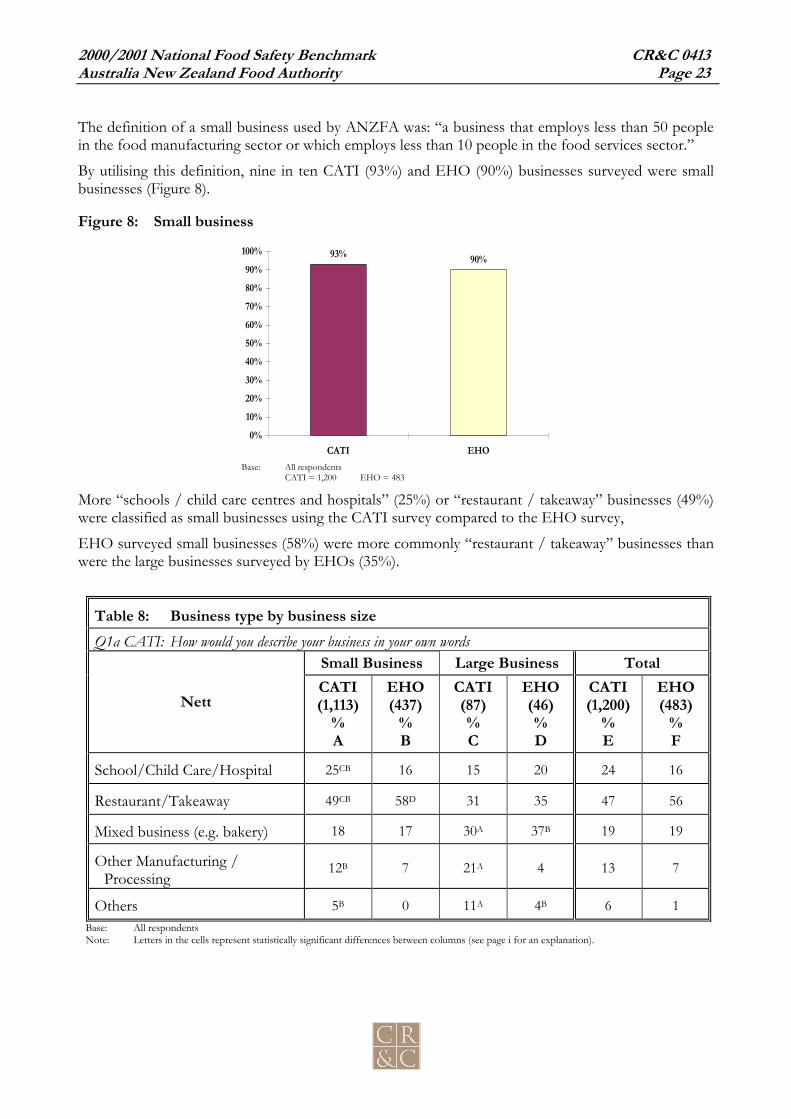
2000/2001 National Food Safety Benchmark CR&C 0413Australia New Zealand Food Authority Page 23
The definition of a small business used by ANZFA was: “a business that employs less than 50 peoplein the food manufacturing sector or which employs less than 10 people in the food services sector.”
By utilising this definition, nine in ten CATI (93%) and EHO (90%) businesses surveyed were smallbusinesses (Figure 8).
Figure 8: Small business
Base: All respondentsCATI = 1,200 EHO = 483
More “schools / child care centres and hospitals” (25%) or “restaurant / takeaway” businesses (49%)were classified as small businesses using the CATI survey compared to the EHO survey,
EHO surveyed small businesses (58%) were more commonly “restaurant / takeaway” businesses thanwere the large businesses surveyed by EHOs (35%).
Table 8: Business type by business sizeQ1a CATI: How would you describe your business in your own words
Small Business Large Business Total
NettCATI(1,113)
%A
EHO(437)
%B
CATI(87)%C
EHO(46)%D
CATI(1,200)
%E
EHO(483)
%F
School/Child Care/Hospital 25CB 16 15 20 24 16
Restaurant/Takeaway 49CB 58D 31 35 47 56
Mixed business (e.g. bakery) 18 17 30A 37B 19 19
Other Manufacturing /Processing
12B 7 21A 4 13 7
Others 5B 0 11A 4B 6 1Base: All respondentsNote: Letters in the cells represent statistically significant differences between columns (see page i for an explanation).
93% 90%
0%10%
20%30%
40%50%60%
70%80%90%
100%
CATI EHO
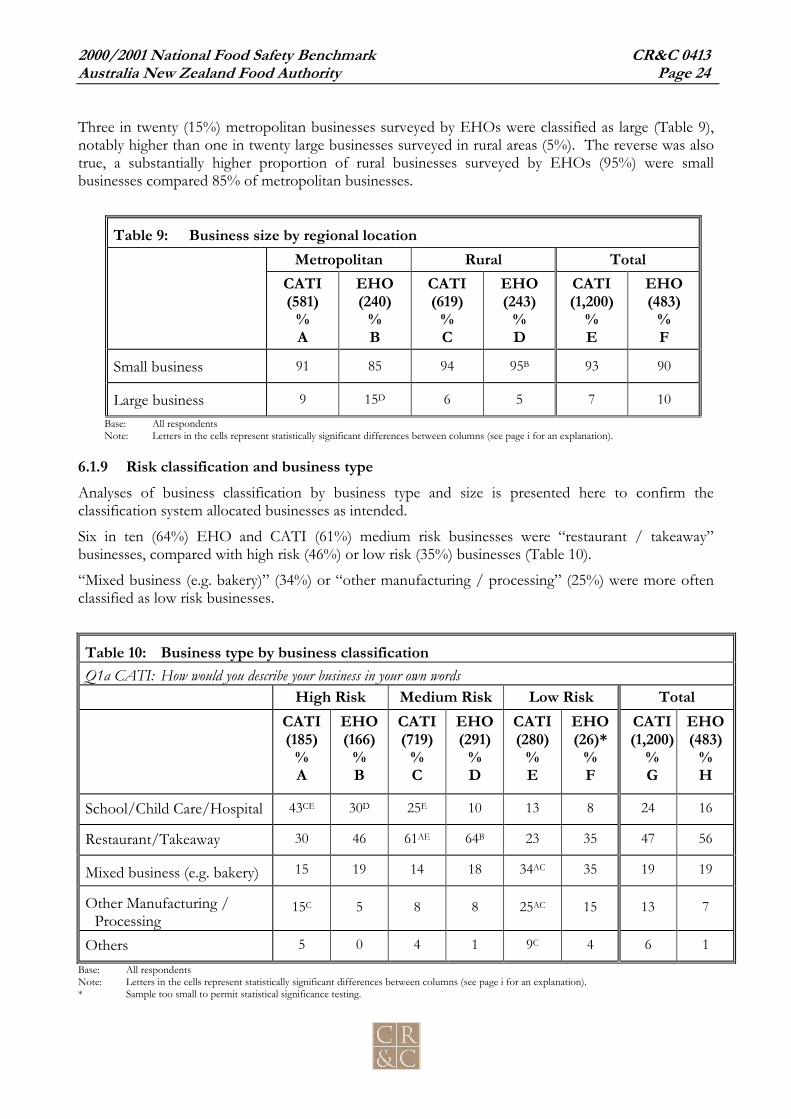
2000/2001 National Food Safety Benchmark CR&C 0413Australia New Zealand Food Authority Page 24
Three in twenty (15%) metropolitan businesses surveyed by EHOs were classified as large (Table 9),notably higher than one in twenty large businesses surveyed in rural areas (5%). The reverse was alsotrue, a substantially higher proportion of rural businesses surveyed by EHOs (95%) were smallbusinesses compared 85% of metropolitan businesses.
Table 9: Business size by regional locationMetropolitan Rural Total
CATI(581)
%A
EHO(240)
%B
CATI(619)
%C
EHO(243)
%D
CATI(1,200)
%E
EHO(483)
%F
Small business 91 85 94 95B 93 90
Large business 9 15D 6 5 7 10Base: All respondentsNote: Letters in the cells represent statistically significant differences between columns (see page i for an explanation).
6.1.9 Risk classification and business typeAnalyses of business classification by business type and size is presented here to confirm theclassification system allocated businesses as intended.
Six in ten (64%) EHO and CATI (61%) medium risk businesses were “restaurant / takeaway”businesses, compared with high risk (46%) or low risk (35%) businesses (Table 10).
“Mixed business (e.g. bakery)” (34%) or “other manufacturing / processing” (25%) were more oftenclassified as low risk businesses.
Table 10: Business type by business classificationQ1a CATI: How would you describe your business in your own words
High Risk Medium Risk Low Risk TotalCATI(185)
%A
EHO(166)
%B
CATI(719)
%C
EHO(291)
%D
CATI(280)
%E
EHO(26)*
%F
CATI(1,200)
%G
EHO(483)
%H
School/Child Care/Hospital 43CE 30D 25E 10 13 8 24 16
Restaurant/Takeaway 30 46 61AE 64B 23 35 47 56
Mixed business (e.g. bakery) 15 19 14 18 34AC 35 19 19
Other Manufacturing /Processing
15C 5 8 8 25AC 15 13 7
Others 5 0 4 1 9C 4 6 1
Base: All respondentsNote: Letters in the cells represent statistically significant differences between columns (see page i for an explanation).* Sample too small to permit statistical significance testing.
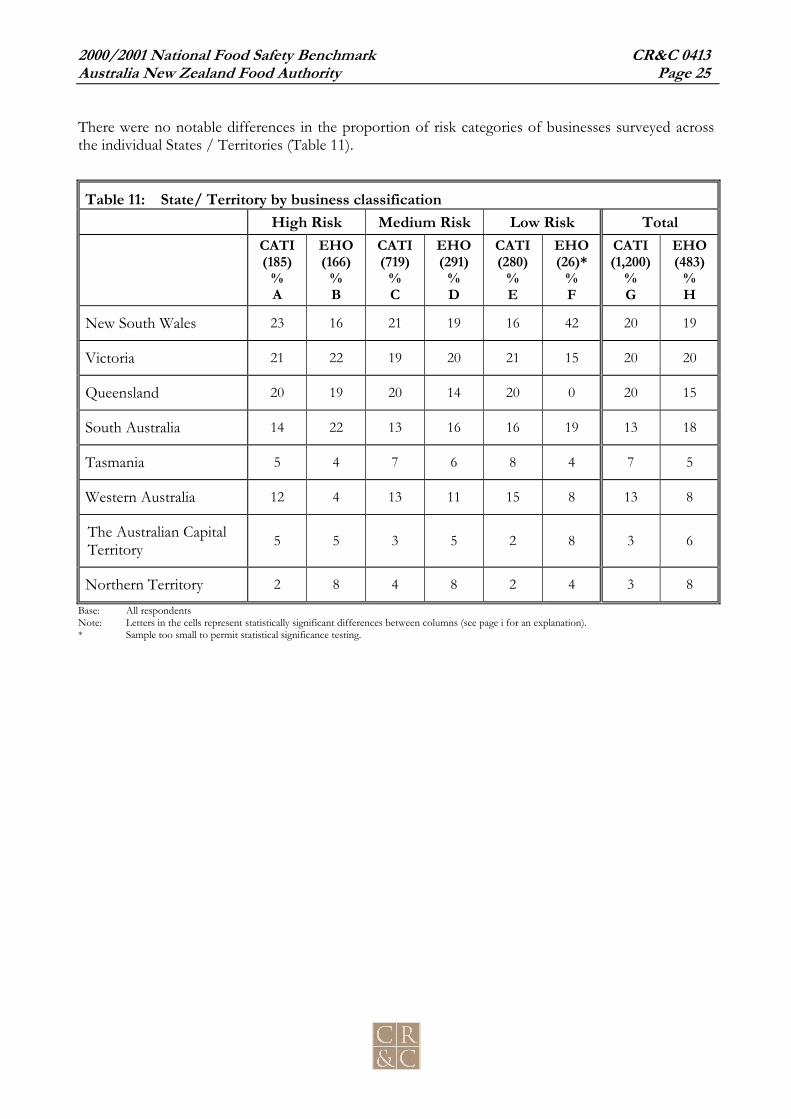
2000/2001 National Food Safety Benchmark CR&C 0413Australia New Zealand Food Authority Page 25
There were no notable differences in the proportion of risk categories of businesses surveyed acrossthe individual States / Territories (Table 11).
Table 11: State/ Territory by business classificationHigh Risk Medium Risk Low Risk Total
CATI(185)
%A
EHO(166)
%B
CATI(719)
%C
EHO(291)
%D
CATI(280)
%E
EHO(26)*
%F
CATI(1,200)
%G
EHO(483)
%H
New South Wales 23 16 21 19 16 42 20 19
Victoria 21 22 19 20 21 15 20 20
Queensland 20 19 20 14 20 0 20 15
South Australia 14 22 13 16 16 19 13 18
Tasmania 5 4 7 6 8 4 7 5
Western Australia 12 4 13 11 15 8 13 8
The Australian CapitalTerritory 5 5 3 5 2 8 3 6
Northern Territory 2 8 4 8 2 4 3 8
Base: All respondentsNote: Letters in the cells represent statistically significant differences between columns (see page i for an explanation).* Sample too small to permit statistical significance testing.
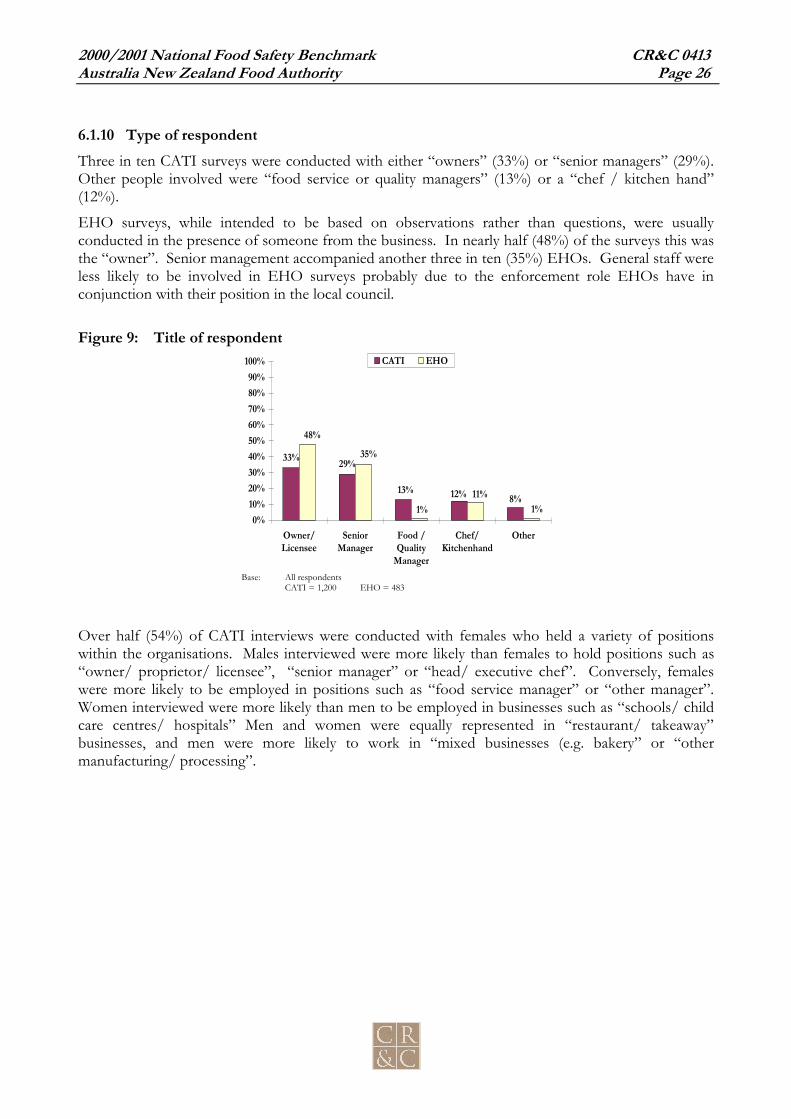
2000/2001 National Food Safety Benchmark CR&C 0413Australia New Zealand Food Authority Page 26
6.1.10 Type of respondentThree in ten CATI surveys were conducted with either “owners” (33%) or “senior managers” (29%).Other people involved were “food service or quality managers” (13%) or a “chef / kitchen hand”(12%).
EHO surveys, while intended to be based on observations rather than questions, were usuallyconducted in the presence of someone from the business. In nearly half (48%) of the surveys this wasthe “owner”. Senior management accompanied another three in ten (35%) EHOs. General staff wereless likely to be involved in EHO surveys probably due to the enforcement role EHOs have inconjunction with their position in the local council.
Figure 9: Title of respondent
Base: All respondentsCATI = 1,200 EHO = 483
Over half (54%) of CATI interviews were conducted with females who held a variety of positionswithin the organisations. Males interviewed were more likely than females to hold positions such as“owner/ proprietor/ licensee”, “senior manager” or “head/ executive chef”. Conversely, femaleswere more likely to be employed in positions such as “food service manager” or “other manager”.Women interviewed were more likely than men to be employed in businesses such as “schools/ childcare centres/ hospitals” Men and women were equally represented in “restaurant/ takeaway”businesses, and men were more likely to work in “mixed businesses (e.g. bakery” or “othermanufacturing/ processing”.
33% 29%
13% 12% 8%1%
48%
35%
1%11%
0%10%20%30%40%50%60%70%80%90%
100%
Owner/Licensee
SeniorManager
Food /Quality
Manager
Chef/Kitchenhand
Other
CATI EHO
2000/2001 National Food Safety Benchmark CR&C 0413Australia New Zealand Food Authority Page 27
7 Telephone survey among food businessesThe objective of the telephone survey was to identify the extent of knowledge about food safety issuesand practices in food businesses. The primary interviewing technique was to encourage businesses torespond, but not force them to guess. It was just as useful to identify the extent to which people donot know the answer to food handling questions as it was to identify correct and incorrect responses.
7.1 Temperature controlControlling the temperature of food is a critical element of food safety. Businesses can maintain foodsafely by keeping chilled food 5°C or below and hot food 60°C or hotter. Businesses were askedabout their temperature control practices and about their knowledge of the temperatures that weresuitable for keeping hot and cold food safe.
Food that has to be kept under temperature control is termed potentially hazardous food. However,in a short telephone interview with businesses that would be unfamiliar with this expression, generallyquestions referred to chilled or hot food. The report refers to these foods as ‘temperature sensitive’.
Some foods may be kept at refrigeration temperatures for quality rather than safety reasons forexample, whole fresh fruit and vegetables. The survey did not distinguish these from foods that werekept chilled for safety reasons.
7.1.1 Receiving hot and chilled foodBusinesses were asked if food was delivered to their business that had to be kept chilled or hot, howoften temperature checks were made of this food and how these checks were made. They were askedwhich foods they checked.
Nearly nine in ten (87%) businesses reported that they had foods delivered to their business that weretemperature sensitive10 and needed to be kept hot or cold (Figure 10).
Nine in ten businesses had hot and chilled foods delivered to their premises.
10 Temperature sensitive foods include foods that need to be kept chilled or hot to maintain quality.
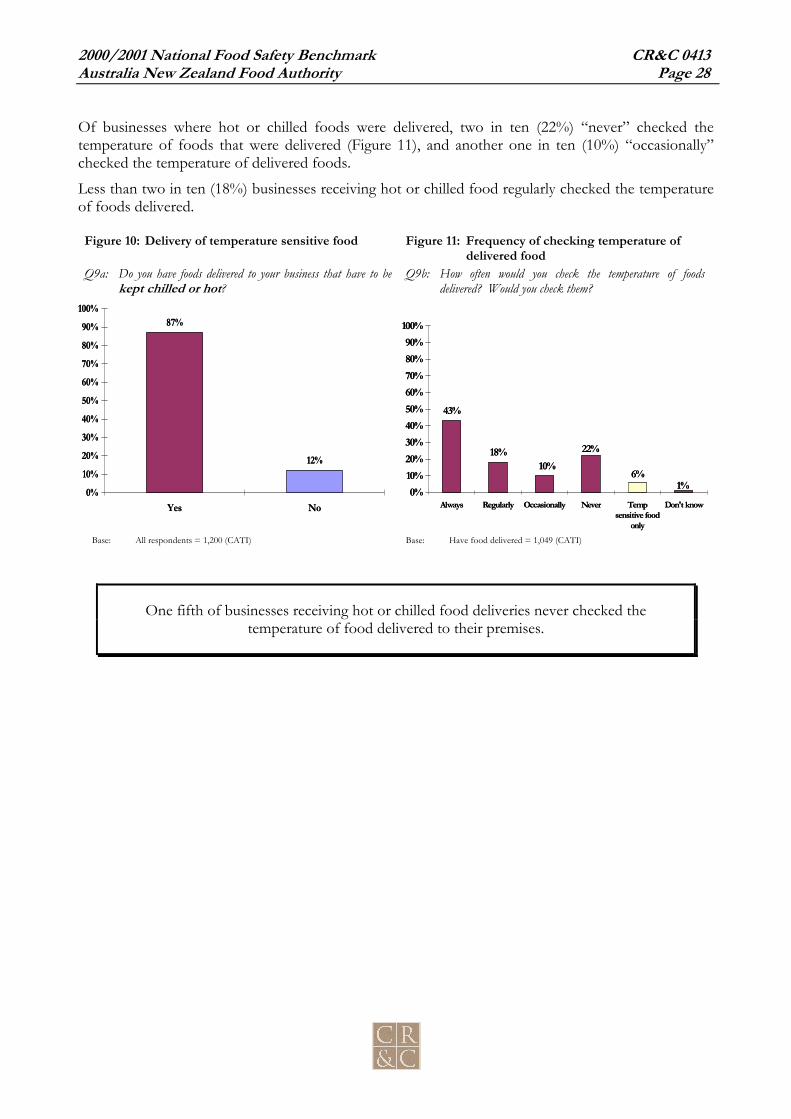
2000/2001 National Food Safety Benchmark CR&C 0413Australia New Zealand Food Authority Page 28
Of businesses where hot or chilled foods were delivered, two in ten (22%) “never” checked thetemperature of foods that were delivered (Figure 11), and another one in ten (10%) “occasionally”checked the temperature of delivered foods.
Less than two in ten (18%) businesses receiving hot or chilled food regularly checked the temperatureof foods delivered.
Figure 10: Delivery of temperature sensitive food Figure 11: Frequency of checking temperature ofdelivered food
Q9a: Do you have foods delivered to your business that have to bekept chilled or hot?
Q9b: How often would you check the temperature of foodsdelivered? Would you check them?
Base: All respondents = 1,200 (CATI) Base: Have food delivered = 1,049 (CATI)
One fifth of businesses receiving hot or chilled food deliveries never checked thetemperature of food delivered to their premises.
87%
12%
0%10%
20%30%40%50%
60%70%80%
90%100%
Yes No
43%
18%
6%1%
22%10%
0%10%20%30%40%50%60%70%80%90%
100%
Always Regularly Occasionally Never Tempsensitive food
only
Don't know
87%
12%
0%10%
20%30%40%50%
60%70%80%
90%100%
Yes No
43%
18%
6%1%
22%10%
0%10%20%30%40%50%60%70%80%90%
100%
Always Regularly Occasionally Never Tempsensitive food
only
Don't know

2000/2001 National Food Safety Benchmark CR&C 0413Australia New Zealand Food Authority Page 29
7.1.2 ThermometersBusinesses that check temperatures of food need a probe thermometer if they are to check the foodtemperature accurately. Information was sought on whether businesses had a probe thermometer. Iffood businesses stored chilled food they were asked about their knowledge of storage temperatures ofchilled food.Most (73%) businesses that had temperature sensitive food delivered, and who reported they checkedthe temperature of food that was delivered had a probe thermometer. One in four (23%) did not havea probe thermometer (Figure 12). Very few (1%) reported they were unsure if they had a probethermometer or did not believe it was a necessary piece of equipment for the type(s) of food theyhandled (1%).
Figure 12: Temperature probeQ9e: Do you have a temperature probe? That is, a thermometer that can be inserted into food to measure its
temperature?
Base: Has temperature sensitive food delivered to business AND checks temperature of food= 818 (CATI)
Businesses more likely to have a temperature probe included: high (81%) or medium (73%) risk businesses as compared with low risk (65%); large (93%) compared to small (71%); Victorian businesses (89%) compared to all other States and Territories; those reporting they felt informed (76%) about food safety compared with not informed
(60%); and those offering staff training (77%) compared to not offering staff training (60%).
73%
24%
1%1%0%
10%
20%30%
40%50%60%
70%80%90%
100%
Yes No Not necessary Don't know

2000/2001 National Food Safety Benchmark CR&C 0413Australia New Zealand Food Authority Page 30
7.1.3 Temperature check by business classification and business sizeComparing risk classifications and business size illustrated some difference in frequency of checkingthe temperature of food delivered to the business (Table 12). Small business were more likely “never”to check their food temperature (23%), when compared to large businesses (4%). Large businesses(72%) were more likely to “always” check temperatures compared to small businesses (41%).
Table 12: Check temperature of delivered food by business classification and business sizeQ9B: How often would you check the temperature of foods delivered?
Business classification Business sizeHigh Risk
(173)%A
Med Risk(661)
%B
Low Risk(200)
%C
Small(974)
%D
Large(75)%E
Total(1,049)
%F
Never 13 24A 25A 23E 4 22
Occasionally 9 11 8 10 11 10
Regularly, but not every delivery 21 16 21 18E 7 18
Always 50 42 42 41 72D 43
Only temperature sensitive food 5 6 4 6 5 6
Don’t know 2 1 2 1 1 1
One quarter of medium (24%) and low (25%) risk businesses receiving hot and chilled food “never”checked the temperature of food delivered to the business. High risk businesses were less likely toreport they “never” checked the temperature of the food (13%).
Nearly all businesses receiving hot/chilled food checked the temperature of food delivered to theirbusiness at least occasionally:
85% of high risk businesses; 75% of medium risk businesses; and 73% of low risk businesses.

2000/2001 National Food Safety Benchmark CR&C 0413Australia New Zealand Food Authority Page 31
Businesses with a temperature probe were more likely to check hot or chilled food (Table 13).Businesses with a temperature probe (61%) more often reported they “always” checked thetemperature of delivered food compared to those businesses without a temperature probe (43%).
Table 13: Check temperature of delivered food by use of temperatureprobe
Q9A: Do you have foods delivered to your business that have to be kept chilled or hot?Q9B: How often would you check the temperature of foods delivered?Q9E: Do you have a temperature probe? That is, a thermometer that can be inserted
into food to measure its temperature?Has temp probe
%Yes
(600)B
No(200)
C
Never 0 0
Occasionally 11 20B
Regularly, but not every delivery 21 26
Always 61C 43
Only temperature sensitive food 6 11B
Don’t know 1 2Base: Had chilled or hot food delivered (818)
Very few businesses receiving hot and chilled food said that a temperature probe was not necessary(1%) or did not know if they had a temperature probe (1%)

2000/2001 National Food Safety Benchmark CR&C 0413Australia New Zealand Food Authority Page 32
Of businesses that checked the temperature of food, over one in ten (14%) checked the temperatureby “touch” and another one in ten (11%) checked the temperature by “looking at the appearance” ofthe food (Figure 13). A clear majority of seven in ten (72%), businesses that checked foodtemperature, reported they used a thermometer to check the temperature of foods delivered to theirbusiness.
Figure 13: Method for checking temperature ofdelivered food
Figure 14: Food types to check temperature whendelivered
Q9c: How do you check the temperature of the food? Q9d: Which type of foods would you check the temperature ofwhen delivered?
Base: Has hot or chilled food delivered to business AND checkstemperature of food = 818 (CATI)
Base: Has hot or chilled food delivered to business AND checkstemperature of food = 818 (CATI)
Total may be greater than 100% due to multiple responses Total may be greater than 100% due to multiple responses
Businesses were much more likely to check the temperature of chilled or frozen items compared tohot foods (Figure 14).
When asked which types of food a business checked the temperature: a majority of businesses (71%) checked the temperature of chilled food when it was
delivered; six in ten (60%) checked frozen food; over one in ten (13%) checked “all” foods; and one in ten (8%) checked “hot” foods.
One in ten businesses where hot or chilled food was delivered and the temperature waschecked, checked the temperature of foods by their appearance rather than by touch or a
thermometer.
72%
14% 11% 10% 6%
0%10%20%30%40%50%60%70%80%90%
100%
Thermometer Touch Appearance Gauge invehicle
Other
71%
60%
1%
29%
13%
2%8%
1%0%
10%
20%30%
40%50%60%
70%80%90%
100%
Chilled Frozen Fresh All Hot Dry Other None

2000/2001 National Food Safety Benchmark CR&C 0413Australia New Zealand Food Authority Page 33
High (65%) and medium (62%) risk businesses were more likely to check the temperature of frozenfood compared to low risk (46%) businesses (Table 14). Other than frozen food, no differences wereidentified by risk classification or business size.
Table 14: Temperature control for different types of food by business classification andbusiness size
Q9D: Which types of food do you check the temperature of when delivered?Business classification Business size
High Risk(151)
%A
Med Risk(503)
%B
Low risk(151)
%C
Small(746)
%D
Large(72)%E
Total(818)
%F
Chilled food 73 73 66 71 75 71
Frozen food 65C 62C 46 59 68 60
Fresh food 32 30 24 29 39 29
All foods 15 13 13 13 15 13
Hot food 9 9 5 8 7 8
Dry foods 2 3 0 2 1 2Base: Have hot or chilled food delivered & check temperature of food delivered (818)Note: Businesses where a risk classification has not been made have been excluded from this table
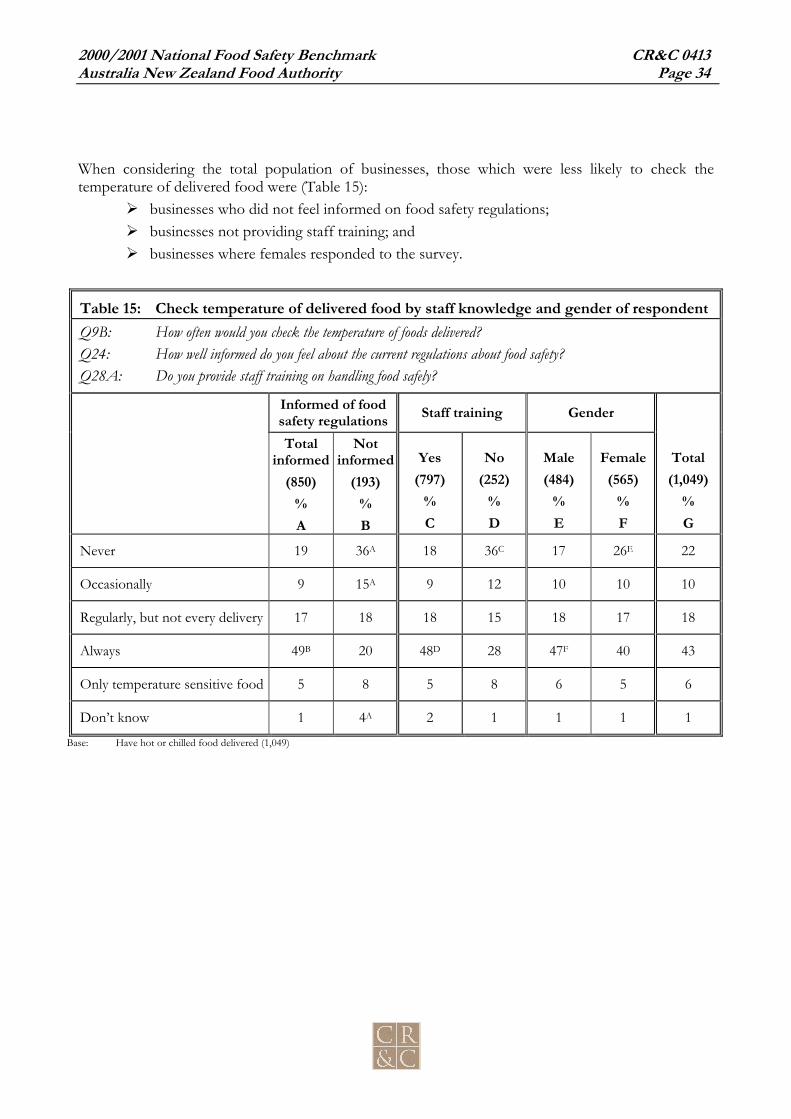
2000/2001 National Food Safety Benchmark CR&C 0413Australia New Zealand Food Authority Page 34
When considering the total population of businesses, those which were less likely to check thetemperature of delivered food were (Table 15):
businesses who did not feel informed on food safety regulations; businesses not providing staff training; and businesses where females responded to the survey.
Table 15: Check temperature of delivered food by staff knowledge and gender of respondentQ9B: How often would you check the temperature of foods delivered?Q24: How well informed do you feel about the current regulations about food safety?Q28A: Do you provide staff training on handling food safely?
Informed of foodsafety regulations Staff training Gender
Totalinformed
(850)%A
Notinformed
(193)%B
Yes(797)
%C
No(252)
%D
Male(484)
%E
Female(565)
%F
Total(1,049)
%G
Never 19 36A 18 36C 17 26E 22
Occasionally 9 15A 9 12 10 10 10
Regularly, but not every delivery 17 18 18 15 18 17 18
Always 49B 20 48D 28 47F 40 43
Only temperature sensitive food 5 8 5 8 6 5 6
Don’t know 1 4A 2 1 1 1 1
Base: Have hot or chilled food delivered (1,049)

2000/2001 National Food Safety Benchmark CR&C 0413Australia New Zealand Food Authority Page 35
7.1.4 Temperature controlled storageIf food businesses stored chilled food they were asked about their knowledge of storage temperaturesof chilled food. Most (92%) businesses stored chilled food on their premises (Figure 15).
Few (one in twenty) businesses storing chilled food did not know the correct temperaturefor storage of chilled food
One in twenty (6%) businesses storing chilled food incorrectly reported that chilled food could bestored higher than 5ºC (Figure 16). Three in twenty (15%) did not know what temperature to storechilled food, while eight in ten (78%) answered the question correctly (5ºC or lower).
Figure 15: Storing chilled food Figure 16: Temperature for storing chilled food
Q10a: Do you store chilled food at your business? Q10b: What temperature should chilled food be stored at?
Base: All respondents = 1,200 (CATI) Base: Store chilled food = 1,102 (CATI)
Low risk businesses (10%) storing chilled food, more often reported chilled food storage temperatureshigher than appropriate (5°C or less) compared to medium (5%) risk businesses (Table 16). One inten high risk (12%), one in seven medium risk (15%) and one in twenty (19%) low risk businessesdidn’t know the correct temperature.
92%
8%
0%10%
20%30%
40%50%60%
70%80%90%
100%
Yes No
78%
6%15%
0%10%20%30%40%50%60%70%80%90%
100%
<= 5°C(correct)
> 5°C Don't know

2000/2001 National Food Safety Benchmark CR&C 0413Australia New Zealand Food Authority Page 36
Nearly one in five (16%) small businesses storing chilled food did not know the correct temperaturefor storing chilled food compared with only 6% of large businesses.
Table 16: Temperature for chilled food storage by business classification and business sizeQ10B: What temperature should chilled food be stored at?
Business classification Business sizeHigh Risk
(179)%A
Med Risk(675)
%B
Low Risk(232)
%C
Small(1,020)
%D
Large(82)%E
Total(1,102)
%F
5°C or less (correct) 83C 80C 71 78 89D 78
More than 5°C 5 5 10B 6 5 6
Don’t know 12 15 19 16E 6 15
Base: Stores chilled food (1,102)
Nearly one in five high risk businesses either did not know (12%) or incorrectly stated(5%) the correct temperature of storing chilled food.
Businesses that stored chilled food, and did not feel they were informed of food safety regulations,were also more likely to report that:
chilled food should be stored at higher temperatures than appropriate (above 5°C); or they did not know at what temperature chilled food should be stored (Table 17).
One quarter (26%) of businesses without staff training programs, and who stored chilled food, wereless likely to know the correct temperature for storing chilled food (Table 17) compared to businesseswith staff training (12%).
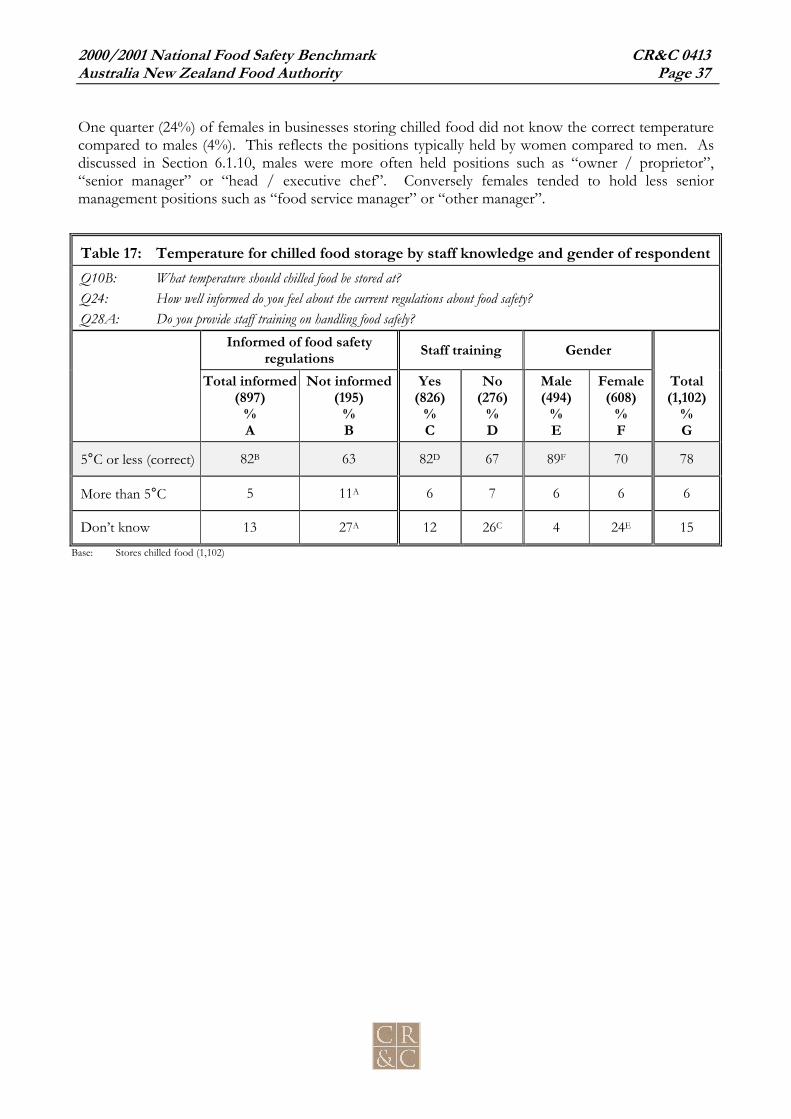
2000/2001 National Food Safety Benchmark CR&C 0413Australia New Zealand Food Authority Page 37
One quarter (24%) of females in businesses storing chilled food did not know the correct temperaturecompared to males (4%). This reflects the positions typically held by women compared to men. Asdiscussed in Section 6.1.10, males were more often held positions such as “owner / proprietor”,“senior manager” or “head / executive chef”. Conversely females tended to hold less seniormanagement positions such as “food service manager” or “other manager”.
Table 17: Temperature for chilled food storage by staff knowledge and gender of respondentQ10B: What temperature should chilled food be stored at?Q24: How well informed do you feel about the current regulations about food safety?Q28A: Do you provide staff training on handling food safely?
Informed of food safetyregulations Staff training Gender
Total informed(897)
%A
Not informed(195)
%B
Yes(826)
%C
No(276)
%D
Male(494)
%E
Female(608)
%F
Total(1,102)
%G
5°C or less (correct) 82B 63 82D 67 89F 70 78
More than 5°C 5 11A 6 7 6 6 6
Don’t know 13 27A 12 26C 4 24E 15
Base: Stores chilled food (1,102)
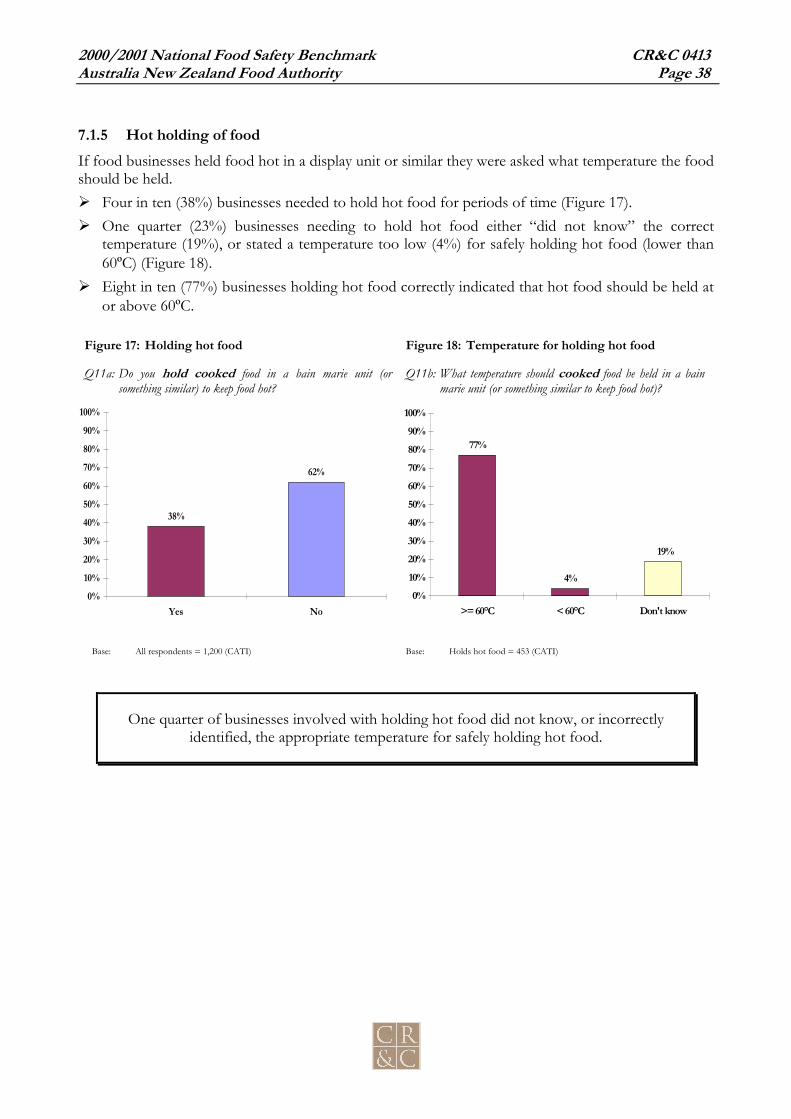
2000/2001 National Food Safety Benchmark CR&C 0413Australia New Zealand Food Authority Page 38
7.1.5 Hot holding of foodIf food businesses held food hot in a display unit or similar they were asked what temperature the foodshould be held.
Four in ten (38%) businesses needed to hold hot food for periods of time (Figure 17). One quarter (23%) businesses needing to hold hot food either “did not know” the correct
temperature (19%), or stated a temperature too low (4%) for safely holding hot food (lower than60ºC) (Figure 18).
Eight in ten (77%) businesses holding hot food correctly indicated that hot food should be held ator above 60ºC.
Figure 17: Holding hot food Figure 18: Temperature for holding hot food
Q11a: Do you hold cooked food in a bain marie unit (orsomething similar) to keep food hot?
Q11b: What temperature should cooked food be held in a bainmarie unit (or something similar to keep food hot)?
Base: All respondents = 1,200 (CATI) Base: Holds hot food = 453 (CATI)
One quarter of businesses involved with holding hot food did not know, or incorrectlyidentified, the appropriate temperature for safely holding hot food.
38%
62%
0%10%
20%30%
40%50%60%
70%80%90%
100%
Yes No
77%
4%
19%
0%10%20%30%40%50%60%70%80%90%
100%
>= 60°C < 60°C Don't know

2000/2001 National Food Safety Benchmark CR&C 0413Australia New Zealand Food Authority Page 39
Medium (21%) and low (24%) risk businesses where hot food was more likely to be held did not knowthe correct temperature for holding hot food than high risk businesses (9%) (Table 18). Similar resultswere found for small (21%) compared to large (3%) businesses.
Businesses that were informed of food regulations were more likely to know the correct temperaturefor holding food in a bain marie (80%), compared to those that did not feel informed (59%). A similarpattern was observed for staff training (Table 19)
Table 18: Temperature control for holding hot food by business classification and businesssize
Q11B: What temperature should cooked food be held in a bain Marie unit?Business classification Business size
High risk(81)%A
Med risk(323)
%B
Low risk(41)%C
Small(414)
%D
Large(39)%E
Total(453)
%F
Less than 60°C 7 3 7 5 3 4
At or above 60°C (correct) 84C 75 68 75 95D 77
Don’t know 9 21A 24A 21E 3 19
Base: Holds hot food (453)
More than three in ten (37%) businesses where hot food was held, and the business did not feelinformed of food safety regulations, or where staff training was not provided (31%), also “did notknow” the correct temperature for holding hot food (Table 19).
Table 19: Temperature for holding hot food by staff knowledge and genderQ11B: What temperature should cooked food be held in a bain marie unit?
Informed of foodsafety regulations Staff training Gender
Totalinformed
(368)%A
Notinformed
(81)%B
Yes(366)
%C
No(87)%D
Male(197)
%E
Female(256)
%F
Total(453)
%G
Less than 60°C 5 4 4 6 4 5 4
At or above 60°C (correct) 80B 59 80D 63 86F 70 77
Don’t know 15 37A 16 31C 10 26E 19
Base: Holds hot food (453)

2000/2001 National Food Safety Benchmark CR&C 0413Australia New Zealand Food Authority Page 40
Female respondents (26%) were more likely than male respondents (10%) to report that they didn’tknow the temperature for holding hot food.
7.1.6 CoolingIf food is prepared and cooked in advance it needs to be cooled rapidly to be kept safe. This onlyapplies to food that may contain bacteria and which provides a medium for bacterial growth.However, to keep questions straightforward, if businesses cooked any types of food for later use, theywere asked some questions about cooling.
One third (31%) of businesses reported that they cooked food and cooled it for later re-use (Figure19).
Figure 19: Cooking food and cooling for re-useQ12a Do you cook food and then cool it for later use?
Base: All respondents = 1,200 (CATI)
One third of businesses cook food and cool it for later re-use.
A series of true/false questions were asked about the correct procedures for cooling food that hasbeen cooked.
The first four statements offered a series of choices on how much time it should take to reduce thetemperature of foods when cooling. A fifth statement asked businesses about the procedure forstoring food in containers when cooling.
All businesses involved with cooking and then cooling food were asked to respond true or false toeach of the following:
cooked food must be cooled from 60°- 21° within two hours (True); cooked food must be cooled from 60°- 21° within four hours (False); cooked food must be cooled from 21°- 5° within six hours (False) cooked food must be cooled from 21°- 5° within four hours (True); and large amounts of cooked food should be placed in small containers and put in a cool room
or refrigerator for cooling (True).
The comparative responses for statements on temperature and time of cooling food are presented inFigure 20.
31%
69%
0%10%
20%30%
40%50%60%
70%80%90%
100%
Yes No

2000/2001 National Food Safety Benchmark CR&C 0413Australia New Zealand Food Authority Page 41
Approximately half of businesses gave the correct response to each statement with the remainderbeing equally distributed between incorrect answers and “don’t know” (Figure 20).
Figure 20: Temperature and time for safely cooling cooked foodQ12b: Thinking about cooling or chilling hot or cooked food, can you tell me whether each of the following
statements are true or false? Cooked food must be cooled from…
Base: Cools cooked food for later re-use = 375 (CATI)
Three in ten businesses (29%) either did not know (10%) or incorrectly reported “false” (19%): that“large amounts of cooked food should be placed in small containers and put in a cool room orrefrigerator for cooling” (Figure 21).
Figure 21: Safely cooling large amounts of cooked foodQ12b: Thinking about cooling or chilling hot or cooked food, can you tell me whether each of the following
statements are true or false? Large amounts of cooked food should be placed in small containers and putin a cool room or refrigerator for cooling. (True)
Base: Cools cooked food for later re-use = 375 (CATI)
Three in ten businesses (29%) involved in cooling cooked food for later re-use did notknow that large amounts of food should be placed in small containers and put in a cool
room or refrigerator for cooling.
71%
19%10%
0%10%20%30%40%50%60%70%80%90%
100%
True False Don't know
46%
28% 30%
51%45% 48%
26%29%23%22%
27%25%
0%10%20%30%40%50%60%70%80%90%
100%
From 60°- 21° in2 hrs
(True)
From 60°- 21° in4 hrs
(False)
From 21°- 5° in 6hrs
(False)
From 21°- 5° in 4hrs
(True)
True False Don't know

2000/2001 National Food Safety Benchmark CR&C 0413Australia New Zealand Food Authority Page 42
Males more often than females reported the correct responses for cooling cooked foods, females weremore likely to report “don’t know”, as were businesses where staff training was not provided (Table20).
Table 20: Cooling/Chilling cooked food by staff knowledge and genderQ12B: Thinking about cooling or chilling HOT/COOKED food, can you tell me whether each of the following
statements are true or false?Cooked food must be cooled from 60 to 21 Celsius within two hours.
Informed of foodsafety regulations Staff training Gender
Totalinformed
(308)%A
Notinformed
(60)%B
Yes(305)
%C
No(70)%D
Male(194)
%E
Female(181)
%F
Total(375)
%G
True (correct) 48 37 48 39 53B 40 46
False 29 30 30 23 33 24 29
Don’t know 23 33 22 39C 14 36 25Q12B: Thinking about cooling or chilling HOT/COOKED food, can you tell me whether each of the following
statements are true or false?Cooked food must be cooled from 60 to 21 Celsius within four hours.
True 27 30 30 21 31 25 28
False (correct) 47 38 47 36 51F 38 45
Don’t know 26 32 24 43C 18 37E 27Q12B: Thinking about cooling or chilling HOT/COOKED food, can you tell me whether each of the following
statements are true or false?Cooked food must be cooled from 21 to 5 Celsius within six hours.
True 31 27 31 29 36F 24 30
False (correct) 50 45 50D 37 53F 43 48Q12B: Thinking about cooling or chilling HOT/COOKED food, can you tell me whether each of the following
statements are true or false?Cooked food must be cooled from 21 to 5 Celsius within four hours.
True (correct) 51 53 54D 40 60F 42 51
False 28 17 27 21 26 25 26
Don’t know 21 30 19 39C 14 33E 23Q12B: Thinking about cooling or chilling HOT/COOKED food, can you tell me whether each of the following
statements are true or false?Large amounts of cooked food should be placed in small containers and put in a cool room or refrigerator forcooling.
True (correct) 73 62 74D 59 69 73 71False 18 23 17 24 21 16 19Don’t know 8 15 9 17C 10 11 10
Base: Cooks food then cools for re-use (375)Note: Columns do not add to base because “don’t know” columns are not included.

2000/2001 National Food Safety Benchmark CR&C 0413Australia New Zealand Food Authority Page 43
7.1.7 Holding food at room temperaturePotentially hazardous food can be safely held at room temperature for a very limited amount of timebecause pathogenic bacteria may multiply rapidly at these temperatures. As the answers needed to beclearly related to potentially hazardous foods (and not to other foods e.g. some hot desserts), thequestion described types of food that are potentially hazardous to the business. The foods describedwere lasagne and cooked rice. Businesses were given time intervals and asked to give the correct timethat these types of food could be left at room temperature.
Very few businesses (3%) knew how long that cooked, potentially hazardous food (to be served hot)could be left at room temperature (Figure 22). The correct response was between 2-4 hours. Eight inten businesses (79%) specified a shorter time period, and one fifth (17%) did not know.
Figure 22: Safely leaving potentially hazardous food at room temperatureQ13: How long can potentially hazardous food that is meant to be served hot be left at room temperature
and still be safe? For example, how long can you safely leave lasagne or cooked rice at room temperature?
Base: Handles “ready-to-eat food” AND holds hot food OR cools cooked food for re-use =367 (CATI)
65%
14% 17%
1%3%0%
10%20%30%40%50%60%70%80%90%
100%
< 1 hour 1 - 2 hours 2 - 4 hours(True)
4 - 6 hours Don't know

2000/2001 National Food Safety Benchmark CR&C 0413Australia New Zealand Food Authority Page 44
7.1.8 Ready to eat foods requiring refrigerationThe knowledge of businesses on the types of food that had to be kept refrigerated was checked.Specific foods were listedBusinesses involved in preparing or handling ready-to-eat foods were read out a list of ready-to-eatfoods and asked if they needed to be kept refrigerated in order to remain safe.The correct responses included the following foods that needed to be kept refrigerated:
lasagne; egg sandwiches; beef curry; or cooked rice.
The vast majority of businesses questioned would keep most prepared, ready-to-eat foods refrigeratedto ensure they remained safe (Figure 23). However approximately one in ten would not keep lasagne,egg sandwiches or beef curry in the fridge. Two in ten (19%) did not consider it necessary to keepcooked rice in the refrigerator.
Figure 23: Ready-to-eat foods needing refrigerationQ14: Which of the following foods need to be kept refrigerated to ensure they remain safe?
Base: Handles “ready-to-eat food” = 552 (CATI)
Two in ten businesses that handle ready-to-eat food did not report that it was important tokeep cooked rice refrigerated.
90% 90%
3%
89% 88%81%
84%
34%
0%10%20%30%40%50%60%70%80%90%
100%
Lasagne Cheddarcheese
Eggsandwich
Beefcurry
Salami Cookedrice
Peanutbutter
Don'tknow
(True) (True) (True) (True)

2000/2001 National Food Safety Benchmark CR&C 0413Australia New Zealand Food Authority Page 45
Females more often than males nominated the correct foods needing to be kept refrigerated to ensurethey remained safe (Table 21). Rural and regional based businesses were more aware of the need forthe refrigeration of cooked rice and beef curry when compared with metropolitan businesses. It isworth noting that while women were more likely to recognise the foods that require refrigeration, theywere less likely to know the temperature at which food should be refrigerated.
Table 21: Potentially hazardous food needing refrigeration by gender and regionQ14: Which of the following foods need to be kept refrigerated to ensure they remain safe?
Gender RegionMale(251)
%A
Female(301)
%B
Metropolitan(261)
%C
Regional(291)
%D
Total(552)
%E
Cooked rice 78 84A 78 85C 81
Salami 83 86 83 86 84
Lasagne 87 93A 89 91 90
Egg sandwich 86 92A 87 91 89
Peanut butter 28 39A 30 38C 34
Beef curry 85 89 84 90C 88
Cheddar cheese 84 94A 88 91 90
Don’t know 4B 1 3 3 3
Base: Handles ready to eat table meals (552)
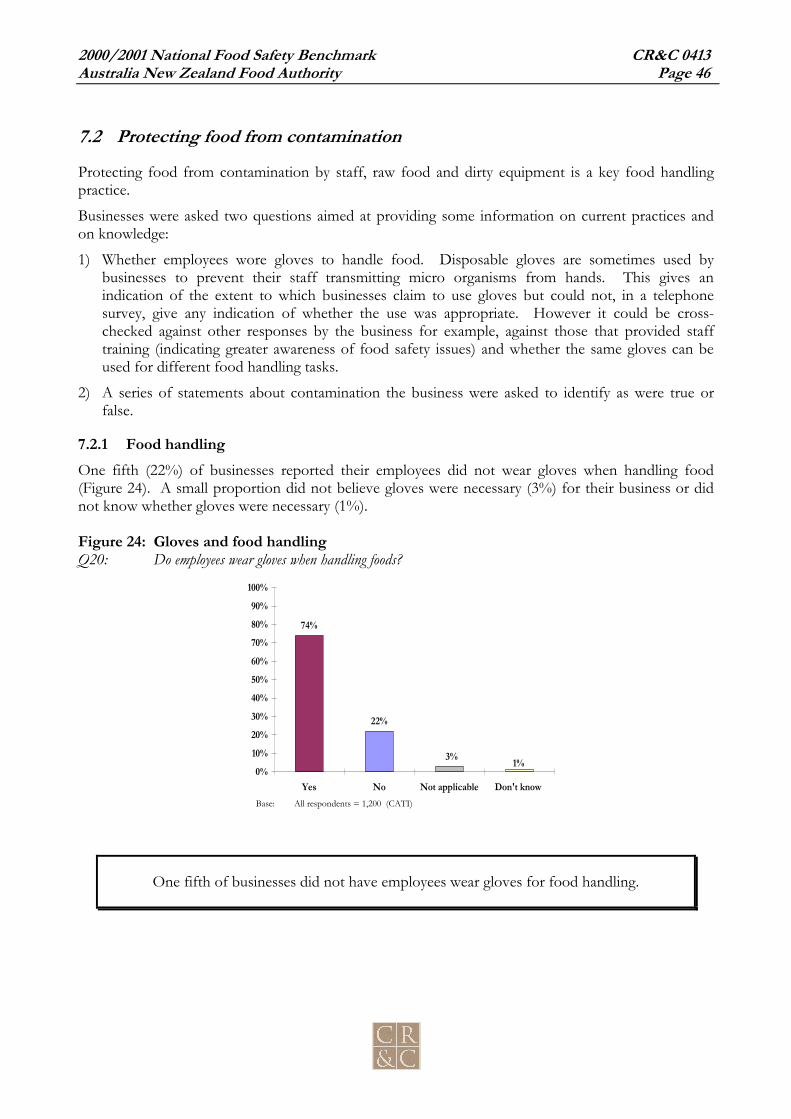
2000/2001 National Food Safety Benchmark CR&C 0413Australia New Zealand Food Authority Page 46
7.2 Protecting food from contamination
Protecting food from contamination by staff, raw food and dirty equipment is a key food handlingpractice.
Businesses were asked two questions aimed at providing some information on current practices andon knowledge:
1) Whether employees wore gloves to handle food. Disposable gloves are sometimes used bybusinesses to prevent their staff transmitting micro organisms from hands. This gives anindication of the extent to which businesses claim to use gloves but could not, in a telephonesurvey, give any indication of whether the use was appropriate. However it could be cross-checked against other responses by the business for example, against those that provided stafftraining (indicating greater awareness of food safety issues) and whether the same gloves can beused for different food handling tasks.
2) A series of statements about contamination the business were asked to identify as were true orfalse.
7.2.1 Food handlingOne fifth (22%) of businesses reported their employees did not wear gloves when handling food(Figure 24). A small proportion did not believe gloves were necessary (3%) for their business or didnot know whether gloves were necessary (1%).
Figure 24: Gloves and food handlingQ20: Do employees wear gloves when handling foods?
Base: All respondents = 1,200 (CATI)
One fifth of businesses did not have employees wear gloves for food handling.
74%
22%
3% 1%0%
10%
20%30%
40%50%60%
70%80%90%
100%
Yes No Not applicable Don't know

2000/2001 National Food Safety Benchmark CR&C 0413Australia New Zealand Food Authority Page 47
Businesses where staff were more likely to wear gloves included: high (82%) and medium (77%) risk compared to low risk (63%); large businesses (84%) compared to small (74%); those located in the ACT (90%) or NSW (85%) compared with VIC (73%), QLD (73%),
SA (68%), WA (68%) and NT (58%); those where a female (80%) was interviewed rather than a male (68%); and those providing staff training (78%) compared to those without training (65%).
A series of true/false statements about general knowledge of safe food handling practices were askedof all CATI surveyed businesses including:
the same gloves can be used to unpack raw vegetables and to slice cold meat (False); the same gloves can be used to clean and wipe tables as well as unstacking the dishwasher
(False); the same equipment can be used to prepare raw meat and raw vegetables that are going to
be cooked together (True); thinking about storing vegetables in the cool room, raw vegetables can be stored above
uncovered cooked food (False); a knife can be cleaned by wiping with a damp sponge (False); it is safe for food handlers to directly touch bread (False); and it is safe for food handlers to directly touch ham (False).
Sometimes a business stated that the issue was not applicable for their business and would not give aresponse. In the case of these true/false statements a “not applicable” answer should be viewed asanother segment of “don’t know”.
A very small proportion (2%) of businesses incorrectly reported that they could wear the same glovesfor unpacking raw vegetables as well as slicing cold meat (Figure 25). Similarly, one in twenty (4%)incorrectly believed the same gloves could be used for both for cleaning and wiping tables, thenunpacking the dishwasher. One per cent did not know whether these statements were true or false.
Figure 25: Wearing gloves for multiple food handling tasksQ21a: Please answer true or false to the following…
The same gloves can be used to unpack raw vegetables and to slice cold meat. (False)The same gloves can be used to clean and wipe tables as well as unstacking the dishwasher. (False)
Base: All respondents = 1,200 (CATI)
2% 4%
85%
1% 1%
90%
7% 10%
0%10%20%30%40%50%60%70%80%90%
100%
Same gloves can be used to unpack rawvegetables and to slice cold meat (False)
Same gloves can be used to clean and wipetables as well as unstacking the dishwasher
(False)
True False Not applicable Don't know

2000/2001 National Food Safety Benchmark CR&C 0413Australia New Zealand Food Authority Page 48
Less than one in ten (8%) businesses answered correctly that it was true they could “use the sameequipment to prepare meat and raw vegetables that were going to be cooked together” (Figure 26).Another 10% did not believe the question was relevant to them (9%) or did not know the answer(1%).
Fewer than one in ten (7%) incorrectly thought it was safe to store raw vegetables on a shelf aboveuncooked cooked food. In total, one in ten did not think it was an applicable question for them (12%)or did not know (3%) the answer to this statement.
Figure 26: Handling raw vegetables and cooked foodQ21a: Please answer True/ False to the following…
The same equipment can be used to prepare raw meat and raw vegetables that are going to be cookedtogether. (True)Thinking about storing vegetables in the cool room, raw vegetables can be stored above uncovered cookedfood. (False)
Base: All respondents = 1,200 (CATI)
The final few true/false statements dealt with contamination of food directly by handlers touching orcleaning food implements.
A substantial two in ten (21%) businesses surveyed incorrectly believed it was safe for food handlers todirectly touch bread and another 10% were unsure or felt the question was not applicable to them(Figure 27).
8% 7%
78%
2% 3%
81%
12%9%
0%10%20%30%40%50%60%70%80%90%
100%
Same equipment can be used to prepareraw meat and raw vegetables that are going
to be cooked together (True)
Raw vegetables can be stored aboveuncovered cooked food (False)
True False Not applicable Don't know

2000/2001 National Food Safety Benchmark CR&C 0413Australia New Zealand Food Authority Page 49
Only one in twenty incorrectly believed they could safely clean a knife by wiping with a damp sponge(4%) or that it was safe for food handlers to directly touch ham (7%).
Figure 27: Food handling: touching food and cleaning utensilsQ21a: Please answer true/false to the following….
A knife can be cleaned by wiping with a damp sponge. (False)It is safe for food handlers to directly touch bread. (False).It is safe for food handlers to directly touch ham. (False)
Base: All respondents = 1,200 (CATI)
A notable two in ten businesses surveyed believed it was an acceptable practice for foodhandlers to directly touch bread.
7.3 Personal hygiene and staff illnessThere are requirements in the Food Safety Standards to control the transmission of illness throughfood from food handlers who are ill, have symptoms or otherwise might transmit the pathogens theyare, or maybe, carrying.
Staff that are unwell with an illness that may be foodborne, or who may be a carrier of such an illness,can transmit that illness through food if they are at work. For example, persons who present at workwith a symptom such as diarrhoea could have an illness that could be transmitted through food. Theypose a risk of transmitting that illness if they handle food, eating and drinking utensils or equipmentthat comes in contact with food. Such persons should not be handling food.
4%
21%
7%
69%
85%
1% 4% 2%
92%
6%7%3%
0%10%20%30%40%50%60%70%80%90%
100%
A knife can be cleaned bywiping with a damp sponge
(False)
It is safe for food handlers todirectly touch bread (False)
It is safe for food handlers todirectly touch ham (False)
True False Not applicable Don't know

2000/2001 National Food Safety Benchmark CR&C 0413Australia New Zealand Food Authority Page 50
7.3.1 Food handlingThree food handling tasks were presented to businesses, the businesses were then asked whether anemployee with an illness of diarrhoea should avoid these tasks.
Half of the businesses interviewed reported that staff experiencing an illness of diarrhoea should not“handle unpackaged food” (52%), “serve food” (50%) or “set the table” (47%). The reverse was alsotrue; one half of businesses did not believe these tasks should be avoided (Figure 28).
In addition to the three tasks suggested: four in ten (37%) businesses gave an unprompted mention that employees with diarrhoea
should not be at work; and another 3% mentioned employees with diarrhoea should not undertake any tasks that
would involve food or food implements.
Figure 28: Safe food handling and staff illnessQ22: If you have an employee with diarrhoea, which of the following tasks should they avoid?
Base: All respondents = 1,200 (CATI)Total is greater than 100% due to multiple responses
Half of food businesses thought it would be acceptable for employees experiencingdiarrhoea to undertake food handling tasks such as “handling unpackaged food”, “serving
food” or “setting the table”.
4%
1%
2%
3%
37%
47%
50%
52%
0% 10% 20% 30% 40% 50% 60%
Not applicable
Other
Don't know
Anything to do with food /implements
Everything / shouldn't be at work
Setting tables(Avoid)
Serving food(Avoid)
Handling unpackaged fooddirectly(Avoid)

2000/2001 National Food Safety Benchmark CR&C 0413Australia New Zealand Food Authority Page 51
7.4 Cleaning and sanitation
Businesses are required under the new Food Safety Standards (or will be when the Standards are inforce in the jurisdiction) to ensure that they use only eating and drinking utensils and food contactsurfaces that are clean and sanitary.
Clean and sanitised eating and drinking utensils, as well as equipment that is in contact with food,minimises the risk of transferring pathogenic micro organisms to food. Generally, using a properlyworking dishwasher is a more effective way of cleaning and sanitising equipment than washingmanually. This is because dishwashers make use of more effective cleaning chemicals and very hotwater for rinsing. In addition, many models include drying cycles.
Information was sought on how businesses cleaned and sanitised their eating and drinking utensils andequipment used for food preparation.
7.4.1 Washing containers and utensilsBusinesses were asked whether they used dishwashers or whether they washed equipment manually(by hand). They were also asked whether they knew the temperature of the final rinse of thedishwasher.
The most frequently utilised method of cleaning containers and utensils was hand washing (Figure 29).Six in ten (59%) businesses undertook hand washing only and one quarter (24%) used both handwashing and a dishwasher. One in ten (11%) used a dishwasher only.
Figure 29: Method of washing containers and utensilsQ15: When washing containers and utensils used for food preparation or eating, do you use a dishwasher, do you
hand wash, or both?
Base: All respondents = 1,200 (CATI)
Business more likely to have “hand washing facilities only” included: small (61%) compared to large (40%); and medium (62%) and low (64%) risk compared to high risk (41%).
59%
24%
11%5% 1%
0%10%20%30%40%50%60%70%80%90%
100%
Handwashing only
Both Dishwasheronly
Notapplicable
Don't know

2000/2001 National Food Safety Benchmark CR&C 0413Australia New Zealand Food Authority Page 52
Six in ten businesses used hand washing for cleaning and sanitising containers and utensilsfor food preparation or eating.
One third (35%) of businesses using a dishwasher did not know the temperature of the final rinse oftheir dishwasher (Figure 30). Four in ten (39%) businesses reported a final rinse higher than 80°C.One in ten (9%) businesses reported temperatures too low to kill bacteria, that is below 70°C
Two in ten (19%) businesses reported a correct temperature of 70-80°C.
One third (36%) of businesses that used hand washing for food preparation materials did not knowwhat temperature of hot water would kill bacteria on utensils (Figure 31). One quarter of businessreported hand washing temperatures below 70°C; temperatures too low to kill bacteria.
Figure 30: Temperature of final rinse in dishwasher Figure 31: Hand washing and food safety
Q16: What is the temperature of the final rinse in your dishwasher? Q17: When hand washing, what temperature of hot water will killbacteria on food preparation utensils
Base: Business uses dishwasher = 418 (CATI) Base: Business hand washes = 992 (CATI)
7.4.2 Chemical sanitisersIf a business cleans and sanitises eating and drinking utensils and food contact surfaces by hand it canuse a chemical sanitiser to sanitise. Businesses that cleaned manually were asked whether they usedsanitisers and some questions to establish if they had knowledge of using the sanitisers.
2%7%
35%39%
17%
0%10%20%30%40%50%60%70%80%90%
100%
50°- 60° 60°-70° 70°-80° (Correct)
Over 80° Don't know
6%
18%13%
21%
2%1%
36%
0%10%20%30%40%50%60%70%80%90%
100%
50°- 60° 70°- 80° (Correct)
Boiling Don'tknow
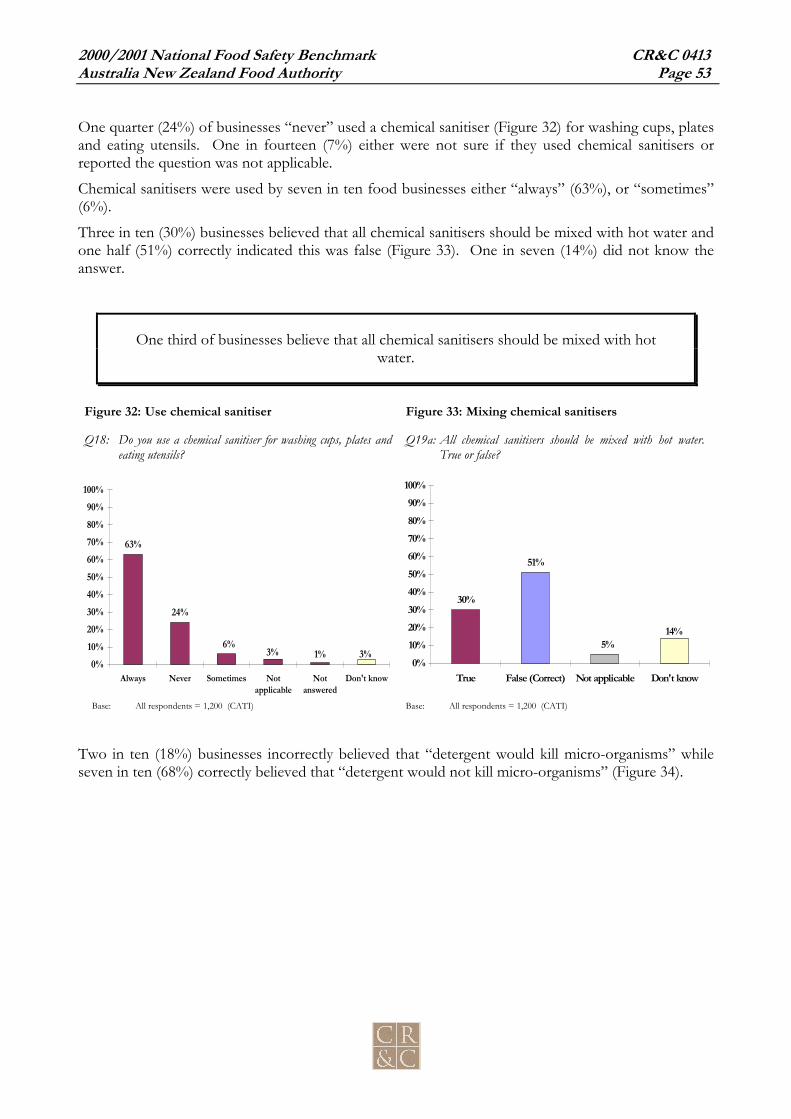
2000/2001 National Food Safety Benchmark CR&C 0413Australia New Zealand Food Authority Page 53
One quarter (24%) of businesses “never” used a chemical sanitiser (Figure 32) for washing cups, platesand eating utensils. One in fourteen (7%) either were not sure if they used chemical sanitisers orreported the question was not applicable.
Chemical sanitisers were used by seven in ten food businesses either “always” (63%), or “sometimes”(6%).
Three in ten (30%) businesses believed that all chemical sanitisers should be mixed with hot water andone half (51%) correctly indicated this was false (Figure 33). One in seven (14%) did not know theanswer.
One third of businesses believe that all chemical sanitisers should be mixed with hotwater.
Figure 32: Use chemical sanitiser Figure 33: Mixing chemical sanitisers
Q18: Do you use a chemical sanitiser for washing cups, plates andeating utensils?
Q19a: All chemical sanitisers should be mixed with hot water.True or false?
Base: All respondents = 1,200 (CATI) Base: All respondents = 1,200 (CATI)
Two in ten (18%) businesses incorrectly believed that “detergent would kill micro-organisms” whileseven in ten (68%) correctly believed that “detergent would not kill micro-organisms” (Figure 34).
63%
24%
6%3% 3%1%
0%10%20%30%40%50%60%70%80%90%
100%
Always Never Sometimes Notapplicable
Notanswered
Don't know
30%
51%
14%5%
0%10%20%30%40%50%60%70%80%90%
100%
True False (Correct) Not applicable Don't know

2000/2001 National Food Safety Benchmark CR&C 0413Australia New Zealand Food Authority Page 54
Very few (4%) businesses incorrectly reported it was false that: “a dirty chopping board needed to bewashed before being sanitised” (Figure 35:). The correct response of “true” was given by nine in tenbusinesses (89%).
Figure 34: Detergent and micro-organisms Figure 35: Sanitising chopping boards
Q19b: Detergent kills micro-organisms. True or false? Q19c A dirty chopping board must be washed before beingsanitised. True or false?
Base: All respondents = 1,200 (CATI) Base: All respondents = 1,200 (CATI)
Businesses less likely to report that a “dirty chopping board needed to be washed before beingsanitised” included:
low risk (80%) compared to medium (92%) or high (93%) risk; and large (83%) compared to small (90%).
7.5 Staff trainingThe Food Safety Standards will, when the relevant provision comes into effect, require foodbusinesses to ensure that their staff have skills and knowledge in food safety and food hygiene mattersrelevant to the work carried out by the staff.The Standards do not specify how businesses must ensure that their staff have these skills andknowledge. There are many alternatives that range from formal training courses to in-house, on-the-job training. Businesses were asked whether they provided any staff training and the type of trainingprovided.
18%
68%
2%12%
0%10%20%30%40%50%60%70%80%90%
100%
True False (Correct) Not applicable Don't know
89%
4% 5%2%
0%10%20%30%40%50%60%70%80%90%
100%
True (Correct) False Not applicable Don't know

2000/2001 National Food Safety Benchmark CR&C 0413Australia New Zealand Food Authority Page 55
One quarter (26%) of businesses reported they did not provide staff training on food handling safety(Figure 36). Specific differences that appeared included:
provision of staff training was directly proportional to the level of risk associated with thebusiness, that is, businesses classified as having a high level of food safety risk more oftenreported provided staff training (90%) compared with medium (74%) or low risk (62%);
businesses supplying foods to high risk groups more often provided training (85%)compared to those businesses not providing foods to high risk groups (72%); and
regional differences were also apparent where metropolitan businesses more oftenprovided staff training (78%) compared with regional and rural businesses (70%).
Figure 36: Staff trainingQ28a: Do you provide staff training on handling food safely?
Base: All respondents = 1,200 (CATI)
Figure 37: Type of staff trainingQ28b: If yes, what kind of training? (all mentions)
Base: Provided staff training = 887 (CATI)
74%
26%
0%10%
20%30%
40%50%60%
70%80%90%
100%
Yes No
1%
2%
1%
3%
5%
5%
7%
28%
75%
0% 10% 20% 30% 40% 50% 60% 70% 80%
Not applicable (no employees)
Health / food safety inspectors
Food safety video
Informal / on the job
Circulate regulation documents
Food safety manager at workplace
Circulate brochures, pamphlets
Staff training programs (external)
Formal induction at workplace

2000/2001 National Food Safety Benchmark CR&C 0413Australia New Zealand Food Authority Page 56
High risk (43%) more often provide “external staff training” compared with medium(25%) and low (22%) risk businesses.
Metropolitan (78%) businesses were more likely to provide “induction training programs atthe workplace” compared to regional businesses (72%)
Business that supplied food to high risk groups (42%) tended to offer “staff trainingexternal to the workplace” compared to those not supplying high risk groups (24%).
Regional and rural businesses were more likely to provide “staff training external to theworkplace” (31%) compared to metropolitan business (24%).

2000/2001 National Food Safety Benchmark CR&C 0413Australia New Zealand Food Authority Page 57
7.6 Source of food safety information
The Commonwealth, State and local governments produce advice for food businesses on food safetymatters and on food safety legislation. There is also information available from professional andindustry organisations, in books and magazines, in other media sources and on the Internet.
It is useful for these organisations to know where food businesses go to for information in order thatthey can provide the information where it will be accessed by the most businesses.
Businesses were asked where they sought information, was food safety information easy to find andwhether they were aware of the new Food Safety Standards.
7.6.1 Information about food safetyThe most frequently mentioned sources of information for food safety issues were “local council”(47%) and “State and Territory Health Department” (42%) (Figure 38). The third most frequentlymentioned source was “industry associations and specialist consultants” (24%).Only a very small group of businesses (2%) mentioned they would obtain information specificallyfrom ANZFA. Less than 1% of businesses indicated they would look for information on the Internet.
Figure 38: Sources of food safety informationQ23: If you need information about food safety or hygiene, who would you contact? (All mentions)
Base: All respondents = 1,200 (CATI)Note: Total equals more than 100% due to multiple response
The Internet is almost never used by food businesses for food and safety information.
1%
2%
2%
3%
4%
3%
3%
4%
5%
7%
24%
42%
47%
0% 5% 10% 15% 20% 25% 30% 35% 40% 45% 50%
Boss / manager
ANZFA
Food Safety person (internal)
Local health inspector
TAFE / course
Head office
Books & manuals
Supplier
Don't know
In-house resources
Consultants/Industry association
State/Territory health depart
Local council

2000/2001 National Food Safety Benchmark CR&C 0413Australia New Zealand Food Authority Page 58
Variations in location information occurred among the following groups:
small businesses were more likely to contact “local councils” (48%) compared with largebusiness (30%);
males (28%) more often contacted “industry associations” compared with females (21%); businesses supplying food to high-risk groups (33%) more often obtained information
from “industry associations” compared to those not supplying these groups (22%); and businesses reporting they felt “informed” on food safety issues (26%) sought information
from “industry associations” less frequently compared to those “not informed” (61%).
One quarter (24%) of businesses did not find it easy to locate information on food safety (Figure 39).A small but notable proportion had “never looked for it” (6%) or didn’t know (21%) if it was difficultto locate information or not.
Figure 39: Ease of locating food safety informationQ26: Do you find it easy to locate food safety information?
Base: All respondents = 1,200 (CATI)
Businesses more likely to report it was “not easy to locate information” included: medium risk (26%) compared to low risk (20%); those not involved in manufacturing (25%) compared to being a manufacturing company
(22%); and those processing food (25%) compared to not processing food (19%).
Businesses that did not provide staff training (10%) were more likely to indicate they had “neverlooked for food safety information” compared to organisations that did offer staff training (5%).
68%
24%
6%2%
0%10%20%30%40%50%60%70%80%90%
100%
Yes No Never looked forit
Don't know
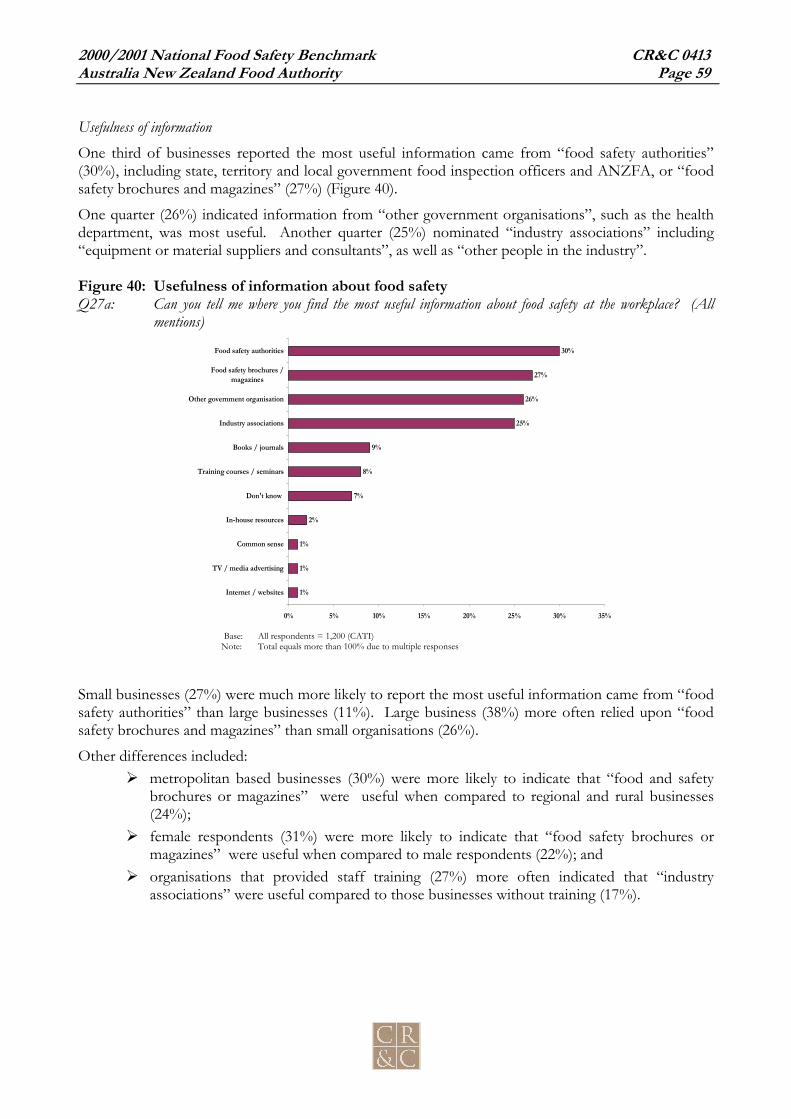
2000/2001 National Food Safety Benchmark CR&C 0413Australia New Zealand Food Authority Page 59
Usefulness of informationOne third of businesses reported the most useful information came from “food safety authorities”(30%), including state, territory and local government food inspection officers and ANZFA, or “foodsafety brochures and magazines” (27%) (Figure 40).
One quarter (26%) indicated information from “other government organisations”, such as the healthdepartment, was most useful. Another quarter (25%) nominated “industry associations” including“equipment or material suppliers and consultants”, as well as “other people in the industry”.
Figure 40: Usefulness of information about food safetyQ27a: Can you tell me where you find the most useful information about food safety at the workplace? (All
mentions)
Base: All respondents = 1,200 (CATI)Note: Total equals more than 100% due to multiple responses
Small businesses (27%) were much more likely to report the most useful information came from “foodsafety authorities” than large businesses (11%). Large business (38%) more often relied upon “foodsafety brochures and magazines” than small organisations (26%).
Other differences included: metropolitan based businesses (30%) were more likely to indicate that “food and safety
brochures or magazines” were useful when compared to regional and rural businesses(24%);
female respondents (31%) were more likely to indicate that “food safety brochures ormagazines” were useful when compared to male respondents (22%); and
organisations that provided staff training (27%) more often indicated that “industryassociations” were useful compared to those businesses without training (17%).
1%
1%
1%
2%
7%
8%
9%
25%
26%
27%
30%
0% 5% 10% 15% 20% 25% 30% 35%
Internet / websites
TV / media advertising
Common sense
In-house resources
Don't know
Training courses / seminars
Books / journals
Industry associations
Other government organisation
Food safety brochures /magazines
Food safety authorities
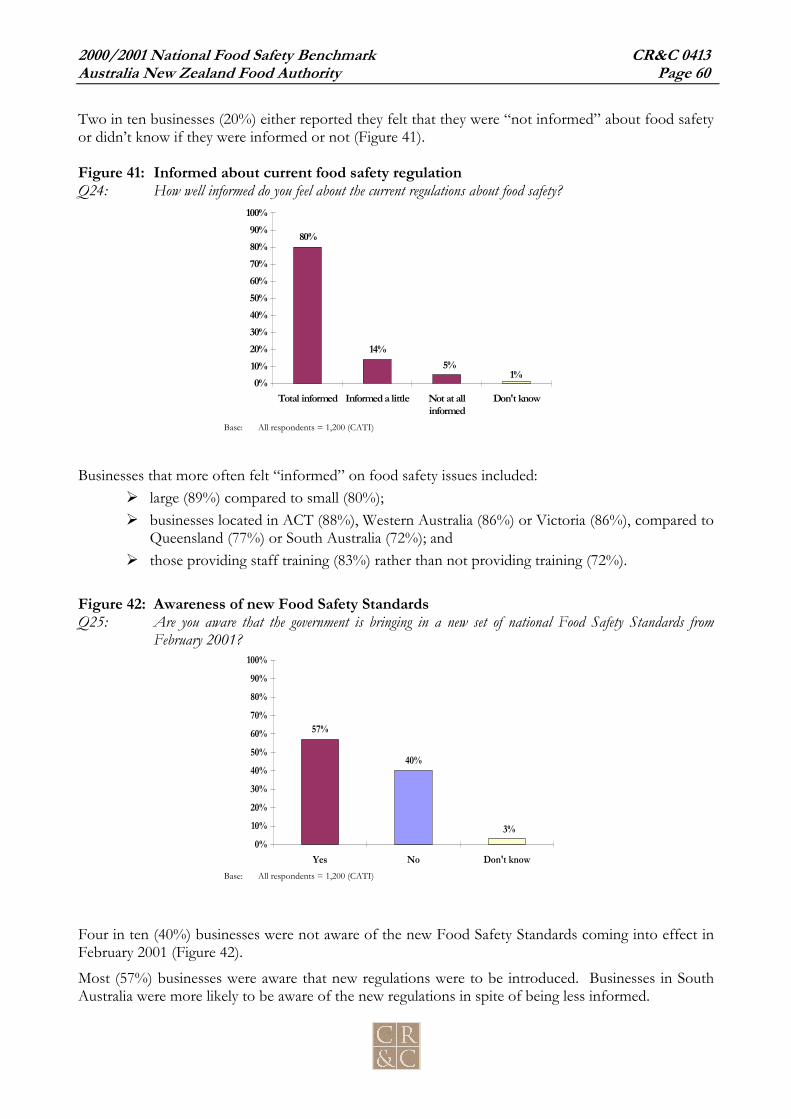
2000/2001 National Food Safety Benchmark CR&C 0413Australia New Zealand Food Authority Page 60
Two in ten businesses (20%) either reported they felt that they were “not informed” about food safetyor didn’t know if they were informed or not (Figure 41).
Figure 41: Informed about current food safety regulationQ24: How well informed do you feel about the current regulations about food safety?
Base: All respondents = 1,200 (CATI)
Businesses that more often felt “informed” on food safety issues included: large (89%) compared to small (80%); businesses located in ACT (88%), Western Australia (86%) or Victoria (86%), compared to
Queensland (77%) or South Australia (72%); and those providing staff training (83%) rather than not providing training (72%).
Figure 42: Awareness of new Food Safety StandardsQ25: Are you aware that the government is bringing in a new set of national Food Safety Standards from
February 2001?
Base: All respondents = 1,200 (CATI)
Four in ten (40%) businesses were not aware of the new Food Safety Standards coming into effect inFebruary 2001 (Figure 42).
Most (57%) businesses were aware that new regulations were to be introduced. Businesses in SouthAustralia were more likely to be aware of the new regulations in spite of being less informed.
57%
40%
3%0%
10%20%
30%40%50%
60%70%
80%90%
100%
Yes No Don't know
80%
14%5%
1%0%
10%20%30%40%50%60%70%80%90%
100%
Total informed Informed a little Not at allinformed
Don't know

2000/2001 National Food Safety Benchmark CR&C 0413Australia New Zealand Food Authority Page 61
Awareness varied across business types and categories, greater awareness occurred among: high risk (62%) businesses compared to low risk (52%); large organisation (69%) compared to small (56%); South Australian businesses (73%) compared to the other larger states (52% - 53%); and organisations manufacturing food (62%) as opposed to not manufacturing (53%).

2000/2001 National Food Safety Benchmark CR&C 0413Australia New Zealand Food Authority Page 62
8 EHO/PHU On-site surveys among food businessesOn-site surveys were completed by Environmental Health officers (EHO’s) or, in NSW, Public HealthUnit (PHU’s) officers. The on-site survey used the skills of these trained personnel, usually employedby local government, to assess food businesses. The officers were briefed to collect the survey data ina consistent manner.
EHOs were instructed to record responses based on their observations rather than questioning theproprietor or manager whenever possible. If a surveyor was unable to observe a practice because itdid not occur during their visit (such as food deliveries), they questioned someone responsible andknowledgeable (the owner or manager) to establish business practices in that situation. Wheninformation was sought from someone at the business the surveyor was to complete the question withthe appropriate answer (e.g. “yes/no”) and also circle “not observed”. Thus, “not observed” doesnot indicate that the element was not assessed, but that the information was based on discussion ratherthan observation of the practice. The percentage of “not observed” responses was dependent on thespecific task and the same percentage would not be expected for each task. That is, while one taskmay not have been observed, other tasks were observed.
In most cases responses were limited to “yes/no” choices, other questions provided a list of responseoptions appropriate to the question.
Responses presented in the graphs in this section of the report: nett yes (combined “yes” and “yes but not observed”); nett no (combined “no” and “no but not observed”); and not applicable (measure does not apply to this business, e.g. If a business does not have
food delivered the response to delivery outside business hours would be “not applicable”).
The percentage of “not observed” cases is identified under each graph.
8.1 Temperature control
Information was sought on the practices used by businesses to ensure that potentially hazardous foodis kept under temperature control during storage, display and transport. Businesses can maintainsafety by keeping chilled food 5°C or below, hot food 60°C or above or by ensuring that the time thatpotentially hazardous food is at another temperature is insufficient to allow bacteria to multiply tounsafe levels.
Businesses that were not storing, displaying or transporting potentially hazardous food at the abovetemperatures were asked whether they had an alternative system to ensure the time/temperature wassafe and whether they documented that system.
The EHO survey identified whether businesses cooked potentially hazardous food to the correcttemperature for an adequate time and whether reheating of food that was to be held hot was carriedout correctly. Temperature control of frozen food was also identified.
The EHOs identified whether businesses had a probe thermometer to measure temperature andwhether staff knew how to use it.

2000/2001 National Food Safety Benchmark CR&C 0413Australia New Zealand Food Authority Page 63
8.1.1 Receiving foodIt is important that potentially hazardous food is under temperature control when received by abusiness and that businesses have a system for checking potentially hazardous food when it isdelivered. A staff member needs to be available to check temperatures or the business needs to havesome other system for ensuring food is at the correct temperature.
The EHO survey identified whether businesses had food delivered outside businesses hours, whethertemperature checks were made or whether the business had alternative, documented systems in place.
One quarter (23%) of businesses had food delivered outside of business hours (Figure 43). Fooddelivery to these businesses may have been be at risk of contamination through lack of temperaturecontrol depending on the types of food delivered and the set-up in the receiving area.
Figure 43: Food delivered outside business hoursQ9 Food is delivered to the premises outside of business hours?
Base: All respondents = 483 (EHO)Response given but practice not observed by EHO = 48% of base
8.1.2 Thermometers and checking temperature of foodBusinesses that check potentially hazardous food need a probe thermometer if they are to check thefood temperature accurately. The EHO survey identified whether businesses had a thermometer; staffknew how to use it and the procedure staff used to take temperatures.
23%
75%
1%0%
10%20%30%40%50%60%70%80%90%
100%
Yes No Don't Know/NoAnswer

2000/2001 National Food Safety Benchmark CR&C 0413Australia New Zealand Food Authority Page 64
Six in ten (60%) businesses handling potentially hazardous food did not have a probe thermometer(Figure 44). Staff did not know how to use a probe thermometer in one in ten (9%) businesses wherea probe thermometer was reported (Figure 45).
Figure 44: Probe thermometer Figure 45: Use of probe thermometer
Q45: If applicable, the business has a probe thermometer. Q46: If applicable, the staff know how to use the probethermometer.
Base: Handles potentially hazardous food suitable for a probe thermometer = 466 (EHO) Base: Have probe thermometer = 184 (EHO)Response given but practice not observed by EHO = 8% of base Response given but practice not observed by EHO = 30% of base
Businesses that were more likely to have a probe thermometer included: high risk businesses (53%) compared with medium risk (34%); large businesses (80%) compared to small businesses (35%); businesses located in metro (45%) compared with regional areas (34%); businesses supplying food for high risk groups (62%) compared to those not supplying
these groups with food (35%); those that had potentially hazardous food delivered (58%) compared to those who do not
(31%); businesses that reported they checked the temperature of delivered food (73%) compared
to those not checking (23%); and those with a written food safety program (89%) compared to not having a written plan
(29%).
Six in ten businesses handling potentially hazardous food did not have a probethermometer.
39%
60%
0%0%
10%20%30%40%50%60%70%80%90%
100%
Yes No Don't Know/NoAnswer
88%
9%2%
0%10%20%30%40%50%60%70%80%90%
100%
Yes No Don't Know/NoAnswer

2000/2001 National Food Safety Benchmark CR&C 0413Australia New Zealand Food Authority Page 65
Checking the temperature of food was undertaken by variety of methods depending on the food typeand location where the check was carried out (Figure 46).
EHOs reported that six in ten (57%) businesses used “sight” when assessing food temperatures.Additionally “touch” was used by four in ten (43%) businesses.
Half (52%) of businesses used a temperature gauge located inside a vehicle, oven or other containerand one third (36%) used a thermometer.
Figure 46: Methods for checking food temperatureQ47 How do staff generally check the temperature of the food?
Base: All respondents = 483 (EHO)Total is greater than 100% due to multiple responses
One third of businesses checked the temperature of food with a thermometer.
“Other” methods for measuring food temperature among one in ten businesses included: experience (3%); time and invoice record of delivery (2%); temperature of equipment (1%); sound, taste, test, smell or routine checks (2%); or standard cooking procedures or manufacturers instructions (1%).
Comparing business types revealed: small businesses more often checked the temperature of food by the food’s “appearance”
(60%) or “touch” (45%) compared with large business (26% and 22% respectively); high risk businesses more often used a thermometer (49%) compared with medium risk
(30%); and non metropolitan based businesses more often utilised “appearance” (67%) compared with
metropolitan based businesses (47%).
57%52%
36%43%
0%10%20%30%40%50%60%70%80%90%
100%
Appearance -looking at it
Temp gauge indelivery vehicle,
fridge, oven
Touch Thermometer

2000/2001 National Food Safety Benchmark CR&C 0413Australia New Zealand Food Authority Page 66
8.1.3 Checking food temperatureThree quarters (74%) of businesses that had potentially hazardous food delivered (Figure 47) either:
checked the temperature of the potentially hazardous food delivered (35%); or had an alternative system in place (39%).
Few (1%) had documented the alternative system.
Two in ten (21%) neither checked the temperature nor had an alternative system for checking thesafety of food.
One in ten (8%) businesses that received deliveries of food that was intended to be delivered frozendid not check the temperature of the food (Figure 48).
Figure 47: Staff checks the temperature of potentiallyhazardous food delivered to the business
Figure 48: Potentially hazardous frozen food isfrozen upon delivery
Q10 A member of staff checks that potentially hazardous food isreceived at the correct temperature at the time of delivery?
Q11 Does the business have an alternative system for ensuring thatpotentially hazardous food is received at a temperature thatwill not adversely affect the business being able to use the foodsafely?
Q12 The business checks that potentially hazardous food intendedto be frozen upon delivery is frozen when accepted
Base: Potentially hazardous food delivered to business = 466 (EHO Base: Has frozen food delivered = 417 (EHOResponse given but practice not observed by EHO = 46% of base Response given but practice not observed by EHO = 53% of base
Businesses more likely to check the temperature of potentially hazardous food delivered to theirbusiness included:
high risk (46%) compared with medium risk businesses (28%); and large businesses (75%) compared to small business (30%).
Two in ten businesses that received delivery of food “did not” check the temperature ofpotentially hazardous foods delivered to their business.
35% 39%
4%
21%
0%10%20%30%40%50%60%70%80%90%
100%
Yes Alternativesystem
None Don't Know/NoAnswer
90%
8%1%
0%10%20%30%40%50%60%70%80%90%
100%
Yes No Don't Know/NoAnswer

2000/2001 National Food Safety Benchmark CR&C 0413Australia New Zealand Food Authority Page 67
8.1.4 Temperature controlled storage of potentially hazardous food
Potentially hazardous food must be either stored chilled (5°C or below) or hot (60°C or above) or atanother temperature if the time the food is at that temperature is safe. The EHO survey identifiedwhether chilled food was stored chilled and whether there was adequate space in the cool room. Ifchilled food was not refrigerated, the EHOs asked whether the business had an alternative,documented system in place.
Nearly all businesses that stored potentially hazardous food that required chilling either stored thefood at the correct temperature11 (90%) or had an alternative system in place (Figure 49). A smallminority (1%) businesses had their alternative system documented to ensure effective usage of thesystem. Less than one in ten businesses (7%) did not store their chilled food at or below 5°C (Figure49).
Figure 49: Chilled potentially hazardous food stored at or below 5°CQ14 Chilled potentially hazardous food is stored at or below 5°CQ15 Does the business have an alternative system for ensuring that chilled potentially hazardous food is being
stored safely?Base: Stores chilled potentially hazardous food = 462 (EHO)
Response given but practice not observed by = 5%
The majority of businesses storing chilled potentially hazardous food kept their chilledfood at the correct temperature (5°C or lower), and fewer than one in ten businesses did
not correctly store chilled food.
11 The briefing for EHOs for this question stated that businesses may have another way of ensuring potentially
hazardous food was safe. See Attachment 3 in Appendix C for a description of alternative systems – using time as acontrol for potentially hazardous food.
90%
2% 1%7%
0%10%20%30%40%50%60%70%80%90%
100%
Yes Alternativesystem
None Don't Know/NoAnswer

2000/2001 National Food Safety Benchmark CR&C 0413Australia New Zealand Food Authority Page 68
Medium risk (88%) businesses were less likely to store chilled potentially hazardous food correctlywhen compared to high risk businesses (94%) (Table 22).
Table 22: Storing chilled potentially hazardous food by business classificationQ14: Chilled Potentially Hazardous Food is stored at or below 5°C
Business classification Business size
High Risk(163)
%A
Med Risk(283)
%B
Low Risk(16)%C
Small(417)
%D
Large(45)%E
Total(462)
%F
Nett yes 94B 88 94 90 89 90
Has an Alternative System 3 1 0 1 6 2
Has None 3 9 0 7 2 7
Don’t Know/No Answer 0 1 6 1 2 1Base: Stores chilled potentially hazardous food (462)
EHOs observed that one in twenty (6%) businesses utilising a cool room “did not have adequatestorage space” to accommodate their level of potentially hazardous food usage (Figure 50). The vastmajority of businesses, over nine in ten (94%), had adequate storage.
Figure 50: Adequate space for potentially hazardous food in cool roomQ17 There is adequate space to store potentially hazardous food in the cool room?
Base: Stores potentially hazardous food in store room = 454 (EHO)Response given but practice not observed by EHO = 2%
94%
6%0%
0%10%20%30%40%50%60%70%80%90%
100%
Yes No Don't Know/NoAnswer

2000/2001 National Food Safety Benchmark CR&C 0413Australia New Zealand Food Authority Page 69
8.1.5 Cooking potentially hazardous foodThe EHO survey identified whether potentially hazardous food was cooked for the correct amount oftime at the correct temperature. If the business did not check the time and temperature of cookingthe EHOs asked whether the business had another way of ensuring that the food was correctlycooked.
Five in ten (53%) businesses that cooked potentially hazardous food monitored that potentiallyhazardous food was cooked at the correct temperature and for the correct amount of time (Figure 51).
A further one third (33%) had an “alternative system” 12 in place to ensure food was correctly cooked.Documentation for ensuring that the alternative system was working effectively was observed in 2% ofthese businesses.
One in ten (11%) businesses did not have a system for ensuring the time and temperature of cookedpotentially hazardous food was appropriate to meet safe standards.
Figure 51: Potentially hazardous food cooked at correct temp for correct amount of timeQ24 Potentially hazardous food is cooked at the correct temperature for the correct amount of time.Q25 The business does not check the temperature and time at that temperature but has another way of ensuring
that food is correctly cooked.
Base: Cooks potentially hazardous food = 392 (EHO)Response given but practice not observed by =40%
Alternative systems for cooking potentially hazardous food (for the correct length of timeand at the correct temperature) were common among businesses – however few
businesses documented these systems. One in ten had no system at all.
12 The note of information on this question stated that businesses may have another way of ensuring potentially
hazardous food was safe. See Attachment 3 in Appendix C for a description of alternative systems – using time asa control for potentially hazardous food
53%
33%
2%11%
0%10%20%30%40%50%60%70%80%90%
100%
Yes Alternativesystem
None Don't know/noanswer
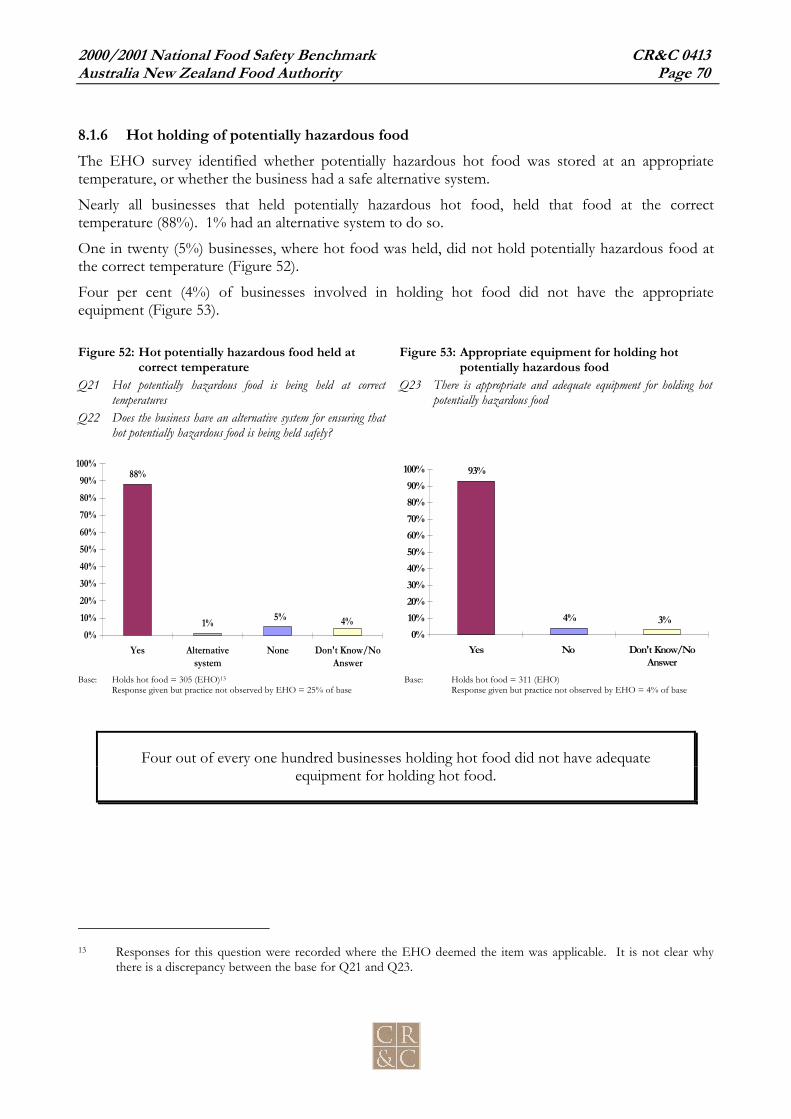
2000/2001 National Food Safety Benchmark CR&C 0413Australia New Zealand Food Authority Page 70
8.1.6 Hot holding of potentially hazardous foodThe EHO survey identified whether potentially hazardous hot food was stored at an appropriatetemperature, or whether the business had a safe alternative system.
Nearly all businesses that held potentially hazardous hot food, held that food at the correcttemperature (88%). 1% had an alternative system to do so.
One in twenty (5%) businesses, where hot food was held, did not hold potentially hazardous food atthe correct temperature (Figure 52).
Four per cent (4%) of businesses involved in holding hot food did not have the appropriateequipment (Figure 53).
Figure 52: Hot potentially hazardous food held atcorrect temperature
Figure 53: Appropriate equipment for holding hotpotentially hazardous food
Q21 Hot potentially hazardous food is being held at correcttemperatures
Q22 Does the business have an alternative system for ensuring thathot potentially hazardous food is being held safely?
Q23 There is appropriate and adequate equipment for holding hotpotentially hazardous food
Base: Holds hot food = 305 (EHO)13 Base: Holds hot food = 311 (EHO)Response given but practice not observed by EHO = 25% of base Response given but practice not observed by EHO = 4% of base
Four out of every one hundred businesses holding hot food did not have adequateequipment for holding hot food.
13 Responses for this question were recorded where the EHO deemed the item was applicable. It is not clear why
there is a discrepancy between the base for Q21 and Q23.
93%
4% 3%0%
10%20%30%40%50%60%70%80%90%
100%
Yes No Don't Know/NoAnswer
88%
1% 4%5%0%
10%20%30%40%50%60%70%80%90%
100%
Yes Alternativesystem
None Don't Know/NoAnswer
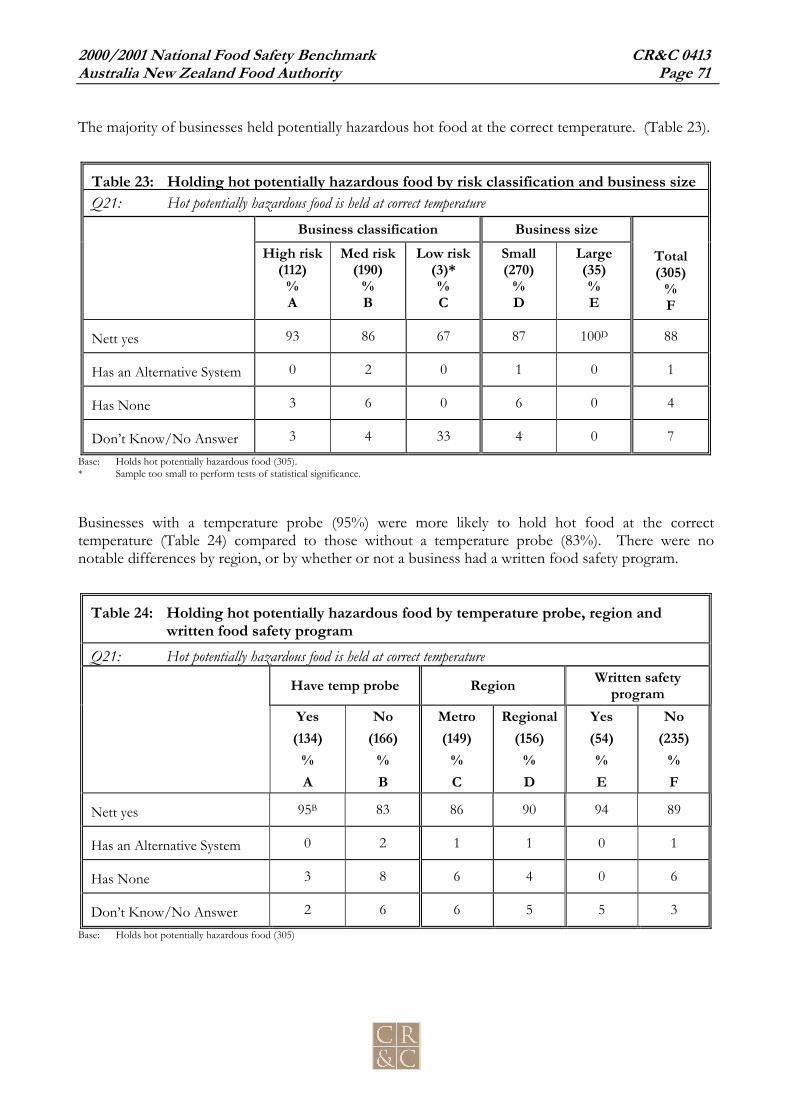
2000/2001 National Food Safety Benchmark CR&C 0413Australia New Zealand Food Authority Page 71
The majority of businesses held potentially hazardous hot food at the correct temperature. (Table 23).
Table 23: Holding hot potentially hazardous food by risk classification and business sizeQ21: Hot potentially hazardous food is held at correct temperature
Business classification Business sizeHigh risk
(112)%A
Med risk(190)
%B
Low risk(3)*%C
Small(270)
%D
Large(35)%E
Total(305)
%F
Nett yes 93 86 67 87 100D 88
Has an Alternative System 0 2 0 1 0 1
Has None 3 6 0 6 0 4
Don’t Know/No Answer 3 4 33 4 0 7
Base: Holds hot potentially hazardous food (305).* Sample too small to perform tests of statistical significance.
Businesses with a temperature probe (95%) were more likely to hold hot food at the correcttemperature (Table 24) compared to those without a temperature probe (83%). There were nonotable differences by region, or by whether or not a business had a written food safety program.
Table 24: Holding hot potentially hazardous food by temperature probe, region andwritten food safety program
Q21: Hot potentially hazardous food is held at correct temperature
Have temp probe Region Written safetyprogram
Yes(134)
%A
No(166)
%B
Metro(149)
%C
Regional(156)
%D
Yes(54)%E
No(235)
%F
Nett yes 95B 83 86 90 94 89
Has an Alternative System 0 2 1 1 0 1
Has None 3 8 6 4 0 6
Don’t Know/No Answer 2 6 6 5 5 3
Base: Holds hot potentially hazardous food (305)

2000/2001 National Food Safety Benchmark CR&C 0413Australia New Zealand Food Authority Page 72
8.1.7 Cooling cooked potentially hazardous food to correct temperatureIt is important that cooked potentially hazardous food is cooled rapidly. The Food Safety Standardsspecify cooling from 60°C to 21°C within 2 hours and from 21°C to 5°C within an additional 4 hours.The EHO survey identified whether businesses cooled potentially hazardous hot food rapidly, orwhether business had a safe alternative system for cooling such food. Rapid cooling ensures thatbacteria do not get an opportunity to multiply to dangerous levels. Because cooling takes place overseveral hours and thus was not necessarily able to be observed by the EHOs, a large proportion (53%)of the responses were classified “not observed”.
Most (82%) businesses cooking potentially hazardous food, then cooling that food for storage, did soto the correct temperatures within the correct amount of time (Figure 54).
A small proportion (4%) had a safe alternative system in place for cooling cooked potentiallyhazardous food. One business documented their alternative system. One in ten (10%) did not coolcooked potentially hazardous food appropriately.
Figure 54: Cooling cooked potentially hazardous food to correct temperatureQ28: Cooked potentially hazardous food is cooled to correct temperatures within the correct amount of time.Q29: Cooked potentially hazardous food is cooled using safe alternative system.
Base: Cook and cool potentially hazardous food = 244 (EHO)Response given but practice not observed by EHO = 53% of base
One in ten businesses did not cool their cooked potentially hazardous food appropriately.
82%
4% 2%10%
0%10%20%30%40%50%60%70%80%90%
100%
Yes Alternativesystem
None Don't Know/NoAnswer

2000/2001 National Food Safety Benchmark CR&C 0413Australia New Zealand Food Authority Page 73
8.1.8 Reheating cooked and cooled potentially hazardous foodReheating potentially hazardous food must be carried out rapidly to ensure that bacteria do not get theopportunity to multiply to dangerous levels.
Nearly all (87%) businesses that reheated food that had been cooked then cooled, did so rapidly. Onein twenty (5%) businesses did not rapidly reheat potentially hazardous food (Figure 55). Few (2%) hadan alternative system for ensuring food was reheated safely. None of these businesses documentedtheir alternative system.
Figure 55: Cooked and cooled potentially hazardous food is reheated rapidlyQ26: Potentially hazardous food that has been cooked then cooled, and is being reheated for holding at hot
temperatures, is reheated rapidly.Q27: Does the business have an alternative system for ensuring potentially hazardous food is reheated safely?
Base: Q26 All respondents = 483 (EHO)Response given but practice not observed by EHO = 22%
One in twenty businesses did not rapidly reheat cooked food.
87%
2% 4%6%
0%10%20%30%40%50%60%70%80%90%
100%
Yes Alternativesystem
None Don't Know/NoAnswer

2000/2001 National Food Safety Benchmark CR&C 0413Australia New Zealand Food Authority Page 74
8.1.9 Display
Displayed potentially hazardous food must be kept either chilled (5°C or below) or hot (60°C orabove) or at another temperature if the time is safe. Temperature control of food on display wasassessed (Figure 56).Most businesses displayed potentially hazardous food at the correct temperature (82%) or had analternative system for safely displaying food (4%). Only two businesses documented this procedure.One in ten (9%) businesses displaying potentially hazardous food neither held it at the correcttemperature nor had an alternative system.
Figure 56: Potentially hazardous food on display is held at the correct temperatureQ32 Potentially hazardous food on display is held at the correct temperature.Q33 Does the business have an alternative system for ensuring potentially hazardous food is displayed safely?
Base: Q32 Displays potentially hazardous food = 273 (EHO)Response given but practice not observed by EHO = 16% of base
One in ten businesses displaying potentially hazardous food did not have a method forensuring the displayed food remained safe.
82%
4% 6%9%
0%10%20%30%40%50%60%70%80%90%
100%
Yes Alternativesystem
None Don't Know/NoAnswer

2000/2001 National Food Safety Benchmark CR&C 0413Australia New Zealand Food Authority Page 75
8.1.10 Transport of potentially hazardous food
Transported potentially hazardous food must be transported either chilled (5°C or below) or hot(60°C or above) or at another temperature if the time is safe. Businesses were asked abouttemperature control of food during transport.
Three in ten (28%) businesses transporting food also reported that they transported potentiallyhazardous food (Figure 57).
Eight in ten (81%) businesses transporting potentially hazardous food carried chilled food. Half (51%)carried hot food (Figure 58) and one third (34%) transported both hot and cold food.
Figure 57: Potentially hazardous food transported Figure 58: Type of potentially hazardous foodtransported
Q36: The business transports potentially hazardous food. Q37: If the business does transport potentially hazardous food,does it transport chilled, hot food or both?
Base: Transports food = 350 (EHO) Base: Transports potentially hazardous food = 99 (EHO)Response given but practice not observed by EHO = 13% of base Note: Multiple response possible
Three in ten businesses transporting food also reported they transported potentiallyhazardous food.
28%
69%
2%0%
10%20%30%40%50%60%70%80%90%
100%
Yes No Don't Know/NoAnswer
81%
51%
34%
0%10%20%30%40%50%60%70%80%90%
100%
Nett Chilled food Nett Hot food Both hot & chilledfood

2000/2001 National Food Safety Benchmark CR&C 0413Australia New Zealand Food Authority Page 76
Three in ten (29%) businesses transporting chilled potentially hazardous food used a refrigeratedvehicle and one quarter (25%) used eskies with ice (Figure 59). A further one quarter of businesses(28%) stated other forms of transport including:
delivery on plate, trolley, basket or box (8%); plastic bag (5%); insulated box (5%); insulated carry bag (4%); dry ice (1%); and foil (1%).
Figure 59: Method of transporting chilled potentiallyhazardous food
Figure 60: Maximum time of transporting chilledpotentially hazardous food
Q38: If chilled potentially hazardous food is transported, whatmethod is used?
Q39: If chilled potentially hazardous food is transported, what isthe maximum time of transportation?
Base: Transports chilled potentially hazardous food = 80 (EHO) Base: Transports chilled potentially hazardous food = 80 (EHO)Total is greater than 100% due to multiple responses
Three in four (75%) businesses reported they transport chilled potentially hazardous food in timeperiods of less than one hour (Figure 60). One in ten (10%) transported chilled potentially hazardousfood for time periods longer than four hours.
One quarter of businesses transporting chilled potentially hazardous food did not mentionuse of temperature control equipment ensuring food would stay chilled.
29% 25%
13%20%
0%10%20%30%40%50%60%70%80%90%
100%
Refrigeratedvehicle
Eskies with ice Van or vehicle Insulated vehicle
75%
11% 10%3%
0%10%20%30%40%50%60%70%80%90%
100%
Less than 1 hour 1 - 2 hours 2 - 3 hours more than 4hours
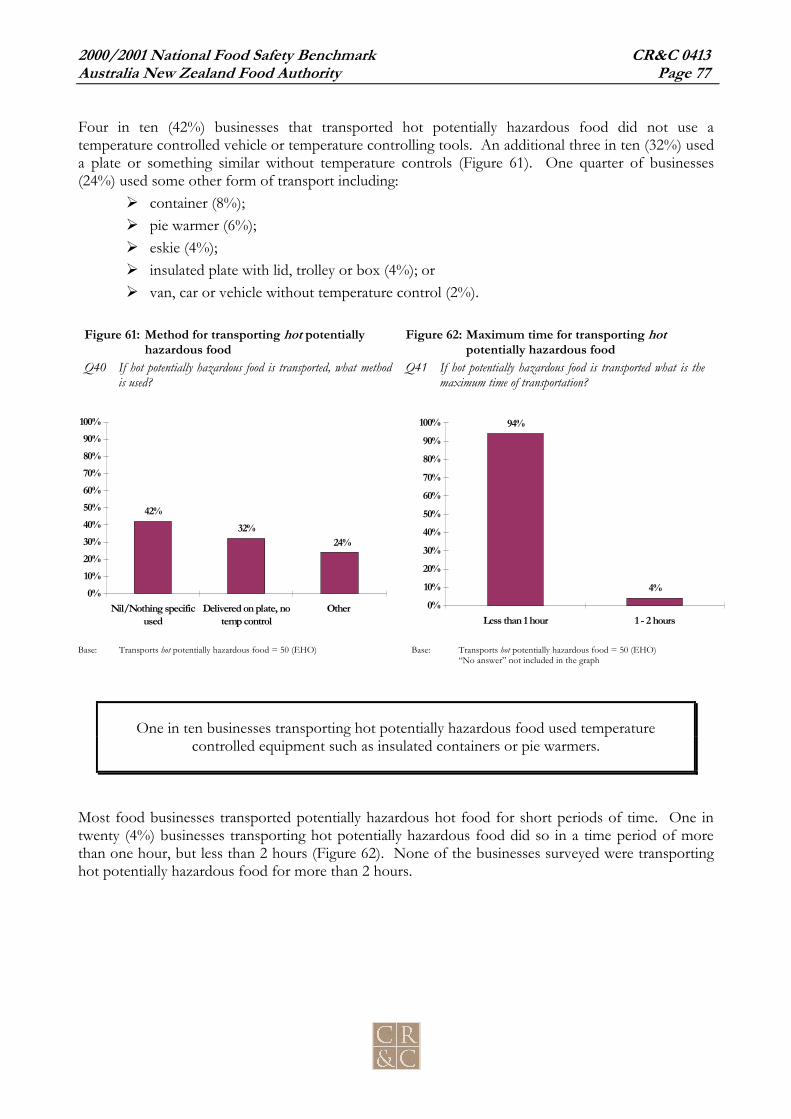
2000/2001 National Food Safety Benchmark CR&C 0413Australia New Zealand Food Authority Page 77
Four in ten (42%) businesses that transported hot potentially hazardous food did not use atemperature controlled vehicle or temperature controlling tools. An additional three in ten (32%) useda plate or something similar without temperature controls (Figure 61). One quarter of businesses(24%) used some other form of transport including:
container (8%); pie warmer (6%); eskie (4%); insulated plate with lid, trolley or box (4%); or van, car or vehicle without temperature control (2%).
Figure 61: Method for transporting hot potentiallyhazardous food
Figure 62: Maximum time for transporting hotpotentially hazardous food
Q40 If hot potentially hazardous food is transported, what methodis used?
Q41 If hot potentially hazardous food is transported what is themaximum time of transportation?
Base: Transports hot potentially hazardous food = 50 (EHO) Base: Transports hot potentially hazardous food = 50 (EHO)“No answer” not included in the graph
One in ten businesses transporting hot potentially hazardous food used temperaturecontrolled equipment such as insulated containers or pie warmers.
Most food businesses transported potentially hazardous hot food for short periods of time. One intwenty (4%) businesses transporting hot potentially hazardous food did so in a time period of morethan one hour, but less than 2 hours (Figure 62). None of the businesses surveyed were transportinghot potentially hazardous food for more than 2 hours.
42%32%
24%
0%10%20%30%40%50%60%70%80%90%
100%
Nil/Nothing specificused
Delivered on plate, notemp control
Other
94%
4%0%
10%
20%30%
40%50%
60%70%
80%90%
100%
Less than 1 hour 1 - 2 hours

2000/2001 National Food Safety Benchmark CR&C 0413Australia New Zealand Food Authority Page 78
Three in four (74%) businesses that transported potentially hazardous food did so at the correcttemperature. One in ten (9%) used an alternative system. Two in ten (21%) businesses transportingpotentially hazardous foods (chilled or hot) were not doing so at the correct temperature (Figure 63).
Figure 63: Potentially hazardous food transported at appropriate temperatureQ42: Potentially hazardous food is transported at the appropriate temperature.Q43: Does the business have an alternative system for ensuring potentially hazardous food is transported safely?
Base: Q42 Transports potentially hazardous food = 99 (EHO)
8.2 Protecting food from contamination
Pathogenic micro organisms from dirt, people, animals, pests or other food may contaminateunprotected food. Food may also be contaminated by chemicals from spillages or vapours and byphysical matter.
The EHO survey identified whether food was protected at all stages of handling in the business.These steps were: receiving, storage, processing, display and transport of food. Space for chilledstorage was checked for adequacy as insufficient space can not only affect cooling rates but increasethe risk of cross contamination.
Food storage in the cool room was checked to observe whether raw food was separated from cookedfood. Dry goods were checked to ensure they were free from pests.
Information on cleaning, sanitising, hand washing and covering of wounds was obtained to check thepossibilities of contamination of food during processing.
Displays of food for self service were checked to observe whether they were supervised, whetherseparate serving utensils were provided, and whether new batches were mixed with previous batches.
Protection from contamination was measured across five areas: at the time of receiving food; in storage areas; in food display areas; during food processing; and during transport of food.
74%
9% 12%3%
0%10%20%30%40%50%60%70%80%90%
100%
Yes Alternativesystem
None Don't Know/NoAnswer

2000/2001 National Food Safety Benchmark CR&C 0413Australia New Zealand Food Authority Page 79
8.2.1 Receiving food and protection from contaminationOne quarter (23%) of businesses had food delivered to their business outside of operational hours(Figure 64).
Regardless of whether food was delivered to the business during or after operational hours, 3% ofbusinesses where food was delivered had unprotected food in their delivery area (Figure 65).
Figure 64: Delivery of food outside business hours Figure 65: Protecting delivered food fromcontamination
Q9: Food is delivered to the premises outside of business hours Q13: Food received is protected from contamination
Base: All respondents = 483 (EHO) Base: Has food delivered = 456 (EHO)Response given but practice not observed by EHO = 48% of base Response given but practice not observed by EHO =46%
Very few (3%) businesses that had food delivered, had food that was unprotected fromcontamination when it was delivered.
23%
76%
1%0%
10%20%30%40%50%60%70%80%90%
100%
Yes No Don't Know/NoAnswer
96%
3% 1%0%
10%20%30%40%50%60%70%80%90%
100%
Yes No Don't Know/NoAnswer

2000/2001 National Food Safety Benchmark CR&C 0413Australia New Zealand Food Authority Page 80
94%
6%0%
0%10%20%30%40%50%60%70%80%90%
100%
Yes No Don't Know/NoAnswer
86%
14%
0%0%
10%20%30%40%50%60%70%80%90%
100%
Yes No Don't Know/NoAnswer
8.2.2 Food storage and protection from contaminationOne in ten (8%) businesses storing raw food in the cool room did not have raw food separated fromready-to-eat food.
Figure 66: Raw food separated in cool roomQ16: Raw food is separated from ready-to-eat food in the cool room
Base: Stores raw food in the cool room = 425 (EHO)Response given but practice not observed by EHO = 5% of base
One in twenty (6%) businesses utilising a cool room did not have adequate space in the cool room tostore potentially hazardous food (Figure 67).
More than one in seven (14%) businesses utilising a cool room did not adequately protect their food inthe cool room from contamination (Figure 68).
Figure 67: Adequate space for potentially hazardousfood in cool room
Figure 68: Protected from contamination in coolroom
Q17 There is adequate space to store potentially hazardous food inthe cool room.
Q18 All food is protected from contamination in the cool room?
Base: Utilised a cool room = 454 (EHO) Base: Utilised a cool room = 459 (EHO)Response given but practice not observed by EHO = 2% of base Response given but practice not observed by EHO = 2%
91%
8%1%
0%10%20%30%40%50%60%70%80%90%
100%
Yes No Don't Know/NoAnswer

2000/2001 National Food Safety Benchmark CR&C 0413Australia New Zealand Food Authority Page 81
One in twenty (6%) businesses handling dry goods did not have adequate protection fromcontamination of their dry goods and a similar proportion (4%) appeared to have problems with pestsin the dry goods areas (Figure 69), (Figure 70).
Figure 69: Dry goods protected from contamination Figure 70: Dry goods free from pests
Q19: Dry goods are protected from contamination? Q20: Dry goods appear to be free from pests.
Base: Handles dry goods = 467 (EHO) Base: Handles dry goods = 468 (EHO)Response given but practice not observed by EHO = 1% of base Response given but practice not observed by EHO = 2%
8.2.3 Display and protection from contaminationJust under one in ten (8%) businesses with food on display did not have their displayed foodadequately protected from contamination (Figure 71).
Figure 71: Protection of displayed foodQ30 Food on display is protected from contamination.
Base: Has food on display = 274 (EHO)Response given but practice not observed by EHO = 4% of base
93%
6%1%
0%10%20%30%40%50%60%70%80%90%
100%
Yes No Don't Know/NoAnswer
94%
4% 2%0%
10%20%30%40%50%60%70%80%90%
100%
Yes No Don't Know/NoAnswer
90%
8%2%
0%10%20%30%40%50%60%70%80%90%
100%
Yes No Don't Know/NoAnswer

2000/2001 National Food Safety Benchmark CR&C 0413Australia New Zealand Food Authority Page 82
One in seven (15%) businesses with food on display, and which needed to be supervised, did not havestaff supervising displayed ready-to-eat food (Figure 72).
When displayed food was removed from display, one in seven (14%) businesses mixed the displayedfood with new food for storage to re-serve the next day (Figure 73).
Figure 72: Displayed ready-to-eat food supervised bystaff
Figure 73: Food removed from display mixed withnew food
Q31: Displayed ready-to-eat food intended for self-service issupervised by staff.
Q34: Is food removed from display mixed with new batches of foodfor display on the next day?
Base: Have food on display needing supervision = 103 (EHO) Base: Has food on display = 294 (EHO)Response given but practice not observed by EHO = 27% of base Response given but practice not observed by EHO = 38%
Businesses more likely to remove food from display and mix it with new batches of food for displaythe next day included:
high risk (21%) businesses (who are also more likely to handle these types of food)compared with medium risk (11%) businesses;
those supplying ready-to-eat food off-site from where it was prepared (23%) comparedwith those not supplying ready-to-eat food off-site (11%); and
those with a written food safety program (24%) compared to those without a plan (13%).
83%
15%
2%0%
10%20%30%40%50%60%70%80%90%
100%
Yes No Don't Know/NoAnswer
14%
82%
4%0%
10%20%30%40%50%60%70%80%90%
100%
Yes No Don't Know/NoAnswer

2000/2001 National Food Safety Benchmark CR&C 0413Australia New Zealand Food Authority Page 83
8.2.4 Processing of food and protection from contaminationOne in ten (9%) businesses did not separate equipment used for preparing raw and ready-to-eat food,or sanitise that equipment between uses (Figure 74).
Figure 74: Separate equipment used for raw & ready-to-eat food?Q62 Separate equipment is used for preparing and processing raw and ready-to-eat food, or equipment is cleaned
and sanitised between these uses?
Base: Prepares & processes raw and ready-to-eat food = 418 (EHO)Response given but practice not observed by EHO = 36%
One in twenty businesses (6%) were at risk of contamination from staff directly touching food inbusinesses where staff handled ready-to-eat food with hands rather than utensils such as tongs (Figure75). One in ten (9%) staff who wore gloves did not change gloves when necessary (Figure 76).
Figure 75: Hands are not used to handle food Figure 76: Gloves are changed
Q64: Staff handle ready-to-eat food with utensils or other barriers(not hands)
Q65: Staff change gloves when necessary.
Base: Staff handle ready-to-eat food = 453 (EHO) Base: Staff wear gloves = 341 (EHO)Response given but practice not observed by EHO = 27% of base Response given but practice not observed by EHO = 47%
90%
9%0%
0%10%20%30%40%50%60%70%80%90%
100%
Yes No Don't Know/NoAnswer
94%
6%0%
0%10%20%30%40%50%60%70%80%90%
100%
Yes No Don't Know/NoAnswer
87%
9%3%
0%10%20%30%40%50%60%70%80%90%
100%
Yes No Don't Know/NoAnswer

2000/2001 National Food Safety Benchmark CR&C 0413Australia New Zealand Food Authority Page 84
One in ten (9%) businesses had staff who did not wash their hands when necessary (Figure 77).Additionally, one in twenty (6%) staff did not cover wounds appropriately (Figure 78).
Figure 77: Hand washing Figure 78: Wound covering
Q66 Staff wash hands when necessary. Q76 Staff cover open wounds with a waterproof dressing.
Base: All respondents = 483 (EHO) Base: All respondents = 483 (EHO)Response given but practice not observed by EHO = 49% of base Response given but practice not observed by EHO = 44%
Between one in ten and one in twenty businesses faced a risk of food contamination fromstaff through infrequent glove changing, using hands rather than utensils to touch food, or
infrequent wound covering.
8.2.5 Transport and protection from contaminationNearly all (99%) businesses transporting food had adequate protection from contamination duringtransportation (Figure 79).
Figure 79: Transport of foodQ44 Food is protected from contamination during transportation
Base: Transports food = 99 (EHO)Response given but practice not observed by EHO = 44% of base
1%
99%
0%0%
10%20%30%40%50%60%70%80%90%
100%
Yes No Don't Know/NoAnswer
88%
9%1%
0%10%20%30%40%50%60%70%80%90%
100%
Yes No Don't Know/NoAnswer
Document2
89%
6% 4%0%
10%20%30%40%50%60%70%80%90%
100%
Yes No Don't Know/NoAnswer

2000/2001 National Food Safety Benchmark CR&C 0413Australia New Zealand Food Authority Page 85
8.3 Personal hygiene and staff illnessStaff are a potential source of pathogenic micro organisms and foreign matter that could contaminatefood. The contamination may be from the food handlers body such as intestinal, respiratory or skinmicro organisms, or foreign material and micro organisms from clothing. Information was sought onhand washing practices and facilities, clothing worn by handlers, and the extent of the use of gloves.
Businesses were asked about their policies regarding staff that are ill and are at work. Staff that aresuffering from symptoms of illness that may be transmitted through food or are carriers of theseillnesses may contaminate food or surfaces that come in contact with food.
8.3.1 Hand washing facilitiesHand washing practices and ensuring that there are adequate facilities for hand washing are keycomponents of personal hygiene. Information was sought on whether staff members wash theirhands, which facilities they use and whether hand wash basins are available, are accessible and aresuitable equipped with soap, warm running water, towels etc. EHOs were asked to observe whetherhand basins showed signs of recent use.
Just under one in five (17%) businesses did not have sufficient hand washing facilities (Figure 80).
One in ten (10%) businesses did not provide their employees with adequate access to hand washfacilities (Figure 81).
Figure 80: Sufficient hand washing facilities Figure 81: Accessible hand washing
Q69 Sufficient hand washing facilities are provided. Q70 Hand washing facilities are accessible to employees
Base: All respondents = 483 (EHO) Base: All respondents = 483 (EHO)Response given but practice not observed by EHO = 1% of base Response given but practice not observed by EHO = 1%
Question not applicable = 2%
82%
17%
1%0%
10%20%30%40%50%60%70%80%90%
100%
Yes No Don't Know/NoAnswer
86%
10%1%
0%10%20%30%40%50%60%70%80%90%
100%
Yes No Don't Know/NoAnswer

2000/2001 National Food Safety Benchmark CR&C 0413Australia New Zealand Food Authority Page 86
Just under one in five businesses did not provide sufficient hand washing facilities forstaff.
Provision of appropriate facilities increased the likelihood of good practice. Nine in ten (92%)businesses with sufficient hand wash facilities had staff who washed their hands when necessary. Thiscompares to only seven in ten (70%) businesses without sufficient hand wash facilities where staffwashed their hands when necessary.
Staff working in businesses with sufficient hand washing facilities were more likely towash their hands when necessary.
Medium risk businesses more often had insufficient hand wash facilities (19%) and lack of access(13%) to hand wash facilities compared with high risk (12% and 5% respectively) (Table 25). Therewere no substantial differences according to business size.
Table 25: Hand wash facilities by business classification and business sizeBusiness classification Business size
High risk(166)
%A
Med risk(291)
%B
Low risk(26)%C
Small(437)
%D
Large(46)%E
Total(483)
%F
Q69: Sufficient hand washing facilities are providedNett Yes 88B 79 69 81 89 81
Nett No 12 19A 27 18 9 17
Not Observed 1 1 4 1 0 1
No Answer 0 1 4 1 0 2
Q70: Hand washing facilities are accessible to employees
Nett Yes 93B 83 81 85 96 86
Nett No 5 13A 15 11 2 10
Not Observed 1 - 4 1 0 1
No Answer 0 1 4 1 0 3Base: All respondents (483)
Sample to small to permit statistical significance testing

2000/2001 National Food Safety Benchmark CR&C 0413Australia New Zealand Food Authority Page 87
Significant differences observed between hand washing facility provision by State / Territory were: Businesses in South Australia (88%) and Victoria (89%) were more likely to provide hand
washing facilities when compared to businesses in New South Wales (76%). Businesses in Victoria (95%) were more likely to have hand washing facilities that are
accessible to employees when compared to businesses in ACT (86%).
Staff did not use the designated hand wash facilities in two in ten (19%) businesses.
Figure 82: Staff wash their hands in designated facilitiesQ67 When staff wash hands, they use the designated hand washing facilities.
77%
19%
1%0%
10%20%30%40%50%60%70%80%90%
100%
Yes No Don't Know/NoAnswer
Base: All respondents = 483 (EHO)Response given but practice not observed by EHO =361%Question not applicable = 2%
One fifth of businesses with designated staff hand wash facilities had staff who did notutilise these hand wash facilities.
Just under one in ten (7%) businesses did not supply soap or hand cleanser (Figure 83) and over one inten (14%) did not have warm running water in their hand washing facilities (Figure 84).

2000/2001 National Food Safety Benchmark CR&C 0413Australia New Zealand Food Authority Page 88
Medium risk businesses were less likely to supply soap or hand cleanser (9%), compared with high riskbusinesses (4%).
Figure 83: Soap or hand cleanser supplied Figure 84: Warm running water available
Q71: Hand washing facilities are supplied with soap or handcleanser
Q72: Hand washing facilities have warm running water
Base: All respondents = 483 (EHO) Base: All respondents = 483 (EHO)Response given but practice not observed by EHO = 2% of base Response given but practice not observed by EHO = 1%Question not applicable = 2% Question not applicable = 3%
Over one in ten businesses with designated staff hand wash facilities did not have warmrunning water in these facilities.
One fifth (20%) of businesses did not supply single use towels14 (Figure 85) and one in seven (14%)businesses’ hand washing facilities did not show evidence of recent use (Figure 86).
14 Each facility must have single-use towels. An air-dryer on its own is not acceptable. Standard 3.2.2 states that foodhandlers must thoroughly dry their hands on a single use towel or in another way that is not likely to transfer pathogenicmicro-organisms to the hands. The user guide: ‘Safe Food Australia’ (pg. 94, 2nd edition notes that food handlers shoulduse single use towels, or a combination of single use towels and air drying to thoroughly dry hands.
90%
7%0%
0%10%20%30%40%50%60%70%80%90%
100%
Yes No Don't Know/NoAnswer
82%
14%
1%0%
10%20%30%40%50%60%70%80%90%
100%
Yes No Don't Know/NoAnswer
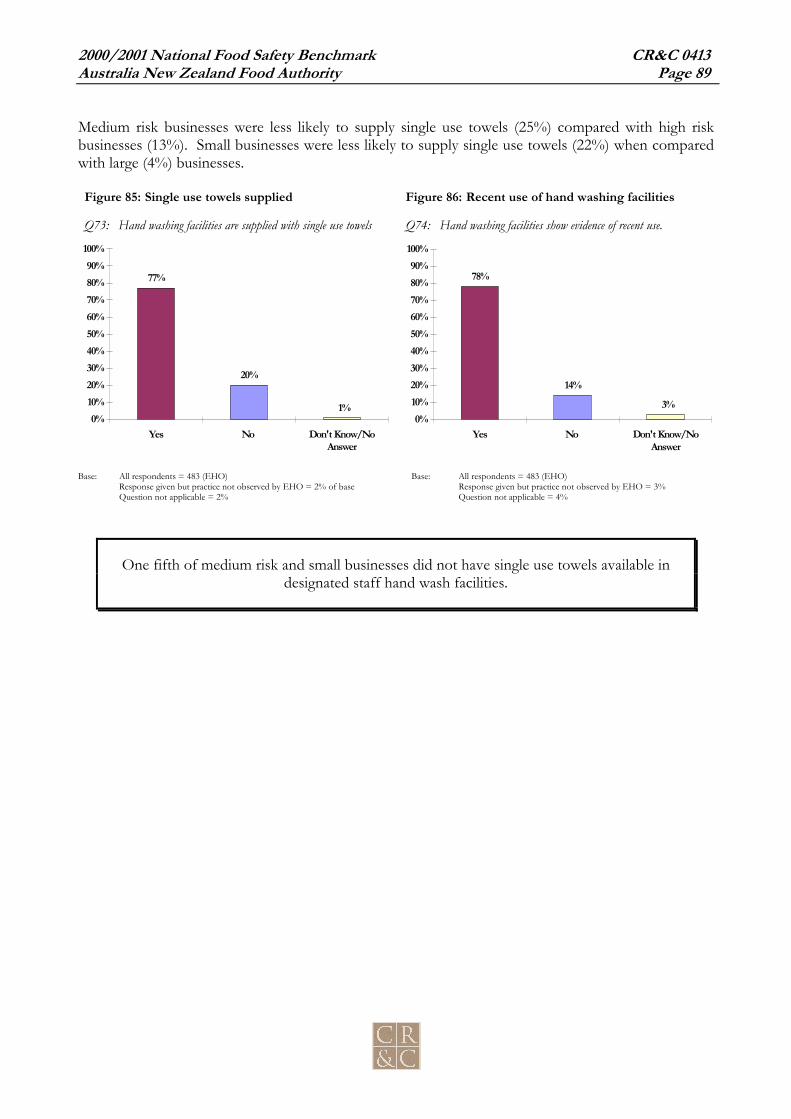
2000/2001 National Food Safety Benchmark CR&C 0413Australia New Zealand Food Authority Page 89
Medium risk businesses were less likely to supply single use towels (25%) compared with high riskbusinesses (13%). Small businesses were less likely to supply single use towels (22%) when comparedwith large (4%) businesses.
Figure 85: Single use towels supplied Figure 86: Recent use of hand washing facilities
Q73: Hand washing facilities are supplied with single use towels Q74: Hand washing facilities show evidence of recent use.
Base: All respondents = 483 (EHO) Base: All respondents = 483 (EHO)Response given but practice not observed by EHO = 2% of base Response given but practice not observed by EHO = 3%Question not applicable = 2% Question not applicable = 4%
One fifth of medium risk and small businesses did not have single use towels available indesignated staff hand wash facilities.
77%
20%
1%0%
10%20%30%40%50%60%70%80%90%
100%
Yes No Don't Know/NoAnswer
78%
14%
3%0%
10%20%30%40%50%60%70%80%90%
100%
Yes No Don't Know/NoAnswer
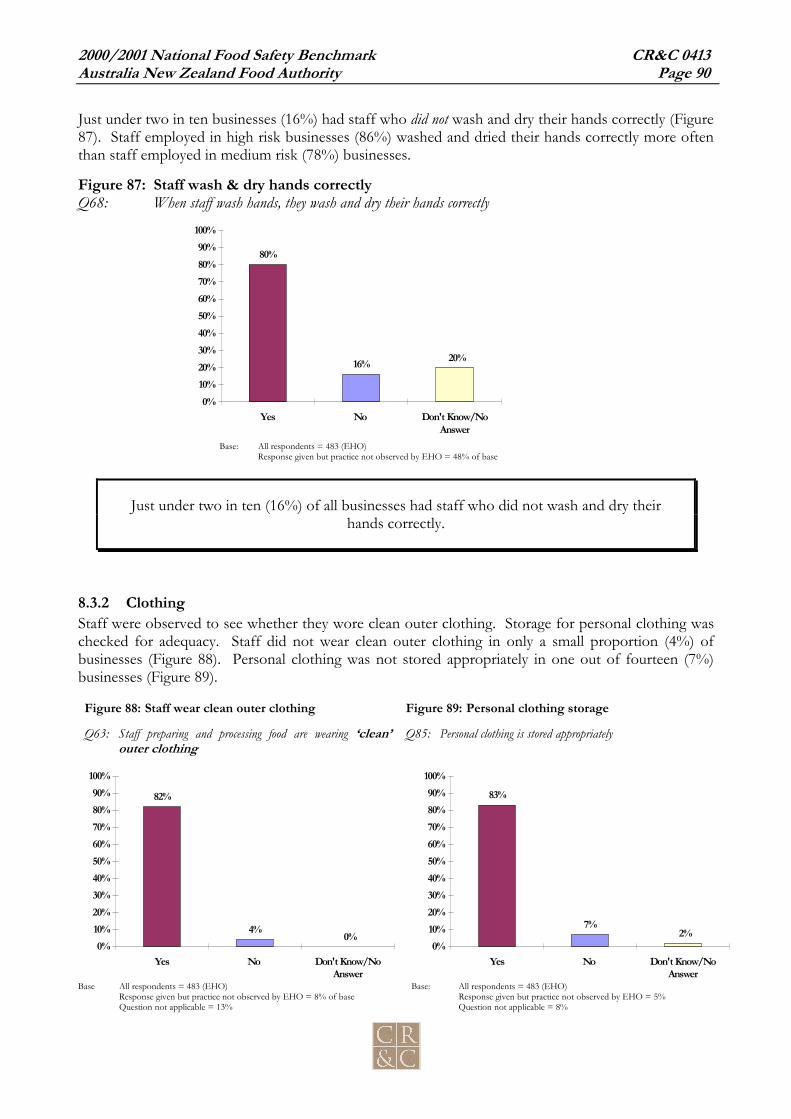
2000/2001 National Food Safety Benchmark CR&C 0413Australia New Zealand Food Authority Page 90
Just under two in ten businesses (16%) had staff who did not wash and dry their hands correctly (Figure87). Staff employed in high risk businesses (86%) washed and dried their hands correctly more oftenthan staff employed in medium risk (78%) businesses.
Figure 87: Staff wash & dry hands correctlyQ68: When staff wash hands, they wash and dry their hands correctly
Base: All respondents = 483 (EHO)Response given but practice not observed by EHO = 48% of base
Just under two in ten (16%) of all businesses had staff who did not wash and dry theirhands correctly.
8.3.2 ClothingStaff were observed to see whether they wore clean outer clothing. Storage for personal clothing waschecked for adequacy. Staff did not wear clean outer clothing in only a small proportion (4%) ofbusinesses (Figure 88). Personal clothing was not stored appropriately in one out of fourteen (7%)businesses (Figure 89).
Figure 88: Staff wear clean outer clothing Figure 89: Personal clothing storage
Q63: Staff preparing and processing food are wearing ‘clean’outer clothing
Q85: Personal clothing is stored appropriately
Base All respondents = 483 (EHO) Base: All respondents = 483 (EHO)Response given but practice not observed by EHO = 8% of base Response given but practice not observed by EHO = 5%Question not applicable = 13% Question not applicable = 8%
80%
16% 20%
0%10%20%30%40%50%60%70%80%90%
100%
Yes No Don't Know/NoAnswer
82%
4% 0%0%
10%20%30%40%50%60%70%80%90%
100%
Yes No Don't Know/NoAnswer
83%
7%2%
0%10%20%30%40%50%60%70%80%90%
100%
Yes No Don't Know/NoAnswer
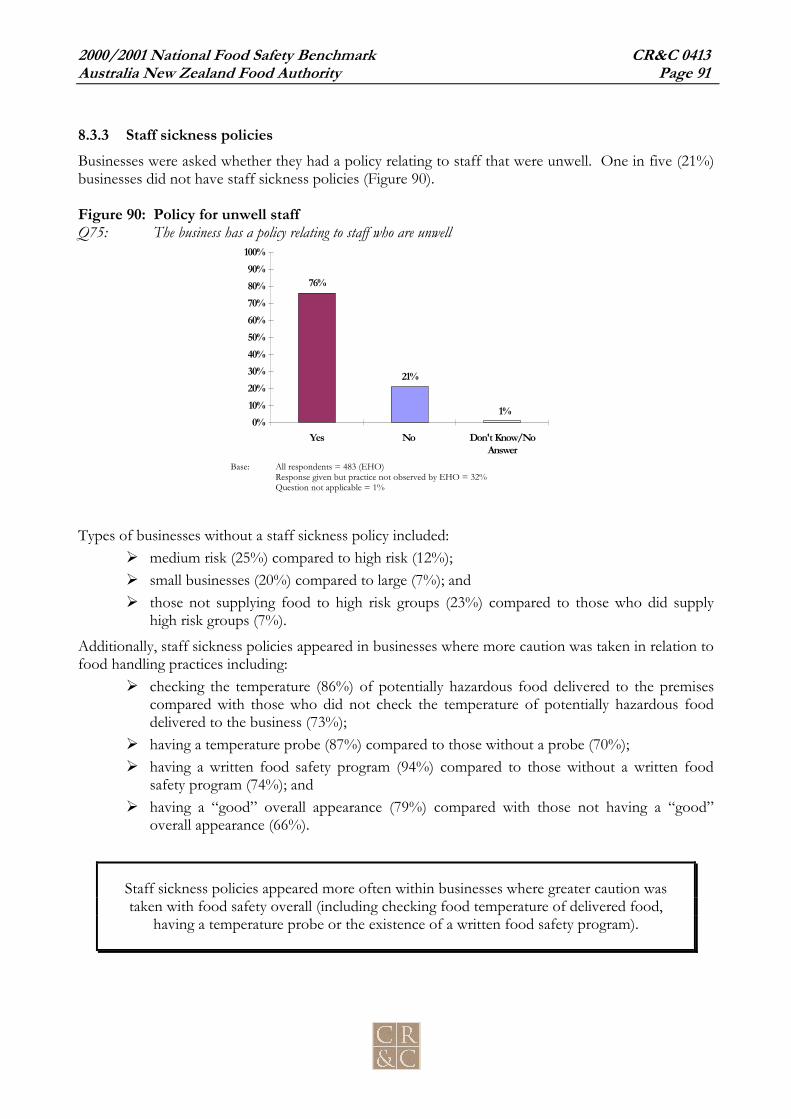
2000/2001 National Food Safety Benchmark CR&C 0413Australia New Zealand Food Authority Page 91
8.3.3 Staff sickness policiesBusinesses were asked whether they had a policy relating to staff that were unwell. One in five (21%)businesses did not have staff sickness policies (Figure 90).
Figure 90: Policy for unwell staffQ75: The business has a policy relating to staff who are unwell
76%
21%
1%0%
10%20%30%40%50%60%70%80%90%
100%
Yes No Don't Know/NoAnswer
Base: All respondents = 483 (EHO)Response given but practice not observed by EHO = 32%Question not applicable = 1%
Types of businesses without a staff sickness policy included: medium risk (25%) compared to high risk (12%); small businesses (20%) compared to large (7%); and those not supplying food to high risk groups (23%) compared to those who did supply
high risk groups (7%).
Additionally, staff sickness policies appeared in businesses where more caution was taken in relation tofood handling practices including:
checking the temperature (86%) of potentially hazardous food delivered to the premisescompared with those who did not check the temperature of potentially hazardous fooddelivered to the business (73%);
having a temperature probe (87%) compared to those without a probe (70%); having a written food safety program (94%) compared to those without a written food
safety program (74%); and having a “good” overall appearance (79%) compared with those not having a “good”
overall appearance (66%).
Staff sickness policies appeared more often within businesses where greater caution wastaken with food safety overall (including checking food temperature of delivered food,
having a temperature probe or the existence of a written food safety program).

2000/2001 National Food Safety Benchmark CR&C 0413Australia New Zealand Food Authority Page 92
8.4 Cleaning and sanitising
The EHO survey identified whether business cleaned and sanitised eating and drinking utensils andfood contact surfaces for example, chopping boards, using commercial dishwashers, glass washers,domestic models of dishwashers or whether they cleaned and sanitised manually.
If food businesses used such equipment, The EHOs identified the operating temperatures of theequipment.
The temperature of water used in manual cleaning and sanitising was also obtained and whether thebusiness used chemical sanitisers.
Effective cleaning and sanitising was assessed by identifying: the methods of washing and sanitising equipment used during food handling; as well as whether the equipment used was working appropriately.
8.4.1 Commercial dishwashersOne third (30%) of businesses where a dishwasher was appropriate (i.e. businesses that had a need towash eating, drinking or food preparation utensils) used a commercial dishwasher to wash and sanitiseeating utensils (Figure 90).
One in ten commercial dishwashers were not working at the correct sanitising temperature and one intwenty (5%) businesses were unsure of the temperature of the dishwasher (Figure 92). To answer yesto correct temperature, the final rinse or sanitising rinse must be 77ºC or above.
Figure 91: Use commercial dishwasher to wash andsanitise
Figure 92: Correct sanitising temperature
Q48: Business uses a commercial dishwasher to wash andsanitise eating and drinking utensils and food contact surfaces
Q49: Commercial dishwashers operates at the correct sanitisingtemperature
Base: Dishwasher appropriate to business = 399 (EHO) Base: Uses commercial dishwasher = 120 (EHO)Response given but practice not observed by EHO = 5% of base Response given but practice not observed by EHO = 25%
One in seven businesses using a commercial dishwasher either did not know the sanitisingtemperature or found it was not working at the correct temperature.
30%
69%
1%0%
10%20%30%40%50%60%70%80%90%
100%
Yes No Don't Know/NoAnswer
79%
10%5%
0%10%20%30%40%50%60%70%80%90%
100%
Yes No Don't Know/NoAnswer

2000/2001 National Food Safety Benchmark CR&C 0413Australia New Zealand Food Authority Page 93
Businesses that were more likely to use a commercial dishwasher included: large (55%) compared to small (27%); those supplying food to high risk groups (43%) compared to those not supplying these
groups (28%); those using chemical sanitisers (36%) compared to those not (10%) using chemical
sanitisers; and those with a written food safety program (45%) compared to those without a written food
safety program (28%).
8.4.2 Domestic dishwashersOver one in ten (13%) businesses where a dishwasher was appropriate (i.e. businesses that had a needto wash eating, drinking or food preparation utensils) used a domestic dishwasher and two in ten(21%) reported a domestic dishwasher was not applicable to the business (Figure 93).
One fifth (19%) of domestic dishwashers did not operate at the correct temperature (Figure 94). Onein ten did not know the sanitising temperature of their domestic dishwasher. The correct sanitisingtemperature for a final rinse or sanitising rinse is 77ºC.
Figure 93: Domestic dishwasher to sanitise eating &drinking utensils
Figure 94: Domestic dishwasher at correct temp
Q51: Business uses a domestic dishwasher to wash andsanitise eating and drinking utensils and food contact surfaces
Q52: Domestic dishwasher operates at correct temperature
Base: Dishwasher appropriate to business = 382 (EHO) Base: Uses domestic dishwasher = 48 (EHO)Response given but practice not observed by EHO = 3% of base Response given but practice not observed by EHO = 46%
One third of domestic dishwashers either did not work at the correct sanitisingtemperature, or the temperature was not known.
13%
85%
3%0%
10%20%30%40%50%60%70%80%90%
100%
Yes No Don't Know/NoAnswer
58%
19%12%
0%10%20%30%40%50%60%70%80%90%
100%
Yes No Don't Know/NoAnswer

2000/2001 National Food Safety Benchmark CR&C 0413Australia New Zealand Food Authority Page 94
8.4.3 Glass washersOne in seven (16%) businesses where a glass washer was appropriate to the business used glasswashers (Figure 95). Two in ten (19%) glass washers did not operate at the correct temperature andone in ten could not identify the sanitising temperature (Figure 96).
Figure 95: Glass washer to sanitise eating & drinkingutensils
Figure 96: Glass washers operate at correcttemperature
Q54: The business uses glass washers to sanitise using hot water Q55: Glass washers operate at the correct temperature
Base: Glass washer appropriate to business = 372 (EHO) Base: Uses glass washer = 59 (EHO)Response given but practice not observed by EHO = 5% of base Response given but practice not observed by EHO = 29% of base
One fifth of domestic dishwashers and glass washers did not operate at the correctsanitising temperature. Commercial dishwashers were a little better with only one in ten
not working at the correct temperature.
8.4.4 Chemical sanitisersOne quarter (24%) of businesses did not use chemical sanitisers (Figure 97) and in those cases wherethey were used, one in ten (9%) did not use them appropriately (Figure 98).
Figure 97: Chemical sanitisers used Figure 98: Appropriate use of sanitisers
Q57 The business uses chemical sanitisers for some or all of itsequipment
Q58 Chemical sanitisers are used appropriately
.Base: Chemical sanitiser appropriate to business = 453 (EHO) Base: Uses chemical sanitiser = 342 (EHO)Response given but practice not observed by EHO = 20% of base Response given but practice not observed by EHO = 45% of base
16%
82%
3%0%
10%20%30%40%50%60%70%80%90%
100%
Yes No Don't Know/NoAnswer
53%
19%10%
0%10%20%30%40%50%60%70%80%90%
100%
Yes No Don't Know/NoAnswer
75%
24%
1%0%
10%20%30%40%50%60%70%80%90%
100%
Yes No Don't Know/NoAnswer
87%
9%2%
0%10%20%30%40%50%60%70%80%90%
100%
Yes No Don't Know/NoAnswer

2000/2001 National Food Safety Benchmark CR&C 0413Australia New Zealand Food Authority Page 95
8.4.5 Manually sanitising using hot waterNearly six in ten (57%) businesses where manual sanitising was appropriate used manual sanitisingprocesses (Figure 99).
Figure 99: All equipment sanitised manuallyQ59 Business sanitises all or some of its equipment and surfaces Manually using hot water (without
chemicals) e.g. in a sink.
Base: Manually sanitising appropriate to business = 462 (EHO)Response given but practice not observed by EHO = 28% of base
Six in ten (60%) of businesses utilising manual sanitising processes did not hold the hot water at theappropriate temperature (e.g. 77°C or above) (Figure 100). Where the correct temperature was notused, two in ten had a temperature of between 60-64 °C and one quarter less than 59 °C (Figure 101).
Figure 100: Sanitising temperature is 77°C or above
Figure 101: Record of temperature
Q60: If business manually sanitises using hot water, the temperatureof the hot water used is 77°C or above
Q61: Record the temperature of the hot water (either at the tap orin the sink as appropriate).
Base: Uses manual sanitising processes = 263 (EHO) Base: Temperature of water for manual sanitation <77°C = 159 (EHO)Response given but practice not observed by EHO = 25% of base No response = 53% of base
57%
42%
1%0%
10%20%30%40%50%60%70%80%90%
100%
Yes No Don't Know/NoAnswer
31%
60%
4%0%
10%20%30%40%50%60%70%80%90%
100%
Yes No Don't Know/NoAnswer
21%16%
10%
0%10%20%30%
40%50%60%70%
80%90%
100%
60C - 64C 55C - 59 C Less than 55C

2000/2001 National Food Safety Benchmark CR&C 0413Australia New Zealand Food Authority Page 96
Businesses less likely to have the correct temperature of water used for manual sanitising included: regional (76%) compared with metropolitan (44%); those not checking the temperature of delivered food (66%) compared to those who did
check (53%); and those without a written food safety program (63%) compared to those with a written food
safety program (43%).
8.5 General assessment
The EHO survey identified some general information about the premises of food businesses.Observations included:
whether the premises were clean and if not, the problem areas were noted; whether lighting was adequate; whether ventilation was adequate; the presence of adequate equipment for processing food; that such equipment was cleaned and sanitised before use; and the safe storage of chemicals.
Information was sought on pest control at the business. Premises were checked to establish whetherthey were free from pests. Businesses were asked whether they contracted pest control companies orhad a pest control program.
8.5.1 EquipmentOne in ten (10%) businesses that prepared and processed food did not have adequate equipment15 forthese tasks (Figure 102).
Figure 102:Adequate equipment for food preparationQ35: There is adequate equipment for preparing and processing food.
Base: Prepares and processes food = 456 (EHO)Response given but practice not observed by EHO = 3% of base
15 See Attachment 4 in Appendix C for a description of assessing adequate equipment.
89%
10%1%
0%10%20%30%40%50%60%70%80%90%
100%
Yes No Don't Know/NoAnswer

2000/2001 National Food Safety Benchmark CR&C 0413Australia New Zealand Food Authority Page 97
8.5.2 Cleaning & sanitationOver one in ten (12%) businesses where it was appropriate to clean and sanitise food contact surfacesand utensils did not do so before using the surface or utensils (Figure 103).
Figure 103:Utensils are clean & sanitisedQ77: Food contact surfaces and utensils are clean and sanitised before use.
Base: Appropriate to clean and sanitise food contact surfaces = 467 (EHO)Response given but practice not observed by EHO = 18% of base
Across all businesses, one in ten (10%) were not considered clean and well maintained (Figure 104).Overall cleanliness rated lower among:
small business (11%) compared with large (2%); medium risk (13%) compared with high risk (7%) business; and businesses that consistently used fewer cautious food handling practices such as those:
− without a temperature probe (13%);− not providing sufficient hand wash facilities (27%);− not using chemical sanitisers (16%); and− without a written food safety program (11%).
87%
12%
0%0%
10%20%30%40%50%60%70%80%90%
100%
Yes No Don't Know/NoAnswer

2000/2001 National Food Safety Benchmark CR&C 0413Australia New Zealand Food Authority Page 98
EHOs identified specific problem areas needing attention within one third of businesses (62%reporting no problem areas). In particular, one in ten (12%) mentioned food preparation andprocessing and cooking areas and another one in ten (10%) mentioned the cool room (Figure 105).
Figure 104: Overall business is clean Figure 105: Identify problem areasQ80 The overall business premises and equipment are clean and well
maintained?Q81 If there are problem areas, please identify where they are.
Base: All respondents =483 (EHO) Base: All respondents =483 (EHO)Response given but practice not observed by EHO = 1% of base Response given but practice not observed by EHO = 62% of base
8.5.3 Lighting & ventilationOne in twenty (4%) businesses did not have adequate lighting, (where lighting issues were appropriateto assess) (Figure 106).
Just under one in ten (7%) businesses did not have adequate ventilation in the premises (whereventilation issues were appropriate to assess) (Figure 107).
Figure 106: Adequate lighting for food preparation Figure 107: Adequate ventilation for food preparation
Q78: Lighting is adequate for preparation and processing food. Q79: There is adequate ventilation when preparing and processingfood.
Base: Lighting appropriate in business =472 (EHO) Base: Ventilation appropriate to business =452 (EHO)Response given but practice not observed by EHO = 1% of base Response given but practice not observed by EHO = 2% of base
92%
7%1%
0%10%20%30%40%50%60%70%80%90%
100%
Yes No Don't Know/NoAnswer
96%
4% 0%0%
10%20%30%40%50%60%70%80%90%
100%
Yes No Don't Know/NoAnswer
89%
10%1%
0%10%20%30%40%50%60%70%80%90%
100%
Yes No Don't Know/NoAnswer
12% 10%5%
8%
0%10%20%30%40%50%60%70%80%90%
100%
Prep processing& cooking areas
Cool room Dry goodstorage area
Hand basin /hand washing

2000/2001 National Food Safety Benchmark CR&C 0413Australia New Zealand Food Authority Page 99
8.5.4 Pest controlOne in ten (10%) food businesses showed evidence of pests (Figure 108). Where pest control wasappropriate, one quarter (24%) did not have adequate pest control measures in place (Figure 109)
Figure 108: Premises free of pests Figure 109: Has pest control
Q82: The premises is free of pests Q83: The business contracts a pest control company or has a pestcontrol program.
Base: All respondents =483 (EHO) Base: Pest control company appropriate to business =478 (EHO)Response given but practice not observed by EHO = 5% of base Response given but practice not observed by EHO = 18% of base
Businesses less likely to have pest control measures in place (if appropriate) included: small (26%) compared to large (2%); those not using chemical sanitisers (35%); those not undertaking some safe food handling practices such as:
− not checking the temperature of potentially hazardous food delivered to thebusiness (27%); and
− not having a written food safety program (26%).
74%
24%
1%0%
10%20%30%40%50%60%70%80%90%
100%
Yes No Don't Know/NoAnswer
89%
10%1%
0%10%20%30%40%50%60%70%80%90%
100%
Yes No Don't Know/NoAnswer

2000/2001 National Food Safety Benchmark CR&C 0413Australia New Zealand Food Authority Page 100
8.5.5 Chemical storageIn business where chemical use was an issue, one in twenty (6%) did not store chemicals safely (Figure110).
Figure 110: Chemicals are stored safelyQ84: Chemicals are stored safely
Base: Business stores chemicals = 476 (EHO)Response given but practice not observed by EHO = 3% of base
91%
6% 2%0%
10%20%30%40%50%60%70%80%90%
100%
Yes No Don't Know/NoAnswer

2000/2001 National Food Safety Benchmark CR&C 0413Australia New Zealand Food Authority Page 101
8.6 Food recall plans
When the Food Safety Standards come into effect in a State or Territory, business that are engaged inthe wholesale supply, manufacturing or importing of food will need to have developed plans to recallfood that has been released into the market and subsequently found to be unsafe.
These types of businesses were asked whether they had written food recall plans. No assessment ofthe adequacy of the plan was made.
Two thirds (66%) of “wholesale / manufacturing / importing” businesses did not have a written foodrecall plan (Figure 111). Businesses more likely to have a written food recall plan included:
those classified as high risk (39%) compared with medium risk (17%); and those having potentially hazardous food delivered (43%) compared to those not having
potentially hazardous food delivered (9%).
Figure 111: Wholesale/ Manufacturers/ Importers have food recall planQ86: If business is engaged in wholesale supply, manufacturing or importation of food, the
business has a written food recall plan.
Base: Wholesale/Manufacturing/Importing business 186 (EHO)Response given but practice not observed by EHO = 7% of base
In general, businesses undertaking other safe food handling precautions were more likely to have awritten food recall plan such as those with a:
temperature probe (48%) compared to those without a probe (2%); written food safety program (79%) compared to those without a program (6%); staff sickness policy (28%) compared to those without a policy (11%); and pest control program (30%) compared to those without a pest control program (12%).
Businesses more likely to have implemented other precautions to ensure safe foodhandling such as written food safety programs, staff sickness policies and pest control
programs were more likely to also have a written food recall plan.
25%
66%
10%
0%10%20%30%40%50%60%70%80%90%
100%
Yes No Don't Know/NoAnswer
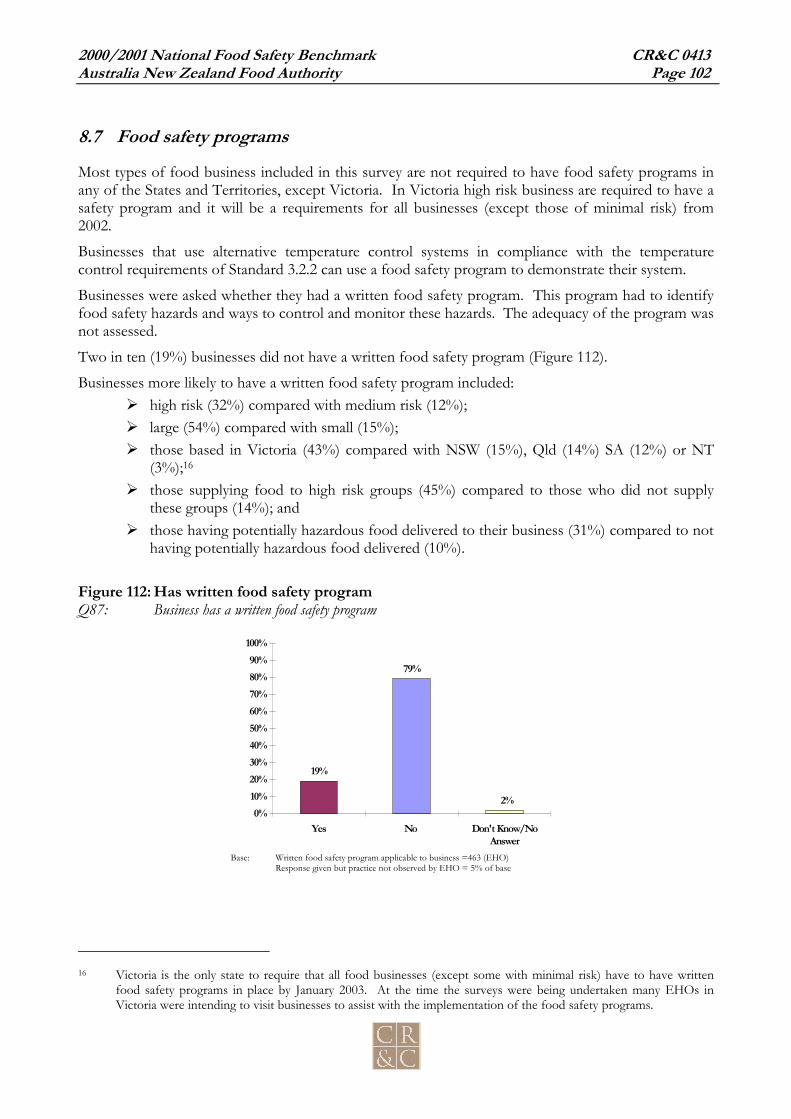
2000/2001 National Food Safety Benchmark CR&C 0413Australia New Zealand Food Authority Page 102
8.7 Food safety programs
Most types of food business included in this survey are not required to have food safety programs inany of the States and Territories, except Victoria. In Victoria high risk business are required to have asafety program and it will be a requirements for all businesses (except those of minimal risk) from2002.
Businesses that use alternative temperature control systems in compliance with the temperaturecontrol requirements of Standard 3.2.2 can use a food safety program to demonstrate their system.
Businesses were asked whether they had a written food safety program. This program had to identifyfood safety hazards and ways to control and monitor these hazards. The adequacy of the program wasnot assessed.
Two in ten (19%) businesses did not have a written food safety program (Figure 112).
Businesses more likely to have a written food safety program included: high risk (32%) compared with medium risk (12%); large (54%) compared with small (15%); those based in Victoria (43%) compared with NSW (15%), Qld (14%) SA (12%) or NT
(3%);16
those supplying food to high risk groups (45%) compared to those who did not supplythese groups (14%); and
those having potentially hazardous food delivered to their business (31%) compared to nothaving potentially hazardous food delivered (10%).
Figure 112: Has written food safety programQ87: Business has a written food safety program
Base: Written food safety program applicable to business =463 (EHO)Response given but practice not observed by EHO = 5% of base
16 Victoria is the only state to require that all food businesses (except some with minimal risk) have to have written
food safety programs in place by January 2003. At the time the surveys were being undertaken many EHOs inVictoria were intending to visit businesses to assist with the implementation of the food safety programs.
19%
79%
2%0%
10%20%30%40%50%60%70%80%90%
100%
Yes No Don't Know/NoAnswer

2000/2001 National Food Safety Benchmark CR&C 0413Australia New Zealand Food Authority Page 103
Businesses implementing additional safe food handling procedures were also more likely to have awritten food safety program. Businesses more likely to have a written food safety program includedthose that:
checked the temperature of potentially hazardous food delivered to their premises (44%)compared to those not checking the temperature of potentially hazardous food delivered(6%);
had a temperature probe (42%) compared to those without a temperature probe (3%); used chemical sanitisers (21%) compared to not using chemical sanitisers (10%); had a staff sickness policy (23%) compared to those without a staff sickness policy (5%); had a pest control program (22%) compared to those without a program (11%); and were reported to have had a good overall appearance (23%) compared to not having a
good overall appearance (3%).
Businesses more likely to have implemented additional safe food handling practices suchas having a temperature probe, using chemical sanitisers, staff sickness policies and pest
control programs were also more likely to have a written food safety program.
Additionally, businesses with a written food safety program were more likely to: remove food from display and mix it with new batches of food on the next day (24%)
compared to those without a written food safety program (13%); and use a commercial dishwasher (45%) compared to those without a written food safety
program (28%).
Businesses without a written food safety program (10%) were less likely to use separate equipment forraw and ready-to-eat food, or sanitise equipment between use compared to those with a written foodsafety program (3%).
Businesses with staff sickness policies (92%) were more likely to use separate equipment for preparingraw and ready-to-eat food, or sanitise equipment between uses than those without policies (85%)(Table 26).
Table 26: Preparation and processing raw food by safety program, sickness policies andregion
Q62: Separate equipment is used for preparing and processing raw and ready to eat food, or equipment is cleanedand sanitised between these uses
Written Food safetyprogram
Staff SicknessPolicy Region
Yes(79)A
No(314)
B
Yes(323)
C
No(87)D
Metro(201)
E
Regional(217)
F
Total(418)
GNett Yes 96 89 92D 85 88 92 90
Nett No 3 10A 7 14C 11 6 9
Nett Not Observed 32 38 37 33 36 35 36

2000/2001 National Food Safety Benchmark CR&C 0413Australia New Zealand Food Authority Page 104
No Answer 0 - - 0 - - -Base: Process raw and ready-to-eat food (418)