campus alberta planning resource · outside of the province. the 2016 campus alberta planning...
TRANSCRIPT
Campus Alberta Planning Resource 2016
1 | P a g e
Executive Summary Alberta’s post-secondary education system sustains and grows Alberta by helping people unlock their potential
through education. Creative, passionate and highly trained graduates contribute to a diversified economy that
creates jobs and opportunities for Albertans and their families. At the same time, the post-secondary system is
influenced by the demographic composition of the province, as well as socio-economic forces both inside and
outside of the province. The 2016 Campus Alberta Planning Resource is intended to present an overview of the
current composition and outcomes of Alberta’s post-secondary system in the context of key factors that
influence the system.
Population, Labour Force and Post-Secondary Participation
Even though Alberta’s population profile is one of the youngest in Canada, its population is aging.
The percentage of retirement-age Albertans is expected to increase significantly over the next decade. Despite
the general aging of Alberta’s population, the 18 to 24 year old age group, which accounts for a majority
of post-secondary enrolments, is projected to increase by 3.1% over the next 10 years.
Over the past 10 years, the number of Albertans in the labour force with a post-secondary credential
as their highest educational qualification increased. In 2015, more than half of Alberta’s labour force had
a post-secondary credential, including 27% who had a university undergraduate or graduate degree, and 34%
who had a post-secondary certificate or diploma as their highest level of education. However, the post-
secondary participation rate of Albertans aged 18 to 34 years was 17% in 2015 and has remained virtually
unchanged for the past 10 years. Consequently, it appears that Alberta is gaining some skilled workers who
have already completed their education via migration.
Similar to previous years, in 2015, Indigenous, youth and very recent immigrants experienced weaker labour
market outcomes than other Albertans.
Historical Applications and Enrolments
Over the past five years, the number of applicants to Alberta’s post-secondary system increased every
year. This growth was driven primarily by increases in applicants from outside Canada. While the majority of
applicants were from Alberta, the number from Alberta decreased slightly every year from 2010 to 2014, then
increased in 2015 and 2016.
From 2012 to 2016, all of the credentialed programs saw increases in the number of applicants, with
the highest growth occurring in certificate programs. In the fall of 2016, more than half of all applications
were made to institutions in the Comprehensive Academic and Research Institutions (CARI) sector. Degree
programs were the most preferred, followed by diploma and non-credential programs.
In general, enrolment in Alberta’s publicly-funded adult learning system increased from 2007-08 to
2015-16. Enrolment increased an average of 1.7% per year. More than half of the post-secondary enrolments
in 2015–16 were in degree programs. Diploma programs accounted for 18% of enrolments. Twelve percent
of enrolments were in certificate programs and 15% of enrolments were in non-credential programs.
2 | P a g e
Over the past five years, enrolment in degree programs increased by five percent. Enrolments in
bachelors programs grew by 4%, master’s programs by 12% and doctoral programs by 28%, while enrolments
in non-credential programs decreased by two percent. During that timeframe, the Independent Academic
Institutions sector enjoyed the highest growth in enrolment (16%). Enrolments in the Polytechnical Institution
sector also grew at an above average pace.
The number of visa students enrolled and their proportion of total enrolment in Alberta’s post-
secondary institutions have more than doubled over the past 10 years. In the 2015-16 academic year, visa
students accounted for 8.3% of all students at post-secondary institutions in Alberta (excluding Athabasca
University).
A key policy direction outlined in A Learning Alberta and the Roles and Mandates Policy Framework is to increase
access for groups traditionally under-represented in post-secondary education, including individuals with
disabilities. The number of students with disabilities who received support to attend post-secondary
education has increased in each of the past five years.
Over the past five years, both the number of Indigenous learners enrolled in post-secondary education
and the proportion of the student population who were Indigenous increased slightly. A larger
proportion of Indigenous students were enrolled in non-credential programs.
In 2015–16, just over half of all students enrolled in Alberta’s publicly-funded post-secondary institutions were
female. This proportion has remained stable over the past five years. A higher proportion of females
than males were enrolled in all sectors except Polytechnical Institutions.
Future Enrolments
Post-secondary enrolments in Alberta appear to be a complex function of labour market forces, population
distribution, migration volume and characteristics, and recent high school graduates’ decisions about labour
force or post-secondary participation. Until recently, the relatively strong labour market in Alberta allowed
high school graduates to actively pursue attractive job opportunities after graduation. However, if the
provincial economy recovers slowly from the recent slowdown and associated higher unemployment,
especially in the 18 to 34 year old age group, then this may result in more Albertans pursuing post-
secondary education in the near future.
Enrolments in publicly-funded post-secondary institutions are projected to increase by 5.6% over the
next 10 years, remaining relatively static for the first half of that period, then increasing marginally for
the remainder.
Enrolments are projected to increase in all sectors except the Comprehensive Community Institutions
(CCIs) and Independent Academic Institutions (IAIs) sector. Most service regions are expected to
experience enrolment increases, with urban areas projected to account for the bulk of that growth.

3 | P a g e
System Outputs
The total number of students completing their studies has shown an increasing trend over the past
five years. In 2015–16, just over 50,000 learners completed a credentialed program of study (certificate,
diploma or degree) at a publicly-funded institution in Alberta. The Trades and Technologies program band
had the highest number of program completers, followed by Health Sciences, and Business.
Based on the latest available analysis, completion rates vary somewhat by credential type.
Approximately three-quarters of Bachelor’s degree program registrants completed their program within the
respective completion timeframes. Eighty percent of Master’s degree students and approximately half of
doctoral students completed their programs within the expected timeframe. The completion rates for the
occupational diploma and certificate credential types were around 70% and 75% respectively.
The Alberta Graduate Outcomes Survey assessed employment outcomes of graduates from Alberta’s publicly-
funded post-secondary institutions. Results of the class of 2013–14 showed an employment rate of 92% among
those who are currently in the active labour force (those who are currently employed or looking for work).
The mean annual income of respondents was $61,667. The average annual income varied by program of study,
with graduates from Trades & Technologies reporting the highest average income.
Overall, graduates who were employed at the time of the survey were highly satisfied with their current
job. A majority of employed graduates felt that that their educational qualifications matched well with their
current job. These results have remained consistent over the past four survey cycles.
4 | P a g e
EXECUTIVE SUMMARY .................................................................................................................... 1
Population, Labour Force and Post-Secondary Participation ............................................................................ 1
Historical Applications and Enrolments ................................................................................................................ 1
Future Enrolments .................................................................................................................................................... 2
System Outputs .......................................................................................................................................................... 3
CHAPTER 1: SOCIAL ENVIRONMENT .......................................................................................... 6
DEMOGRAPHICS ................................................................................................................................. 6
Population ................................................................................................................................................................... 6
Projected Population Growth .................................................................................................................................. 7
EDUCATION ....................................................................................................................................... 8
Post-Secondary Participation ................................................................................................................................... 8
Educational Attainment ............................................................................................................................................ 9
LABOUR MARKET .............................................................................................................................. 11
Educational Attainment of Labour Force ........................................................................................................... 11
Post-secondary Education and Employment Outcomes .................................................................................. 12
CHAPTER 2: POST-SECONDARY EDUCATION ........................................................................... 14
ADULT LEARNING SYSTEM ....................................................................................................... 14
APPLICATION TRENDS ...................................................................................................................... 16
Acceptance Rate and Conversion Rate ................................................................................................................ 17
Application by Credentials ..................................................................................................................................... 19
Applications by Program Bands ............................................................................................................................ 20
Applications by Sector ............................................................................................................................................ 21
ENROLMENT TRENDS ..................................................................................................................... 22
Enrolment by Credentials ....................................................................................................................................... 23
Enrolment by Program Bands ............................................................................................................................... 24
Enrolment by Age Groups ..................................................................................................................................... 25
Enrolment by Sectors .............................................................................................................................................. 27
ENROLMENT PROJECTIONS ............................................................................................................ 38
LEARNER GROUPS ............................................................................................................................. 41
Indigenous Learners ................................................................................................................................................ 41
International Education .......................................................................................................................................... 43
Learners with Disabilities ....................................................................................................................................... 46
Female Students in Post-Secondary Education .................................................................................................. 47
LEARNER PATHWAYS ....................................................................................................................... 48
Transfers and Recognition of Prior Learning ..................................................................................................... 48
Student Enrolment Flow ........................................................................................................................................ 48
Transition from High School ................................................................................................................................. 51
STUDENT AID ................................................................................................................................... 52
Student Aid Alberta – Loans and Grants ............................................................................................................ 52
Alberta Scholarships& Awards .............................................................................................................................. 54
APPRENTICESHIP AND INDUSTRY TRAINING .................................................................................. 55
Apprenticeship Registration ................................................................................................................................... 55
Technical Training Seats Offered .......................................................................................................................... 56
5 | P a g e
High School Students’ Perceptions of Trades .................................................................................................... 57
COMMUNITY ADULT LEARNING ...................................................................................................... 58
Foundational Learning in Post-Secondary Institutions ..................................................................................... 59
PRIVATE CAREER COLLEGES ........................................................................................................... 60
CHAPTER 3: SYSTEM OUTPUT ...................................................................................................... 61
PROGRAM COMPLETION ................................................................................................................... 61
SATISFACTION WITH POST-SECONDARY EDUCATION ..................................................................... 62
EMPLOYMENT OUTCOMES OF GRADUATES .................................................................................... 63
Graduate’s Job Satisfaction .................................................................................................................................... 63
Job Relatedness to Education ................................................................................................................................ 64
APPENDICES ..................................................................................................................................... 65
APPENDIX A: METHODOLOGICAL NOTES ....................................................................................... 66
A1. Population Projections .................................................................................................................................... 66
A2. Program Bands ................................................................................................................................................. 67
A3. Enrolment .......................................................................................................................................................... 68
APPENDIX B: DATA TABLES ............................................................................................................. 69
Population by Service Region, All Ages ............................................................................................................... 69
High School .............................................................................................................................................................. 70
Application ................................................................................................................................................................ 72
Enrolment ................................................................................................................................................................. 78
Completers ................................................................................................................................................................ 95
GLOSSARY .......................................................................................................................................... 98
ENDNOTES ...................................................................................................................................... 100
6 | P a g e
Chapter 1: SOCIAL ENVIRONMENT
Demographics
The demographic profile of Alberta is an important external factor that affects demand for post-secondary
education. Trends and changes at the regional and subpopulation group levels are also important as post-
secondary education needs vary among population sub-groups.
Population
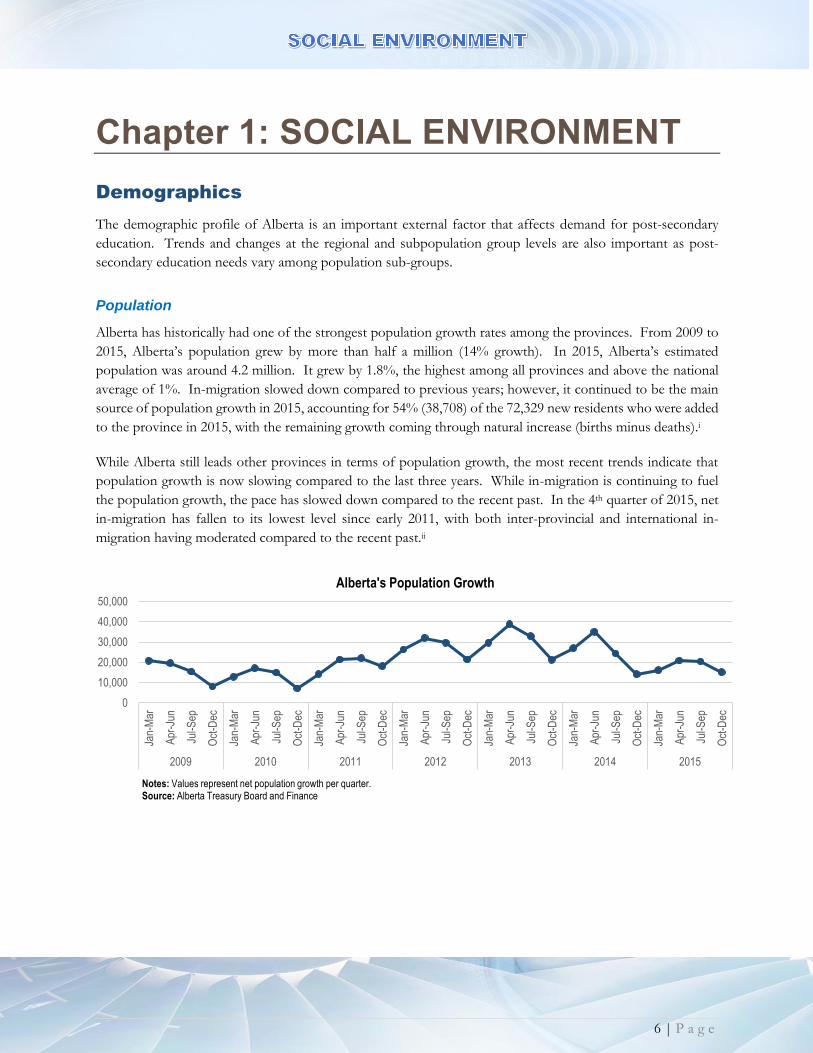
Alberta has historically had one of the strongest population growth rates among the provinces. From 2009 to
2015, Alberta’s population grew by more than half a million (14% growth). In 2015, Alberta’s estimated
population was around 4.2 million. It grew by 1.8%, the highest among all provinces and above the national
average of 1%. In-migration slowed down compared to previous years; however, it continued to be the main
source of population growth in 2015, accounting for 54% (38,708) of the 72,329 new residents who were added
to the province in 2015, with the remaining growth coming through natural increase (births minus deaths).i
While Alberta still leads other provinces in terms of population growth, the most recent trends indicate that
population growth is now slowing compared to the last three years. While in-migration is continuing to fuel
the population growth, the pace has slowed down compared to the recent past. In the 4th quarter of 2015, net
in-migration has fallen to its lowest level since early 2011, with both inter-provincial and international in-
migration having moderated compared to the recent past.ii
0
10,000
20,000
30,000
40,000
50,000
Jan-
Mar
Apr
-Jun
Jul-S
ep
Oct
-Dec
Jan-
Mar
Apr
-Jun
Jul-S
ep
Oct
-Dec
Jan-
Mar
Apr
-Jun
Jul-S
ep
Oct
-Dec
Jan-
Mar
Apr
-Jun
Jul-S
ep
Oct
-Dec
Jan-
Mar
Apr
-Jun
Jul-S
ep
Oct
-Dec
Jan-
Mar
Apr
-Jun
Jul-S
ep
Oct
-Dec
Jan-
Mar
Apr
-Jun
Jul-S
ep
Oct
-Dec
2009 2010 2011 2012 2013 2014 2015
Alberta's Population Growth
Notes: Values represent net population growth per quarter.Source: Alberta Treasury Board and Finance
7 | P a g e
Projected Population Growth
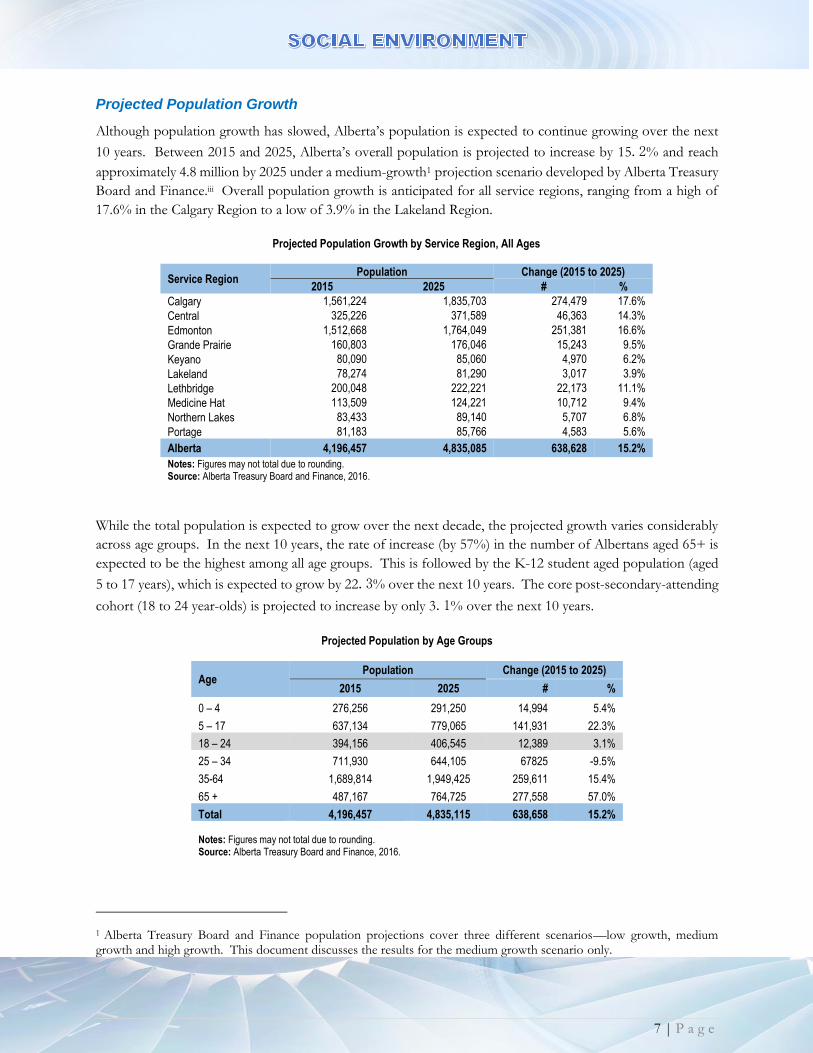
Although population growth has slowed, Alberta’s population is expected to continue growing over the next
10 years. Between 2015 and 2025, Alberta’s overall population is projected to increase by 15.2% and reach
approximately 4.8 million by 2025 under a medium-growth1 projection scenario developed by Alberta Treasury
Board and Finance.iii Overall population growth is anticipated for all service regions, ranging from a high of
17.6% in the Calgary Region to a low of 3.9% in the Lakeland Region.
While the total population is expected to grow over the next decade, the projected growth varies considerably
across age groups. In the next 10 years, the rate of increase (by 57%) in the number of Albertans aged 65+ is
expected to be the highest among all age groups. This is followed by the K-12 student aged population (aged
5 to 17 years), which is expected to grow by 22.3% over the next 10 years. The core post-secondary-attending
cohort (18 to 24 year-olds) is projected to increase by only 3.1% over the next 10 years.
Projected Population by Age Groups
Age Population Change (2015 to 2025)
2015 2025 # %
0 – 4 276,256 291,250 14,994 5.4%
5 – 17 637,134 779,065 141,931 22.3%
18 – 24 394,156 406,545 12,389 3.1%
25 – 34 711,930 644,105 67825 -9.5%
35-64 1,689,814 1,949,425 259,611 15.4%
65 + 487,167 764,725 277,558 57.0%
Total 4,196,457 4,835,115 638,658 15.2%
Notes: Figures may not total due to rounding. Source: Alberta Treasury Board and Finance, 2016.
1 Alberta Treasury Board and Finance population projections cover three different scenarios—low growth, medium growth and high growth. This document discusses the results for the medium growth scenario only.
Projected Population Growth by Service Region, All Ages
Service Region Population Change (2015 to 2025)
2015 2025 # %
Calgary 1,561,224 1,835,703 274,479 17.6%
Central 325,226 371,589 46,363 14.3%
Edmonton 1,512,668 1,764,049 251,381 16.6%
Grande Prairie 160,803 176,046 15,243 9.5%
Keyano 80,090 85,060 4,970 6.2%
Lakeland 78,274 81,290 3,017 3.9%
Lethbridge 200,048 222,221 22,173 11.1%
Medicine Hat 113,509 124,221 10,712 9.4%
Northern Lakes 83,433 89,140 5,707 6.8%
Portage 81,183 85,766 4,583 5.6%
Alberta 4,196,457 4,835,085 638,628 15.2%
Notes: Figures may not total due to rounding. Source: Alberta Treasury Board and Finance, 2016.
8 | P a g e
Education
As technology advances, the demand for highly skilled and educated workers is likely to increase and the post-
secondary sector is instrumental in training these workers.
Post-Secondary Participation
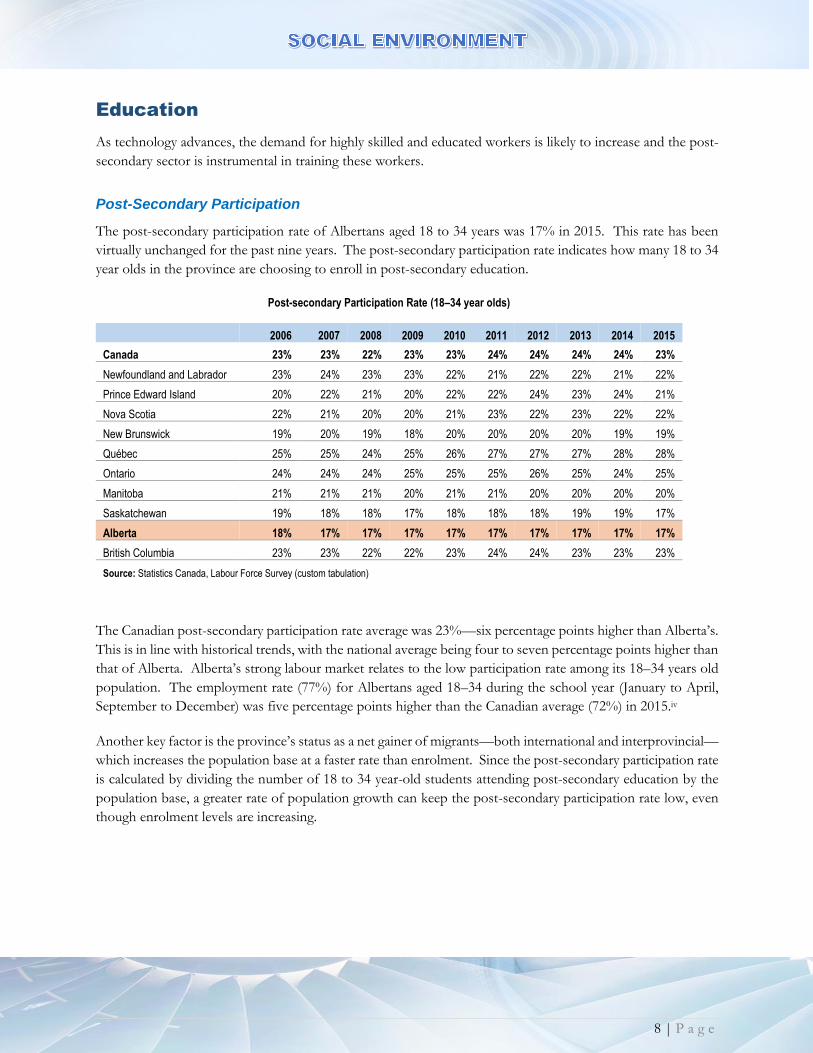
The post-secondary participation rate of Albertans aged 18 to 34 years was 17% in 2015. This rate has been
virtually unchanged for the past nine years. The post-secondary participation rate indicates how many 18 to 34
year olds in the province are choosing to enroll in post-secondary education.
Post-secondary Participation Rate (18–34 year olds)
2006 2007 2008 2009 2010 2011 2012 2013 2014 2015
Canada 23% 23% 22% 23% 23% 24% 24% 24% 24% 23%
Newfoundland and Labrador 23% 24% 23% 23% 22% 21% 22% 22% 21% 22%
Prince Edward Island 20% 22% 21% 20% 22% 22% 24% 23% 24% 21%
Nova Scotia 22% 21% 20% 20% 21% 23% 22% 23% 22% 22%
New Brunswick 19% 20% 19% 18% 20% 20% 20% 20% 19% 19%
Québec 25% 25% 24% 25% 26% 27% 27% 27% 28% 28%
Ontario 24% 24% 24% 25% 25% 25% 26% 25% 24% 25%
Manitoba 21% 21% 21% 20% 21% 21% 20% 20% 20% 20%
Saskatchewan 19% 18% 18% 17% 18% 18% 18% 19% 19% 17%
Alberta 18% 17% 17% 17% 17% 17% 17% 17% 17% 17%
British Columbia 23% 23% 22% 22% 23% 24% 24% 23% 23% 23%
Source: Statistics Canada, Labour Force Survey (custom tabulation)
The Canadian post-secondary participation rate average was 23%—six percentage points higher than Alberta’s.
This is in line with historical trends, with the national average being four to seven percentage points higher than
that of Alberta. Alberta’s strong labour market relates to the low participation rate among its 18–34 years old
population. The employment rate (77%) for Albertans aged 18–34 during the school year (January to April,
September to December) was five percentage points higher than the Canadian average (72%) in 2015.iv
Another key factor is the province’s status as a net gainer of migrants—both international and interprovincial—
which increases the population base at a faster rate than enrolment. Since the post-secondary participation rate
is calculated by dividing the number of 18 to 34 year-old students attending post-secondary education by the
population base, a greater rate of population growth can keep the post-secondary participation rate low, even
though enrolment levels are increasing.
9 | P a g e
Educational Attainment
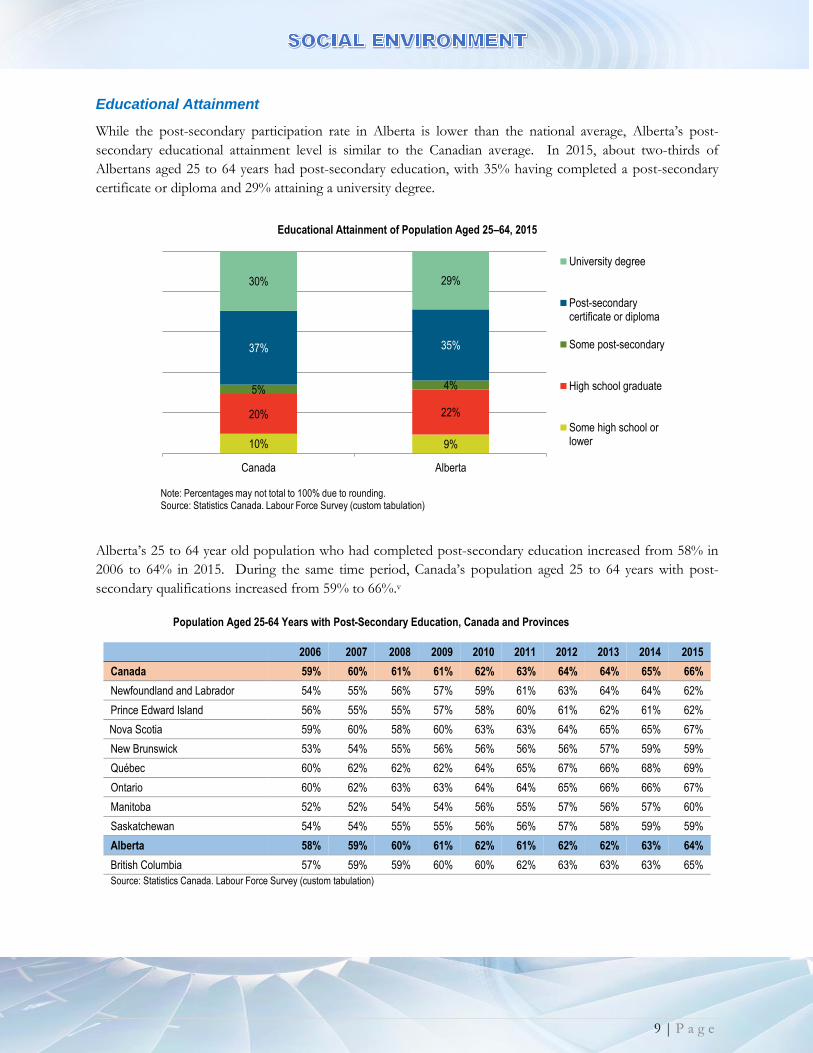
While the post-secondary participation rate in Alberta is lower than the national average, Alberta’s post-
secondary educational attainment level is similar to the Canadian average. In 2015, about two-thirds of
Albertans aged 25 to 64 years had post-secondary education, with 35% having completed a post-secondary
certificate or diploma and 29% attaining a university degree.
Alberta’s 25 to 64 year old population who had completed post-secondary education increased from 58% in
2006 to 64% in 2015. During the same time period, Canada’s population aged 25 to 64 years with post-
secondary qualifications increased from 59% to 66%.v
Population Aged 25-64 Years with Post-Secondary Education, Canada and Provinces
2006 2007 2008 2009 2010 2011 2012 2013 2014 2015
Canada 59% 60% 61% 61% 62% 63% 64% 64% 65% 66%
Newfoundland and Labrador 54% 55% 56% 57% 59% 61% 63% 64% 64% 62%
Prince Edward Island 56% 55% 55% 57% 58% 60% 61% 62% 61% 62%
Nova Scotia 59% 60% 58% 60% 63% 63% 64% 65% 65% 67%
New Brunswick 53% 54% 55% 56% 56% 56% 56% 57% 59% 59%
Québec 60% 62% 62% 62% 64% 65% 67% 66% 68% 69%
Ontario 60% 62% 63% 63% 64% 64% 65% 66% 66% 67%
Manitoba 52% 52% 54% 54% 56% 55% 57% 56% 57% 60%
Saskatchewan 54% 54% 55% 55% 56% 56% 57% 58% 59% 59%
Alberta 58% 59% 60% 61% 62% 61% 62% 62% 63% 64%
British Columbia 57% 59% 59% 60% 60% 62% 63% 63% 63% 65%
Source: Statistics Canada. Labour Force Survey (custom tabulation)
10% 9%
20% 22%
5% 4%
37% 35%
30% 29%
Canada Alberta
Educational Attainment of Population Aged 25–64, 2015
University degree
Post-secondarycertificate or diploma
Some post-secondary
High school graduate
Some high school orlower
Note: Percentages may not total to 100% due to rounding.Source: Statistics Canada. Labour Force Survey (custom tabulation)
10 | P a g e
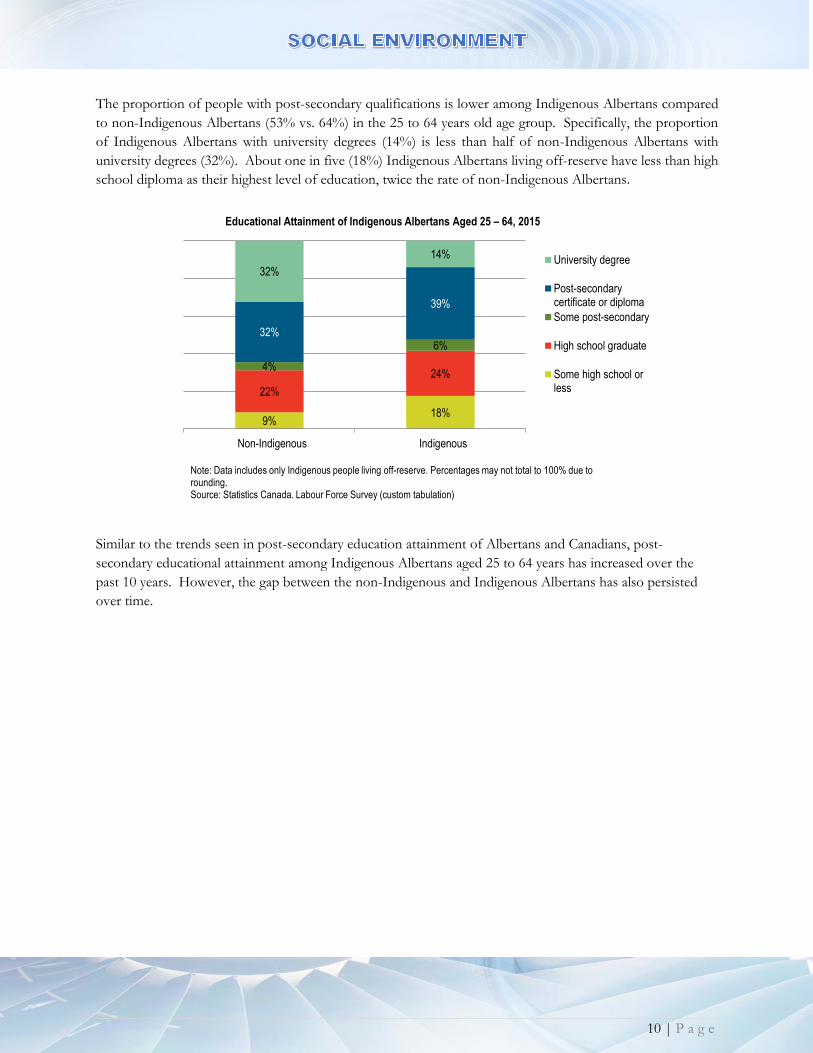
The proportion of people with post-secondary qualifications is lower among Indigenous Albertans compared
to non-Indigenous Albertans (53% vs. 64%) in the 25 to 64 years old age group. Specifically, the proportion
of Indigenous Albertans with university degrees (14%) is less than half of non-Indigenous Albertans with
university degrees (32%). About one in five (18%) Indigenous Albertans living off-reserve have less than high
school diploma as their highest level of education, twice the rate of non-Indigenous Albertans.
Similar to the trends seen in post-secondary education attainment of Albertans and Canadians, post-
secondary educational attainment among Indigenous Albertans aged 25 to 64 years has increased over the
past 10 years. However, the gap between the non-Indigenous and Indigenous Albertans has also persisted
over time.
9%18%
22%
24%4%
6%32%
39%
32%
14%
Non-Indigenous Indigenous
Educational Attainment of Indigenous Albertans Aged 25 – 64, 2015
University degree
Post-secondarycertificate or diploma
Some post-secondary
High school graduate
Some high school orless
Note: Data includes only Indigenous people living off-reserve. Percentages may not total to 100% due to rounding.Source: Statistics Canada. Labour Force Survey (custom tabulation)
11 | P a g e
Labour Market
Educational Attainment of Labour Force
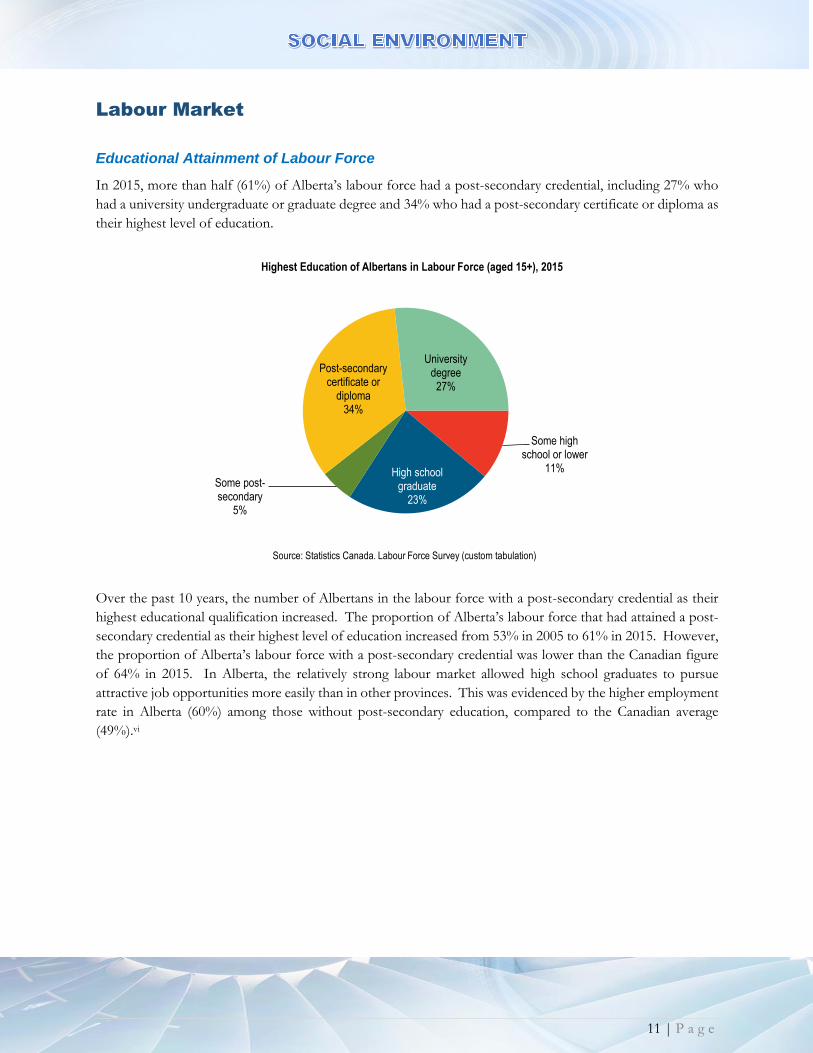
In 2015, more than half (61%) of Alberta’s labour force had a post-secondary credential, including 27% who
had a university undergraduate or graduate degree and 34% who had a post-secondary certificate or diploma as
their highest level of education.
Over the past 10 years, the number of Albertans in the labour force with a post-secondary credential as their
highest educational qualification increased. The proportion of Alberta’s labour force that had attained a post-
secondary credential as their highest level of education increased from 53% in 2005 to 61% in 2015. However,
the proportion of Alberta’s labour force with a post-secondary credential was lower than the Canadian figure
of 64% in 2015. In Alberta, the relatively strong labour market allowed high school graduates to pursue
attractive job opportunities more easily than in other provinces. This was evidenced by the higher employment
rate in Alberta (60%) among those without post-secondary education, compared to the Canadian average
(49%).vi
Some high school or lower
11%High school graduate
23%
Some post-secondary
5%
Post-secondary certificate or
diploma34%
University degree27%
Highest Education of Albertans in Labour Force (aged 15+), 2015
Source: Statistics Canada. Labour Force Survey (custom tabulation)
12 | P a g e
Post-secondary Education and Employment Outcomes
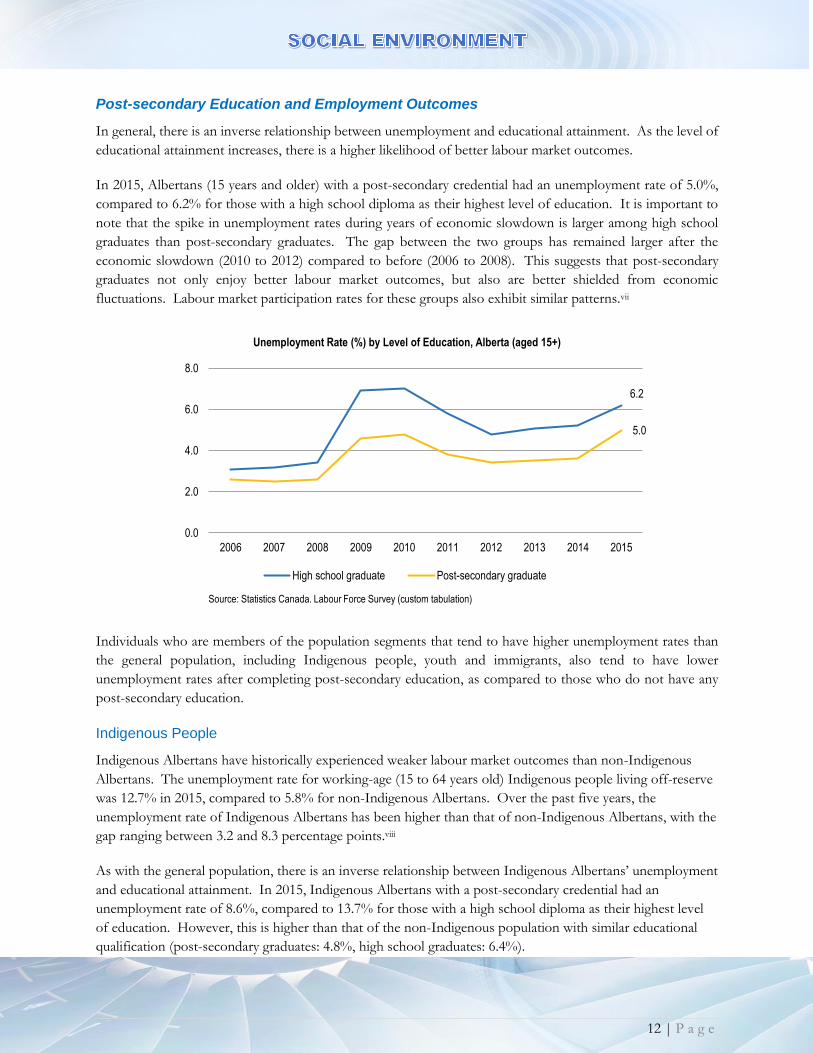
In general, there is an inverse relationship between unemployment and educational attainment. As the level of
educational attainment increases, there is a higher likelihood of better labour market outcomes.
In 2015, Albertans (15 years and older) with a post-secondary credential had an unemployment rate of 5.0%,
compared to 6.2% for those with a high school diploma as their highest level of education. It is important to
note that the spike in unemployment rates during years of economic slowdown is larger among high school
graduates than post-secondary graduates. The gap between the two groups has remained larger after the
economic slowdown (2010 to 2012) compared to before (2006 to 2008). This suggests that post-secondary
graduates not only enjoy better labour market outcomes, but also are better shielded from economic
fluctuations. Labour market participation rates for these groups also exhibit similar patterns.vii
Individuals who are members of the population segments that tend to have higher unemployment rates than
the general population, including Indigenous people, youth and immigrants, also tend to have lower
unemployment rates after completing post-secondary education, as compared to those who do not have any
post-secondary education.
Indigenous People
Indigenous Albertans have historically experienced weaker labour market outcomes than non-Indigenous
Albertans. The unemployment rate for working-age (15 to 64 years old) Indigenous people living off-reserve
was 12.7% in 2015, compared to 5.8% for non-Indigenous Albertans. Over the past five years, the
unemployment rate of Indigenous Albertans has been higher than that of non-Indigenous Albertans, with the
gap ranging between 3.2 and 8.3 percentage points.viii
As with the general population, there is an inverse relationship between Indigenous Albertans’ unemployment
and educational attainment. In 2015, Indigenous Albertans with a post-secondary credential had an
unemployment rate of 8.6%, compared to 13.7% for those with a high school diploma as their highest level
of education. However, this is higher than that of the non-Indigenous population with similar educational
qualification (post-secondary graduates: 4.8%, high school graduates: 6.4%).
6.2
5.0
0.0
2.0
4.0
6.0
8.0
2006 2007 2008 2009 2010 2011 2012 2013 2014 2015
Unemployment Rate (%) by Level of Education, Alberta (aged 15+)
High school graduate Post-secondary graduate
Source: Statistics Canada. Labour Force Survey (custom tabulation)
13 | P a g e
Youth
In 2015, youth (15 to 24 years of age) formed 16% of the working-age (15+ years) population of Alberta, similar
to the Canadian level (15%).ix Alberta’s 2015 youth unemployment rate of 10.7% was lower than the Canadian
average of 13.2%. However, similar to previous years, the youth unemployment rate was higher than that of
older Albertans in 2015 (10.7% vs 5.2%). As with general population, unemployment rates tend to be higher
among youth without post-secondary education than for those with post-secondary education (12.5% vs.
7.5%).x
International Immigrants
Approximately 742,900 working-aged (15+ years) immigrants2 lived in Alberta in 2015, representing 22% of
Alberta’s working-age population. Alberta had the second highest employment rate for immigrants in Canada
in 2015 at 65%, behind Saskatchewan (69%). Immigrants to Alberta experienced an unemployment rate of
7.1%, above the provincial average of 6.0%, and very recent immigrants were less likely to have found
employment, reporting a 10.0% unemployment rate.xi
In 2015, the proportion of post-secondary graduates among international immigrants to Alberta was higher
than for those born in Canada (60% vs. 54%). However, the unemployment rate was higher among immigrants
with post-secondary education than for those born in Canada. Immigrants to Alberta with post-secondary
certificates/diplomas had an unemployment rate of 6.9%, higher than that for non-immigrants with similar
education (4.3%).xii
Detailed labour force profiles for Indigenous, Youth and Immigrant groups are published at:
http://work.alberta.ca/labour/labour-force-profiles.html.
2 Immigrants are defined as people who are, or have been, landed immigrants in Canada.

14 | P a g e
Chapter 2: Post-Secondary Education
ADULT LEARNING SYSTEM
The Roles and Mandates Policy Framework* for Alberta’s Publicly-Funded Advanced Education System,
released in 2007, is the foundation of Campus Alberta. The concept of Campus Alberta describes post-
secondary education and training providers working together to ensure all Albertans have the opportunity to
participate in high-quality and innovative learning opportunities in order to advance the social, cultural and
economic well-being of the province.13 †
Learners are the core beneficiaries of an integrated adult learning system. Campus Alberta partners deliver
accessible, affordable and high quality learning opportunities, building pathways within their institutions and
with other institutions and community partners for learners to get the education or training they need—how,
where, and when they need it. Taxpayers are well served through a quality adult learning system that provides
a high return on their investments. In many cases, cooperation offers better learning outcomes allowing
institutions to focus on areas of strength while leveraging the strengths of others. Society benefits when human
potential is realized. From basic literacy training to job readiness, and apprenticeship training to graduate and
post-graduate studies, Campus Alberta is at the centre of developing the province’s knowledge-driven economy,
enhancing Alberta’s competitiveness and ultimately, contributing to a bright future for all Albertans.14
Publicly-funded post-secondary institutions are the cornerstones of Campus Alberta, and work together to
create a learner-centered system that is accessible, affordable, and of high quality. Private providers,
community-based organizations, and industry also provide diverse learning opportunities within and in support
of Campus Alberta. No matter the provider, each has a role in making Alberta a great place to learn and grow.
Campus Alberta is also supported by Alberta Economic Development and Trade and the industry.15
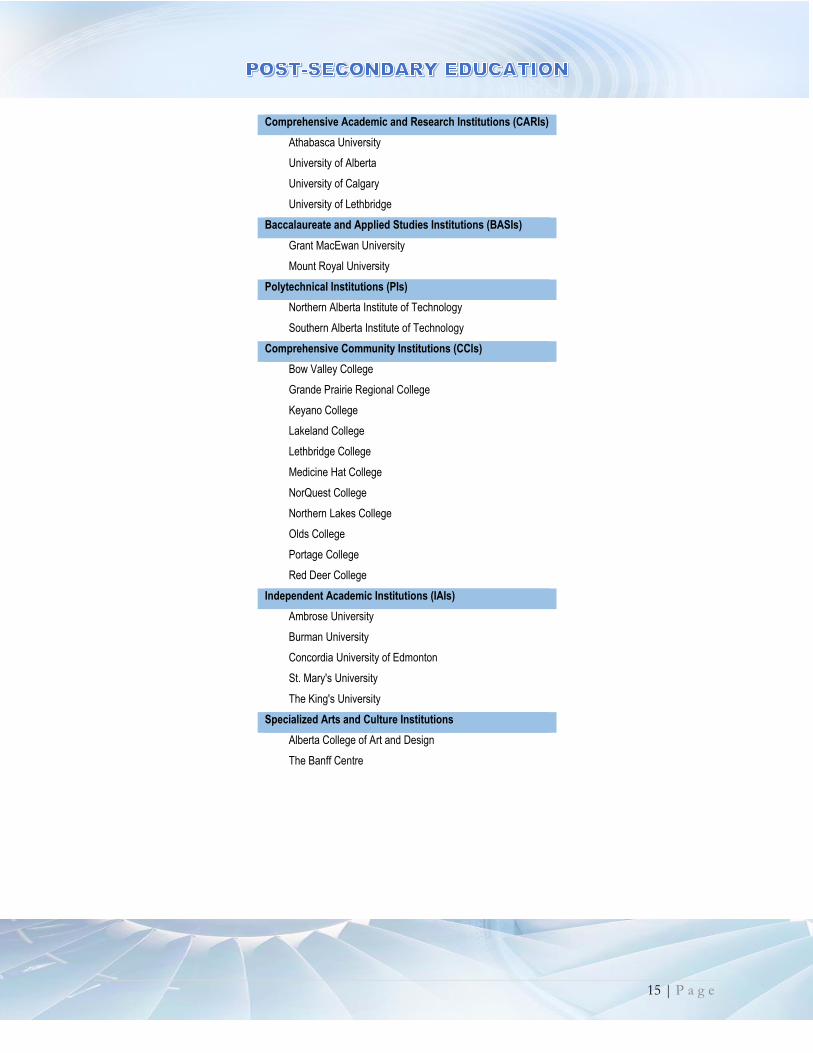
Campus Alberta’s 26 publicly-funded post-secondary institutions are categorized into six sectors, each with
corresponding roles and mandates. Institutional differentiation among sectors is based largely on credentials
offered, type and intensity of research activity, and geographic focus. It is also recognized that institutions
differ within each sector according to programs and specializations, institutional strengths, strategic priorities,
client groups served, geographic region served, and delivery models utilized. The six sectors are Comprehensive
Academic and Research Institutions (CARIs), Baccalaureate and Applied Studies Institutions (BASIs),
Polytechnical Institutions (PIs), Comprehensive Community Institutions (CCIs), Independent Academic
Institutions (IAIs), and Specialized Arts and Culture Institutions (SACIs).
* For more information, see the Roles and Mandates Policy Framework for Alberta’s Publicly-Funded Advanced Learning System,
available online at http://eae.alberta.ca/post-secondary/policy/roles.aspx.
† For more information, see Guidelines for Board of Governors Members: An Introduction to Board Governance at Alberta’s Public
Post-Secondary Institutions http://eae.alberta.ca/media/383000/board%20manual%20complete%202014-01-23.pdf.
15 | P a g e
Comprehensive Academic and Research Institutions (CARIs)
Athabasca University
University of Alberta
University of Calgary
University of Lethbridge
Baccalaureate and Applied Studies Institutions (BASIs)
Grant MacEwan University
Mount Royal University
Polytechnical Institutions (PIs)
Northern Alberta Institute of Technology
Southern Alberta Institute of Technology
Comprehensive Community Institutions (CCIs)
Bow Valley College
Grande Prairie Regional College
Keyano College
Lakeland College
Lethbridge College
Medicine Hat College
NorQuest College
Northern Lakes College
Olds College
Portage College
Red Deer College
Independent Academic Institutions (IAIs)
Ambrose University
Burman University
Concordia University of Edmonton
St. Mary's University
The King's University
Specialized Arts and Culture Institutions
Alberta College of Art and Design
The Banff Centre

16 | P a g e
Application Trends
In the fall of each academic year, Alberta Advanced Education (AE) collects information from publicly-funded
post-secondary institutions (not including the Banff Centre) on student applications. The information is
collected through the Application Submission Initiative (ASI) database and is a snapshot of application activity
for programs beginning between August 1st and September 30th each year. All data collected is subject to
varying institutional (and program) admission policies, and therefore caution should be taken when using this
data for decision-making or comparison purposes. Using students’ unique Alberta Student Number (ASN) and
postal codes on post-secondary application forms, AE can acquire a general idea of the demand and supply*.
In fall 2016, 161,678 prospective students applied to programs at Alberta’s publicly-funded post-secondary
institutions. The number of applicants to the system has increased every year for the past five years (3%
increase from 2012 to 2016). The growth in the number of applicants has primarily been driven by increases
in applicants from outside Canada. While a majority (110,397) of the applicants were from Alberta, the number
of applicants from Alberta decreased slightly between 2012 and 2014, and then it increased in 2015 and 2016.
* The data collected were based on institutions’ own scenarios such as application deadline and admission policies.
151,358 154,223 156,426 157,316 157,481 159,327 161,678
106,286 105,924 104,006 103,479 102,557 106,357 110,397
32,000 33,575 35,684 35,771 35,903 33,778 30,154
14,256 16,051 18,574 20,073 21,325 21,732 23,315
Fall 2010 Fall 2011 Fall 2012 Fall 2013 Fall 2014 Fall 2015 Fall 2016
Applicants to Post-secondary System – by Source Regions
All Applicants
From Alberta
Other CanadianProvinces
Outside Canada
Notes: Applications were categorized into Alberta and non-Alberta/Canadian groups based on the postal codes submitted at the time of application. Does not include the Banff Centre.Source: Alberta Advanced Education – Application Submission Initiative.
17 | P a g e
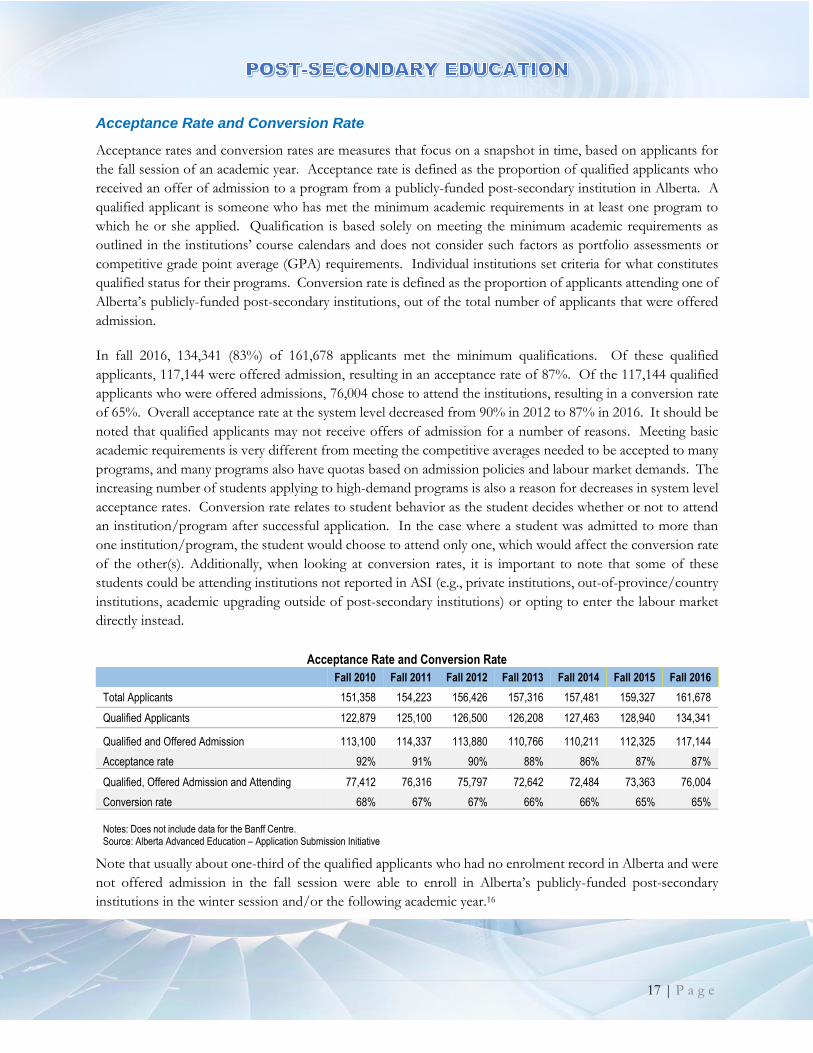
Acceptance Rate and Conversion Rate
Acceptance rates and conversion rates are measures that focus on a snapshot in time, based on applicants for
the fall session of an academic year. Acceptance rate is defined as the proportion of qualified applicants who
received an offer of admission to a program from a publicly-funded post-secondary institution in Alberta. A
qualified applicant is someone who has met the minimum academic requirements in at least one program to
which he or she applied. Qualification is based solely on meeting the minimum academic requirements as
outlined in the institutions’ course calendars and does not consider such factors as portfolio assessments or
competitive grade point average (GPA) requirements. Individual institutions set criteria for what constitutes
qualified status for their programs. Conversion rate is defined as the proportion of applicants attending one of
Alberta’s publicly-funded post-secondary institutions, out of the total number of applicants that were offered
admission.
In fall 2016, 134,341 (83%) of 161,678 applicants met the minimum qualifications. Of these qualified
applicants, 117,144 were offered admission, resulting in an acceptance rate of 87%. Of the 117,144 qualified
applicants who were offered admissions, 76,004 chose to attend the institutions, resulting in a conversion rate
of 65%. Overall acceptance rate at the system level decreased from 90% in 2012 to 87% in 2016. It should be
noted that qualified applicants may not receive offers of admission for a number of reasons. Meeting basic
academic requirements is very different from meeting the competitive averages needed to be accepted to many
programs, and many programs also have quotas based on admission policies and labour market demands. The
increasing number of students applying to high-demand programs is also a reason for decreases in system level
acceptance rates. Conversion rate relates to student behavior as the student decides whether or not to attend
an institution/program after successful application. In the case where a student was admitted to more than
one institution/program, the student would choose to attend only one, which would affect the conversion rate
of the other(s). Additionally, when looking at conversion rates, it is important to note that some of these
students could be attending institutions not reported in ASI (e.g., private institutions, out-of-province/country
institutions, academic upgrading outside of post-secondary institutions) or opting to enter the labour market
directly instead.
Acceptance Rate and Conversion Rate
Fall 2010 Fall 2011 Fall 2012 Fall 2013 Fall 2014 Fall 2015 Fall 2016
Total Applicants 151,358 154,223 156,426 157,316 157,481 159,327 161,678
Qualified Applicants 122,879 125,100 126,500 126,208 127,463 128,940 134,341
Qualified and Offered Admission 113,100 114,337 113,880 110,766 110,211 112,325 117,144
Acceptance rate 92% 91% 90% 88% 86% 87% 87%
Qualified, Offered Admission and Attending 77,412 76,316 75,797 72,642 72,484 73,363 76,004
Conversion rate 68% 67% 67% 66% 66% 65% 65%
Notes: Does not include data for the Banff Centre. Source: Alberta Advanced Education – Application Submission Initiative
Note that usually about one-third of the qualified applicants who had no enrolment record in Alberta and were
not offered admission in the fall session were able to enroll in Alberta’s publicly-funded post-secondary
institutions in the winter session and/or the following academic year.16
18 | P a g e
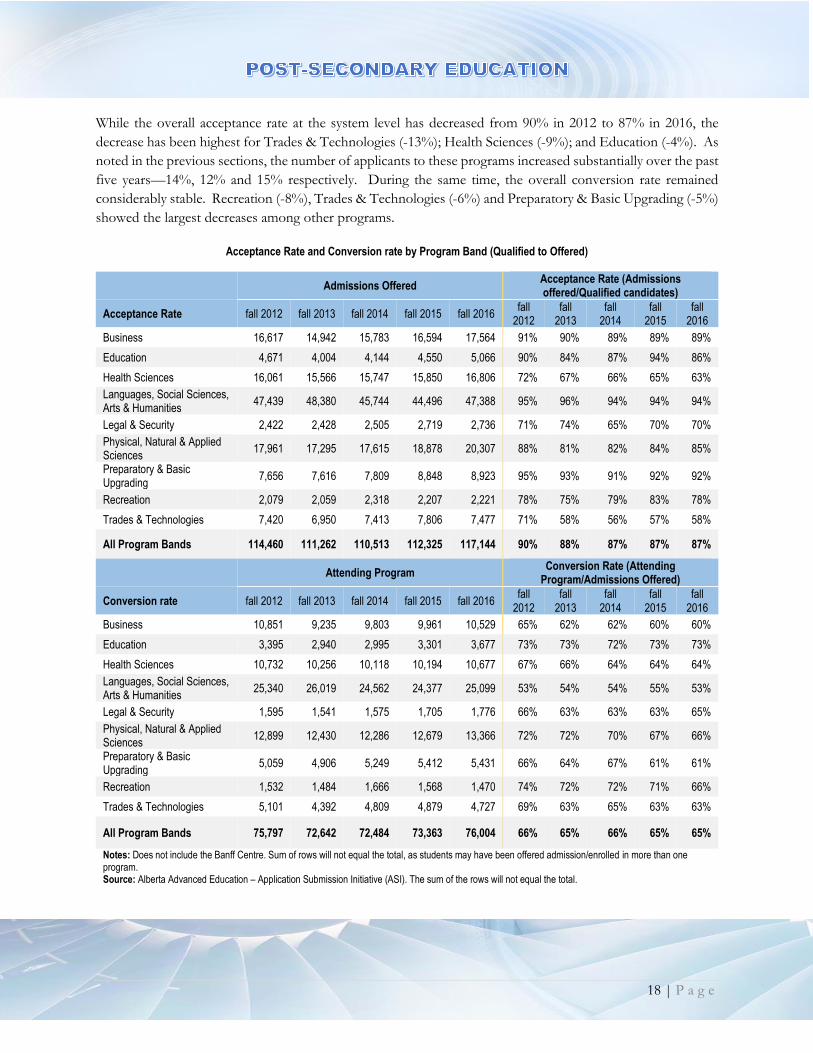
While the overall acceptance rate at the system level has decreased from 90% in 2012 to 87% in 2016, the
decrease has been highest for Trades & Technologies (-13%); Health Sciences (-9%); and Education (-4%). As
noted in the previous sections, the number of applicants to these programs increased substantially over the past
five years—14%, 12% and 15% respectively. During the same time, the overall conversion rate remained
considerably stable. Recreation (-8%), Trades & Technologies (-6%) and Preparatory & Basic Upgrading (-5%)
showed the largest decreases among other programs.
Acceptance Rate and Conversion rate by Program Band (Qualified to Offered)
Admissions Offered Acceptance Rate (Admissions offered/Qualified candidates)
Acceptance Rate fall 2012 fall 2013 fall 2014 fall 2015 fall 2016 fall
2012 fall
2013 fall
2014 fall
2015 fall
2016
Business 16,617 14,942 15,783 16,594 17,564 91% 90% 89% 89% 89%
Education 4,671 4,004 4,144 4,550 5,066 90% 84% 87% 94% 86%
Health Sciences 16,061 15,566 15,747 15,850 16,806 72% 67% 66% 65% 63%
Languages, Social Sciences, Arts & Humanities
47,439 48,380 45,744 44,496 47,388 95% 96% 94% 94% 94%
Legal & Security 2,422 2,428 2,505 2,719 2,736 71% 74% 65% 70% 70%
Physical, Natural & Applied Sciences
17,961 17,295 17,615 18,878 20,307 88% 81% 82% 84% 85%
Preparatory & Basic Upgrading
7,656 7,616 7,809 8,848 8,923 95% 93% 91% 92% 92%
Recreation 2,079 2,059 2,318 2,207 2,221 78% 75% 79% 83% 78%
Trades & Technologies 7,420 6,950 7,413 7,806 7,477 71% 58% 56% 57% 58%
All Program Bands 114,460 111,262 110,513 112,325 117,144 90% 88% 87% 87% 87%
Attending Program Conversion Rate (Attending
Program/Admissions Offered)
Conversion rate fall 2012 fall 2013 fall 2014 fall 2015 fall 2016 fall
2012 fall
2013 fall
2014 fall
2015 fall
2016
Business 10,851 9,235 9,803 9,961 10,529 65% 62% 62% 60% 60%
Education 3,395 2,940 2,995 3,301 3,677 73% 73% 72% 73% 73%
Health Sciences 10,732 10,256 10,118 10,194 10,677 67% 66% 64% 64% 64%
Languages, Social Sciences, Arts & Humanities
25,340 26,019 24,562 24,377 25,099 53% 54% 54% 55% 53%
Legal & Security 1,595 1,541 1,575 1,705 1,776 66% 63% 63% 63% 65%
Physical, Natural & Applied Sciences
12,899 12,430 12,286 12,679 13,366 72% 72% 70% 67% 66%
Preparatory & Basic Upgrading
5,059 4,906 5,249 5,412 5,431 66% 64% 67% 61% 61%
Recreation 1,532 1,484 1,666 1,568 1,470 74% 72% 72% 71% 66%
Trades & Technologies 5,101 4,392 4,809 4,879 4,727 69% 63% 65% 63% 63%
All Program Bands 75,797 72,642 72,484 73,363 76,004 66% 65% 66% 65% 65%
Notes: Does not include the Banff Centre. Sum of rows will not equal the total, as students may have been offered admission/enrolled in more than one program. Source: Alberta Advanced Education – Application Submission Initiative (ASI). The sum of the rows will not equal the total.
19 | P a g e
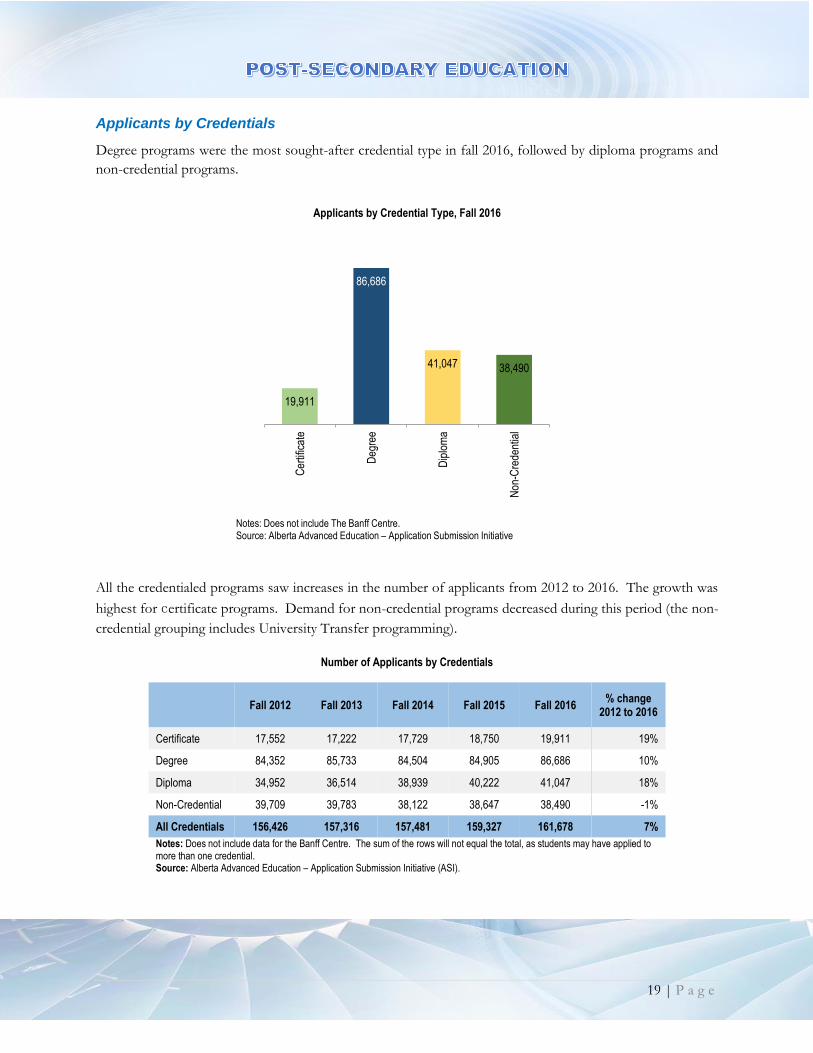
Applicants by Credentials
Degree programs were the most sought-after credential type in fall 2016, followed by diploma programs and
non-credential programs.
All the credentialed programs saw increases in the number of applicants from 2012 to 2016. The growth was
highest for certificate programs. Demand for non-credential programs decreased during this period (the non-
credential grouping includes University Transfer programming).
Number of Applicants by Credentials
Fall 2012 Fall 2013 Fall 2014 Fall 2015 Fall 2016 % change
2012 to 2016
Certificate 17,552 17,222 17,729 18,750 19,911 19%
Degree 84,352 85,733 84,504 84,905 86,686 10%
Diploma 34,952 36,514 38,939 40,222 41,047 18%
Non-Credential 39,709 39,783 38,122 38,647 38,490 -1%
All Credentials 156,426 157,316 157,481 159,327 161,678 7%
Notes: Does not include data for the Banff Centre. The sum of the rows will not equal the total, as students may have applied to more than one credential. Source: Alberta Advanced Education – Application Submission Initiative (ASI).
19,911
86,686
41,047 38,490
Cer
tific
ate
Deg
ree
Dip
lom
a
Non
-Cre
dent
ial
Applicants by Credential Type, Fall 2016
Notes: Does not include The Banff Centre.Source: Alberta Advanced Education – Application Submission Initiative
20 | P a g e
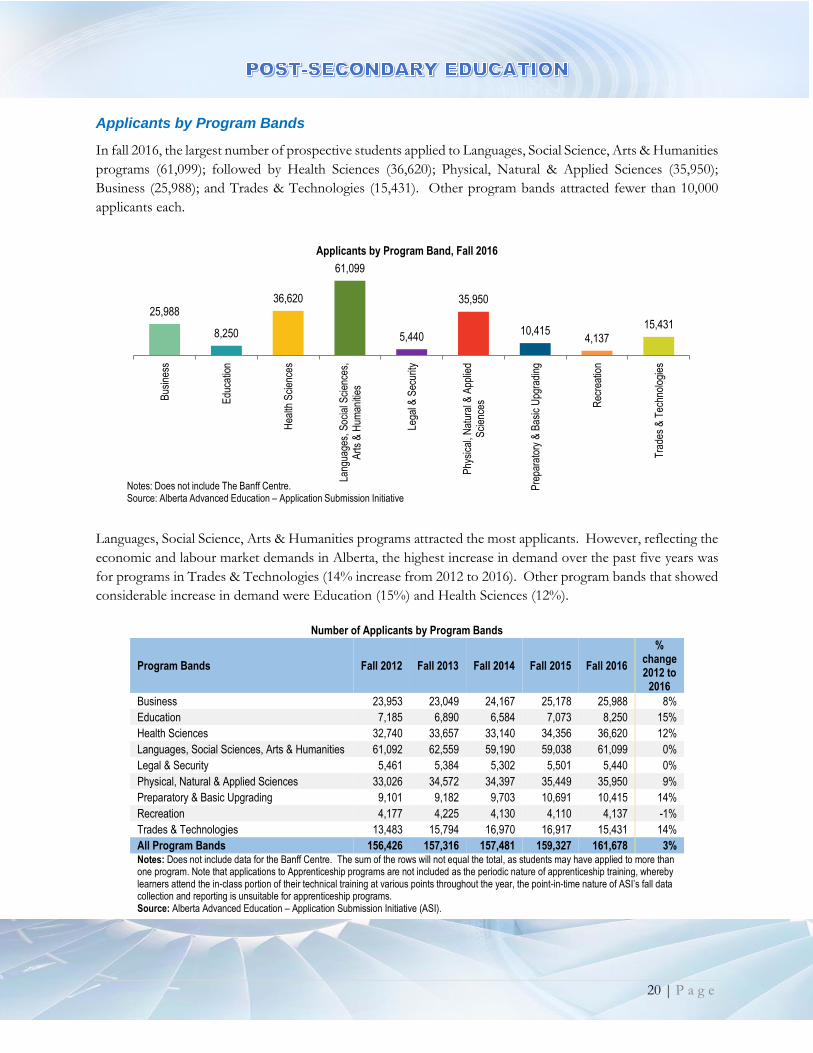
Applicants by Program Bands
In fall 2016, the largest number of prospective students applied to Languages, Social Science, Arts & Humanities
programs (61,099); followed by Health Sciences (36,620); Physical, Natural & Applied Sciences (35,950);
Business (25,988); and Trades & Technologies (15,431). Other program bands attracted fewer than 10,000
applicants each.
Languages, Social Science, Arts & Humanities programs attracted the most applicants. However, reflecting the
economic and labour market demands in Alberta, the highest increase in demand over the past five years was
for programs in Trades & Technologies (14% increase from 2012 to 2016). Other program bands that showed
considerable increase in demand were Education (15%) and Health Sciences (12%).
Number of Applicants by Program Bands
Program Bands Fall 2012 Fall 2013 Fall 2014 Fall 2015 Fall 2016
% change 2012 to
2016
Business 23,953 23,049 24,167 25,178 25,988 8%
Education 7,185 6,890 6,584 7,073 8,250 15%
Health Sciences 32,740 33,657 33,140 34,356 36,620 12%
Languages, Social Sciences, Arts & Humanities 61,092 62,559 59,190 59,038 61,099 0%
Legal & Security 5,461 5,384 5,302 5,501 5,440 0%
Physical, Natural & Applied Sciences 33,026 34,572 34,397 35,449 35,950 9%
Preparatory & Basic Upgrading 9,101 9,182 9,703 10,691 10,415 14%
Recreation 4,177 4,225 4,130 4,110 4,137 -1%
Trades & Technologies 13,483 15,794 16,970 16,917 15,431 14%
All Program Bands 156,426 157,316 157,481 159,327 161,678 3% Notes: Does not include data for the Banff Centre. The sum of the rows will not equal the total, as students may have applied to more than one program. Note that applications to Apprenticeship programs are not included as the periodic nature of apprenticeship training, whereby learners attend the in-class portion of their technical training at various points throughout the year, the point-in-time nature of ASI’s fall data collection and reporting is unsuitable for apprenticeship programs. Source: Alberta Advanced Education – Application Submission Initiative (ASI).
25,988
8,250
36,620
61,099
5,440
35,950
10,4154,137
15,431
Bus
ines
s
Edu
catio
n
Hea
lth S
cien
ces
Lang
uage
s, S
ocia
l Sci
ence
s,A
rts
& H
uman
ities
Lega
l & S
ecur
ity
Phy
sica
l, N
atur
al &
App
lied
Sci
ence
s
Pre
para
tory
& B
asic
Upg
radi
ng
Rec
reat
ion
Tra
des
& T
echn
olog
ies
Applicants by Program Band, Fall 2016
Notes: Does not include The Banff Centre.Source: Alberta Advanced Education – Application Submission Initiative
21 | P a g e
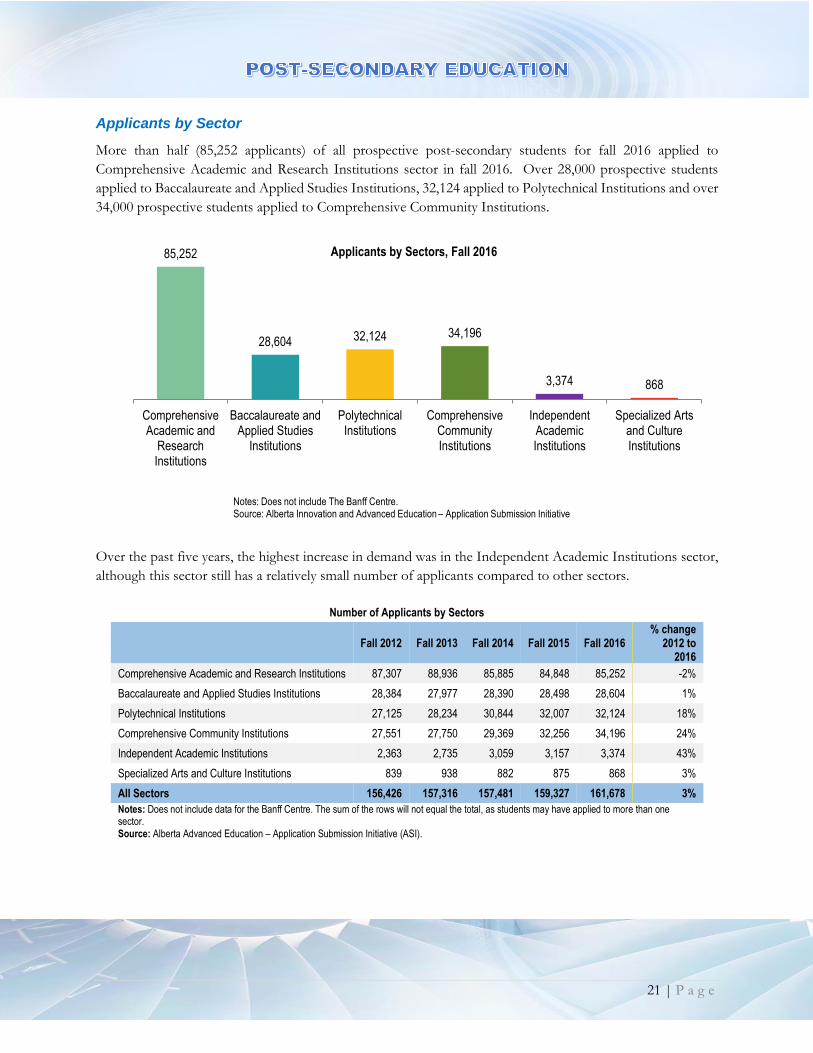
Applicants by Sector
More than half (85,252 applicants) of all prospective post-secondary students for fall 2016 applied to
Comprehensive Academic and Research Institutions sector in fall 2016. Over 28,000 prospective students
applied to Baccalaureate and Applied Studies Institutions, 32,124 applied to Polytechnical Institutions and over
34,000 prospective students applied to Comprehensive Community Institutions.
Over the past five years, the highest increase in demand was in the Independent Academic Institutions sector,
although this sector still has a relatively small number of applicants compared to other sectors.
Number of Applicants by Sectors
Fall 2012 Fall 2013 Fall 2014 Fall 2015 Fall 2016 % change
2012 to 2016
Comprehensive Academic and Research Institutions 87,307 88,936 85,885 84,848 85,252 -2%
Baccalaureate and Applied Studies Institutions 28,384 27,977 28,390 28,498 28,604 1%
Polytechnical Institutions 27,125 28,234 30,844 32,007 32,124 18%
Comprehensive Community Institutions 27,551 27,750 29,369 32,256 34,196 24%
Independent Academic Institutions 2,363 2,735 3,059 3,157 3,374 43%
Specialized Arts and Culture Institutions 839 938 882 875 868 3%
All Sectors 156,426 157,316 157,481 159,327 161,678 3%
Notes: Does not include data for the Banff Centre. The sum of the rows will not equal the total, as students may have applied to more than one sector. Source: Alberta Advanced Education – Application Submission Initiative (ASI).
85,252
28,604 32,124 34,196
3,374 868
ComprehensiveAcademic and
ResearchInstitutions
Baccalaureate andApplied Studies
Institutions
PolytechnicalInstitutions
ComprehensiveCommunityInstitutions
IndependentAcademicInstitutions
Specialized Artsand CultureInstitutions
Applicants by Sectors, Fall 2016
Notes: Does not include The Banff Centre.Source: Alberta Innovation and Advanced Education – Application Submission Initiative
22 | P a g e
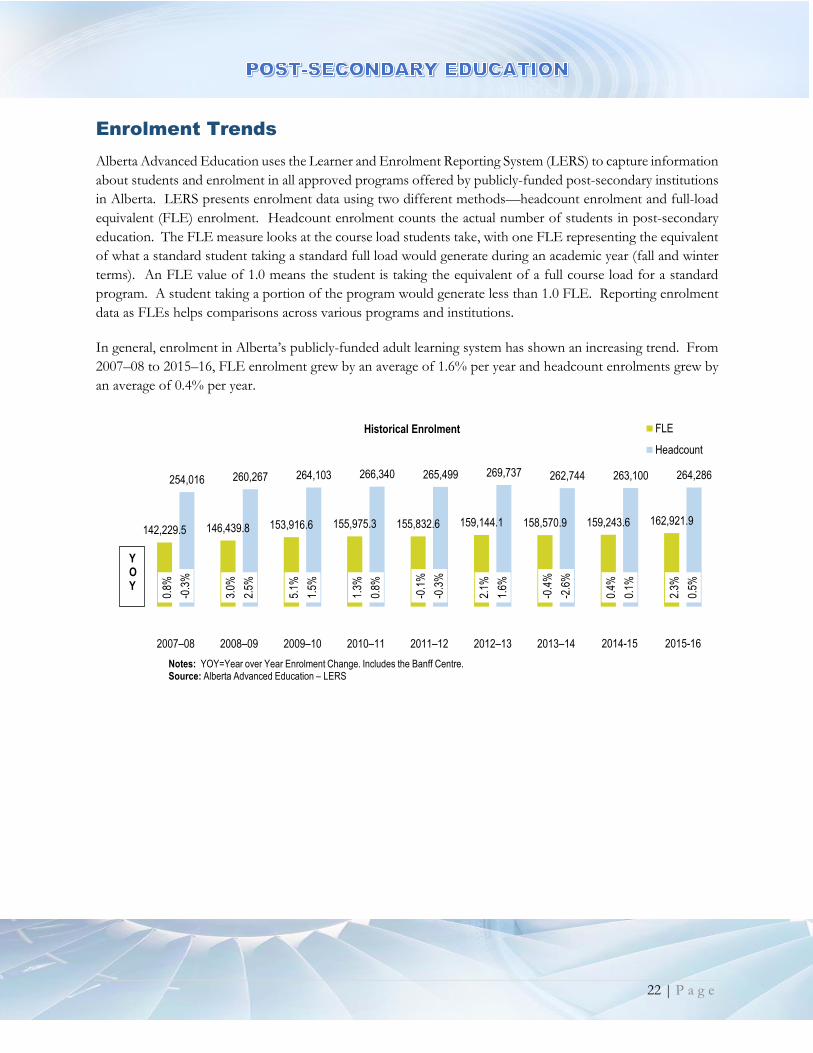
Enrolment Trends
Alberta Advanced Education uses the Learner and Enrolment Reporting System (LERS) to capture information
about students and enrolment in all approved programs offered by publicly-funded post-secondary institutions
in Alberta. LERS presents enrolment data using two different methods—headcount enrolment and full-load
equivalent (FLE) enrolment. Headcount enrolment counts the actual number of students in post-secondary
education. The FLE measure looks at the course load students take, with one FLE representing the equivalent
of what a standard student taking a standard full load would generate during an academic year (fall and winter
terms). An FLE value of 1.0 means the student is taking the equivalent of a full course load for a standard
program. A student taking a portion of the program would generate less than 1.0 FLE. Reporting enrolment
data as FLEs helps comparisons across various programs and institutions.
In general, enrolment in Alberta’s publicly-funded adult learning system has shown an increasing trend. From
2007–08 to 2015–16, FLE enrolment grew by an average of 1.6% per year and headcount enrolments grew by
an average of 0.4% per year.
142,229.5 146,439.8 153,916.6 155,975.3 155,832.6 159,144.1 158,570.9 159,243.6 162,921.9
254,016 260,267 264,103 266,340 265,499 269,737 262,744 263,100 264,286
0.8%
3.0%
5.1%
1.3%
-0.1
%
2.1%
-0.4
%
0.4%
2.3%
-0.3
%
2.5%
1.5%
0.8%
-0.3
%
1.6%
-2.6
%
0.1%
0.5%
2007–08 2008–09 2009–10 2010–11 2011–12 2012–13 2013–14 2014-15 2015-16
Historical Enrolment FLE
Headcount
YOY
Notes: YOY=Year over Year Enrolment Change. Includes the Banff Centre.Source: Alberta Advanced Education – LERS
23 | P a g e
Enrolment by Credentials
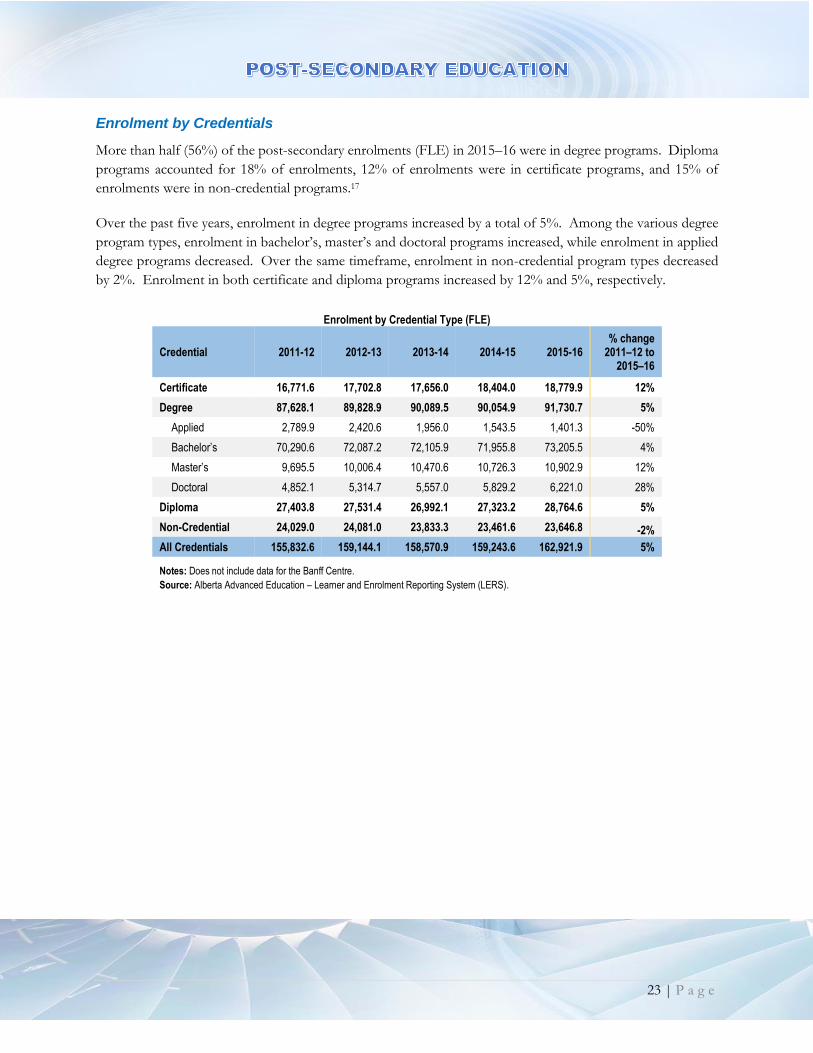
More than half (56%) of the post-secondary enrolments (FLE) in 2015–16 were in degree programs. Diploma
programs accounted for 18% of enrolments, 12% of enrolments were in certificate programs, and 15% of
enrolments were in non-credential programs.17
Over the past five years, enrolment in degree programs increased by a total of 5%. Among the various degree
program types, enrolment in bachelor’s, master’s and doctoral programs increased, while enrolment in applied
degree programs decreased. Over the same timeframe, enrolment in non-credential program types decreased
by 2%. Enrolment in both certificate and diploma programs increased by 12% and 5%, respectively.
Enrolment by Credential Type (FLE)
Credential 2011-12 2012-13 2013-14 2014-15 2015-16 % change
2011–12 to 2015–16
Certificate 16,771.6 17,702.8 17,656.0 18,404.0 18,779.9 12%
Degree 87,628.1 89,828.9 90,089.5 90,054.9 91,730.7 5%
Applied 2,789.9 2,420.6 1,956.0 1,543.5 1,401.3 -50%
Bachelor’s 70,290.6 72,087.2 72,105.9 71,955.8 73,205.5 4%
Master’s 9,695.5 10,006.4 10,470.6 10,726.3 10,902.9 12%
Doctoral 4,852.1 5,314.7 5,557.0 5,829.2 6,221.0 28%
Diploma 27,403.8 27,531.4 26,992.1 27,323.2 28,764.6 5%
Non-Credential 24,029.0 24,081.0 23,833.3 23,461.6 23,646.8 -2%
All Credentials 155,832.6 159,144.1 158,570.9 159,243.6 162,921.9 5%
Notes: Does not include data for the Banff Centre.
Source: Alberta Advanced Education – Learner and Enrolment Reporting System (LERS).
24 | P a g e
Enrolment by Program Bands
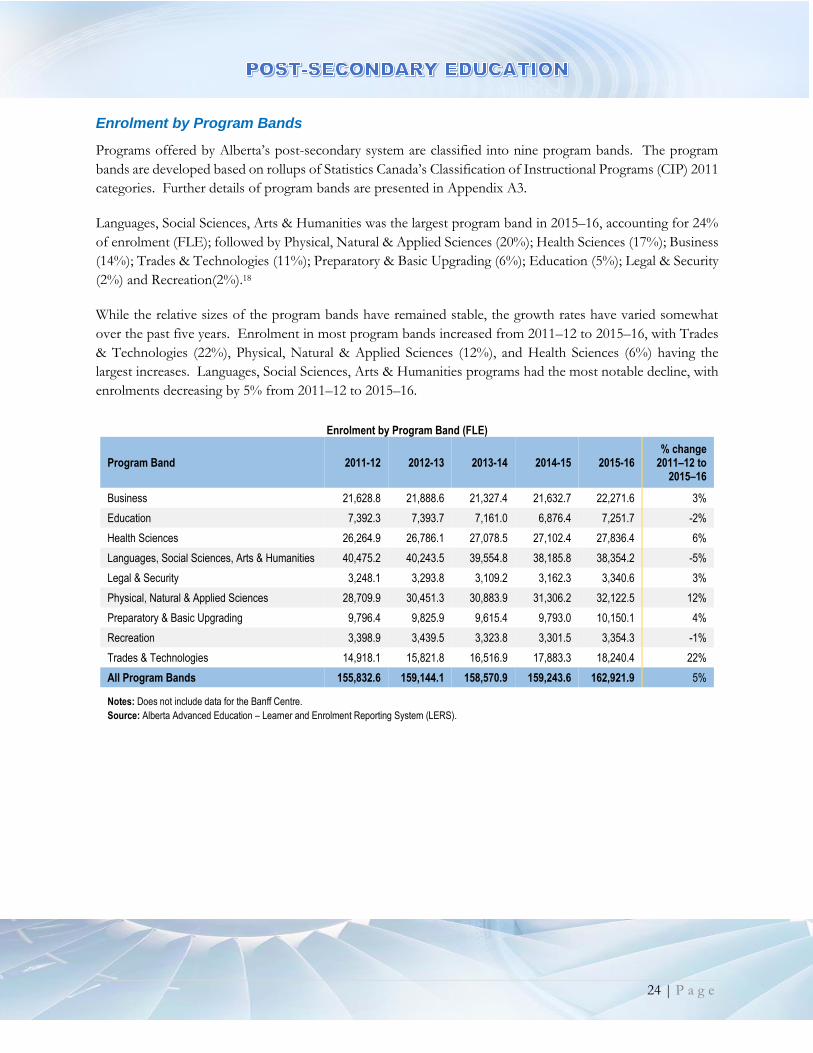
Programs offered by Alberta’s post-secondary system are classified into nine program bands. The program
bands are developed based on rollups of Statistics Canada’s Classification of Instructional Programs (CIP) 2011
categories. Further details of program bands are presented in Appendix A3.
Languages, Social Sciences, Arts & Humanities was the largest program band in 2015–16, accounting for 24%
of enrolment (FLE); followed by Physical, Natural & Applied Sciences (20%); Health Sciences (17%); Business
(14%); Trades & Technologies (11%); Preparatory & Basic Upgrading (6%); Education (5%); Legal & Security
(2%) and Recreation(2%).18
While the relative sizes of the program bands have remained stable, the growth rates have varied somewhat
over the past five years. Enrolment in most program bands increased from 2011–12 to 2015–16, with Trades
& Technologies (22%), Physical, Natural & Applied Sciences (12%), and Health Sciences (6%) having the
largest increases. Languages, Social Sciences, Arts & Humanities programs had the most notable decline, with
enrolments decreasing by 5% from 2011–12 to 2015–16.
Enrolment by Program Band (FLE)
Program Band 2011-12 2012-13 2013-14 2014-15 2015-16 % change
2011–12 to 2015–16
Business 21,628.8 21,888.6 21,327.4 21,632.7 22,271.6 3%
Education 7,392.3 7,393.7 7,161.0 6,876.4 7,251.7 -2%
Health Sciences 26,264.9 26,786.1 27,078.5 27,102.4 27,836.4 6%
Languages, Social Sciences, Arts & Humanities 40,475.2 40,243.5 39,554.8 38,185.8 38,354.2 -5%
Legal & Security 3,248.1 3,293.8 3,109.2 3,162.3 3,340.6 3%
Physical, Natural & Applied Sciences 28,709.9 30,451.3 30,883.9 31,306.2 32,122.5 12%
Preparatory & Basic Upgrading 9,796.4 9,825.9 9,615.4 9,793.0 10,150.1 4%
Recreation 3,398.9 3,439.5 3,323.8 3,301.5 3,354.3 -1%
Trades & Technologies 14,918.1 15,821.8 16,516.9 17,883.3 18,240.4 22%
All Program Bands 155,832.6 159,144.1 158,570.9 159,243.6 162,921.9 5%
Notes: Does not include data for the Banff Centre.
Source: Alberta Advanced Education – Learner and Enrolment Reporting System (LERS).
25 | P a g e
Enrolment by Age Groups
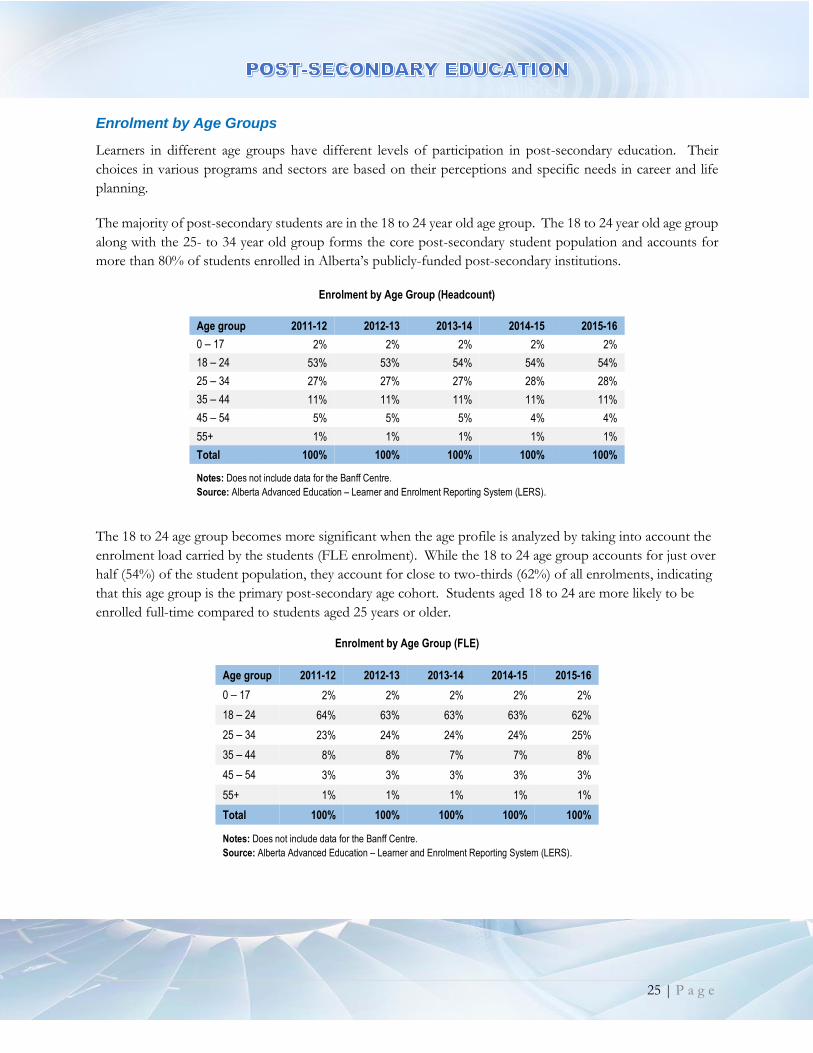
Learners in different age groups have different levels of participation in post-secondary education. Their
choices in various programs and sectors are based on their perceptions and specific needs in career and life
planning.
The majority of post-secondary students are in the 18 to 24 year old age group. The 18 to 24 year old age group
along with the 25- to 34 year old group forms the core post-secondary student population and accounts for
more than 80% of students enrolled in Alberta’s publicly-funded post-secondary institutions.
Enrolment by Age Group (Headcount)
Age group 2011-12 2012-13 2013-14 2014-15 2015-16
0 – 17 2% 2% 2% 2% 2%
18 – 24 53% 53% 54% 54% 54%
25 – 34 27% 27% 27% 28% 28%
35 – 44 11% 11% 11% 11% 11%
45 – 54 5% 5% 5% 4% 4%
55+ 1% 1% 1% 1% 1%
Total 100% 100% 100% 100% 100%
Notes: Does not include data for the Banff Centre.
Source: Alberta Advanced Education – Learner and Enrolment Reporting System (LERS).
The 18 to 24 age group becomes more significant when the age profile is analyzed by taking into account the
enrolment load carried by the students (FLE enrolment). While the 18 to 24 age group accounts for just over
half (54%) of the student population, they account for close to two-thirds (62%) of all enrolments, indicating
that this age group is the primary post-secondary age cohort. Students aged 18 to 24 are more likely to be
enrolled full-time compared to students aged 25 years or older.
Enrolment by Age Group (FLE)
Age group 2011-12 2012-13 2013-14 2014-15 2015-16
0 – 17 2% 2% 2% 2% 2%
18 – 24 64% 63% 63% 63% 62%
25 – 34 23% 24% 24% 24% 25%
35 – 44 8% 8% 7% 7% 8%
45 – 54 3% 3% 3% 3% 3%
55+ 1% 1% 1% 1% 1%
Total 100% 100% 100% 100% 100%
Notes: Does not include data for the Banff Centre.
Source: Alberta Advanced Education – Learner and Enrolment Reporting System (LERS).
26 | P a g e
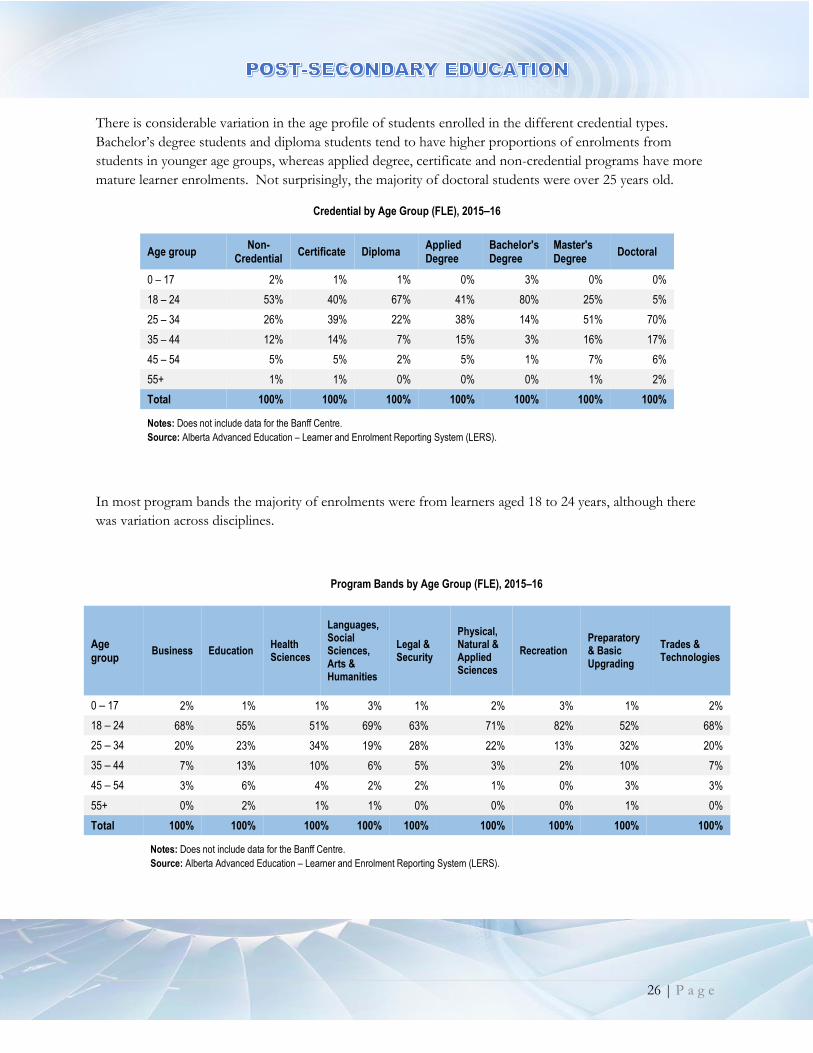
There is considerable variation in the age profile of students enrolled in the different credential types.
Bachelor’s degree students and diploma students tend to have higher proportions of enrolments from
students in younger age groups, whereas applied degree, certificate and non-credential programs have more
mature learner enrolments. Not surprisingly, the majority of doctoral students were over 25 years old.
Credential by Age Group (FLE), 2015–16
Age group Non-
Credential Certificate Diploma
Applied Degree
Bachelor's Degree
Master's Degree
Doctoral
0 – 17 2% 1% 1% 0% 3% 0% 0%
18 – 24 53% 40% 67% 41% 80% 25% 5%
25 – 34 26% 39% 22% 38% 14% 51% 70%
35 – 44 12% 14% 7% 15% 3% 16% 17%
45 – 54 5% 5% 2% 5% 1% 7% 6%
55+ 1% 1% 0% 0% 0% 1% 2%
Total 100% 100% 100% 100% 100% 100% 100%
Notes: Does not include data for the Banff Centre.
Source: Alberta Advanced Education – Learner and Enrolment Reporting System (LERS).
In most program bands the majority of enrolments were from learners aged 18 to 24 years, although there
was variation across disciplines.
Program Bands by Age Group (FLE), 2015–16
Age group
Business Education Health Sciences
Languages, Social Sciences, Arts & Humanities
Legal & Security
Physical, Natural & Applied Sciences
Recreation Preparatory & Basic Upgrading
Trades & Technologies
0 – 17 2% 1% 1% 3% 1% 2% 3% 1% 2%
18 – 24 68% 55% 51% 69% 63% 71% 82% 52% 68%
25 – 34 20% 23% 34% 19% 28% 22% 13% 32% 20%
35 – 44 7% 13% 10% 6% 5% 3% 2% 10% 7%
45 – 54 3% 6% 4% 2% 2% 1% 0% 3% 3%
55+ 0% 2% 1% 1% 0% 0% 0% 1% 0%
Total 100% 100% 100% 100% 100% 100% 100% 100% 100%
Notes: Does not include data for the Banff Centre.
Source: Alberta Advanced Education – Learner and Enrolment Reporting System (LERS).
27 | P a g e
Enrolment by Sectors
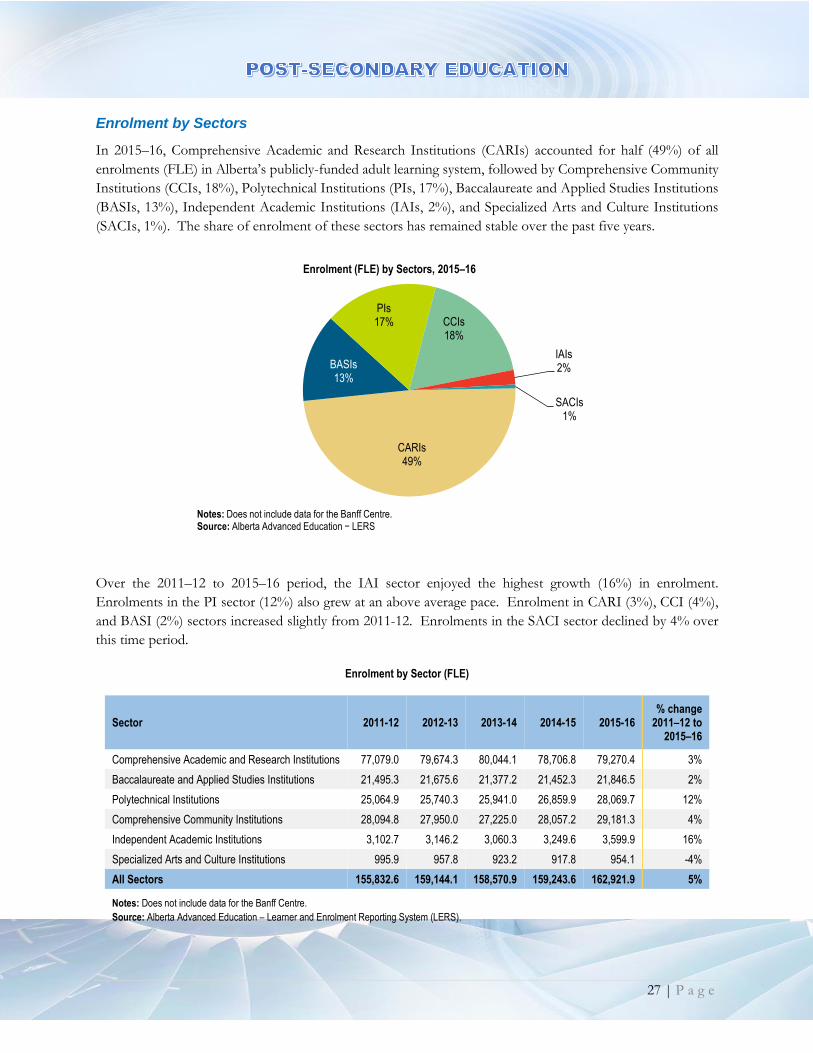
In 2015–16, Comprehensive Academic and Research Institutions (CARIs) accounted for half (49%) of all
enrolments (FLE) in Alberta’s publicly-funded adult learning system, followed by Comprehensive Community
Institutions (CCIs, 18%), Polytechnical Institutions (PIs, 17%), Baccalaureate and Applied Studies Institutions
(BASIs, 13%), Independent Academic Institutions (IAIs, 2%), and Specialized Arts and Culture Institutions
(SACIs, 1%). The share of enrolment of these sectors has remained stable over the past five years.
Over the 2011–12 to 2015–16 period, the IAI sector enjoyed the highest growth (16%) in enrolment.
Enrolments in the PI sector (12%) also grew at an above average pace. Enrolment in CARI (3%), CCI (4%),
and BASI (2%) sectors increased slightly from 2011-12. Enrolments in the SACI sector declined by 4% over
this time period.
Enrolment by Sector (FLE)
Sector 2011-12 2012-13 2013-14 2014-15 2015-16 % change
2011–12 to 2015–16
Comprehensive Academic and Research Institutions 77,079.0 79,674.3 80,044.1 78,706.8 79,270.4 3%
Baccalaureate and Applied Studies Institutions 21,495.3 21,675.6 21,377.2 21,452.3 21,846.5 2%
Polytechnical Institutions 25,064.9 25,740.3 25,941.0 26,859.9 28,069.7 12%
Comprehensive Community Institutions 28,094.8 27,950.0 27,225.0 28,057.2 29,181.3 4%
Independent Academic Institutions 3,102.7 3,146.2 3,060.3 3,249.6 3,599.9 16%
Specialized Arts and Culture Institutions 995.9 957.8 923.2 917.8 954.1 -4%
All Sectors 155,832.6 159,144.1 158,570.9 159,243.6 162,921.9 5%
Notes: Does not include data for the Banff Centre.
Source: Alberta Advanced Education – Learner and Enrolment Reporting System (LERS).
CARIs49%
BASIs13%
PIs17% CCIs
18%
IAIs2%
SACIs1%
Enrolment (FLE) by Sectors, 2015–16
Notes: Does not include data for the Banff Centre.Source: Alberta Advanced Education − LERS
28 | P a g e
Comprehensive Academic and Research Institutions (CARIs)
The CARI sector provides undergraduate and graduate degrees, and undertakes comprehensive research
activity. While instructional excellence remains the core business of the CARIs, research activity is primarily
conducted in this sector.19
In 2015–16, CARIs accounted for half (49%) of all enrolments (FLE) in Alberta’s publicly-funded adult learning
system, and over the 2011–12 to 2015–16 period enrolment growth in CARIs (3%) was similar to the average
growth in Alberta’s post-secondary education system (5%).20
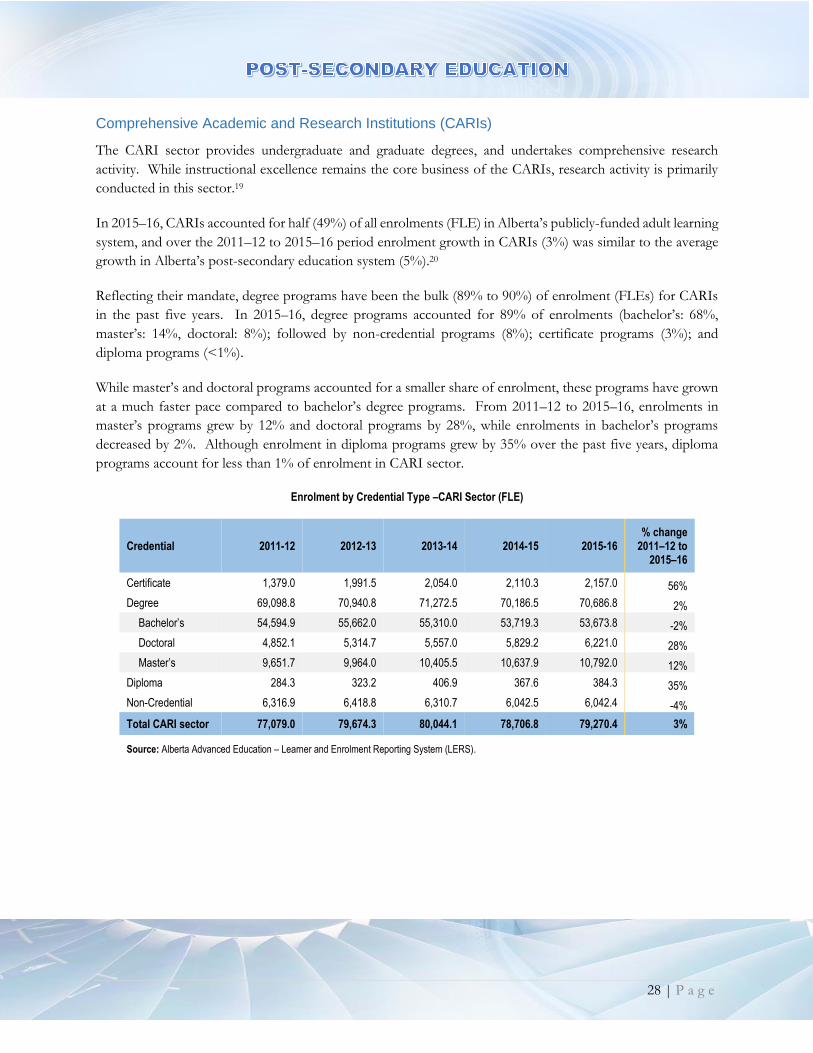
Reflecting their mandate, degree programs have been the bulk (89% to 90%) of enrolment (FLEs) for CARIs
in the past five years. In 2015–16, degree programs accounted for 89% of enrolments (bachelor’s: 68%,
master’s: 14%, doctoral: 8%); followed by non-credential programs (8%); certificate programs (3%); and
diploma programs (<1%).
While master’s and doctoral programs accounted for a smaller share of enrolment, these programs have grown
at a much faster pace compared to bachelor’s degree programs. From 2011–12 to 2015–16, enrolments in
master’s programs grew by 12% and doctoral programs by 28%, while enrolments in bachelor’s programs
decreased by 2%. Although enrolment in diploma programs grew by 35% over the past five years, diploma
programs account for less than 1% of enrolment in CARI sector.
Enrolment by Credential Type –CARI Sector (FLE)
Credential 2011-12 2012-13 2013-14 2014-15 2015-16 % change
2011–12 to 2015–16
Certificate 1,379.0 1,991.5 2,054.0 2,110.3 2,157.0 56%
Degree 69,098.8 70,940.8 71,272.5 70,186.5 70,686.8 2%
Bachelor’s 54,594.9 55,662.0 55,310.0 53,719.3 53,673.8 -2%
Doctoral 4,852.1 5,314.7 5,557.0 5,829.2 6,221.0 28%
Master’s 9,651.7 9,964.0 10,405.5 10,637.9 10,792.0 12%
Diploma 284.3 323.2 406.9 367.6 384.3 35%
Non-Credential 6,316.9 6,418.8 6,310.7 6,042.5 6,042.4 -4%
Total CARI sector 77,079.0 79,674.3 80,044.1 78,706.8 79,270.4 3%
Source: Alberta Advanced Education – Learner and Enrolment Reporting System (LERS).

29 | P a g e
In 2015–16, Physical, Natural & Applied Sciences (33% of FLE enrolments) and Languages, Social Sciences,
Arts & Humanities (26%) were the largest program bands in the CARI sector; followed by Health Sciences
(19%); Business (11%); Education (7%); Recreation (3%); and Legal & Security (2%).
Enrolment in all program bands in the CARI sector grew in the 2011–12 to 2015–16 period, with the exception
of Languages, Social Sciences, Arts & Humanities, Education and Recreation. Enrolment growth was highest
in Health Sciences (15%), Physical, Natural & Applied Sciences (12%), and Legal & Security (8%). Enrolment
in both Languages, Social Sciences, Arts & Humanities and Education decreased by 11% and 8% respectively
during this period.
Enrolment by Program Bands – CARI Sector (FLE)
Program Bands 2011-12 2012-13 2013-14 2014-15 2015-16 % change
2011–12 to 2015–16
Business 7,814.9 8,097.7 8,263.8 8,258.6 8,339.7 7%
Education 5,984.0 6,054.6 5,755.3 5,241.4 5,486.4 -8%
Health Sciences 12,805.9 13,707.3 14,353.5 14,650.0 14,770.6 15%
Languages, Social Sciences, Arts & Humanities 23,605.3 23,428.8 22,695.0 21,401.1 20,949.9 -11%
Legal & Security 1,206.7 1,255.9 1,262.6 1,247.4 1,301.6 8%
Physical, Natural & Applied Sciences 23,393.4 24,832.1 25,455.0 25,694.9 26,196.1 12%
Recreation 2,268.8 2,297.9 2,259.1 2,213.5 2,226.2 -2%
Total CARI sector 77,079.0 79,674.3 80,044.1 78,706.8 79,270.4 3%
Source: Alberta Advanced Education – Learner and Enrolment Reporting System (LERS).
30 | P a g e
Baccalaureate and Applied Studies Institutions (BASIs)
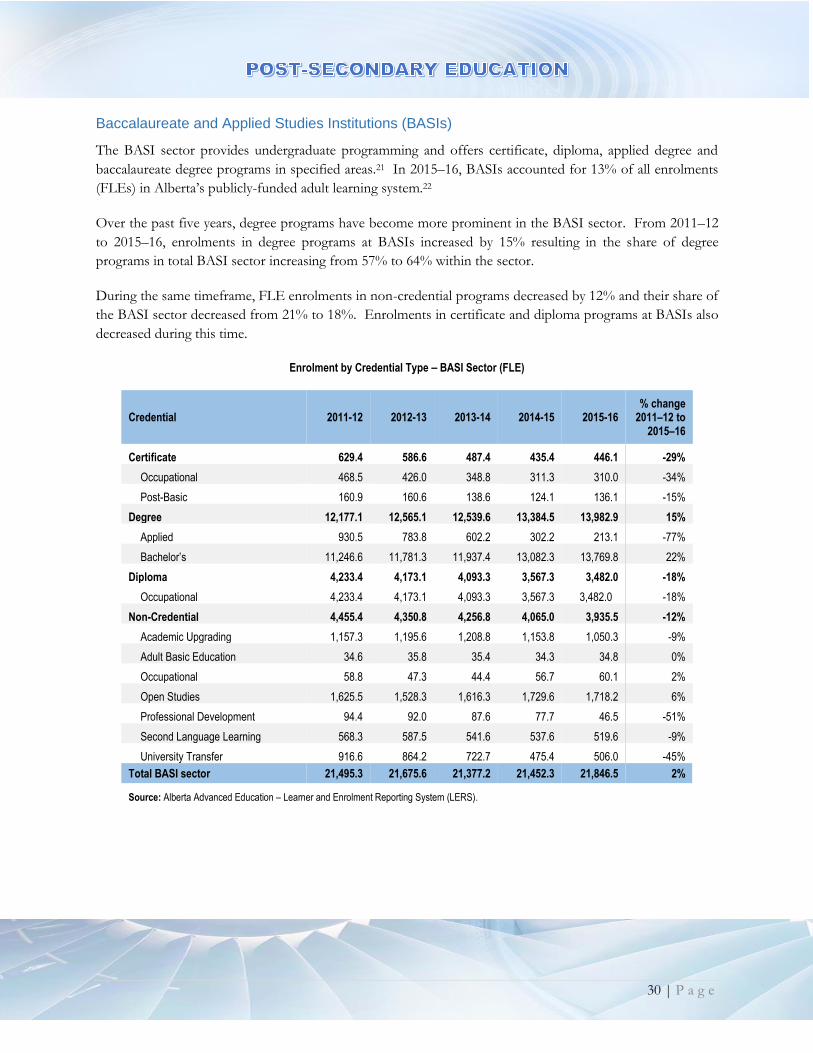
The BASI sector provides undergraduate programming and offers certificate, diploma, applied degree and
baccalaureate degree programs in specified areas.21 In 2015–16, BASIs accounted for 13% of all enrolments
(FLEs) in Alberta’s publicly-funded adult learning system.22
Over the past five years, degree programs have become more prominent in the BASI sector. From 2011–12
to 2015–16, enrolments in degree programs at BASIs increased by 15% resulting in the share of degree
programs in total BASI sector increasing from 57% to 64% within the sector.
During the same timeframe, FLE enrolments in non-credential programs decreased by 12% and their share of
the BASI sector decreased from 21% to 18%. Enrolments in certificate and diploma programs at BASIs also
decreased during this time.
Enrolment by Credential Type – BASI Sector (FLE)
Credential 2011-12 2012-13 2013-14 2014-15 2015-16 % change
2011–12 to 2015–16
Certificate 629.4 586.6 487.4 435.4 446.1 -29%
Occupational 468.5 426.0 348.8 311.3 310.0 -34%
Post-Basic 160.9 160.6 138.6 124.1 136.1 -15%
Degree 12,177.1 12,565.1 12,539.6 13,384.5 13,982.9 15%
Applied 930.5 783.8 602.2 302.2 213.1 -77%
Bachelor’s 11,246.6 11,781.3 11,937.4 13,082.3 13,769.8 22%
Diploma 4,233.4 4,173.1 4,093.3 3,567.3 3,482.0 -18%
Occupational 4,233.4 4,173.1 4,093.3 3,567.3 3,482.0 -18%
Non-Credential 4,455.4 4,350.8 4,256.8 4,065.0 3,935.5 -12%
Academic Upgrading 1,157.3 1,195.6 1,208.8 1,153.8 1,050.3 -9%
Adult Basic Education 34.6 35.8 35.4 34.3 34.8 0%
Occupational 58.8 47.3 44.4 56.7 60.1 2%
Open Studies 1,625.5 1,528.3 1,616.3 1,729.6 1,718.2 6%
Professional Development 94.4 92.0 87.6 77.7 46.5 -51%
Second Language Learning 568.3 587.5 541.6 537.6 519.6 -9%
University Transfer 916.6 864.2 722.7 475.4 506.0 -45%
Total BASI sector 21,495.3 21,675.6 21,377.2 21,452.3 21,846.5 2%
Source: Alberta Advanced Education – Learner and Enrolment Reporting System (LERS).
31 | P a g e
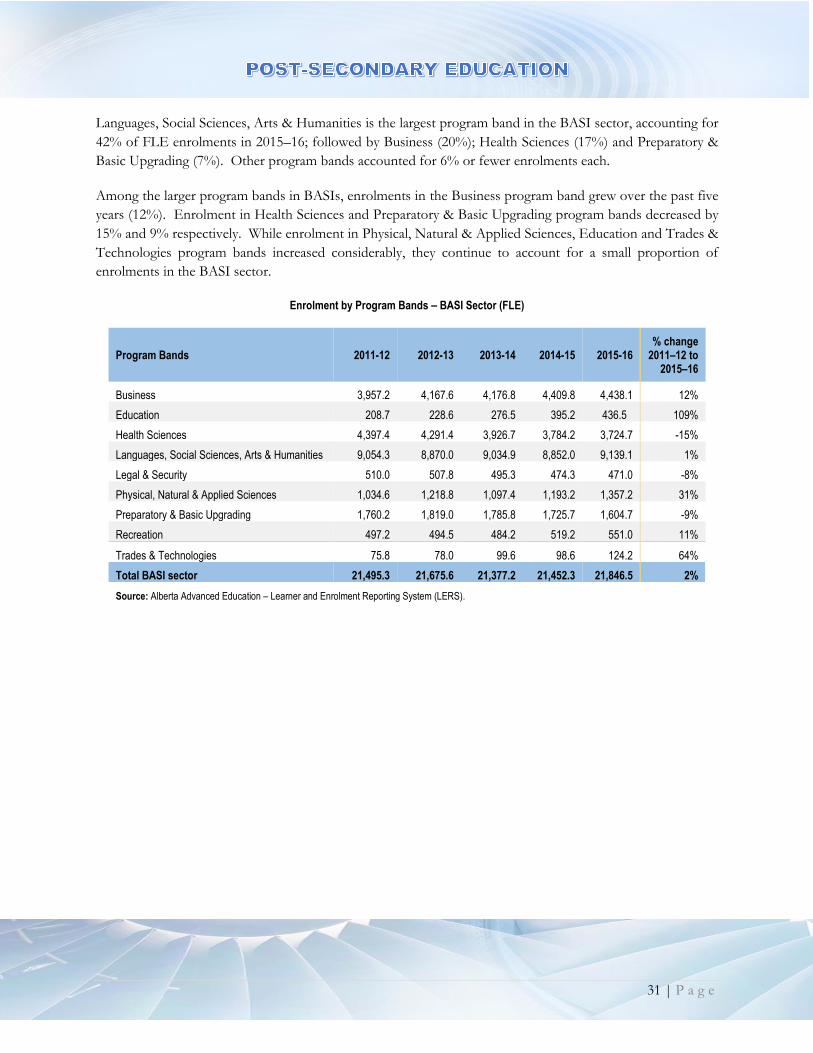
Languages, Social Sciences, Arts & Humanities is the largest program band in the BASI sector, accounting for
42% of FLE enrolments in 2015–16; followed by Business (20%); Health Sciences (17%) and Preparatory &
Basic Upgrading (7%). Other program bands accounted for 6% or fewer enrolments each.
Among the larger program bands in BASIs, enrolments in the Business program band grew over the past five
years (12%). Enrolment in Health Sciences and Preparatory & Basic Upgrading program bands decreased by
15% and 9% respectively. While enrolment in Physical, Natural & Applied Sciences, Education and Trades &
Technologies program bands increased considerably, they continue to account for a small proportion of
enrolments in the BASI sector.
Enrolment by Program Bands – BASI Sector (FLE)
Program Bands 2011-12 2012-13 2013-14 2014-15 2015-16 % change
2011–12 to 2015–16
Business 3,957.2 4,167.6 4,176.8 4,409.8 4,438.1 12%
Education 208.7 228.6 276.5 395.2 436.5 109%
Health Sciences 4,397.4 4,291.4 3,926.7 3,784.2 3,724.7 -15%
Languages, Social Sciences, Arts & Humanities 9,054.3 8,870.0 9,034.9 8,852.0 9,139.1 1%
Legal & Security 510.0 507.8 495.3 474.3 471.0 -8%
Physical, Natural & Applied Sciences 1,034.6 1,218.8 1,097.4 1,193.2 1,357.2 31%
Preparatory & Basic Upgrading 1,760.2 1,819.0 1,785.8 1,725.7 1,604.7 -9%
Recreation 497.2 494.5 484.2 519.2 551.0 11%
Trades & Technologies 75.8 78.0 99.6 98.6 124.2 64%
Total BASI sector 21,495.3 21,675.6 21,377.2 21,452.3 21,846.5 2%
Source: Alberta Advanced Education – Learner and Enrolment Reporting System (LERS).
32 | P a g e
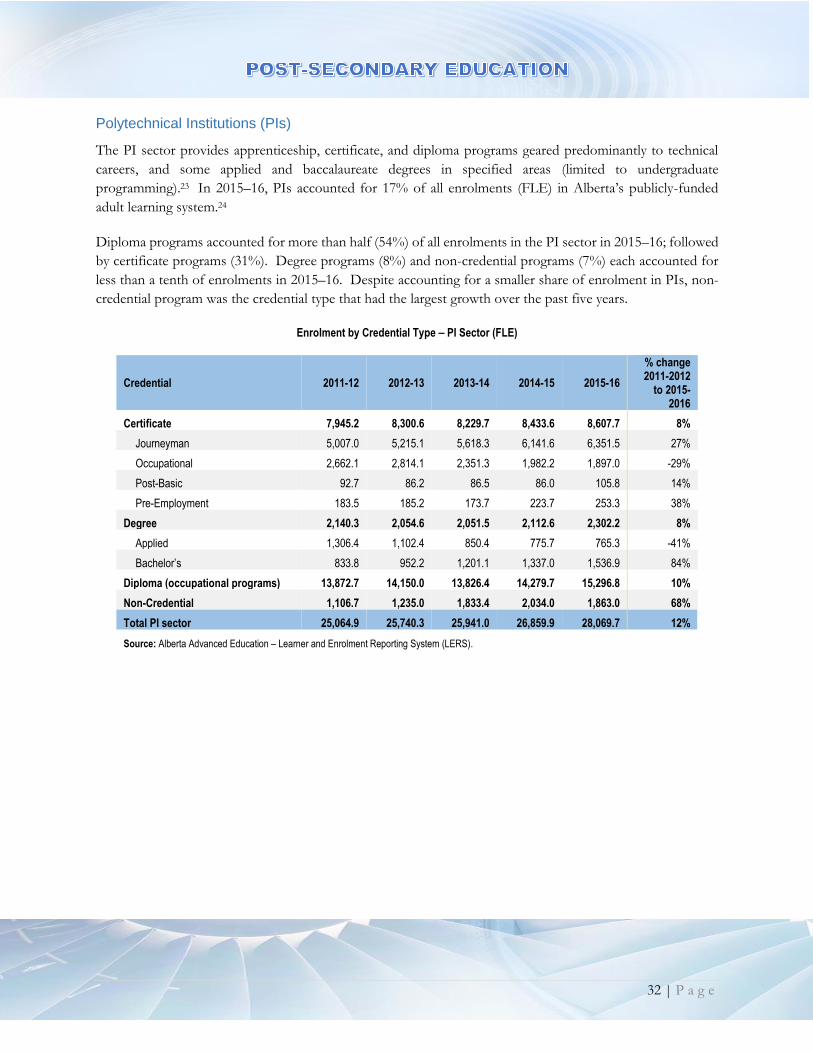
Polytechnical Institutions (PIs)
The PI sector provides apprenticeship, certificate, and diploma programs geared predominantly to technical
careers, and some applied and baccalaureate degrees in specified areas (limited to undergraduate
programming).23 In 2015–16, PIs accounted for 17% of all enrolments (FLE) in Alberta’s publicly-funded
adult learning system.24
Diploma programs accounted for more than half (54%) of all enrolments in the PI sector in 2015–16; followed
by certificate programs (31%). Degree programs (8%) and non-credential programs (7%) each accounted for
less than a tenth of enrolments in 2015–16. Despite accounting for a smaller share of enrolment in PIs, non-
credential program was the credential type that had the largest growth over the past five years.
Enrolment by Credential Type – PI Sector (FLE)
Credential 2011-12 2012-13 2013-14 2014-15 2015-16
% change 2011-2012
to 2015-2016
Certificate 7,945.2 8,300.6 8,229.7 8,433.6 8,607.7 8%
Journeyman 5,007.0 5,215.1 5,618.3 6,141.6 6,351.5 27%
Occupational 2,662.1 2,814.1 2,351.3 1,982.2 1,897.0 -29%
Post-Basic 92.7 86.2 86.5 86.0 105.8 14%
Pre-Employment 183.5 185.2 173.7 223.7 253.3 38%
Degree 2,140.3 2,054.6 2,051.5 2,112.6 2,302.2 8%
Applied 1,306.4 1,102.4 850.4 775.7 765.3 -41%
Bachelor’s 833.8 952.2 1,201.1 1,337.0 1,536.9 84%
Diploma (occupational programs) 13,872.7 14,150.0 13,826.4 14,279.7 15,296.8 10%
Non-Credential 1,106.7 1,235.0 1,833.4 2,034.0 1,863.0 68%
Total PI sector 25,064.9 25,740.3 25,941.0 26,859.9 28,069.7 12%
Source: Alberta Advanced Education – Learner and Enrolment Reporting System (LERS).

33 | P a g e
Trades & Technologies (50%), Business (22%) and Health Sciences (9%) program bands accounted for the
bulk of the enrolments in PIs.
Among the larger program bands in PIs, enrolments in the Trades & Technologies (20%) program band grew
over the past five years, while enrolment in the Business program band decreased by 2%. While enrolments in
Languages, Social Sciences, Arts & Humanities programs constitutes only 7% of total enrolments in PI sector,
enrolment in this program band has increased considerably over the last five years.
Enrolment by Program Bands – PI Sector (FLE)
Program Bands 2011-12 2012-13 2013-14 2014-15 2015-16
% change 2011-2012
to 2015-2016
Business 6,449.4 6,368.1 5,986.0 5,910.7 6,291.6 -2%
Health Sciences 2,626.2 2,618.4 2,615.9 2,440.2 2,619.2 0%
Languages, Social Sciences, Arts & Humanities 1,461.8 1,629.5 1,834.5 1,937.0 1,876.9 28%
Legal & Security 330.7 327.2 322.2 327.1 351.8 6%
Physical, Natural & Applied Sciences 1,624.2 1,666.4 1,586.2 1,642.2 1,732.5 7%
Preparatory & Basic Upgrading 786.0 794.2 992.4 1,006.1 1,059.8 35%
Recreation 211.8 213.2 191.7 205.8 210.0 -1%
Trades & Technologies 11,574.8 12,123.2 12,412.1 13,390.9 13,927.9 20%
Total PI Sector 25,064.9 25,740.3 25,941.0 26,859.9 28,069.7 12%
Source: Alberta Advanced Education – Learner and Enrolment Reporting System (LERS).
34 | P a g e
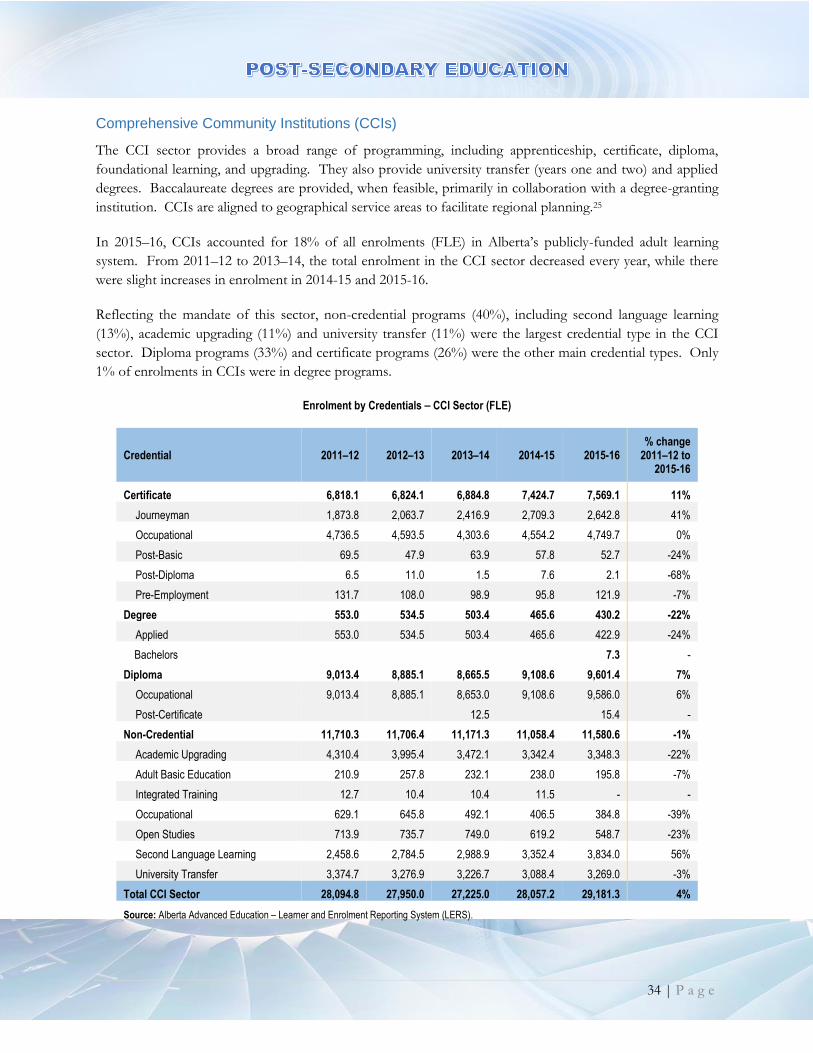
Comprehensive Community Institutions (CCIs)
The CCI sector provides a broad range of programming, including apprenticeship, certificate, diploma,
foundational learning, and upgrading. They also provide university transfer (years one and two) and applied
degrees. Baccalaureate degrees are provided, when feasible, primarily in collaboration with a degree-granting
institution. CCIs are aligned to geographical service areas to facilitate regional planning.25
In 2015–16, CCIs accounted for 18% of all enrolments (FLE) in Alberta’s publicly-funded adult learning
system. From 2011–12 to 2013–14, the total enrolment in the CCI sector decreased every year, while there
were slight increases in enrolment in 2014-15 and 2015-16.
Reflecting the mandate of this sector, non-credential programs (40%), including second language learning
(13%), academic upgrading (11%) and university transfer (11%) were the largest credential type in the CCI
sector. Diploma programs (33%) and certificate programs (26%) were the other main credential types. Only
1% of enrolments in CCIs were in degree programs.
Enrolment by Credentials – CCI Sector (FLE)
Credential 2011–12 2012–13 2013–14 2014-15 2015-16 % change
2011–12 to 2015-16
Certificate 6,818.1 6,824.1 6,884.8 7,424.7 7,569.1 11%
Journeyman 1,873.8 2,063.7 2,416.9 2,709.3 2,642.8 41%
Occupational 4,736.5 4,593.5 4,303.6 4,554.2 4,749.7 0%
Post-Basic 69.5 47.9 63.9 57.8 52.7 -24%
Post-Diploma 6.5 11.0 1.5 7.6 2.1 -68%
Pre-Employment 131.7 108.0 98.9 95.8 121.9 -7%
Degree 553.0 534.5 503.4 465.6 430.2 -22%
Applied 553.0 534.5 503.4 465.6 422.9 -24%
Bachelors 7.3 -
Diploma 9,013.4 8,885.1 8,665.5 9,108.6 9,601.4 7%
Occupational 9,013.4 8,885.1 8,653.0 9,108.6 9,586.0 6%
Post-Certificate 12.5 15.4 -
Non-Credential 11,710.3 11,706.4 11,171.3 11,058.4 11,580.6 -1%
Academic Upgrading 4,310.4 3,995.4 3,472.1 3,342.4 3,348.3 -22%
Adult Basic Education 210.9 257.8 232.1 238.0 195.8 -7%
Integrated Training 12.7 10.4 10.4 11.5 - -
Occupational 629.1 645.8 492.1 406.5 384.8 -39%
Open Studies 713.9 735.7 749.0 619.2 548.7 -23%
Second Language Learning 2,458.6 2,784.5 2,988.9 3,352.4 3,834.0 56%
University Transfer 3,374.7 3,276.9 3,226.7 3,088.4 3,269.0 -3%
Total CCI Sector 28,094.8 27,950.0 27,225.0 28,057.2 29,181.3 4%
Source: Alberta Advanced Education – Learner and Enrolment Reporting System (LERS).

35 | P a g e
Preparatory & Basic Upgrading is the largest program band in CCIs, comprising 26% of enrolment, followed
by Health Sciences (21%), Languages, Social Sciences, Arts & Humanities (15%), Trades & Technologies (14%)
and Business (10%). Each of the other program bands accounted for less than one-tenth of enrolments.
From 2011-12 to 2015-16, enrolment in most of the larger program bands in CCIs has increased over time:
Preparatory & Basic Upgrading (4%), Health Sciences (2%), Languages, Social Sciences, Arts & Humanities
(3%), and Trades & Technologies (28%). Business (-9%), Physical, Natural & Applied Sciences (-5%) and
Recreation (-13%) were the only program bands that had declines over the past five years.
Enrolment by Program Bands – CCI Sector (FLE)
Program Bands 2011–12 2012–13 2013–14 2014-15 2015-16 % change
2011–12 to 2015-16
Business 3,152.2 2,990.9 2,644.1 2,770.9 2,877.1 -9%
Education 812.4 713.4 730.7 786.7 843.6 4%
Health Sciences 5,940.7 5,680.3 5,701.6 5,677.2 6,043.9 2% Languages, Social Sciences, Arts & Humanities 4,141.2 4,141.6 3,911.9 3,954.6 4,277.7 3%
Legal & Security 1,200.7 1,202.9 1,029.2 1,113.6 1,216.3 1%
Physical, Natural & Applied Sciences 1,986.8 2,014.4 1,980.7 1,942.6 1,885.9 -5%
Preparatory & Basic Upgrading 7,175.7 7,157.9 6,837.2 7,061.2 7,485.5 4%
Recreation 417.6 427.9 384.4 356.8 362.8 -13%
Trades & Technologists 3,267.6 3,620.6 4,005.3 4,393.8 4,188.3 28%
Total CCI sector 28,094.8 27,950.0 27,225.0 28,057.2 29,181.3 4%
Source: Alberta Advanced Education – Learner and Enrolment Reporting System (LERS).
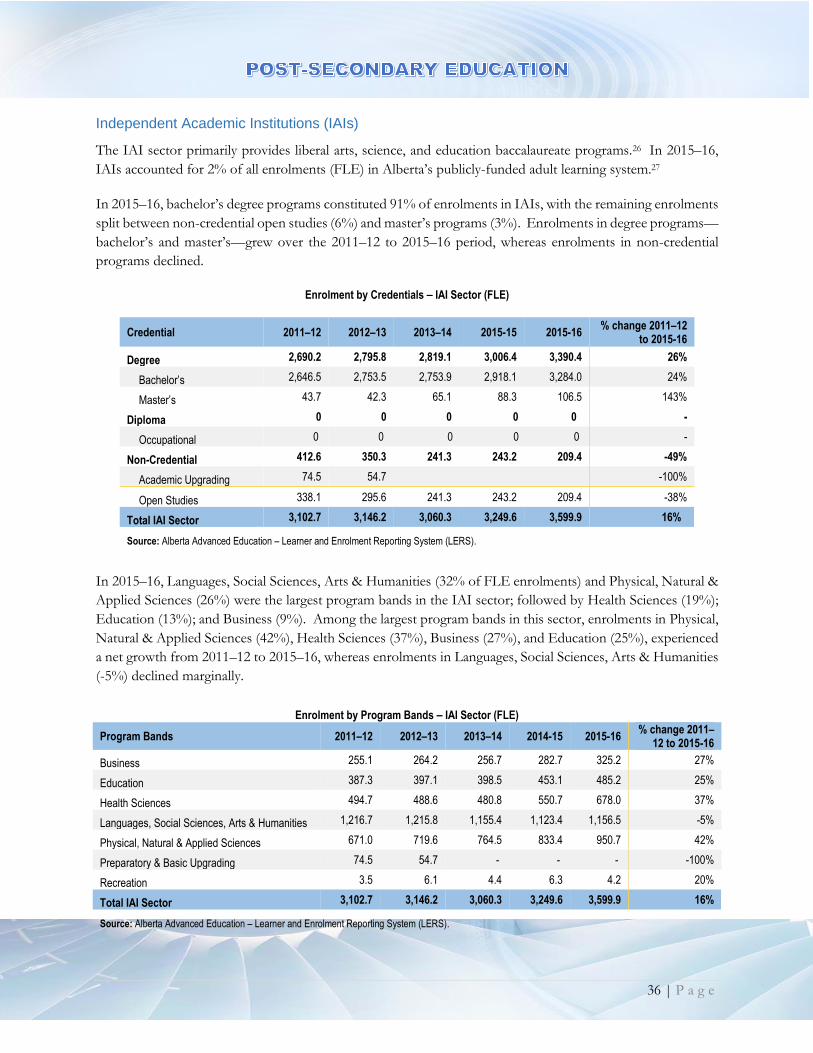
36 | P a g e
Independent Academic Institutions (IAIs)
The IAI sector primarily provides liberal arts, science, and education baccalaureate programs.26 In 2015–16,
IAIs accounted for 2% of all enrolments (FLE) in Alberta’s publicly-funded adult learning system.27
In 2015–16, bachelor’s degree programs constituted 91% of enrolments in IAIs, with the remaining enrolments
split between non-credential open studies (6%) and master’s programs (3%). Enrolments in degree programs—
bachelor’s and master’s—grew over the 2011–12 to 2015–16 period, whereas enrolments in non-credential
programs declined.
Enrolment by Credentials – IAI Sector (FLE)
Credential 2011–12 2012–13 2013–14 2015-15 2015-16 % change 2011–12
to 2015-16
Degree 2,690.2 2,795.8 2,819.1 3,006.4 3,390.4 26%
Bachelor’s 2,646.5 2,753.5 2,753.9 2,918.1 3,284.0 24%
Master’s 43.7 42.3 65.1 88.3 106.5 143%
Diploma 0 0 0 0 0 -
Occupational 0 0 0 0 0 -
Non-Credential 412.6 350.3 241.3 243.2 209.4 -49%
Academic Upgrading 74.5 54.7 -100%
Open Studies 338.1 295.6 241.3 243.2 209.4 -38%
Total IAI Sector 3,102.7 3,146.2 3,060.3 3,249.6 3,599.9 16%
Source: Alberta Advanced Education – Learner and Enrolment Reporting System (LERS).
In 2015–16, Languages, Social Sciences, Arts & Humanities (32% of FLE enrolments) and Physical, Natural &
Applied Sciences (26%) were the largest program bands in the IAI sector; followed by Health Sciences (19%);
Education (13%); and Business (9%). Among the largest program bands in this sector, enrolments in Physical,
Natural & Applied Sciences (42%), Health Sciences (37%), Business (27%), and Education (25%), experienced
a net growth from 2011–12 to 2015–16, whereas enrolments in Languages, Social Sciences, Arts & Humanities
(-5%) declined marginally.
Enrolment by Program Bands – IAI Sector (FLE)
Program Bands 2011–12 2012–13 2013–14 2014-15 2015-16 % change 2011–
12 to 2015-16
Business 255.1 264.2 256.7 282.7 325.2 27%
Education 387.3 397.1 398.5 453.1 485.2 25%
Health Sciences 494.7 488.6 480.8 550.7 678.0 37%
Languages, Social Sciences, Arts & Humanities 1,216.7 1,215.8 1,155.4 1,123.4 1,156.5 -5%
Physical, Natural & Applied Sciences 671.0 719.6 764.5 833.4 950.7 42%
Preparatory & Basic Upgrading 74.5 54.7 - - - -100%
Recreation 3.5 6.1 4.4 6.3 4.2 20%
Total IAI Sector 3,102.7 3,146.2 3,060.3 3,249.6 3,599.9 16%
Source: Alberta Advanced Education – Learner and Enrolment Reporting System (LERS).
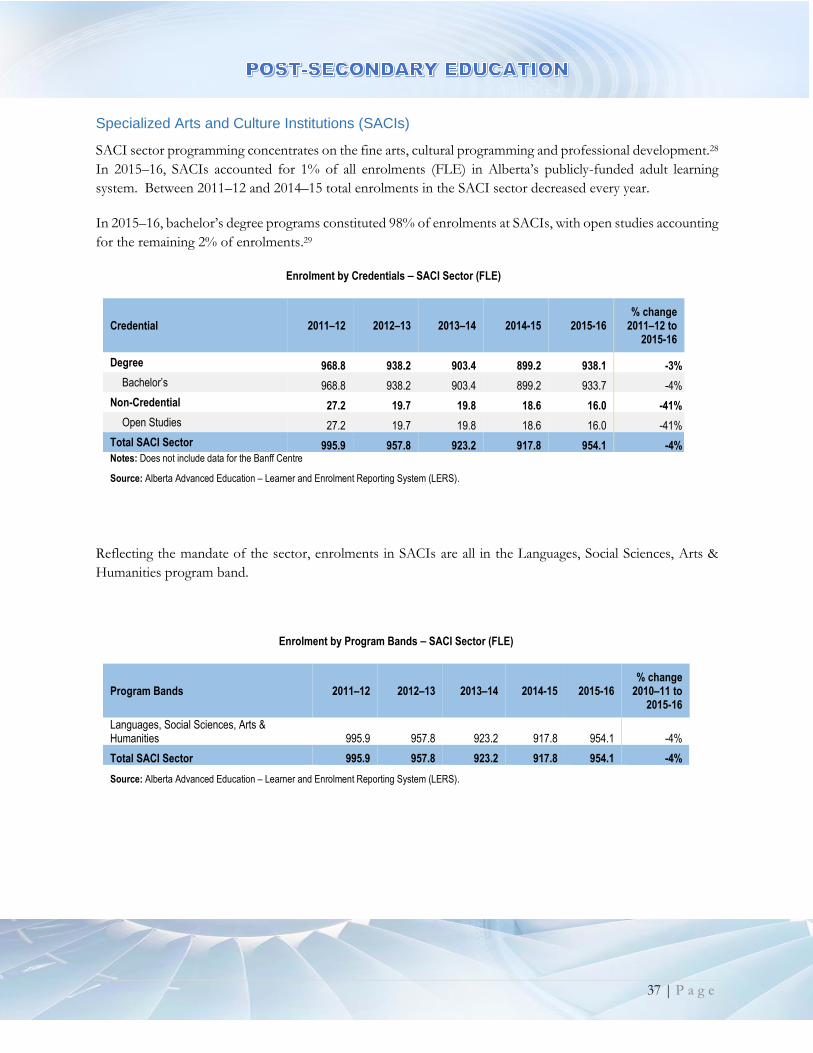
37 | P a g e
Specialized Arts and Culture Institutions (SACIs)
SACI sector programming concentrates on the fine arts, cultural programming and professional development.28
In 2015–16, SACIs accounted for 1% of all enrolments (FLE) in Alberta’s publicly-funded adult learning
system. Between 2011–12 and 2014–15 total enrolments in the SACI sector decreased every year.
In 2015–16, bachelor’s degree programs constituted 98% of enrolments at SACIs, with open studies accounting
for the remaining 2% of enrolments.29
Enrolment by Credentials – SACI Sector (FLE)
Credential 2011–12 2012–13 2013–14 2014-15 2015-16 % change
2011–12 to 2015-16
Degree 968.8 938.2 903.4 899.2 938.1 -3%
Bachelor’s 968.8 938.2 903.4 899.2 933.7 -4%
Non-Credential 27.2 19.7 19.8 18.6 16.0 -41%
Open Studies 27.2 19.7 19.8 18.6 16.0 -41%
Total SACI Sector 995.9 957.8 923.2 917.8 954.1 -4% Notes: Does not include data for the Banff Centre
Source: Alberta Advanced Education – Learner and Enrolment Reporting System (LERS).
Reflecting the mandate of the sector, enrolments in SACIs are all in the Languages, Social Sciences, Arts &
Humanities program band.
Enrolment by Program Bands – SACI Sector (FLE)
Program Bands 2011–12 2012–13 2013–14 2014-15 2015-16 % change
2010–11 to 2015-16
Languages, Social Sciences, Arts & Humanities 995.9 957.8 923.2 917.8 954.1 -4%
Total SACI Sector 995.9 957.8 923.2 917.8 954.1 -4%
Source: Alberta Advanced Education – Learner and Enrolment Reporting System (LERS).

38 | P a g e
Enrolment Projections
In-jector* is Alberta Advanced Education’s enrolment projection model that provides a general picture of
future student enrolments for the publicly-funded post-secondary system of Alberta. The projection model is
expected to serve as a basis for thoughtful, strategic conversations about future enrolment growth or decline
in post-secondary institutions. It allows post-secondary planners and administrators to engage in informed
conversations about future enrolment trends at both the institutional and provincial levels, as well as estimate
their potential impact on budgets, staffing, programs, and facilities.
In-jector uses projected population and historical enrolment as input variables for calculating future enrolment
(expressed as FLEs). The population data is based on Alberta Treasury Board and Finance’s population
projection and Alberta Education’s projection of 17-year old high school student population. Historical
enrolment data is derived from information that publicly-funded post-secondary institutions submit to AE’s
Learner and Enrolment Reporting System. When all of the data is entered, In-jector can create projection
scenarios based on the following factors:
Uptake Levels: used to determine the number of new enrolments at an institution each year. Uptake
levels are based on the number of entrants to an institution from the K–12 system over 10 years
(assuming that all of the institution’s enrolments come from the underlying service area—for CARIs,
this is Alberta; for all other institutions, it is their service region).
Retention Levels: the percentage of the previous academic years’ FLEs that remain in the current
academic year.
Program Proportions: the percentage of institutions’ gender-based enrolments in each program band.
In-jector uses cohorts of 17-year-old high school students aged according to the year being projected to predict
new enrolments. It uses the previous years’ enrolments and applies age-specific retention rates to predict
retained enrolments†. Total enrolments are then broken into various program bands using institution-specific
proportions. The primary function of In-jector is to project post-secondary enrolments at both the institutional
and provincial levels.
In addition to enrolment projections, institutional capacity to accommodate learners is important for identifying
space pressures from projected enrolment growth in the post-secondary system. Assessing system capacity
includes estimating existing institutional capacity and the capacity resulting from projects that are approved or
under way but not yet completed. Institutional capacity information is not being included in the Campus
Alberta Planning Resource this year because AE is working on a multi-year initiative with the Ministry of
Infrastructure and several post-secondary institutions to better estimate institutional capacity. The objective of
the initiative is to improve the information used to report and project capacity by better understanding the
various types of instructional spaces offered by our institutions, appropriately classifying them, and
standardizing an approach to calculating the appropriate use of these spaces.
* In-jector” stands for Institutional Enrolment Projection Model.
† New enrolments are defined as FLEs from students who were not at that institution in the previous year. Retained enrolments are defined as FLEs from students who were at that institution in the previous year.

39 | P a g e
Enrolments in publicly-funded post-secondary institutions are projected to increase by 5.6% over the next 10
years (2015–16 to 2025–26). Enrolments are projected to increase in all sectors except CCI and IAI sectors.
Projected Enrolment by Sectors
Sector 2015-16 (current)
2016-17 2017-18 2018-19 2019-20 2020-21 2021-22 2022-23 2023-24 2024-25 2025-26
Projected Increase
(2015-16 to
2025-26)
CARI 79,270 80,100 80,900 81,476 81,917 82,237 82,608 83,242 83,989 84,867 86,013 8.5%
CCI 29,181 28,488 28,154 27,949 27,804 27,701 27,680 27,775 27,969 28,196 28,538 -2.2%
PI 28,070 27,729 27,691 27,760 27,858 27,953 28,082 28,323 28,646 29,040 29,537 5.2%
BASI 21,847 21,845 21,944 22,041 22,133 22,181 22,271 22,469 22,731 23,060 23,496 7.6%
IAI 3,600 3,482 3,427 3,394 3,372 3,354 3,352 3,375 3,408 3,452 3,515 -2.4%
SACI 954 943 938 937 941 944 952 965 982 1,002 1,026 7.6% All Sectors
162,922 162,587 163,055 163,556 164,026 164,370 164,944 166,149 167,725 169,617 172,124 5.6%
Sources: Alberta Advanced Education – Learner and Enrolment Reporting System (LERS), Enrolment Projection Model.
Enrolment growth is expected to vary across AE service regions during the 2015–16 to 2025-26 projection
period. Most service regions are projected to have enrolment increases, with the urban areas projected to
account for the bulk of the enrolment growth. The Calgary region is projected to have a peak growth of 4,879
FLEs (49.1% of total growth), followed by the Edmonton region with a peak growth of 3,562 FLEs (35.8% of
total growth).
Projected Enrolment Growth (FLE) by Service Region
Geographic Service Region Projected peak
enrolment growth 2015-16 to 2025-26
% of total
Calgary 4,879 49.1%
Edmonton 3,562 35.8%
Lethbridge 279 2.8%
Central 0 0.0%
Medicine Hat 70 0.7%
Grande Prairie 192 1.9%
Lakeland 0 0.0%
Keyano 215 2.2%
Northern Lakes 144 1.4%
Portage 0 0.0%
Athabasca University 603 6.1%
Total 9,944 100.0%
Notes: All figures are in FLEs. This does not include the Banff Centre. Peak enrolment is the maximum expected enrolment growth over the projection period compared to the current enrolment level. The peak figure does not take into account enrolment decreases. Source: Alberta Advanced Education – Learner and Enrolment Reporting System (LERS), Enrolment Projection Model

40 | P a g e
The enrolment growth pattern is expected to vary across the system during the 2015-16 to 2025-26 projection
period. Most institutions show an increasing trend and will reach their peak enrolment at the end of the
projection period. However, some institutions show a declining enrolment trend over the projection period.
For a few institutions, enrolment growth is not expected to follow a linear growth path; these institutions see
enrolment increases in some years and decreases in others. The detailed projections for institutions and regions
are included in the following table, with the peak enrolment year highlighted.
Projected Enrolment by Institution and Service Region (FLE)
2015
-16
(cu
rren
t)
2016
-17
2017
-18
2018
-19
2019
-20
2020
-21
2021
-22
2022
-23
2023
-24
2024
-25
2025
-26
Edmonton 69,828 69,416 69,632 69,953 70,242 70,422 70,642 71,105 71,685 72,405 73,390
Concordia Univ. College 1,434 1,351 1,309 1,284 1,266 1,251 1,244 1,246 1,252 1,263 1,282
Grant MacEwan University 12,581 12,572 12,633 12,684 12,705 12,693 12,689 12,738 12,818 12,935 13,119
King's University 629 609 602 597 592 587 585 588 592 598 609
NorQuest College 5,013 4,466 4,227 4,127 4,092 4,073 4,060 4,060 4,070 4,093 4,132
NAIT 13,808 13,369 13,200 13,145 13,120 13,094 13,079 13,115 13,177 13,268 13,412
University of Alberta 36,364 37,049 37,660 38,116 38,468 38,725 38,985 39,359 39,775 40,247 40,836
Calgary 59,382 59,334 59,531 59,751 60,023 60,276 60,654 61,302 62,117 63,082 64,261
ACAD 954 943 938 937 941 944 952 965 982 1,002 1,026
Ambrose University 481 476 475 476 478 481 485 492 502 513 526
Bow Valley College 6,309 6,140 6,077 6,062 6,075 6,105 6,151 6,219 6,314 6,431 6,565
Mount Royal University 9,266 9,273 9,311 9,357 9,429 9,488 9,582 9,731 9,913 10,126 10,377
SAIT 14,262 14,360 14,491 14,615 14,738 14,859 15,002 15,208 15,469 15,772 16,125
St. Mary's University 622 617 616 617 620 623 628 638 650 663 679
University of Calgary 27,489 27,524 27,623 27,689 27,741 27,775 27,854 28,048 28,288 28,576 28,963
Lethbridge 10,770 10,766 10,774 10,761 10,740 10,704 10,701 10,733 10,802 10,896 11,050
Lethbridge College 3,821 3,865 3,886 3,884 3,868 3,838 3,826 3,819 3,832 3,854 3,908
University of Lethbridge 6,949 6,902 6,888 6,876 6,872 6,866 6,875 6,914 6,969 7,041 7,141
Central 5,459 5,321 5,254 5,193 5,138 5,079 5,060 5,082 5,103 5,127 5,190
Burman University 435 429 425 421 416 412 410 411 412 414 419
Olds College 1,246 1,289 1,306 1,306 1,298 1,287 1,282 1,288 1,295 1,301 1,318
Red Deer College 3,778 3,603 3,523 3,467 3,424 3,381 3,368 3,382 3,397 3,412 3,453
Medicine Hat College 2,080 2,102 2,103 2,116 2,110 2,127 2,121 2,121 2,135 2,149 2,150
GPRC 1,877 1,929 1,949 1,943 1,937 1,940 1,948 1,964 1,989 2,021 2,069
Lakeland College 1,957 1,867 1,797 1,743 1,704 1,669 1,657 1,646 1,659 1,652 1,645
Keyano College 1,137 1,196 1,231 1,245 1,255 1,266 1,277 1,302 1,319 1,334 1,352
Northern Lakes College 1,088 1,190 1,227 1,232 1,222 1,199 1,174 1,159 1,144 1,128 1,122
Portage College 874 841 828 824 819 818 815 813 815 820 824
Athabasca University 8,469 8,625 8,728 8,794 8,836 8,871 8,894 8,921 8,957 9,003 9,072
Total 162,922 162,587 163,055 163,556 164,026 164,370 164,944 166,149 167,725 169,617 172,124
Notes: Data does not include the Banff Centre. Highlighted cells represent the highest/peak enrolment expected during the projection period for the institution/region. Sources: Alberta Advanced Education – LERS, Enrolment Projection Model
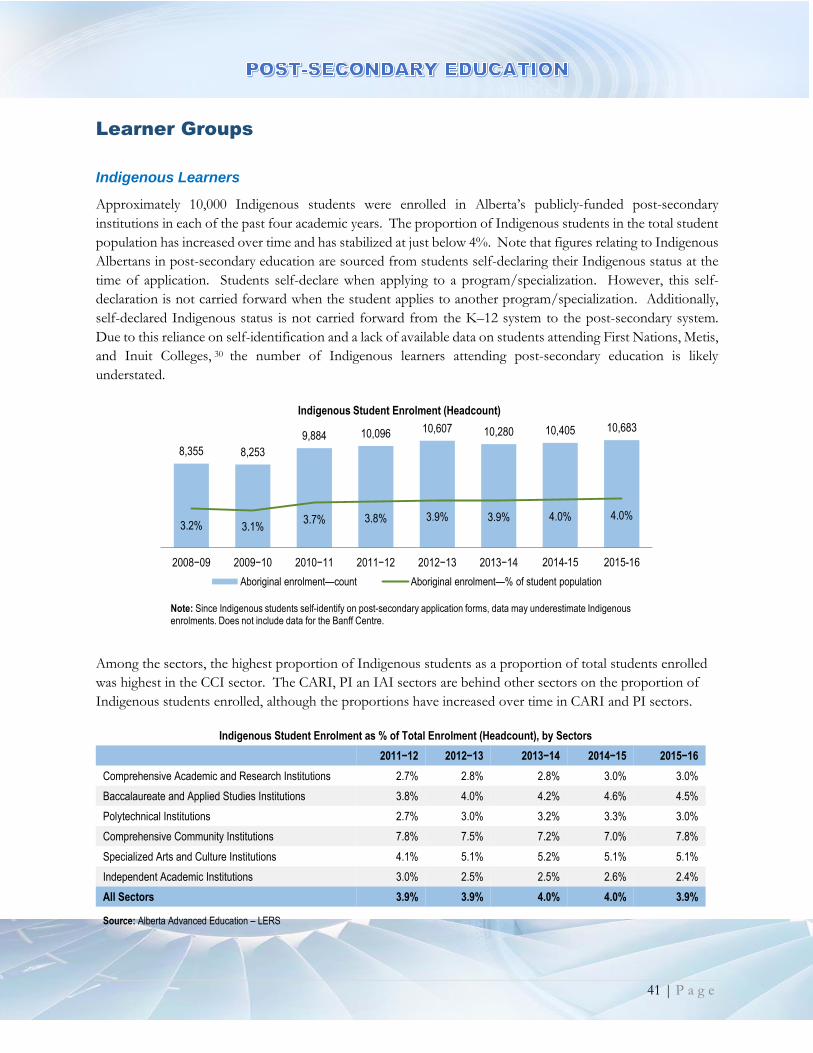
41 | P a g e
Learner Groups
Indigenous Learners
Approximately 10,000 Indigenous students were enrolled in Alberta’s publicly-funded post-secondary
institutions in each of the past four academic years. The proportion of Indigenous students in the total student
population has increased over time and has stabilized at just below 4%. Note that figures relating to Indigenous
Albertans in post-secondary education are sourced from students self-declaring their Indigenous status at the
time of application. Students self-declare when applying to a program/specialization. However, this self-
declaration is not carried forward when the student applies to another program/specialization. Additionally,
self-declared Indigenous status is not carried forward from the K–12 system to the post-secondary system.
Due to this reliance on self-identification and a lack of available data on students attending First Nations, Metis,
and Inuit Colleges, 30 the number of Indigenous learners attending post-secondary education is likely
understated.
Among the sectors, the highest proportion of Indigenous students as a proportion of total students enrolled
was highest in the CCI sector. The CARI, PI an IAI sectors are behind other sectors on the proportion of
Indigenous students enrolled, although the proportions have increased over time in CARI and PI sectors.
Indigenous Student Enrolment as % of Total Enrolment (Headcount), by Sectors
2011−12 2012−13 2013−14 2014−15 2015−16
Comprehensive Academic and Research Institutions 2.7% 2.8% 2.8% 3.0% 3.0%
Baccalaureate and Applied Studies Institutions 3.8% 4.0% 4.2% 4.6% 4.5%
Polytechnical Institutions 2.7% 3.0% 3.2% 3.3% 3.0%
Comprehensive Community Institutions 7.8% 7.5% 7.2% 7.0% 7.8%
Specialized Arts and Culture Institutions 4.1% 5.1% 5.2% 5.1% 5.1%
Independent Academic Institutions 3.0% 2.5% 2.5% 2.6% 2.4%
All Sectors 3.9% 3.9% 4.0% 4.0% 3.9%
Source: Alberta Advanced Education – LERS
8,355 8,253
9,884 10,096 10,607 10,280 10,405 10,683
3.2% 3.1%3.7% 3.8% 3.9% 3.9% 4.0% 4.0%
2008−09 2009−10 2010−11 2011−12 2012−13 2013−14 2014-15 2015-16
Indigenous Student Enrolment (Headcount)
Aboriginal enrolment—count Aboriginal enrolment—% of student population
Note: Since Indigenous students self-identify on post-secondary application forms, data may underestimate Indigenous enrolments. Does not include data for the Banff Centre.
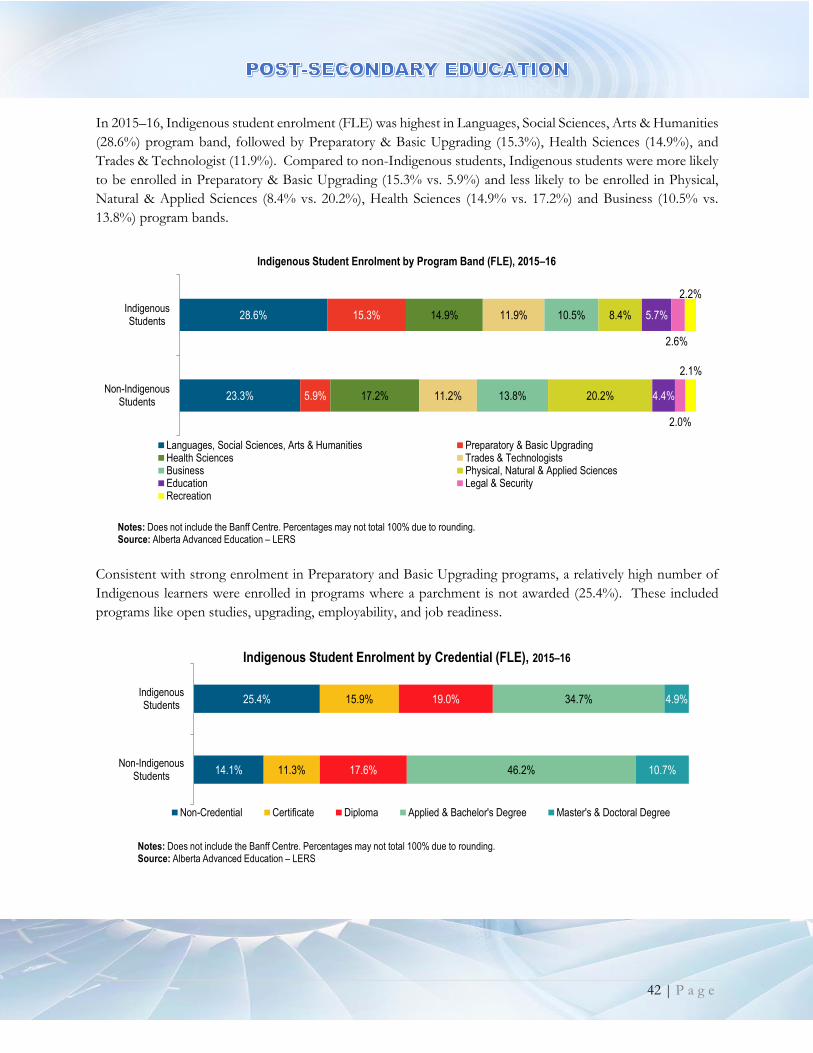
42 | P a g e
In 2015–16, Indigenous student enrolment (FLE) was highest in Languages, Social Sciences, Arts & Humanities
(28.6%) program band, followed by Preparatory & Basic Upgrading (15.3%), Health Sciences (14.9%), and
Trades & Technologist (11.9%). Compared to non-Indigenous students, Indigenous students were more likely
to be enrolled in Preparatory & Basic Upgrading (15.3% vs. 5.9%) and less likely to be enrolled in Physical,
Natural & Applied Sciences (8.4% vs. 20.2%), Health Sciences (14.9% vs. 17.2%) and Business (10.5% vs.
13.8%) program bands.
Consistent with strong enrolment in Preparatory and Basic Upgrading programs, a relatively high number of
Indigenous learners were enrolled in programs where a parchment is not awarded (25.4%). These included
programs like open studies, upgrading, employability, and job readiness.
28.6%
23.3%
15.3%
5.9%
14.9%
17.2%
11.9%
11.2%
10.5%
13.8%
8.4%
20.2%
5.7%
4.4%
2.6%
2.0%
2.2%
2.1%
IndigenousStudents
Non-IndigenousStudents
Indigenous Student Enrolment by Program Band (FLE), 2015–16
Languages, Social Sciences, Arts & Humanities Preparatory & Basic UpgradingHealth Sciences Trades & TechnologistsBusiness Physical, Natural & Applied SciencesEducation Legal & SecurityRecreation
Notes: Does not include the Banff Centre. Percentages may not total 100% due to rounding.Source: Alberta Advanced Education – LERS
25.4%
14.1%
15.9%
11.3%
19.0%
17.6%
34.7%
46.2%
4.9%
10.7%
IndigenousStudents
Non-IndigenousStudents
Indigenous Student Enrolment by Credential (FLE), 2015–16
Non-Credential Certificate Diploma Applied & Bachelor's Degree Master's & Doctoral Degree
Notes: Does not include the Banff Centre. Percentages may not total 100% due to rounding.Source: Alberta Advanced Education – LERS

43 | P a g e
In 2015–16, the Indigenous student population had a higher proportion of female students than the non-
Indigenous student population. Indigenous students also tend to be somewhat older than non-Indigenous
students.
Indigenous Student Enrolment by Age and Gender, 2015–16
Age Indigenous Non-Indigenous
0 – 17 1% 2%
18 – 24 49% 54%
25 – 34 32% 28%
35 – 44 12% 11%
45 – 54 5% 4%
55+ 1% 1%
Total 100% 100%
Gender Indigenous Non-Indigenous
Female 63% 53%
Male 37% 47%
Total 100% 100%
International Education
International education involves the inflow of international students to Canada and Alberta, as well as the
movement of Alberta students to jurisdictions outside of Canada. In addition, the concept encompasses
activities like collaborative programs between institutions across borders, international projects, and the
incorporation of a global perspective into classroom learning. Currently, there is no good estimate of the
valuation of the research and entrepreneurial activity done by international students and recent international
student graduates, which is an important data gap. At the graduate level, there is a high proportion of
international students who are likely contributing significantly to Alberta’s economic output through research
and research commercialization.
International Students in Alberta
Alberta has the fourth-highest number of international students among the provinces, after Ontario, British
Columbia, and Quebec. This is consistent with previous years.31 In 2015–16, China was the single largest
source country for post-secondary visa students to Alberta, accounting for about one-third (35%) of visa
students enrolled in Alberta for post-secondary studies, followed by India (12%), Korea (4%), Nigeria (4%),
Iran (3%), United States (3%), Vietnam (2%) and Japan (2%). 32
The number of visa students enrolled and their proportion of total enrolment in Alberta’s post-secondary
institutions have more than doubled over the past 10 years. In the 2015–16 academic year, a total of 18,839
visa students (up from 9,047 in 2005–06) were enrolled in post-secondary institutions in Alberta (excluding
Athabasca University). This represents 7.1% of all students (up from 3.7% in 2005–06) in the post-secondary
system.
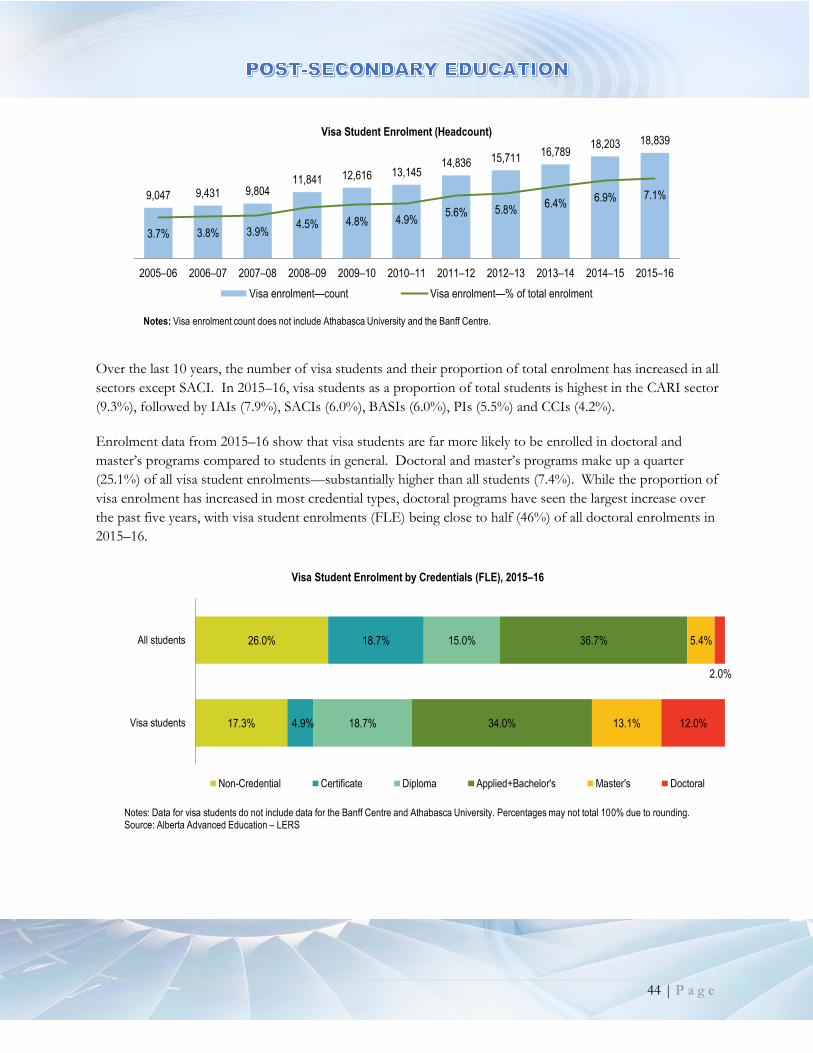
44 | P a g e
Over the last 10 years, the number of visa students and their proportion of total enrolment has increased in all
sectors except SACI. In 2015–16, visa students as a proportion of total students is highest in the CARI sector
(9.3%), followed by IAIs (7.9%), SACIs (6.0%), BASIs (6.0%), PIs (5.5%) and CCIs (4.2%).
Enrolment data from 2015–16 show that visa students are far more likely to be enrolled in doctoral and
master’s programs compared to students in general. Doctoral and master’s programs make up a quarter
(25.1%) of all visa student enrolments—substantially higher than all students (7.4%). While the proportion of
visa enrolment has increased in most credential types, doctoral programs have seen the largest increase over
the past five years, with visa student enrolments (FLE) being close to half (46%) of all doctoral enrolments in
2015–16.
9,047 9,431 9,80411,841 12,616 13,145
14,836 15,71116,789
18,203 18,839
3.7% 3.8% 3.9%4.5% 4.8% 4.9%
5.6% 5.8%6.4%
6.9% 7.1%
2005–06 2006–07 2007–08 2008–09 2009–10 2010–11 2011–12 2012–13 2013–14 2014–15 2015–16
Visa Student Enrolment (Headcount)
Visa enrolment—count Visa enrolment—% of total enrolment
Notes: Visa enrolment count does not include Athabasca University and the Banff Centre.
17.3%
26.0%
4.9%
18.7%
18.7%
15.0%
34.0%
36.7%
13.1%
5.4%
12.0%
2.0%
Visa students
All students
Visa Student Enrolment by Credentials (FLE), 2015–16
Non-Credential Certificate Diploma Applied+Bachelor's Master's Doctoral
Notes: Data for visa students do not include data for the Banff Centre and Athabasca University. Percentages may not total 100% due to rounding.Source: Alberta Advanced Education – LERS

45 | P a g e
Compared to non-visa students, visa students are far more likely to be in programs in the Physical, Natural &
Applied Sciences program band (33.7% vs. 14.1%).
Alberta Students Studying Abroad
While there is currently no direct mechanism to track Albertans who choose to study outside the province,
some indication of the number of Albertans leaving the province to study can be obtained from student
financial assistance data. Students must indicate the institution they will attend on their Student Aid Alberta
application form. The proportions of Student Aid Alberta recipients studying outside the province and abroad
are used as a proxy for the overall proportion of Albertans who leave the province to study.
Alberta Graduates Outcomes Survey for the class of 2013–14 indicates that 6% of graduates participated in a
program abroad, which may have included a student exchange, field school experience, course taken abroad,
co-op/practicum, or internship outside of Canada. Higher proportions of graduates who attended CARIs
(10%) and IAIs (11%) have participated in a program abroad, compared to graduates who attended CCIs (2%)
and PIs (2%). Study abroad participation is higher among graduates from applied, bachelor (9%) and master’s
degree program (10%) than from certificate or diploma programs (2% to 3%).33
5.8%2.6%
8.3%6.6%
22.7%
45.0%
7.5%
3.3%
8.3% 7.1%
24.1%
44.6%
6.9%3.6%
9.9%
7.2%
23.4%
46.1%
Non-Credential Certificate Diploma Applied+Bachelor's Master's Doctoral
Visa Enrolment as a Proportion of Total Enrolment by Credentials (FLE)
2011–12 2012–13 2013–14 2014–15 2015–16
Notes: Data for visa students do not include data for the Banff Centre and Athabasca University. Percentages may not total 100% due to rounding.Source: Alberta Advanced Education – LERS

46 | P a g e
Learners with Disabilities
A key policy direction outlined in A Learning Alberta and the Roles and Mandates Policy Framework is to increase
access for groups traditionally under-represented in post-secondary education, including individuals with
disabilities.34
In 2014–15, the number of students with disabilities seeking and receiving services and accommodations from
Alberta’s 26 publicly-funded institutions was 12,682 (a 5 % increase from the previous year). This included
9,278 registered students with one disability and 3,404 students with multiple disabilities, and represents
approximately 4.8% of the total number of full and part-time students in the system.
In 2014–15, students with learning disabilities represented the largest category of disability accommodated by
post-secondary institutions in Alberta (29% of all assessed primary disabilities), followed by psychiatric
disabilities (25%), Attention Deficit-Hyperactivity Disorder (18%), chronic medical/systemic disability (12%),
mobility/functional disabilities (5%), acquired brain injury (2%), Deaf/Hard of Hearing (2%), Blind/Partially
Sighted (2%) and other types of disabilities (4%).
Students who have a documented permanent disability and are attending full-time post-secondary studies may
be eligible for additional student aid through the Canada Student Grant for Students with Permanent
Disabilities, and the Canada Student Grant for Services and Equipment for Students with Permanent
Disabilities. Students not eligible for federal funding are supported through the Alberta Grant for Students
with Permanent Disabilities (applies to services/equipment). In 2014–15, 3,362 learners received disability
funding from Student Aid through the Canada Student Grant for Students with Permanent Disabilities and the
Canada Student Grant for Services and Equipment for Students with Permanent Disabilities. The number of
students who received these supports has increased each year for the past five years.35
8,022
9,423 9,778 9,565
11,238 11,802
12,682
3.0%3.5% 3.6% 3.6%
4.2% 4.5% 4.8%
2008–09 2009–10 2010–11 2011–12 2012–13 2013–14 2014–15
Students with Disabilities (Headcount)
Students with disabilities—count Students with disabilities—% of student population
Notes: The count represents the number of students with disabilities seeking and receiving services and accommodations from Alberta’s 26 publicly-funded institutions. Includes data for the Banff Centre.Source: Alberta Advanced Education

47 | P a g e
Female Students in Post-Secondary Education
In 2015–16, 53% of students enrolled in Alberta’s publicly-funded post-secondary institutions were female.
This proportion has remained stable in the past five years. A higher proportion of females than males were
enrolled in all sectors except Polytechnical Institutions.
Enrolment (Headcount) by Gender and Sector, 2015–16
Sector Female Male
Comprehensive Academic and Research Institutions 59% 41%
Baccalaureate and Applied Studies Institutions 64% 36%
Polytechnical Institutions 31% 69%
Comprehensive Community Institutions 58% 42%
Independent Academic Institutions 61% 39%
Specialized Arts and Culture Institutions 71% 29%
All Sectors 53% 47%
Source: Alberta Advanced Education – Learner and Enrolment Reporting System (LERS)
Most program bands also had a higher proportion of females than males enrolled (FLE) in 2015–16. The
proportion of female enrolments was considerably higher in Health Sciences (80%), Education (77%), and
Languages, Social Sciences, Arts & Humanities (64%) program bands. Trades & Technologies (14%) and
Physical, Natural & Applied Sciences (40%) were the only program bands that had a lower proportion of
females than males. These findings have remained consistent over the past five years.
Enrolment (FLE) by Gender and Program Band, 2015–16
Program band Female Male
Business 52% 48%
Education 77% 23%
Health Sciences 80% 20%
Languages, Social Sciences, Arts & Humanities 64% 35%
Legal & Security 58% 42%
Physical, Natural & Applied Sciences 40% 60%
Preparatory & Basic Upgrading 62% 38%
Recreation 58% 42%
Trades & Technologists 14% 86%
Grand Total 55% 45%
Source: Alberta Advanced Education – Learner and Enrolment Reporting System (LERS)

48 | P a g e
Learner Pathways
Ensuring that students can easily move into and through the adult learning system is an important part of an
accessible system. Mechanisms that facilitate opportunities for diverse learner pathways and system mobility
help students move into and between institutions, programs, or credentials; reduce barriers to educational
achievement; and get students into the labour market faster.
Transfers and Recognition of Prior Learning
The Alberta Transfer System and its member institutions support these opportunities. The Alberta Council
on Admissions and Transfer (ACAT) is the provincial advisory body responsible for providing oversight and
advice regarding learner pathways, student mobility and the Alberta Transfer System. The Alberta Transfer
System is open to public and private not-for-profit institutions and is currently comprised of 39 post-
secondary institutions, including 26 publicly-funded, 4 out-of-province, 5 First Nations, and 4 private
institutions. Currently, there are approximately 34,000 by-course and 900 by-program active transfer
agreements made available to students by Alberta Transfer System member institutions via Transfer Alberta.
Transfer is the movement of students among post-secondary institutions based on transferable credit. Transfer
credit is awarded for successful completion of structured educational activities at a post-secondary institution.
Students receive transfer credit, where appropriate, upon admission to an educational program in a post-
secondary institution. According to the Alberta Graduate Outcomes Survey – Class of 2013–14, 46% of
graduates, who had completed prior post-secondary education, received transfer credits for courses taken at
another institution; and the vast majority (89%) of these graduates were satisfied with the transfer credit they
received when transitioning from one institution to another.36
Student Enrolment Flow
AE and ACAT produce Student Mobility Reports that provide data demonstrating the student movement
amongst the 26 public Alberta Transfer System member institutions and the Campus Alberta sectors. These
reports use student enrolment data collected from and approved by institutions.
To analyze student in-flow, students enrolled in the post-secondary system in a given year are classified into
three groups—new students, continuing students, and returning students—based on their prior interaction with
the post-secondary system. Students who had no enrolment records in Alberta’s post-secondary system for
the previous six years are classified as new students. Students who were enrolled in the system in the prior year
are classified as continuing students. Students who were not enrolled in the previous year, but had an enrolment
record at some point in the five years before that are classified as returning students.
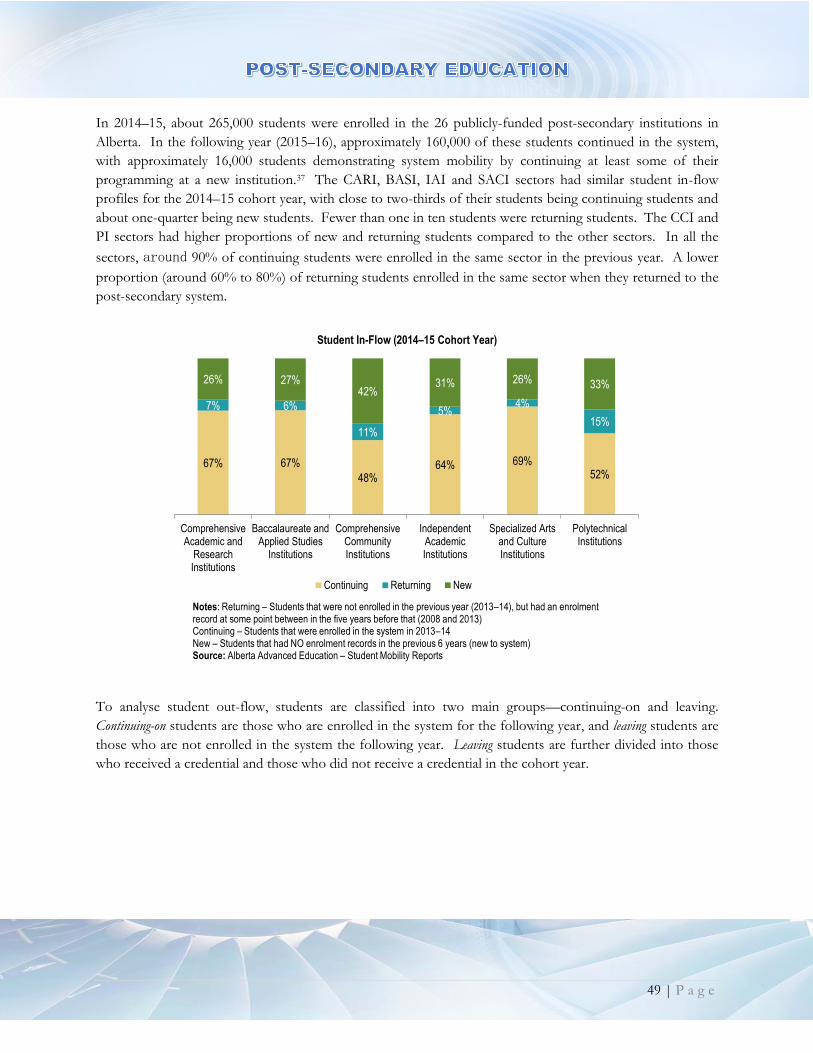
49 | P a g e
In 2014–15, about 265,000 students were enrolled in the 26 publicly-funded post-secondary institutions in
Alberta. In the following year (2015–16), approximately 160,000 of these students continued in the system,
with approximately 16,000 students demonstrating system mobility by continuing at least some of their
programming at a new institution.37 The CARI, BASI, IAI and SACI sectors had similar student in-flow
profiles for the 2014–15 cohort year, with close to two-thirds of their students being continuing students and
about one-quarter being new students. Fewer than one in ten students were returning students. The CCI and
PI sectors had higher proportions of new and returning students compared to the other sectors. In all the
sectors, around 90% of continuing students were enrolled in the same sector in the previous year. A lower
proportion (around 60% to 80%) of returning students enrolled in the same sector when they returned to the
post-secondary system.
To analyse student out-flow, students are classified into two main groups—continuing-on and leaving.
Continuing-on students are those who are enrolled in the system for the following year, and leaving students are
those who are not enrolled in the system the following year. Leaving students are further divided into those
who received a credential and those who did not receive a credential in the cohort year.
67% 67%
48%64% 69%
52%
7% 6%
11%
5%4%
15%
26% 27%42%
31% 26% 33%
ComprehensiveAcademic and
ResearchInstitutions
Baccalaureate andApplied Studies
Institutions
ComprehensiveCommunityInstitutions
IndependentAcademicInstitutions
Specialized Artsand CultureInstitutions
PolytechnicalInstitutions
Student In-Flow (2014–15 Cohort Year)
Continuing Returning New
Notes: Returning – Students that were not enrolled in the previous year (2013–14), but had an enrolment record at some point between in the five years before that (2008 and 2013)Continuing – Students that were enrolled in the system in 2013–14New – Students that had NO enrolment records in the previous 6 years (new to system)Source: Alberta Advanced Education – Student Mobility Reports
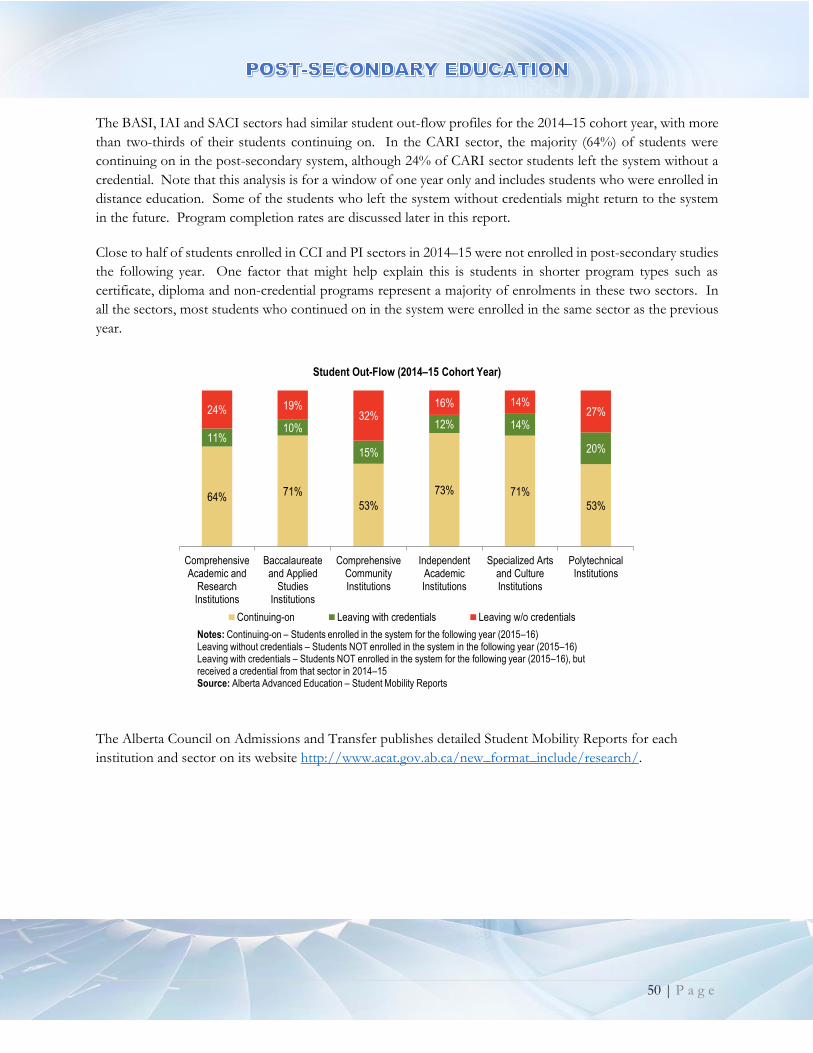
50 | P a g e
The BASI, IAI and SACI sectors had similar student out-flow profiles for the 2014–15 cohort year, with more
than two-thirds of their students continuing on. In the CARI sector, the majority (64%) of students were
continuing on in the post-secondary system, although 24% of CARI sector students left the system without a
credential. Note that this analysis is for a window of one year only and includes students who were enrolled in
distance education. Some of the students who left the system without credentials might return to the system
in the future. Program completion rates are discussed later in this report.
Close to half of students enrolled in CCI and PI sectors in 2014–15 were not enrolled in post-secondary studies
the following year. One factor that might help explain this is students in shorter program types such as
certificate, diploma and non-credential programs represent a majority of enrolments in these two sectors. In
all the sectors, most students who continued on in the system were enrolled in the same sector as the previous
year.
The Alberta Council on Admissions and Transfer publishes detailed Student Mobility Reports for each
institution and sector on its website http://www.acat.gov.ab.ca/new_format_include/research/.
64% 71%
53%
73% 71%
53%
11%10%
15%
12% 14%
20%
24% 19%32%
16% 14%27%
ComprehensiveAcademic and
ResearchInstitutions
Baccalaureateand Applied
StudiesInstitutions
ComprehensiveCommunityInstitutions
IndependentAcademicInstitutions
Specialized Artsand CultureInstitutions
PolytechnicalInstitutions
Student Out-Flow (2014–15 Cohort Year)
Continuing-on Leaving with credentials Leaving w/o credentials
Notes: Continuing-on – Students enrolled in the system for the following year (2015–16)Leaving without credentials – Students NOT enrolled in the system in the following year (2015–16)Leaving with credentials – Students NOT enrolled in the system for the following year (2015–16), but received a credential from that sector in 2014–15Source: Alberta Advanced Education – Student Mobility Reports
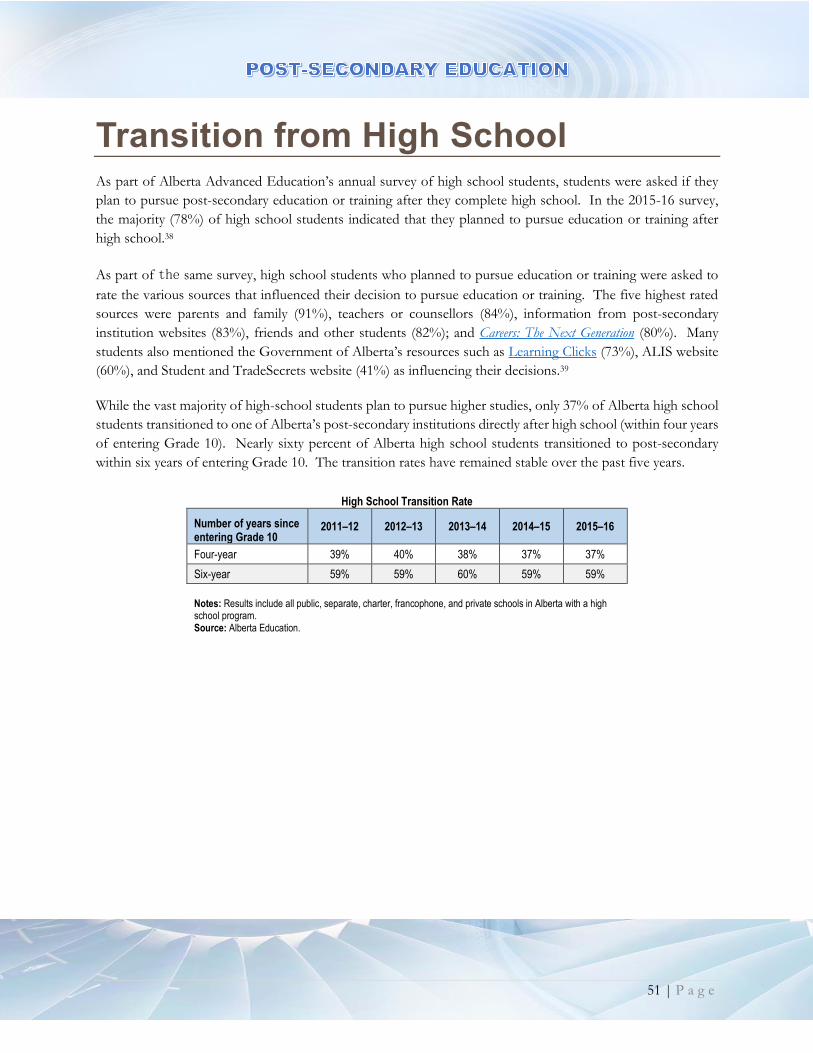
51 | P a g e
Transition from High School As part of Alberta Advanced Education’s annual survey of high school students, students were asked if they
plan to pursue post-secondary education or training after they complete high school. In the 2015-16 survey,
the majority (78%) of high school students indicated that they planned to pursue education or training after
high school.38
As part of the same survey, high school students who planned to pursue education or training were asked to
rate the various sources that influenced their decision to pursue education or training. The five highest rated
sources were parents and family (91%), teachers or counsellors (84%), information from post-secondary
institution websites (83%), friends and other students (82%); and Careers: The Next Generation (80%). Many
students also mentioned the Government of Alberta’s resources such as Learning Clicks (73%), ALIS website
(60%), and Student and TradeSecrets website (41%) as influencing their decisions.39
While the vast majority of high-school students plan to pursue higher studies, only 37% of Alberta high school
students transitioned to one of Alberta’s post-secondary institutions directly after high school (within four years
of entering Grade 10). Nearly sixty percent of Alberta high school students transitioned to post-secondary
within six years of entering Grade 10. The transition rates have remained stable over the past five years.
High School Transition Rate
Number of years since entering Grade 10
2011–12 2012–13 2013–14 2014–15 2015–16
Four-year 39% 40% 38% 37% 37%
Six-year 59% 59% 60% 59% 59%
Notes: Results include all public, separate, charter, francophone, and private schools in Alberta with a high school program. Source: Alberta Education.

52 | P a g e
Student Aid
As part of AE’s 2015-16 survey of high school students, students planning to pursue additional education or
training after high school are asked how they plan to cover the cost of their post-secondary education. The
greatest proportion of students indicated that they intend to get help by working part-time while in school
(35%) and/or from family/parents (27%). About one out of five students reported that they would use student
loans, grants or scholarships (22%) from the Government of Alberta. Less than one out of five students
indicated that they would use summer earnings (15%), bursaries (14%), or bank loans (3%). The majority (58%)
of these students reported that they had received information on student loans, grants or scholarships available
from the Government of Alberta, primarily through their school.40
However, results from the Alberta Graduate Outcomes Survey indicate that 43% of graduates received
government sponsored student loads, 20% used non-government loans from financial institutions, and 12%
used both. Two-thirds (63%) of 2013–14 graduates received scholarships, grants or bursaries during their
studies.41 The higher use of government and bank loans than estimated by high school students suggests that
students may not have realistic expectations of the costs and financing options for post-secondary
education.42
Details regarding the types of loans and debt at time of graduation is available in the Graduate Outcomes Survey
Class of 2013/14 Final Report published at http://iae.alberta.ca/ministry/stats/.
Student Aid Alberta – Loans and Grants
Student Aid issues federal and provincial loans and grants to eligible post-secondary students. Government
student loans help cover the basic costs of education, including tuition, fees, books, supplies, and basic living
costs. Student loans are interest-free while students are in school, and students are not required to make
payments while in school. Student loan borrowers are not required to begin making loan payments until six
months after leaving their studies; however, during this six-month period, interest accrues on federal student
loans. Federal and provincial grants are available to student loan borrowers including those who are low income
students, students caring for children, and those with permanent disabilities. When students apply for a student
loan to Student Aid Alberta, they are automatically considered for loans and grants from both the provincial
and federal governments.
In 2015–16, 70,461 full-time students were issued a total of approximately $1 billion in federal and provincial
loans and grants. The number of recipients decreased from 2003–04 to 2007–08, and since then number of
recipients has almost doubled.43
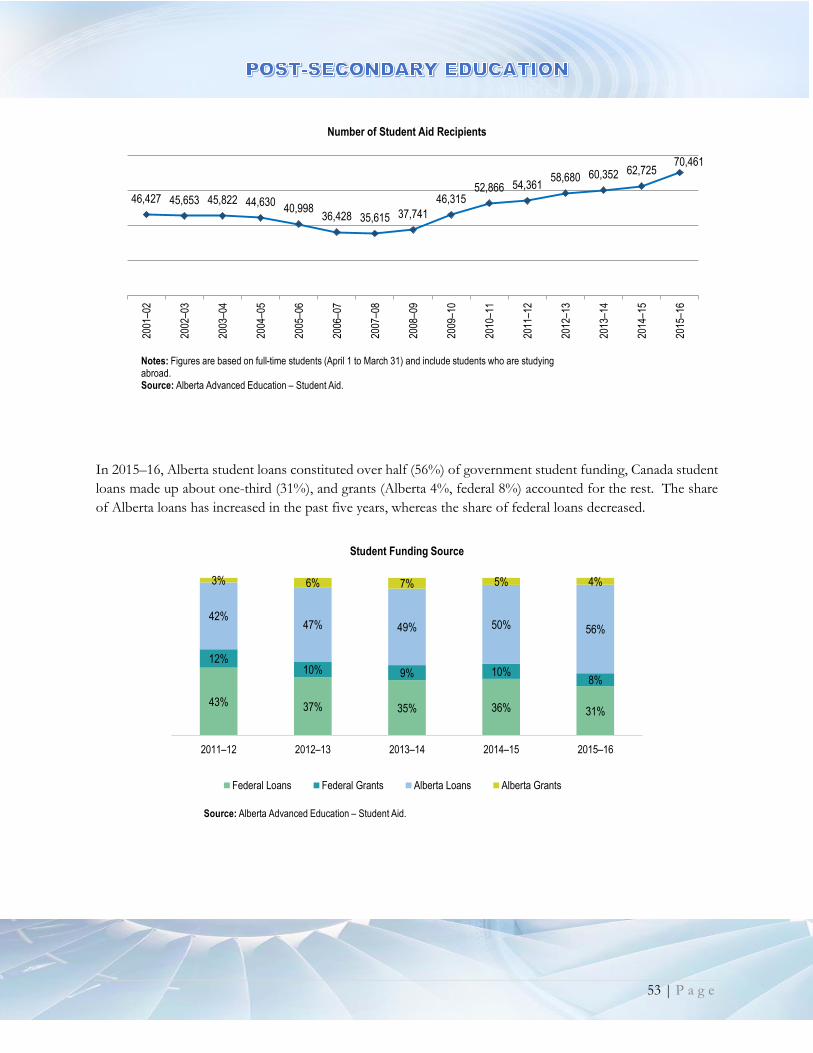
53 | P a g e
In 2015–16, Alberta student loans constituted over half (56%) of government student funding, Canada student
loans made up about one-third (31%), and grants (Alberta 4%, federal 8%) accounted for the rest. The share
of Alberta loans has increased in the past five years, whereas the share of federal loans decreased.
46,427 45,653 45,822 44,63040,998
36,428 35,615 37,741
46,31552,866 54,361
58,680 60,352 62,72570,461
2001
–02
2002
–03
2003
–04
2004
–05
2005
–06
2006
–07
2007
–08
2008
–09
2009
–10
2010
–11
2011
–12
2012
–13
2013
–14
2014
–15
2015
–16
Number of Student Aid Recipients
Notes: Figures are based on full-time students (April 1 to March 31) and include students who are studying abroad.Source: Alberta Advanced Education – Student Aid.
43% 37% 35% 36% 31%
12%10% 9% 10%
8%
42%47% 49% 50% 56%
3% 6% 7% 5% 4%
2011–12 2012–13 2013–14 2014–15 2015–16
Student Funding Source
Federal Loans Federal Grants Alberta Loans Alberta Grants
Source: Alberta Advanced Education – Student Aid.
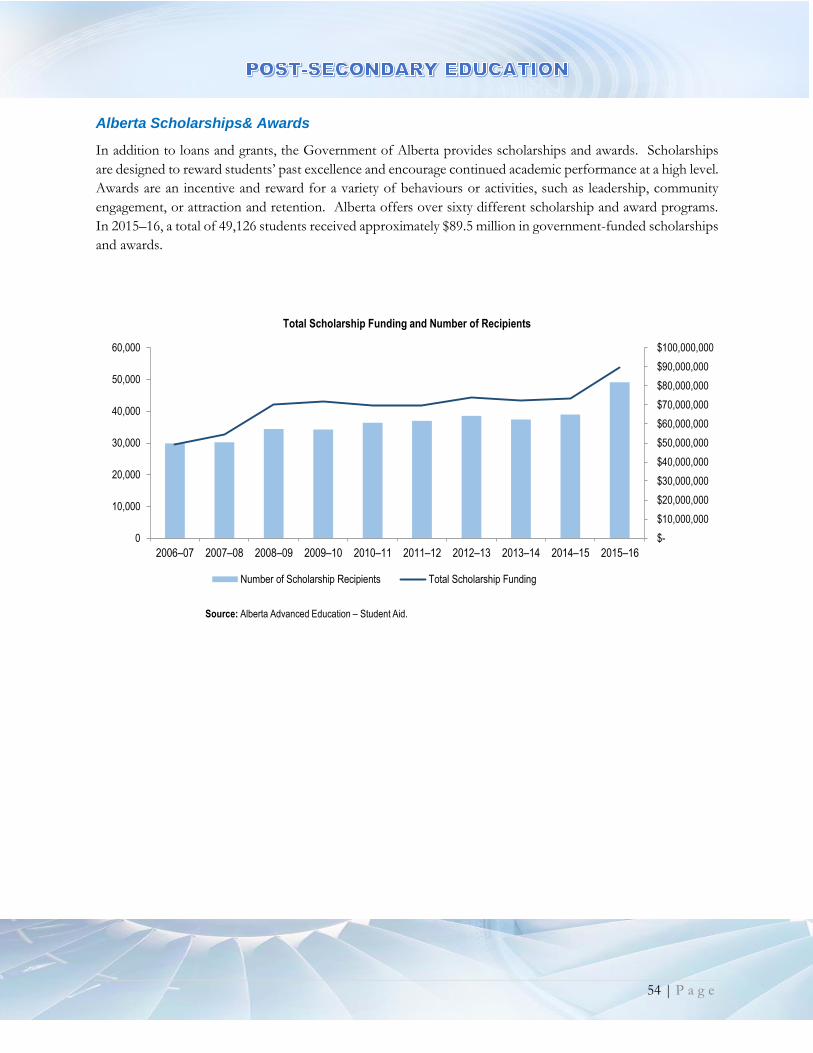
54 | P a g e
Alberta Scholarships& Awards
In addition to loans and grants, the Government of Alberta provides scholarships and awards. Scholarships
are designed to reward students’ past excellence and encourage continued academic performance at a high level.
Awards are an incentive and reward for a variety of behaviours or activities, such as leadership, community
engagement, or attraction and retention. Alberta offers over sixty different scholarship and award programs.
In 2015–16, a total of 49,126 students received approximately $89.5 million in government-funded scholarships
and awards.
$-
$10,000,000
$20,000,000
$30,000,000
$40,000,000
$50,000,000
$60,000,000
$70,000,000
$80,000,000
$90,000,000
$100,000,000
0
10,000
20,000
30,000
40,000
50,000
60,000
2006–07 2007–08 2008–09 2009–10 2010–11 2011–12 2012–13 2013–14 2014–15 2015–16
Total Scholarship Funding and Number of Recipients
Number of Scholarship Recipients Total Scholarship Funding
Source: Alberta Advanced Education – Student Aid.
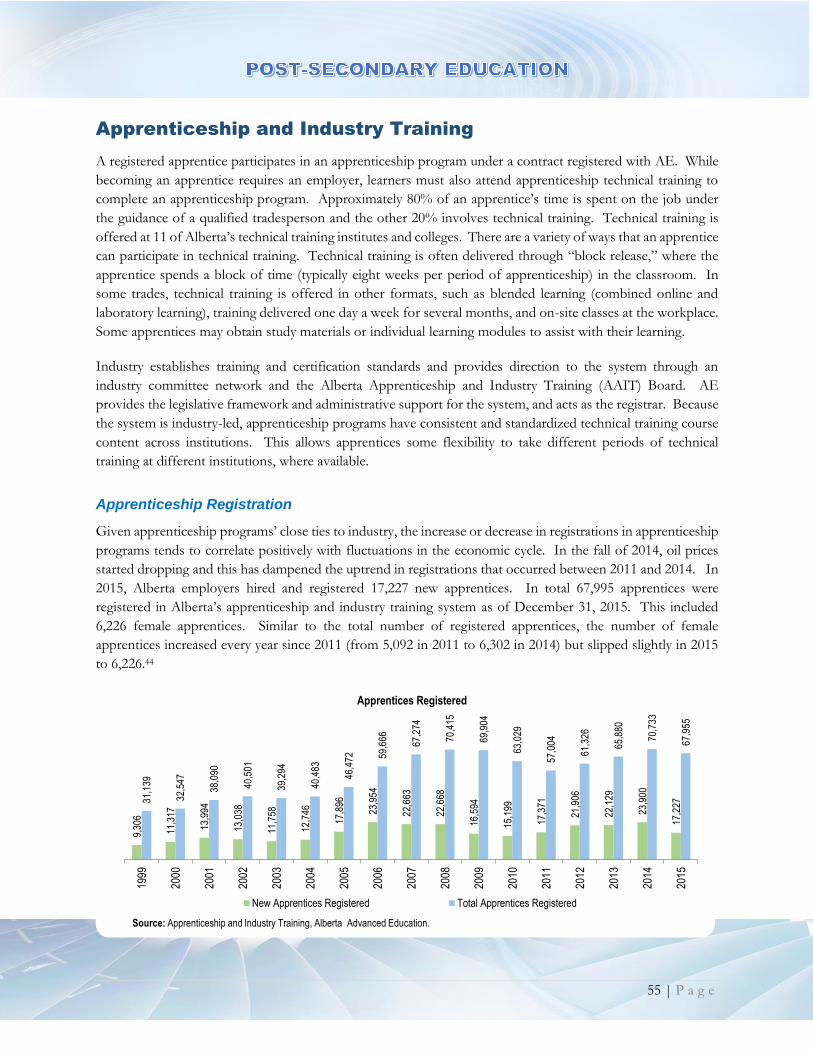
55 | P a g e
Apprenticeship and Industry Training
A registered apprentice participates in an apprenticeship program under a contract registered with AE. While
becoming an apprentice requires an employer, learners must also attend apprenticeship technical training to
complete an apprenticeship program. Approximately 80% of an apprentice’s time is spent on the job under
the guidance of a qualified tradesperson and the other 20% involves technical training. Technical training is
offered at 11 of Alberta’s technical training institutes and colleges. There are a variety of ways that an apprentice
can participate in technical training. Technical training is often delivered through “block release,” where the
apprentice spends a block of time (typically eight weeks per period of apprenticeship) in the classroom. In
some trades, technical training is offered in other formats, such as blended learning (combined online and
laboratory learning), training delivered one day a week for several months, and on-site classes at the workplace.
Some apprentices may obtain study materials or individual learning modules to assist with their learning.
Industry establishes training and certification standards and provides direction to the system through an
industry committee network and the Alberta Apprenticeship and Industry Training (AAIT) Board. AE
provides the legislative framework and administrative support for the system, and acts as the registrar. Because
the system is industry-led, apprenticeship programs have consistent and standardized technical training course
content across institutions. This allows apprentices some flexibility to take different periods of technical
training at different institutions, where available.
Apprenticeship Registration
Given apprenticeship programs’ close ties to industry, the increase or decrease in registrations in apprenticeship
programs tends to correlate positively with fluctuations in the economic cycle. In the fall of 2014, oil prices
started dropping and this has dampened the uptrend in registrations that occurred between 2011 and 2014. In
2015, Alberta employers hired and registered 17,227 new apprentices. In total 67,995 apprentices were
registered in Alberta’s apprenticeship and industry training system as of December 31, 2015. This included
6,226 female apprentices. Similar to the total number of registered apprentices, the number of female
apprentices increased every year since 2011 (from 5,092 in 2011 to 6,302 in 2014) but slipped slightly in 2015
to 6,226.44
9,30
6
11,3
17
13,9
94
13,0
38
11,7
58
12,7
46
17,8
96
23,9
54
22,6
63
22,6
68
16,5
94
15,1
99
17,3
71
21,9
06
22,1
29
23,9
00
17,2
2731,1
39
32,5
47
38,0
90
40,5
01
39,2
94
40,4
83
46,4
72 59,6
66
67,2
74
70,4
15
69,9
04
63,0
29
57,0
04
61,3
26
65,8
80
70,7
33
67,9
55
1999
2000
2001
2002
2003
2004
2005
2006
2007
2008
2009
2010
2011
2012
2013
2014
2015
Apprentices Registered
New Apprentices Registered Total Apprentices Registered
Source: Apprenticeship and Industry Training, Alberta Advanced Education.
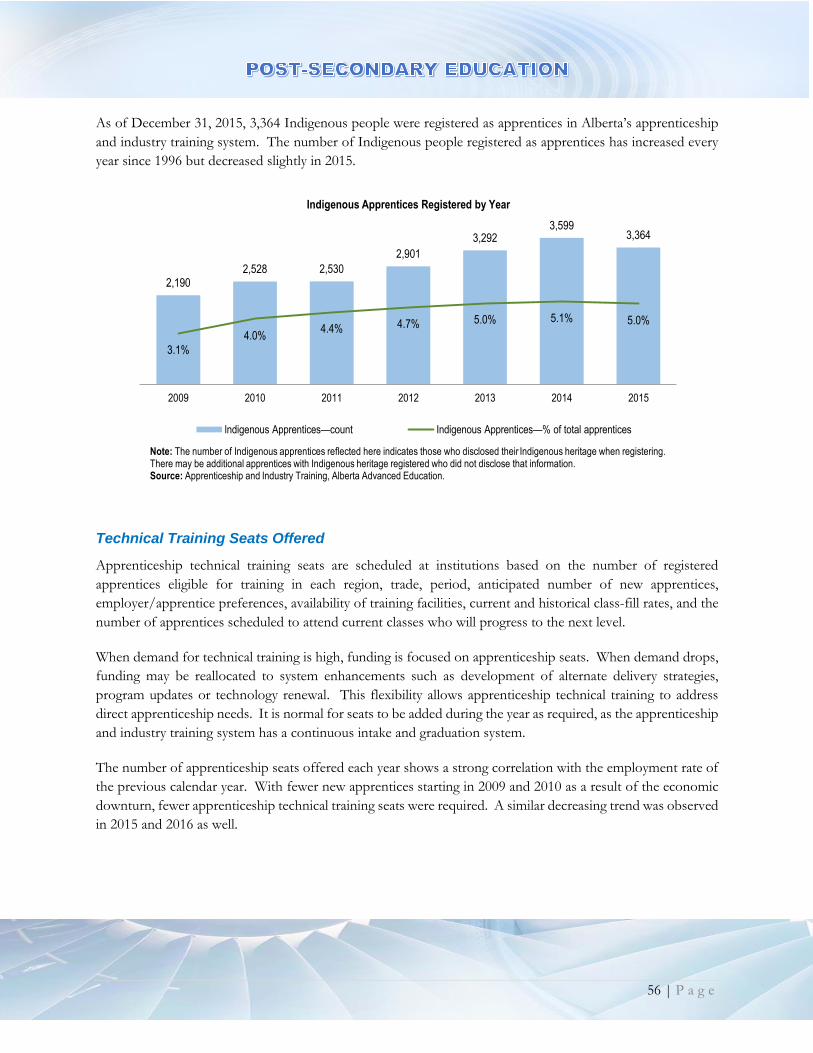
56 | P a g e
As of December 31, 2015, 3,364 Indigenous people were registered as apprentices in Alberta’s apprenticeship
and industry training system. The number of Indigenous people registered as apprentices has increased every
year since 1996 but decreased slightly in 2015.
Technical Training Seats Offered
Apprenticeship technical training seats are scheduled at institutions based on the number of registered
apprentices eligible for training in each region, trade, period, anticipated number of new apprentices,
employer/apprentice preferences, availability of training facilities, current and historical class-fill rates, and the
number of apprentices scheduled to attend current classes who will progress to the next level.
When demand for technical training is high, funding is focused on apprenticeship seats. When demand drops,
funding may be reallocated to system enhancements such as development of alternate delivery strategies,
program updates or technology renewal. This flexibility allows apprenticeship technical training to address
direct apprenticeship needs. It is normal for seats to be added during the year as required, as the apprenticeship
and industry training system has a continuous intake and graduation system.
The number of apprenticeship seats offered each year shows a strong correlation with the employment rate of
the previous calendar year. With fewer new apprentices starting in 2009 and 2010 as a result of the economic
downturn, fewer apprenticeship technical training seats were required. A similar decreasing trend was observed
in 2015 and 2016 as well.
2,1902,528 2,530
2,901
3,2923,599
3,364
3.1%
4.0%4.4% 4.7% 5.0% 5.1% 5.0%
2009 2010 2011 2012 2013 2014 2015
Indigenous Apprentices Registered by Year
lndigenous Apprentices—count Indigenous Apprentices—% of total apprentices
Note: The number of Indigenous apprentices reflected here indicates those who disclosed their Indigenous heritage when registering. There may be additional apprentices with Indigenous heritage registered who did not disclose that information.Source: Apprenticeship and Industry Training, Alberta Advanced Education.

57 | P a g e
A total of 10,681 individuals were certified in Alberta’s designated trades and occupations, including
completed apprentices and individuals issued occupation and qualification certificates in 2015. A cohort of
apprentices who had completed all the requirements for their first period of an apprenticeship program
(including technical training, on-the-job training and period exams) were tracked, and 72% went on to
complete their program within two years past the normally expected completion date or by 2014-15.*
Completion rates were somewhat lower among Indigenous apprentices (61%) and female apprentices
(65%).45
High School Students’ Perceptions of Trades
As part of AE’s 2015-16 survey of high school students, the students who were planning to pursue post-
secondary education or training were asked if they had considered a trade as a career option. Over half (55%)
of these students indicated they had done so. Of those who had considered a trade as a career option, 59%
indicated that they actually planned to pursue a career in a trade.46
The proportion of those who considered a trade as a career option was higher among Indigenous high school
students. In a similar survey conducted among self-identified Indigenous high school students, 66% of the
students who were planning to pursue education or training indicated they had considered a trade as a career
option. Of those who had considered a trade as a career option, 65% indicated that they actually planned to
pursue a career in a trade.47
* The completion rate is based on trade programs that are two, three and four years in length combined. One year trades are excluded.
0
5
10
15
20
25
30
35
40
2001
–02
2002
–03
2003
–04
2004
–05
2005
–06
2006
–07
2007
–08
2008
–09
2009
–10
2010
–11
2011
–12
2012
–13
2013
–14
2014
–15
2015
–16
2016
–17
Th
ou
san
ds
Technical Training Seats Offered by School Year
Notes: Additional apprenticeship seats may be added in-year.Source: Apprenticeship and Industry Training, Alberta Advanced Education.
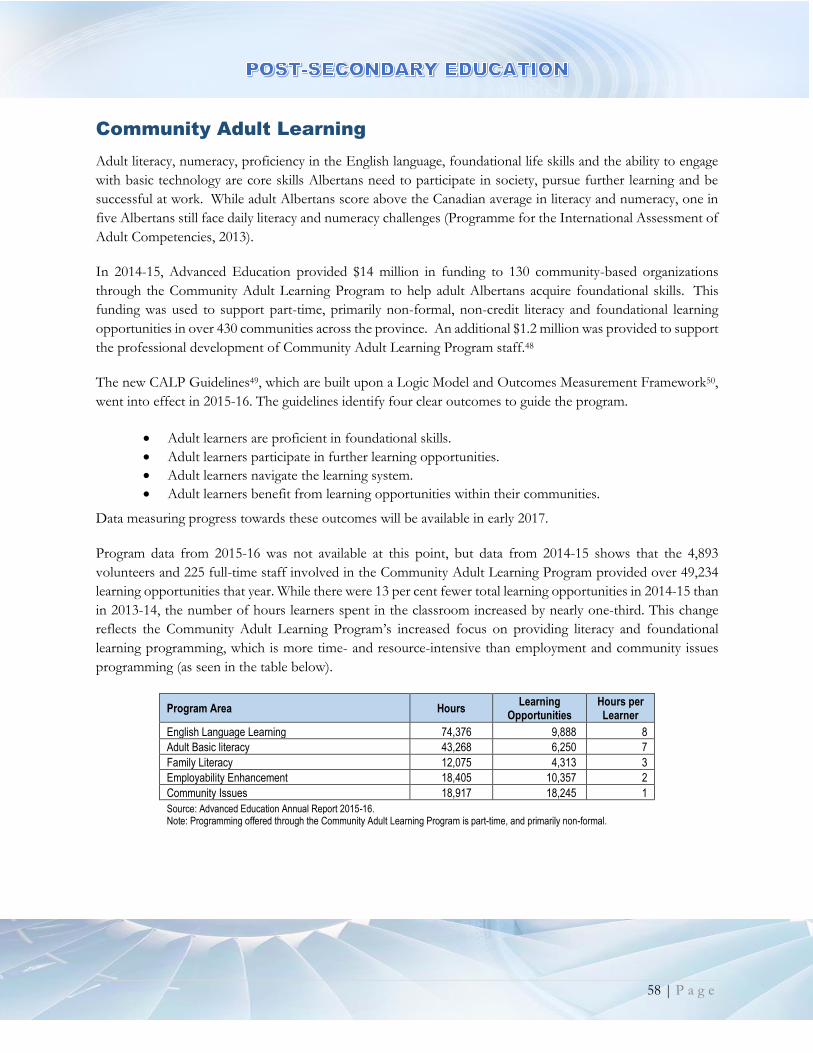
58 | P a g e
Community Adult Learning
Adult literacy, numeracy, proficiency in the English language, foundational life skills and the ability to engage
with basic technology are core skills Albertans need to participate in society, pursue further learning and be
successful at work. While adult Albertans score above the Canadian average in literacy and numeracy, one in
five Albertans still face daily literacy and numeracy challenges (Programme for the International Assessment of
Adult Competencies, 2013).
In 2014-15, Advanced Education provided $14 million in funding to 130 community-based organizations
through the Community Adult Learning Program to help adult Albertans acquire foundational skills. This
funding was used to support part-time, primarily non-formal, non-credit literacy and foundational learning
opportunities in over 430 communities across the province. An additional $1.2 million was provided to support
the professional development of Community Adult Learning Program staff.48
The new CALP Guidelines49, which are built upon a Logic Model and Outcomes Measurement Framework50,
went into effect in 2015-16. The guidelines identify four clear outcomes to guide the program.
Adult learners are proficient in foundational skills.
Adult learners participate in further learning opportunities.
Adult learners navigate the learning system.
Adult learners benefit from learning opportunities within their communities.
Data measuring progress towards these outcomes will be available in early 2017.
Program data from 2015-16 was not available at this point, but data from 2014-15 shows that the 4,893
volunteers and 225 full-time staff involved in the Community Adult Learning Program provided over 49,234
learning opportunities that year. While there were 13 per cent fewer total learning opportunities in 2014-15 than
in 2013-14, the number of hours learners spent in the classroom increased by nearly one-third. This change
reflects the Community Adult Learning Program’s increased focus on providing literacy and foundational
learning programming, which is more time- and resource-intensive than employment and community issues
programming (as seen in the table below).
Program Area Hours Learning
Opportunities Hours per Learner
English Language Learning 74,376 9,888 8
Adult Basic literacy 43,268 6,250 7
Family Literacy 12,075 4,313 3
Employability Enhancement 18,405 10,357 2
Community Issues 18,917 18,245 1
Source: Advanced Education Annual Report 2015-16. Note: Programming offered through the Community Adult Learning Program is part-time, and primarily non-formal.
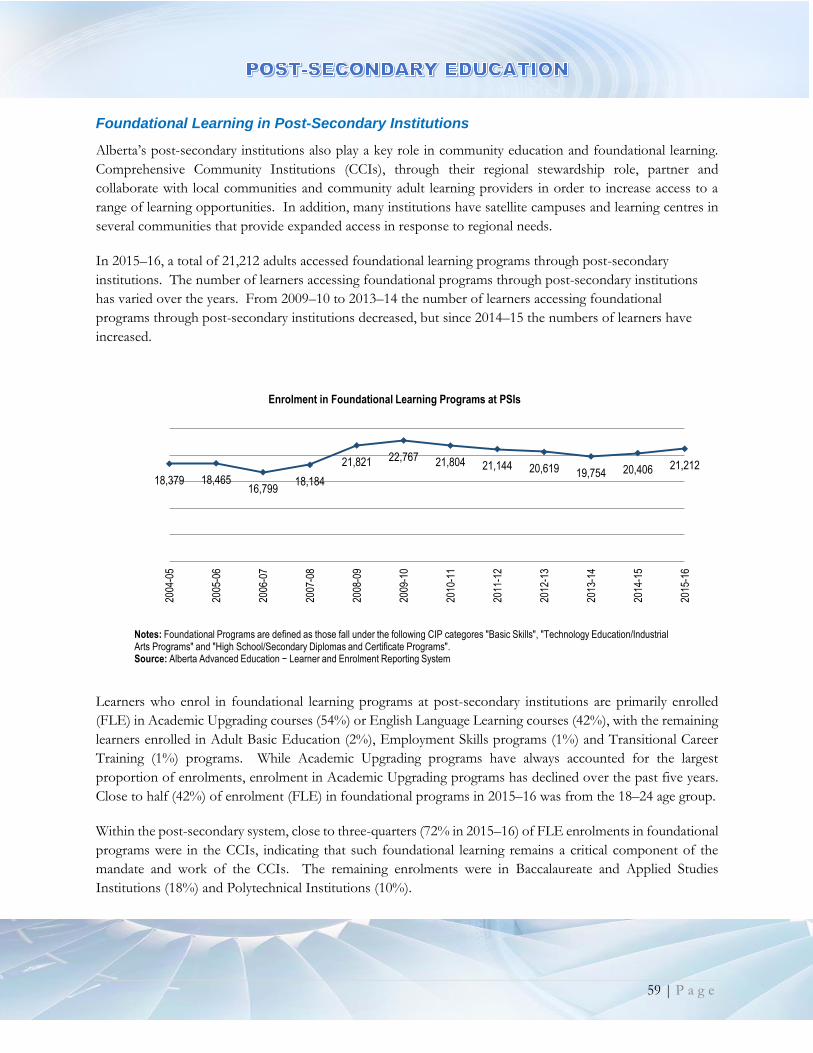
59 | P a g e
Foundational Learning in Post-Secondary Institutions
Alberta’s post-secondary institutions also play a key role in community education and foundational learning.
Comprehensive Community Institutions (CCIs), through their regional stewardship role, partner and
collaborate with local communities and community adult learning providers in order to increase access to a
range of learning opportunities. In addition, many institutions have satellite campuses and learning centres in
several communities that provide expanded access in response to regional needs.
In 2015–16, a total of 21,212 adults accessed foundational learning programs through post-secondary
institutions. The number of learners accessing foundational programs through post-secondary institutions
has varied over the years. From 2009–10 to 2013–14 the number of learners accessing foundational
programs through post-secondary institutions decreased, but since 2014–15 the numbers of learners have
increased.
Learners who enrol in foundational learning programs at post-secondary institutions are primarily enrolled
(FLE) in Academic Upgrading courses (54%) or English Language Learning courses (42%), with the remaining
learners enrolled in Adult Basic Education (2%), Employment Skills programs (1%) and Transitional Career
Training (1%) programs. While Academic Upgrading programs have always accounted for the largest
proportion of enrolments, enrolment in Academic Upgrading programs has declined over the past five years.
Close to half (42%) of enrolment (FLE) in foundational programs in 2015–16 was from the 18–24 age group.
Within the post-secondary system, close to three-quarters (72% in 2015–16) of FLE enrolments in foundational
programs were in the CCIs, indicating that such foundational learning remains a critical component of the
mandate and work of the CCIs. The remaining enrolments were in Baccalaureate and Applied Studies
Institutions (18%) and Polytechnical Institutions (10%).
18,379 18,46516,799
18,184
21,821 22,767 21,804 21,144 20,619 19,754 20,406 21,212
2004
-05
2005
-06
2006
-07
2007
-08
2008
-09
2009
-10
2010
-11
2011
-12
2012
-13
2013
-14
2014
-15
2015
-16
Enrolment in Foundational Learning Programs at PSIs
Notes: Foundational Programs are defined as those fall under the following CIP categores "Basic Skills", "Technology Education/Industrial Arts Programs" and "High School/Secondary Diplomas and Certificate Programs". Source: Alberta Advanced Education − Learner and Enrolment Reporting System
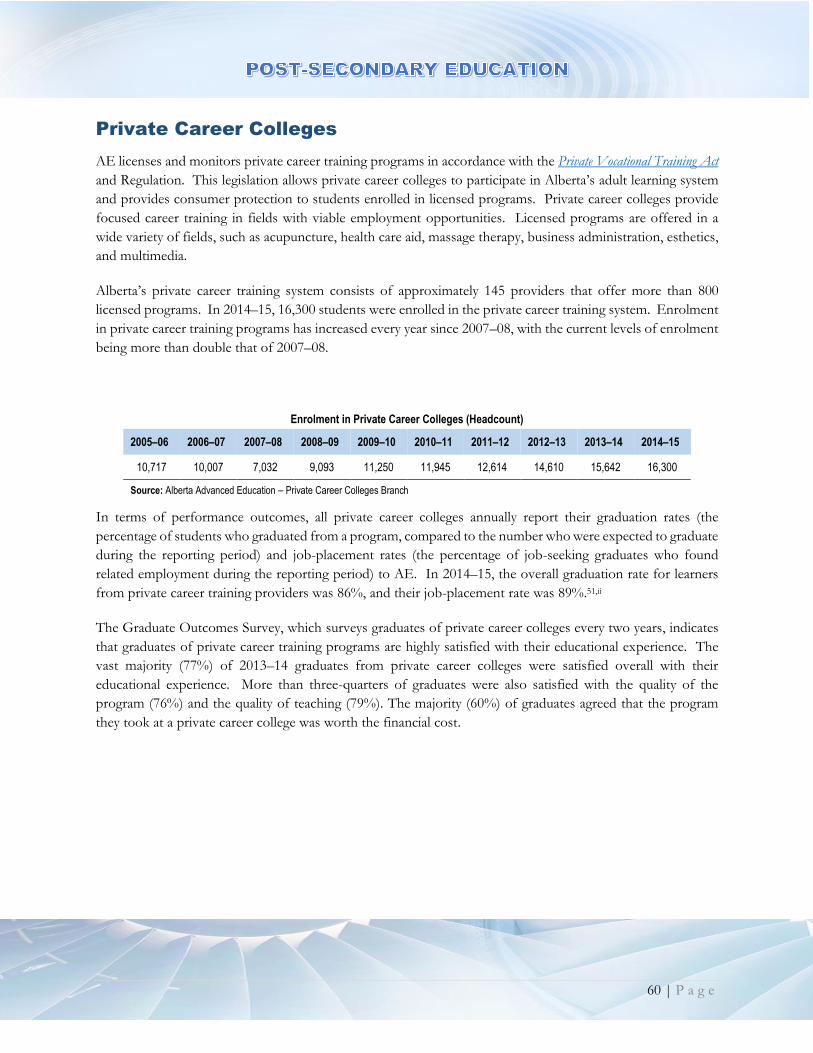
60 | P a g e
Private Career Colleges
AE licenses and monitors private career training programs in accordance with the Private Vocational Training Act
and Regulation. This legislation allows private career colleges to participate in Alberta’s adult learning system
and provides consumer protection to students enrolled in licensed programs. Private career colleges provide
focused career training in fields with viable employment opportunities. Licensed programs are offered in a
wide variety of fields, such as acupuncture, health care aid, massage therapy, business administration, esthetics,
and multimedia.
Alberta’s private career training system consists of approximately 145 providers that offer more than 800
licensed programs. In 2014–15, 16,300 students were enrolled in the private career training system. Enrolment
in private career training programs has increased every year since 2007–08, with the current levels of enrolment
being more than double that of 2007–08.
Enrolment in Private Career Colleges (Headcount)
2005–06 2006–07 2007–08 2008–09 2009–10 2010–11 2011–12 2012–13 2013–14 2014–15
10,717 10,007 7,032 9,093 11,250 11,945 12,614 14,610 15,642 16,300
Source: Alberta Advanced Education – Private Career Colleges Branch
In terms of performance outcomes, all private career colleges annually report their graduation rates (the
percentage of students who graduated from a program, compared to the number who were expected to graduate
during the reporting period) and job-placement rates (the percentage of job-seeking graduates who found
related employment during the reporting period) to AE. In 2014–15, the overall graduation rate for learners
from private career training providers was 86%, and their job-placement rate was 89%.51,ii
The Graduate Outcomes Survey, which surveys graduates of private career colleges every two years, indicates
that graduates of private career training programs are highly satisfied with their educational experience. The
vast majority (77%) of 2013–14 graduates from private career colleges were satisfied overall with their
educational experience. More than three-quarters of graduates were also satisfied with the quality of the
program (76%) and the quality of teaching (79%). The majority (60%) of graduates agreed that the program
they took at a private career college was worth the financial cost.
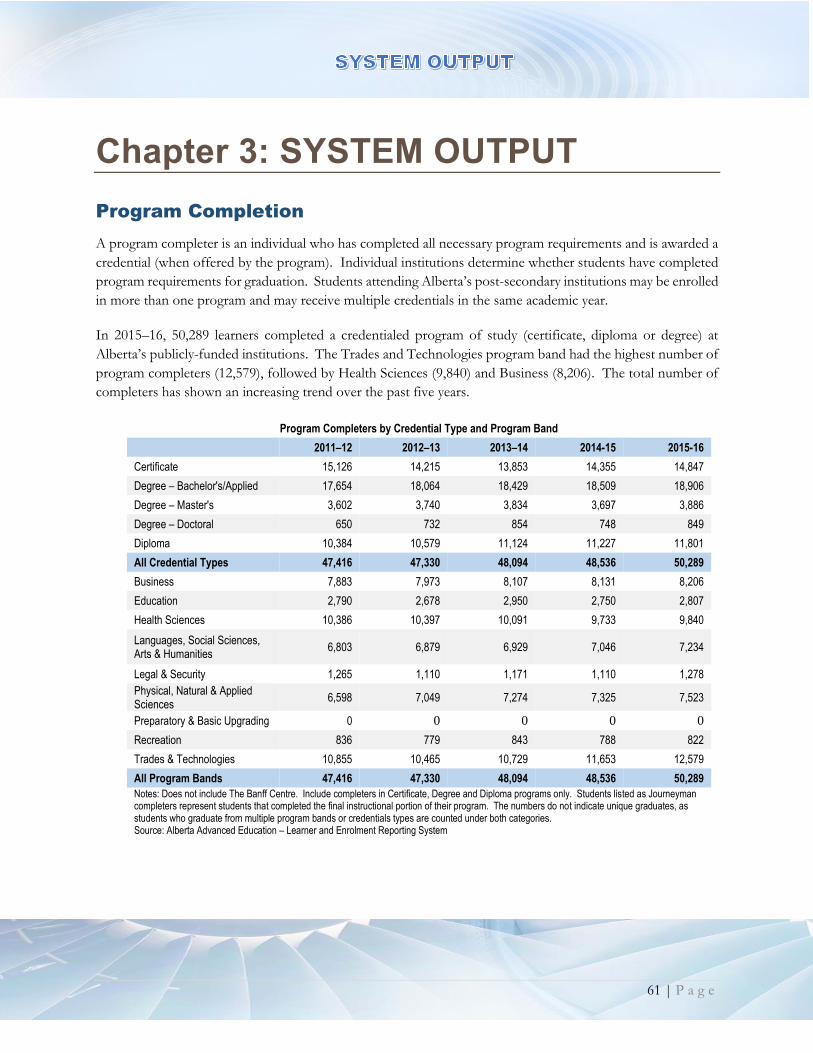
61 | P a g e
Chapter 3: SYSTEM OUTPUT
Program Completion
A program completer is an individual who has completed all necessary program requirements and is awarded a
credential (when offered by the program). Individual institutions determine whether students have completed
program requirements for graduation. Students attending Alberta’s post-secondary institutions may be enrolled
in more than one program and may receive multiple credentials in the same academic year.
In 2015–16, 50,289 learners completed a credentialed program of study (certificate, diploma or degree) at
Alberta’s publicly-funded institutions. The Trades and Technologies program band had the highest number of
program completers (12,579), followed by Health Sciences (9,840) and Business (8,206). The total number of
completers has shown an increasing trend over the past five years.
Program Completers by Credential Type and Program Band
2011–12 2012–13 2013–14 2014-15 2015-16
Certificate 15,126 14,215 13,853 14,355 14,847
Degree – Bachelor's/Applied 17,654 18,064 18,429 18,509 18,906
Degree – Master's 3,602 3,740 3,834 3,697 3,886
Degree – Doctoral 650 732 854 748 849
Diploma 10,384 10,579 11,124 11,227 11,801
All Credential Types 47,416 47,330 48,094 48,536 50,289
Business 7,883 7,973 8,107 8,131 8,206
Education 2,790 2,678 2,950 2,750 2,807
Health Sciences 10,386 10,397 10,091 9,733 9,840
Languages, Social Sciences, Arts & Humanities
6,803 6,879 6,929 7,046 7,234
Legal & Security 1,265 1,110 1,171 1,110 1,278
Physical, Natural & Applied Sciences
6,598 7,049 7,274 7,325 7,523
Preparatory & Basic Upgrading 0 0 0 0 0
Recreation 836 779 843 788 822
Trades & Technologies 10,855 10,465 10,729 11,653 12,579
All Program Bands 47,416 47,330 48,094 48,536 50,289
Notes: Does not include The Banff Centre. Include completers in Certificate, Degree and Diploma programs only. Students listed as Journeyman completers represent students that completed the final instructional portion of their program. The numbers do not indicate unique graduates, as students who graduate from multiple program bands or credentials types are counted under both categories. Source: Alberta Advanced Education – Learner and Enrolment Reporting System
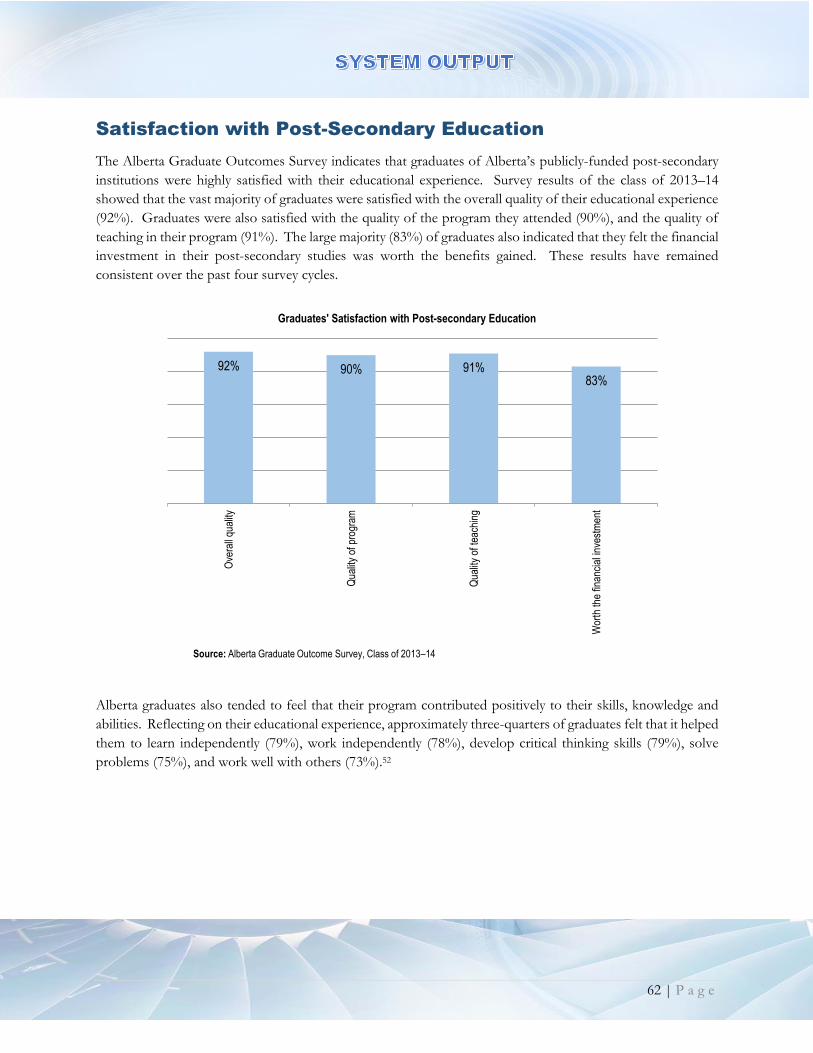
62 | P a g e
Satisfaction with Post-Secondary Education
The Alberta Graduate Outcomes Survey indicates that graduates of Alberta’s publicly-funded post-secondary
institutions were highly satisfied with their educational experience. Survey results of the class of 2013–14
showed that the vast majority of graduates were satisfied with the overall quality of their educational experience
(92%). Graduates were also satisfied with the quality of the program they attended (90%), and the quality of
teaching in their program (91%). The large majority (83%) of graduates also indicated that they felt the financial
investment in their post-secondary studies was worth the benefits gained. These results have remained
consistent over the past four survey cycles.
Alberta graduates also tended to feel that their program contributed positively to their skills, knowledge and
abilities. Reflecting on their educational experience, approximately three-quarters of graduates felt that it helped
them to learn independently (79%), work independently (78%), develop critical thinking skills (79%), solve
problems (75%), and work well with others (73%).52
92% 90% 91%83%
Ove
rall
qual
ity
Qua
lity
of p
rogr
am
Qua
lity
of te
achi
ng
Wor
th th
e fin
anci
al in
vest
men
t
Graduates' Satisfaction with Post-secondary Education
Source: Alberta Graduate Outcome Survey, Class of 2013–14
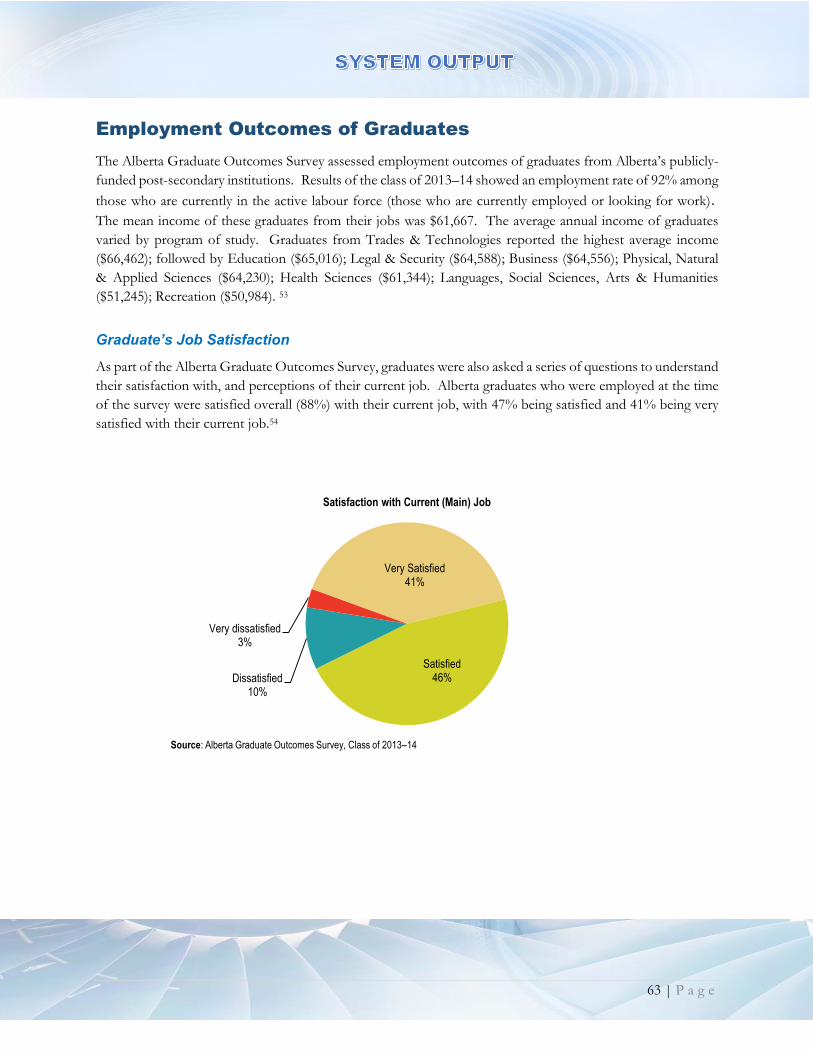
63 | P a g e
Employment Outcomes of Graduates
The Alberta Graduate Outcomes Survey assessed employment outcomes of graduates from Alberta’s publicly-
funded post-secondary institutions. Results of the class of 2013–14 showed an employment rate of 92% among
those who are currently in the active labour force (those who are currently employed or looking for work).
The mean income of these graduates from their jobs was $61,667. The average annual income of graduates
varied by program of study. Graduates from Trades & Technologies reported the highest average income
($66,462); followed by Education ($65,016); Legal & Security ($64,588); Business ($64,556); Physical, Natural
& Applied Sciences ($64,230); Health Sciences ($61,344); Languages, Social Sciences, Arts & Humanities
($51,245); Recreation ($50,984). 53
Graduate’s Job Satisfaction
As part of the Alberta Graduate Outcomes Survey, graduates were also asked a series of questions to understand
their satisfaction with, and perceptions of their current job. Alberta graduates who were employed at the time
of the survey were satisfied overall (88%) with their current job, with 47% being satisfied and 41% being very
satisfied with their current job.54
Very Satisfied41%
Satisfied46%Dissatisfied
10%
Very dissatisfied3%
Satisfaction with Current (Main) Job
Source: Alberta Graduate Outcomes Survey, Class of 2013–14
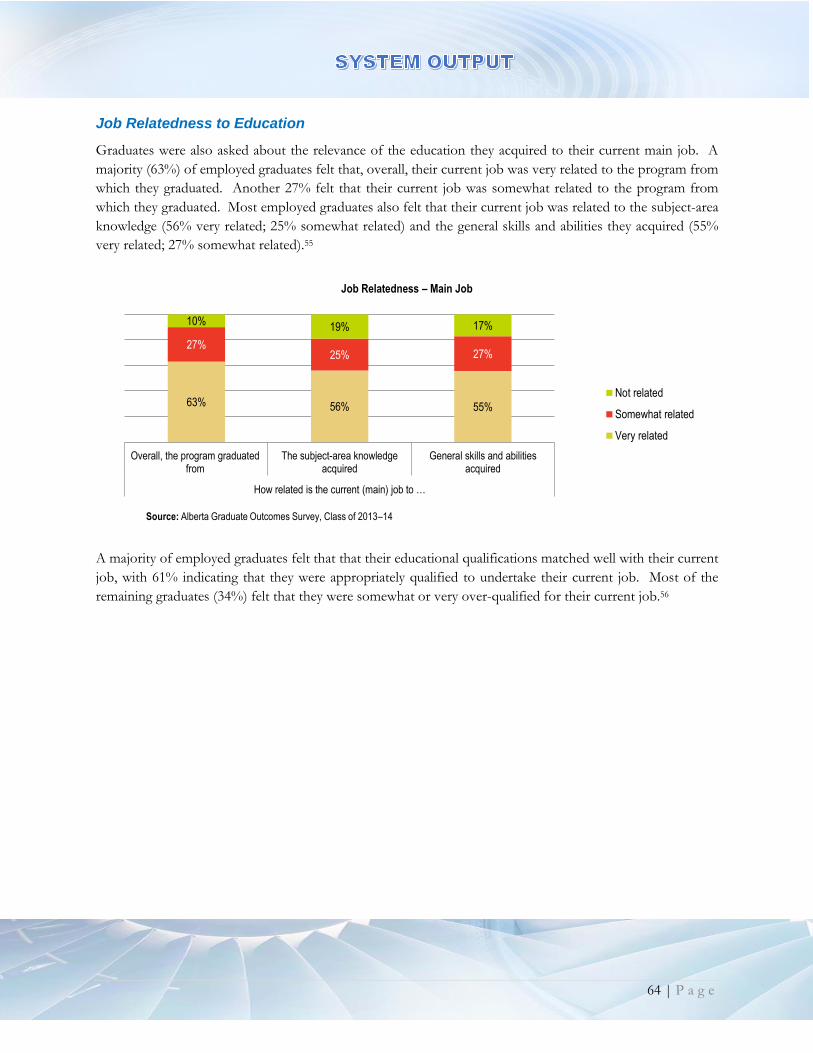
64 | P a g e
Job Relatedness to Education
Graduates were also asked about the relevance of the education they acquired to their current main job. A
majority (63%) of employed graduates felt that, overall, their current job was very related to the program from
which they graduated. Another 27% felt that their current job was somewhat related to the program from
which they graduated. Most employed graduates also felt that their current job was related to the subject-area
knowledge (56% very related; 25% somewhat related) and the general skills and abilities they acquired (55%
very related; 27% somewhat related).55
A majority of employed graduates felt that that their educational qualifications matched well with their current
job, with 61% indicating that they were appropriately qualified to undertake their current job. Most of the
remaining graduates (34%) felt that they were somewhat or very over-qualified for their current job.56
63% 56% 55%
27%25% 27%
10%19% 17%
Overall, the program graduatedfrom
The subject-area knowledgeacquired
General skills and abilitiesacquired
How related is the current (main) job to …
Job Relatedness – Main Job
Not related
Somewhat related
Very related
Source: Alberta Graduate Outcomes Survey, Class of 2013–14

65 | P a g e
APPENDICES
66 | P a g e
Appendix A: Methodological Notes
A1. Population Projections
At the Alberta and Census Division (CD) level, projected population data are sourced from Alberta Treasury Board and
Finance. The base population for these projections is Statistics Canada’s July 1, 2013 postcensal estimate. This estimate is
based on the 2011 Census of Population adjusted for net under coverage and incompletely enumerated Indian reserves. The
population estimates, as well as the projections, include only the resident population, as defined by the census. Hence, an
individual must be usually living in an area to be considered a resident. Usual residents include non-permanent residents
(NPRs), but not ‘shadow’ populations, since these people have a usual residence elsewhere and are enumerated by Statistics
Canada in the census as residents of other jurisdictions.
Alberta is composed of 19 Census Divisions (CDs), each containing a number of smaller Dissemination Blocks (DBs). Data
is available by DB for census years and by CD for non-census years. Alberta Treasury Board and Finance produces three
population projections by CD using low-, medium-, and high-growth scenarios. Data presented here are sourced from the
medium-growth scenario, which represents the most likely case. The component projection approach takes the base
population categorized by age and by sex, and applies fertility rates, mortality rates, and migration to project the number of
births, deaths, and migrants per year. These three components are either added or subtracted from the base population to
obtain the projected population for the subsequent years. Provincial-level population projections are derived by summing the
CD-level projections.lvii
Population projections by service region are derived separately from the provincial projection. Unlike CDs, DBs fit neatly into
geographic service region boundaries. Since DB-level data are only available in census years, each CD is weighted according
to the proportion of its population falling in a particular service region and matched to the DBs within that region.
For example, the Medicine Hat region includes parts of three CDs (100% of CD1, 15% of CD2, and 34% of CD4). To derive
the Medicine Hat region’s population from these three CDs, the population of CD1 is multiplied by 1 because it contains
100% of that CD. The population of CD2 is multiplied by 0.15, and the population of CD4 by 0.34. The three derived figures
are then summed to determine the overall regional population. These calculations are then projected forward using Alberta
Treasury Board and Finance’s medium-term growth scenario.
67 | P a g e
A2. Program Bands
Program bands are based on the Classification of Instructional Programs (CIP) 2011 categories. CIP 2011 is designed to
classify instructional programs; and aims to provide a sound basis for grouping similar types of programs and support the
accurate tracking, monitoring, and evaluation of programs and completions. Program bands are designed to make data analysis
and the communication and presentation of data easier by categorizing CIP 2011 into nine higher-level groupings.
In collaboration with Statistics Canada, AE reviewed CIP 2011 codes for all programs and specializations. Some programs
and specializations’ CIP codes were revised to more accurately reflect academic content. As a result of this review, some codes
have been adjusted. Data provided at the CIP code or program band level may not reconcile with data presented in previous
iterations.
Program Band CIP 2011 Program Band CIP 2011
Business Business, management, marketing and related support services Legal & Security
Legal professions and studies
Security and protective services
Education Education
Trades & Technologies
Personal and culinary services
Engineering technologies and engineering-related fields
Science technologies/technicians
Construction trades
Mechanic and repair technologies/technicians
Precision production
Transportation and materials moving
Health Sciences
Health-related knowledge and skills (not for credit)
Psychology
Health professions and related programs
Dental, medical and veterinary residency programs
Languages, Social Sciences, Arts & Humanities
Area, ethnic, cultural, gender, and group studies
Communication, journalism and related programs
Aboriginal and foreign languages, literatures and linguistics
Family and consumer sciences/human sciences
English language and literature/letters
Liberal arts and sciences, general studies and humanities
Library science
Philosophy and religious studies
Theology and religious vocations
Public administration and social service professions
Social sciences
Visual and performing arts
History
French language and literature/letters
Physical, Natural & Applied Sciences
Agriculture, agriculture operations and related sciences
Natural resources and conservation
Architecture and related services
Communications technologies/technicians and support services
Computer and information sciences and support services
Engineering
Biological and biomedical sciences
Mathematics and statistics
Military science, leadership and operational art
Military Technologies
Multidisciplinary/interdisciplinary studies
Physical sciences
Recreation
Parks, recreation, leisure and fitness studies
Citizenship activities (not for credit)
Leisure and recreational activities (not for credit)
Personal awareness and self-improvement (not for credit)
Preparatory & Basic Upgrading
Pre-technology education/pre-industrial arts programs
Basic skills (not for credit)
Interpersonal and social skills (not for credit)
High school/secondary diploma and certificate programs
68 | P a g e
A3. Enrolment
Headcount Enrolment
The unique student headcount measure is a method of counting enrolment that refers to the actual number of unique students
registered at and attending a publicly-funded post-secondary institution in Alberta (full- and part-time) in a given academic
year.
To address the issue of double counting, the unique student headcount methodology uses the Alberta Student Number (ASN),
rather than the institutional student identification number, as the means of identifying students. For the past decade, institutions
have used the ASN to report enrolment data to AE via LERS. All students in Alberta should be assigned a unique ASN that
travels with them, regardless of the post-secondary institutions they attend through the course of their life. As a unique
identifier that travels with the learner, the ASN enables analyses that removes duplicate student counts among institutions.
In some cases, students are not assigned an ASN. For those student records without an ASN, institution-specific values were
used. Because the methodology removes double counting, subtotals and system values for this measure will not be equal to
the sum of the corresponding institutional totals, as a student may have attended more than one institution. In other words, it
will not be possible to add up institutional totals to arrive at a summary value, as adding each institutional total may lead to
double counting. The value listed for each institution represents the unique headcount at that particular institution, while the
value listed for the system total represents the number of unique headcount across the whole system.
Banff Centre Enrolments
In 2009–10, the Banff Centre began reporting enrolments using an updated full-load equivalent (FLE) calculation. Factors
used for calculating FLE enrolment were reviewed and adjusted for the 2009–10 academic year forward. This adjustment
resulted in a significantly higher FLE in 2009–10, independent of enrolments.
Apprenticeship Data
At a system level, registered apprentices are included in all enrolment data. Due to the nature of apprenticeship programs,
where 80% of the training is provided on the job and 20% is technical training provided in class, only the in-class component
is included in the LERS enrolment data. There are also differences in how apprenticeship technical training enrolments are
reflected as headcounts compared to FLEs. In terms of headcount enrolment data, apprentices are counted in the same way
as everyone else (one person equals one count). In terms of FLE data, one FLE roughly equates to just over four students
enrolled in apprenticeship programming.

69 | P a g e
Source: Alberta Treasury Board and Finance, Alberta Advanced Education, 2015
Appendix B: Data Tables
Population by Service Region, All Ages
Calgary Central Edmonton Grande Prairie Keyano
2015 2025 2015 2025 2015 2025 2015 2025 2015 2025
Age 0 - 4 98,914 106,008 22,316 23,825 94,869 102,256 12,248 11,536 6,221 5,720
Age 5 - 9 95,012 110,994 21,026 24,630 89,772 105,650 11,376 12,455 5,049 6,515
Age 10 - 14 84,362 107,679 19,359 23,999 79,911 103,283 9,783 12,313 3,763 6,250
Age 15 - 19 87,493 108,203 20,244 23,999 85,484 106,636 10,081 11,799 3,745 5,330
Age 20 - 24 103,073 106,890 22,362 22,086 108,977 106,920 11,912 10,769 6,216 5,230
Age 25 -29 127,965 114,961 23,847 23,077 131,975 112,673 13,443 10,903 9,904 5,620
Age 30 - 34 142,852 127,266 25,442 25,049 133,890 128,014 14,201 12,213 9,752 7,200
Age 35 - 39 129,177 146,602 22,990 26,443 115,459 146,027 12,018 13,454 7,824 8,570
Age 40 - 44 119,321 155,563 21,029 27,300 101,806 145,083 10,766 13,915 6,342 7,860
Age 45 - 49 109,506 135,240 20,325 23,838 97,470 121,839 9,799 11,395 5,728 6,300
Age 50 - 54 111,380 119,776 24,068 21,276 106,761 102,979 11,245 9,991 5,552 5,455
Age 55 - 59 103,446 107,448 22,724 20,400 100,606 95,861 10,370 9,136 4,979 4,805
Age 60 - 64 80,571 107,882 18,177 23,579 81,961 102,870 7,915 10,567 2,787 4,165
Age 65 - 69 60,311 98,321 14,048 21,434 62,979 94,522 5,547 9,516 1,270 2,980
Age 70 - 74 39,097 73,724 9,598 16,116 42,150 73,421 3,694 6,713 503 1,505
Age 75 - 79 27,518 51,537 7,155 11,426 31,154 52,565 2,582 4,235 235 980
Age 80 + 41,227 57,610 10,515 14,004 47,445 63,449 3,823 5,134 220 575
Lakeland Lethbridge Medicine Hat Northern Lakes Portage
2015 2025 2015 2025 2015 2025 2015 2025 2015 2025
Age 0 - 4 5,061 5,137 14,589 14,774 7,455 7,510 7,848 8,279 6,735 6,215
Age 5 - 9 5,030 5,327 13,661 16,033 7,302 8,120 7,277 8,308 6,043 6,223
Age 10 - 14 4,876 5,277 12,311 15,447 6,842 6,842 6,445 6,445 5,411 6,347
Age 15 - 19 5,161 4,989 12,899 14,923 7,039 7,911 6,392 6,788 5,709 5,968
Age 20 - 24 5,156 4,647 14,540 13,876 7,545 7,531 6,631 6,222 6,020 5,424
Age 25 -29 4,489 4,999 15,290 13,582 7,902 7,535 5,779 6,390 5,708 5,440
Age 30 - 34 4,985 5,233 14,279 14,105 8,219 7,857 5,878 6,529 6,130 5,444
Age 35 - 39 4,842 4,631 12,892 15,241 7,532 8,293 5,449 5,130 5,405 5,135
Age 40 - 44 4,609 4,943 11,466 14,898 6,814 8,568 5,258 4,733 4,900 5,821
Age 45 - 49 4,814 4,639 11,190 13,341 6,796 7,670 4,899 4,517 4,935 5,310
Age 50 - 54 5,939 4,403 13,194 11,729 8,068 6,873 5,417 4,654 5,958 4,813
Age 55 - 59 5,828 4,692 13,018 11,305 8,100 6,759 4,638 4,279 5,163 4,702
Age 60 - 64 4,840 5,770 11,304 12,863 6,799 7,852 3,682 4,679 3,964 5,538
Age 65 - 69 3,995 5,489 9,454 12,340 5,351 7,679 2,898 3,927 3,069 4,672
Age 70 - 74 2,882 4,189 7,027 10,177 4,011 6,102 2,037 2,932 2,253 3,426
Age 75 - 79 2,250 3,065 5,221 7,939 2,988 4,437 1,385 2,052 1,669 2,465
Age 80 + 3,516 3,862 7,711 9,648 4,746 5,536 1,521 2,223 2,111 2,823
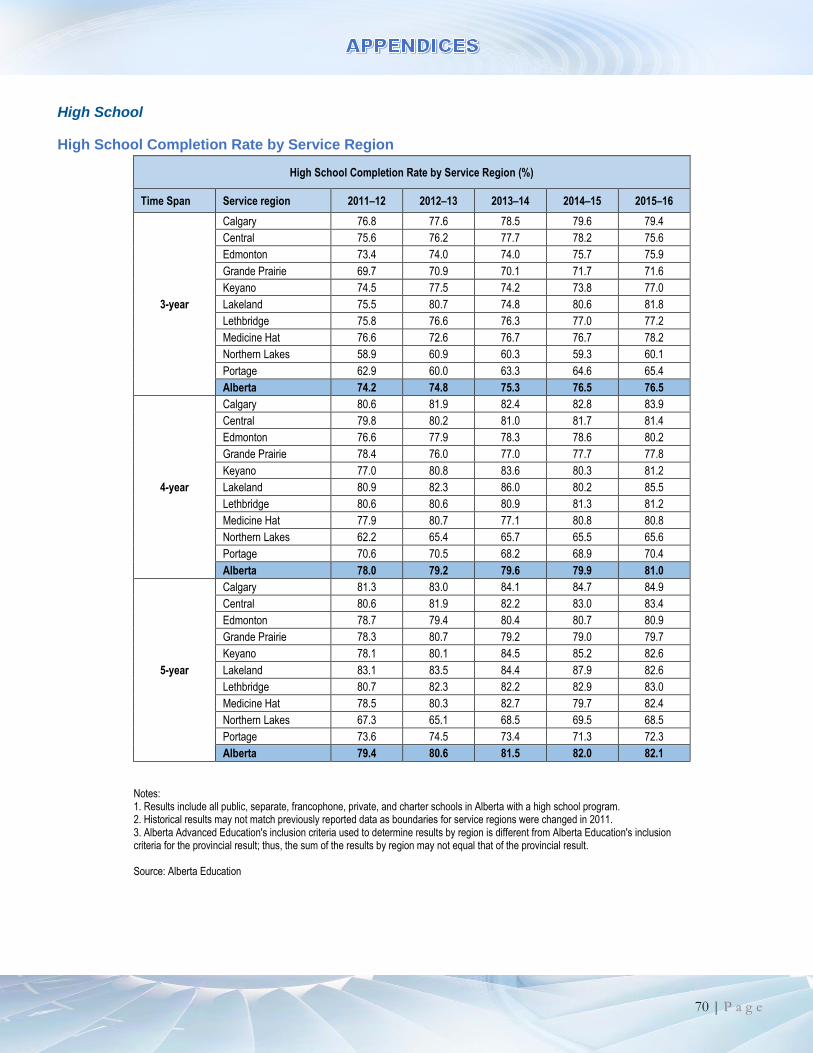
70 | P a g e
High School
High School Completion Rate by Service Region
High School Completion Rate by Service Region (%)
Time Span Service region 2011–12 2012–13 2013–14 2014–15 2015–16
3-year
Calgary 76.8 77.6 78.5 79.6 79.4
Central 75.6 76.2 77.7 78.2 75.6
Edmonton 73.4 74.0 74.0 75.7 75.9
Grande Prairie 69.7 70.9 70.1 71.7 71.6
Keyano 74.5 77.5 74.2 73.8 77.0
Lakeland 75.5 80.7 74.8 80.6 81.8
Lethbridge 75.8 76.6 76.3 77.0 77.2
Medicine Hat 76.6 72.6 76.7 76.7 78.2
Northern Lakes 58.9 60.9 60.3 59.3 60.1
Portage 62.9 60.0 63.3 64.6 65.4
Alberta 74.2 74.8 75.3 76.5 76.5
4-year
Calgary 80.6 81.9 82.4 82.8 83.9
Central 79.8 80.2 81.0 81.7 81.4
Edmonton 76.6 77.9 78.3 78.6 80.2
Grande Prairie 78.4 76.0 77.0 77.7 77.8
Keyano 77.0 80.8 83.6 80.3 81.2
Lakeland 80.9 82.3 86.0 80.2 85.5
Lethbridge 80.6 80.6 80.9 81.3 81.2
Medicine Hat 77.9 80.7 77.1 80.8 80.8
Northern Lakes 62.2 65.4 65.7 65.5 65.6
Portage 70.6 70.5 68.2 68.9 70.4
Alberta 78.0 79.2 79.6 79.9 81.0
5-year
Calgary 81.3 83.0 84.1 84.7 84.9
Central 80.6 81.9 82.2 83.0 83.4
Edmonton 78.7 79.4 80.4 80.7 80.9
Grande Prairie 78.3 80.7 79.2 79.0 79.7
Keyano 78.1 80.1 84.5 85.2 82.6
Lakeland 83.1 83.5 84.4 87.9 82.6
Lethbridge 80.7 82.3 82.2 82.9 83.0
Medicine Hat 78.5 80.3 82.7 79.7 82.4
Northern Lakes 67.3 65.1 68.5 69.5 68.5
Portage 73.6 74.5 73.4 71.3 72.3
Alberta 79.4 80.6 81.5 82.0 82.1
Notes: 1. Results include all public, separate, francophone, private, and charter schools in Alberta with a high school program. 2. Historical results may not match previously reported data as boundaries for service regions were changed in 2011. 3. Alberta Advanced Education's inclusion criteria used to determine results by region is different from Alberta Education's inclusion criteria for the provincial result; thus, the sum of the results by region may not equal that of the provincial result. Source: Alberta Education

71 | P a g e
Number of High School Students Enrolled in Grade 10,11 and 12 by Region
High School Enrolment by Service Region, 2014-15
Service region Grade 10 Grade 11 Grade 12 Total
Calgary 17,534 17,257 22,479 57,270
Central 4,100 3,995 4,938 13,033
Edmonton 16,790 17,287 28,375 62,452
Grande Prairie 1,811 1,742 2,439 5,992
Keyano 763 729 928 2,420
Lakeland 1,185 1,118 1,111 3,414
Lethbridge 2,489 2,350 2,778 7,617
Medicine Hat 1,442 1,397 1,721 4,560
Northern Lakes 1,545 1,387 1,363 4,295
Portage 1,508 1,347 1,689 4,544
Alberta 49,167 48,609 67,821 165,597
Notes: Results include students in public, separate, francophone, charter, and private schools. Lloydminster schools located in Alberta were included in the count. Source: Alberta Education (http://education.alberta.ca/department/stats/students.aspx).
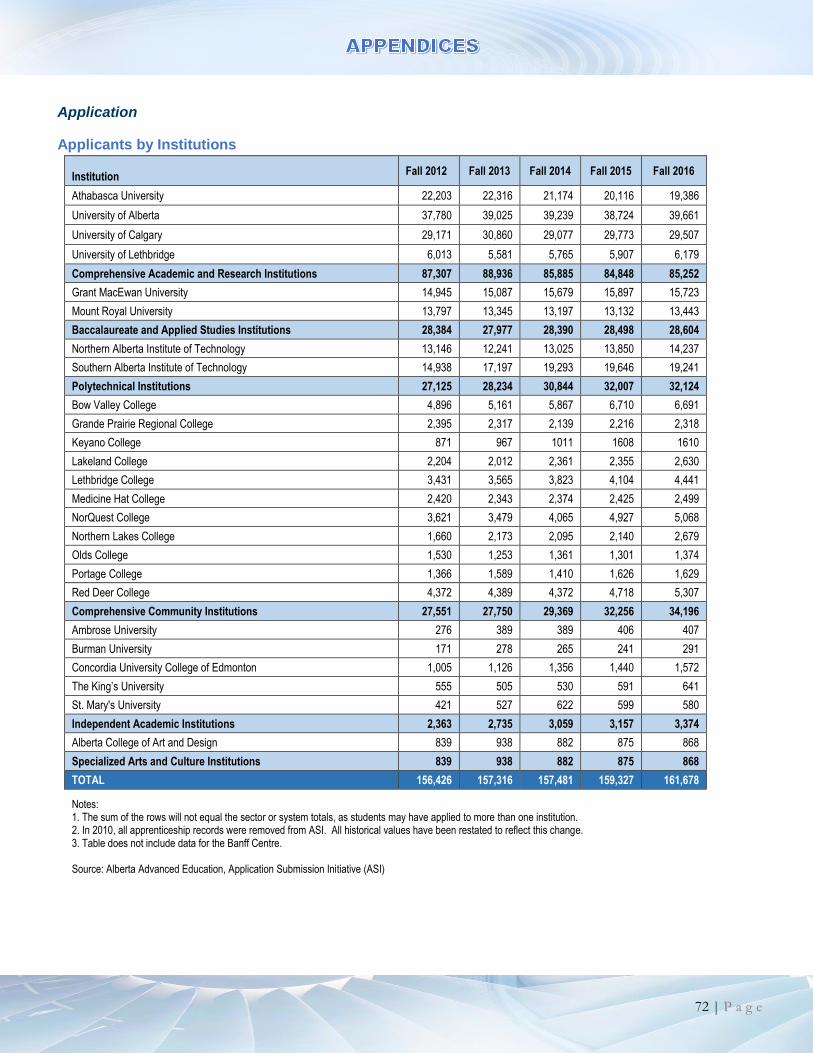
72 | P a g e
Application
Applicants by Institutions
Institution Fall 2012 Fall 2013 Fall 2014 Fall 2015 Fall 2016
Athabasca University 22,203 22,316 21,174 20,116 19,386
University of Alberta 37,780 39,025 39,239 38,724 39,661
University of Calgary 29,171 30,860 29,077 29,773 29,507
University of Lethbridge 6,013 5,581 5,765 5,907 6,179
Comprehensive Academic and Research Institutions 87,307 88,936 85,885 84,848 85,252
Grant MacEwan University 14,945 15,087 15,679 15,897 15,723
Mount Royal University 13,797 13,345 13,197 13,132 13,443
Baccalaureate and Applied Studies Institutions 28,384 27,977 28,390 28,498 28,604
Northern Alberta Institute of Technology 13,146 12,241 13,025 13,850 14,237
Southern Alberta Institute of Technology 14,938 17,197 19,293 19,646 19,241
Polytechnical Institutions 27,125 28,234 30,844 32,007 32,124
Bow Valley College 4,896 5,161 5,867 6,710 6,691
Grande Prairie Regional College 2,395 2,317 2,139 2,216 2,318
Keyano College 871 967 1011 1608 1610
Lakeland College 2,204 2,012 2,361 2,355 2,630
Lethbridge College 3,431 3,565 3,823 4,104 4,441
Medicine Hat College 2,420 2,343 2,374 2,425 2,499
NorQuest College 3,621 3,479 4,065 4,927 5,068
Northern Lakes College 1,660 2,173 2,095 2,140 2,679
Olds College 1,530 1,253 1,361 1,301 1,374
Portage College 1,366 1,589 1,410 1,626 1,629
Red Deer College 4,372 4,389 4,372 4,718 5,307
Comprehensive Community Institutions 27,551 27,750 29,369 32,256 34,196
Ambrose University 276 389 389 406 407
Burman University 171 278 265 241 291
Concordia University College of Edmonton 1,005 1,126 1,356 1,440 1,572
The King’s University 555 505 530 591 641
St. Mary's University 421 527 622 599 580
Independent Academic Institutions 2,363 2,735 3,059 3,157 3,374
Alberta College of Art and Design 839 938 882 875 868
Specialized Arts and Culture Institutions 839 938 882 875 868
TOTAL 156,426 157,316 157,481 159,327 161,678
Notes: 1. The sum of the rows will not equal the sector or system totals, as students may have applied to more than one institution. 2. In 2010, all apprenticeship records were removed from ASI. All historical values have been restated to reflect this change. 3. Table does not include data for the Banff Centre. Source: Alberta Advanced Education, Application Submission Initiative (ASI)

73 | P a g e
Applicants by Region
Total Applicants
Service Area Fall 2012 Fall 2013 Fall 2014 Fall 2015 Fall 2016 A
lber
ta
Calgary 42,944 43,923 44,264 45,477 45,799
Central 6,861 6,505 6,303 6,327 7,029
Edmonton 36,622 35,504 35,134 36,615 37,520
Grande Prairie 3,135 2,934 2,874 2,885 3,229
Keyano 1,782 1,926 1,924 2,211 2,176
Lakeland 1,433 1,321 1,363 1,308 1,380
Lethbridge 4,521 4,379 4,259 4,446 4,689
Medicine Hat 2,522 2,360 2,227 2,259 2,441
Northern Lakes 2,342 2,791 2,582 2,593 3,080
Portage 2,179 2,241 2,017 2,172 2,282
Alberta - Unknown 220 214 199 660 1,567
Total Alberta 103,994 103,472 102,537 106,357 110,397
Can
ada
(Not
Alb
erta
)
British Columbia 9,597 10,221 10,007 9,235 8,365
Manitoba 1,575 1,687 1,630 1,593 1,564
New Brunswick 597 614 594 525 417
Newfoundland 451 501 456 404 369
Northwest Territories 932 920 875 880 802
Nova Scotia 1,274 1,334 1,227 1,114 1,036
Nunavut & Yukon 278 297 296 233 242
Ontario 12,844 13,142 12,485 10,939 9,470
Prince Edward Island 213 203 179 160 169
Quebec 921 967 986 853 731
Saskatchewan 4,324 4,253 4,173 4,190 4,424
Canada - Unknown (999 999) 2,761 1,691 3,103 3,652 2,565
Total Canada (Not Alberta) 35,674 35,761 35,896 33,556 29,970
Outside Canada 18,570 20,059 21,305 21,732 23,315
All Service Areas 156,426 157,316 157,481 159,327 161,678
Notes: 1. The sum of the rows will not equal the sector or system totals, as students may have applied to more than one institution. 2. In 2010, all apprenticeship records were removed from ASI. All historical values have been restated to reflect this change. 3. Table does not include data for the Banff Centre. Source: Alberta Advanced Education, Application Submission Initiative (ASI)
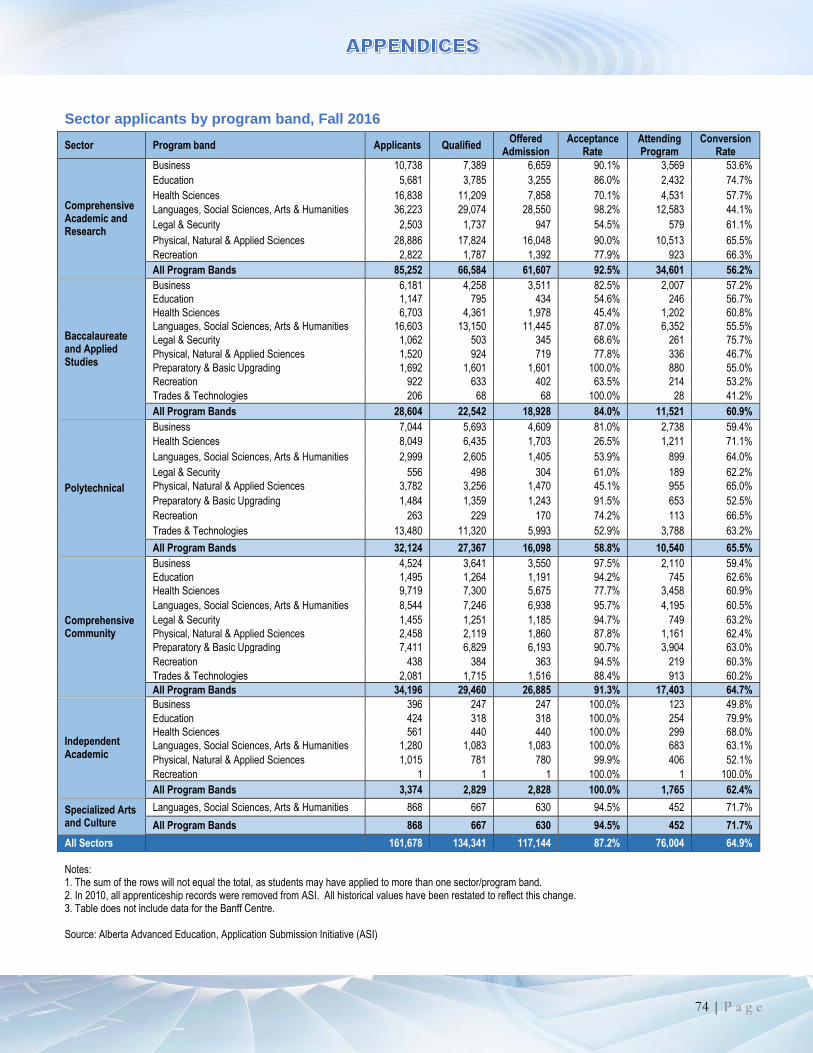
74 | P a g e
Sector applicants by program band, Fall 2016
Sector Program band Applicants Qualified Offered
Admission Acceptance
Rate Attending Program
Conversion Rate
Comprehensive Academic and Research
Business 10,738 7,389 6,659 90.1% 3,569 53.6%
Education 5,681 3,785 3,255 86.0% 2,432 74.7%
Health Sciences 16,838 11,209 7,858 70.1% 4,531 57.7%
Languages, Social Sciences, Arts & Humanities 36,223 29,074 28,550 98.2% 12,583 44.1%
Legal & Security 2,503 1,737 947 54.5% 579 61.1%
Physical, Natural & Applied Sciences 28,886 17,824 16,048 90.0% 10,513 65.5%
Recreation 2,822 1,787 1,392 77.9% 923 66.3%
All Program Bands 85,252 66,584 61,607 92.5% 34,601 56.2%
Baccalaureate and Applied Studies
Business 6,181 4,258 3,511 82.5% 2,007 57.2%
Education 1,147 795 434 54.6% 246 56.7%
Health Sciences 6,703 4,361 1,978 45.4% 1,202 60.8%
Languages, Social Sciences, Arts & Humanities 16,603 13,150 11,445 87.0% 6,352 55.5%
Legal & Security 1,062 503 345 68.6% 261 75.7%
Physical, Natural & Applied Sciences 1,520 924 719 77.8% 336 46.7%
Preparatory & Basic Upgrading 1,692 1,601 1,601 100.0% 880 55.0%
Recreation 922 633 402 63.5% 214 53.2%
Trades & Technologies 206 68 68 100.0% 28 41.2%
All Program Bands 28,604 22,542 18,928 84.0% 11,521 60.9%
Polytechnical
Business 7,044 5,693 4,609 81.0% 2,738 59.4%
Health Sciences 8,049 6,435 1,703 26.5% 1,211 71.1%
Languages, Social Sciences, Arts & Humanities 2,999 2,605 1,405 53.9% 899 64.0%
Legal & Security 556 498 304 61.0% 189 62.2%
Physical, Natural & Applied Sciences 3,782 3,256 1,470 45.1% 955 65.0%
Preparatory & Basic Upgrading 1,484 1,359 1,243 91.5% 653 52.5%
Recreation 263 229 170 74.2% 113 66.5%
Trades & Technologies 13,480 11,320 5,993 52.9% 3,788 63.2%
All Program Bands 32,124 27,367 16,098 58.8% 10,540 65.5%
Comprehensive Community
Business 4,524 3,641 3,550 97.5% 2,110 59.4%
Education 1,495 1,264 1,191 94.2% 745 62.6%
Health Sciences 9,719 7,300 5,675 77.7% 3,458 60.9%
Languages, Social Sciences, Arts & Humanities 8,544 7,246 6,938 95.7% 4,195 60.5%
Legal & Security 1,455 1,251 1,185 94.7% 749 63.2%
Physical, Natural & Applied Sciences 2,458 2,119 1,860 87.8% 1,161 62.4%
Preparatory & Basic Upgrading 7,411 6,829 6,193 90.7% 3,904 63.0%
Recreation 438 384 363 94.5% 219 60.3%
Trades & Technologies 2,081 1,715 1,516 88.4% 913 60.2%
All Program Bands 34,196 29,460 26,885 91.3% 17,403 64.7%
Independent Academic
Business 396 247 247 100.0% 123 49.8%
Education 424 318 318 100.0% 254 79.9%
Health Sciences 561 440 440 100.0% 299 68.0%
Languages, Social Sciences, Arts & Humanities 1,280 1,083 1,083 100.0% 683 63.1%
Physical, Natural & Applied Sciences 1,015 781 780 99.9% 406 52.1%
Recreation 1 1 1 100.0% 1 100.0%
All Program Bands 3,374 2,829 2,828 100.0% 1,765 62.4%
Specialized Arts and Culture
Languages, Social Sciences, Arts & Humanities 868 667 630 94.5% 452 71.7%
All Program Bands 868 667 630 94.5% 452 71.7%
All Sectors 161,678 134,341 117,144 87.2% 76,004 64.9%
Notes: 1. The sum of the rows will not equal the total, as students may have applied to more than one sector/program band. 2. In 2010, all apprenticeship records were removed from ASI. All historical values have been restated to reflect this change. 3. Table does not include data for the Banff Centre. Source: Alberta Advanced Education, Application Submission Initiative (ASI)

75 | P a g e
Regional Applicants by Program Band, Fall 2016
Service Region Program Band
To
tal
Ap
plic
ants
Qu
alif
ied
Off
ered
Ad
mis
sio
n
Acc
epta
nce
Rat
e
Att
end
ing
Pro
gra
m
Co
nve
rsio
n
Rat
e
Calgary Business 11,137 7,873 6,674 84.8% 4,046 60.6%
Education 2,795 2,133 1,548 72.6% 1,067 68.9%
Health Sciences 15,422 11,528 5,519 47.9% 3,453 62.6%
Languages, Social Sciences, Arts & Humanities 21,568 16,664 14,539 87.2% 8,285 57.0%
Legal & Security 2,782 2,068 1,191 57.6% 727 61.0%
Physical, Natural & Applied Sciences 14,764 10,422 7,979 76.6% 4,989 62.5%
Preparatory & Basic Upgrading 3,287 2,811 2,561 91.1% 1,577 61.6%
Recreation 1,888 1,258 825 65.6% 503 61.0%
Trades & Technologists 7,666 5,957 3,656 61.4% 2,215 60.6%
Calgary 62,490 50,424 39,911 79.2% 26,453 66.3%
Central Business 1,067 960 957 99.7% 592 61.9%
Education 589 529 514 97.2% 295 57.4%
Health Sciences 2,293 1,783 1,051 58.9% 538 51.2%
Languages, Social Sciences, Arts & Humanities 2,418 2,170 2,139 98.6% 967 45.2%
Legal & Security 107 99 88 88.9% 38 43.2%
Physical, Natural & Applied Sciences 1,065 860 781 90.8% 465 59.5%
Preparatory & Basic Upgrading 390 382 382 100.0% 237 62.0%
Recreation 268 231 215 93.1% 124 57.7%
Trades & Technologists 255 192 171 89.1% 108 63.2%
Central 6,910 6,228 5,683 91.2% 3,361 59.1%
Edmonton Business 9,207 6,387 5,380 84.2% 3,668 68.2%
Education 4,042 2,389 2,115 88.5% 1,604 75.8%
Health Sciences 16,835 10,681 6,136 57.4% 4,472 72.9%
Languages, Social Sciences, Arts & Humanities 20,768 14,958 13,854 92.6% 9,118 65.8%
Legal & Security 2,452 1,321 793 60.0% 537 67.7%
Physical, Natural & Applied Sciences 20,694 11,544 10,071 87.2% 6,316 62.7%
Preparatory & Basic Upgrading 3,514 3,461 3,047 88.0% 2,041 67.0%
Recreation 1,819 1,106 837 75.7% 583 69.7%
Trades & Technologists 6,499 5,803 2,496 43.0% 1,601 64.1%
Edmonton 68,633 50,878 41,974 82.5% 29,884 71.2%
Grande Prairie Business 423 321 321 100.0% 182 56.7%
Education 185 156 156 100.0% 107 68.6%
Health Sciences 475 304 229 75.3% 148 64.6%
Languages, Social Sciences, Arts & Humanities 752 630 630 100.0% 415 65.9%
Legal & Security 0 0 0 - - -
Physical, Natural & Applied Sciences 70 53 53 100.0% 25 47.2%
Preparatory & Basic Upgrading 355 234 234 100.0% 101 43.2%
Recreation 74 62 62 100.0% 44 71.0%
Trades & Technologists 294 196 191 97.4% 116 60.7%
Grande Prairie 2,318 1,853 1,792 96.7% 1,138 63.5%
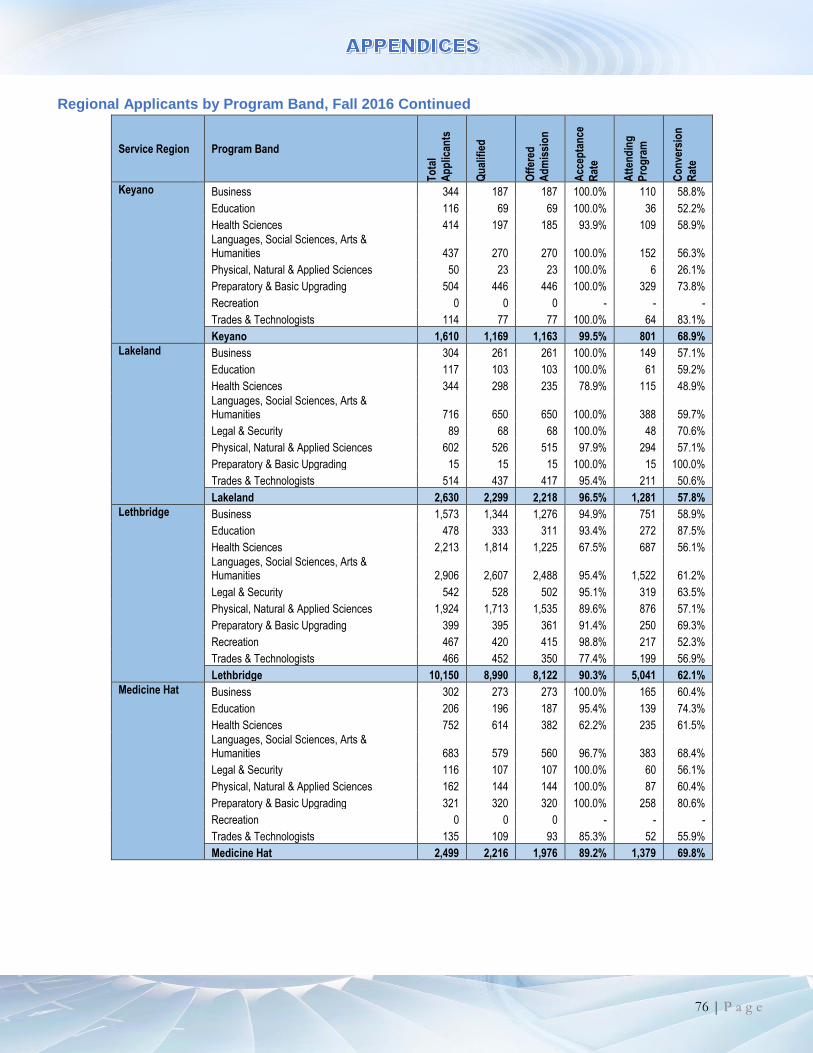
76 | P a g e
Regional Applicants by Program Band, Fall 2016 Continued
Service Region Program Band
To
tal
Ap
plic
ants
Qu
alif
ied
Off
ered
Ad
mis
sio
n
Acc
epta
nce
Rat
e
Att
end
ing
Pro
gra
m
Co
nve
rsio
n
Rat
e
Keyano Business 344 187 187 100.0% 110 58.8%
Education 116 69 69 100.0% 36 52.2%
Health Sciences 414 197 185 93.9% 109 58.9%
Languages, Social Sciences, Arts & Humanities 437 270 270 100.0% 152 56.3%
Physical, Natural & Applied Sciences 50 23 23 100.0% 6 26.1%
Preparatory & Basic Upgrading 504 446 446 100.0% 329 73.8%
Recreation 0 0 0 - - -
Trades & Technologists 114 77 77 100.0% 64 83.1%
Keyano 1,610 1,169 1,163 99.5% 801 68.9%
Lakeland Business 304 261 261 100.0% 149 57.1%
Education 117 103 103 100.0% 61 59.2%
Health Sciences 344 298 235 78.9% 115 48.9%
Languages, Social Sciences, Arts & Humanities 716 650 650 100.0% 388 59.7%
Legal & Security 89 68 68 100.0% 48 70.6%
Physical, Natural & Applied Sciences 602 526 515 97.9% 294 57.1%
Preparatory & Basic Upgrading 15 15 15 100.0% 15 100.0%
Trades & Technologists 514 437 417 95.4% 211 50.6%
Lakeland 2,630 2,299 2,218 96.5% 1,281 57.8%
Lethbridge Business 1,573 1,344 1,276 94.9% 751 58.9%
Education 478 333 311 93.4% 272 87.5%
Health Sciences 2,213 1,814 1,225 67.5% 687 56.1%
Languages, Social Sciences, Arts & Humanities 2,906 2,607 2,488 95.4% 1,522 61.2%
Legal & Security 542 528 502 95.1% 319 63.5%
Physical, Natural & Applied Sciences 1,924 1,713 1,535 89.6% 876 57.1%
Preparatory & Basic Upgrading 399 395 361 91.4% 250 69.3%
Recreation 467 420 415 98.8% 217 52.3%
Trades & Technologists 466 452 350 77.4% 199 56.9%
Lethbridge 10,150 8,990 8,122 90.3% 5,041 62.1%
Medicine Hat Business 302 273 273 100.0% 165 60.4%
Education 206 196 187 95.4% 139 74.3%
Health Sciences 752 614 382 62.2% 235 61.5%
Languages, Social Sciences, Arts & Humanities 683 579 560 96.7% 383 68.4%
Legal & Security 116 107 107 100.0% 60 56.1%
Physical, Natural & Applied Sciences 162 144 144 100.0% 87 60.4%
Preparatory & Basic Upgrading 321 320 320 100.0% 258 80.6%
Recreation 0 0 0 - - -
Trades & Technologists 135 109 93 85.3% 52 55.9%
Medicine Hat 2,499 2,216 1,976 89.2% 1,379 69.8%
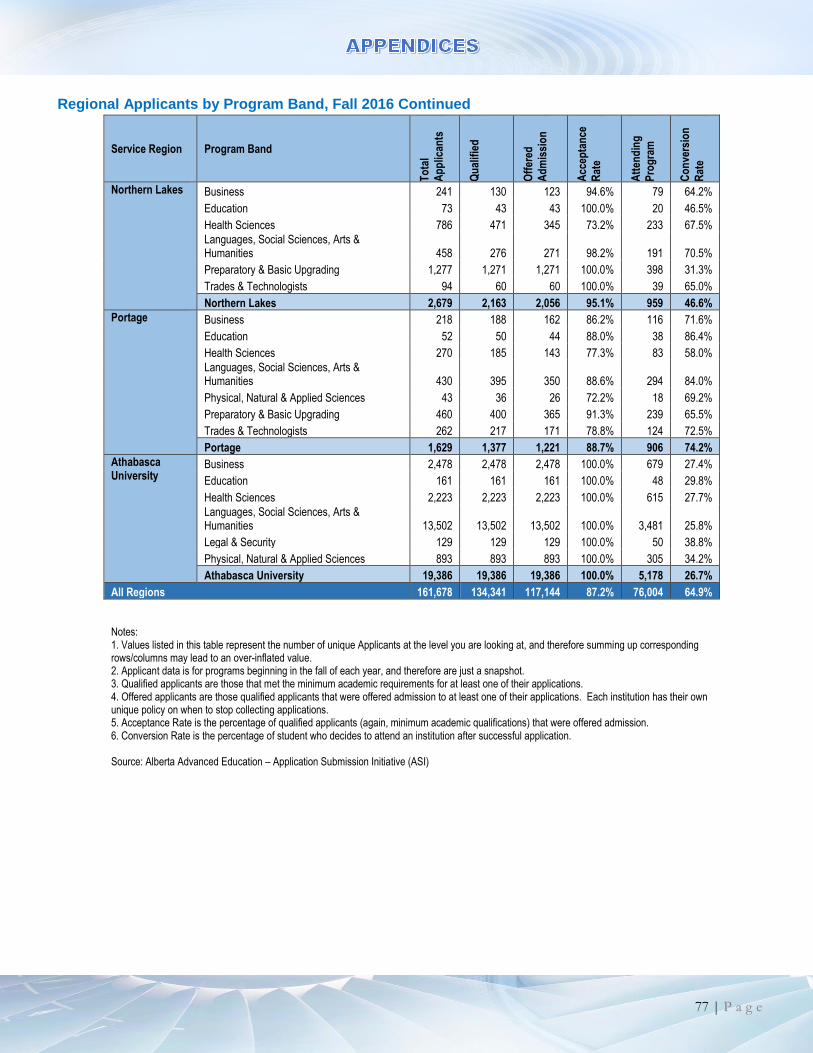
77 | P a g e
Regional Applicants by Program Band, Fall 2016 Continued
Service Region Program Band
To
tal
Ap
plic
ants
Qu
alif
ied
Off
ered
Ad
mis
sio
n
Acc
epta
nce
Rat
e
Att
end
ing
Pro
gra
m
Co
nve
rsio
n
Rat
e
Northern Lakes Business 241 130 123 94.6% 79 64.2%
Education 73 43 43 100.0% 20 46.5%
Health Sciences 786 471 345 73.2% 233 67.5%
Languages, Social Sciences, Arts & Humanities 458 276 271 98.2% 191 70.5%
Preparatory & Basic Upgrading 1,277 1,271 1,271 100.0% 398 31.3%
Trades & Technologists 94 60 60 100.0% 39 65.0%
Northern Lakes 2,679 2,163 2,056 95.1% 959 46.6%
Portage Business 218 188 162 86.2% 116 71.6%
Education 52 50 44 88.0% 38 86.4%
Health Sciences 270 185 143 77.3% 83 58.0%
Languages, Social Sciences, Arts & Humanities 430 395 350 88.6% 294 84.0%
Physical, Natural & Applied Sciences 43 36 26 72.2% 18 69.2%
Preparatory & Basic Upgrading 460 400 365 91.3% 239 65.5%
Trades & Technologists 262 217 171 78.8% 124 72.5%
Portage 1,629 1,377 1,221 88.7% 906 74.2%
Athabasca University
Business 2,478 2,478 2,478 100.0% 679 27.4%
Education 161 161 161 100.0% 48 29.8%
Health Sciences 2,223 2,223 2,223 100.0% 615 27.7%
Languages, Social Sciences, Arts & Humanities 13,502 13,502 13,502 100.0% 3,481 25.8%
Legal & Security 129 129 129 100.0% 50 38.8%
Physical, Natural & Applied Sciences 893 893 893 100.0% 305 34.2%
Athabasca University 19,386 19,386 19,386 100.0% 5,178 26.7%
All Regions 161,678 134,341 117,144 87.2% 76,004 64.9% Notes: 1. Values listed in this table represent the number of unique Applicants at the level you are looking at, and therefore summing up corresponding rows/columns may lead to an over-inflated value. 2. Applicant data is for programs beginning in the fall of each year, and therefore are just a snapshot. 3. Qualified applicants are those that met the minimum academic requirements for at least one of their applications. 4. Offered applicants are those qualified applicants that were offered admission to at least one of their applications. Each institution has their own unique policy on when to stop collecting applications. 5. Acceptance Rate is the percentage of qualified applicants (again, minimum academic qualifications) that were offered admission. 6. Conversion Rate is the percentage of student who decides to attend an institution after successful application. Source: Alberta Advanced Education – Application Submission Initiative (ASI)
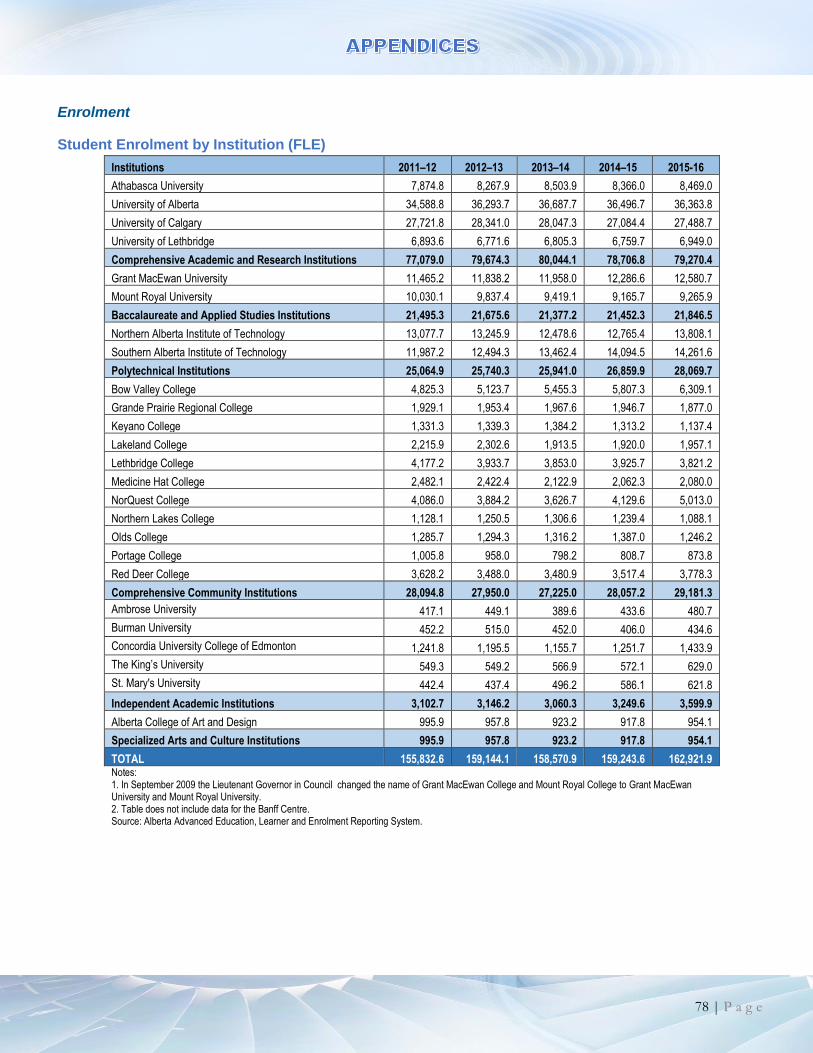
78 | P a g e
Enrolment
Student Enrolment by Institution (FLE)
Institutions 2011–12 2012–13 2013–14 2014–15 2015-16
Athabasca University 7,874.8 8,267.9 8,503.9 8,366.0 8,469.0
University of Alberta 34,588.8 36,293.7 36,687.7 36,496.7 36,363.8
University of Calgary 27,721.8 28,341.0 28,047.3 27,084.4 27,488.7
University of Lethbridge 6,893.6 6,771.6 6,805.3 6,759.7 6,949.0
Comprehensive Academic and Research Institutions 77,079.0 79,674.3 80,044.1 78,706.8 79,270.4
Grant MacEwan University 11,465.2 11,838.2 11,958.0 12,286.6 12,580.7
Mount Royal University 10,030.1 9,837.4 9,419.1 9,165.7 9,265.9
Baccalaureate and Applied Studies Institutions 21,495.3 21,675.6 21,377.2 21,452.3 21,846.5
Northern Alberta Institute of Technology 13,077.7 13,245.9 12,478.6 12,765.4 13,808.1
Southern Alberta Institute of Technology 11,987.2 12,494.3 13,462.4 14,094.5 14,261.6
Polytechnical Institutions 25,064.9 25,740.3 25,941.0 26,859.9 28,069.7
Bow Valley College 4,825.3 5,123.7 5,455.3 5,807.3 6,309.1
Grande Prairie Regional College 1,929.1 1,953.4 1,967.6 1,946.7 1,877.0
Keyano College 1,331.3 1,339.3 1,384.2 1,313.2 1,137.4
Lakeland College 2,215.9 2,302.6 1,913.5 1,920.0 1,957.1
Lethbridge College 4,177.2 3,933.7 3,853.0 3,925.7 3,821.2
Medicine Hat College 2,482.1 2,422.4 2,122.9 2,062.3 2,080.0
NorQuest College 4,086.0 3,884.2 3,626.7 4,129.6 5,013.0
Northern Lakes College 1,128.1 1,250.5 1,306.6 1,239.4 1,088.1
Olds College 1,285.7 1,294.3 1,316.2 1,387.0 1,246.2
Portage College 1,005.8 958.0 798.2 808.7 873.8
Red Deer College 3,628.2 3,488.0 3,480.9 3,517.4 3,778.3
Comprehensive Community Institutions 28,094.8 27,950.0 27,225.0 28,057.2 29,181.3
Ambrose University 417.1 449.1 389.6 433.6 480.7
Burman University 452.2 515.0 452.0 406.0 434.6
Concordia University College of Edmonton 1,241.8 1,195.5 1,155.7 1,251.7 1,433.9
The King’s University 549.3 549.2 566.9 572.1 629.0
St. Mary's University 442.4 437.4 496.2 586.1 621.8
Independent Academic Institutions 3,102.7 3,146.2 3,060.3 3,249.6 3,599.9
Alberta College of Art and Design 995.9 957.8 923.2 917.8 954.1
Specialized Arts and Culture Institutions 995.9 957.8 923.2 917.8 954.1
TOTAL 155,832.6 159,144.1 158,570.9 159,243.6 162,921.9 Notes: 1. In September 2009 the Lieutenant Governor in Council changed the name of Grant MacEwan College and Mount Royal College to Grant MacEwan University and Mount Royal University. 2. Table does not include data for the Banff Centre. Source: Alberta Advanced Education, Learner and Enrolment Reporting System.

79 | P a g e
Student Enrolment by Institution (Headcount)
Institutions 2011-12 2012-13 2013-14 2014-15 2015-16
Athabasca University 39,284 41,223 41,747 40,408 40,070
University of Alberta 42,344 43,013 42,705 42,129 41,356
University of Calgary 34,144 34,474 33,929 32,518 32,983
University of Lethbridge 9,340 9,114 8,969 8,820 9,106
Comprehensive Academic and Research Institutions 122,833 125,593 125,157 121,738 121,260
Grant MacEwan University 18,862 18,897 19,250 19,606 19,292
Mount Royal University 15,612 15,168 14,550 13,805 13,593
Baccalaureate and Applied Studies Institutions 34,461 34,000 33,752 33,391 32,876
Northern Alberta Institute of Technology 26,570 27,182 25,557 26,606 27,941
Southern Alberta Institute of Technology 25,844 26,815 28,067 28,422 27,912
Polytechnical Institutions 52,363 53,934 53,580 54,968 55,814
Bow Valley College 9,583 10,727 11,049 11,450 11,638
Grande Prairie Regional College 3,822 3,911 3,893 3,957 3,803
Keyano College 2,869 2,950 2,922 2,889 2,572
Lakeland College 7,396 7,527 3,642 3,792 3,719
Lethbridge College 6,503 6,303 6,413 6,524 6,588
Medicine Hat College 5,425 4,126 3,572 3,549 3,508
NorQuest College 6,819 6,722 6,496 7,476 9,422
Northern Lakes College 1,933 2,201 2,391 2,399 1,966
Olds College 2,465 2,573 2,316 2,324 1,772
Portage College 3,360 3,463 1,185 1,192 1,273
Red Deer College 6,595 6,456 6,738 7,118 7,369
Comprehensive Community Institutions 55,978 56,196 50,156 52,181 53,145
Ambrose University 624 605 570 638 696
Burman University 613 621 616 560 541
Concordia University College of Edmonton 1,677 1,613 1,606 1,715 1,937
The King’s University 713 705 720 741 806
St. Mary's University 655 641 692 793 838
Independent Academic Institutions 4,273 4,178 4,200 4,443 4,811
Alberta College of Art and Design 1,323 1,250 1,225 1,187 1,213
Specialized Arts and Culture Institutions 1,323 1,250 1,225 1,187 1,213
TOTAL 265,501 269,750 262,744 263,100 264,286
Notes: 1. In September 2009 the Lieutenant Governor in Council changed the name of Grant MacEwan College and Mount Royal College to Grant MacEwan University and Mount Royal University. 2. Table does not include data for the Banff Centre. 3. The headcounts reported above are true headcounts, where students are counted once for each institution / academic year. Source: Alberta Advanced Education, Learner and Enrolment Reporting System.

80 | P a g e
Student Enrolment by Service Region (FLE)
Alberta Historical Enrolment (FLE) by Service Region, Attending At
Service region 2011–12 2012–13 2013-14 2014–15 2015-16
# % of total
# % of total
# % of total
# % of total
# % of total
Calgary 56,419.8 35.6% 57,640.7 36.2% 58,193.0 35.7% 58,089.3 36.5% 59,381.8 36.4%
Central 5,366.1 3.4% 5,297.3 3.3% 5,249.1 3.2% 5,310.5 3.3% 5,459.1 3.4%
Edmonton 65,008.7 41.0% 67,006.7 42.1% 66,473.6 40.8% 67,502.1 42.4% 69,828.4 42.9%
Grande Prairie 1,929.1 1.2% 1,953.4 1.2% 1,967.6 1.2% 1,946.7 1.2% 1,877.0 1.2%
Keyano 1,331.3 0.8% 1,339.3 0.8% 1,384.2 0.8% 1,313.2 0.8% 1,137.4 0.7%
Lakeland 2,215.9 1.4% 2,302.6 1.4% 1,913.5 1.2% 1,920.0 1.2% 1,957.1 1.2%
Lethbridge 11,070.9 7.0% 10,705.3 6.7% 10,658.3 6.5% 10,685.4 6.7% 10,770.2 6.6%
Medicine Hat 2,482.1 1.6% 2,422.4 1.5% 2,122.9 1.3% 2,062.3 1.3% 2,080.0 1.3%
Northern Lakes 1,128.1 0.7% 1,250.5 0.8% 1,306.6 0.8% 1,239.4 0.8% 1,088.1 0.7%
Athabasca University 7,874.8 5.0% 8,267.9 5.2% 8,503.9 5.2% 8,366.0 5.3% 8,469.0 5.2%
Portage 1,005.8 0.6% 958.0 0.6% 798.2 0.5% 808.7 0.5% 873.8 0.5%
TOTAL 155,832.6 98.3% 159,144.1 99.9% 158,570.9 97.3% 159,243.6 100.0% 162,921.9 100.0%
Note: table does not include data for the Banff Centre. Source: Alberta Advanced Education – Learner and Enrolment Reporting System (LERS).
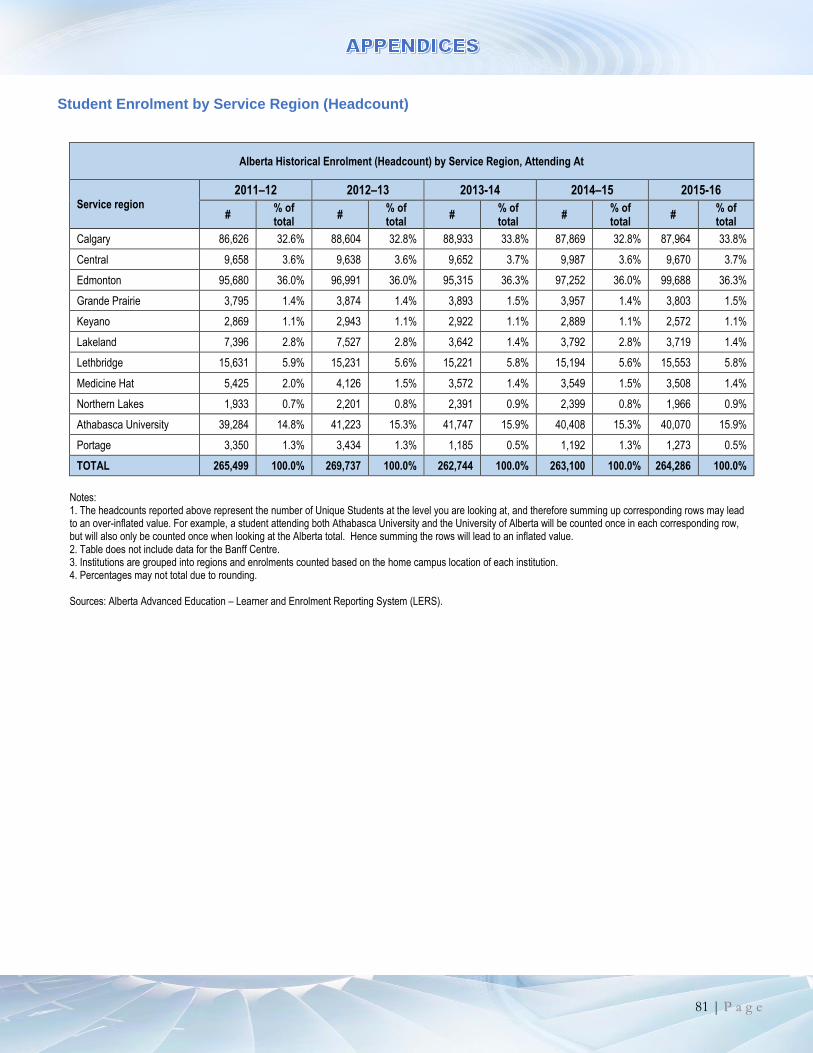
81 | P a g e
Student Enrolment by Service Region (Headcount)
Alberta Historical Enrolment (Headcount) by Service Region, Attending At
Service region 2011–12 2012–13 2013-14 2014–15 2015-16
# % of total
# % of total
# % of total
# % of total
# % of total
Calgary 86,626 32.6% 88,604 32.8% 88,933 33.8% 87,869 32.8% 87,964 33.8%
Central 9,658 3.6% 9,638 3.6% 9,652 3.7% 9,987 3.6% 9,670 3.7%
Edmonton 95,680 36.0% 96,991 36.0% 95,315 36.3% 97,252 36.0% 99,688 36.3%
Grande Prairie 3,795 1.4% 3,874 1.4% 3,893 1.5% 3,957 1.4% 3,803 1.5%
Keyano 2,869 1.1% 2,943 1.1% 2,922 1.1% 2,889 1.1% 2,572 1.1%
Lakeland 7,396 2.8% 7,527 2.8% 3,642 1.4% 3,792 2.8% 3,719 1.4%
Lethbridge 15,631 5.9% 15,231 5.6% 15,221 5.8% 15,194 5.6% 15,553 5.8%
Medicine Hat 5,425 2.0% 4,126 1.5% 3,572 1.4% 3,549 1.5% 3,508 1.4%
Northern Lakes 1,933 0.7% 2,201 0.8% 2,391 0.9% 2,399 0.8% 1,966 0.9%
Athabasca University 39,284 14.8% 41,223 15.3% 41,747 15.9% 40,408 15.3% 40,070 15.9%
Portage 3,350 1.3% 3,434 1.3% 1,185 0.5% 1,192 1.3% 1,273 0.5%
TOTAL 265,499 100.0% 269,737 100.0% 262,744 100.0% 263,100 100.0% 264,286 100.0%
Notes: 1. The headcounts reported above represent the number of Unique Students at the level you are looking at, and therefore summing up corresponding rows may lead to an over-inflated value. For example, a student attending both Athabasca University and the University of Alberta will be counted once in each corresponding row, but will also only be counted once when looking at the Alberta total. Hence summing the rows will lead to an inflated value. 2. Table does not include data for the Banff Centre. 3. Institutions are grouped into regions and enrolments counted based on the home campus location of each institution. 4. Percentages may not total due to rounding. Sources: Alberta Advanced Education – Learner and Enrolment Reporting System (LERS).
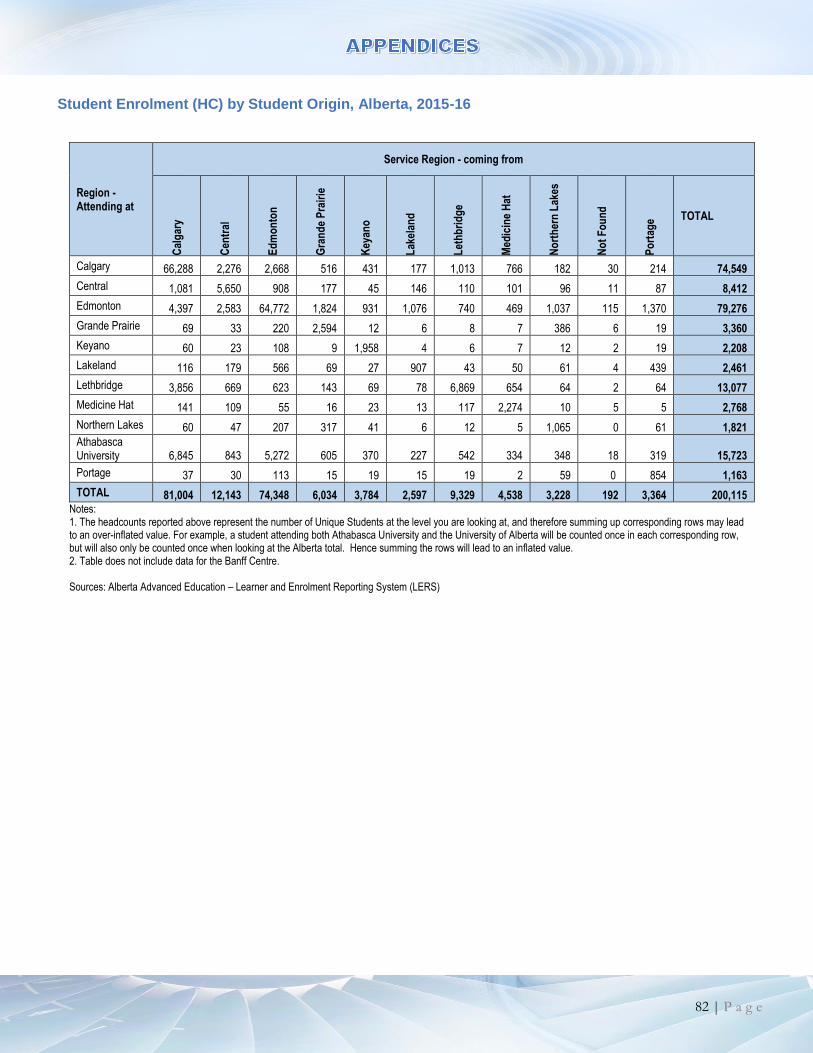
82 | P a g e
Student Enrolment (HC) by Student Origin, Alberta, 2015-16
Region - Attending at
Service Region - coming from
Cal
gar
y
Cen
tral
Ed
mo
nto
n
Gra
nd
e P
rair
ie
Key
ano
Lak
elan
d
Let
hb
rid
ge
Med
icin
e H
at
No
rth
ern
Lak
es
No
t F
ou
nd
Po
rtag
e TOTAL
Calgary 66,288 2,276 2,668 516 431 177 1,013 766 182 30 214 74,549
Central 1,081 5,650 908 177 45 146 110 101 96 11 87 8,412
Edmonton 4,397 2,583 64,772 1,824 931 1,076 740 469 1,037 115 1,370 79,276
Grande Prairie 69 33 220 2,594 12 6 8 7 386 6 19 3,360
Keyano 60 23 108 9 1,958 4 6 7 12 2 19 2,208
Lakeland 116 179 566 69 27 907 43 50 61 4 439 2,461
Lethbridge 3,856 669 623 143 69 78 6,869 654 64 2 64 13,077
Medicine Hat 141 109 55 16 23 13 117 2,274 10 5 5 2,768
Northern Lakes 60 47 207 317 41 6 12 5 1,065 0 61 1,821
Athabasca University 6,845 843 5,272 605 370 227 542 334 348 18 319 15,723
Portage 37 30 113 15 19 15 19 2 59 0 854 1,163
TOTAL 81,004 12,143 74,348 6,034 3,784 2,597 9,329 4,538 3,228 192 3,364 200,115 Notes: 1. The headcounts reported above represent the number of Unique Students at the level you are looking at, and therefore summing up corresponding rows may lead to an over-inflated value. For example, a student attending both Athabasca University and the University of Alberta will be counted once in each corresponding row, but will also only be counted once when looking at the Alberta total. Hence summing the rows will lead to an inflated value. 2. Table does not include data for the Banff Centre. Sources: Alberta Advanced Education – Learner and Enrolment Reporting System (LERS)
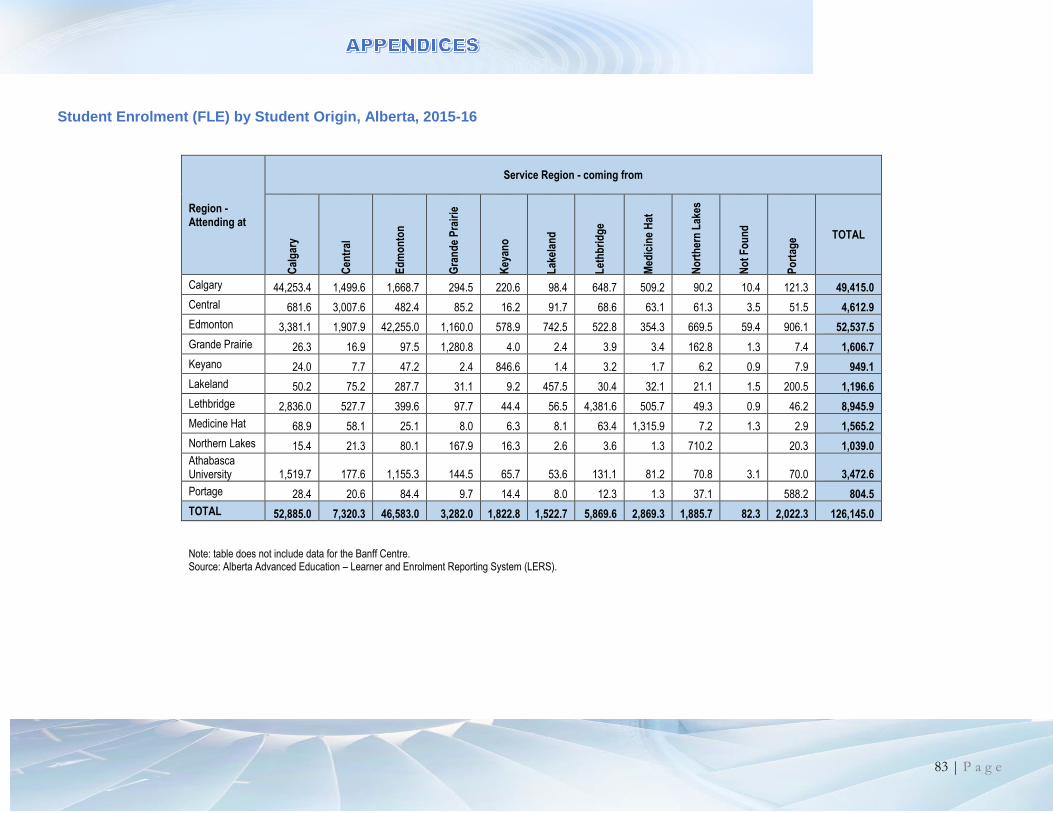
83 | P a g e
Student Enrolment (FLE) by Student Origin, Alberta, 2015-16
Region - Attending at
Service Region - coming from
Cal
gar
y
Cen
tral
Ed
mo
nto
n
Gra
nd
e P
rair
ie
Key
ano
Lak
elan
d
Let
hb
rid
ge
Med
icin
e H
at
No
rth
ern
Lak
es
No
t F
ou
nd
Po
rtag
e TOTAL
Calgary 44,253.4 1,499.6 1,668.7 294.5 220.6 98.4 648.7 509.2 90.2 10.4 121.3 49,415.0
Central 681.6 3,007.6 482.4 85.2 16.2 91.7 68.6 63.1 61.3 3.5 51.5 4,612.9
Edmonton 3,381.1 1,907.9 42,255.0 1,160.0 578.9 742.5 522.8 354.3 669.5 59.4 906.1 52,537.5
Grande Prairie 26.3 16.9 97.5 1,280.8 4.0 2.4 3.9 3.4 162.8 1.3 7.4 1,606.7
Keyano 24.0 7.7 47.2 2.4 846.6 1.4 3.2 1.7 6.2 0.9 7.9 949.1
Lakeland 50.2 75.2 287.7 31.1 9.2 457.5 30.4 32.1 21.1 1.5 200.5 1,196.6
Lethbridge 2,836.0 527.7 399.6 97.7 44.4 56.5 4,381.6 505.7 49.3 0.9 46.2 8,945.9
Medicine Hat 68.9 58.1 25.1 8.0 6.3 8.1 63.4 1,315.9 7.2 1.3 2.9 1,565.2
Northern Lakes 15.4 21.3 80.1 167.9 16.3 2.6 3.6 1.3 710.2 20.3 1,039.0
Athabasca University 1,519.7 177.6 1,155.3 144.5 65.7 53.6 131.1 81.2 70.8 3.1 70.0 3,472.6
Portage 28.4 20.6 84.4 9.7 14.4 8.0 12.3 1.3 37.1 588.2 804.5
TOTAL 52,885.0 7,320.3 46,583.0 3,282.0 1,822.8 1,522.7 5,869.6 2,869.3 1,885.7 82.3 2,022.3 126,145.0 Note: table does not include data for the Banff Centre. Source: Alberta Advanced Education – Learner and Enrolment Reporting System (LERS).
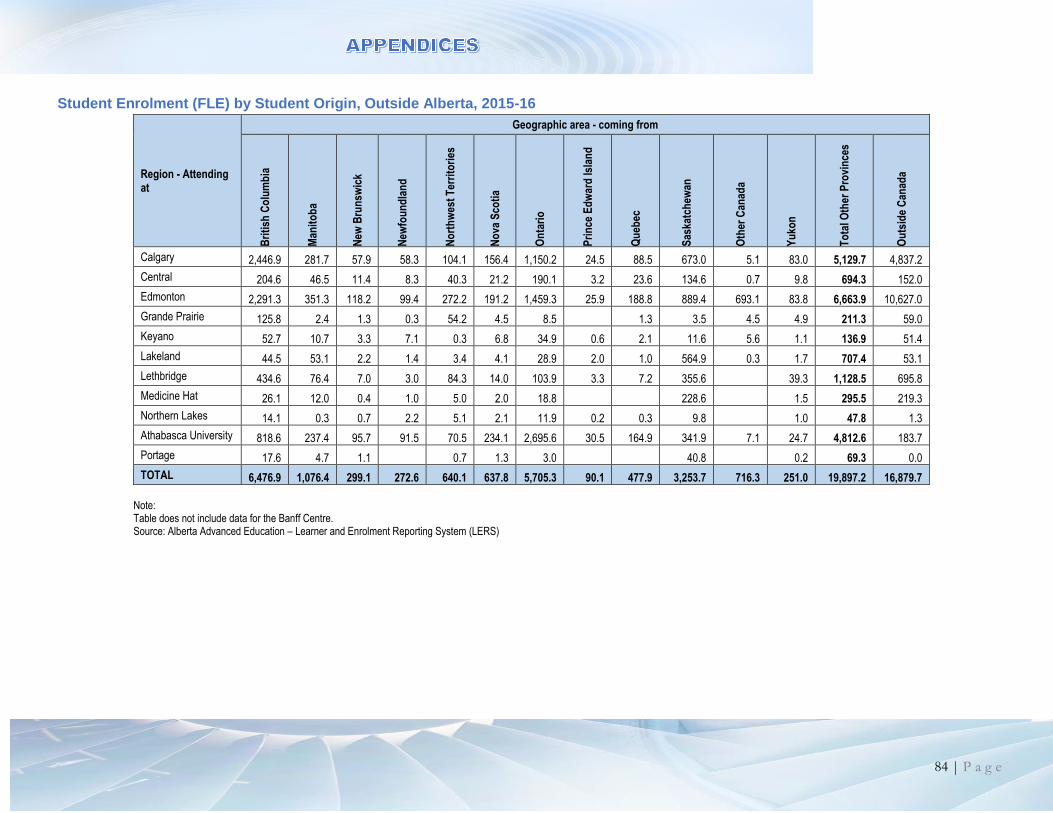
84 | P a g e
Student Enrolment (FLE) by Student Origin, Outside Alberta, 2015-16
Region - Attending at
Geographic area - coming from
Bri
tish
Co
lum
bia
Man
ito
ba
New
Bru
nsw
ick
New
fou
nd
lan
d
No
rth
wes
t T
erri
tori
es
No
va S
coti
a
On
tari
o
Pri
nce
Ed
war
d Is
lan
d
Qu
ebec
Sas
katc
hew
an
Oth
er C
anad
a
Yu
kon
To
tal O
ther
Pro
vin
ces
Ou
tsid
e C
anad
a
Calgary 2,446.9 281.7 57.9 58.3 104.1 156.4 1,150.2 24.5 88.5 673.0 5.1 83.0 5,129.7 4,837.2
Central 204.6 46.5 11.4 8.3 40.3 21.2 190.1 3.2 23.6 134.6 0.7 9.8 694.3 152.0
Edmonton 2,291.3 351.3 118.2 99.4 272.2 191.2 1,459.3 25.9 188.8 889.4 693.1 83.8 6,663.9 10,627.0
Grande Prairie 125.8 2.4 1.3 0.3 54.2 4.5 8.5 1.3 3.5 4.5 4.9 211.3 59.0
Keyano 52.7 10.7 3.3 7.1 0.3 6.8 34.9 0.6 2.1 11.6 5.6 1.1 136.9 51.4
Lakeland 44.5 53.1 2.2 1.4 3.4 4.1 28.9 2.0 1.0 564.9 0.3 1.7 707.4 53.1
Lethbridge 434.6 76.4 7.0 3.0 84.3 14.0 103.9 3.3 7.2 355.6 39.3 1,128.5 695.8
Medicine Hat 26.1 12.0 0.4 1.0 5.0 2.0 18.8 228.6 1.5 295.5 219.3
Northern Lakes 14.1 0.3 0.7 2.2 5.1 2.1 11.9 0.2 0.3 9.8 1.0 47.8 1.3
Athabasca University 818.6 237.4 95.7 91.5 70.5 234.1 2,695.6 30.5 164.9 341.9 7.1 24.7 4,812.6 183.7
Portage 17.6 4.7 1.1 0.7 1.3 3.0 40.8 0.2 69.3 0.0
TOTAL 6,476.9 1,076.4 299.1 272.6 640.1 637.8 5,705.3 90.1 477.9 3,253.7 716.3 251.0 19,897.2 16,879.7
Note: Table does not include data for the Banff Centre. Source: Alberta Advanced Education – Learner and Enrolment Reporting System (LERS)

85 | P a g e
Student Enrolment (HC) by Student Origin, Outside Alberta, 2015-16
Region - Attending at
Geographic area - coming from
Bri
tish
Co
lum
bia
Man
ito
ba
New
Bru
nsw
ick
New
fou
nd
lan
d
No
rth
wes
t T
erri
tori
es
No
va S
coti
a
On
tari
o
Pri
nce
Ed
war
d Is
lan
d
Qu
ebec
Sas
katc
hew
an
Oth
er C
anad
a
Yu
kon
To
tal O
ther
Pro
vin
ces
Ou
tsid
e C
anad
a
Calgary 3,209 379 80 85 172 197 1,406 32 110 904 13 123 6,709 6,767
Central 297 67 17 13 72 33 243 6 33 202 2 15 1,000 260
Edmonton 2,879 450 150 124 431 247 1,764 35 213 1,223 850 129 8,493 12,080
Grande Prairie 188 3 3 1 91 11 16 0 3 8 7 12 343 100
Keyano 93 16 9 15 1 20 64 3 5 25 21 2 274 90
Lakeland 79 68 5 2 6 9 55 2 3 915 1 3 1,148 110
Lethbridge 613 87 12 4 124 21 147 5 10 468 0 51 1,542 944
Medicine Hat 46 17 2 5 8 4 35 0 0 287 0 3 407 333
Northern Lakes 50 2 3 7 10 8 22 1 2 33 0 2 140 5
Athabasca University 3,574 1,236 489 398 370 1,179 13,337 156 825 1,830 27 119 23,540 0
Portage 28 6 2 0 2 2 5 0 0 64 0 1 110 807
TOTAL 10,944 2,317 771 652 1,269 1,727 17,062 240 1,203 5,882 921 454 43,428 21,462
Notes: 1. The headcounts reported above represent the number of Unique Students at the level you are looking at, and therefore summing up corresponding rows may lead to an over-inflated value. For example, a student attending both Athabasca University and the University of Alberta will be counted once in each corresponding row, but will also only be counted once when looking at the Alberta total. Hence summing the rows will lead to an inflated value. 2. Table does not include data for the Banff Centre. Sources: Alberta Advanced Education – Learner and Enrolment Reporting System (LERS)
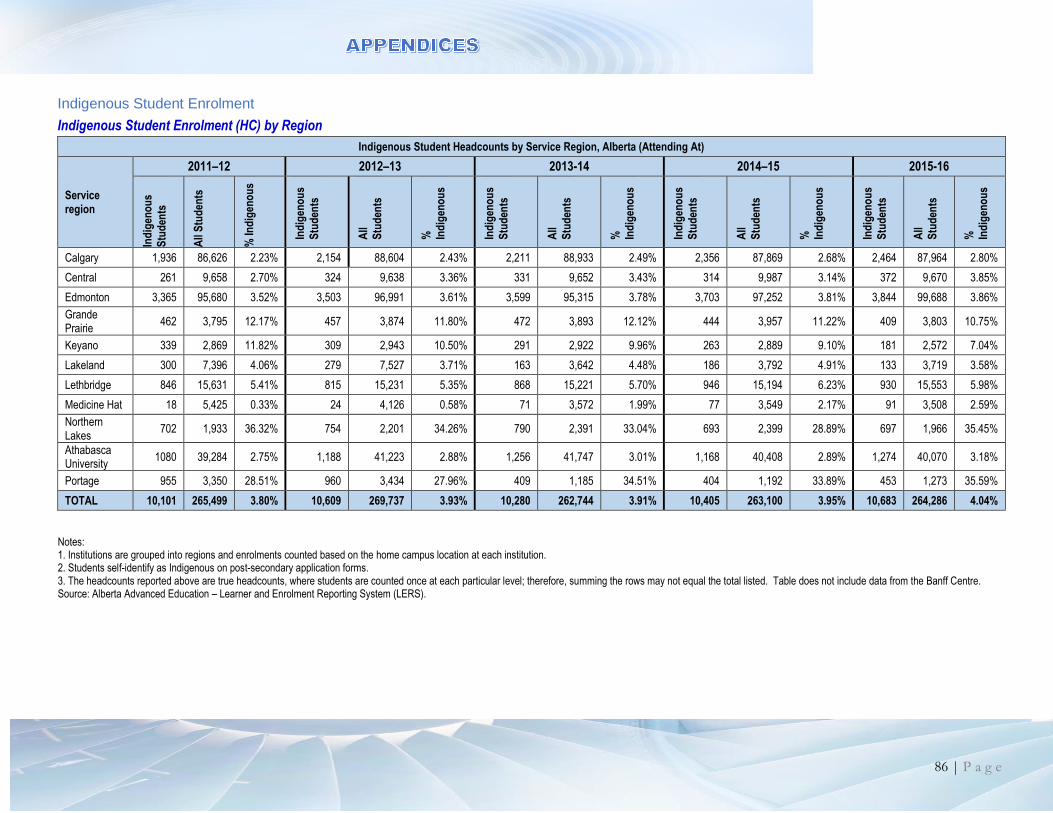
86 | P a g e
Indigenous Student Enrolment
Indigenous Student Enrolment (HC) by Region
Indigenous Student Headcounts by Service Region, Alberta (Attending At)
Service region
2011–12 2012–13 2013-14 2014–15 2015-16
Ind
igen
ou
s
Stu
den
ts
All
Stu
den
ts
% In
dig
eno
us
Ind
igen
ou
s
Stu
den
ts
All
Stu
den
ts
%
Ind
igen
ou
s
Ind
igen
ou
s
Stu
den
ts
All
Stu
den
ts
%
Ind
igen
ou
s
Ind
igen
ou
s
Stu
den
ts
All
Stu
den
ts
%
Ind
igen
ou
s
Ind
igen
ou
s
Stu
den
ts
All
Stu
den
ts
%
Ind
igen
ou
s
Calgary 1,936 86,626 2.23% 2,154 88,604 2.43% 2,211 88,933 2.49% 2,356 87,869 2.68% 2,464 87,964 2.80%
Central 261 9,658 2.70% 324 9,638 3.36% 331 9,652 3.43% 314 9,987 3.14% 372 9,670 3.85%
Edmonton 3,365 95,680 3.52% 3,503 96,991 3.61% 3,599 95,315 3.78% 3,703 97,252 3.81% 3,844 99,688 3.86%
Grande Prairie
462 3,795 12.17% 457 3,874 11.80% 472 3,893 12.12% 444 3,957 11.22% 409 3,803 10.75%
Keyano 339 2,869 11.82% 309 2,943 10.50% 291 2,922 9.96% 263 2,889 9.10% 181 2,572 7.04%
Lakeland 300 7,396 4.06% 279 7,527 3.71% 163 3,642 4.48% 186 3,792 4.91% 133 3,719 3.58%
Lethbridge 846 15,631 5.41% 815 15,231 5.35% 868 15,221 5.70% 946 15,194 6.23% 930 15,553 5.98%
Medicine Hat 18 5,425 0.33% 24 4,126 0.58% 71 3,572 1.99% 77 3,549 2.17% 91 3,508 2.59%
Northern Lakes
702 1,933 36.32% 754 2,201 34.26% 790 2,391 33.04% 693 2,399 28.89% 697 1,966 35.45%
Athabasca University
1080 39,284 2.75% 1,188 41,223 2.88% 1,256 41,747 3.01% 1,168 40,408 2.89% 1,274 40,070 3.18%
Portage 955 3,350 28.51% 960 3,434 27.96% 409 1,185 34.51% 404 1,192 33.89% 453 1,273 35.59%
TOTAL 10,101 265,499 3.80% 10,609 269,737 3.93% 10,280 262,744 3.91% 10,405 263,100 3.95% 10,683 264,286 4.04%
Notes: 1. Institutions are grouped into regions and enrolments counted based on the home campus location at each institution. 2. Students self-identify as Indigenous on post-secondary application forms. 3. The headcounts reported above are true headcounts, where students are counted once at each particular level; therefore, summing the rows may not equal the total listed. Table does not include data from the Banff Centre. Source: Alberta Advanced Education – Learner and Enrolment Reporting System (LERS).
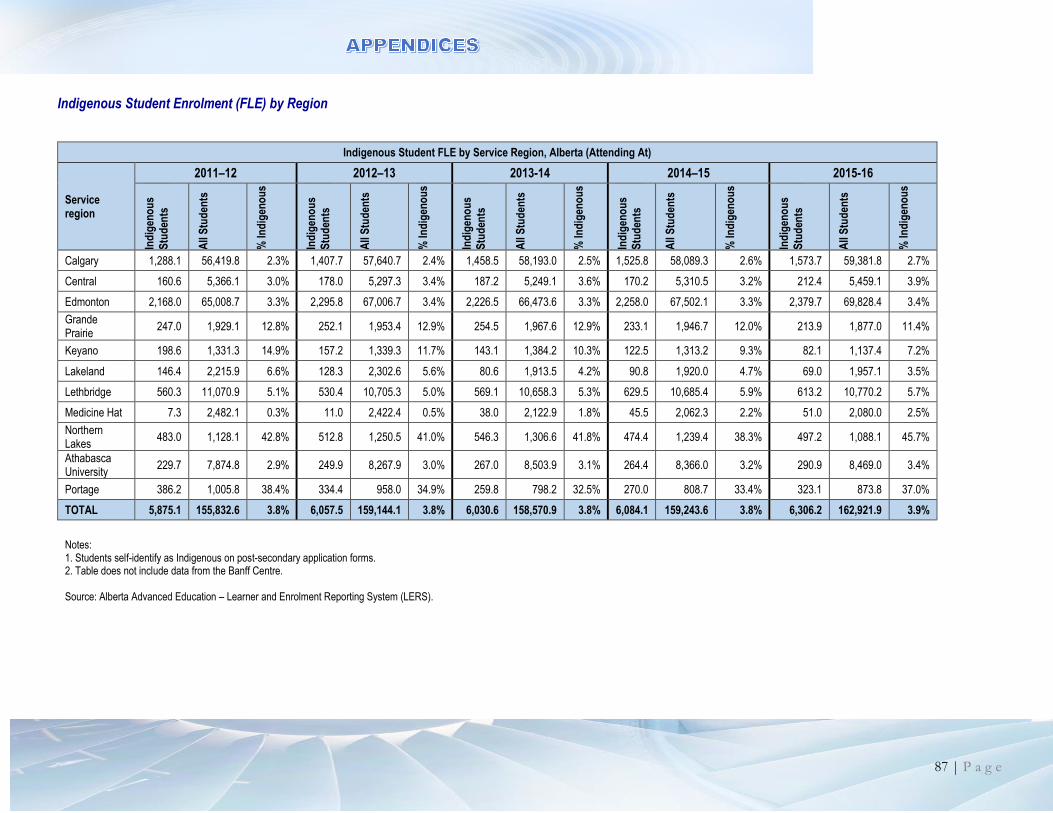
87 | P a g e
Indigenous Student Enrolment (FLE) by Region
Indigenous Student FLE by Service Region, Alberta (Attending At)
Service region
2011–12 2012–13 2013-14 2014–15 2015-16
Ind
igen
ou
s
Stu
den
ts
All
Stu
den
ts
% In
dig
eno
us
Ind
igen
ou
s
Stu
den
ts
All
Stu
den
ts
% In
dig
eno
us
Ind
igen
ou
s
Stu
den
ts
All
Stu
den
ts
% In
dig
eno
us
Ind
igen
ou
s
Stu
den
ts
All
Stu
den
ts
% In
dig
eno
us
Ind
igen
ou
s
Stu
den
ts
All
Stu
den
ts
% In
dig
eno
us
Calgary 1,288.1 56,419.8 2.3% 1,407.7 57,640.7 2.4% 1,458.5 58,193.0 2.5% 1,525.8 58,089.3 2.6% 1,573.7 59,381.8 2.7%
Central 160.6 5,366.1 3.0% 178.0 5,297.3 3.4% 187.2 5,249.1 3.6% 170.2 5,310.5 3.2% 212.4 5,459.1 3.9%
Edmonton 2,168.0 65,008.7 3.3% 2,295.8 67,006.7 3.4% 2,226.5 66,473.6 3.3% 2,258.0 67,502.1 3.3% 2,379.7 69,828.4 3.4%
Grande Prairie
247.0 1,929.1 12.8% 252.1 1,953.4 12.9% 254.5 1,967.6 12.9% 233.1 1,946.7 12.0% 213.9 1,877.0 11.4%
Keyano 198.6 1,331.3 14.9% 157.2 1,339.3 11.7% 143.1 1,384.2 10.3% 122.5 1,313.2 9.3% 82.1 1,137.4 7.2%
Lakeland 146.4 2,215.9 6.6% 128.3 2,302.6 5.6% 80.6 1,913.5 4.2% 90.8 1,920.0 4.7% 69.0 1,957.1 3.5%
Lethbridge 560.3 11,070.9 5.1% 530.4 10,705.3 5.0% 569.1 10,658.3 5.3% 629.5 10,685.4 5.9% 613.2 10,770.2 5.7%
Medicine Hat 7.3 2,482.1 0.3% 11.0 2,422.4 0.5% 38.0 2,122.9 1.8% 45.5 2,062.3 2.2% 51.0 2,080.0 2.5%
Northern Lakes
483.0 1,128.1 42.8% 512.8 1,250.5 41.0% 546.3 1,306.6 41.8% 474.4 1,239.4 38.3% 497.2 1,088.1 45.7%
Athabasca University
229.7 7,874.8 2.9% 249.9 8,267.9 3.0% 267.0 8,503.9 3.1% 264.4 8,366.0 3.2% 290.9 8,469.0 3.4%
Portage 386.2 1,005.8 38.4% 334.4 958.0 34.9% 259.8 798.2 32.5% 270.0 808.7 33.4% 323.1 873.8 37.0%
TOTAL 5,875.1 155,832.6 3.8% 6,057.5 159,144.1 3.8% 6,030.6 158,570.9 3.8% 6,084.1 159,243.6 3.8% 6,306.2 162,921.9 3.9%
Notes: 1. Students self-identify as Indigenous on post-secondary application forms. 2. Table does not include data from the Banff Centre. Source: Alberta Advanced Education – Learner and Enrolment Reporting System (LERS).
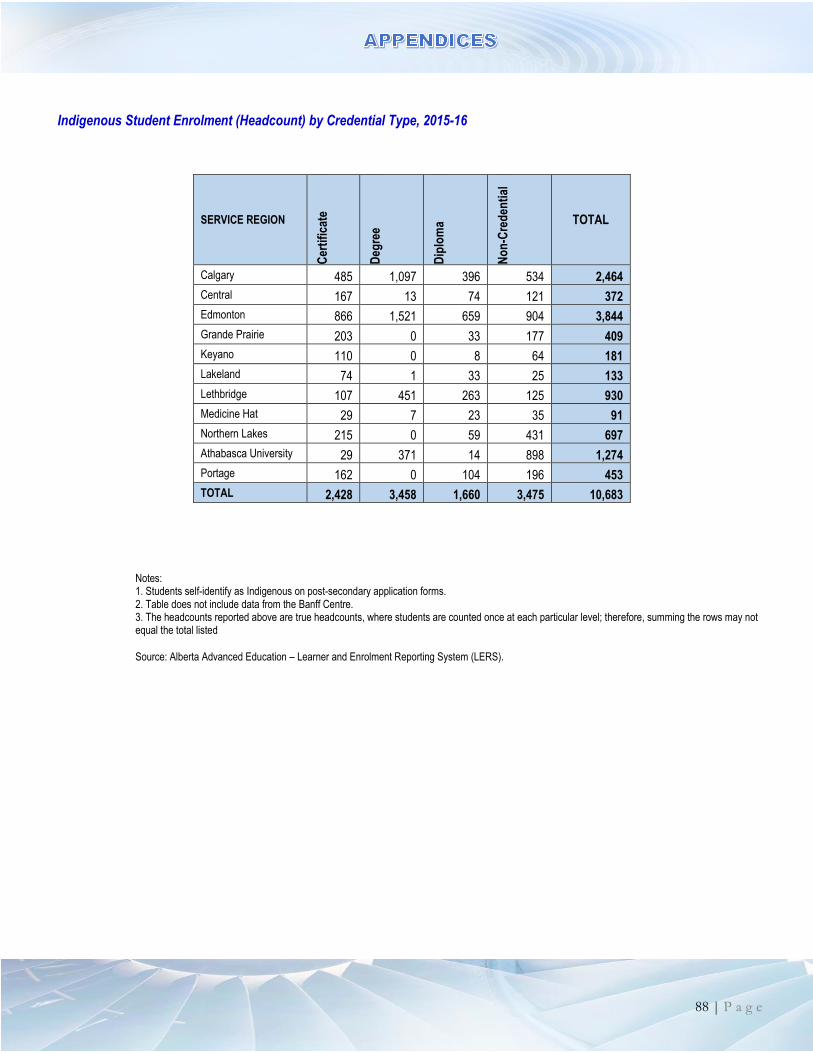
88 | P a g e
Indigenous Student Enrolment (Headcount) by Credential Type, 2015-16
SERVICE REGION
Cer
tifi
cate
Deg
ree
Dip
lom
a
No
n-C
red
enti
al
TOTAL
Calgary 485 1,097 396 534 2,464
Central 167 13 74 121 372
Edmonton 866 1,521 659 904 3,844
Grande Prairie 203 0 33 177 409
Keyano 110 0 8 64 181
Lakeland 74 1 33 25 133
Lethbridge 107 451 263 125 930
Medicine Hat 29 7 23 35 91
Northern Lakes 215 0 59 431 697
Athabasca University 29 371 14 898 1,274
Portage 162 0 104 196 453
TOTAL 2,428 3,458 1,660 3,475 10,683
Notes: 1. Students self-identify as Indigenous on post-secondary application forms. 2. Table does not include data from the Banff Centre. 3. The headcounts reported above are true headcounts, where students are counted once at each particular level; therefore, summing the rows may not equal the total listed
Source: Alberta Advanced Education – Learner and Enrolment Reporting System (LERS).
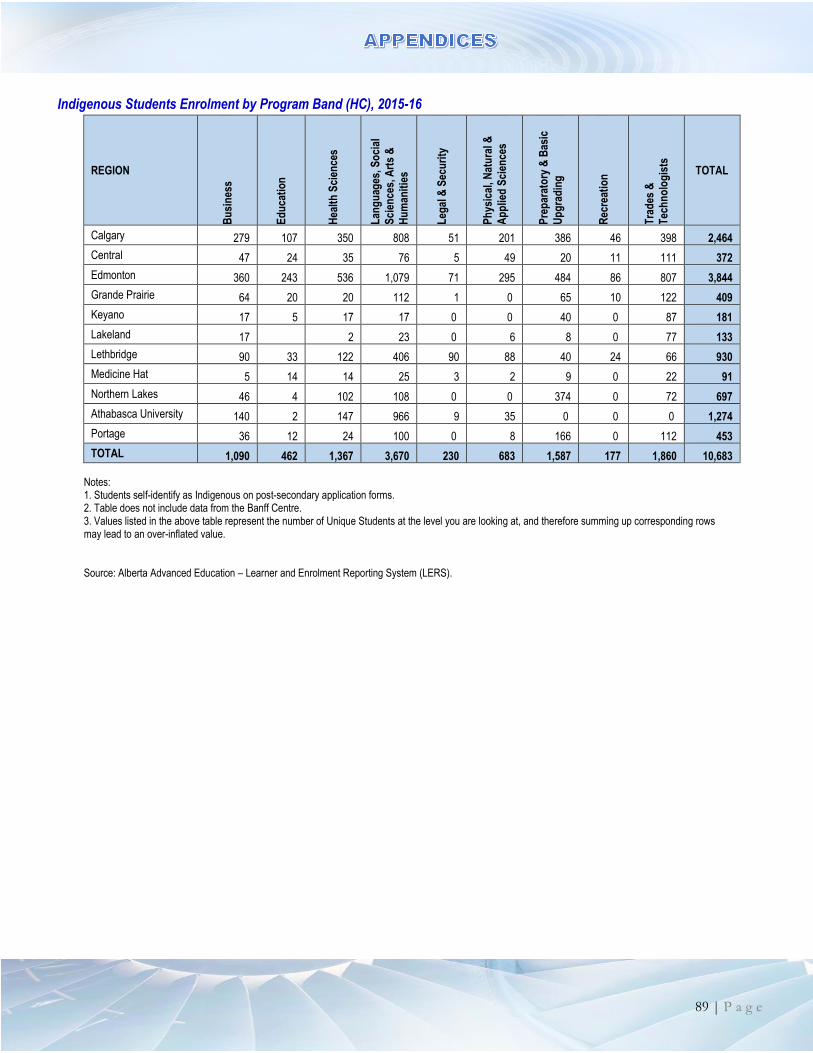
89 | P a g e
Indigenous Students Enrolment by Program Band (HC), 2015-16
REGION
Bu
sin
ess
Ed
uca
tio
n
Hea
lth
Sci
ence
s
Lan
gu
ages
, So
cial
Sci
ence
s, A
rts
&
Hu
man
itie
s
Leg
al &
Sec
uri
ty
Ph
ysic
al, N
atu
ral &
Ap
plie
d S
cien
ces
Pre
par
ato
ry &
Bas
ic
Up
gra
din
g
Rec
reat
ion
Tra
des
&
Tec
hn
olo
gis
ts
TOTAL
Calgary 279 107 350 808 51 201 386 46 398 2,464
Central 47 24 35 76 5 49 20 11 111 372
Edmonton 360 243 536 1,079 71 295 484 86 807 3,844
Grande Prairie 64 20 20 112 1 0 65 10 122 409
Keyano 17 5 17 17 0 0 40 0 87 181
Lakeland 17 2 23 0 6 8 0 77 133
Lethbridge 90 33 122 406 90 88 40 24 66 930
Medicine Hat 5 14 14 25 3 2 9 0 22 91
Northern Lakes 46 4 102 108 0 0 374 0 72 697
Athabasca University 140 2 147 966 9 35 0 0 0 1,274
Portage 36 12 24 100 0 8 166 0 112 453
TOTAL 1,090 462 1,367 3,670 230 683 1,587 177 1,860 10,683
Notes: 1. Students self-identify as Indigenous on post-secondary application forms. 2. Table does not include data from the Banff Centre. 3. Values listed in the above table represent the number of Unique Students at the level you are looking at, and therefore summing up corresponding rows may lead to an over-inflated value. Source: Alberta Advanced Education – Learner and Enrolment Reporting System (LERS).
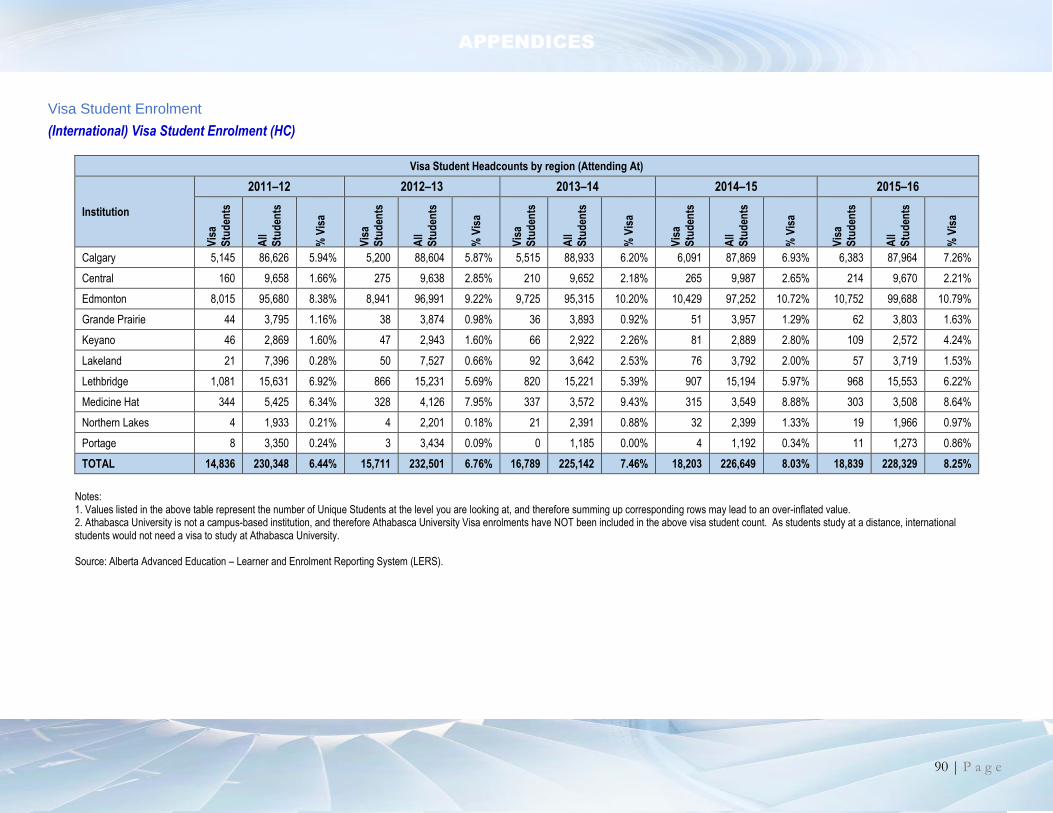
APPENDICES
90 | P a g e
Visa Student Enrolment
(International) Visa Student Enrolment (HC)
Visa Student Headcounts by region (Attending At)
Institution
2011–12 2012–13 2013–14 2014–15 2015–16
Vis
a
Stu
den
ts
All
Stu
den
ts
% V
isa
Vis
a
Stu
den
ts
All
Stu
den
ts
% V
isa
Vis
a
Stu
den
ts
All
Stu
den
ts
% V
isa
Vis
a
Stu
den
ts
All
Stu
den
ts
% V
isa
Vis
a
Stu
den
ts
All
Stu
den
ts
% V
isa
Calgary 5,145 86,626 5.94% 5,200 88,604 5.87% 5,515 88,933 6.20% 6,091 87,869 6.93% 6,383 87,964 7.26%
Central 160 9,658 1.66% 275 9,638 2.85% 210 9,652 2.18% 265 9,987 2.65% 214 9,670 2.21%
Edmonton 8,015 95,680 8.38% 8,941 96,991 9.22% 9,725 95,315 10.20% 10,429 97,252 10.72% 10,752 99,688 10.79%
Grande Prairie 44 3,795 1.16% 38 3,874 0.98% 36 3,893 0.92% 51 3,957 1.29% 62 3,803 1.63%
Keyano 46 2,869 1.60% 47 2,943 1.60% 66 2,922 2.26% 81 2,889 2.80% 109 2,572 4.24%
Lakeland 21 7,396 0.28% 50 7,527 0.66% 92 3,642 2.53% 76 3,792 2.00% 57 3,719 1.53%
Lethbridge 1,081 15,631 6.92% 866 15,231 5.69% 820 15,221 5.39% 907 15,194 5.97% 968 15,553 6.22%
Medicine Hat 344 5,425 6.34% 328 4,126 7.95% 337 3,572 9.43% 315 3,549 8.88% 303 3,508 8.64%
Northern Lakes 4 1,933 0.21% 4 2,201 0.18% 21 2,391 0.88% 32 2,399 1.33% 19 1,966 0.97%
Portage 8 3,350 0.24% 3 3,434 0.09% 0 1,185 0.00% 4 1,192 0.34% 11 1,273 0.86%
TOTAL 14,836 230,348 6.44% 15,711 232,501 6.76% 16,789 225,142 7.46% 18,203 226,649 8.03% 18,839 228,329 8.25%
Notes: 1. Values listed in the above table represent the number of Unique Students at the level you are looking at, and therefore summing up corresponding rows may lead to an over-inflated value. 2. Athabasca University is not a campus-based institution, and therefore Athabasca University Visa enrolments have NOT been included in the above visa student count. As students study at a distance, international students would not need a visa to study at Athabasca University. Source: Alberta Advanced Education – Learner and Enrolment Reporting System (LERS).
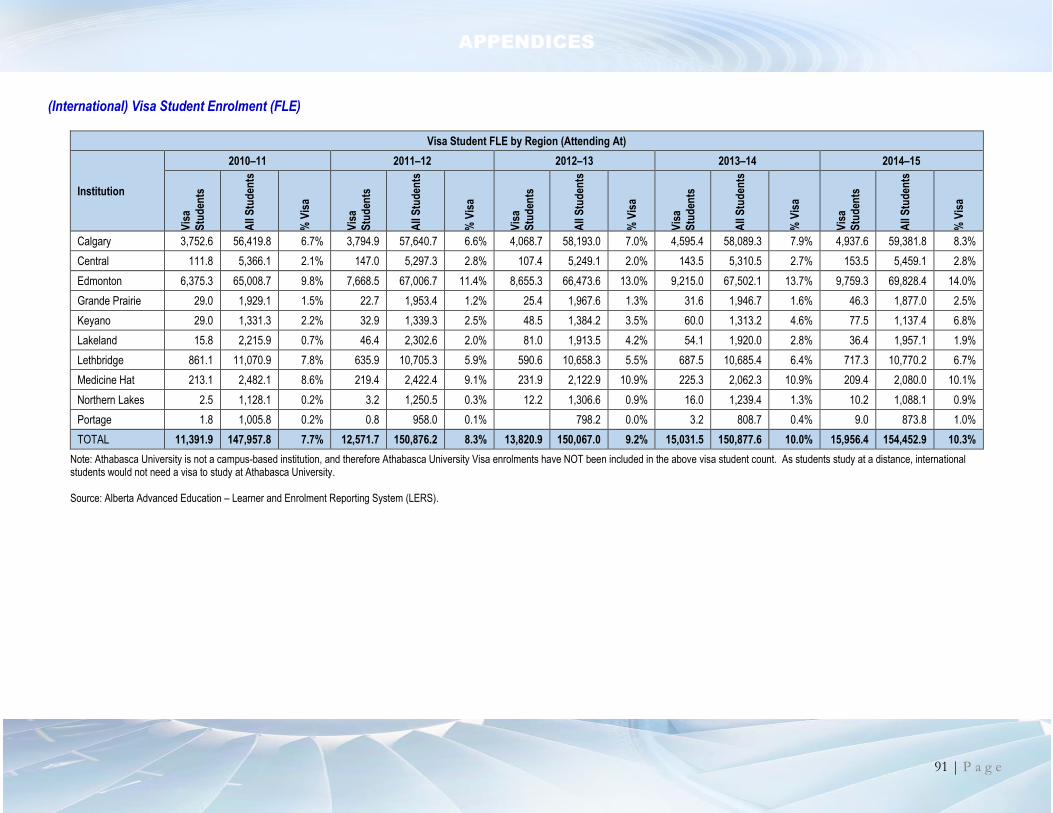
APPENDICES
91 | P a g e
(International) Visa Student Enrolment (FLE)
Visa Student FLE by Region (Attending At)
Institution
2010–11 2011–12 2012–13 2013–14 2014–15
Vis
a
Stu
den
ts
All
Stu
den
ts
% V
isa
Vis
a
Stu
den
ts
All
Stu
den
ts
% V
isa
Vis
a
Stu
den
ts
All
Stu
den
ts
% V
isa
Vis
a
Stu
den
ts
All
Stu
den
ts
% V
isa
Vis
a
Stu
den
ts
All
Stu
den
ts
% V
isa
Calgary 3,752.6 56,419.8 6.7% 3,794.9 57,640.7 6.6% 4,068.7 58,193.0 7.0% 4,595.4 58,089.3 7.9% 4,937.6 59,381.8 8.3%
Central 111.8 5,366.1 2.1% 147.0 5,297.3 2.8% 107.4 5,249.1 2.0% 143.5 5,310.5 2.7% 153.5 5,459.1 2.8%
Edmonton 6,375.3 65,008.7 9.8% 7,668.5 67,006.7 11.4% 8,655.3 66,473.6 13.0% 9,215.0 67,502.1 13.7% 9,759.3 69,828.4 14.0%
Grande Prairie 29.0 1,929.1 1.5% 22.7 1,953.4 1.2% 25.4 1,967.6 1.3% 31.6 1,946.7 1.6% 46.3 1,877.0 2.5%
Keyano 29.0 1,331.3 2.2% 32.9 1,339.3 2.5% 48.5 1,384.2 3.5% 60.0 1,313.2 4.6% 77.5 1,137.4 6.8%
Lakeland 15.8 2,215.9 0.7% 46.4 2,302.6 2.0% 81.0 1,913.5 4.2% 54.1 1,920.0 2.8% 36.4 1,957.1 1.9%
Lethbridge 861.1 11,070.9 7.8% 635.9 10,705.3 5.9% 590.6 10,658.3 5.5% 687.5 10,685.4 6.4% 717.3 10,770.2 6.7%
Medicine Hat 213.1 2,482.1 8.6% 219.4 2,422.4 9.1% 231.9 2,122.9 10.9% 225.3 2,062.3 10.9% 209.4 2,080.0 10.1%
Northern Lakes 2.5 1,128.1 0.2% 3.2 1,250.5 0.3% 12.2 1,306.6 0.9% 16.0 1,239.4 1.3% 10.2 1,088.1 0.9%
Portage 1.8 1,005.8 0.2% 0.8 958.0 0.1% 798.2 0.0% 3.2 808.7 0.4% 9.0 873.8 1.0%
TOTAL 11,391.9 147,957.8 7.7% 12,571.7 150,876.2 8.3% 13,820.9 150,067.0 9.2% 15,031.5 150,877.6 10.0% 15,956.4 154,452.9 10.3%
Note: Athabasca University is not a campus-based institution, and therefore Athabasca University Visa enrolments have NOT been included in the above visa student count. As students study at a distance, international students would not need a visa to study at Athabasca University. Source: Alberta Advanced Education – Learner and Enrolment Reporting System (LERS).
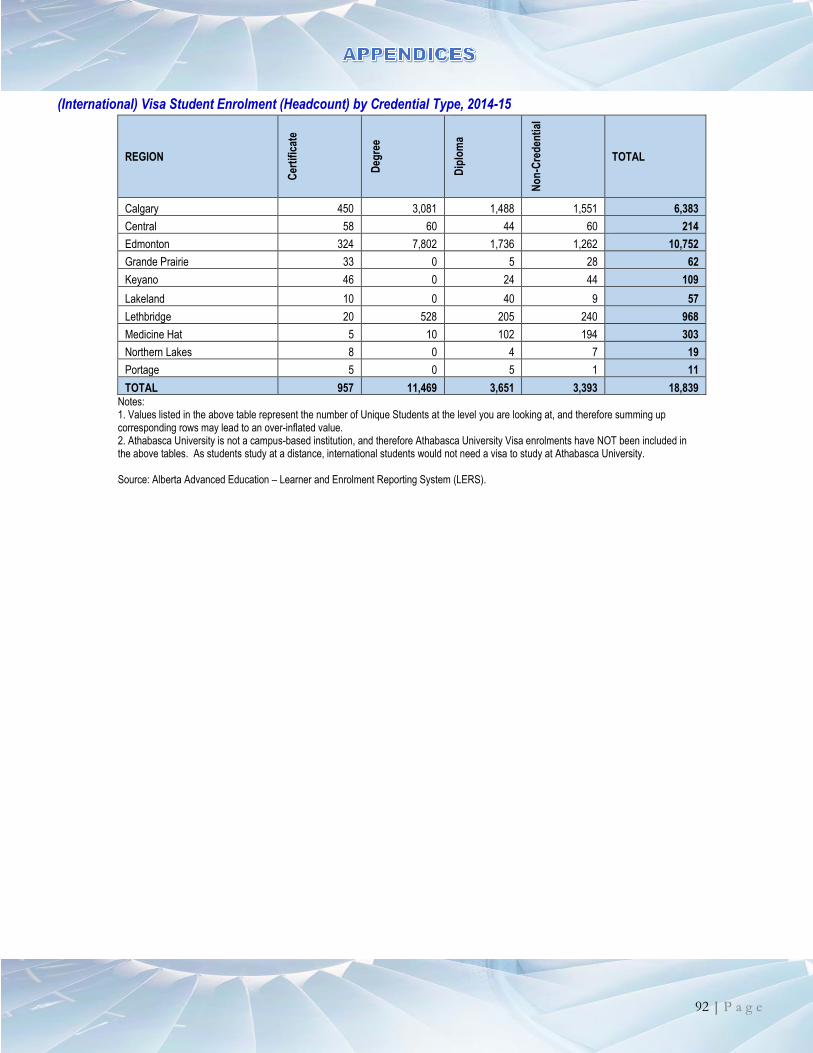
92 | P a g e
(International) Visa Student Enrolment (Headcount) by Credential Type, 2014-15
REGION
Cer
tifi
cate
Deg
ree
Dip
lom
a
No
n-C
red
enti
al
TOTAL
Calgary 450 3,081 1,488 1,551 6,383
Central 58 60 44 60 214
Edmonton 324 7,802 1,736 1,262 10,752
Grande Prairie 33 0 5 28 62
Keyano 46 0 24 44 109
Lakeland 10 0 40 9 57
Lethbridge 20 528 205 240 968
Medicine Hat 5 10 102 194 303
Northern Lakes 8 0 4 7 19
Portage 5 0 5 1 11
TOTAL 957 11,469 3,651 3,393 18,839 Notes: 1. Values listed in the above table represent the number of Unique Students at the level you are looking at, and therefore summing up corresponding rows may lead to an over-inflated value. 2. Athabasca University is not a campus-based institution, and therefore Athabasca University Visa enrolments have NOT been included in the above tables. As students study at a distance, international students would not need a visa to study at Athabasca University. Source: Alberta Advanced Education – Learner and Enrolment Reporting System (LERS).

93 | P a g e
VISA Students Enrolment by Program Band (HC), 2015-16
REGION B
usi
nes
s
Ed
uca
tio
n
Hea
lth
Sci
ence
s
Lan
gu
ages
,
So
cial
Sci
ence
s,
Art
s &
Hu
man
itie
s
Leg
al &
Sec
uri
ty
Ph
ysic
al, N
atu
ral
& A
pp
lied
Sci
ence
s
Pre
par
ato
ry &
Bas
ic U
pg
rad
ing
Rec
reat
ion
Tra
des
&
Tec
hn
olo
gis
ts
TOTAL
Calgary 1,118 48 449 1,803 61 1,916 611 43 631 6,383
Central 67 11 25 50 3 40 6 15 9 214
Edmonton 2,115 120 844 3,305 21 4,165 191 65 407 10,752
Grande Prairie 16 0 8 23 0 1 2 3 12 62
Keyano 50 0 6 15 0 1 30 2 9 109
Lakeland 36 2 1 13 2 1 0 0 3 57
Lethbridge 258 3 61 357 8 219 61 10 22 968
Medicine Hat 82 2 8 52 2 13 141 2 13 303
Northern Lakes 0 0 7 1 0 0 7 0 4 19
Portage 4 0 3 1 0 2 0 0 1 11
TOTAL 3,743 186 1,411 5,614 97 6,348 1,047 140 1,111 18,839
Notes: 1. Values listed in the above table represent the number of Unique Students at the level you are looking at, and therefore summing up corresponding rows may lead to an over-inflated value. 2. Athabasca University is not a campus-based institution, and therefore Athabasca University Visa enrolments have NOT been included in the above tables. As students study at a distance, international students would not need a visa to study at Athabasca University. Source: Alberta Advanced Education – Learner and Enrolment Reporting System (LERS).
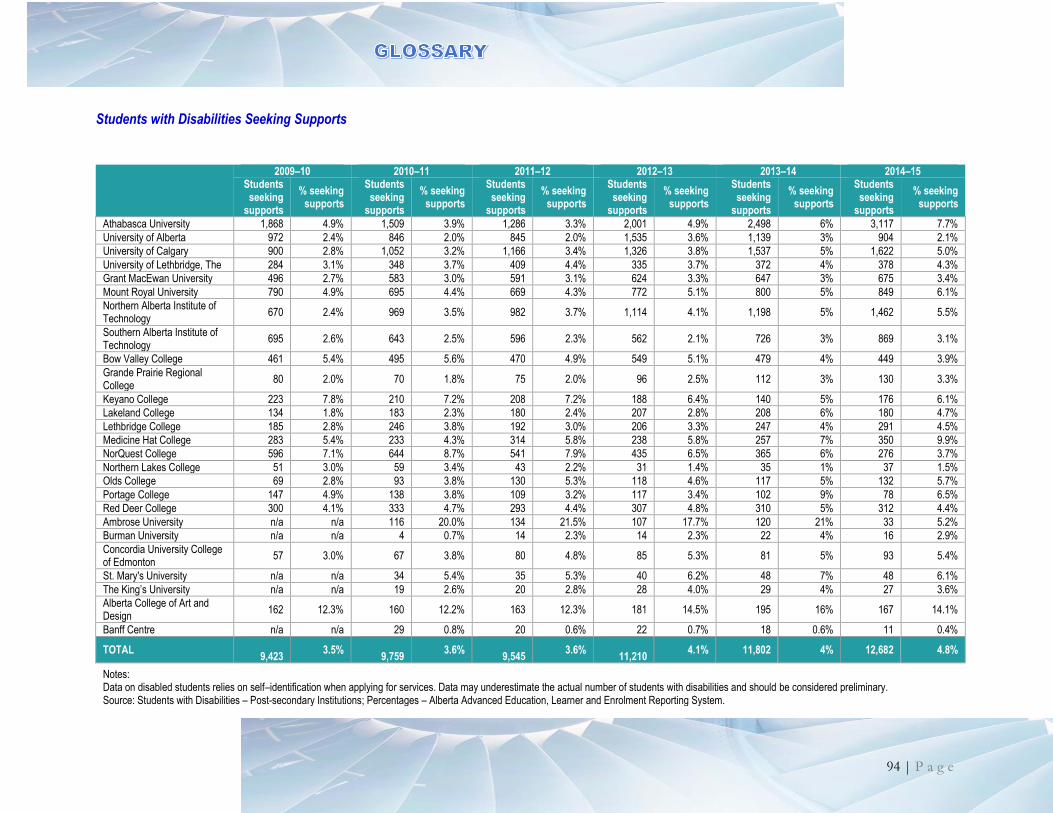
94 | P a g e
Students with Disabilities Seeking Supports
2009–10 2010–11 2011–12 2012–13 2013–14 2014–15 Students
seeking supports
% seeking supports
Students seeking
supports
% seeking supports
Students seeking
supports
% seeking supports
Students seeking
supports
% seeking supports
Students seeking
supports
% seeking supports
Students seeking
supports
% seeking supports
Athabasca University 1,868 4.9% 1,509 3.9% 1,286 3.3% 2,001 4.9% 2,498 6% 3,117 7.7%
University of Alberta 972 2.4% 846 2.0% 845 2.0% 1,535 3.6% 1,139 3% 904 2.1%
University of Calgary 900 2.8% 1,052 3.2% 1,166 3.4% 1,326 3.8% 1,537 5% 1,622 5.0%
University of Lethbridge, The 284 3.1% 348 3.7% 409 4.4% 335 3.7% 372 4% 378 4.3%
Grant MacEwan University 496 2.7% 583 3.0% 591 3.1% 624 3.3% 647 3% 675 3.4%
Mount Royal University 790 4.9% 695 4.4% 669 4.3% 772 5.1% 800 5% 849 6.1%
Northern Alberta Institute of Technology
670 2.4% 969 3.5% 982 3.7% 1,114 4.1% 1,198 5% 1,462 5.5%
Southern Alberta Institute of Technology
695 2.6% 643 2.5% 596 2.3% 562 2.1% 726 3% 869 3.1%
Bow Valley College 461 5.4% 495 5.6% 470 4.9% 549 5.1% 479 4% 449 3.9%
Grande Prairie Regional College
80 2.0% 70 1.8% 75 2.0% 96 2.5% 112 3% 130 3.3%
Keyano College 223 7.8% 210 7.2% 208 7.2% 188 6.4% 140 5% 176 6.1%
Lakeland College 134 1.8% 183 2.3% 180 2.4% 207 2.8% 208 6% 180 4.7%
Lethbridge College 185 2.8% 246 3.8% 192 3.0% 206 3.3% 247 4% 291 4.5%
Medicine Hat College 283 5.4% 233 4.3% 314 5.8% 238 5.8% 257 7% 350 9.9%
NorQuest College 596 7.1% 644 8.7% 541 7.9% 435 6.5% 365 6% 276 3.7%
Northern Lakes College 51 3.0% 59 3.4% 43 2.2% 31 1.4% 35 1% 37 1.5%
Olds College 69 2.8% 93 3.8% 130 5.3% 118 4.6% 117 5% 132 5.7%
Portage College 147 4.9% 138 3.8% 109 3.2% 117 3.4% 102 9% 78 6.5%
Red Deer College 300 4.1% 333 4.7% 293 4.4% 307 4.8% 310 5% 312 4.4%
Ambrose University n/a n/a 116 20.0% 134 21.5% 107 17.7% 120 21% 33 5.2%
Burman University n/a n/a 4 0.7% 14 2.3% 14 2.3% 22 4% 16 2.9%
Concordia University College of Edmonton
57 3.0% 67 3.8% 80 4.8% 85 5.3% 81 5% 93 5.4%
St. Mary's University n/a n/a 34 5.4% 35 5.3% 40 6.2% 48 7% 48 6.1%
The King’s University n/a n/a 19 2.6% 20 2.8% 28 4.0% 29 4% 27 3.6%
Alberta College of Art and Design
162 12.3% 160 12.2% 163 12.3% 181 14.5% 195 16% 167 14.1%
Banff Centre n/a n/a 29 0.8% 20 0.6% 22 0.7% 18 0.6% 11 0.4%
TOTAL
9,423 3.5%
9,759
3.6%
9,545 3.6%
11,210
4.1% 11,802 4% 12,682 4.8%
Notes: Data on disabled students relies on self–identification when applying for services. Data may underestimate the actual number of students with disabilities and should be considered preliminary. Source: Students with Disabilities – Post-secondary Institutions; Percentages – Alberta Advanced Education, Learner and Enrolment Reporting System.
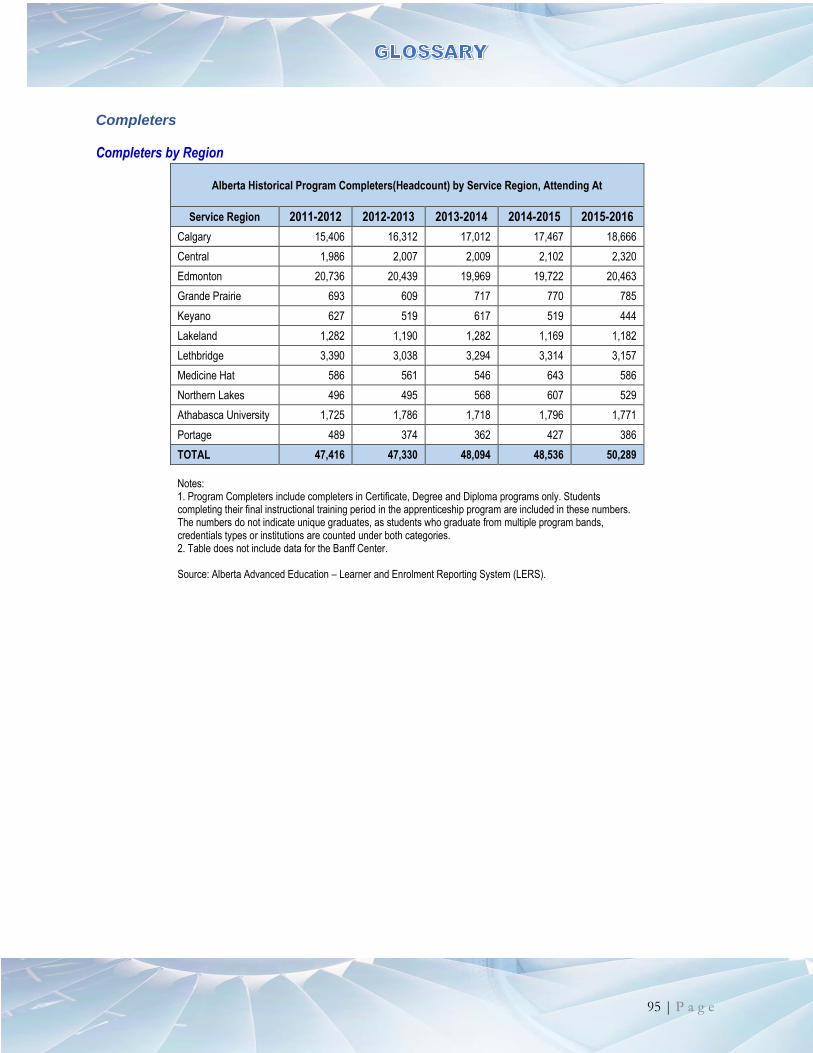
95 | P a g e
Completers
Completers by Region
Alberta Historical Program Completers(Headcount) by Service Region, Attending At
Service Region 2011-2012 2012-2013 2013-2014 2014-2015 2015-2016
Calgary 15,406 16,312 17,012 17,467 18,666
Central 1,986 2,007 2,009 2,102 2,320
Edmonton 20,736 20,439 19,969 19,722 20,463
Grande Prairie 693 609 717 770 785
Keyano 627 519 617 519 444
Lakeland 1,282 1,190 1,282 1,169 1,182
Lethbridge 3,390 3,038 3,294 3,314 3,157
Medicine Hat 586 561 546 643 586
Northern Lakes 496 495 568 607 529
Athabasca University 1,725 1,786 1,718 1,796 1,771
Portage 489 374 362 427 386
TOTAL 47,416 47,330 48,094 48,536 50,289
Notes: 1. Program Completers include completers in Certificate, Degree and Diploma programs only. Students completing their final instructional training period in the apprenticeship program are included in these numbers. The numbers do not indicate unique graduates, as students who graduate from multiple program bands, credentials types or institutions are counted under both categories. 2. Table does not include data for the Banff Center. Source: Alberta Advanced Education – Learner and Enrolment Reporting System (LERS).
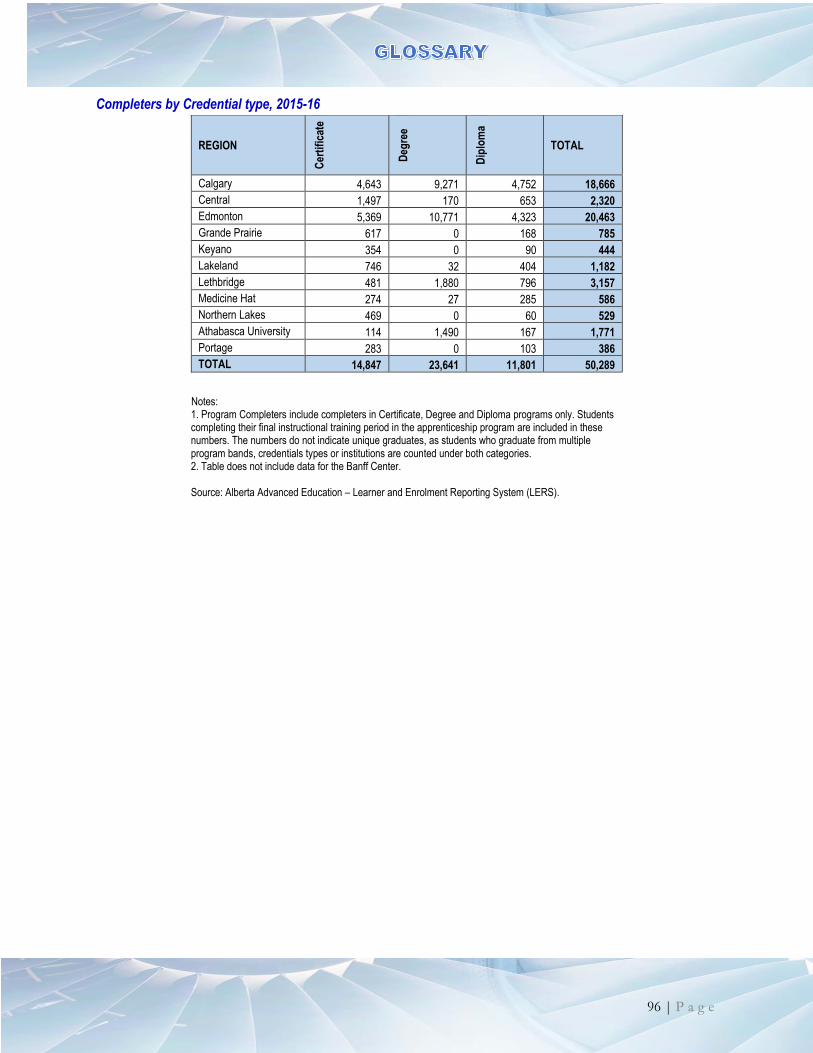
96 | P a g e
Completers by Credential type, 2015-16
REGION
Cer
tifi
cate
Deg
ree
Dip
lom
a
TOTAL
Calgary 4,643 9,271 4,752 18,666
Central 1,497 170 653 2,320
Edmonton 5,369 10,771 4,323 20,463
Grande Prairie 617 0 168 785
Keyano 354 0 90 444
Lakeland 746 32 404 1,182
Lethbridge 481 1,880 796 3,157
Medicine Hat 274 27 285 586
Northern Lakes 469 0 60 529
Athabasca University 114 1,490 167 1,771
Portage 283 0 103 386
TOTAL 14,847 23,641 11,801 50,289
Notes: 1. Program Completers include completers in Certificate, Degree and Diploma programs only. Students completing their final instructional training period in the apprenticeship program are included in these numbers. The numbers do not indicate unique graduates, as students who graduate from multiple program bands, credentials types or institutions are counted under both categories. 2. Table does not include data for the Banff Center. Source: Alberta Advanced Education – Learner and Enrolment Reporting System (LERS).
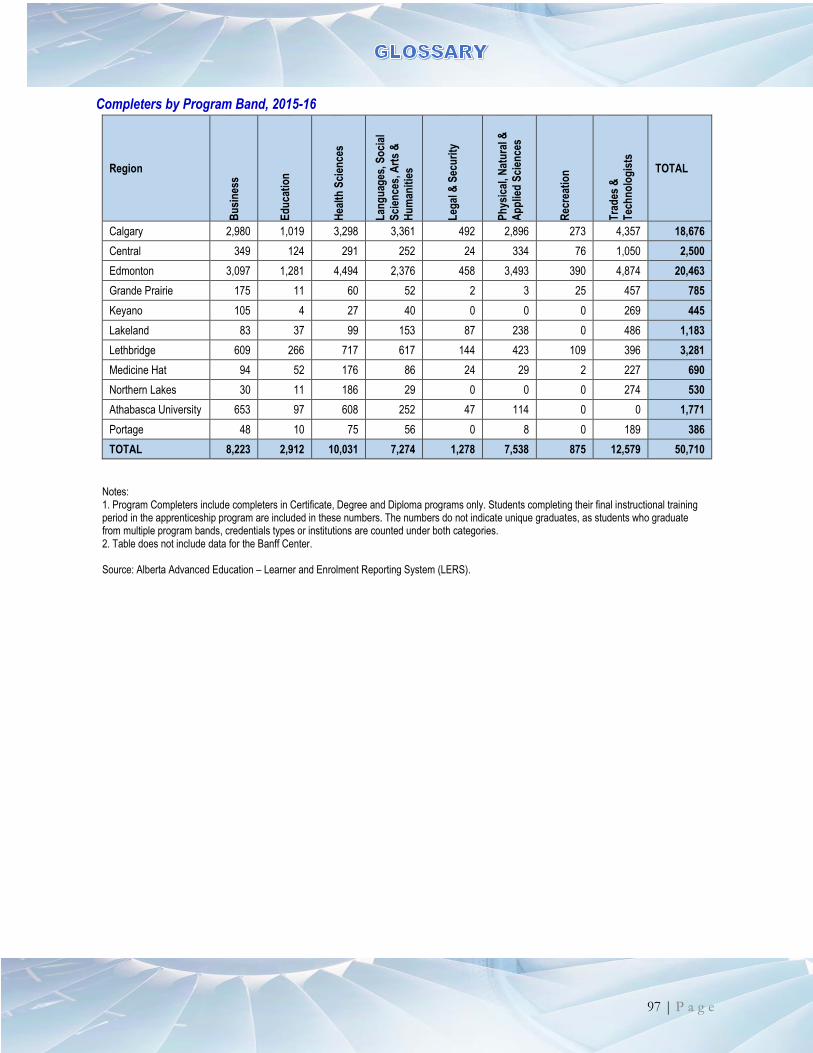
97 | P a g e
Completers by Program Band, 2015-16
Region
Bu
sin
ess
Ed
uca
tio
n
Hea
lth
Sci
ence
s
Lan
gu
ages
, So
cial
Sci
ence
s, A
rts
&
Hu
man
itie
s
Leg
al &
Sec
uri
ty
Ph
ysic
al, N
atu
ral &
Ap
plie
d S
cien
ces
Rec
reat
ion
Tra
des
&
Tec
hn
olo
gis
ts
TOTAL
Calgary 2,980 1,019 3,298 3,361 492 2,896 273 4,357 18,676
Central 349 124 291 252 24 334 76 1,050 2,500
Edmonton 3,097 1,281 4,494 2,376 458 3,493 390 4,874 20,463
Grande Prairie 175 11 60 52 2 3 25 457 785
Keyano 105 4 27 40 0 0 0 269 445
Lakeland 83 37 99 153 87 238 0 486 1,183
Lethbridge 609 266 717 617 144 423 109 396 3,281
Medicine Hat 94 52 176 86 24 29 2 227 690
Northern Lakes 30 11 186 29 0 0 0 274 530
Athabasca University 653 97 608 252 47 114 0 0 1,771
Portage 48 10 75 56 0 8 0 189 386
TOTAL 8,223 2,912 10,031 7,274 1,278 7,538 875 12,579 50,710
Notes: 1. Program Completers include completers in Certificate, Degree and Diploma programs only. Students completing their final instructional training period in the apprenticeship program are included in these numbers. The numbers do not indicate unique graduates, as students who graduate from multiple program bands, credentials types or institutions are counted under both categories. 2. Table does not include data for the Banff Center. Source: Alberta Advanced Education – Learner and Enrolment Reporting System (LERS).
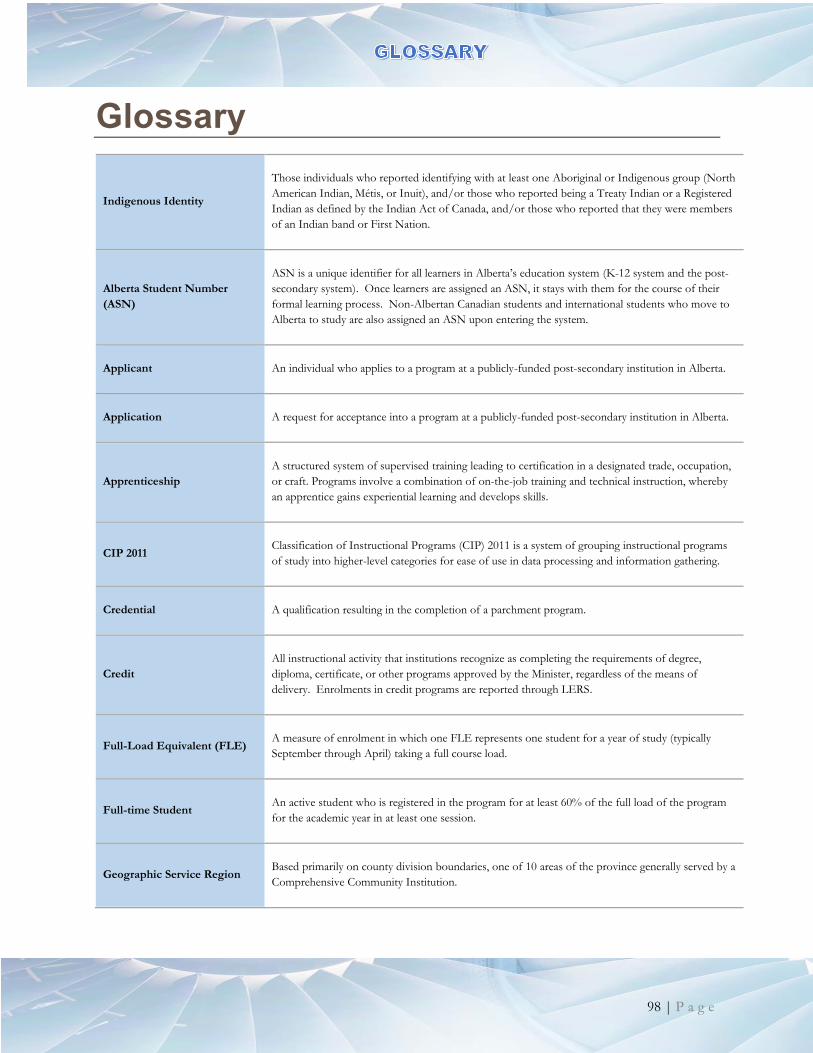
98 | P a g e
Glossary
Indigenous Identity
Those individuals who reported identifying with at least one Aboriginal or Indigenous group (North
American Indian, Métis, or Inuit), and/or those who reported being a Treaty Indian or a Registered
Indian as defined by the Indian Act of Canada, and/or those who reported that they were members
of an Indian band or First Nation.
Alberta Student Number
(ASN)
ASN is a unique identifier for all learners in Alberta’s education system (K-12 system and the post-
secondary system). Once learners are assigned an ASN, it stays with them for the course of their
formal learning process. Non-Albertan Canadian students and international students who move to
Alberta to study are also assigned an ASN upon entering the system.
Applicant An individual who applies to a program at a publicly-funded post-secondary institution in Alberta.
Application A request for acceptance into a program at a publicly-funded post-secondary institution in Alberta.
Apprenticeship
A structured system of supervised training leading to certification in a designated trade, occupation,
or craft. Programs involve a combination of on-the-job training and technical instruction, whereby
an apprentice gains experiential learning and develops skills.
CIP 2011 Classification of Instructional Programs (CIP) 2011 is a system of grouping instructional programs
of study into higher-level categories for ease of use in data processing and information gathering.
Credential A qualification resulting in the completion of a parchment program.
Credit
All instructional activity that institutions recognize as completing the requirements of degree,
diploma, certificate, or other programs approved by the Minister, regardless of the means of
delivery. Enrolments in credit programs are reported through LERS.
Full-Load Equivalent (FLE) A measure of enrolment in which one FLE represents one student for a year of study (typically
September through April) taking a full course load.
Full-time Student An active student who is registered in the program for at least 60% of the full load of the program
for the academic year in at least one session.
Geographic Service Region Based primarily on county division boundaries, one of 10 areas of the province generally served by a
Comprehensive Community Institution.
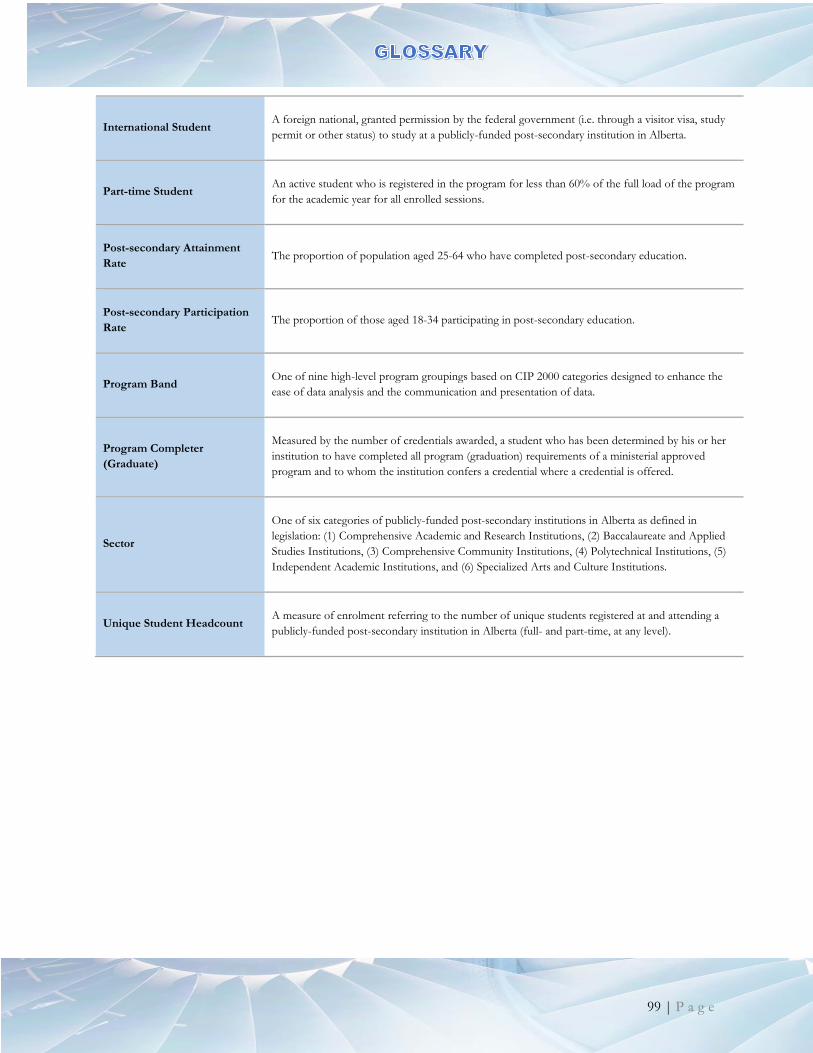
99 | P a g e
International Student A foreign national, granted permission by the federal government (i.e. through a visitor visa, study
permit or other status) to study at a publicly-funded post-secondary institution in Alberta.
Part-time Student An active student who is registered in the program for less than 60% of the full load of the program
for the academic year for all enrolled sessions.
Post-secondary Attainment
Rate The proportion of population aged 25-64 who have completed post-secondary education.
Post-secondary Participation
Rate The proportion of those aged 18-34 participating in post-secondary education.
Program Band One of nine high-level program groupings based on CIP 2000 categories designed to enhance the
ease of data analysis and the communication and presentation of data.
Program Completer
(Graduate)
Measured by the number of credentials awarded, a student who has been determined by his or her
institution to have completed all program (graduation) requirements of a ministerial approved
program and to whom the institution confers a credential where a credential is offered.
Sector
One of six categories of publicly-funded post-secondary institutions in Alberta as defined in
legislation: (1) Comprehensive Academic and Research Institutions, (2) Baccalaureate and Applied
Studies Institutions, (3) Comprehensive Community Institutions, (4) Polytechnical Institutions, (5)
Independent Academic Institutions, and (6) Specialized Arts and Culture Institutions.
Unique Student Headcount A measure of enrolment referring to the number of unique students registered at and attending a
publicly-funded post-secondary institution in Alberta (full- and part-time, at any level).
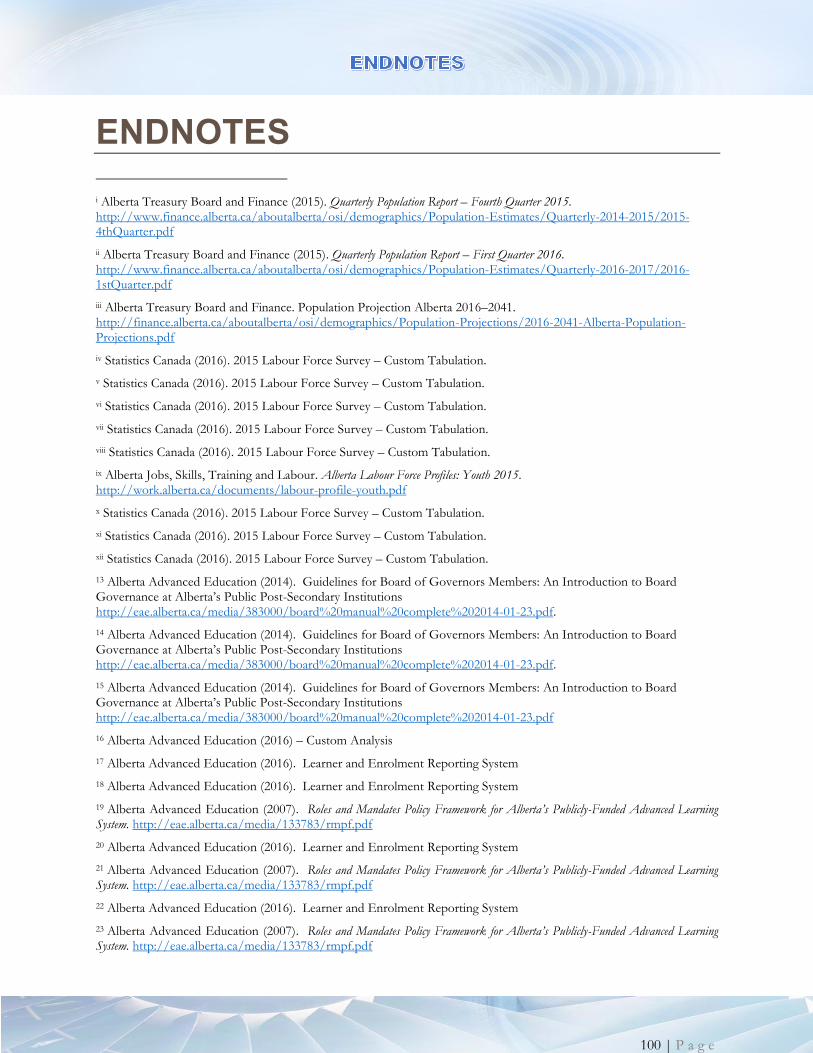
100 | P a g e
ENDNOTES
i Alberta Treasury Board and Finance (2015). Quarterly Population Report – Fourth Quarter 2015. http://www.finance.alberta.ca/aboutalberta/osi/demographics/Population-Estimates/Quarterly-2014-2015/2015-4thQuarter.pdf
ii Alberta Treasury Board and Finance (2015). Quarterly Population Report – First Quarter 2016. http://www.finance.alberta.ca/aboutalberta/osi/demographics/Population-Estimates/Quarterly-2016-2017/2016-1stQuarter.pdf
iii Alberta Treasury Board and Finance. Population Projection Alberta 2016–2041. http://finance.alberta.ca/aboutalberta/osi/demographics/Population-Projections/2016-2041-Alberta-Population-Projections.pdf
iv Statistics Canada (2016). 2015 Labour Force Survey – Custom Tabulation.
v Statistics Canada (2016). 2015 Labour Force Survey – Custom Tabulation.
vi Statistics Canada (2016). 2015 Labour Force Survey – Custom Tabulation.
vii Statistics Canada (2016). 2015 Labour Force Survey – Custom Tabulation.
viii Statistics Canada (2016). 2015 Labour Force Survey – Custom Tabulation.
ix Alberta Jobs, Skills, Training and Labour. Alberta Labour Force Profiles: Youth 2015. http://work.alberta.ca/documents/labour-profile-youth.pdf
x Statistics Canada (2016). 2015 Labour Force Survey – Custom Tabulation.
xi Statistics Canada (2016). 2015 Labour Force Survey – Custom Tabulation.
xii Statistics Canada (2016). 2015 Labour Force Survey – Custom Tabulation.
13 Alberta Advanced Education (2014). Guidelines for Board of Governors Members: An Introduction to Board Governance at Alberta’s Public Post-Secondary Institutions http://eae.alberta.ca/media/383000/board%20manual%20complete%202014-01-23.pdf.
14 Alberta Advanced Education (2014). Guidelines for Board of Governors Members: An Introduction to Board Governance at Alberta’s Public Post-Secondary Institutions http://eae.alberta.ca/media/383000/board%20manual%20complete%202014-01-23.pdf.
15 Alberta Advanced Education (2014). Guidelines for Board of Governors Members: An Introduction to Board Governance at Alberta’s Public Post-Secondary Institutions http://eae.alberta.ca/media/383000/board%20manual%20complete%202014-01-23.pdf
16 Alberta Advanced Education (2016) – Custom Analysis
17 Alberta Advanced Education (2016). Learner and Enrolment Reporting System
18 Alberta Advanced Education (2016). Learner and Enrolment Reporting System
19 Alberta Advanced Education (2007). Roles and Mandates Policy Framework for Alberta’s Publicly-Funded Advanced Learning System. http://eae.alberta.ca/media/133783/rmpf.pdf
20 Alberta Advanced Education (2016). Learner and Enrolment Reporting System
21 Alberta Advanced Education (2007). Roles and Mandates Policy Framework for Alberta’s Publicly-Funded Advanced Learning System. http://eae.alberta.ca/media/133783/rmpf.pdf
22 Alberta Advanced Education (2016). Learner and Enrolment Reporting System
23 Alberta Advanced Education (2007). Roles and Mandates Policy Framework for Alberta’s Publicly-Funded Advanced Learning System. http://eae.alberta.ca/media/133783/rmpf.pdf
101 | P a g e
24 Alberta Advanced Education (2016). Learner and Enrolment Reporting System
25 Alberta Advanced Education (2007). Roles and Mandates Policy Framework for Alberta’s Publicly-Funded Advanced Learning System. http://eae.alberta.ca/media/133783/rmpf.pdf
26 Alberta Advanced Education (2007). Roles and Mandates Policy Framework for Alberta’s Publicly-Funded Advanced Learning System. http://eae.alberta.ca/media/133783/rmpf.pdf
27 Alberta Advanced Education (2016). Learner and Enrolment Reporting System
28 Alberta Advanced Education (2007). Roles and Mandates Policy Framework for Alberta’s Publicly-Funded Advanced Learning System. http://eae.alberta.ca/media/133783/rmpf.pdf
29 Alberta Advanced Education (2016). Learner and Enrolment Reporting System
30 There are six First Nations, Metis, and Inuit Colleges in Alberta that deliver post-secondary and foundational learning programs to Albertans. They offer accredited post-secondary courses, certificates, and degrees in partnership with publicly-funded post-secondary institutions. For links to First Nations, Metis, and Inuit Colleges in Alberta, see http://iae.alberta.ca/post-secondary/institutions/fnmi.aspx
31 Statistics Canada. Postsecondary enrolments, by registration status
http://www5.statcan.gc.ca/cansim/a26?lang=eng&id=4770019&p2=33
32 Alberta Advanced Education (2016). Learner and Enrolment Reporting System.
33 Leger Marketing Alberta Inc.. Alberta Graduate Outcomes Survey, http://iae.alberta.ca/ministry/stats/
34 For more information on services available to students with disabilities, see http://alis.alberta.ca/et/ep/pps/planning/disability.html.
35 Alberta Advanced Education (2015) – Student Aid.
36 Alberta Graduate Outcomes Survey Class of 2013–2014, Custom Tabulation
37 Alberta Council of Admissions and Transfer (2015). System Level Student Mobility – Year by Year http://www.acat.gov.ab.ca/new_format_include/research/pdfs/System-Level-Student-Mobility.pdf
38 Alberta and Advanced Education. High School Student Report. 2015-16 Stakeholder Satisfaction Survey.
39 Alberta and Advanced Education. High School Student Report. 2015-16 Stakeholder Satisfaction Survey.
40 Alberta Advanced Education. High School Student Report. 2015-16 Stakeholder Satisfaction Survey.
41 Leger Marketing Alberta Inc.. Alberta Graduate Outcomes Survey, http://iae.alberta.ca/ministry/stats/
42 Leger Marketing Alberta Inc. Alberta Graduate Outcomes Survey, http://iae.alberta.ca/ministry/stats/
43 Alberta Advanced Education – Student Aid.
44 Alberta Apprenticeship and Industry Training. 2015 Statistical Profiles. http://tradesecrets.alberta.ca/sources/pdfs/board_publications/statistical_profiles/2015_statistical_report.pdf
45 Alberta Apprenticeship and Industry Training. 2015 Statistical Profiles.
http://tradesecrets.alberta.ca/sources/pdfs/board_publications/statistical_profiles/2015_statistical_report.pdf
46 Alberta and Advanced Education. High School Student Report. 2015-16 Stakeholder Satisfaction Survey.
47 Alberta and Advanced Education. Self-Identified Aboriginal High School Student Report. 2015-16 Stakeholder Satisfaction Survey.
48 Alberta Advanced Education Annual Report 2015-16.
49 Community Adult Learning Program Guidelines: http://advancededucation.alberta.ca/media/479526/calp-guidelines-2016-august-2016.pdf
102 | P a g e
50 Community Adult Learning Program Logic Model:http://eae.alberta.ca/media/475341/calp-logic-model-and-outcomes-measurement-framework.pdf
51 Alberta Advanced Education – Private Career Colleges Branch. ii Students who are calculated in the job placement rate for a specific reporting period are those students who graduated in the reporting period and have had 90 days to find employment. Also calculated in the job placement rate are students who graduated in the previous reporting period i.e. April 1 - March 31 but did not have 90 days to find employment i.e. students who graduated after December 31.
52 Leger Marketing Alberta Inc.. Alberta Graduate Outcomes Survey, http://iae.alberta.ca/ministry/stats/
53 Leger Marketing Alberta Inc.. Alberta Graduate Outcomes Survey, http://iae.alberta.ca/ministry/stats/
54 Leger Marketing Alberta Inc.. Alberta Graduate Outcomes Survey, http://iae.alberta.ca/ministry/stats/
55 Leger Marketing Alberta Inc.. Alberta Graduate Outcomes Survey, http://iae.alberta.ca/ministry/stats/
56 Leger Marketing Alberta Inc.. Alberta Graduate Outcomes Survey, http://iae.alberta.ca/ministry/stats/
lvii Alberta Treasury Board and Finance. Alberta Population Projections, by Census Division, 2016–2041.
http://finance.alberta.ca/aboutalberta/osi/demographics/Population-Projections/2016-2041-Alberta-Population-
Projections.pdf