campus presentation| april 30, 2012 titan student union feasibility study
TRANSCRIPT

C A M P U S P R E S E N T A T I O N | A P R I L 3 0 , 2 0 1 2T I TA N S T U D E N T U N I O N F E A S I B I L I T Y S T U DY
PRESENTAT ION OUTL INE
OBJECTIVESPARTICIPATION & PROCESSPROGRAMS AND SERVICESFEE SENSITIVITYSATELLITE OPERATIONSEXISTING CONDITIONSPROJECT CONCEPTNEXT STEPSDISCUSSION
OBJECTIVES PARTICIPATION PROGRAMS & SERVICES FEE SENSITIVITY SATELLITE OPERATIONS EXISTING CONDITIONS PROJECT CONCEPT NEXT STEPS
OB JECT IVE
To provide a comprehensive feasibility study of the options available to the ASI
as it considers expanding the Titan Student Union facilities in order to
improve service delivery to the CSUF campus community.
OBJECTIVES PARTICIPATION PROGRAMS & SERVICES FEE SENSITIVITY SATELLITE OPERATIONS EXISTING CONDITIONS PROJECT CONCEPT NEXT STEPS
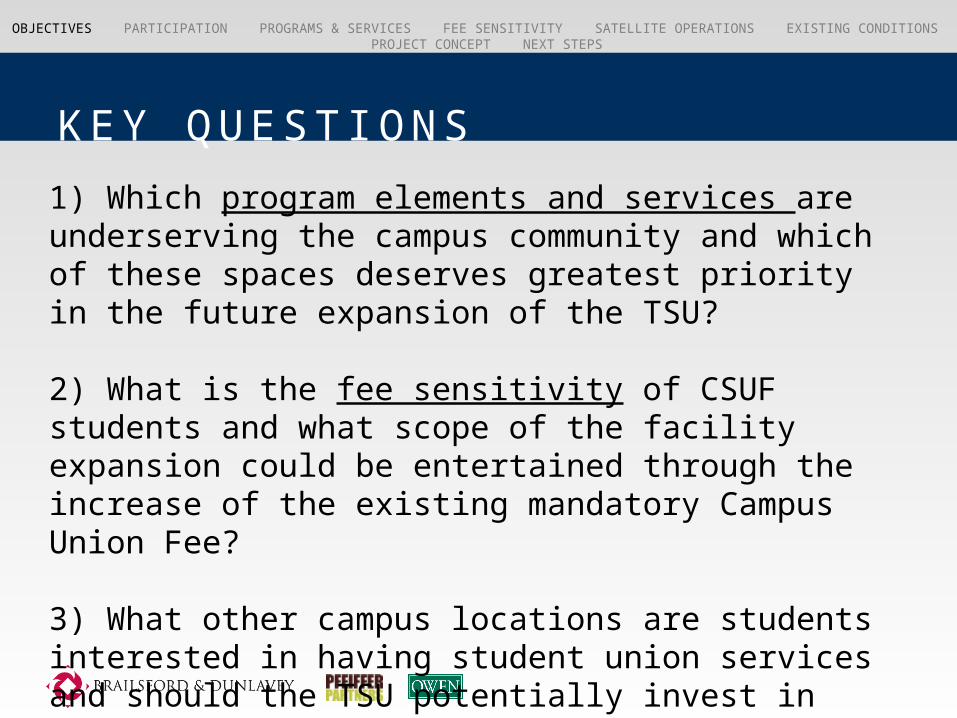
KEY QUEST IONS
1) Which program elements and services are underserving the campus community and which of these spaces deserves greatest priority in the future expansion of the TSU?
2) What is the fee sensitivity of CSUF students and what scope of the facility expansion could be entertained through the increase of the existing mandatory Campus Union Fee?
3) What other campus locations are students interested in having student union services and should the TSU potentially invest in establishing satellite operations?
OBJECTIVES PARTICIPATION PROGRAMS & SERVICES FEE SENSITIVITY SATELLITE OPERATIONS EXISTING CONDITIONS PROJECT CONCEPT NEXT STEPS
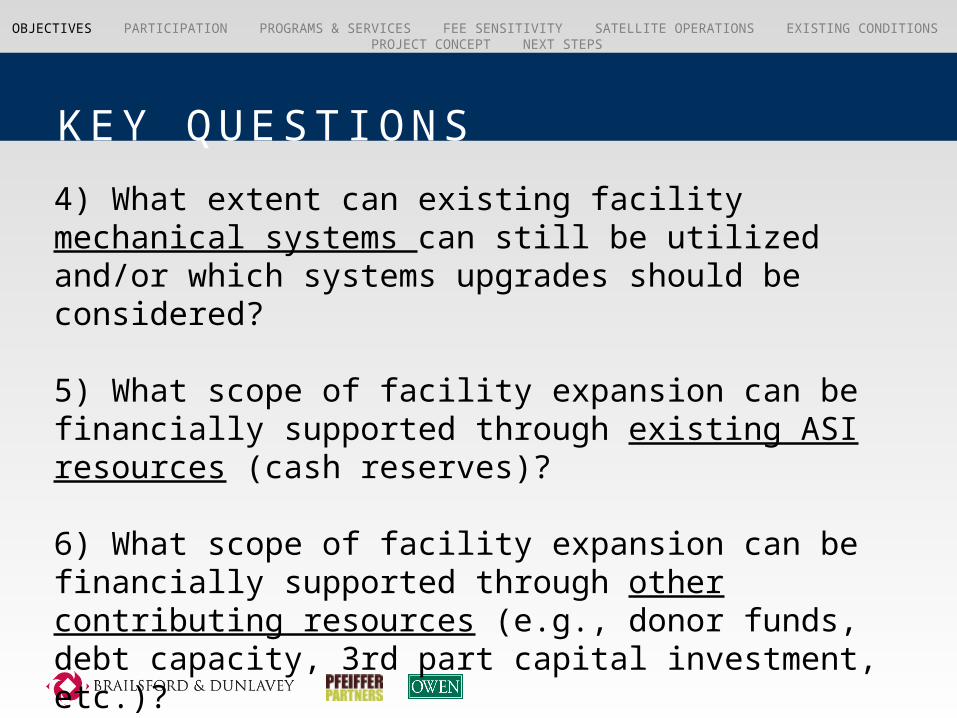
KEY QUEST IONS
4) What extent can existing facility mechanical systems can still be utilized and/or which systems upgrades should be considered?
5) What scope of facility expansion can be financially supported through existing ASI resources (cash reserves)?
6) What scope of facility expansion can be financially supported through other contributing resources (e.g., donor funds, debt capacity, 3rd part capital investment, etc.)?
OBJECTIVES PARTICIPATION PROGRAMS & SERVICES FEE SENSITIVITY SATELLITE OPERATIONS EXISTING CONDITIONS PROJECT CONCEPT NEXT STEPS
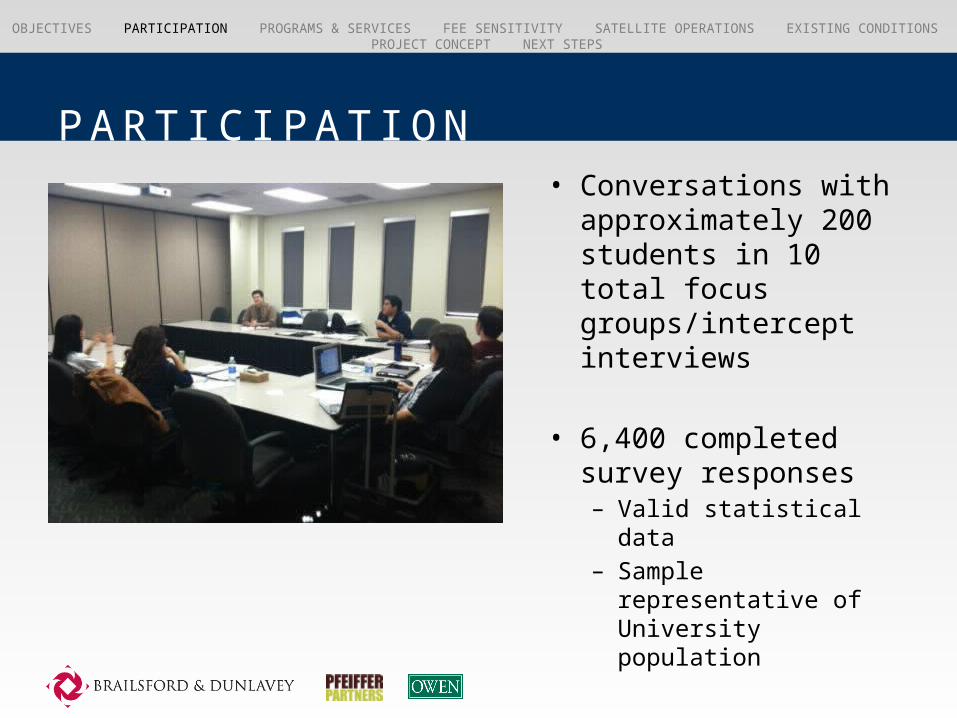
PART IC I PAT ION• Conversations with
approximately 200 students in 10 total focus groups/intercept interviews
• 6,400 completed survey responses– Valid statistical data– Sample
representative of University population
OBJECTIVES PARTICIPATION PROGRAMS & SERVICES FEE SENSITIVITY SATELLITE OPERATIONS EXISTING CONDITIONS PROJECT CONCEPT NEXT STEPS
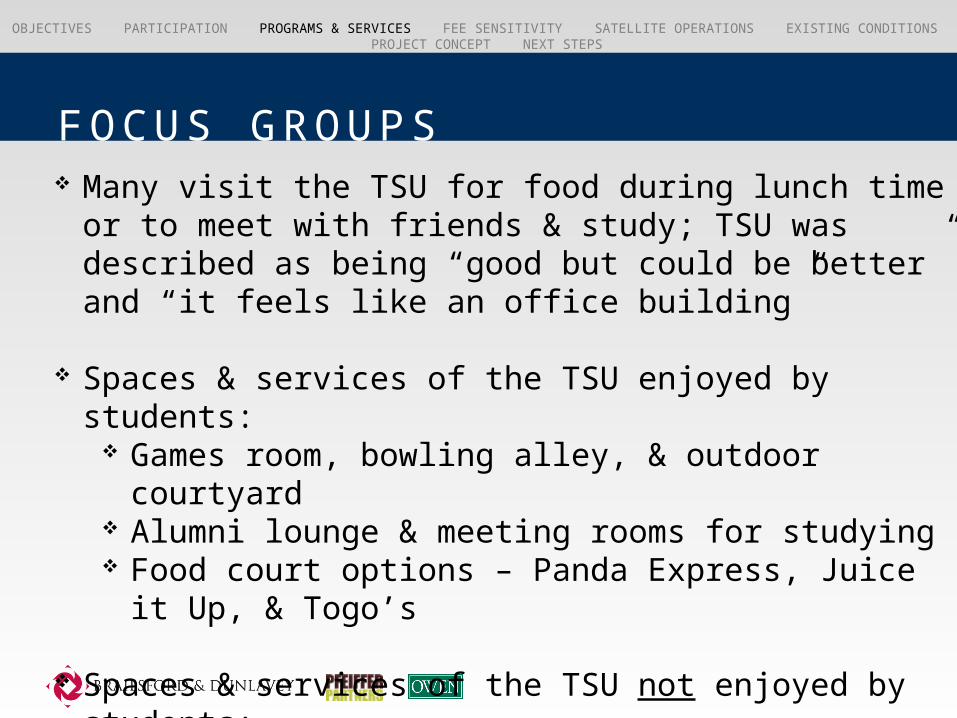
FOCUS GR OUPS Many visit the TSU for food during lunch time or to
meet with friends & study; TSU was described as being “good but could be better” and “it feels like an office building”
Spaces & services of the TSU enjoyed by students: Games room, bowling alley, & outdoor courtyard Alumni lounge & meeting rooms for studying Food court options – Panda Express, Juice it Up, &
Togo’s
Spaces & services of the TSU not enjoyed by students:
Student org. offices, Portola Pavilion, & Titan Theater
Inconvenient hours of operation – Food court closed on weekends; not enough seating in food court area

OBJECTIVES PARTICIPATION PROGRAMS & SERVICES FEE SENSITIVITY SATELLITE OPERATIONS EXISTING CONDITIONS PROJECT CONCEPT NEXT STEPS
BENCHMAR K ING32,353 38,831 35,250
Functional Areas ASF %-Ttl ASF ASF/Stdnt ASF %-Ttl ASF ASF/Stdnt ASF %-Ttl ASF ASF/Stdnt ASF/Stdnt Grp ASF ASF/Stdnt Grp ASF
Group 1: Food Service 22,797 18.2% 0.7 35,822 19.8% 0.9 19,321 21.7% 0.5 (0.2) (3,476) (0.4) (16,501)
Group 2: Ballroom Facilities 11,725 9.3% 0.4 14,869 8.2% 0.4 14,471 16.3% 0.4 0.0 2,746 0.0 (398)
Group 3: Conference/Meeting Rooms 13,981 11.1% 0.4 20,044 11.1% 0.5 8,695 9.8% 0.2 (0.2) (5,286) (0.3) (11,349)
Group 4: Bookstore 6,375 5.1% 0.2 12,992 7.2% 0.3 0 0.0% 0.0 (0.2) (6,375) (0.3) (12,992)
Group 5: Additional Retail Services 3,004 2.4% 0.1 6,275 3.5% 0.2 1,694 1.9% 0.0 (0.0) (1,310) (0.1) (4,581)
Group 6: Theater/Auditorium 7,206 5.7% 0.2 11,254 6.2% 0.3 2,530 2.8% 0.1 (0.2) (4,676) (0.2) (8,724)
Group 7: Recreation/Entertainment 23,539 18.8% 0.7 11,368 6.3% 0.3 7,971 9.0% 0.2 (0.5) (15,568) (0.1) (3,397)
Group 8: Lounge Space 7,252 5.8% 0.2 12,717 7.0% 0.3 8,451 9.5% 0.2 0.0 1,199 (0.1) (4,266)
Group 9: Academic Related 0 0.0% 0.0 2,582 1.4% 0.1 1,740 2.0% 0.0 0.0 1,740 (0.0) (842)
Group 10: Student Organizations 10,105 8.0% 0.3 14,045 7.7% 0.4 5,466 6.1% 0.2 (0.2) (4,639) (0.2) (8,579)
Group 11: Administrative Offices 7,208 5.7% 0.2 15,903 8.8% 0.4 11,827 13.3% 0.3 0.1 4,619 (0.1) (4,076)
Group 12: Multicultural Centers 1,415 1.1% 0.0 2,103 1.2% 0.1 0 0.0% 0.0 (0.0) (1,415) (0.1) (2,103)
Group 13: Special/Misc. Components 10,931 8.7% 0.3 20,456 11.3% 0.5 6,875 7.7% 0.2 (0.1) (4,056) (0.3) (13,581)
Total Assignable Sq. Footage 125,538 181,265 89,041
Total Gross Sq. Footage 189,930 281,816 140,000
Gross/Net Ratio (Grossing Factor) 1.57 1.59 1.57
Efficiency Factor (% ASF/GSF) 66% 63% 64%
* "Select" data from institutions in B&D / WTW database with comparable mission / enrollment
Select Unions to CSUF Variance
CSU FullertonSelect Unions (n=11)CSU Unions (n=4) Ave Enrollment = Ave Enrollment = Enrollment =
CSU Unions to CSUF Variance
(92,224)
(141,816)
(0.02)
0%-2%
(36,497)
(49,930)
0.00
OBJECTIVES PARTICIPATION PROGRAMS & SERVICES FEE SENSITIVITY SATELLITE OPERATIONS EXISTING CONDITIONS PROJECT CONCEPT NEXT STEPS
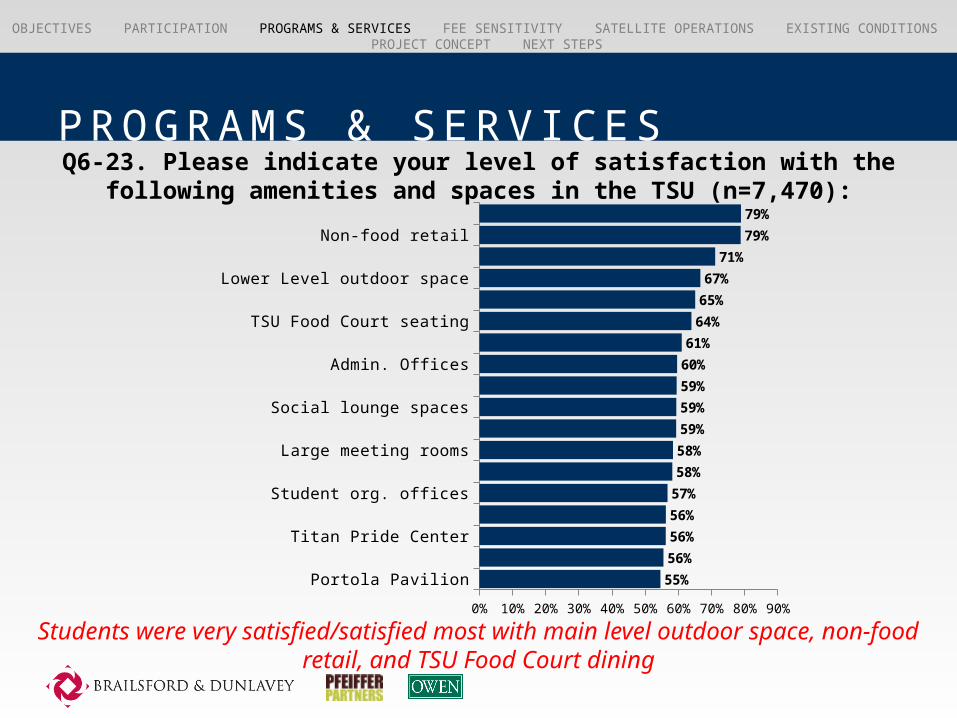
Q6-23. Please indicate your level of satisfaction with the following amenities and spaces in the TSU (n=7,470):
Students were very satisfied/satisfied most with main level outdoor space, non-food retail, and TSU Food Court dining
Portola PavilionSmall meetings rooms
Titan Pride CenterTitan Theater
Student org. officesTitan Bowl
Large meeting roomsTSU Lower Level dining
Social lounge spacesCasual recreation
Admin. OfficesMainframe Comp. Lab
TSU Food Court seatingQuiet/study lounge spacesLower Level outdoor space
TSU Food Court diningNon-food retail
Main Level outdoor space
0% 10% 20% 30% 40% 50% 60% 70% 80% 90%
55%
56%
56%
56%
57%
58%
58%
59%
59%
59%
60%
61%
64%
65%
67%
71%
79%
79%
PROGRAMS & SERV ICES
OBJECTIVES PARTICIPATION PROGRAMS & SERVICES FEE SENSITIVITY SATELLITE OPERATIONS EXISTING CONDITIONS PROJECT CONCEPT NEXT STEPS
PROGRAMS & SERV ICES
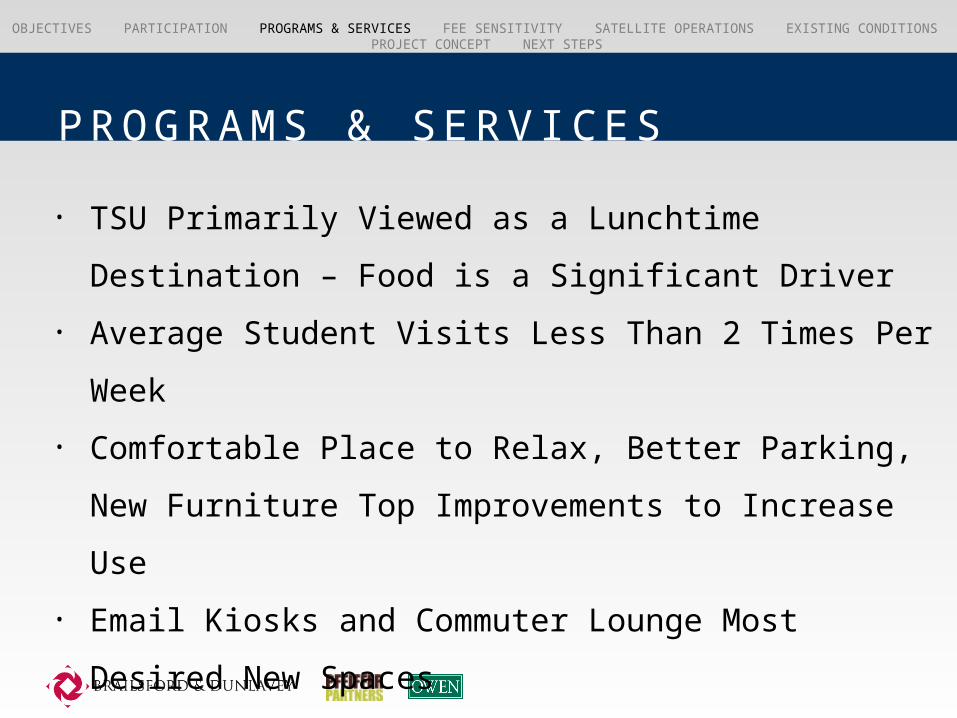
• TSU Primarily Viewed as a Lunchtime Destination –
Food is a Significant Driver
• Average Student Visits Less Than 2 Times Per Week
• Comfortable Place to Relax, Better Parking, New
Furniture Top Improvements to Increase Use
• Email Kiosks and Commuter Lounge Most Desired
New Spaces
• Price/Value, Food Selection and Variety, Hours of
Operation are Top 3 Areas of Improvement for Food
Service
OBJECTIVES PARTICIPATION PROGRAMS & SERVICES FEE SENSITIVITY SATELLITE OPERATIONS EXISTING CONDITIONS PROJECT CONCEPT NEXT STEPS
DEMAND BASED PR OGRAMMING
Demand for drop-in Union Spaces Depth and Breadth Activity Prioritization Space Reconciliation
OBJECTIVES PARTICIPATION PROGRAMS & SERVICES FEE SENSITIVITY SATELLITE OPERATIONS EXISTING CONDITIONS PROJECT CONCEPT NEXT STEPS
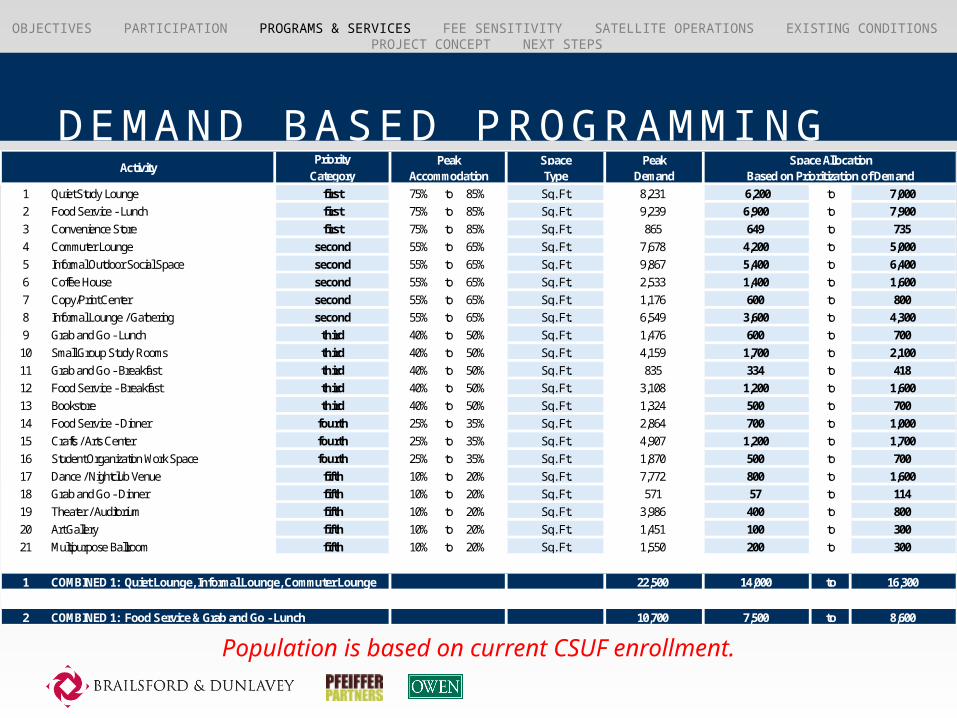
DEMAND BASED PR OGRAMMINGPriority Peak Space Peak Space Allocation
Category Accommodation Type Demand Based on Prioritization of Demand
1 Quiet Study Lounge first 75% to 85% Sq. Ft. 8,231 6,200 to 7,000
2 Food Service - Lunch first 75% to 85% Sq. Ft. 9,239 6,900 to 7,900
3 Convenience Store first 75% to 85% Sq. Ft. 865 649 to 735
4 Commuter Lounge second 55% to 65% Sq. Ft. 7,678 4,200 to 5,000
5 Informal Outdoor Social Space second 55% to 65% Sq. Ft. 9,867 5,400 to 6,400
6 Coffee House second 55% to 65% Sq. Ft. 2,533 1,400 to 1,600
7 Copy/Print Center second 55% to 65% Sq. Ft. 1,176 600 to 800
8 Informal Lounge / Gathering second 55% to 65% Sq. Ft. 6,549 3,600 to 4,300
9 Grab and Go - Lunch third 40% to 50% Sq. Ft. 1,476 600 to 700
10 Small Group Study Rooms third 40% to 50% Sq. Ft. 4,159 1,700 to 2,100
11 Grab and Go - Breakfast third 40% to 50% Sq. Ft. 835 334 to 418
12 Food Service - Breakfast third 40% to 50% Sq. Ft. 3,108 1,200 to 1,600
13 Bookstore third 40% to 50% Sq. Ft. 1,324 500 to 700
14 Food Service - Dinner fourth 25% to 35% Sq. Ft. 2,864 700 to 1,000
15 Crafts / Arts Center fourth 25% to 35% Sq. Ft. 4,907 1,200 to 1,700
16 Student Organization Work Space fourth 25% to 35% Sq. Ft. 1,870 500 to 700
17 Dance / Nightclub Venue fifth 10% to 20% Sq. Ft. 7,772 800 to 1,600
18 Grab and Go - Dinner fifth 10% to 20% Sq. Ft. 571 57 to 114
19 Theater / Auditorium fifth 10% to 20% Sq. Ft. 3,986 400 to 800
20 Art Gallery fifth 10% to 20% Sq. Ft. 1,451 100 to 300
21 Multipurpose Ballroom fifth 10% to 20% Sq. Ft. 1,550 200 to 300
1 COMBINED 1: Quiet Lounge, Informal Lounge, Commuter Lounge 22,500 14,000 to 16,300
2 COMBINED 1: Food Service & Grab and Go - Lunch 10,700 7,500 to 8,600
Activity
Population is based on current CSUF enrollment.
OBJECTIVES PARTICIPATION PROGRAMS & SERVICES FEE SENSITIVITY SATELLITE OPERATIONS EXISTING CONDITIONS PROJECT CONCEPT NEXT STEPS
DEMAND BASED PR OGRAMMING
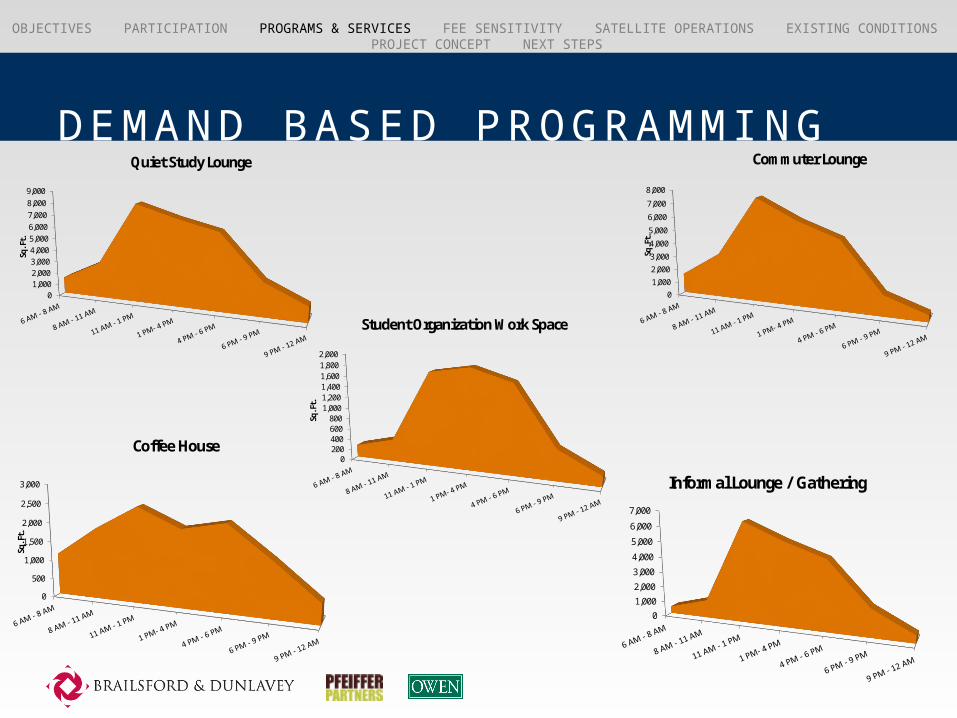
01,0002,0003,0004,0005,0006,0007,0008,0009,000
Sq. F
t.
Quiet Study Lounge
0
500
1,000
1,500
2,000
2,500
3,000
Sq. F
t.
Coffee House
01,000
2,000
3,000
4,000
5,000
6,000
7,000
8,000
Sq. F
t.
Commuter Lounge
0
1,000
2,000
3,000
4,000
5,000
6,000
7,000
Sq. F
t.
Informal Lounge / Gathering
0200400600800
1,0001,2001,4001,6001,8002,000
Sq. F
t.
Student Organization Work Space
OBJECTIVES PARTICIPATION PROGRAMS & SERVICES FEE SENSITIVITY SATELLITE OPERATIONS EXISTING CONDITIONS PROJECT CONCEPT NEXT STEPS
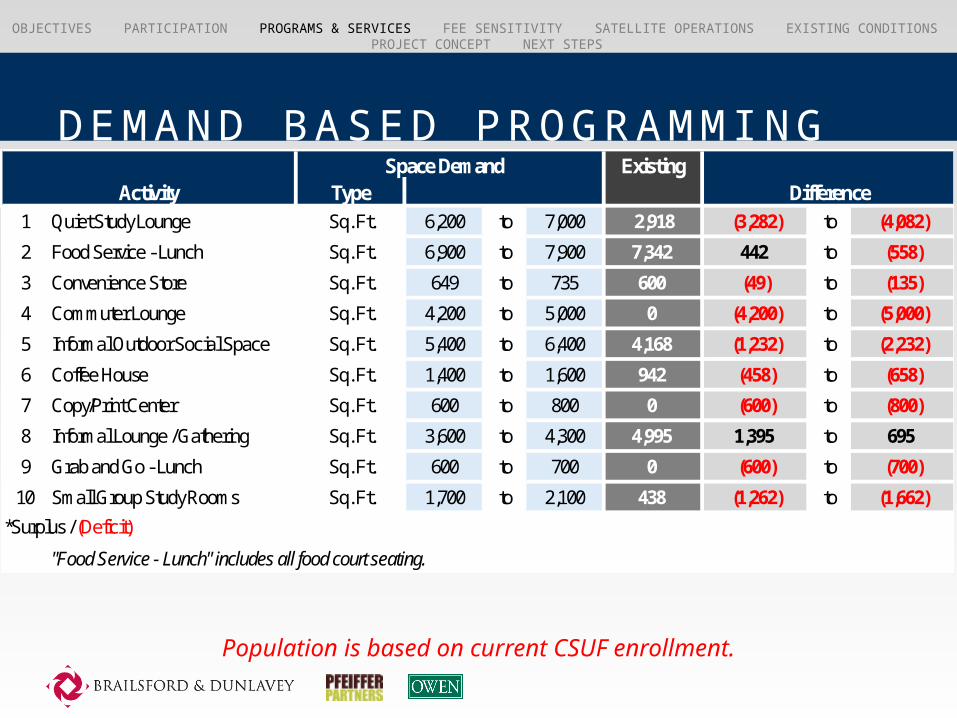
DEMAND BASED PR OGRAMMINGSpace Demand Existing
Type Difference1 Quiet Study Lounge Sq. Ft. 6,200 to 7,000 2,918 (3,282) to (4,082)
2 Food Service - Lunch Sq. Ft. 6,900 to 7,900 7,342 442 to (558)
3 Convenience Store Sq. Ft. 649 to 735 600 (49) to (135)
4 Commuter Lounge Sq. Ft. 4,200 to 5,000 0 (4,200) to (5,000)
5 Informal Outdoor Social Space Sq. Ft. 5,400 to 6,400 4,168 (1,232) to (2,232)
6 Coffee House Sq. Ft. 1,400 to 1,600 942 (458) to (658)
7 Copy/Print Center Sq. Ft. 600 to 800 0 (600) to (800)
8 Informal Lounge / Gathering Sq. Ft. 3,600 to 4,300 4,995 1,395 to 695
9 Grab and Go - Lunch Sq. Ft. 600 to 700 0 (600) to (700)
10 Small Group Study Rooms Sq. Ft. 1,700 to 2,100 438 (1,262) to (1,662)
*Surplus / (Deficit)
"Food Service - Lunch" includes all food court seating.
Activity
Population is based on current CSUF enrollment.
OBJECTIVES PARTICIPATION PROGRAMS & SERVICES FEE SENSITIVITY SATELLITE OPERATIONS EXISTING CONDITIONS PROJECT CONCEPT NEXT STEPS
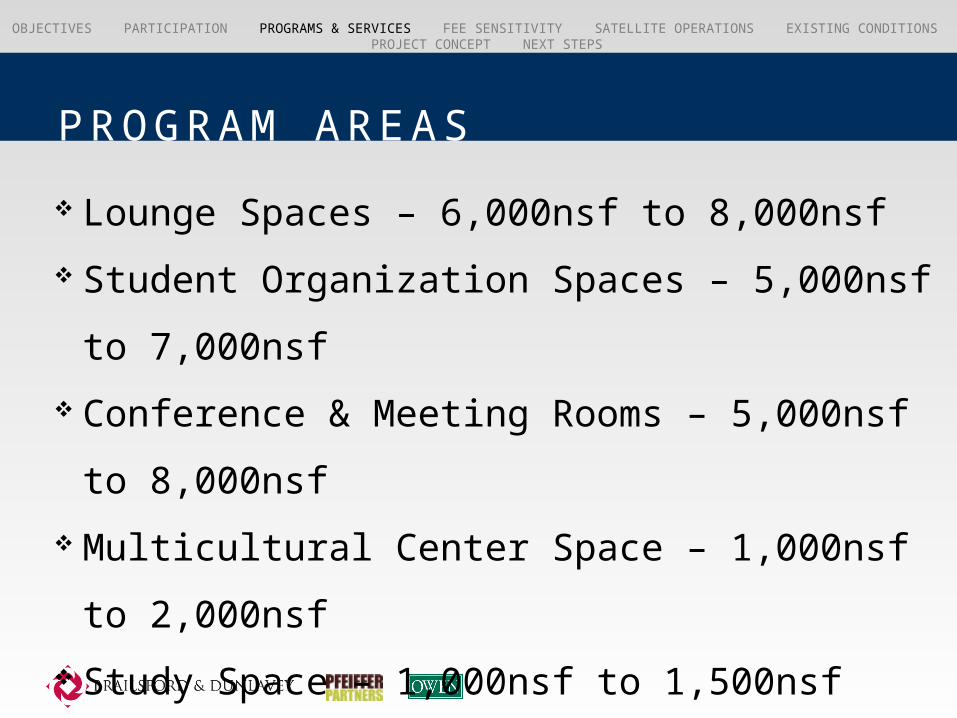
PROGRAM AREAS
Lounge Spaces – 6,000nsf to 8,000nsf
Student Organization Spaces – 5,000nsf to
7,000nsf
Conference & Meeting Rooms – 5,000nsf to
8,000nsf
Multicultural Center Space – 1,000nsf to
2,000nsf
Study Space – 1,000nsf to 1,500nsf
Food Service Seating – 1,000 to 1,500nsf
Support Space – 8,000nsf to 12,000nsf
OBJECTIVES PARTICIPATION PROGRAMS & SERVICES FEE SENSITIVITY SATELLITE OPERATIONS EXISTING CONDITIONS PROJECT CONCEPT NEXT STEPS
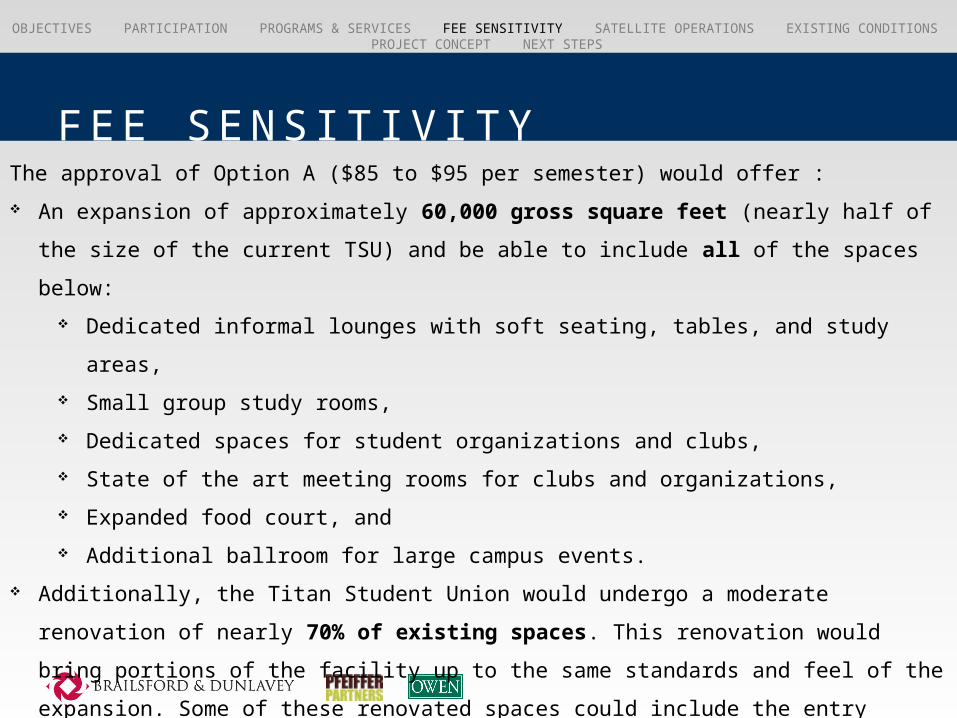
FEE SENS IT IV I TYThe approval of Option A ($85 to $95 per semester) would offer :
An expansion of approximately 60,000 gross square feet (nearly half of the size of
the current TSU) and be able to include all of the spaces below:
Dedicated informal lounges with soft seating, tables, and study areas,
Small group study rooms,
Dedicated spaces for student organizations and clubs,
State of the art meeting rooms for clubs and organizations,
Expanded food court, and
Additional ballroom for large campus events.
Additionally, the Titan Student Union would undergo a moderate renovation of nearly
70% of existing spaces. This renovation would bring portions of the facility up to
the same standards and feel of the expansion. Some of these renovated spaces
could include the entry lobby, courtyard, meeting rooms, and food court.
OBJECTIVES PARTICIPATION PROGRAMS & SERVICES FEE SENSITIVITY SATELLITE OPERATIONS EXISTING CONDITIONS PROJECT CONCEPT NEXT STEPS
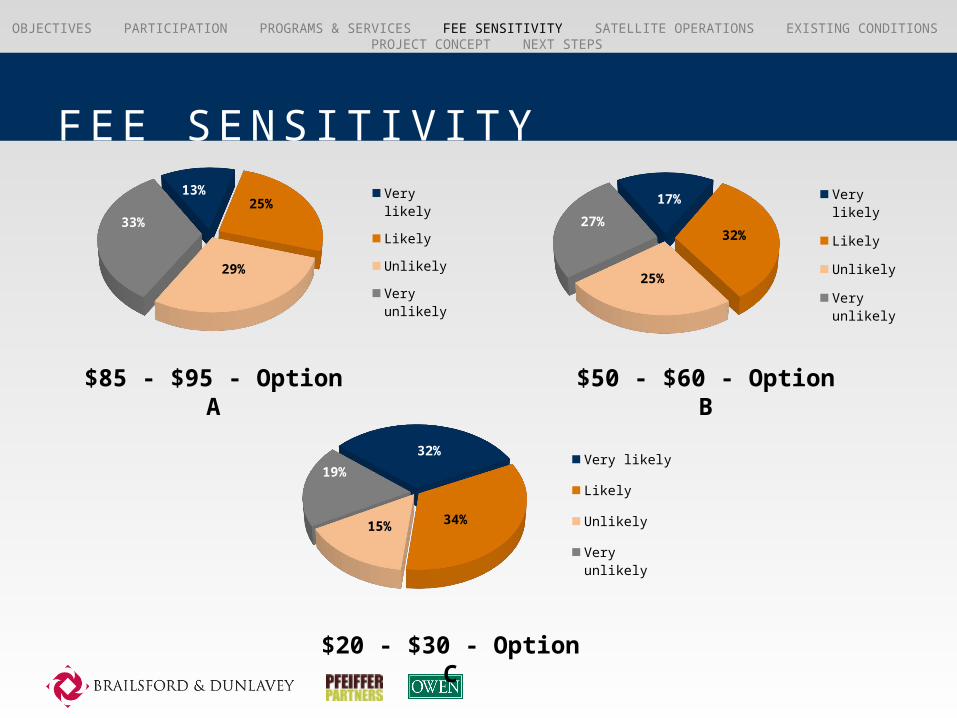
FEE SENS IT IV I TY
17%
32%
25%
27%
Very likely
Likely
Unlikely
Very unlikely
$50 - $60 - Option B
$85 - $95 - Option A
13%25%
29%
33%
Very likely
Likely
Unlikely
Very unlikely
$20 - $30 - Option C
32%
34%15%
19%Very likely
Likely
Unlikely
Very unlikely
OBJECTIVES PARTICIPATION PROGRAMS & SERVICES FEE SENSITIVITY SATELLITE OPERATIONS EXISTING CONDITIONS PROJECT CONCEPT NEXT STEPS
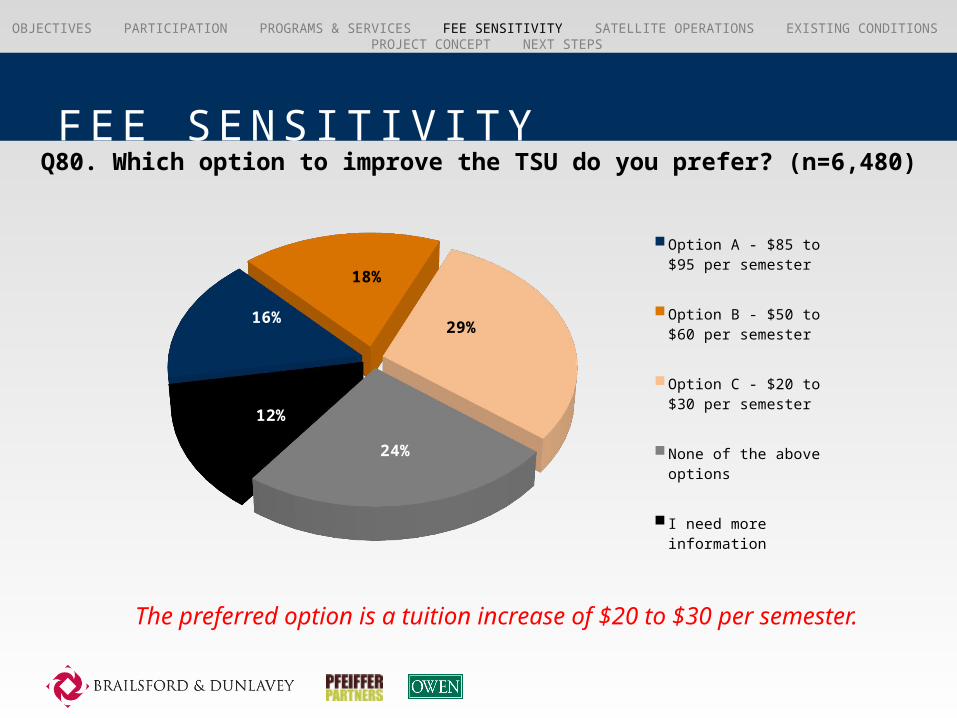
FEE SENS IT IV I TYQ80. Which option to improve the TSU do you prefer? (n=6,480)
The preferred option is a tuition increase of $20 to $30 per semester.
16%
18%
29%
24%
12%
Option A - $85 to $95 per semes-ter
Option B - $50 to $60 per semes-ter
Option C - $20 to $30 per semes-ter
None of the above options
I need more information
OBJECTIVES PARTICIPATION PROGRAMS & SERVICES FEE SENSITIVITY SATELLITE OPERATIONS EXISTING CONDITIONS PROJECT CONCEPT NEXT STEPS
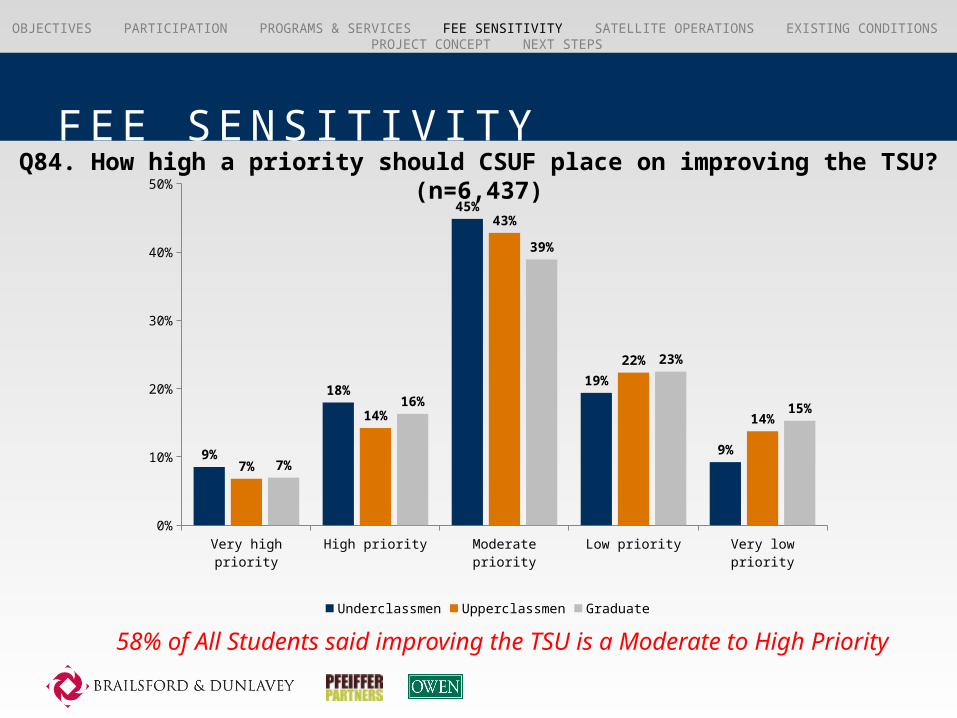
Q84. How high a priority should CSUF place on improving the TSU? (n=6,437)
58% of All Students said improving the TSU is a Moderate to High Priority
Very high priority High priority Moderate priority Low priority Very low priority0%
10%
20%
30%
40%
50%
9%
18%
45%
19%
9%7%
14%
43%
22%
14%
7%
16%
39%
23%
15%
Underclassmen Upperclassmen Graduate
FEE SENS IT IV I TY
OBJECTIVES PARTICIPATION PROGRAMS & SERVICES FEE SENSITIVITY SATELLITE OPERATIONS EXISTING CONDITIONS PROJECT CONCEPT NEXT STEPS
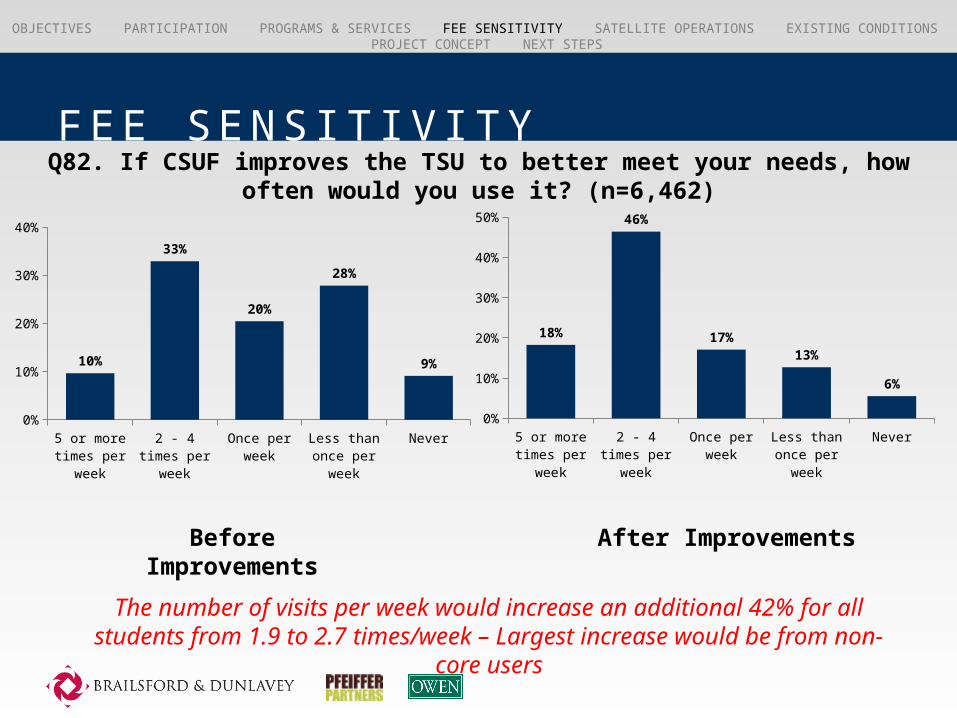
Q82. If CSUF improves the TSU to better meet your needs, how often would you use it? (n=6,462)
The number of visits per week would increase an additional 42% for all students from 1.9 to 2.7 times/week – Largest increase
would be from non-core users
FEE SENS IT IV I TY
5 or more times per week
2 - 4 times per week
Once per week Less than once per week
Never0%
10%
20%
30%
40%
10%
33%
20%
28%
9%
5 or more times per week
2 - 4 times per week
Once per week Less than once per week
Never0%
10%
20%
30%
40%
50%
18%
46%
17%
13%
6%
Before Improvements
After Improvements
OBJECTIVES PARTICIPATION PROGRAMS & SERVICES FEE SENSITIVITY SATELLITE OPERATIONS EXISTING CONDITIONS PROJECT CONCEPT NEXT STEPS
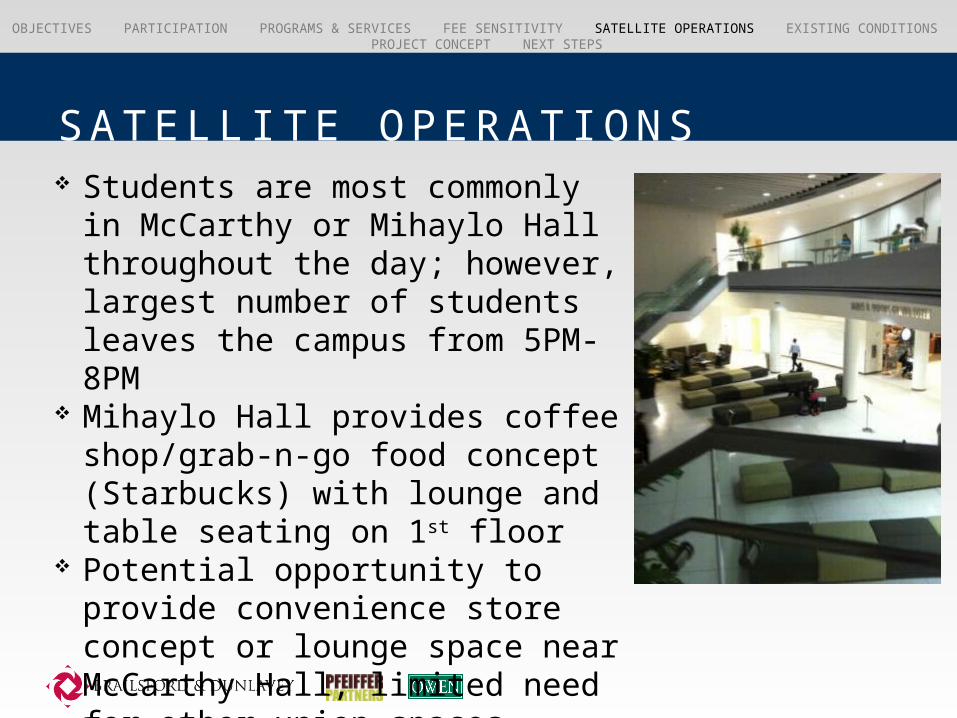
S ATELL I TE OPERAT IONS Students are most commonly in
McCarthy or Mihaylo Hall throughout the day; however, largest number of students leaves the campus from 5PM-8PM
Mihaylo Hall provides coffee shop/grab-n-go food concept (Starbucks) with lounge and table seating on 1st floor
Potential opportunity to provide convenience store concept or lounge space near McCarthy Hall, limited need for other union spaces
OBJECTIVES PARTICIPATION PROGRAMS & SERVICES FEE SENSITIVITY SATELLITE OPERATIONS EXISTING CONDITIONS PROJECT CONCEPT NEXT STEPS
ARCH ITECTURAL ASSESSMENT
Disjointed Wayfinding, Stratification of Levels, Separation of Quiet Versus Loud Areas
Disjointed Circulation, Multiple Stairs No Central Node, Gathering Space, Building Focal
Point Underutilized Lower Level – Garden Courtyard Compartmentalized Second Floor Food Court Kitchens Require Significant
Investment

OBJECTIVES PARTICIPATION PROGRAMS & SERVICES FEE SENSITIVITY SATELLITE OPERATIONS EXISTING CONDITIONS PROJECT CONCEPT NEXT STEPS
MECHAN ICAL ASSESSMENT
Existing TSC Plant Does Not Have Capacity to Accommodate Expansion
Requires New Systems, Connection to Univ, or New Plant
16 AHUs are Obsolete and Will Need Replacement Systems Controls are Outdated Single Pane Glazing Should be Replaced with
Efficient, Low-E, Double-Glazing Heating and Cooling in Cooking Areas Not
Properly Addressed
OBJECTIVES PARTICIPATION PROGRAMS & SERVICES FEE SENSITIVITY SATELLITE OPERATIONS EXISTING CONDITIONS PROJECT CONCEPT NEXT STEPS
ELECTR ICAL / P LUMB ING ASSESSMENT
Electrical Capacity at Panels is Maxed Out Older Lighting Fixtures Have Already Been
Replaced With New Old Pipes are Creating Domestic Hot Water Issues Only Portions of the TSU are Sprinklered

OBJECTIVES PARTICIPATION PROGRAMS & SERVICES FEE SENSITIVITY SATELLITE OPERATIONS EXISTING CONDITIONS PROJECT CONCEPT NEXT STEPS
CONCEPT DR IVER S
Address Program Shortfalls Align with Budget Maximize Value of Improvement to Existing and
New Spaces
OBJECTIVES PARTICIPATION PROGRAMS & SERVICES FEE SENSITIVITY SATELLITE OPERATIONS EXISTING CONDITIONS PROJECT CONCEPT NEXT STEPS
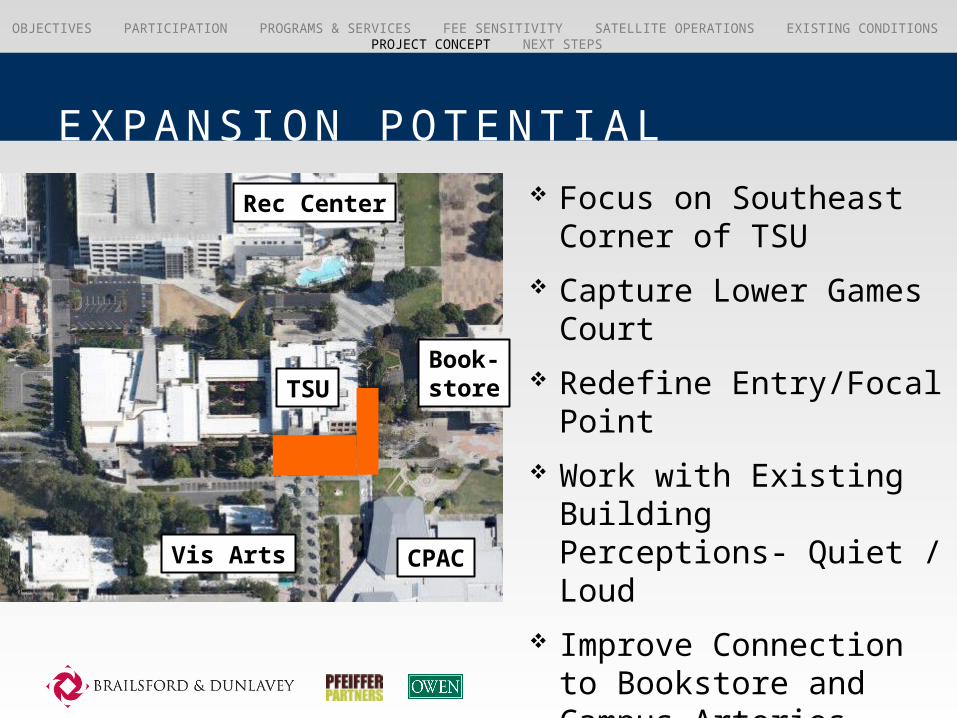
EXPANS ION POTENT IAL
TSUBook-store
CPAC
Rec Center
Vis Arts
Focus on Southeast Corner of TSU
Capture Lower Games Court
Redefine Entry/Focal Point
Work with Existing Building Perceptions- Quiet / Loud
Improve Connection to Bookstore and Campus Arteries
OBJECTIVES PARTICIPATION PROGRAMS & SERVICES FEE SENSITIVITY SATELLITE OPERATIONS EXISTING CONDITIONS PROJECT CONCEPT NEXT STEPS
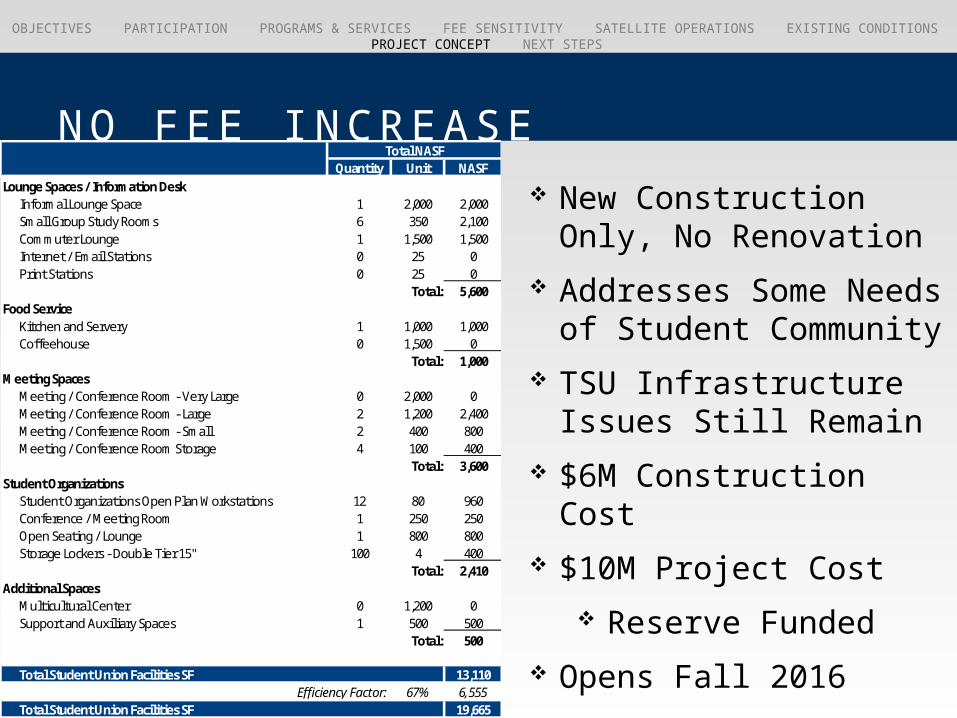
NO FEE INCREASEQuantity Unit NASF
Lounge Spaces / Information DeskInformal Lounge Space 1 2,000 2,000Small Group Study Rooms 6 350 2,100Commuter Lounge 1 1,500 1,500Internet / Email Stations 0 25 0Print Stations 0 25 0
Total: 5,600Food Service
Kitchen and Servery 1 1,000 1,000Coffeehouse 0 1,500 0
Total: 1,000Meeting Spaces
Meeting / Conference Room - Very Large 0 2,000 0Meeting / Conference Room - Large 2 1,200 2,400Meeting / Conference Room - Small 2 400 800Meeting / Conference Room Storage 4 100 400
Total: 3,600Student Organizations
Student Organizations Open Plan Workstations 12 80 960Conference / Meeting Room 1 250 250Open Seating / Lounge 1 800 800Storage Lockers - Double Tier 15" 100 4 400
Total: 2,410Additional Spaces
Multicultural Center 0 1,200 0Support and Auxiliary Spaces 1 500 500
Total: 500
Total Student Union Facilities SF 13,110Efficiency Factor: 67% 6,555
Total Student Union Facilities SF 19,665
Total NASF
New Construction Only, No Renovation
Addresses Some Needs of Student Community
TSU Infrastructure Issues Still Remain
$6M Construction Cost $10M Project Cost
Reserve Funded Opens Fall 2016
OBJECTIVES PARTICIPATION PROGRAMS & SERVICES FEE SENSITIVITY SATELLITE OPERATIONS EXISTING CONDITIONS PROJECT CONCEPT NEXT STEPS
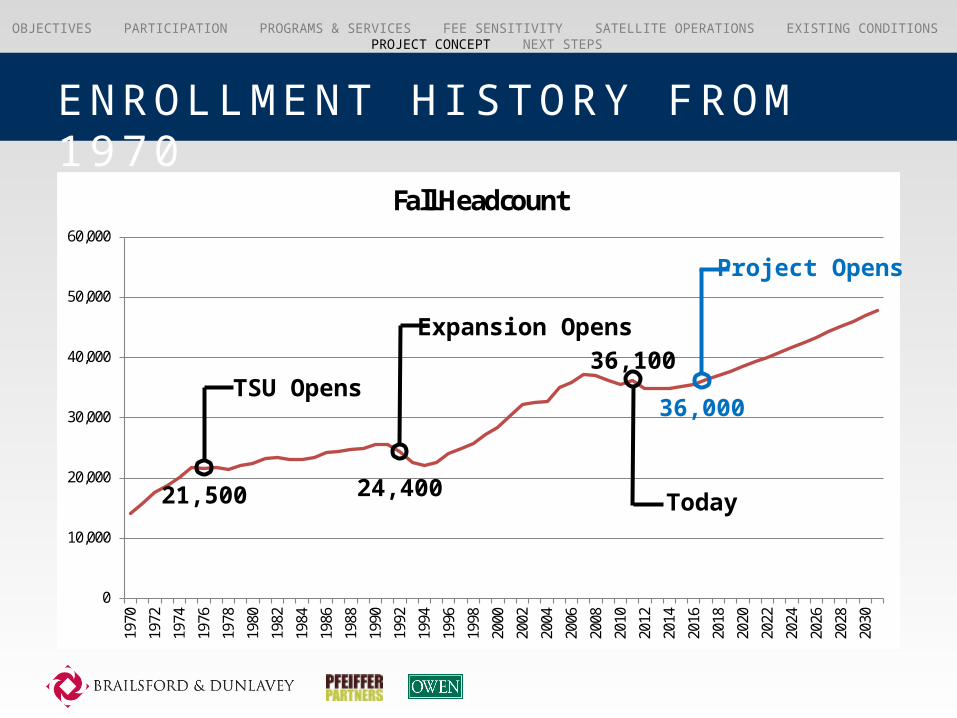
ENR OLLMENT H ISTORY FR OM 1970
0
10,000
20,000
30,000
40,000
50,000
60,000
1970
1972
1974
1976
1978
1980
1982
1984
1986
1988
1990
1992
1994
1996
1998
2000
2002
2004
2006
2008
2010
2012
2014
2016
2018
2020
2022
2024
2026
2028
2030
Fall Headcount
TSU Opens
Expansion Opens
21,500 24,400 Today
36,100
Project Opens
36,000
OBJECTIVES PARTICIPATION PROGRAMS & SERVICES FEE SENSITIVITY SATELLITE OPERATIONS EXISTING CONDITIONS PROJECT CONCEPT NEXT STEPS
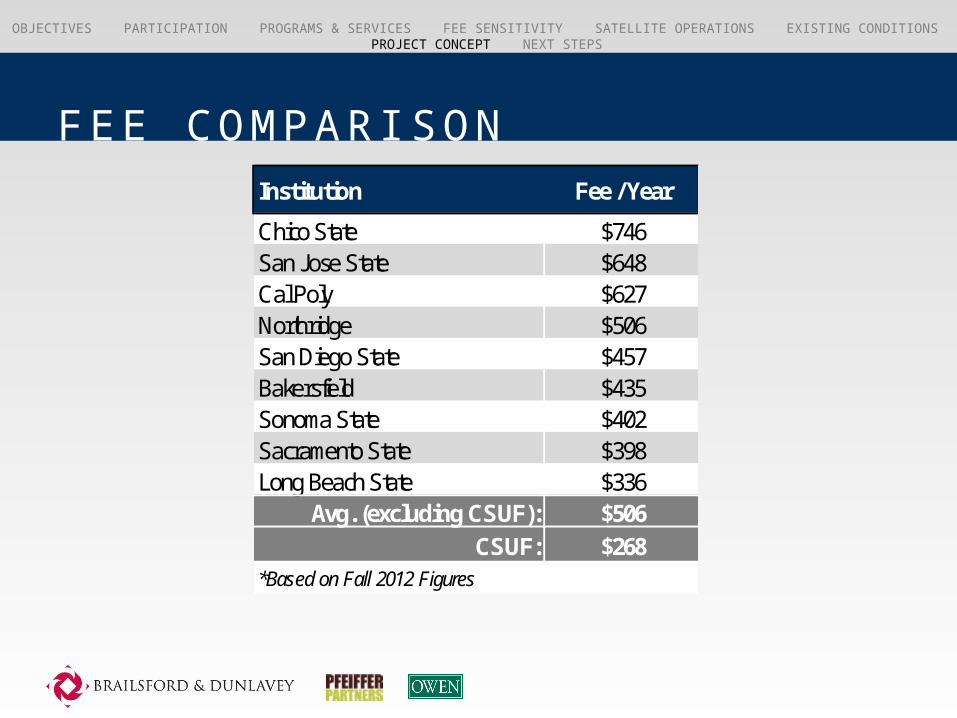
FEE COMPAR ISONInstitution Fee / Year
Chico State $746San Jose State $648Cal Poly $627Northridge $506San Diego State $457Bakersfield $435Sonoma State $402Sacramento State $398Long Beach State $336
Avg. (excluding CSUF): $506CSUF: $268
*Based on Fall 2012 Figures
OBJECTIVES PARTICIPATION PROGRAMS & SERVICES FEE SENSITIVITY SATELLITE OPERATIONS EXISTING CONDITIONS PROJECT CONCEPT NEXT STEPS
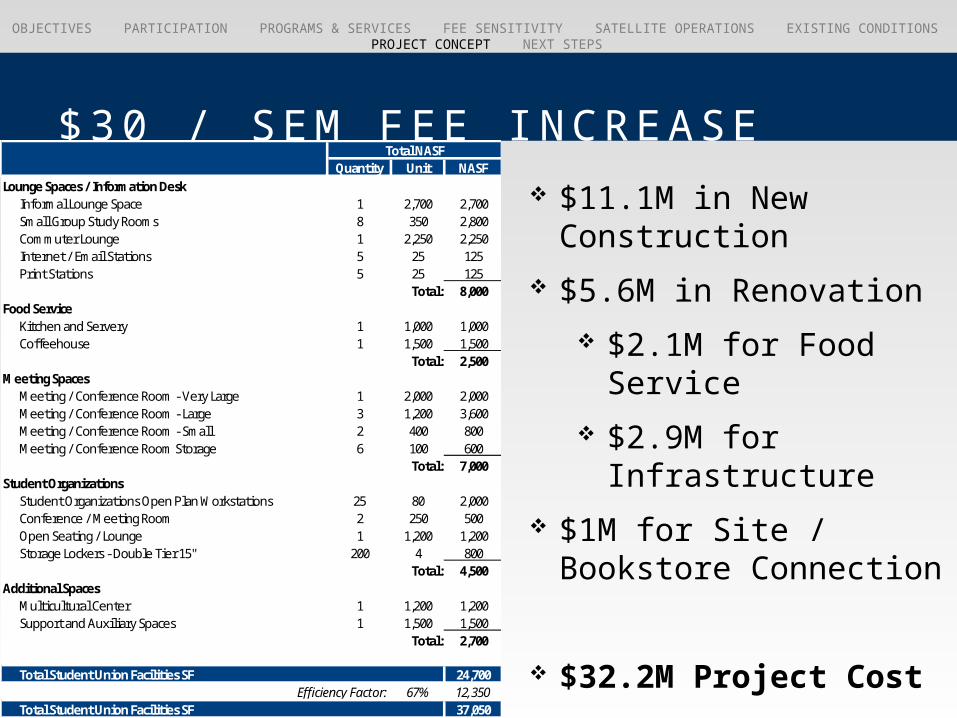
$30 / SEM FEE INCR EASEQuantity Unit NASF
Lounge Spaces / Information DeskInformal Lounge Space 1 2,700 2,700Small Group Study Rooms 8 350 2,800Commuter Lounge 1 2,250 2,250Internet / Email Stations 5 25 125Print Stations 5 25 125
Total: 8,000Food Service
Kitchen and Servery 1 1,000 1,000Coffeehouse 1 1,500 1,500
Total: 2,500Meeting Spaces
Meeting / Conference Room - Very Large 1 2,000 2,000Meeting / Conference Room - Large 3 1,200 3,600Meeting / Conference Room - Small 2 400 800Meeting / Conference Room Storage 6 100 600
Total: 7,000Student Organizations
Student Organizations Open Plan Workstations 25 80 2,000Conference / Meeting Room 2 250 500Open Seating / Lounge 1 1,200 1,200Storage Lockers - Double Tier 15" 200 4 800
Total: 4,500Additional Spaces
Multicultural Center 1 1,200 1,200Support and Auxiliary Spaces 1 1,500 1,500
Total: 2,700
Total Student Union Facilities SF 24,700Efficiency Factor: 67% 12,350
Total Student Union Facilities SF 37,050
Total NASF
$11.1M in New Construction
$5.6M in Renovation $2.1M for Food
Service $2.9M for
Infrastructure $1M for Site / Bookstore
Connection
$32.2M Project Cost
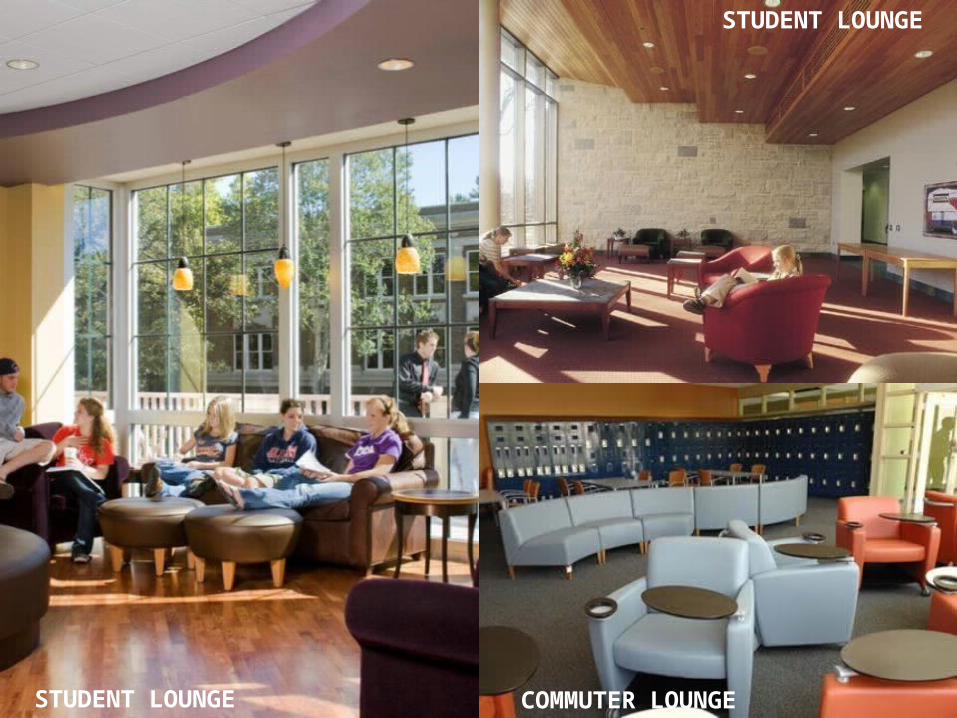
STUDENT LOUNGE
STUDENT LOUNGE COMMUTER LOUNGE
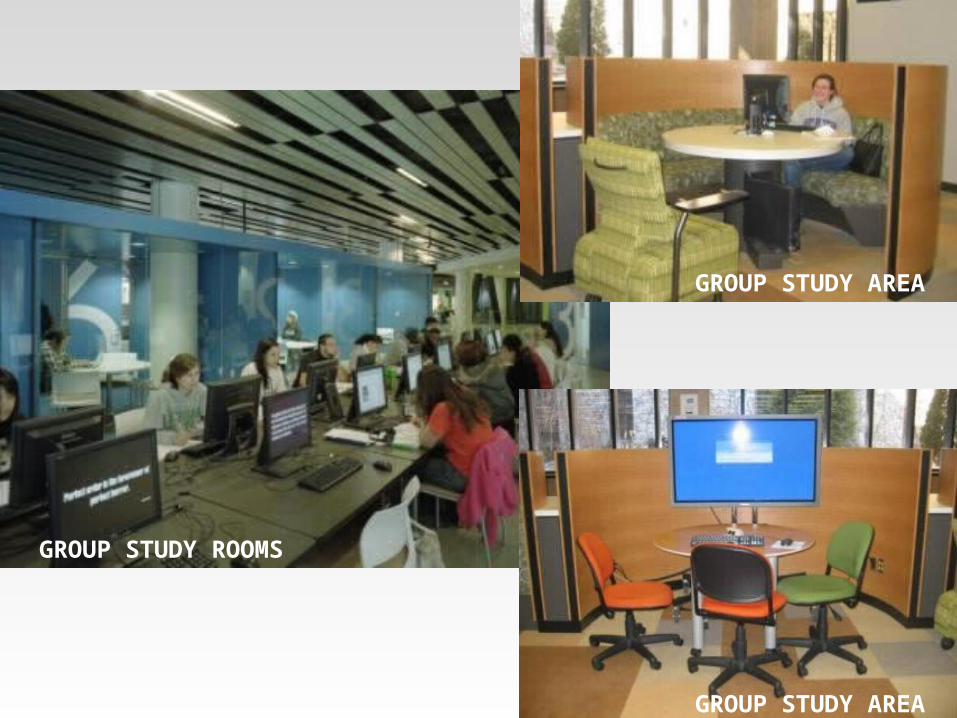
GROUP STUDY ROOMS
GROUP STUDY AREA
GROUP STUDY AREA
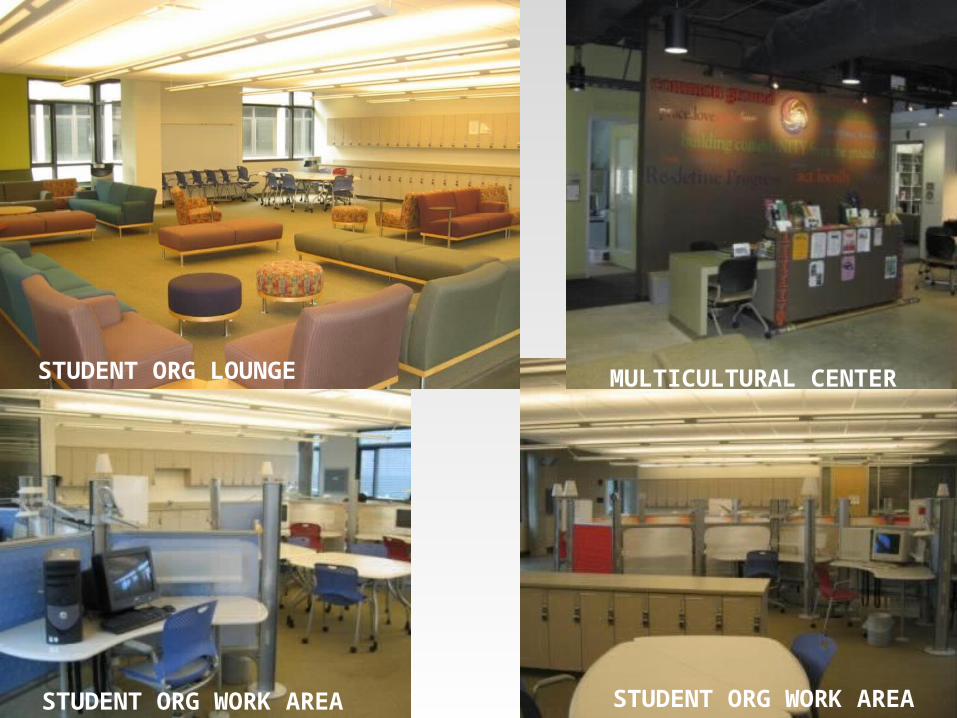
STUDENT ORG LOUNGE
STUDENT ORG WORK AREA STUDENT ORG WORK AREA
MULTICULTURAL CENTER
OBJECTIVES PARTICIPATION PROGRAMS & SERVICES FEE SENSITIVITY SATELLITE OPERATIONS EXISTING CONDITIONS PROJECT CONCEPT NEXT STEPS
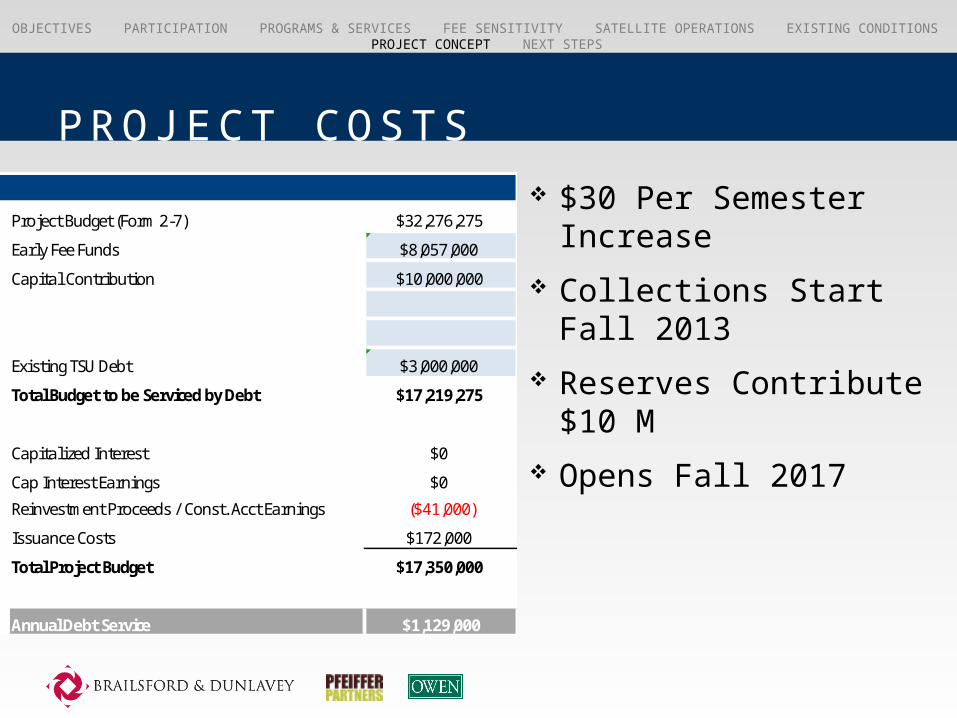
PRO JECT COSTS $30 Per Semester
Increase Collections Start Fall
2013 Reserves Contribute
$10 M Opens Fall 2017
Tax-exempt Interest Rate 5.00% Project Budget (Form 2-7) $32,276,275
Term Tax-Exempt (Years) 30 Early Fee Funds $8,057,000
Cap Interest (as a % of Budget) 0.0% Capital Contribution $10,000,000
Average Balance Reinvested 45% Existing TSU Debt $3,000,000
Reinvestment Rate 0.50% Total Budget to be Serviced by Debt $17,219,275
Average Amount Reinvested $10,898,674
Reinvestment Period (months) 9 Capitalized Interest $0
Reinvestment Proceeds $40,870 Cap Interest Earnings $0
Reinvestment Proceeds / Const. Acct Earnings ($41,000)
Issuance Costs 1.00% Issuance Costs $172,000
Cap I Interest Earnings 0.50% Total Project Budget $17,350,000
Total Previously Collected: $8,057,000
Annual Debt Service $1,129,000
Debt Service
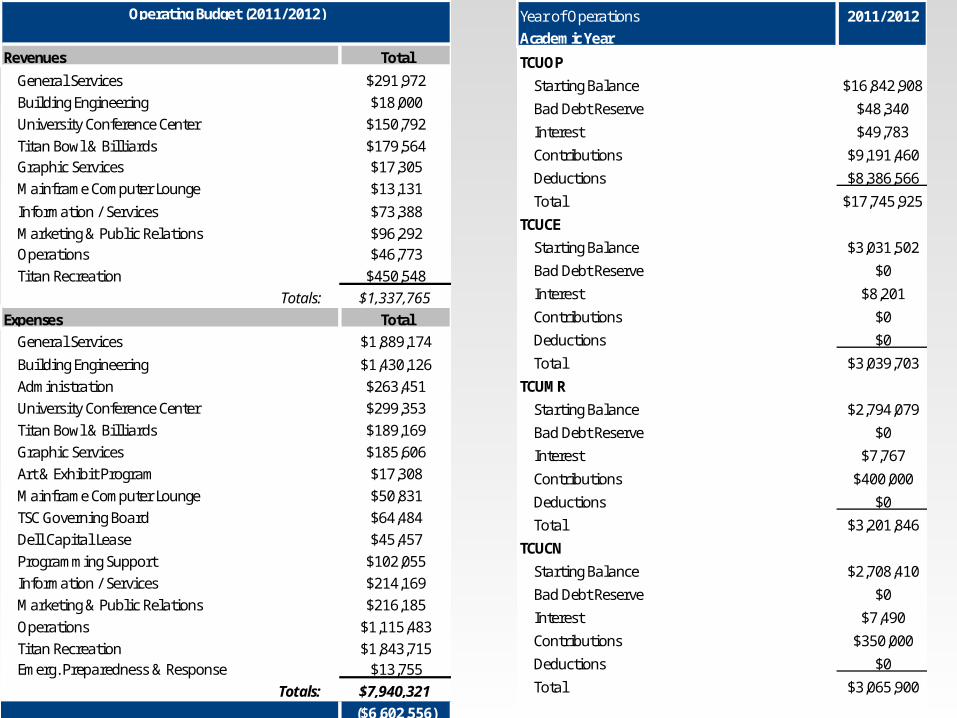
Revenues Total
General Services $291,972Building Engineering $18,000University Conference Center $150,792Titan Bowl & Bil l iards $179,564Graphic Services $17,305Mainframe Computer Lounge $13,131
Information / Services $73,388Marketing & Public Relations $96,292Operations $46,773Titan Recreation $450,548
Totals: $1,337,765Expenses Total
General Services $1,889,174
Building Engineering $1,430,126Administration $263,451University Conference Center $299,353Titan Bowl & Bil l iards $189,169Graphic Services $185,606Art & Exhibit Program $17,308Mainframe Computer Lounge $50,831TSC Governing Board $64,484Dell Capital Lease $45,457Programming Support $102,055Information / Services $214,169Marketing & Public Relations $216,185Operations $1,115,483Titan Recreation $1,843,715Emerg. Preparedness & Response $13,755
Totals: $7,940,321($6,602,556)
Operating Budget (2011/2012) Year of Operations 2011/2012Academic Year
TCUOP
Starting Balance $16,842,908
Bad Debt Reserve $48,340
Interest $49,783
Contributions $9,191,460
Deductions $8,386,566
Total $17,745,925
TCUCE
Starting Balance $3,031,502
Bad Debt Reserve $0
Interest $8,201
Contributions $0
Deductions $0
Total $3,039,703
TCUMR
Starting Balance $2,794,079
Bad Debt Reserve $0
Interest $7,767
Contributions $400,000
Deductions $0
Total $3,201,846
TCUCN
Starting Balance $2,708,410
Bad Debt Reserve $0
Interest $7,490
Contributions $350,000
Deductions $0
Total $3,065,900
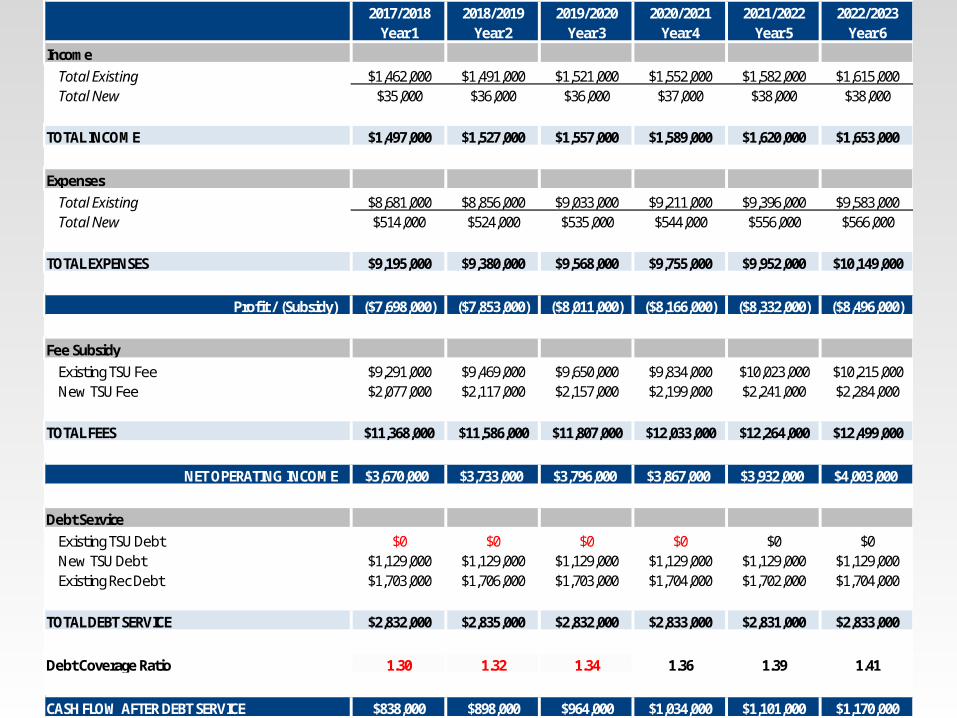
2017/2018 2018/2019 2019/2020 2020/2021 2021/2022 2022/2023Year 1 Year 2 Year 3 Year 4 Year 5 Year 6
IncomeTotal Existing $1,462,000 $1,491,000 $1,521,000 $1,552,000 $1,582,000 $1,615,000Total New $35,000 $36,000 $36,000 $37,000 $38,000 $38,000
TOTAL INCOME $1,497,000 $1,527,000 $1,557,000 $1,589,000 $1,620,000 $1,653,000
ExpensesTotal Existing $8,681,000 $8,856,000 $9,033,000 $9,211,000 $9,396,000 $9,583,000Total New $514,000 $524,000 $535,000 $544,000 $556,000 $566,000
TOTAL EXPENSES $9,195,000 $9,380,000 $9,568,000 $9,755,000 $9,952,000 $10,149,000
Profit / (Subsidy) ($7,698,000) ($7,853,000) ($8,011,000) ($8,166,000) ($8,332,000) ($8,496,000)
Fee SubsidyExisting TSU Fee $9,291,000 $9,469,000 $9,650,000 $9,834,000 $10,023,000 $10,215,000New TSU Fee $2,077,000 $2,117,000 $2,157,000 $2,199,000 $2,241,000 $2,284,000
TOTAL FEES $11,368,000 $11,586,000 $11,807,000 $12,033,000 $12,264,000 $12,499,000
NET OPERATING INCOME $3,670,000 $3,733,000 $3,796,000 $3,867,000 $3,932,000 $4,003,000
Debt ServiceExisting TSU Debt $0 $0 $0 $0 $0 $0New TSU Debt $1,129,000 $1,129,000 $1,129,000 $1,129,000 $1,129,000 $1,129,000Existing Rec Debt $1,703,000 $1,706,000 $1,703,000 $1,704,000 $1,702,000 $1,704,000
TOTAL DEBT SERVICE $2,832,000 $2,835,000 $2,832,000 $2,833,000 $2,831,000 $2,833,000
Debt Coverage Ratio 1.30 1.32 1.34 1.36 1.39 1.41
CASH FLOW AFTER DEBT SERVICE $838,000 $898,000 $964,000 $1,034,000 $1,101,000 $1,170,000
OBJECTIVES PARTICIPATION PROGRAMS & SERVICES FEE SENSITIVITY SATELLITE OPERATIONS EXISTING CONDITIONS PROJECT CONCEPT NEXT STEPS
R ISKS /UNKNOWNS
Campus Enrollment Growth Projected at 0% for the Next Years, the
Increasing Construction and Operations Inflation Existing TSU Debt Service Payments
Opportunities to Fund Through Reserves Refinance
OBJECTIVES PARTICIPATION PROGRAMS & SERVICES FEE SENSITIVITY SATELLITE OPERATIONS EXISTING CONDITIONS PROJECT CONCEPT NEXT STEPS
NEXT STEPS
Develop an Information Campaign to Education Students AND Faculty/Staff About Why the TSU Needs Improving
Timeline Committees Marketing Materials Presentations Partnerships
OBJECTIVES PARTICIPATION PROGRAMS & SERVICES FEE SENSITIVITY SATELLITE OPERATIONS EXISTING CONDITIONS PROJECT CONCEPT NEXT STEPS
NEXT STEPS
Identify Partners to Contribute Additional Funds or Other Nearby Improvements
ASC / Bookstore Third-Party Vendor Additional Funding will Allow for Additional
Improvements to the Existing TSU
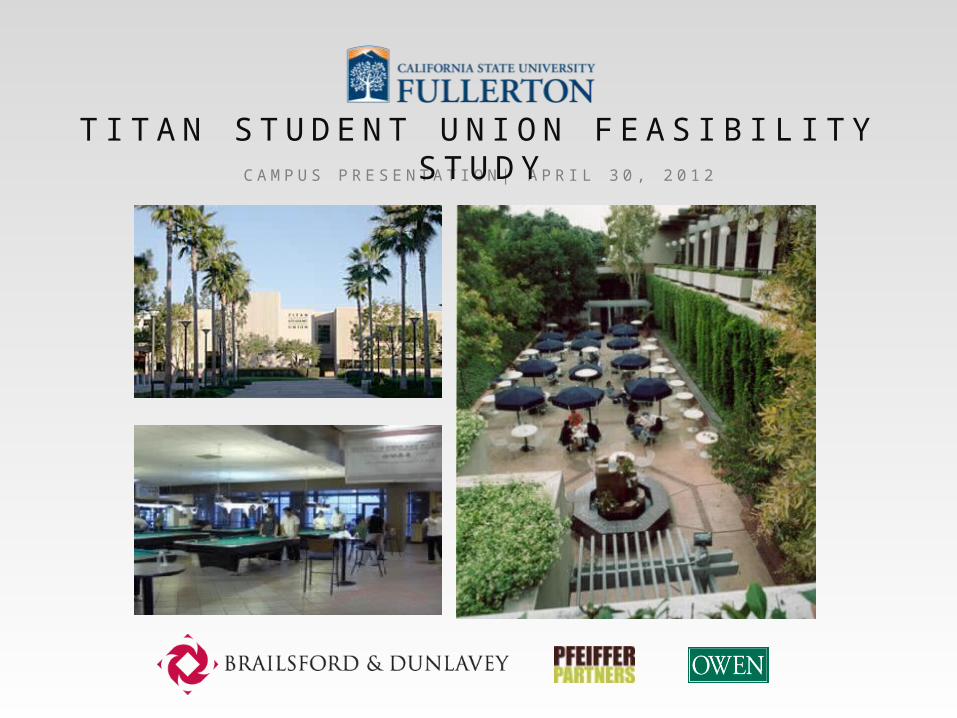
C A M P U S P R E S E N T A T I O N | A P R I L 3 0 , 2 0 1 2T I TA N S T U D E N T U N I O N F E A S I B I L I T Y S T U DY