can chile remain king of copper and codelco the jewel in the … · 2015-02-27 · it has...
TRANSCRIPT

Can Chile remain king of copper and Codelco the jewel in the crown?
Juan Carlos Guajardo B.Executive Director
Plusmining
28th International Copper Conference - Metal BulletinThe Hotel, Brussels, 25-27 February 2015

www.plusmining.com
About Plusmining
▪ Plusmining is a strategic consulting firm based in Santiago, Chile, which provides intelligence services onmining markets and industries and advising on business development.
▪ It is focused on mining but with a broader scope, serving to improve the connection of mining with otherrelated activities.
▪ It is based on expert knowledge in the mining industry accumulated over 20 years of work in mining from aneconomic and public policy perspective at a very high level. It also counts on the contribution of severalhighly-qualified experts to add value in different areas.
▪ It has an extensive network of contacts in the international mining industry.
▪ It has privileged links with Asia, particularly Japan and China, as well as with other key countries engaged inthe mining industry, such as Australia, Canada, Peru, and Chile.
www.plusmining.com
Content
1. Can Chile remain king of copper?
a. The kingdom of copper
b. What variables might impact Chile’s leadership in the coming years?
c. Outlook - Investment and Production until 2025
2. Can Codelco remain the jewel in the crown?
3. Final Comments

Can Chile remain king of copper?

The kingdom of coppera1.

www.plusmining.com
No doubt Chile is the largest mine copper producer in the world and has been at the head of the industry in the last two centuries
Copper Mine Production by CountryTop 20 Countries in 2013
4 out of the 5 largestcopper mines in theworld are located inChile
6 out of the 10 largestcopper mines in theworld are located inChile
8 out of the 20 largestcopper mines in theworld are located inChile
0 2.000 4.000 6.000 8.000
TMT
Source: International Copper Study Group, World Copper Fact Book 2014
Rank Mine Country Capacity
(TMT)1 Escondida Chile 10502 Grasberg Indonesia 7903 Collahuasi Chile 5204 Los Bronces Chile 4905 Codelco Norte Chile 4506 Antamina Peru 4507 Morenci United States 4508 El Teniente Chile 443
9Taimyr Peninsula (Norilsk/Talnakh Mills)
Russia 430
10 Los Pelambres Chile 40011 Radomiro Tomic Chile 40012 Andina Chile 30013 Kansanshi Zambia 28514 Bingham Canyon United States 28015 Batu Hijau Indonesia 25016 Sarcheshmeh Iran 24917 Cerro Verde II (Sulphide) Peru 24018 Olympic Dam Australia 22519 Cuajone Peru 21220 Konkola Zambia 200
Top 20 Copper Mines by Capacity (basis 2014)
www.plusmining.com
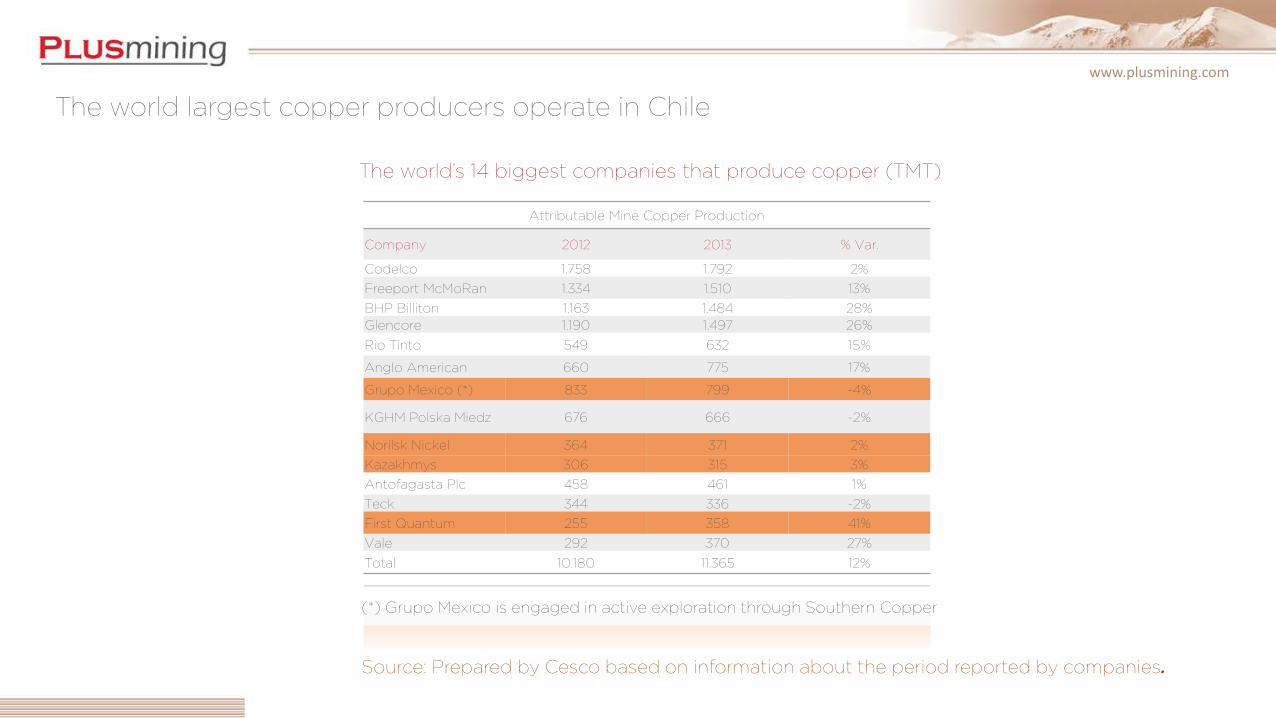
The world’s 14 biggest companies that produce copper (TMT)
Source: Prepared by Cesco based on information about the period reported by companies.
(*) Grupo Mexico is engaged in active exploration through Southern Copper
The world largest copper producers operate in Chile
Attributable Mine Copper Production
Company 2012 2013 % Var.
Codelco 1.758 1.792 2%
Freeport McMoRan 1.334 1.510 13%
BHP Billiton 1.163 1.484 28%Glencore 1.190 1.497 26%
Rio Tinto 549 632 15%
Anglo American 660 775 17%
Grupo Mexico (*) 833 799 -4%
KGHM Polska Miedz 676 666 -2%
Norilsk Nickel 364 371 2%
Kazakhmys 306 315 3%
Antofagasta Plc 458 461 1%
Teck 344 336 -2%
First Quantum 255 358 41%
Vale 292 370 27%
Total 10.180 11.365 12%

www.plusmining.com
Copper Smelter Production by Country. Top 20 Countries in 2013
However, downstream of this point, Chile shows a decreasing position, losing ground to China
0 2.000 4.000 6.000
Iran
Spain
Mexico
Brazil
Indonesia
Canada
Peru
Kazakhstan
Bulgaria
Australia
Germany
United States
Zambia
Poland
Korean Rep.
India
Russian Fed.
Chile
Japan
China
TMT
0 2.000 4.000 6.000 8.000
Bulgaria
Brazil
Canada
Kazakhstan
Spain
Peru
Mexico
Belgium
Australia
Poland
Zambia
Korean Rep.
India
Congo
Germany
Russian Fed.
United States
Japan
Chile
China
TMT
Copper Refined Production by Country. Top 20 Countries in 2013
0 10.000 20.000
Malaysia
Poland
United Arab Emirates
Indonesia
Spain
Thailand
Mexico
BENELUX
France
Turkey
Brazil
Taiwan (China)
Russian Fed.
India
Italy
Korean Rep.
Germany
Japan
United States
China
TMT
Copper and Copper Alloy Semis Production Capacity by Country.
Top 20 Countries in 2014
Source: International Copper Study Group, World Copper Fact Book and Directory of Copper and Copper Alloy Fabricators 2014

www.plusmining.com
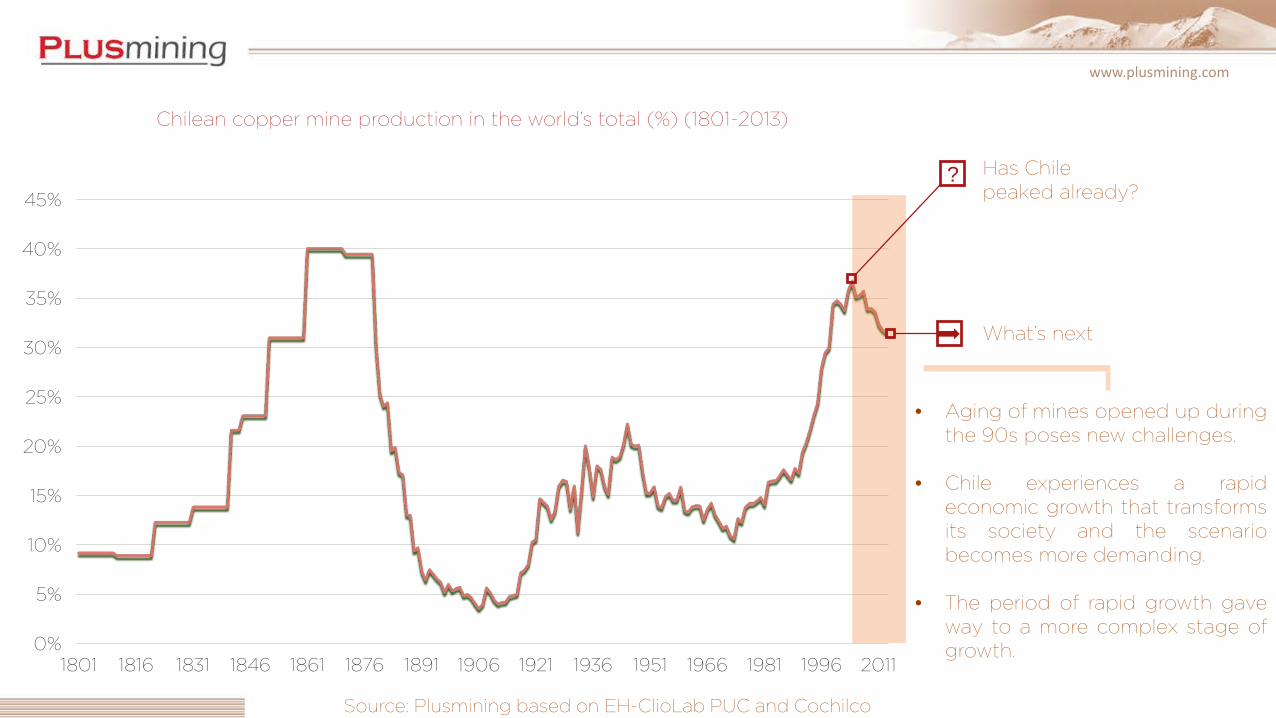
- However, the “kingdom of copper” has experienced significant fluctuations.- Why has Chile exhibited production increases and decreases in relatively short periods of time?- Can the same happen in the near future?
Chilean copper mine production in the world’s total (%)
(1801-2013)
Source: Plusmining based on EH-ClioLab PUC and Cochilco
0%
5%
10%
15%
20%
25%
30%
35%
40%
45%
1801 1816 1831 1846 1861 1876 1891 1906 1921 1936 1951 1966 1981 1996 2011

www.plusmining.com
Chilean copper mine production in the world’s total (%) (1801-2013)
0%
5%
10%
15%
20%
25%
30%
35%
40%
45%
1801 1816 1831 1846 1861 1876 1891 1906 1921 1936 1951 1966 1981 1996 2011
Source: Plusmining based on EH-ClioLab PUC and Cochilco
• The country’s independence released mining exploitation from past restrictions.
• Chilean production rapidly focused on meeting England’s demands significantly increased by the Industrial Revolution.

www.plusmining.com
0%
5%
10%
15%
20%
25%
30%
35%
40%
45%
1801 1816 1831 1846 1861 1876 1891 1906 1921 1936 1951 1966 1981 1996 2011
Source: Plusmining based on EH-ClioLab PUC and Cochilco
• The War of the Pacific triggered a huge boost in nitrates exploitation that displaced copper.
• However, the main reason was technological obsolescence in Chilean mining that, in those days, practiced small-scale mining with basic methods.
• At the same time, USA and Australia developed technologies that allowed larger-scale exploitation and with lower grades.
Chilean copper mine production in the world’s total (%) (1801-2013)

www.plusmining.com
0%
5%
10%
15%
20%
25%
30%
35%
40%
45%
1801 1816 1831 1846 1861 1876 1891 1906 1921 1936 1951 1966 1981 1996 2011
Source: Plusmining based on EH-ClioLab PUC and Cochilco
• Arrival of USA mining companies that, with more advanced technologies and access to capital, were able to mine large porphyry deposits in Chile.
• In the first three decades of the XX century, 11 porphyry copper deposits were put into operation in the world – eight in USA and three in Chile.
Chilean copper mine production in the world’s total (%) (1801-2013)

www.plusmining.com
0%
5%
10%
15%
20%
25%
30%
35%
40%
45%
1801 1816 1831 1846 1861 1876 1891 1906 1921 1936 1951 1966 1981 1996 2011
• On the second half of the XX century, the relationship between USA and the Chilean State was marked by controversies regarding tax increase, copper price, and investments.
• Early in the 1960s, the advent of revolutionary and reformist ideas in Latin America, installed the notion of recovering basic resources and the concept of nationalization started to gain strength, until its culmination on July 11th, 1971.
Source: Plusmining based on EH-ClioLab PUC and Cochilco
Chilean copper mine production in the world’s total (%) (1801-2013)

www.plusmining.com
0%
5%
10%
15%
20%
25%
30%
35%
40%
45%
1801 1816 1831 1846 1861 1876 1891 1906 1921 1936 1951 1966 1981 1996 2011
Source: Plusmining based on EH-ClioLab PUC and Cochilco
Chilean copper mine production in the world’s total (%) (1801-2013)
• Codelco is established and mining exploitation carried out mostly by this company.
• After the 1973 government overthrown a new institutional framework was established that welcomed private and foreign investments.
• Investments materialized after the return to democracy when guarantees to foreign investors increased in the face of lower country risk.

www.plusmining.com
0%
5%
10%
15%
20%
25%
30%
35%
40%
45%
1801 1816 1831 1846 1861 1876 1891 1906 1921 1936 1951 1966 1981 1996 2011
Source: Plusmining based on EH-ClioLab PUC and Cochilco
Chilean copper mine production in the world’s total (%) (1801-2013)
• A “mixed model” wasconsolidated where theState (Codelco) andprivate sectors couldcoexist.
• Thus, large private minescame to life (Escondida,Collahuasi, and Pelambres,among others).
• Period of importantproduction andinvestment expansionwith “brand new” deposits.
www.plusmining.com
0%
5%
10%
15%
20%
25%
30%
35%
40%
45%
1801 1816 1831 1846 1861 1876 1891 1906 1921 1936 1951 1966 1981 1996 2011
Has Chile peaked already?
What’s next
Source: Plusmining based on EH-ClioLab PUC and Cochilco
• Aging of mines opened up duringthe 90s poses new challenges.
• Chile experiences a rapideconomic growth that transformsits society and the scenariobecomes more demanding.
• The period of rapid growth gaveway to a more complex stage ofgrowth.
Chilean copper mine production in the world’s total (%) (1801-2013)
?

What variables might impact Chile’s leadership in the
coming years?b1.

www.plusmining.com
What variables might impact Chile’s leadership in the coming years?
a) Technology?
b) Lack of funds?
c) Geological depletion, resource & reserve declines?
d) Public policies not sufficient or adequate enough to address the productivity decline?

www.plusmining.com
a) Technology, as it happened late XIX century?:
Unlikely. Though it is increasingly evident that the mining industry needs technological breakthroughs, when these occur, they shouldbe available for Chile, as its mining industry is open to international trade and linked to global supply chains.
b) Lack of funds?
• Unlikely.
• Chile’s economy is fully integrated to the international financing system, therefore this variable would not act as a factor that would impair Chilean mining growth.
• Small and medium-scale mining do face more financial access challenges, but they represent a minor contribution to the country’s production.
• A lack of funds might have an impact on Codelco, considering its current high debt level; but the government has decidedly agreed to support their investment plans by means of capital increases.
• Higher investment costs have led banks to assess more rigorously mining-related finance projects.
4.5155.153
7.9196.666
7.982
10.250
14.25213.582
15.596
20.52320.891
21.708
0
5.000
10.000
15.000
20.000
25.000
USD/TMF
Investment costs per copper production unit 2003-2014
Source: Mining Council based on SignumBox
What variables might impact Chile’s leadership in the coming years?
www.plusmining.com
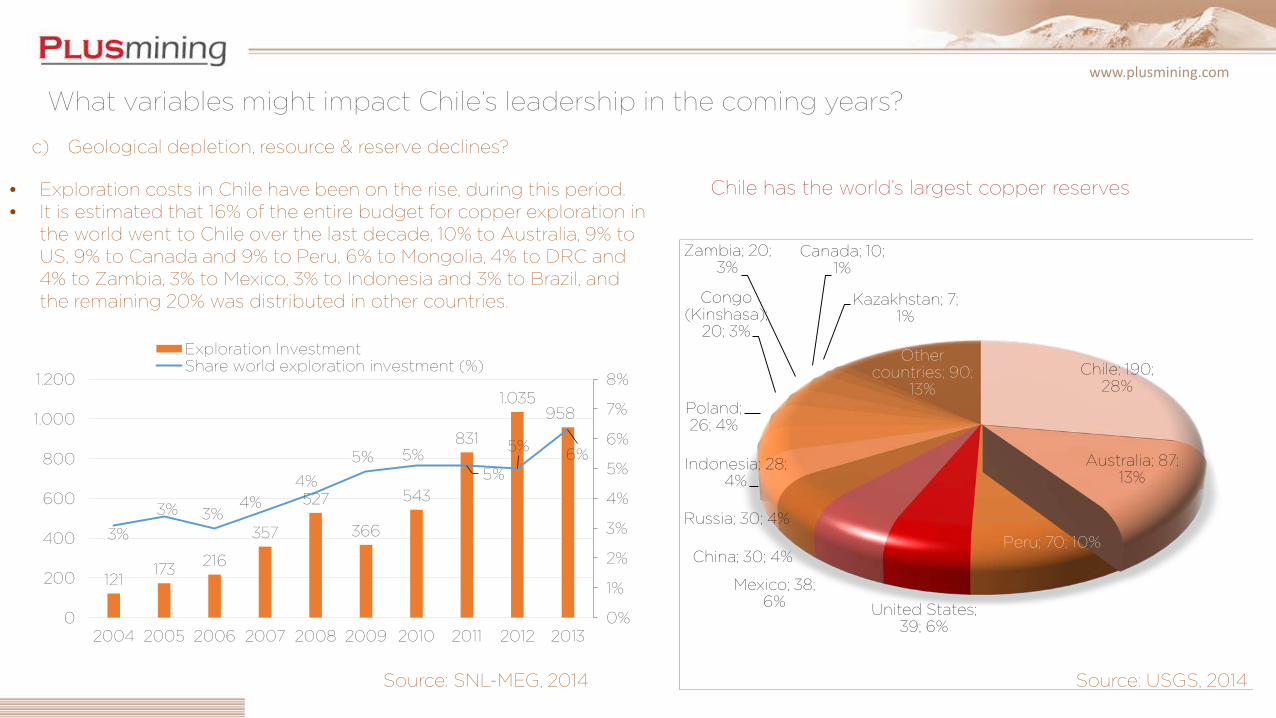
c) Geological depletion, resource & reserve declines?
Chile; 190; 28%
Australia; 87; 13%
Peru; 70; 10%
United States; 39; 6%
Mexico; 38; 6%
China; 30; 4%
Russia; 30; 4%
Indonesia; 28; 4%
Poland; 26; 4%
Congo (Kinshasa);
20; 3%
Zambia; 20; 3%
Canada; 10; 1%
Kazakhstan; 7; 1%
Other countries; 90;
13%
Source: SNL-MEG, 2014
Chile has the world’s largest copper reserves
121173
216
357
527
366
543
831
1.035958
3%
3% 3%4%
4%
5% 5%5%
5%6%
0%
1%
2%
3%
4%
5%
6%
7%
8%
0
200
400
600
800
1.000
1.200
2004 2005 2006 2007 2008 2009 2010 2011 2012 2013
Exploration InvestmentShare world exploration investment (%)
Source: USGS, 2014
• Exploration costs in Chile have been on the rise, during this period.• It is estimated that 16% of the entire budget for copper exploration in
the world went to Chile over the last decade, 10% to Australia, 9% to US, 9% to Canada and 9% to Peru, 6% to Mongolia, 4% to DRC and 4% to Zambia, 3% to Mexico, 3% to Indonesia and 3% to Brazil, and the remaining 20% was distributed in other countries.
What variables might impact Chile’s leadership in the coming years?

www.plusmining.com
c) Geological depletion, resource & reserve declines?
Source: Yearbook of Mining in Chile 2013, SernageominSource: U.S. Geological Survey, Mineral Commodity Summaries, January 1996 and 2015
As compared to the international scenario, Chile has experienced a significant increase in reserves, though it has slightly reduced the relative volumes associated to production, since present-day amounts will be able to sustain current production 4 years less than they did in 1994.
8094
110123 123 120
150 159 158 164
189209
146 151 161179 175 175
218 227 221
253269
296
0
50
100
150
200
250
300
350
MT
Reserves Resources
• Copper reserves have increased 160% in a decade.• A significant part of the increase in resources and reserves of
copper in Chile can be explained because the high price of copper make it possible to incorporate low-grade ore resources and reserves, that can be exploited due to favorable market conditions.
Production (TMT) Reserves (TMT) Production/Reserves (Years)
1994 2014 1994 2014 1994 2014 ChangeChile 2.220 5.800 88.000 209.000 40 36 -4Australia 416 1.000 7.000 93.000 17 93 76
Peru 399 1.400 7.000 68.000 18 49 31Mexico - 520 - 38.000 - 73 -United States 1.810 1.370 45.000 35.000 25 26 1China 350 1.620 3.000 30.000 9 19 10Russia 573 850 20.000 30.000 35 35 0Poland 328 425 20.000 28.000 61 66 5Indonesia 322 400 11.000 25.000 34 63 28Zaire (DRC) 40 1.100 10.000 20.000 250 18 -232
Zambia 385 730 12.000 20.000 31 27 -4Canada 623 680 11.000 11.000 18 16 -1Kazakstan 202 430 14.000 6.000 69 14 -55Philippines 110 - 7.000 - 64 - -Other countries 1.660 2.400 55.000 90.000 33 38 4World Total 9.438 18.295 310.000 700.000 33 38 5
What variables might impact Chile’s leadership in the coming years?

www.plusmining.com
Source: Estimates based on reports from mining companies
Reserves and Resources in Operating Copper Mines per Country, 2012
• Estimates indicate that half of worldwide copper reserves and resources associated to active mines can be found in Chile.
• Considering that global mining companies are now mainly focused on expanding rather than on developing new projects, it is likely that expansion projects continue to be developed, in spite of the increasing problems that nowadays affect the mining industry in Chile.
• It is believed that, in the last decade, 90% of reserve increases exhibited by major companies came from “upgrading” resources in projects and from acquired mines and only the remaining 10% was the result of grassroot exploration discoveries.
• While this trend ensures, in the short-run, better project feasibility chances, the weakness of grassroot exploration and new discoveries will, sooner or later, affect the industry due to the low availability of new copper resources.
Chile52%
Australia 9%
Peru7%
United States5%
Zambia 4%
Indonesia4%
Mexico3%
DRC 3%
Kazakhstan3%
Russia3%
Poland2%
China2%
Canada1%Brazil
1%
Iran1%
c) Geological depletion, resource & reserve declines?
What variables might impact Chile’s leadership in the coming years?

www.plusmining.com
Source: Global Mineral Resource Assessment Estimate of Undiscovered Copper Resources of the World, 2013. USGS
Using a geology-based assessment methodology, the U.S. Geological Survey estimated a mean of 3,500 million metric tons of undiscovered copper among 225 tracts around the world.
According to this study, most undiscovered copper resources are located in the Andean region of South America.
Region Deposit TypeUndiscovered resources (Mt)
Identified resources (Mt)
Mean
South AmericaPorphyry 750 810
Sediment-hosted 0,51
Central America and the Caribbean
Porphyry 170 42
North AmericaPorphyry 400 470
Sediment-hosted 57 18
Northeast Asia Porphyry 260 8,8
North Central AsiaPorphyry 440 130
Sediment-hosted 53 48
South Central Asia and Indochina
Porphyry 510 63
Sediment-hosted 4,5
Southeast AsiaArchipelagos
Porphyry 300 130
Australia Porphyry 21 15
Eastern Europe and Southwestern Asia
Porphyry 240 110
Sediment-hosted 13 6,4
Western EuropePorphyry 1,6
Sediment-hosted 120 77
Total Copper 3,500 2,100
What variables might impact Chile’s leadership in the coming years?
c) Geological depletion, resource & reserve declines?

www.plusmining.com
Source: Plusmining based on Cochilco
Costs in Chilean and World Copper Mining Industry 2003 - 2013
Why is Chilean Mining Industry struggling to keep competitiveness
0
50
100
150
200
250
300
2003 2004 2005 2006 2007 2008 2009 2010 2011 2012 2013
cU
SD
/lb
Chile Rest of the World
Structural
- Aging of large mines that started-up in the early nineties:
- Lower head-grades, greater transportation distances
- Higher Opex and Capex
Sector specific
- High energy cost
- Lack of fresh water
- High labor pressures
- Uncertain environmental permits
- Uncertain indigenous regulation
General policies- Dealing with a more
empowered society: demands for better education, better quality of life, higher social protection:
- Educational reform
- Tax reform (including foreign investor statute)
- Labor reform
The challenge: keep the path of social and economic progress under society’s transformation
d) Public policies not sufficient or adequate enough toaddress the productivity decline?
What variables might impact Chile’s leadership in the coming years?

www.plusmining.com
Total Productivity of Factors in Relevant Mining Districts – 1997-2013
0
50
100
150
200
250
2005 2006 2007 2008 2009 2010 2011 2012
Codelco Antofagasta Minerals Escondida
Collahuasi El Abra Candelaria
Quebrada Blanca Anglo American TOTAL
Source: Clapes PUC Source: Cesco
Productivity of Different Deposits or Companies in Chile(M.T. of copper per worker)
Mining productivity has also dropped in other large copper producer countries, such as Peru and Australia, though decline in Chile has been steeper.
Productivity

www.plusmining.com
Average head-grade in the Chilean copper industry (2002-2013) and forecast (2014-2024)
Source: Cochilco (2002-2013), estimated (2014-2024) Source: Estimated by Codelco in August 2013
Head grade decline has been steeper in Chile than the rest of the industry over the last ten years
0,4%
0,5%
0,6%
0,7%
0,8%
0,9%
1,0%
1,1%
1,2%
20
02
20
03
20
04
20
05
20
06
20
07
20
08
20
09
20
10
20
11
20
12
20
13
20
14
20
15
20
16
20
17
20
18
20
19
20
20
20
21
20
22
20
23
20
24
10% additional decline is forecast for the next decade
Head Grades

www.plusmining.com
Source: Mining Council of Chile based on Cochilco, Sernageomin and INE
0
20
40
60
80
100
120
140
160
180
200
2006 2007 2008 2009 2010 2011 2012 2013
Index - Labour compensation in mining (USD based)
Index - Productivity defined as processed mineral / workers
Index - Productivity defined as Cu produced / workers
Labor Productivity and Labor Compensation

www.plusmining.com
30%38%
25%
7%
Source: Mining Council of Chile
Workers41%Contractors
59%
Workers32%
Contractors68%
▪ 2003
▪ 2013
Non-Productive Unnecessary
• Interference with Operations• Interference with Housekeeping• Wait for overlaps, blockings, entry permits• Wait for Supervisor• Other waits• No job allocated
Physical Work
• Working in equipment unit• Looking for tools and parts• Looking for safety elements• Preparation• Cleaning, returning of tools, etc..
Coordination and analyses
• Permit to enter the area• Meal breaks / Dressing• Transport• Blocking / Unblocking• Blasting
Non-productive, necessary
• Toolbox meeting• Safe work permit• Flash risk assessment• Job allocation• Situation / job diagnosis• Crew coordination
Labor Model and Productivity
Source: Codelco
Estimating Productivity Contractors

www.plusmining.com
0,28
0,210,20
0,19 0,19
0,17 0,170,16 0,16 0,16 0,16
0,15 0,15 0,150,14 0,14 0,14 0,14
0,00
0,05
0,10
0,15
0,20
0,25
0,30
US
D/K
wh
Source: World Economic Forum
Electricity for industryTop-18 most expensive countries in the world
Source: Estimated by Codelco in August 2013
Electric power rates in relevant copper districts(cUSD 2012/Kwh)
Cost of Electricity
• According to the World Economic Forum, Chile is ranked 13 –out of 124 countries- among the nations with the highest electric power rates in the industry.
• Energy is expensive in Chile because large power projects (hydro and thermo), have not been developed.
• Non-conventional renewable sources are increasing strongly.
• The mining industry uses 32% of the electricity in Chile.• High energy consumption but higher efficiency as well.

Outlook - Investmentand Production until 2025c1.

www.plusmining.com
• Based on official estimates, investments for over USD 100 billion are expected to materialize in mining in Chile in the next 10 years.
• However, only ¾ of that amount is aimed at copper.
Copper77%
Other Minerals
23%
19.942
1.613
21.241
37.826
0%
10%
20%
30%
40%
50%
60%
70%
80%
90%
100%
Base Probable Possible Potential
• Out of the USD 80K million in copper investments, 27% (USD 21K million) corresponds to basic and probable investment; USD 21K million (26%) to possible projects, and almost half of it represents potential projects.
• In an environment of more uncertainty and high capital costs, the decision regarding these projects is one of low likelihood.
Source: Chilean Copper Commission – Cochilco. Investment in the Chilean mining industry - Project portfolio 2014 -2023. August/ 2014
www.plusmining.com
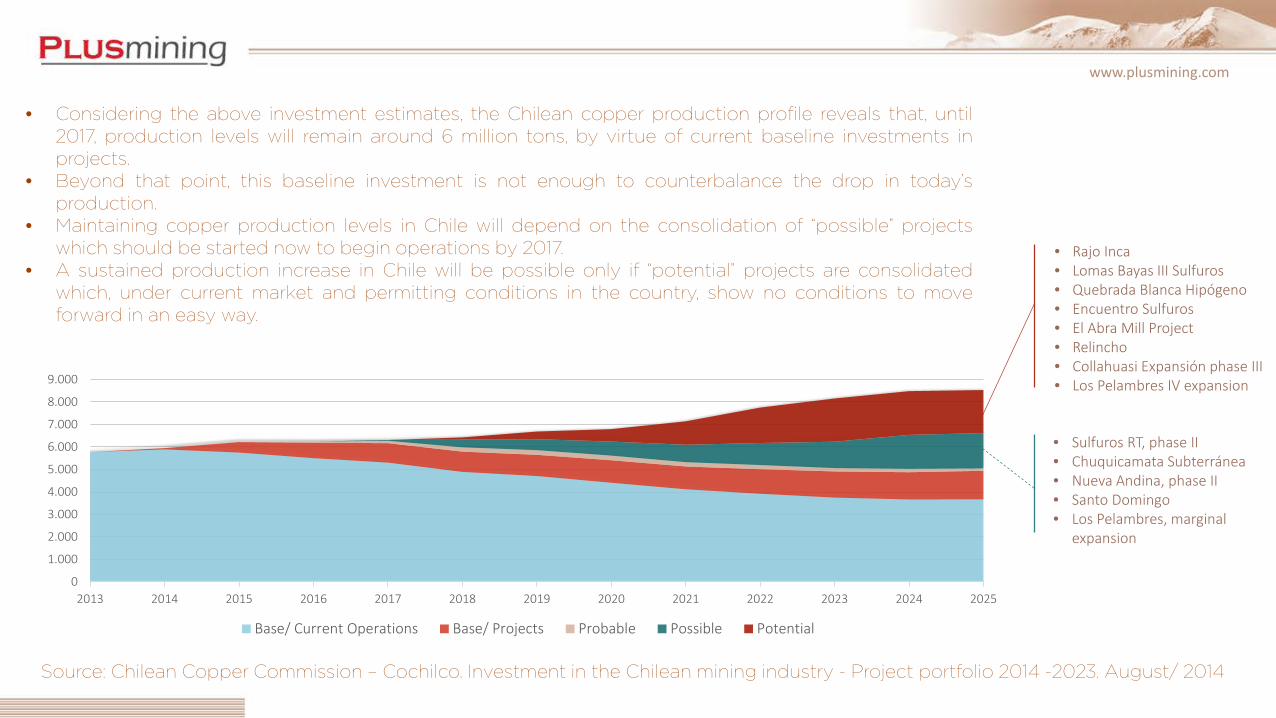
• Considering the above investment estimates, the Chilean copper production profile reveals that, until2017, production levels will remain around 6 million tons, by virtue of current baseline investments inprojects.
• Beyond that point, this baseline investment is not enough to counterbalance the drop in today’sproduction.
• Maintaining copper production levels in Chile will depend on the consolidation of “possible” projectswhich should be started now to begin operations by 2017.
• A sustained production increase in Chile will be possible only if “potential” projects are consolidatedwhich, under current market and permitting conditions in the country, show no conditions to moveforward in an easy way.
Source: Chilean Copper Commission – Cochilco. Investment in the Chilean mining industry - Project portfolio 2014 -2023. August/ 2014
0
1.000
2.000
3.000
4.000
5.000
6.000
7.000
8.000
9.000
2013 2014 2015 2016 2017 2018 2019 2020 2021 2022 2023 2024 2025
Base/ Current Operations Base/ Projects Probable Possible Potential
• Sulfuros RT, phase II• Chuquicamata Subterránea• Nueva Andina, phase II• Santo Domingo• Los Pelambres, marginal
expansion
• Rajo Inca• Lomas Bayas III Sulfuros• Quebrada Blanca Hipógeno• Encuentro Sulfuros• El Abra Mill Project• Relincho• Collahuasi Expansión phase III• Los Pelambres IV expansion

Can Codelco remain thejewel in the crown?2

www.plusmining.com
If Codelco does not invest in the structural projects,production would fall significantly and the company wouldnot be viable.
Countercyclical effect. Codelco’s capital expenditures arehelping the Chilean economy in the current downturn.
Codelco Production by Mine (1971-2013)
Source: Plusmining based on Codelco
0,0
0,2
0,4
0,6
0,8
1,0
1,2
1,4
1,6
1,8
2,0
0
200
400
600
800
1.000
1.200
1.400
1.600
1.800
2.000
1971
1973
1975
1977
1979
1981
1983
1985
1987
1989
1991
1993
1995
1997
1999
2001
2003
2005
2007
2009
2011
2013
TM
T
Ministro Hales
Gaby
El Teniente
Andina
Salvador
RadomiroTomic
Chuquicamata
Head Grade(%)
Source: Codelco
Codelco Production History and Forecast

Copper Reserves by Company
Mineral Reserves Head Grade Long-term price Production 2013
Million tm Million tmf % c/lb Thousand tmf Years
Southern Copper 25.021 80,07 0,32 367,4 SEC 617 130
Codelco 8.896 61,20 0,69 CONFIDENTIAL JORC** 1.622 38
BHP Billiton 5.870 43,44 0,74 s/i JORC 1.244 35
FCX 10.862 40,19 0,37 367,41 SEC 1.511 27
Glencore-Xstrata 3.998 33,59 0,84 s/i JORC 1.287 26
Rio Tinto 4.060 29,64 0,73 s/i JORC 632 47
KGHM 2.867 23,79 0,83 s/i s/i 531 45
Anglo American 3.352 23,13 0,69 s/i JORC 541 43
Antofagasta 2.704 13,25 0,49 s/i JORC 466 28
Vale 1.393 10,86 0,78 367,41 SEC 348 31
• Codelco has one of the largest mining basis of the world.• Most of these resources are associated with current operations so that its development offers
economic advantages.
Source: Estimated by Codelco in December 2013
0
5.000
10.000
15.000
20.000
25.000
30.000
35.000
40.000
Replacement Expansion New
TM
T
Codelco Other Copper
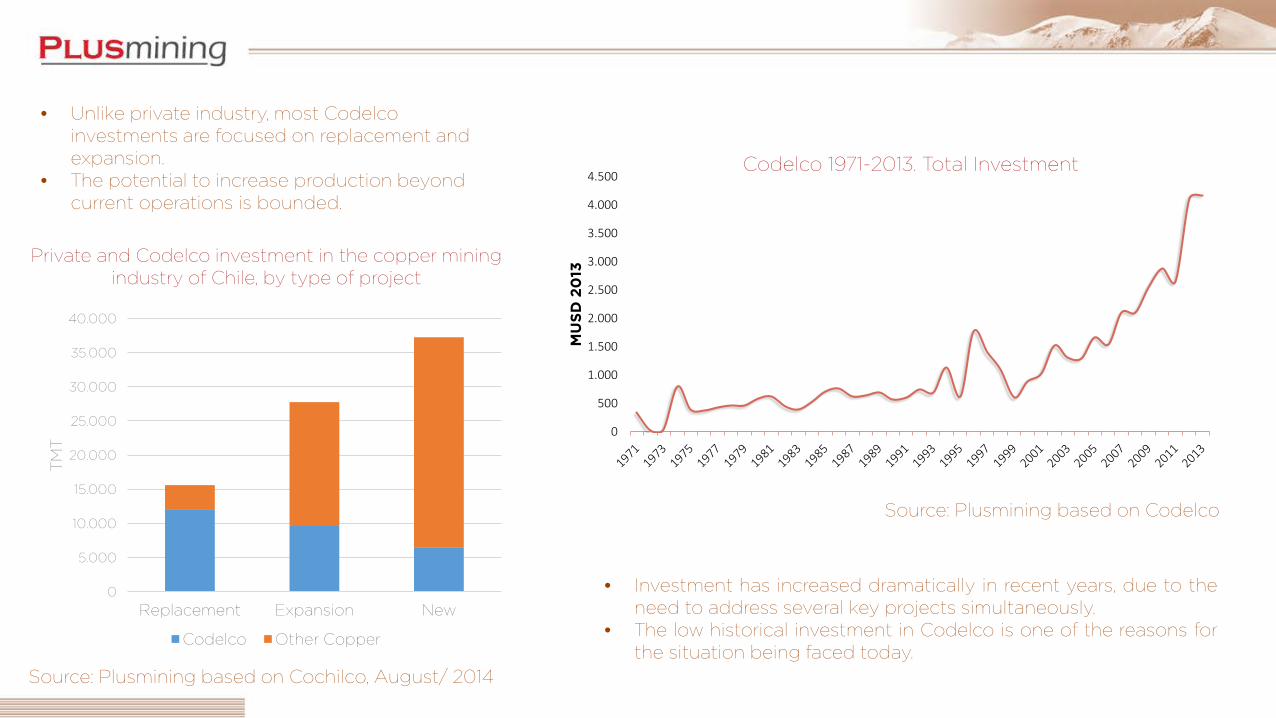
• Unlike private industry, most Codelco investments are focused on replacement and expansion.
• The potential to increase production beyond current operations is bounded.
Private and Codelco investment in the copper mining industry of Chile, by type of project
0
500
1.000
1.500
2.000
2.500
3.000
3.500
4.000
4.500
MU
SD
20
13
Source: Plusmining based on Codelco
Codelco 1971-2013. Total Investment
• Investment has increased dramatically in recent years, due to theneed to address several key projects simultaneously.
• The low historical investment in Codelco is one of the reasons forthe situation being faced today.
Source: Plusmining based on Cochilco, August/ 2014

Source: Plusmining based on Codelco
Start-up2013
MINISTRO HALES1997
RT SULPHIDESPHASE II
1915CHUQUICAMATAUNDERGROUND
1905EL TENIENTE NEW
MINE LEVEL
1970ANDINA
EXPANSION
1959INCA PIT
(Salvador)Status In commissioning. Feasibility finished.
EIA presented. In construction. In construction. In feasibility. EIA presented. In pre-feasibility.
CAPEX (US$ million) 3,301. 5,000 – 5,500. 4,000 – 4,500. 3,500 – 4,500. 6,500 – 7,500. 2,500 – 3,000.
Start-up date 2014. 2018 – 2019. 2019. 2019. 2023. 2019.
Life of mine 17 years. Around 40 years. Around 40 years. Around 50 years. Around 75 years. Around 35 years.
Copper production 176,000 tpy. 354,000 tpy. 367,000 tpy. 432,000 tpy. 343,000 tpy. 196,000 tpy.
Description
Operation of an open pit mine and processing ore at a stand-alone concentrator. Copper concentrate is then processed in a roasting plant to obtain calcines.
It is the continuity option for the development of the RT open pit mine, whose oxide production declines sharply from 2018.
Transforming the world largest open pit into a massive underground operation with a lifespan of about 39 years.
The objective is to ensure the operational continuity of El Teniente Division, exploiting mineral reserves below Teniente 8th level.
Aims to increase in 150 T tpd the capacity of ore processing at Andina Division, through the expansion of the open pit mine and the incorporation of new works and installations.
Open pit exploitation of the remaining resources from the Indio Muerto deposit , currently operated through an underground pit.
Other features
- 263 MT of mineral resources (1.11% total copper).- Important copper and silver content.- New open pit, concentrator and roaster.- 50,000 tpd of capacity.
- 2,674 MT of mineral resources (0.47% total copper).- Gives operational continuity to RT open pit.- Open pit, concentration plant (SAG) and desalination plant.- 200.000 tpd of capacity increase, in two stages.
- Exploit some of the resources remaining under current open pit of Chuquicamata.- 1,760 million tones of mineral resources (0.71% total copper).- Copper and molybdenum content.140,000 tpd of capacity.
- 1,699 MT of mineral resources (0.90% total copper).- Underground mining, with an exploitation system similar to El Teniente, but ore transportation to the plant will use continuous conveyor belts. - Maintain current production capacity at El Teniente (137,000 tpd).
- 4,331 MT of mineral resources (0.74% total copper). It is Codelco’s largest deposit.- Expansion of open pit, new operations of crushing, concentration, ore transport system and storage of copper concentrate.- Increases capacity from 94,000 tpd to 244,000 tpd.
1,621 million tones of mineral resources (0.45 % total copper and 150 ppm of molybdenum).Considers the expansion of current treatment capacity of the Division from 35 ktpd to 132 ktpd.
2008Gabriela Mistral
www.plusmining.com
Codelco’s Outlook
• With the only exception of Gabriela Mistral, every Codelco operation is facing a major project.
• Among the 6 large structural projects, 4 are critical for the viability of the operation: RT Sulphides Phase II,Chuquicamata Underground, El Teniente New Mine Level and Inca Pit (Salvador).
• Advantages: large reserve base and availability of facilities.
• Challenge: development of 6 projects at the same time.

Final Comments3

www.plusmining.com
Final Remarks
• Chile will continue to be the leader in copper production in the world in the coming years.
• However, its contribution to the growth of world supply will be at lower rates compared to previous decadesand its market share is likely to decline, especially due to the fall of head-grades, the greatest difficulties todevelop projects and increase net growth of Peru.
• Chile has the potential to recover its growth due to its large base of brownfield resources. However it is likelythat investment decisions are postponed until better conditions exist to invest.
• The low basic exploration and difficulties in developing new projects affect the growth capacity of themining industry in a horizon of 10 and beyond, both in Chile and worldwide.
• Codelco faces a large and complex challenge to keep its production. Maintaining its leadership will requireovercoming, in a flawless way, a series of non-low risk projects.
• Chile needs to regain a consensus view about its future in order to overcome structural barriers that slow upthe growth of mining.

Visit www.plusmining.com
Intelligence services on mining markets and industries and advising
on business development