can groups solve the problem of over-bidding in contests · can groups solve the problem of...
TRANSCRIPT

Can Groups Solve the Problem of Over-Bidding in
Contests?
Roman M. Sheremeta* and Jingjing Zhang**
* Argyros School of Business and Economics, Chapman University,
1 University Drive, Orange, CA 92866, USA
** Department of Economics, McMaster University,
1280 Main Street West, Hamilton, ON L8S 4M4, Canada
September 10, 2009
Abstract
This study reports an experiment that examines whether groups can better comply with theoretical predictions than individuals in contests. Our experiment replicates previous findings that individual players significantly overbid relative to theoretical predictions, incurring substantial losses. There is high variance in individual bids and strong heterogeneity across individual players. The new findings of our experiment are that groups make 25% lower bids, their bids have lower variance, and group bids are less heterogeneous than individual bids. Therefore, groups receive significantly higher and more homogeneous payoffs than individuals. We elicit individual and group preferences towards risk using simple lotteries. The results indicate that groups make less risky decisions, which is a possible explanation for lower bids in contests. Most importantly, we find that groups learn to make lower bids from communication and negotiation between group members.
JEL Classifications: C72, C91, C92, D72 Keywords: rent-seeking, contest, experiments, risk, over-dissipation, group decision-making Corresponding author: Roman M. Sheremeta; E-mail: [email protected] We are particularly grateful to Timothy Cason, Martin Kocher, Vai-Lam Mui, Matthias Sutter, and two anonymous referees for very useful comments. The research of Roman M. Sheremeta was supported by NSF Grant SES-0751081. The research of Jingjing Zhang was supported by NSF Grant SES-0721019. Any remaining errors are ours.

2
1. Introduction
Contests are competitive games in which players make bids in order to win a prize.
Examples include rent-seeking contests, R&D competitions between firms, and patent races. It is
well documented that in most contest experiments subjects overbid relative to theoretical
predictions, which is inconsistent with empirical evidence from the field. This inconsistency may
be explained by the fact that firms use groups, instead of individuals, to determine their bidding
strategies. While previous experimental studies employ only individuals, we examine whether
groups can make “more rational” decisions than individuals in a contest experiment. We refer to
a more rational decision as a decision that is closer to theoretical predictions.1
The phenomenon of over-bidding was first discovered in an experimental contest study
by Millner and Pratt (1989, 1991) and it has been further replicated by many other experiments.
As a result of over-bidding, most subjects, on average, receive negative payoffs (Davis and
Reilly, 1998; Gneezy and Smorodinsky, 2006; Sheremeta, 2009b). Moreover, contrary to the
theoretical prediction of a unique pure strategy Nash equilibrium, experimental studies document
that individual bids are distributed on the entire strategy space, and even aggregate individual
behavior is heterogeneous (Millner and Pratt, 1989, 1991; Davis and Reilly, 1998; Potters et al.,
1998; Parco et al., 2005).
The findings of experimental studies are hard to reconcile with some of the empirical
evidence from the field. In particular, Hazlett and Michaels (1993) estimate that, in FCC
lotteries, total firm expenditures account for only 38% of the final prize value, suggesting that
firms do not over-bid in lottery contests. The crucial difference between lab experiments and
1 In contests, over-bidding leads to lower payoffs, while more rational (or equilibrium) bidding leads to higher payoffs. Therefore, in a sense a “more rational” decision may also be interpreted as a “better” decision because it results in higher payoffs.

3
lottery contests in the field is that lab experiments use individual bidders while many firms
assemble groups such as teams of experts and committees to determine the bidding strategies
(Hoffman et al., 1991; Borgers and Dustmann, 2005).2
This study reports an experiment that examines whether groups can make more rational
decisions than individuals in lottery contests. We study a simple lottery contest as in Tullock
(1980). In the first treatment individuals, while in the second treatment groups, are competing for
a prize in a lottery contest. More specifically, a single bid is submitted by a group of two subjects
after they exchange free-form text messages in a chat window for one minute. This distinguishes
our study from other studies with exogenous group decision rules, i.e. the average of the group
members’ bids in Cox and Hayne (2005), the sum of the group members’ bids in Ahn et al.
(2009), and the best-shot or weakest-link in Sheremeta (2009c). The results of the experiment
indicate that although groups still overbid relative to the Nash equilibrium, groups indeed make
more rational decisions than individuals: groups make 25% lower bids, bids have less variance,
and groups are less heterogeneous. As a result, groups receive significantly higher and more
homogeneous payoffs than individuals. A possible explanation for these findings is that groups
make less risky decisions than individuals. Most importantly, we find that groups learn to make
lower bids from communication and negotiation between group members.
Our results contribute to at least three research areas. First, our study contributes to the
discussion on why there is over-bidding in contests. Over the last decade a number of studies
have offered different explanations. The first common explanation is that most subjects are likely
to make mistakes (Potters et al., 1998). These mistakes add noise to the Nash equilibrium
2 The empirical evidence from the field is not as consistent as the experimental evidence. While some studies report under-expenditures in the field (Hazlett and Michaels, 1993), one may find anecdotal evidence that point out to over-expenditures in the field contests. For example, the European pro-league football clubs are often left in turmoil and near bankrupt due to very high expenditures.

4
solution and thus may cause over-bidding in contests. Several studies have provided support for
this argument (Goeree et al., 2002; Schmidt et al., 2005; Sheremeta, 2009a). A second
explanation for over-bidding is based on the observation that most subjects are not risk-neutral
(Cox et al., 1988). In a theoretical model, Hillman and Katz (1984) show that risk-seeking
players make higher bids than risk-neutral players. This theory is supported by three independent
contest experiments (Miller and Pratt, 1991; Schmidt et al., 2005; Sheremeta, 2009a), which
show that subjects who are more willing to take risks make substantially higher bids in lottery
contests.3 Our results are consistent with these two explanations. Groups perform better than
individuals because groups make less risky decisions and they reduce individual mistakes
through group communication.
Second, our results contribute to the literature investigating means by which over-bidding
in contests can be reduced. So far, experimental economists have found that over-bidding
decreases with the repetition (Davis and Reilly, 1998; Gneezy and Smorodinsky, 2006).
Therefore, one way to reduce over-bidding is to allow economic agents to gain experience over
time. This does not solve the problem of over-bidding for inexperienced contestants, though.
Another way to reduce over-bidding is to constrain individual endowments (Parco et al, 2005;
Sheremeta, 2009a). However, in the world of competitive capital markets money is relatively
easy to borrow and thus it is very unlikely that such constraints will be imposed (D’Avolio,
2002). Our results suggest that letting groups, instead of individuals, make bids in lottery
contests is an effective way to reduce over-bidding.
Finally, our study contributes to the discussion on whether groups are more rational than
individuals. Recent experimental studies have shown that depending on the environment groups
3 Other studies also suggest such explanations as misperception of probabilities (Sheremeta, 2009a), judgmental biases (Baharad and Nitzan, 2008), and a non-monetary utility of winning (Parco et al, 2005; Sheremeta, 2009b).
5
can be either more or less successful in solving economic problems than individuals. For
example, Cooper and Kagel (2005) show that groups consistently make more strategic decisions
than individuals in a repeated signaling game, where an incumbent monopolist attempts to deter
entry by signaling. Casari et al. (2009) find that groups perform better than individuals in
handling the winner’s curse problem in the context of the company takeover game. 4 On the other
hand, in a common value auction, Cox and Hayne (2006) document that groups bid more
competitively than individuals which leads to significantly lower profits. Sutter et al. (2009) also
report that groups stay longer in an ascending sealed-bid English auction, bid higher, and thus
make fewer profits than individuals. 5 Relying on previous experimental findings on group
decision making, it is not obvious whether in lottery contests group behavior will be closer to
standard game-theoretic predictions than individual behavior. Our study contributes to this
discussion by explicitly examining group versus individual decision making in a laboratory
experiment and we find that in lottery contests groups make more rational discussions than
individuals.
4 Charness et al. (2007) compare individual and group decision making under risk and find that groups make substantially fewer errors than individuals. Charness et al. (2008) report that groups fall less to the conjunction fallacy in probability judgment. Groups are also better in processing information in “letters to numbers” problem and beauty-contest games (Stasser and Dietz-Uhler, 2001; Laughlin et al., 2002, 2003; Kocher and Sutter, 2005; Sutter, 2005, 2007). 5 Previous studies have offered insights on why groups perform worse than individuals in some environments. Kerr et al. (1996), for example, find that groups may amplify rather than suppress judgmental biases. Group decisions also depend critically on the procedure in which the experiment is conducted (Brady and Wu, 2008). In some experiments, groups make poor decisions even when the group is composed of highly capable individuals. This is mainly because interactions within a group result in distraction and process losses (Davis, 1992; Laughlin, 1996; Steiner, 1972).
6
2. Theoretical Model
In a simple lottery contest identical risk-neutral players are competing for a prize of
value . Each player chooses his bid, , to win the prize. The probability that a player wins
the prize, , , is given by the lottery contest success function:
,∑
. (1)
That is, the probability of winning depends on own bid relative to the sum of all bids.
This lottery contest success function is commonly used in most of the theoretical contest
literature (Tullock, 1980), including virtually all of the experimental contest literature. Given (1),
the expected payoff for player , , can be written as
, . (2)
That is, the probability of winning the prize, , , times the value of the prize, ,
minus the bid, . Differentiating (2) with respect to and accounting for the symmetric Nash
equilibrium leads to a classical solution (Tullock, 1980),
. (3)
The equilibrium bid (3) is increasing in the prize value and decreasing in the number of
players. It is important to emphasize that Szidarovszky and Okuguchi (1997) and Cornes and
Hartley (2005) have proved that this equilibrium is unique.
3. Experimental Design and Procedures
Our experiment consists of two different treatments. In the Individual treatment there are
4 individual players ( = 4) competing with each other for a prize with a value of 120 ( = 120).
From (3), the unique equilibrium bid is 22.5. The expected payoff of such a contest is 7.5. The

7
Group treatment is exactly the same as Individual treatment except that, instead of 4 individual
players, 4 pairs of players compete with each other for a prize of 120. We refer to a pair of
individuals as a group hereafter.
The experiment involved 108 undergraduate subjects from Purdue University. The
computerized experimental sessions were run using z-Tree (Fischbacher, 2007). We ran 3
sessions in the Individual treatment (36 subjects) and 3 sessions in the Group treatment (72
subjects). Each session in the Individual treatment included a total of 12 subjects and the session
proceeded in two parts: part 1a and part 2a. Instructions, available in Appendix, were given to
subjects at the beginning of each part and the experimenter read the instructions aloud. In part 1a,
subjects made 15 choices in simple lotteries, similar to Holt and Laury (2002).6 At the end of the
session we randomly selected 1 out of 15 decisions for payment. This method was used to elicit
subjects’ risk preferences. In part 2a, each subject played a lottery contest for 30 periods. In each
period subjects were randomly and anonymously placed into a group of 4 players. Subjects were
randomly re-grouped after each period. At the beginning of each period, subjects were given an
endowment of 120 experimental francs and were asked to make a bid for a prize of 120 francs.
All subjects were informed that by increasing their bids, they would increase their chances of
winning and regardless of who wins the prize all subjects would have to pay their bids. After all
subjects submitted their bids, the computer chose the winner by implementing a simple lottery
rule: the chance of receiving the prize is calculated by the number of francs a subject bids
divided by the total number of francs all 4 subjects in the group bid. In case all subjects bid zero,
the prize was randomly assigned to one of the four subjects in the group. At the end of each
6 Subjects were asked to state whether they preferred safe option A or risky option B. Option A yielded $1 payoff with certainty, while option B yielded a payoff of either $3 or $0. The probability of receiving $3 or $0 varied across all 15 lotteries. The first lottery offered a 5% chance of winning $3 and a 95% chance of winning $0, while the last lottery offered a 70% chance of winning $3 and a 30% chance of winning $0.

8
period, the sum of all bids in the group and personal period earnings were reported to all
subjects. After completing all 30 decision periods, 5 periods were randomly selected for payment
in part 2a. The earnings were converted into US dollars at the rate of 60 francs to $1. On average,
subjects earned $17 each and this was paid in cash. The experimental sessions lasted for about 50
minutes.
In each session with the Group treatment there were a total of 24 subjects (12 pairs) and
the session proceeded in two parts: part 1b and part 2b. In part 1b, subjects were randomly
divided into pairs and were asked to make 15 choices in simple lotteries. Hence there were 12
pairs in each session. Following the procedure in Zhang and Casari (2009), after exchanging
proposals and free-form text messages with each other, each pair had up to three rounds to reach
an agreement for each of the 15 choices. We paid for only 1 of the 15 decisions, chosen
randomly at the end of the session.
In part 2b, subjects faced the lottery contest for 30 periods and were asked to make their
decisions in pairs. Pairs were the same as in part 1b and all players stayed in the same pairs for
all 30 periods. After each period, we randomly re-grouped different pairs to form a group of 4
pairs. Every period had a proposal phase, a chat phase, and a bidding phase. All players initially
made a bid proposal. The bid proposals were then displayed for both pair members to see. At that
point, players could chat for one minute after which they submitted a bid for the pair decision. If
both players from the same pair made the same bid, then it became a pair bid. Otherwise, both
players had another minute to chat and after that they submitted their final bids. If there was still
disagreement, the pair lost the endowment of 120 francs and the pair bid was replaced with a bid
made by a randomly selected pair in a different session (this happened only once in the entire
experiment). After completing all 30 decision periods, 5 periods were randomly selected for

9
payment in part 2b. The earnings were converted into US dollars at the rate of 30 francs to $1
and these earnings were split equally between two group members (so that the effective
conversion rate was 60 francs to $1 as in the Individual treatment). On average, subjects earned
$22 each and the experiment session lasted for about 90 minutes.7
4. Results
4.1. Individuals versus Groups
Table 4.1 summarizes average bids, payoffs, and dissipation rates in Individual and
Group treatments. Overall, subjects in both treatments overbid relative to the risk-neutral Nash
equilibrium. Dissipation rates, defined as the ratio of the total sum of bids to the value of the
prize, are significantly greater than the predictions (for both treatments p-value < 0.05).8 Bids
made in the first period in both treatments are significantly different from the theory as shown by
a Wilcoxon signed-rank tests (p-value < 0.05 for Individual treatment and p-value = 0.06 for the
Group treatment).
Table 4.1 – Average Statistics
Treatment Individual Group Equilibrium Average Bid 43.8 (1.07) 32.8 (0.91) 22.5 Average Payoff -13.8 (1.58) -3.1 (1.49) 7.5 Dissipation Rate 1.46 (0.04) 1.09 (0.03) 0.75 Standard error of the mean in parentheses
The main question we pose in this study is whether groups make more rational decisions
than individuals. The lottery contest that we study has systematic over-bidding, and thus more
7 We gave subjects a higher show up fee in the Group treatment than the Individual treatment to compensate for longer experimental sessions. 8 We estimated a random effect model, with individual subjects random effects and standard errors clustered at the session level, on a constant separately for each treatment. Then we tested whether the constant coefficients are equal to the predicted theoretical values as in Table 4.1. We found that these differences are significant for both treatments (p-value < 0.05).
10
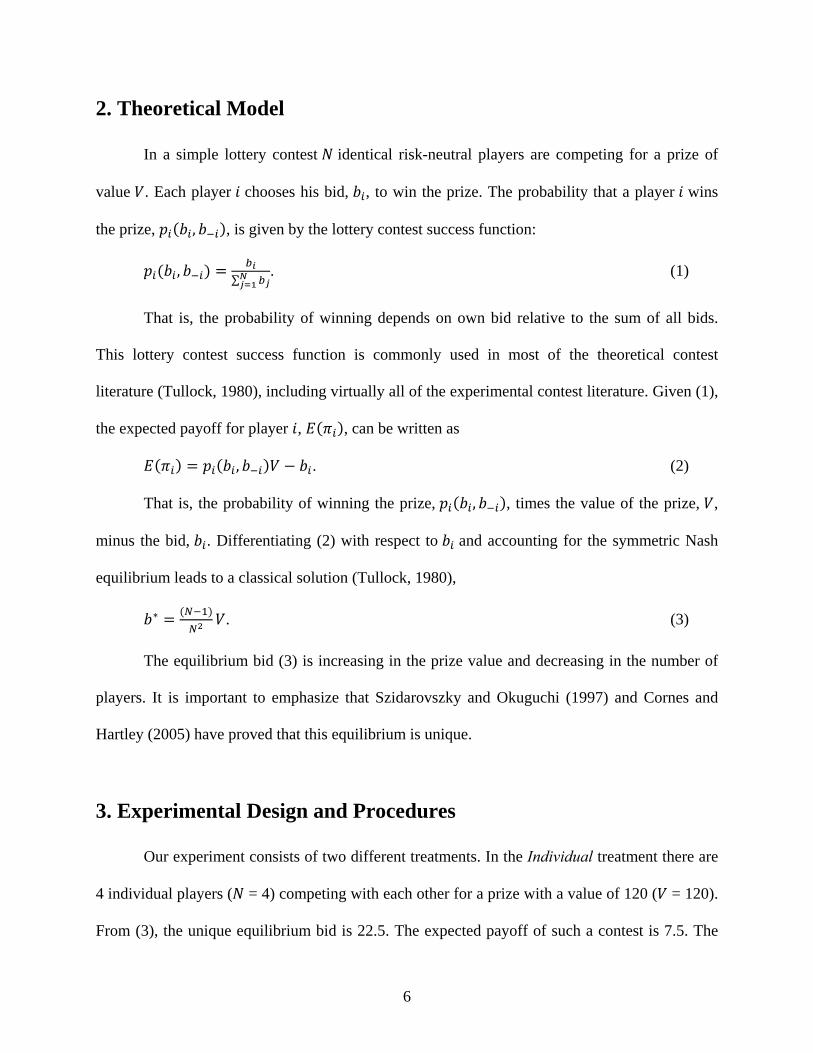
rational decisions correspond to lower bids.9 From Table 4.1, we can see that groups on average
bid 32.8 while individuals bid 43.8 (a difference of 25%). This difference is significant based on
the estimation of a random effect model with standard errors clustered at the session level, where
the dependent variable is the bid and the independent variables are a period trend and a treatment
dummy-variable (p-value < 0.05).
Result 1. Groups make 25% lower bids than individuals, although both groups and
individuals significantly overbid relative to the equilibrium. As a result, groups incur fewer
losses than individuals.
Figure 4.1 – Average Bid over Periods
Figure 4.1 shows that average individual bids are higher than average group bids over all
periods of the experiment. As a result of significant over-bidding, average payoffs are negative.
Individuals receive an average payoff of -13.8 and groups receive -3.1. As players become more
9 Note that higher bids are not the best-response to the observed over-bidding in lottery contests.
20
25
30
35
40
45
50
55
60
Average Bid
Period
Individual
Group
Equilibrium
11
experienced they decrease their bids, indicating some learning. A simple regression of the bid on
a period trend shows a significant and negative relationship (p-value < 0.05).
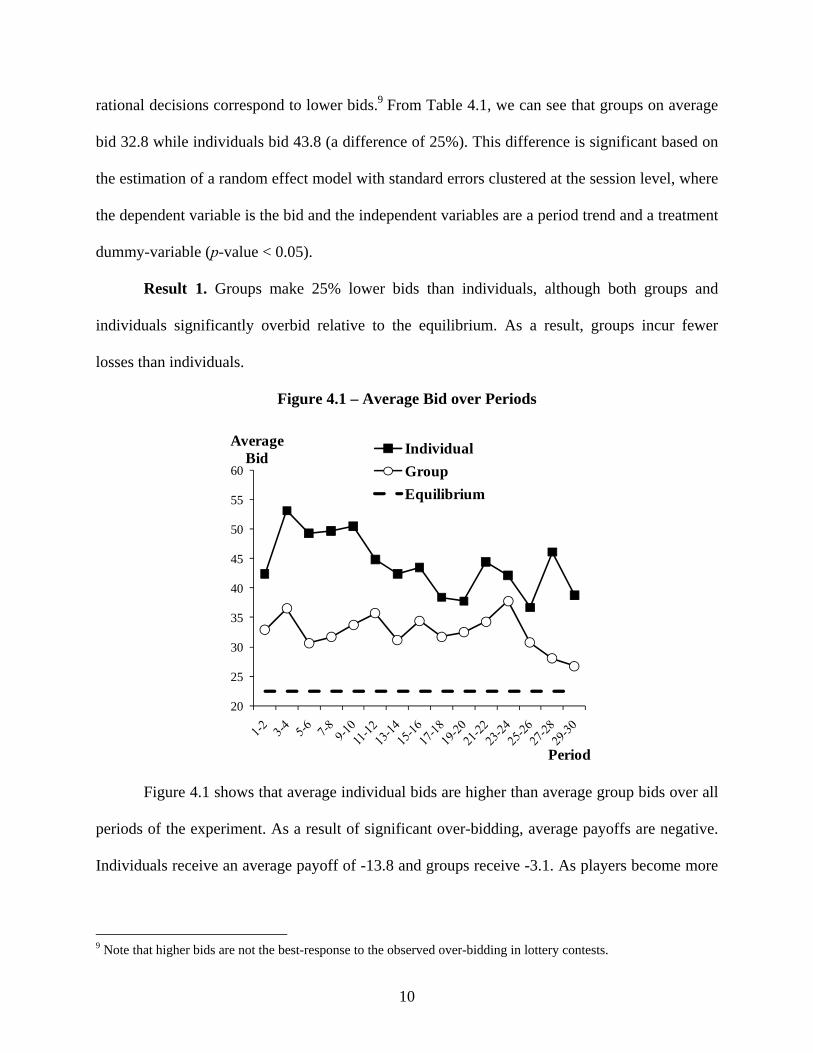
Contrary to the unique pure strategy Nash equilibrium, both individual and group bids are
distributed on the entire strategy space. Figure 4.2 shows that instead of a single-point
equilibrium of 22.5, bids range from 0 to 120. A high variance in individual bids is consistent
with previous experimental findings of the contest literature (Millner and Pratt, 1989, 1991;
Davis and Reilly, 1998; Potters et al., 1998; Sheremeta, 2009a, b). This puzzling observation
produces a challenge for existing contest theory (Cornes and Hartley, 2005). Figure 4.2 also
shows that group bids are significantly less dispersed than individual bids. We can reject the
equality of two distributions based on a standard F-test and Levene's robust test for the equality
of variances (p-value < 0.05).
Result 2. There is a substantial variance in bids, but groups have a lower bid variance
than individuals.
Figure 4.2 – Distribution of Bids
This finding contributes to the discussion on whether groups are more rational than
individuals. In particular, Result 2 suggests that groups better comply with game theoretic
0.0
5.1
.15
.2F
ract
ion
0 20 40 60 80 100 120Bid
Individual
0.0
5.1
.15
.2F
ract
ion
0 20 40 60 80 100 120Bid
Group

12
predictions than individuals by the fact that groups have lower bid variance. In equilibrium, of
course, the bid variance should be zero.
Another puzzle for contest theory comes from the observation that even aggregate
individual behavior is heterogeneous (Parco et al., 2005; Sheremeta, 2009a). Figure 4.3 ranks 36
individuals and 36 groups by the average bids they submitted over 30 periods. The line that
represents groups is flatter than the line that represents individuals, indicating less heterogeneity
across groups than across individuals.
Result 3. There is less heterogeneity across groups than across individuals.
Figure 4.3 – Average Bids Ranked by Individual (Group)
This finding also confirms the earlier observation that groups better comply with game
theoretic predictions than individuals. Result 3 suggests that in the aggregate bidding behavior
groups are more homogenous than individuals. At equilibrium, of course, all players should
make identical bids. Overall, Results 1, 2, and 3 indicate that groups make more ratioanl
0
20
40
60
80
100
120
1 4 7 10 13 16 19 22 25 28 31 34
Average Bid
Individual (Group) ID
Individual
Group
Equilibrium
13
decisions than individuals in lottery contests: groups make lower bids with a smaller variance
and groups are less heterogeneous.
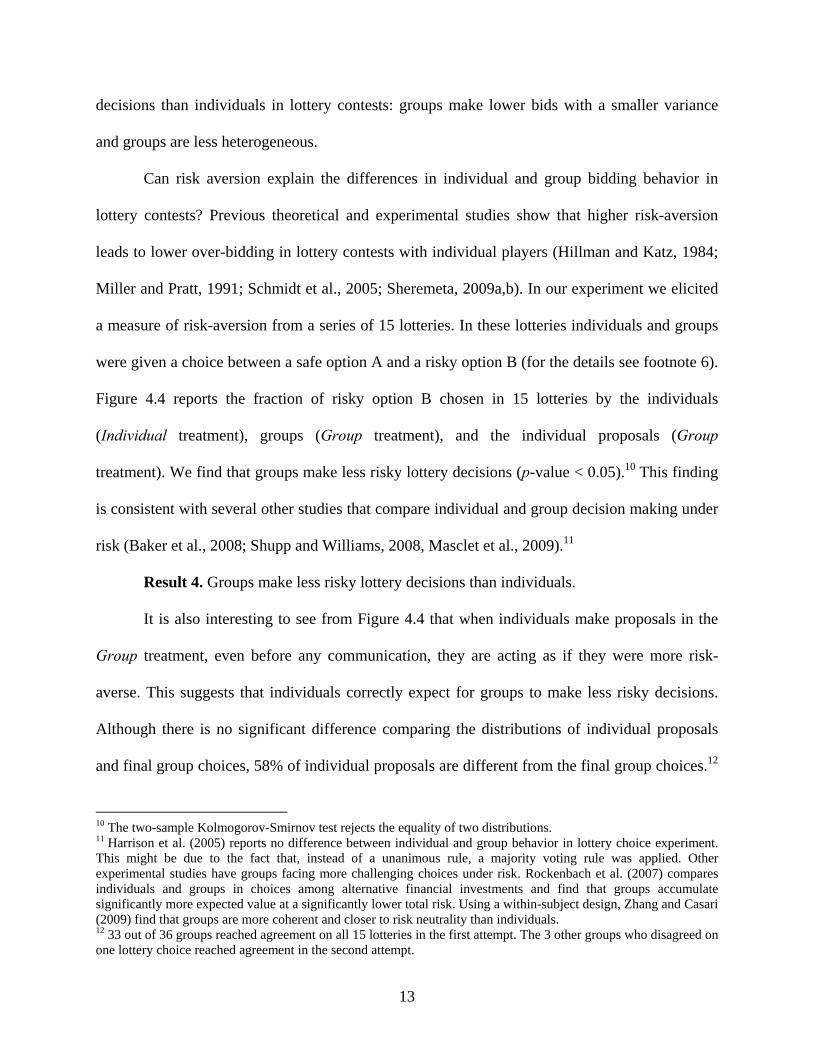
Can risk aversion explain the differences in individual and group bidding behavior in
lottery contests? Previous theoretical and experimental studies show that higher risk-aversion
leads to lower over-bidding in lottery contests with individual players (Hillman and Katz, 1984;
Miller and Pratt, 1991; Schmidt et al., 2005; Sheremeta, 2009a,b). In our experiment we elicited
a measure of risk-aversion from a series of 15 lotteries. In these lotteries individuals and groups
were given a choice between a safe option A and a risky option B (for the details see footnote 6).
Figure 4.4 reports the fraction of risky option B chosen in 15 lotteries by the individuals
(Individual treatment), groups (Group treatment), and the individual proposals (Group
treatment). We find that groups make less risky lottery decisions (p-value < 0.05).10 This finding
is consistent with several other studies that compare individual and group decision making under
risk (Baker et al., 2008; Shupp and Williams, 2008, Masclet et al., 2009).11
Result 4. Groups make less risky lottery decisions than individuals.
It is also interesting to see from Figure 4.4 that when individuals make proposals in the
Group treatment, even before any communication, they are acting as if they were more risk-
averse. This suggests that individuals correctly expect for groups to make less risky decisions.
Although there is no significant difference comparing the distributions of individual proposals
and final group choices, 58% of individual proposals are different from the final group choices.12
10 The two-sample Kolmogorov-Smirnov test rejects the equality of two distributions. 11 Harrison et al. (2005) reports no difference between individual and group behavior in lottery choice experiment. This might be due to the fact that, instead of a unanimous rule, a majority voting rule was applied. Other experimental studies have groups facing more challenging choices under risk. Rockenbach et al. (2007) compares individuals and groups in choices among alternative financial investments and find that groups accumulate significantly more expected value at a significantly lower total risk. Using a within-subject design, Zhang and Casari (2009) find that groups are more coherent and closer to risk neutrality than individuals. 12 33 out of 36 groups reached agreement on all 15 lotteries in the first attempt. The 3 other groups who disagreed on one lottery choice reached agreement in the second attempt.

14
In the proposal stage, 29 out of 36 groups were in disagreement. After two minutes of
communication, one of the two proposals prevailed in 16 groups. The more risk averse subject
conformed to the less risk averse subject in 10 groups and the less risk averse subject conformed
to the more risk averse subject in 6 groups. In the other 10 groups, two subjects reached a
compromise by choosing the average of the two proposals.
Figure 4.4 – Choices of Individuals and Groups in Lotteries13
It is important to emphasize that the differences in risk-aversion between individuals and
groups may not be the cause for the differences in bids (Cox et al., 1988; Berg et al., 2005). To
see whether risk-aversion correlates with the decisions made in the lottery contest we conduct a
multivariate analysis. Table 4.2 reports the estimation results of three random effect models,
where the dependent variable is a bid made by either an individual or a group. All regressions
13 Figure 4.4 includes non-monotonic lottery choices, i.e. more than one switching point from A to B. Individual decisions are 94.4% monotonic. Individual proposals in the group treatment are 93.1% monotonic. Group choices are 100% monotonic (this again is an indication of groups being more rational than individuals).
0.0
0.1
0.2
0.3
0.4
0.5
0.6
0.7
0.8
0.9
1.0
1 2 3 4 5 6 7 8 9 10 11 12 13 14 15
Fraction of Option B
Lottery
Risk Neutral
Individual
Group
Individual Proposals

15
include dummy variables to capture session and treatment effects (not shown in the table). To
allow for time effects we include a period trend. The independent lagged variables are designed
to capture the dynamic nature of the experiment.
Table 4.2 – Determinants of Individual and Group Bids
Dependent variable, bid Individual Group Individual+Group
Specification (1) (2) (3) bid-lag 0.61** 0.54** 0.61** [bid in period t-1] (0.03) (0.03) (0.02) win-lag 1.02 6.97** 1.02 [1 if win in t-1] (2.14) (1.90) (1.99) otherbid-lag 0.00 0.00 0.00 [sum of opponents' bids in period t-1] (0.01) (0.02) (0.01) Period -0.18 -0.09 -0.18 [period trend] (0.10) (0.09) (0.10) risk-averse 1.31 -0.02 1.31 [number of risky options B < 7] (1.86) (2.19) (1.73) risk-seeking 9.31** 3.26 9.31** [number of risky options B > 8] (3.11) (3.29) (2.89) Group × bid-lag -0.07
(0.04) Group × win-lag 5.95*
(2.87) Group × otherbid-lag -0.01
(0.02) Group × period 0.09
(0.14) Group × risk-averse -1.33
(2.94) Group × risk-seeking -6.04
(4.60) Observations 1044 1044 2088 Robust standard errors in parentheses. * significant at 5%, ** significant at 1% Specifications (1) and (2) use the data from the Individual and Group treatments, while specification (3) uses pooled data from both treatments. All models include a random effects error structure, with the individual subject effects. We also include dummies to control for session and treatment effects.
Consistent with previous experimental findings, specifications (1) and (3) indicate that
risk-aversion elicited from lotteries has significant influence on bidding behavior of individuals.
Risk-seeking individuals make higher bids than risk-averse individuals. On the other hand, risk-
aversion does not have a significant effect on bidding behavior of groups (specifications 2 and
16
3). 14 Another interesting finding from Table 4.2 is that a win-lag variable is positive and
significant for groups (specifications 2 and 3). This variable takes a value of 1 if individual or
group won the contest in period t-1 and 0 otherwise. One interpretation of this finding might be a
“hot hand” phenomenon, documented in the gambling literature. The idea is based on the
observation that gamblers hold beliefs in a positive autocorrelation of a non-autocorrelated
random sequence (Gilovich et al., 1985; Chau and Phillips, 1995; Croson and Sundali, 2005). In
our experiment, the random draws made by the computer in each period are not correlated.15
However, as we can see from Table 4.2, groups place higher bids in period t if they won in
period t-1. This might be due to the fact that groups pay more attention to the history of the play
as they discuss about the details of the game during the chat period. The information about
winning in the last period may be a misleading distraction which makes groups fall prey to the
“hot hand” phenomenon more often than individuals.16
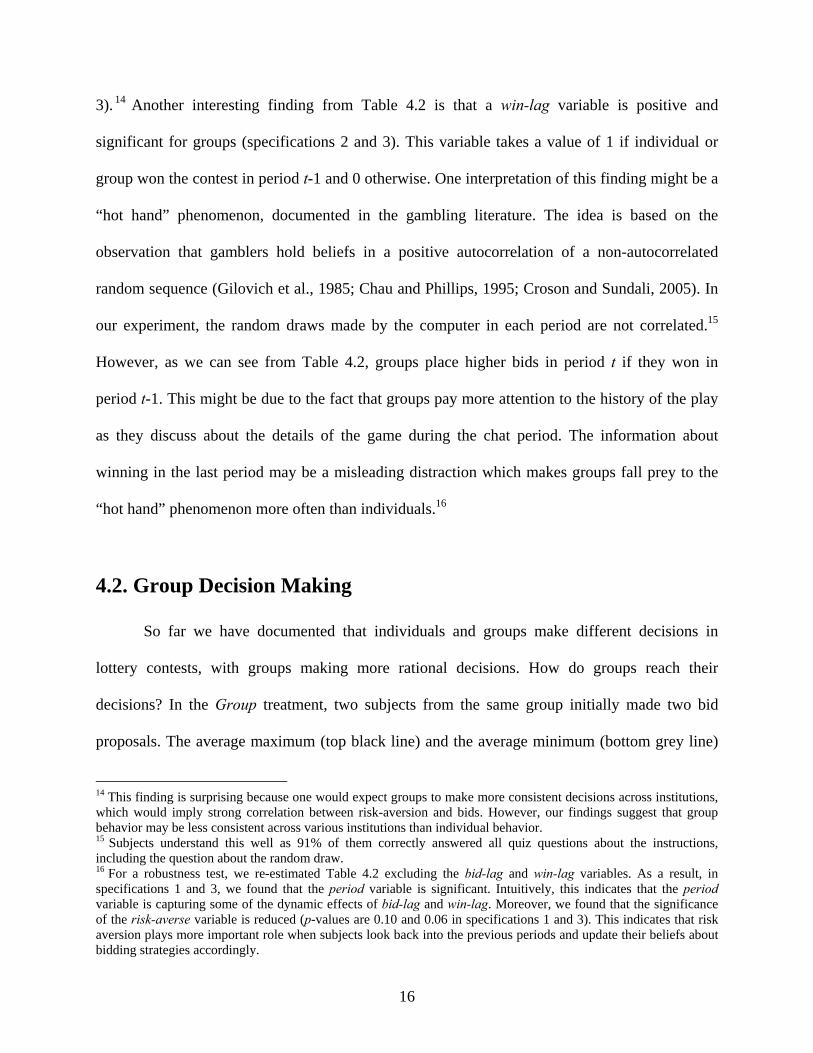
4.2. Group Decision Making
So far we have documented that individuals and groups make different decisions in
lottery contests, with groups making more rational decisions. How do groups reach their
decisions? In the Group treatment, two subjects from the same group initially made two bid
proposals. The average maximum (top black line) and the average minimum (bottom grey line)
14 This finding is surprising because one would expect groups to make more consistent decisions across institutions, which would imply strong correlation between risk-aversion and bids. However, our findings suggest that group behavior may be less consistent across various institutions than individual behavior. 15 Subjects understand this well as 91% of them correctly answered all quiz questions about the instructions, including the question about the random draw. 16 For a robustness test, we re-estimated Table 4.2 excluding the bid-lag and win-lag variables. As a result, in specifications 1 and 3, we found that the period variable is significant. Intuitively, this indicates that the period variable is capturing some of the dynamic effects of bid-lag and win-lag. Moreover, we found that the significance of the risk-averse variable is reduced (p-values are 0.10 and 0.06 in specifications 1 and 3). This indicates that risk aversion plays more important role when subjects look back into the previous periods and update their beliefs about bidding strategies accordingly.
17
proposals are shown in Figure 4.5. As the experiment proceeds the gap between the proposals
narrows down. In the first two periods the gap is around 19 experimental francs while in the last
two periods it is reduced to 7. Intuitively, the more often two players interact with each other, the
more similar their proposal bids become.
Figure 4.5 – Absolute Difference between Proposals and Bids over Periods
While bid proposals were displayed for both group members to see, players had up to two
rounds to reach a unanimous bid decision. The average maximum bids (middle black line) and
the average minimum bids (middle grey line) are shown in Figure 4.5. As expected, the two lines
overlap, with only 0.1% disagreement.17 Most disagreement occurred in first five periods (37%)
and last five periods (21%) of the experiment.
17 If both players from the same pair disagreed on their pair bid, they had another one minute to chat after which they submitted their final bids. Throughout the entire experiment we had only one decision which resulted in final disagreement. The reason for such strong agreement among pair members is that in our experiment disagreement was very costly. A pair in disagreement had to forfeit their endowment of 120 francs and the pair bid was then replaced with a bid made by a randomly selected pair in a different session.
20
25
30
35
40
45
50
Proposal (Bid)
Period
Max proposals Min proposals
Max bid Min bid

18
Next, we look at how group members reach their decisions in case of a disagreement in
their initial proposals. Do group members take turns to determine their final bids or do they take
the average of the two proposals? On aggregate, 74.3% of the final bids are equal to one of the
two proposals. Yet some times, one member is more persuasive than the other. For example, in 3
out of 36 groups, one member was always able to convince the other member to choose her
proposal as the final bid. In other instances, subjects took turns to determine their final bids: in
13 groups, one member’s proposal prevailed between 40% and 60% of the time, and one group
took exact 50-50 turn. Finally, 37.4% of time, group members reached a compromise by making
a final bid which was very close to the average of the two proposals.18 This shows that group
members apply different strategies in determining their final bids. To further see how groups
reach their decisions, we estimate the following “bargaining” equation (Cason and Mui, 1997):
max min ∑
, (4)
where denotes the bid made by the th group, and individual bid proposals are ordered
max min . We also include period trend to control for learning and dummy-variables
to control for individual group effects.
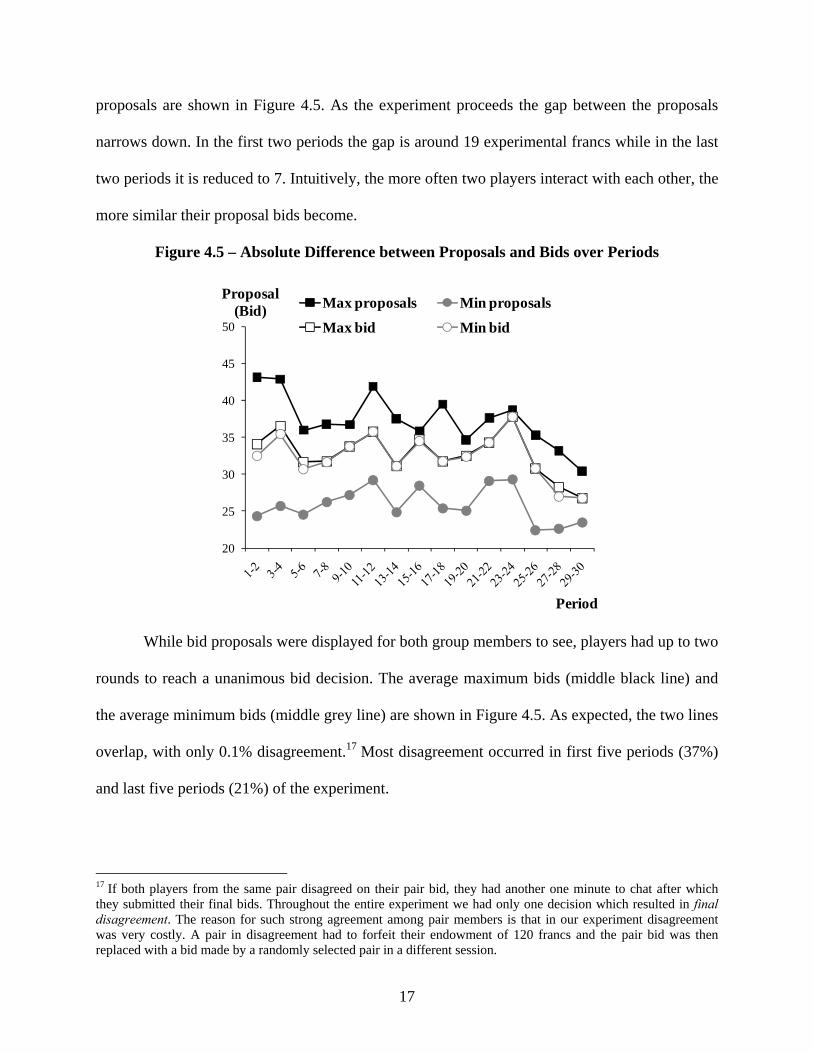
Estimates of model (4), over different periods of experiment, are shown in Table 4.3. In
the very first period of the experiment the group bid responds mainly to the lower proposal
(specification 1). We can reject the hypothesis that (p-value < 0.05). As we move from
specification (1) to (2) and then to (3), we see that increases and decreases. At the end of
the experiment the group bid responds mainly to the higher proposal (specification 4). We can
reject the hypothesis that (p-value = 0.07). Although the group bids depend on the
18 To count for the cases where final group bids are very close to the average of the two proposals, we used a deviation of 2 francs.
19
higher proposals ( ) in later periods, the group bids are still lower than the individual bids
because the higher proposals decrease over the periods and become more similar to the lower
proposals.
Table 4.3 – Estimates of Group Bargaining Equation
Dependent variable, bid Period 1 Period 1-5 Period 6-24 Period 25-30
Specification (1) (2) (3) (4) α0 8.39 -4.56 -5.38 27.78 [constant] (6.74) (4.89) (3.59) (36.73) α1 0.23 0.50** 0.65** 0.78** [maximum among two proposals] (0.13) (0.14) (0.09) (0.13) α2 0.87** 0.58** 0.37** 0.29 [minimum among two proposals] (0.14) (0.19) (0.08) (0.15) period 1.27 0.28 -1.31 [period trend] (0.94) (0.23) (1.38) p-value 0.01 0.80 0.08 0.07 Observations 33 129 272 83 Robust standard errors in parentheses. * significant at 5%, ** significant at 1%
Overall, the estimation results shown in Table 4.2 suggest that groups learn to reduce
their bids at the very beginning of the experiment.19 This may explain why there is a large
difference between the average group bids and individual bids even in the first periods of the
experiment.
5. Conclusions
Previous experiments have documented that individual players significantly overbid
relative to theoretical predictions, bids exhibit a high variance, and strong heterogeneity exists
across individual players. We designed an experiment to see whether groups can make more
rational decisions than individuals in lottery contests. The answer is yes. We find that group
19 In beauty contest games, Kocher and Sutter (2005) and Kocher et al. (2006) also document that groups learn faster than individuals and thus outperform individuals.
20
behavior is significantly different from individual behavior: groups make lower bids with a
smaller variance and there is less heterogeneity across groups.
We explore several possible explanations for a better group performance. First, we find
that groups make less risky decisions than individuals, which is consistent with other studies.
Risk-aversion, however, is not a significant determinant of group bids in lottery contests.
Second, and probably the most important explanation is that groups learn to make lower bids
from communication and negotiation between group members. To support this argument we
estimate a bargaining model, where the dependent variable is a group bid and the independent
variables are maximum and minimum bids proposed by group members. We find that in the first
few periods of the experiment group bids respond mainly to the minimum proposals, which
results in lower group bids even at the very beginning of the experiment. Our study contributes
to the discussion on whether groups are more rational than individuals. In contrast to Cox and
Hayne (2006) and Sutter et al. (2009), we find that group behavior is closer to standard game-
theoretic predictions than individual behavior. The differences in results might be due to several
factors. First, the lottery contests, as in our study, are much simpler than the common value
auctions, as in the other two studies. Groups thus have a chance to learn faster than individuals in
our game. Second, we have a smaller group size (group of 2) relative to groups of 5, as in Cox
and Hayne (2006), and groups of 3, as in Sutter et al. (2009). Finally, the other two studies use
face to face communication, instead of free-form chat communication. Without control for
anonymity, subjects may care more about in-group members’ perceptions on what is socially
favorable and may be more likely to compromise to majority’s opinion in the group due to the
conformity pressure (Cialdini et. al., 2004).
21
The findings of our study can also help to reconcile the difference between experimental
findings of Millner and Pratt (1989, 1991) and empirical findings in the field of Hazlett and
Michaels (1993). It might be the case that in reality firms do not over-bid in lottery contests as
often as the lab experiments predict simply because in reality firms use groups, instead of
individuals, to determine their bidding strategies. Finally, our study reveals important insights on
how groups reach their decisions (Kiesler and Lee, 1992).
There are several possible extensions to our study. First, groups with more members are
found to outperform groups with fewer members (Sutter, 2005). Therefore, it would be
interesting to see whether this holds in our study. Second, Brady and Wu (2008) show that the
direction and magnitude of the decisions made by groups depend on the procedure by which
groups reach their final decisions. This suggests further research on group decision making by
implementing alternative experimental procedures such as aggregation rules (majority rule
versus dictator rule), communication structures (one way versus two way communication), and
forms of communication (face to face versus chat form).
22
References
Ahn, T.K., Isaac, M.R., & Salmon, T.C. (2009). Rent Seeking in Groups. Working Paper. Baharad, E., & Nitzan, S. (2008). Contest Efforts in Light of Behavioral Considerations.
Economic Journal, 118, 2047-2059. Baker, R.J., Laury, S.K., & Williams, A.W. (2008). Comparing Small-Group and Individual
Behavior in Lottery-Choice Experiments. Southern Economic Journal, 75, 367–382. Berg, J., Dickhaut, J., & McCabe, K. (2005). Risk Preference Instability Across Institutions: A
Dilemma. Proceedings of the National Academy of Sciences, 11, 4209-4214. Borgers, T., & Dustmann, C. (2005). Strange bids: Bidding Behavior in the United Kingdom’s
Third Generation Spectrum Auction, Economic Journal, 115, 551–78. Brady, M.P., & Wu, S.Y. (2008). The Effect of Intragroup Communication on Preference Shifts
in Groups, Institute for the Study of Labor (IZA), Working Paper. Casari, M., Zhang, J., & Jackson, C. (2009). Do Groups Fall Prey to the Winner’s Curse? Purdue
University, Working Paper. Cason, T.N., & Mui, V.L. (1997). A Laboratory Study of Group Polarization in the Team
Dictator Game. Economic Journal, 107, 1465-1483. Charness, G., Karni E., and Levin D. (2007). Individual and Group Decision Making Under Risk:
An Experimental Study of Bayesian Updating and Violations of First-Order Stochastic Dominance, Journal of Risk and Uncertainty, 35,129-148.
Charness, G., Karni E., and Levin D. (2009). On the Conjunction Fallacy in Probability Judgment: New Experimental Evidence, Games and Economic Behavior, forthcoming.
Chau, A., & Phillips, J. (1995). Effects of Perceived Control Upon Wagering and Attributions in Computer Blackjack, Journal of General Psychology, 122, 253–269.
Cialdini, R.B., & Goldstein N.J. (2004). Social Influence: Compliance and Conformity. Annual Review of Psychology, 55, 591-621.
Cooper, D.J., & Kagel, J.H., (2005). Are Two Heads Better than One? Team versus Individual Play in Signaling Games. American Economic Review, 95, 477–509.
Cornes, R., & Hartley, R. (2005). Asymmetric Contests with General Technologies. Economic Theory, 26, 923-946.
Cox, J. & Hayne, S. (2005). When Does Free Riding Promote Rational Bidding? In Rami Zwick and Amnon Rapoport, (eds.), Experimental Business Research, Vol. II, Springer.
Cox, J. & Hayne S. (2006). Barking Up the Right Tree: Are Small Groups Rational Agents? Experimental Economics, 9,209-222.
Cox, J., Smith, V., & Walker, J. (1988). Theory and Individual Behavior of First-Price Auctions. Journal of Risk and Uncertainty, 1, 61-99.
Cox, J.C., Smith, V.L., & Walker, J.M. (1988). Theory and Individual Behavior of First-Price Auctions. Journal of Risk and Uncertainty, 1, 61-99.
Croson, R., & Sundali, J. (2005). The Gambler’s Fallacy and the Hot Hand: Empirical Data from Casinos, Journal of Risk and Uncertainty, 30, 195-209.
D’Avolio, G., (2002). The Market for Borrowing Stock. Journal of Financial Economics, 66, 271–306.
Davis, D., & Reilly, R. (1998). Do Many Cooks Always Spoil the Stew? An Experimental Analysis of Rent Seeking and the Role of a Strategic Buyer. Public Choice, 95, 89-115.
23
Davis, J. H. (1992), Some Compelling Intuitions about Group Consensus Decisions, Theoretical and Empirical Research, and Interpersonal Aggregation Phenomena: Selected Examples, 1950-1990, Organizational Behavior and Human Decision Processes, 52, 3-38.
Fischbacher, U. (2007). z-Tree: Zurich Toolbox for Ready-Made Economic Experiments, Experimental Economics, 10, 171-178.
Gilovich, T., Vallone, R., & Tversky, A. (1985). The Hot Hand in Basketball: On the Misperception of Random Sequences, Cognitive Psychology, 17, 295–314
Gneezy, U., & Smorodinsky, R. (2006). All-Pay Auctions – An Experimental Study. Journal of Economic Behavior and Organization, 61, 255-275.
Goeree, J., Holt, C., & Palfrey, T. (2002). Quantal Response Equilibrium and Overbidding in Private-Value Auctions. Journal of Economic Theory, 247-272.
Harrison, G., Lau, M., Rutstrom, E., & Tarazona-Gómez, M. (2005), Preferences Over Social Risk, Working Paper.
Hazlett, T. W. and Michaels, R. J. (1993). The Cost of Rent-Seeking: Evidence from Cellular Telephone License Lotteries, Southern Economic Journal, 59, 425-35.
Hillman, A.L., & Katz, E. (1984). Risk-Averse Rent Seekers and the Social Cost of Monopoly Power. Economic Journal, 94, 104-110.
Hoffman, E., Marsden, J., & Saidi, R. (1991). Are Joint Bidding and Competitive Common Value Auctions Markets Compatible—Some Evidence from Offshore Oil Auctions. Journal of Environmental Economics and Management, 20, 99–112.
Holt, C.A., & Laury, S.K. (2002). Risk Aversion and Incentive Effects. American Economic Review, 92, 1644-55.
Kerr, N.L., MacCoun, R.J., & Kramer, G.P. (1996). Bias in Judgment: Comparing Individuals and Groups. Psychological Review. 103, 687–719.
Kiesler, S., & Lee, S. (1992). Group Decision Making and Communication Technology. Organizational Behavior and Human Decision Processes, 52, 96-123.
Kocher, M.G., & Sutter, M. (2005). The Decision Maker Matters: Individual versus Group Behavior in Experimental Beauty-Contest Games. Economic Journal 115, 200–223.
Kocher, M.G., Sutter, M., & Strauss, S. (2006). Individual Decision-Making - Causes and Consequences of Self-Selection, Games and Economic Behavior, 56, 259-270.
Laughlin, P. R., Bonner, B. L., & Miner, A. G. (2002). Groups Perform Better than the Best Individuals on Letters-to-Numbers Problems, Organizational Behavior and Human Decision Processes, 61, 94-107.
Laughlin, P. R., Zander, M. L., Knievel, E. M., & Tan, T. K. (2003). Groups Perform Better than the Best Individuals on Letters-to-Numbers Problems: Informative Equations and Effective Strategies, Journal of Personality and Social Psychology, 85, 684-694.
Masclet, D., Loheac, Y., Laurent, D.-B. & Colombier, N. (2009). Group and Individual Risk Preferences : A Lottery-Choice Experiment, Journal of Economic Behavior and Organization, forthcoming.
Millner, E.L., & Pratt, M.D. (1989). An Experimental Investigation of Efficient Rent-Seeking. Public Choice, 62, 139–151.
Millner, E.L., & Pratt, M.D. (1991). Risk Aversion and Rent-Seeking: An Extension and Some Experimental Evidence, Public Choice, 69, 81-92.
Parco J., Rapoport A., & Amaldoss W. (2005). Two-Stage Contests with Budget Constraints: An Experimental Study. Journal of Mathematical Psychology, 49, 320-338.

24
Potters, J.C., De Vries, C.G., & Van Winden, F. (1998). An Experimental Examination of Rational Rent Seeking. European Journal of Political Economy, 14, 783-800.
Rockenbach, B., Sadrieh, A., & Mathauschek, B., (2007). Teams Take the Better Risks. Journal of Economic Behavior and Organization, 63, 412–422.
Schmidt, D., Shupp, R., & Walker, J. (2006). Resource Allocation Contests: Experimental Evidence. Indiana University, Working Paper.
Sheremeta, R.M. (2009a). Contest Design: An Experimental Investigation. Economic Inquiry, forthcoming.
Sheremeta. R.M. (2009b). Experimental Comparison of Multi-Stage and One-Stage Contests. Purdue University. Games end Economic Behavior, forthcoming.
Sheremeta. R.M. (2009c). Perfect-Substitutes, Best-Shot, and Weakest-Link Contests between Groups. Purdue University, Working Paper.
Shupp, R.S., & Williams, A.W. (2008). Risk Preference Differentials of Small Groups and Individuals. Economic Journal, 118, 258-283.
Stasser, G., & Dietz-Uhler, B. (2001). Collective Choice, Judgment, and Problem Solving, In M. A. Hogg & R. S. Tindale (Eds.), Blackwell handbook of social psychology: Group Processes, 31-55, Malden, MA: Blackwell.
Steiner, I. D. (1972). Group Processes and Productivity, New York: Academic Press. Sutter, M. (2005), Are Four Heads Better than Two? An Experimental Beauty-Contest Game
with Teams of Different Sizes, Economics Letters, 88, 41-46. Sutter, M. (2007). Are Teams Prone to Myopic Loss Aversion? An Experimental Study on
Individual versus Team Investment Behavior, Economics Letters, 97, 128-132. Sutter, M., Kocher M. G., and Strauss S. (2009). Individuals and Teams in Auctions. Oxford
Economic Papers, 61, 380-394. Szidarovszky, F., & Okuguchi, K. (1997). On the Existence and Uniqueness of Pure Nash
Equilibrium in Rent-Seeking Games. Games and Economic Behavior, 18, 135-140. Tullock, G. (1980). Efficient Rent Seeking. In James M. Buchanan, Robert D. Tollison, Gordon
Tullock, (Eds.), Toward A Theory of The Rent-Seeking Society. College Station, TX: Texas A&M University Press, pp. 97-112.
Zhang, J. & Casari, M. (2009). How Groups Reach Agreement In Risky Choices: An Experiment, McMaster University, Working Paper.

25
Appendix – Instructions for Group Treatment
GENERAL INSTRUCTIONS This is an experiment in the economics of strategic decision making. Various research agencies have
provided funds for this research. The instructions are simple. If you follow them closely and make appropriate decisions, you can earn an appreciable amount of money.
The experiment will proceed in two parts. Each part contains decision problems that require you to make a series of economic choices which determine your total earnings. The currency used in Part 1 of the experiment is U.S. Dollars. The currency used in Part 2 of the experiment is francs. Francs will be converted to U.S. Dollars at a rate of _30_ francs to _1_ dollar. At the end of today’s experiment, you will be paid in private and in cash. 24 participants are in today’s experiment.
It is very important that you remain silent and do not look at other people’s work. If you have any questions, or need assistance of any kind, please raise your hand and an experimenter will come to you. If you talk, laugh, exclaim out loud, etc., you will be asked to leave and you will not be paid. We expect and appreciate your cooperation. At this time we proceed to Part 1 of the experiment.
INSTRUCTIONS FOR PART 1 In this part of the experiment you will be paired with another participant and you will be asked to make a
series of choices as a pair in decision problems. How much your pair receives will depend partly on chance and partly on the choices your pair makes.
Please look at the table in the next page. For each line, you and your pair counterpart will be asked to choose either option A or option B. Notice that there are a total of 15 lines in the table but just one line will be randomly selected for payment. Each line is equally likely to be chosen, so you should pay equal attention to the choice you make in every line. After you have completed all your choices a token will be randomly drawn out of a bingo cage containing tokens numbered from 1 to 15. The token number determines which line is going to be paid.
Your pair earnings for the selected line depend on which option your pair chose. If your pair chose option A in that line, your pair will receive $2. If your pair chose option B in that line, your pair will receive either $6 or $0. To determine your earnings in the case your pair chose option B there will be second random draw. A token will be randomly drawn out of the bingo cage now containing twenty tokens numbered from 1 to 20. The token number is then compared with the numbers in the line selected (see the table). If the token number shows up in the left column your pair earns $6. If the token number shows up in the right column your pair earns $0.
Since you will have to make your decisions as the pair there will be several stages. On the first screen, you will input your proposals for the 15 decisions for your counterpart to see on his or her screen. When you click “Submit,” all proposals of your counterpart will be posted on the screen for you to see. From the screen you will see if your counterpart made the same or different proposals.
At this point, you will be able to send messages to your counterpart. To see how, please click now on the messenger tab in the lower portion of your screen. The messenger window will open. Then click on the lower (white) part of the box and type “hello”. Please everyone type “hello” now. Then click the ‘Send’ button, so that your counterpart can read your message. If you look at the messenger window you will see how many seconds remain for exchanging messages. The messenger window will be active for two minutes during the task when you start to make decisions for money. Now please switch to the main window by clicking on the background.
Although we will record the messages you send to each other, only you and your counterpart will see them. In sending messages, you should follow two basic rules: (1) Be civil to one another and do not use profanities, and (2) Do not identify yourself in any manner. The communication channel is intended to discuss your choices and should be used that way.
It is very important that you do not close any window at any time because that will cause delays and problems with the software. If you like, you can simply wait without sending any message, although the messages may help you to agree on a common choice for the pair.
After the exchange of messages, you will make your choices of A or B for the pair and then press the ‘Submit’ button. If both pair members made the same choice in all decisions, those will be the pair decisions. If some choices are different, you will be able to revise them in a second round. During the second round you will be able to send messages to your counterpart again. The messenger window will be active for another two minutes. After the exchange of messages, you will make your final choices of A or B for the pair. If the pair does not reach unanimity in the second round, the pair may lose the opportunity to earn money. More precisely, if a decision with disagreement is randomly selected for payment, the pair will earn zero.

26
At the very end of part 1, remember to record the final pair decisions in the table on the next page. For each decision, state whether the pair agreed on option A, option B, or whether there was still disagreement by the second round. Are there any questions?
Participant ID _________
Decision No.
Option A
Option B
Please choose A or B
1 $2 $6 never $0 if 1,2,3,4,5,6,7,8,9,10,11,12,13, 14,15, 16,17,18,19,20
2 $2 $6 if 1 comes out of the bingo cage $0 if 2,3,4,5,6,7,8,9,10,11,12,13,14,15, 16,17,18,19,20
3 $2 $6 if 1 or 2 comes out $0 if 3,4,5,6,7,8,9,10,11,12,13,14,15, 16,17,18,19,20
4 $2 $6 if 1,2, or 3 $0 if 4,5,6,7,8,9,10,11,12,13,14,15, 16,17,18,19,20
5 $2 $6 if 1,2,3,4 $0 if 5,6,7,8,9,10,11,12,13,14,15, 16,17,18,19,20
6 $2 $6 if 1,2,3,4,5 $0 if 6,7,8,9,10,11,12,13,14,15, 16,17,18,19,20
7 $2 $6 if 1,2,3,4,5,6 $0 if 7,8,9,10,11,12,13,14,15, 16,17,18,19,20
8 $2 $6 if 1,2,3,4,5,6,7 $0 if 8,9,10,11,12,13,14,15, 16,17,18,19,20
9 $2 $6 if 1,2,3,4,5,6,7,8 $0 if 9,10,11,12,13,14,15, 16,17,18,19,20
10 $2 $6 if 1,2,3,4,5,6,7,8,9 $0 if 10,11,12,13,14,15,16,17,18,19,20
11 $2 $6 if 1,2, 3,4,5,6,7,8,9,10 $0 if 11,12,13,14,15,16,17,18,19,20
12 $2 $6 if 1,2, 3,4,5,6,7,8,9,10,11 $0 if 12,13,14,15,16,17,18,19,20
13 $2 $6 if 1,2, 3,4,5,6,7,8,9,10,11,12 $0 if 13,14,15,16,17,18,19,20
14 $2 $6 if 1,2,3,4,5,6,7,8,9,10,11,12,13 $0 if 14,15,16,17,18,19,20
15 $2 $6 if 1,2,3,4,5,6,7,8,9,10 11,12,13,14
$0 if 15,16,17,18,19,20
27
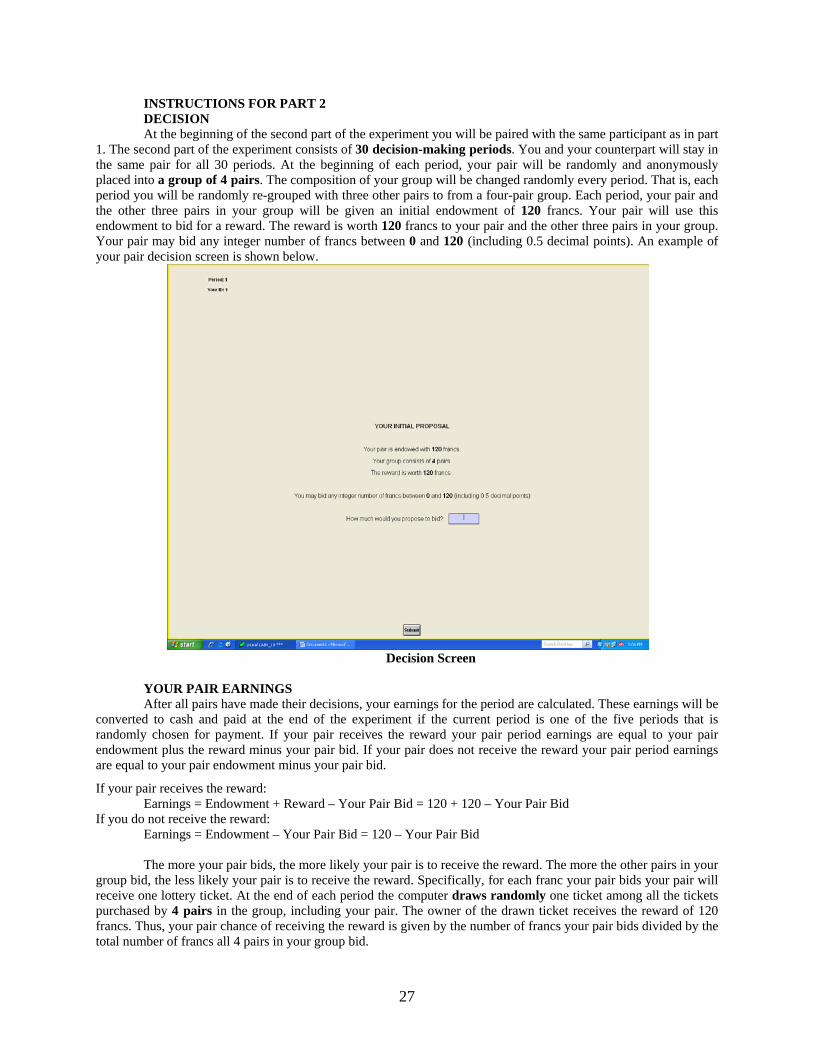
INSTRUCTIONS FOR PART 2 DECISION At the beginning of the second part of the experiment you will be paired with the same participant as in part
1. The second part of the experiment consists of 30 decision-making periods. You and your counterpart will stay in the same pair for all 30 periods. At the beginning of each period, your pair will be randomly and anonymously placed into a group of 4 pairs. The composition of your group will be changed randomly every period. That is, each period you will be randomly re-grouped with three other pairs to from a four-pair group. Each period, your pair and the other three pairs in your group will be given an initial endowment of 120 francs. Your pair will use this endowment to bid for a reward. The reward is worth 120 francs to your pair and the other three pairs in your group. Your pair may bid any integer number of francs between 0 and 120 (including 0.5 decimal points). An example of your pair decision screen is shown below.
Decision Screen
YOUR PAIR EARNINGS After all pairs have made their decisions, your earnings for the period are calculated. These earnings will be
converted to cash and paid at the end of the experiment if the current period is one of the five periods that is randomly chosen for payment. If your pair receives the reward your pair period earnings are equal to your pair endowment plus the reward minus your pair bid. If your pair does not receive the reward your pair period earnings are equal to your pair endowment minus your pair bid.
If your pair receives the reward: Earnings = Endowment + Reward – Your Pair Bid = 120 + 120 – Your Pair Bid If you do not receive the reward: Earnings = Endowment – Your Pair Bid = 120 – Your Pair Bid
The more your pair bids, the more likely your pair is to receive the reward. The more the other pairs in your
group bid, the less likely your pair is to receive the reward. Specifically, for each franc your pair bids your pair will receive one lottery ticket. At the end of each period the computer draws randomly one ticket among all the tickets purchased by 4 pairs in the group, including your pair. The owner of the drawn ticket receives the reward of 120 francs. Thus, your pair chance of receiving the reward is given by the number of francs your pair bids divided by the total number of francs all 4 pairs in your group bid.
28
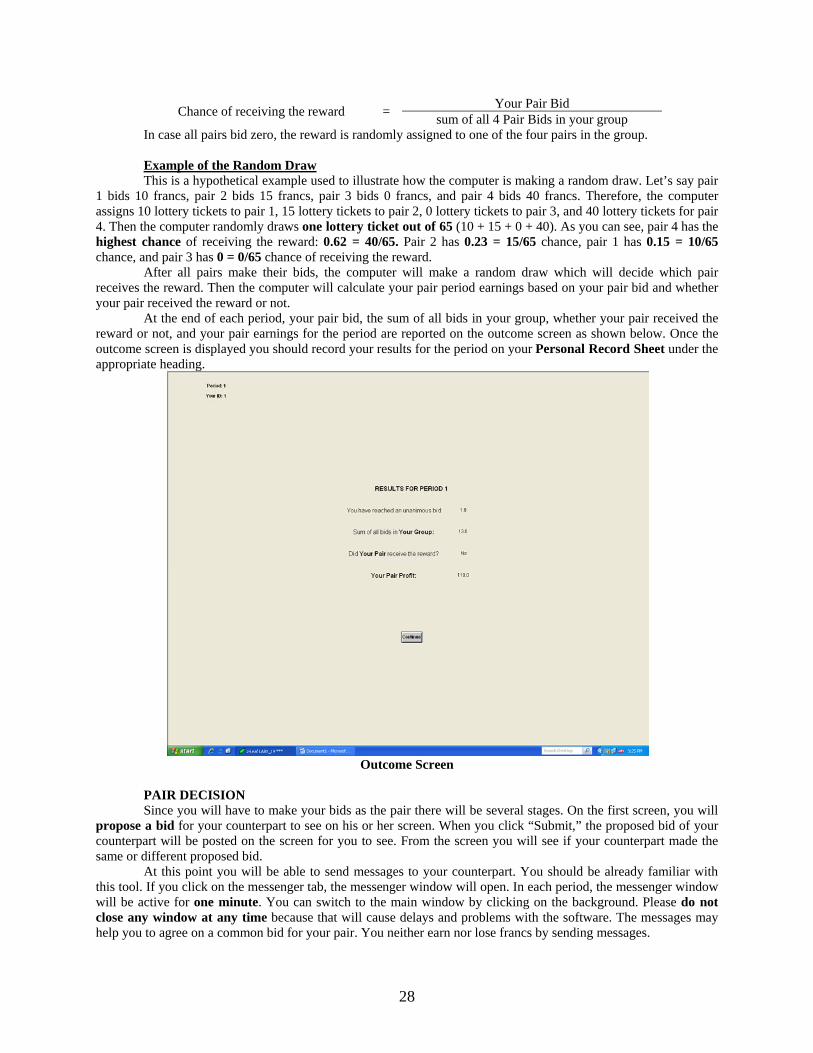
Chance of receiving the reward = Your Pair Bid
sum of all 4 Pair Bids in your group In case all pairs bid zero, the reward is randomly assigned to one of the four pairs in the group.
Example of the Random Draw This is a hypothetical example used to illustrate how the computer is making a random draw. Let’s say pair
1 bids 10 francs, pair 2 bids 15 francs, pair 3 bids 0 francs, and pair 4 bids 40 francs. Therefore, the computer assigns 10 lottery tickets to pair 1, 15 lottery tickets to pair 2, 0 lottery tickets to pair 3, and 40 lottery tickets for pair 4. Then the computer randomly draws one lottery ticket out of 65 (10 + 15 + 0 + 40). As you can see, pair 4 has the highest chance of receiving the reward: 0.62 = 40/65. Pair 2 has 0.23 = 15/65 chance, pair 1 has 0.15 = 10/65 chance, and pair 3 has 0 = 0/65 chance of receiving the reward.
After all pairs make their bids, the computer will make a random draw which will decide which pair receives the reward. Then the computer will calculate your pair period earnings based on your pair bid and whether your pair received the reward or not.
At the end of each period, your pair bid, the sum of all bids in your group, whether your pair received the reward or not, and your pair earnings for the period are reported on the outcome screen as shown below. Once the outcome screen is displayed you should record your results for the period on your Personal Record Sheet under the appropriate heading.
Outcome Screen
PAIR DECISION Since you will have to make your bids as the pair there will be several stages. On the first screen, you will
propose a bid for your counterpart to see on his or her screen. When you click “Submit,” the proposed bid of your counterpart will be posted on the screen for you to see. From the screen you will see if your counterpart made the same or different proposed bid.
At this point you will be able to send messages to your counterpart. You should be already familiar with this tool. If you click on the messenger tab, the messenger window will open. In each period, the messenger window will be active for one minute. You can switch to the main window by clicking on the background. Please do not close any window at any time because that will cause delays and problems with the software. The messages may help you to agree on a common bid for your pair. You neither earn nor lose francs by sending messages.

29
After the exchange of messages you will choose the bid you want for the pair and then press the SUBMIT button. If you and your counterpart chose an identical bid, that amount will be the pair bid. If the bid amounts are different, you will be able to revise your bid in a second round. During the second round you will be able to send messages to your counterpart again. The messenger window will be active for another one minute. After the exchange of messages, you will make your final bid in the second round. If you and your counterpart do not reach unanimity in the second round, your pair loses the endowment of 120 francs and your pair loses the opportunity to place a bid for the period. In this case, the computer will randomly select a bid made by a different pair which has reached a unanimous decision in the same type of experiment which we ran last week. You may think of this as if the computer substitutes your pair with a different pair which has reached a unanimous decision. The other three pairs in your group are automatically matched with this different pair. Therefore, in case of disagreement your pair will not participate in the experiment for that period and your pair will always earn zero for the period.
IMPORTANT NOTES
You and your counterpart will stay in the same pair for all 30 periods. At the beginning of each period your pair will be randomly re-grouped with three other pairs to from a four-pair group. Your pair can never guarantee itself the reward. However, by increasing your pair bid, your pair can increase your pair chance of receiving the reward. Regardless of which pair receives the reward, all pairs will have to pay their bids.
At the end of the experiment we will randomly choose 5 of the 30 periods for actual payment in Part 2 using a bingo cage. You will sum the total pair earnings for these 5 periods and convert them to a U.S. dollar payment. Your total pair earnings will be split in half between you and your counterpart and will be paid in cash at the end of the experiment. Are there any questions?

Economic Science Institute Working Papers
2009
09-08 Sheremeta, R. and Zhang, J. Multi-Level Trust Game with "Insider" Communication. 09-07 Price, C. and Sheremeta, R. Endowment Effects in Contests. 09-06 Cason, T., Savikhin, A. and Sheremeta, R. Cooperation Spillovers in Coordination Games. 09-05 Sheremeta, R. Contest Design: An Experimental Investigation. 09-04 Sheremeta, R. Experimental Comparison of Multi-Stage and One-Stage Contests. 09-03 Smith, A., Skarbek, D., and Wilson, B. Anarchy, Groups, and Conflict: An Experiment on the Emergence of Protective Associations.
09-02 Jaworski, T. and Wilson, B. Go West Young Man: Self-selection and Endogenous Property Rights.
09-01 Gjerstad, S. Housing Market Price Tier Movements in an Expansion and Collapse.
2008
08-10 Dickhaut, J., Houser, D., Aimone, J., Tila, D. and Johnson, C. High Stakes Behavior with Low Payoffs: Inducing Preferences with Holt-Laury Gambles.
08-09 Stecher, J., Shields, T. and Dickhaut, J. Generating Ambiguity in the Laboratory.
08-08 Stecher, J., Lunawat, R., Pronin, K. and Dickhaut, J. Decision Making and Trade without Probabilities.
08-07 Dickhaut, J., Lungu, O., Smith, V., Xin, B. and Rustichini, A. A Neuronal Mechanism of Choice.
08-06 Anctil, R., Dickhaut, J., Johnson, K., and Kanodia, C. Does Information Transparency Decrease Coordination Failure?
08-05 Tila, D. and Porter, D. Group Prediction in Information Markets With and Without Trading Information and Price Manipulation Incentives.
08-04 Caginalp, G., Hao, L., Porter, D. and Smith, V. Asset Market Reactions to News: An Experimental Study.
08-03 Thomas, C. and Wilson, B. Horizontal Product Differentiation in Auctions and Multilateral Negotiations.
08-02 Oprea, R., Wilson, B. and Zillante, A. War of Attrition: Evidence from a Laboratory Experiment on Market Exit.

08-01 Oprea, R., Porter, D., Hibbert, C., Hanson, R. and Tila, D. Can Manipulators Mislead Prediction Market Observers?