can learning disabilities explain low literacy performance?
TRANSCRIPT

By Gregory S. McKennaSeptember, 2010
Learning Policy Directorate
Strategic Policy and Research
Human Resources and Skills Development Canada
Can Learning Disabilities Explain Low Literacy Performance?
SP-959-07-10E
Now and TomorrowExcellence in Everything We Do

By Gregory S. McKennaJuly, 2010
Learning Policy Directorate
Strategic Policy and Research
Human Resources and Skills Development Canada
The views expressed in papers published by the Learning Policy Directorate are the authors’ and do not necessarily reflect the opinions of Human Resources and Skills Development Canada
or of the federal government.
Can Learning Disabilities Explain Low Literacy Performance?

Note: the departmental catalogue number is placed on the front cover, bottom left hand side.
You can order this publication by contacting:
Publications Services Human Resources and Skills Development Canada 140, promenade du Portage Phase IV, 12th FloorGatineau, Quebec K1A 0J9
Fax: 819-953-7260 Online: http://www12.hrsdc.gc.ca
This document is available on demand in alternate formats (Large Print, Braille, Audio Cassette, Audio CD, e-Text Diskette, e-Text CD, or DAISY), by contacting 1 800 O-Canada (1-800-622-6232). If you have a hearing or speech impairment and use a teletypewriter (TTY), call 1-800-926-9105.
© Her Majesty the Queen in Right of Canada, 2010
PaperCat. No.: HS38-22/2010EISBN: 978-1-100-16366-6
PDFCat. No.: HS38-22/2010E-PDFISBN: 978-1-100-16367-3

AcknowledgementsThe author is grateful to Mr. Mathieu Audet, Dr. Bagala Biswal, Dr. Urvashi Dhawan-Biswal
and Dr. Satya Brink for their assistance and support in developing this line of research. I would also
like to express my appreciation to Ms. Barbara McNutt, Dr. Audrey Penner and Dr. Brian McMillan.
Special thanks to Professor Linda Siegel, Ph.D., Educational and Counselling Psychology and Special
Education, University of British Columbia for her critical review and feedback on this report.


AbstractThe primary purpose of this report is to explore within the Canadian context the relationship between
Self-Reported Learning Disabilities (SRLD) and low literacy performance using the Canadian portion of
the public data set from the 2003 International Adult Literacy and Life Skills Survey (IALSS). Two primary
research questions related to SRLD were asked: 1) What is the influence of SRLD status on prose literacy
scores after controlling for a number of variables known to impact on prose literacy? and 2) Are variables
most strongly associated with self-reported LD the same as those for low literacy skill? In answering the
first question it was found that a difference of 33 points existed between the mean prose score of those with
a SRLD and those without, in favour of those without. However, after controlling for a number of variables
known to influence prose literacy the difference fell to approximately 15 points. Results from answering
the second question indicate that higher levels of SRLD are present for, but not limited to, those:
1) in the younger age cohort,
2) with lower levels of education,
3) with various co-occurring disabilities, and
4) who received remedial reading while in school.
Moreover, remedial reading is the variable that most clearly differentiates those who report a LD compared
to those who do not. Reporting a LD was predictive of whether remedial services were received and yet
when looking at mean prose scores at each literacy level by LD status and Remedial services, little difference
in outcomes was observed. The observed trends strongly suggest that both Learning Disability and low
literacy should be recognized as being so closely related that differentiating between them given the current
state of assessment procedures and intervention strategies is unnecessary and overly burdensome to both
individuals and the larger education system as a whole. It needs to be acknowledged that LD is not the
only reason for poorly developed reading skills and that it is better to provide assistance to all who need it
by tailoring services according to need. This may have significant policy implications regarding the value
of identification, diagnosis and funding related to those who meet the current definitional criteria
for diagnosis of a Learning Disabilities.


Table of Contents
1
3
9
111111
1313142020
27
35
39
45
13
14
15
18
20
21
1 Introduction
2 Literature Review
3 Research Questions
4 Method4.1 DataSourceandSample4.2 ResearchQuestionsandStudiedVariables
5 Data Analysis and Results5.1 DataAnalysis–Question 1
5.2 Results–Question 1
5.3 DataAnalysis–Question 2
5.4 Results–Question 2
6 Discussion of Results
7 Key Findings and Policy Implications
Annex – RegressionTables
Bibliography
Table 1 Imputation of Data
Table 2 Descriptive Statistics for Each of the Control Variables and Percentages in Reference to Prose Levels 1 Through 4/5
Table 3 Descriptive Statistics for Those with a LD for Each of the Control Variables and Percentages in Reference to Prose Levels 1 Through 4/5
Table 4 Abbreviated Display of Regressions with Prose Literacy as the Dependent Variable
Table 5 Describing the Anticipated Relationship Between Variables and Probability of LD
Table 6 Descriptive Statistics and Percentages of LD Versus Non LD Respondents for Selected Control Variables
List of Tables

25
26
39
Table 7 Percentage of Those at Each Prose Level Who Were Remediated According to LD Status and Mean Scores and Significance of LD and Non LD with and without Remediation
Table 8 Abbreviated Regression Table for Learning Disability
Annex Regression Table for ProseTable 1
17
23
24
Figure 1 Prose Scores for LD and Non LD
Figure 2 Prose Scores of LD Groups
Figure 3 Prose Scores of Non LD Groups
List of Figures

1
1 Introduction
Since its emergence as a diagnostic
category through the early 1960’s to the
mid 1970’s, learning disabilities have been
increasingly associated with poor educational and
employment outcomes. Concomitantly, there has
been an increase in demand for specific remedial
services and in many jurisdictions a requirement for
formal diagnosis in order to receive such services.
While this has resulted in an increase in funding
for those with such issues it also creates a situation
where services are directed to those with a formal
diagnosis and a lack of support for those who
struggle with various academic domains but who
do not meet diagnostic criteria. Moreover, there
are still a variety of contentious issues within the
learning disability field related to prevalence rates
and risk factors. This study was designed to deter-
mine if a self-reported learning disability had an
impact on Prose literacy and to further determine
if there are variables that are more strongly asso-
ciated with the presence of a learning disability
as compared to low literacy skill.
There are numerous and significant policy
implications associated with issues related to
diagnosis of learning disabilities. First, as a formal
diagnostic category there are legal implications
for educational institutions and employers related
to the mandatory provision of accommodations
and services. Second, the recognition of this
disability as separate and unique to low literacy
affects the nature and distribution of funding for
services, grants, tax incentives and so forth. Third,
it allows for government lobbying by individuals
and organizations with a vested interested in
the maintenance of the category. Fourth, it limits
govern ment’s ability to pursue other means of allo-
cating funding simply by the fact that set diagnostic
criteria, formal recognition as a disability, and the
strength and public impact that lobby groups can
have through media posturing, creates a situation
that significantly constrains the potential to pursue
alternative approaches to addressing educational
issues. As such, exploring the impact and variables
associated with learning disabilities is essential
to ensure that evidenced based decision making
can occur and that clinical and policy “foreclosure”
do not occur as a result of political ideology
and vested interest.


3
2 Literature Review
Most research on learning
disabilities (LD) is conducted on
relatively small samples, with the
majority of work being focused on school aged
populations, and in particular those in the elemen-
tary school age/grade range. Thus, there has been
little research available specifically focused on an
adult population (Gottardo, Siegel, & Stanovich, 1997)
as illustrated by an attempt at a meta-analytic review
of research on remedial programs for adults that
was unsuccessful due to the small number of
studies, differing intervention strategies, different
samples used, and methodological concerns
(Torgerson, Porthouse, & Brooks, 2003).
In addition, it has been suggested that those
working with the adult literacy community and those
working with the adult learning disability community
have typically had different pedagogical approaches,
assumptions, target populations and interventions
(Fowler, & Scarborough, 1993). However, accumu-
lated evidence from research on children and adults
suggests that this dichotomy may not be a useful
approach. In particular, it has been repeatedly
demonstrated within a school aged population that
those meeting traditional definitions for reading
disabilities do not differ in meaningful ways from
those simply classified as poor readers. In both
cases, primary deficits in cognitive-linguistic
domains, such as phonological processing, have
been identified (Felton, & Wood, 1992; Shaywitz,
Fletcher, Holahan, & Shaywitz, 1992; Siegel, 1989;
Vellutino, Scanlon, & Lyon, 2000). Bone, Cirino,
Morris and Morris (2002) replicated this finding
with an adult sample. Similarly, there does not
appear to be any significant difference between
the two groups, reading disabled and poor readers,
with respect to response to phonologically based
treatments (Kruidenier, 2002; Vellutino, et al., 2000).
In essence, there appears to be a point of conflu-
ence where poor reading due to poverty of experi-
ence or specific reading disability leads to similar
problems at the cognitive-linguistic level. However,
to date there have been no large scale investiga tions
designed to evaluate for meaningful differences
between those with low literacy skills and those
with a learning disability, particularly a reading
disability, in an adult sample with particular
reference to outcomes. It may be that if the same
explanatory variables are linked to both LD and
low literacy that these two solitudes may be better
considered as a single issue or at least be recog-
nized as being so closely related that differentiating
between them given the current state of intervention
strategies is unnecessary and overly burdensome
to both individuals and the larger adult education
system as a whole. This requires acknowledging
that poor reading skills may arise for a myriad of
reasons, not just the presence of a LD and that
interventions can be successful regardless of
the reason for poorly developed reading skills.
A number of variables have been demonstrated
to have a robust influence on Prose literacy scores

4
C a n L e a r n i n g D i s a b i l i t i e s E x p l a i n L o w L i t e r a c y P e r f o r m a n c e ? L i t e r a t u r e R e v i e w
including such things as: 1) gender, where
it has been consistently shown that females
demonstrate higher prose skills compared to
males (Desjardins, 2005a), 2) age cohort, where
younger cohorts tend to score higher than older
cohorts (Desjardins, 2005a), 3) education level,
where higher levels of education result in better
scores (Desjardins, 2005b), 4) income, where higher
income is associated with better scores (Desjardins,
Werquin, & Dong, 2005), 5) parent level of education,
where higher levels of parental education are linked
to higher scores and 6) reading practices, where
more reading is connected to higher scores
(Willms, 2005).
In addition to the influence of LD on prose scores,
it is also important to understand which variables
are most strongly associated with LD in an adult
population. As noted, there are relatively few studies
focusing on adults compared to what is available in
reference to children. As a result there are a num-
ber of unanswered questions and/or contentious
issues relating to the prevalence, distribution and
influencing factors associated with the reported
presence of a learning disability, in large part due
to the lack of evidence specific to the adult popu-
lation. Four key variables can be identified in the
research literature that have been relatively widely
studied and yet continue to be debated due to con-
flicting or limited evidence. These are: gender, age,
attained education level, and income/employment
status as adults. The relationship of these variables
to LD is either somewhat contentious or has been
generally accepted as a matter of fact based upon
the results of relatively few studies. As such, these
four variables were selected for inclusion in the
present study in order to clarify their relationship
to self-reported LD in an adult population. The
following is a brief review of each of these variables
and a sampling of the related research findings:
• Gender: For many years the higher prevalence
of LD in males was considered to be an estab-
lished fact. However, more recently there has
been increasing debate regarding this issue.
For instance, Siegel and Smythe (2005) took the
perspective that gender differences were an
artifact of the defini tional criteria used in diag-
nosing LD and they supported this per spective by
citing a large scale longitudinal study of school
aged individuals who were followed from kinder-
garten to grade 5. Their results demon strated
that although some gender differences were
observable in kindergarten and grade 1, after
that point there were essentially no meas urable
differences between genders. In con trast,
Liederman, Kantrowitz, and Flannery (2005),
argue that gender differences are present. They
use a review of high quality studies and an asso-
ciated critical analysis of these to sup port the
contention that gender differences are not the
product of defi ni tional criteria, ascertain ment
bias, statistical artifacts and related concerns,
but rather reflect actual differences due
to gender.
• Age: Age, in and of itself, should not be related
to the presence of a learning disability given that
learning disabilities by definition are neurologi-
cally based and lifelong (Learning Disability
Association of Canada, 2001). However, preva-
lence rates should rise based upon age cohort
since Learning Disability as a formal diagnostic
category was not established until the early
1960’s. As such, the number of those over the

C a n L e a r n i n g D i s a b i l i t i e s E x p l a i n L o w L i t e r a c y P e r f o r m a n c e ?
5
2 L i t e r a t u r e R e v i e w
age of 45 who report a learning disability could
be expected to be significantly lower than those
under the age of 45. According to LDAC “The age
of 44 was identified… since ‘learning disability’
was first applied in the early 1960’s, and those
identified by diagnosticians in the late 1960’s
and early 1970’s are now in this age bracket.”
Inter estingly, Mellard and Patterson (2008) in a
study using 311 Adult Development Education
(ADE) participants in the Midwestern states
to identify differences between those reporting
a LD with those who did not, found that those
reporting LD were more likely to be in the
46 – 55 year old age bracket.
• Education: Given the educational struggles
typically faced by those with LD it would be
expected that academic outcomes would be
lower as com pared to peers. In particular it
would be anticipated that fewer individuals
with LD would graduate from high school and
fewer still would go on to post-secondary edu-
cation. Levine and Nourse (1998) in a review of
the literature related to LD, gender, education
and employment reported a number of meth-
odo logically sound studies that demonstrated
that LD students were less likely than their peers
to pursue post-secondary education. However,
Mellard and Patterson (2008) found in a sample of
adult education learners that those with LD were
more likely to complete high school com pared to
those without LD. Though this tends to contradict
most other studies it was suggested that those
with a formal diagnosis may have received
greater sup port from the school system
that allowed them to reach graduation.
• Income and Employment Status: As with
educational outcomes it would be anticipated
that those with LD would be more likely to be
unemployed and if working would be in either
relatively low paying/skill jobs and/or perhaps
face wage discrimination. Again Levine and
Norse’s (1998) review of the literature suggest
that unemployment and low paying/skill jobs
were present to a higher degree in those with
LD, though significant meth od ological issues
were identified in the research reviewed. Mellard
and Patterson (2008) noted that participants in
ADE programs with and without LD tended to
demon strate similar employment rates and similar
status jobs. This would suggest that edu ca tional
attain ment and basic literacy skills may be the
key factor in these issues as opposed to LD status
per se. In addition, Dickinson and Verbeek (2002)
analyzed a data set to determine if there was
a wage differential between college graduates
with and without a LD. Results showed a wage
differen tial was present that did not appear to
be related to overt discrimination, but rather the
authors attrib uted the difference to productivity
characteristics of the individuals.
Additional variables, variables of interest, were
also identified since they have been associated
with educational outcomes generally or they have
been linked to LD but have been considerably less
studied in reference to LD. These variables of interest
include: 1) parents’ education level – separated for
father and mother, 2) self-reported co-occurring
disabilities – hearing, speech, vision, and other
lasting more than six months, 3) remedial reading
activities while in school, and 4) reading practices

6
C a n L e a r n i n g D i s a b i l i t i e s E x p l a i n L o w L i t e r a c y P e r f o r m a n c e ? L i t e r a t u r e R e v i e w
at home. The rationale for identifying each of
these as variables of interest is as follows:
• Parents’ level of education: First, it has been
clearly established that genetics play a role in
the development of a LD (Shaywitz, & Shaywitz,
undated). As such, there may be a relationship
between the level of edu cation attained by parents
and that attained by offspring. In addition, if clear
gender differences in prevalence rates do exist
in favour of males having higher rates of LD it
would be expected that father’s level of education
would be a stronger predictor of LD status than
mother’s level of educational attainment. In addi-
tion, par ental level of education has been shown
to be a significant factor related to literacy levels,
such that those with more highly educated parents
tend to have higher literary scores (Kaplan, &
Venezky, 1993; Willms, 2005). Interestingly, Mellard
and Patterson (2008) found no difference between
mothers’ high school or post-secondary comple-
tion between those reporting, and those
not reporting a LD.
• Co-occurring disabilities: A number
of research studies have demonstrated that
those with learning disabilities are more likely
compared to those in the general population
to have or to have had other disabilities, with
speech and hearing disabilities being com-
monly identified. This is illustrated by Vogel
and Holt (2003) who reviewed results from the
first IALS (1994) survey and noted that within
Canada 18% of those with a LD compared to
8.37% without reported a hearing disability and
11% versus 2.96% reported a speech disability.
Similarly, Shapiro (undated) indicated that the
presence of a hearing or speech impair ment
was a risk factor associated with reading disa-
bility. The co-occurrence of visual disabilities
is less commonly reported, though Stein (2001)
has theorized that a visual issue may underlay
reading impairment, Solan, Shelly-Tremblay,
Hanson and Larson (2007) concluded given the
results of their study “…that a common linkage
exists between reading comprehension, visual
attention, and magnocellular processing.” (p. 270),
and a significantly higher rate of visual difficulties
was noted in one study of ADE learners (Mellard,
& Patterson, 2008). The “other disabilities” cate-
gory was included given the range of disabilities
that have been linked to LD and the observation
by Vogel and Holt (2003) that 26% of LD compared
to 10.98% of non-LD respondents endorsed
this item.
• Remedial reading: Reading disabilities
are the most common LD accounting for 80% of
those reported (Shaywitz, & Shaywitz, undated).
In addition, those with LD would tend to experi-
ence greater difficulty with academic material
compared to the general population. As such,
it was expected that those with a LD would be
more likely to have been enrolled in remedial
reading programs while in school. Such findings
were noted by Mellard and Patterson (2008)
where 75% of those with LD reported partici-
pating in remedial or special programs while
in school. This translated into those with a LD
being nine times more likely to have undergone
such programs. However, evidence of this
phenomenon is limited.

C a n L e a r n i n g D i s a b i l i t i e s E x p l a i n L o w L i t e r a c y P e r f o r m a n c e ?
7
2 L i t e r a t u r e R e v i e w
• Reading practices at home: These variables
have been demonstrated to be significant factors
in literacy skill attainment and retention in the
adult population (Willms, 2005) and were included
to evaluate their relationship to LD.

9
3 Research Questions
T he public data set from the 2003
International Adult Literacy and Life
Skills Survey (IALSS) provides data on
self-reported LD in the Canadian adult population,
thus providing a large stratified random sample
representative of the population from which mean-
ingful conclusions may be drawn from data analysis.
This study was designed to answer two questions
related to LD:
Question 1 What is the influence of
self-reported LD status on prose literacy scores
after controlling for a number of variables known
to impact on prose literacy?
and
Question 2 What variables are most strongly
associated with self-reported LD?
Enhanced understanding of the influence of LD
on prose literacy once the other strong predictors
of prose have been controlled will yield meaningful
information for policy makers and stakeholders
working within the LD field. In addition, a direct
comparison of the variables related to self-reported
LD will provide insight into the similarity of those
with self-reported LD to those with low literacy skill.
In particular, clearly demonstrating in a quantifiable
manner the degree to which LD affects prose liter-
acy and differentiating between those with self-
reported LD and those with low literacy skill with
no LD may lead to alterations in priorities and policy
with respect to both early interventions and adult
learners’ needs. Of course it is recognized that LD
is heterogeneous and can refer to difficulties
in numerous cognitive domains. However, given
that it is estimated that 80% of LDs are specific
to reading (Shaywitz, & Shaywitz, undated)
and a variety of other LDs (e.g. working memory,
processing speed and so forth) would negatively
impact on reading this paper will focus on LDs in
the area of reading; though it is acknowledged that
a relatively small percentage of those self-reporting
LD may be referring to disabilities in unrelated
domains such as mathematics.


11
4 Method
4.1 Data Source and Sample
The data used for these analyses were from
the public use file of the 2003 International Adult
Literacy and Life Skills Survey (IALSS) and utilized
the Canadian data set. The sample was drawn so as
to produce high quality probability sam ples of the
non-institutionalized Canadian population 16 years
of age and older. Stratified random sampling was
used in which units with known demographic
characteristics were used for the first stage in
the sample design and in subsequent stages were
randomly drawn from these units. This resulted in
a representative sample with a known probability
of selection. Population weights were derived to
provide accurate estimates of population totals.
Over 23,000 individuals from across all provinces
and territories responded to the survey.1 More
specific details of this survey, the sampling design,
measures used and so forth have been extensively
described in Building on Our Competencies: Cana
dian Results of the International Adult Literacy and
Skills Survey (Human Resources and Skills Devel-
opment Canada, & Statistics Canada, 2005). For this
study the total sample consisted of 22,276 respond-
ents. The sub-sample who reported a LD consisted
of 1,346 individuals. Exclusion from the study was
based upon missing information on the self-reported
LD variable.
The key variable within the present study is
self-reported LD. This was determined based upon
participants’ response to the question: “Did you ever
have a learning disability?” This method of identi-
fying a LD is different from the process involved in
identifying a learning disability in a school or clinical
setting, as well as being distinct from identification
of a LD used in research studies (Vogel, & Holt, 2003).
Nonetheless, this process of self identification has
been widely used in research surveys and has been
deemed a valid method of sample ascertainment
(Gilger, cited in Vogel, & Holt, 2003).
4.2 Research Questions and Studied Variables
Question 1 What is the influence of
self-reported LD status on prose literacy scores
after controlling for a number of variables known
to impact on prose literacy?
• Dependent Variable: Scores on the prose
literacy scale. Prose literacy as assessed in the
IALSS survey is defined as “…the knowledge
and skills needed to understand and use infor-
ma tion from texts including editorials, news
stories, brochures and instruction manuals”
1 Though the issue of representativeness of the sample to the Canadian population, especially at the lower end of the literacy distribution, may be raised, Statistics Canada has taken every precaution to avoid any issues that may negatively influence the samples representativeness.

12
C a n L e a r n i n g D i s a b i l i t i e s E x p l a i n L o w L i t e r a c y P e r f o r m a n c e ?
(Human Resources and Skills Development
Canada, & Statistics Canada, 2005, p. 13). Further,
“Proficiency in each domain is measured on a
continuous scale. Each scale starts at zero and
increases to a theoretical maximum of 500 points.
Scores along the scale denote the points
at which a person with a given level of perfor-
mance has an 80 percent probability of success-
fully completing a task at that level of difficulty”
(Human Resources and Skills Development
Canada, & Statistics Canada, 2005, p. 14).
• Independent Variable: Self-report of a learning
disability. Self-report of a learning disability was
coded as a dummy variable based upon response
to a question specifically requesting this
information.
• Control Variables: Analysis was adjusted for
gender, age, education level, income, mother’s
education, father’s education, and reading prac-
tices at home, as these variables have been
demonstrated to have a robust association with
prose literacy scores. Remedial reading in school
was included because of the potential influence
this may have on reading. Variables were utilized
as they were provided in the public use file, that
is, 1) gender was a dummy variable, 2) age was
broken into cohorts 16 – 25, 26 – 35, 36 – 45, 46 – 55,
56 – 65, and older than 65, 3) education was broken
into less than grade 7, some high school, com-
pleted high school, non-university post-secondary,
and university, 4) income was broken into less
than $8,000, $8,000.01 – 25,000, $25,000.01 – 50,000,
and higher than $50,000.01, 5 & 6) mother’s and
father’s education were coded as less than high
school or high school and greater, 7) remedial
reading in school was a dummy variable, and
8) reading practices at home were established
based upon the response to a question regarding
the number of books at home, less than 25, 25 – 100,
and over 100. The number of books at home has
been used as a proxy measure for reading prac-
tices at home in a variety of studies (Cunningham,
& Stanovich, 1993; Kaplan, & Venezky, 1993;
Senechal, LeFevre, Hudson, & Lawson, 1996;
Senechal, LeFevre, Thomas, & Daley, 1998).
Control variables for each of the imputations
were also entered.
Question 2 What variables are most strongly
associated with self-reported LD?
• Dependent Variable: Self-report of a learning
disability. Self-report of a learning disability
was coded as a dummy variable based upon
response to a question specifically requesting
this information.
• Independent Variables: A number of
independent variables were entered into
the equation, 1) gender was a dummy variable,
2) age was entered as a dummy variable 45 years
of age and younger, over the age of 45, given
the rationale provided in the literature review,
3) education, 4) income, 5 & 6) mother’s and
father’s education, 7) reading practices at
home were coded the same as for question
one, 9, 10, 11 & 12) self-reported vision disability,
hearing disability, speech disability and other
disability were coded as dummy variables, and
13) partici pation in a remedial reading program
in school was coded as a dummy variable.

13
5 Data Analysis and Results
5.1 Data Analysis
Question 1 What is the influence of
self-reported LD status on prose literacy scores
after controlling for a number of variables known
to impact on prose literacy?
Considering the nature of the data, regression
analysis was used in order to answer the research
questions. For question 1 an OLS regression was
utilized. Imputation was used to adjust for missing
data and the imputations were then entered as
control variables. Table 1 indicates which variables
were imputed and how. In addition, percentages
and tests of mean differences were used to illustrate
variation between groups for selected variables in
order to further elucidate the findings. In all cases
weighted data were statistically analyzed.
Model: For question 1 it was anticipated that all
control variables entered, with the exception of
controls for imputations, would have a significant
effect on prose literacy given results from previous
research. It was further hypothesized that self-
reported learning disability would account for a
moderate amount of variance on prose literacy
over and above that accounted for by the control
variables.
TABLE 1Imputation of Data
Variable Coded Imputed Number
Education Don’t Know, Not Stated, Refused Less than grade 7 3,314
Income Don’t Know, Not Stated, Refused $8,000.00 or less 2,661
Mother’s Education Don’t Know, Not Stated, Refused Less than high school 1,794
Father’s Education Don’t Know, Not Stated, Refused Less than high school 2,213
Reading Practices Don’t Know, Not Stated, Refused Less than 25 41
Vision Disability Don’t Know, Not Stated, Refused No disability 1,854
Hearing Disability Don’t Know, Not Stated, Refused No disability 1,852
Speech Disability Don’t Know, Not Stated, Refused No disability 1,852
Other Disability Don’t Know, Not Stated, Refused No disability 2
Remedial Reading Don’t Know, Not Stated, Refused No remediation 27

14
C a n L e a r n i n g D i s a b i l i t i e s E x p l a i n L o w L i t e r a c y P e r f o r m a n c e ? D a t a A n a l y s i s a n d R e s u l t s
5.2 Results
Question 1 What is the influence of
self-reported LD status on prose literacy scores
after controlling for a number of variables known
to impact on prose literacy?
Table 2 outlines the n for selected control variables
and percentages in reference to prose levels 1
through 4/5. As anticipated the variables appear
to vary in relation to prose levels.
TABLE 2Descriptive Statistics for Each of the Control Variables and Percentages in Reference
to Prose Levels 1 Through 4/5
Prose 1 Prose 2 Prose 3 Prose 4/5
nScores 0 – 225
Scores 226 – 275
Scores 276 – 325
Scores 326 – 500
Gender
Male 10,183 48.26 47.39 45.67 38.08Female 12,093 51.74 52.61 54.33 61.92
Age Group16 – 25 3,781 9.14 17.24 20.23 20.5926 – 35 3,423 8.93 13.48 18.36 22.1336 – 45 4,703 15.37 20.80 23.17 25.7246 – 55 4,499 15.87 20.64 21.54 22.7356 – 65 2,960 17.17 14.90 11.74 7.5165+ 2,910 33.53 12.94 4.96 1.32
EducationLess than 7 956 17.58 1.43 0.12 0Some high school 4,392 35.75 25.87 10.53 4.05High school 5,793 17.95 29.85 30.18 19.80PSE – not University 3,918 7.86 17.21 22.78 20.72PSE – University 3,903 3.82 10.16 23.11 41.27Missing 3,314 17.04 15.48 13.28 14.16
IncomeLess $8,000 4,350 21.60 21.09 18.63 15.09$8,000.01 – 25,000 6,999 46.17 33.94 24.56 19.83$25,000.01 – 50,000 5,436 14.50 25.10 28.82 27.40$50,000.01 + 2,830 3.09 8.54 17.21 25.69Missing 2,661 14.62 11.33 10.80 12
(Continued)

C a n L e a r n i n g D i s a b i l i t i e s E x p l a i n L o w L i t e r a c y P e r f o r m a n c e ?
15
5 D a t a A n a l y s i s a n d R e s u l t s
Table 3 outlines the n for selected control variables and percentages in reference to prose levels 1
through 4/5 for those with a LD. Once again the variables appear to vary in relation to prose levels.
(Concluded)
Prose 1 Prose 2 Prose 3 Prose 4/5
nScores 0 – 225
Scores 226 – 275
Scores 276 – 325
Scores 326 – 500
Mother’s EducationLess than high school 11,422 70.68 57.81 42.47 28.43High school or + 9,060 14.19 32.72 52.84 69.33Missing 1,794 15.13 9.47 4.69 2.24
Father’s EducationLess than high school 11,553 67.07 57.45 44.68 33.66High school or + 8,510 16.24 30.53 48.71 63.31Missing 2,213 16.69 12.03 6.61 3.03
Remedial ReadingYes 2,131 12.59 10.85 8.39 4.94No 20,118 87.02 89.04 91.60 95.06Missing 27 0.39 0.11 0.01 0
TABLE 3Descriptive Statistics for Those with a LD for Each of the Control Variables and Percentages
in Reference to Prose Levels 1 Through 4/5.
Prose 1 Prose 2 Prose 3 Prose 4/5
nScores 0 – 225
Scores 226 – 275
Scores 276 – 325
Scores 326 – 500
Gender
Male 703 56.59 54.19 54.48 52.96Female 643 43.41 45.81 45.52 47.04
Age Group16 – 25 344 19.16 30.93 30.18 25.8126 – 35 244 10.90 18.60 30.18 25.8136 – 45 300 24.78 22.09 18.95 16.1346 – 55 216 17.05 14.88 14.04 24.1956 – 65 133 12.65 9.53 5.26 8.0665+ 109 15.47 3.95 1.40 0
(Continued)

16
C a n L e a r n i n g D i s a b i l i t i e s E x p l a i n L o w L i t e r a c y P e r f o r m a n c e ? D a t a A n a l y s i s a n d R e s u l t s
(Concluded)
Prose 1 Prose 2 Prose 3 Prose 4/5
nScores 0 – 225
Scores 226 – 275
Scores 276 – 325
Scores 326 – 500
EducationLess than 7 163 24.43 5.12 0.70 0Some high school 421 37.96 34.88 18.25 4.84High school 274 12.13 25.81 27.37 25.81PSE – not University 126 2.28 11.40 18.60 17.74PSE – University 79 0.35 3.72 14.04 33.87Missing 283 22.85 19.07 21.05 17.74
IncomeLess $8,000 390 31.81 30.47 23.86 16.13$8,000.01 – 25,000 502 42.00 36.28 32.28 24.19$25,000.01 – 50,000 200 8.96 16.74 21.75 24.19$50,000.01 + 81 2.46 6.74 10.18 14.52
Missing 173 14.76 15.77 11.93 20.97
Mother’s EducationLess than high school 645 61.34 45.35 29.47 27.42High school or + 545 21.44 43.95 66.32 72.58Missing 156 17.23 10.69 4.21 0
Father’s EducationLess than high school 685 63.09 49.07 34.04 29.03High school or + 456 15.47 37.21 57.89 69.35Missing 205 21.45 13.72 8.07 1.61
Remedial ReadingYes 565 39.37 41.16 50.18 33.87No 776 59.75 58.84 49.82 66.13Missing 5 0.88 0 0 0

C a n L e a r n i n g D i s a b i l i t i e s E x p l a i n L o w L i t e r a c y P e r f o r m a n c e ?
17
5 D a t a A n a l y s i s a n d R e s u l t s
Figure 1 provides the distribution of individuals
with and without a self-reported LD based upon
prose levels. It is apparent that those with a LD
typically have lower literacy scores compared to
those without a LD. The mean prose score for those
with LD is 235.75 and the mean prose scores without
a LD is 268.92 a difference of 33.17 points. A com-
parison of these means indicates the difference is
significant, t = -21.53(22274), p > .0001. This figure
also demonstrates that substantial numbers of
adults who score low do not have a LD. In addition,
it illustrates that despite a LD a large number are
able to score high on the IALSS assessment.
0.008
0.006
0.004
0.002
0
kernel = epanechnikov, bandwidth = 11.9916
100 200 300
Prose scores
FIGURE 1
Prose Scores for LD and Non LDComparison of Kernel Density Estimate
Den
sity
400 500
LD
Non LD
Vertical lines marklevel 3 – scores 276 – 325

18
C a n L e a r n i n g D i s a b i l i t i e s E x p l a i n L o w L i t e r a c y P e r f o r m a n c e ? D a t a A n a l y s i s a n d R e s u l t s
Table 4 2 presents the relationship between the
dependent variable – Prose literacy – the control
variables,3 and the independent variable – self-
reported LD, resulting from this regression analysis.4
All of the control variables were significantly related
to prose literacy. It is apparent that age, level of
education, parent level of education, receiving
remedial reading when in school, and number of
books at home, all has a strong influence on literacy
skills. The independent variable, self-reported LD,
retained significance despite controlling for a large
array of variables that have been clearly demon-
strated to influence prose literacy. Though, it should
be noted that LD alone does not have a high degree
of explanatory power as can be seen by the rela-
tively low value of the adjusted R 2 in regression 1.
Given that results suggest that LD is related to
literacy development and that other variables may
contain greater explanatory power, further explora-
tion through answering question 2 is justified.
2 This is an abbreviated table see annex for full regression table.3 Due to the collinearity of education and income, income was run separately with the same model.
Given the similarity in results only the former is presented. The income regression is available from the author.
4 Although there is a potential problem with endogeniety it was not possible to identify an instrumental variable to correct for this issue.
TABLE 4Abbreviated Display of Regressions with Prose Literacy as the Dependent Variable.a
Regression Model1 3 4 6 7 13
coef se coef se coef se coef se coef se coef se
LD 29.2 3.0 35.0 2.7 20.2 2.3 21.0 2.2 17.6 2.3 15.5 2.1
Gender 4.0 1.2 3.6 1.1 4.3 1.0 4.1 1.0 3.4 1.0
Age 26 – 35 3.8 1.8 -11.2 1.8 -4.7 1.7 -5.0 1.7 -4.6 1.7
Age 36 – 45 -7.8 1.9 -18.4 1.8 -8.0 1.8 -8.5 1.7 -11.0 1.7
Age 46 – 55 -11.7 1.8 -19.2 1.7 -6.9 1.7 -8.0 1.7 -11.9 1.7
Age 56 – 65 -31.7 2.2 -31.6 2.0 -17.5 2.1 -18.9 2.1 -22.8 2.0
Age 65 + -69.1 2.1 -55.0 1.9 -41.5 1.9 -43.0 1.9 -43.0 1.9
Less than Grade 7 -68.8 2.5 -63.3 2.4 -63.4 2.4 -61.9 2.7
Some High School -25.0 1.6 -21.6 1.6 -21.6 1.6 -19.0 1.5
PSE Non-University 16.0 1.4 14.2 1.4 14.2 1.4 12.0 1.3
PSE University 32.7 1.5 27.0 1.5 26.9 1.5 23.0 1.4
Mother’s Education 18.7 1.2 18.6 1.2 15.1 1.2
(Continued)

C a n L e a r n i n g D i s a b i l i t i e s E x p l a i n L o w L i t e r a c y P e r f o r m a n c e ?
19
5 D a t a A n a l y s i s a n d R e s u l t s
A post regression VIF analysis where all values
fell between, 1.00 and 2.23 (mean VIF = 1.54),
and inspection of the correlation matrix of the
regression coefficients with correlations ranging
from .0002 – .25, provide no indication of multi-
collinearity.
(Concluded)
Regression Model1 3 4 6 7 13
coef se coef se coef se coef se coef se coef se
Father’s Education 6.0 1.2 6.0 1.2 3.6 1.2
Remedial Reading -9.8 1.9 -10.5 1.8
25 – 100 books 21.3 1.6
100+ books 36.4 1.5
Cons 244.9 2.9 254.1 2.8 270.9 2.6 249.7 2.8 254.9 2.9 237.1 3.0
Number of Observations 22,276 22,276 22,276 22,276 22,276 22,276
Adjusted R 2 0.016 0.198 0.385 0.415 0.417 0.474
Log-Likelihood -120,795 -118,506 -115,544.7 -114,996.1 -114,949 -113,797.4
Note: All shown coefficients p<0.01
a A full version of this regression table is in the Annex, pages 39 – 43.

20
C a n L e a r n i n g D i s a b i l i t i e s E x p l a i n L o w L i t e r a c y P e r f o r m a n c e ? D a t a A n a l y s i s a n d R e s u l t s
5.3 Data Analysis
Question 2 What variables are most strongly
associated with self-reported LD?
For question 2 a Probit regression was utilized
since the dependent variable was dichotomous.
In addition, percentages and tests of mean differ-
ences were used to illustrate variation between
groups for selected variables in order to further
elucidate the findings. Note that unless otherwise
specified weighted data were statistically analyzed.
Model: For question 2, table 5 describes
the anticipated relationships.
5.4 Results
Question 2 What variables are most strongly
associated with self-reported LD?
Table 6 outlines the n and percentage distribution
of LD versus non LD respondents in reference to
selected control variables. It is notable that higher
levels of self-reported LD are present for, but
not limited to, those 1) in the younger age cohort,
2) with lower levels of education, 3) with various
disabilities, and 4) who received remedial reading
while in school. Moreover, it would appear that
remedial reading is the variable that most clearly
differentiates those who report a LD compared to
those who do not. Further investigation of those
participating in remedial reading programs while
in school indicates that a relatively small percent-
age, approximately 26%, of those who participated
in such programs reported a LD.
Given the apparent relationship between remedial
programming and LD and the potentially significant
impact that remedial programming could have on
prose literacy the association between LD status,
participation in remedial programming and prose
literacy was explored.
Figure 2 uses kernel density plots to illustrate
the differences between the prose scores of those
reporting a LD who received remedial reading versus
those reporting a LD who did not receive remedial
reading, with the distribution of the entire Canadian
sample provided as a reference. It would appear
that remedial interventions have a positive influence
on prose literacy, with the greatest benefit going
to those in level 1. In comparison Figure 3 presents
kernel density plots to demonstrate the differences
TABLE 5Describing the Anticipated Relationship
Between Variables and Probability of LD.
Variables Probability of LD
Gender Male > Female
Age Younger > Older
Education Less Educated > More Educated
Income Lower Income > Higher Income
Parental Education
Less Educated > More Educated
DisabilityHearing Hearing Disabled > Non
DisabledSpeech Speech Disabled > Non
DisabledOther Other Disability > No Other
DisabilityVision Vision Disability = Non Vision
Disability
Remedial Reading
With Remediation > Without Remediation
Reading at Home # of books
Less Reading > More Reading

C a n L e a r n i n g D i s a b i l i t i e s E x p l a i n L o w L i t e r a c y P e r f o r m a n c e ?
21
5 D a t a A n a l y s i s a n d R e s u l t s
TABLE 6Descriptive Statistics and Percentages of LD Versus Non LD Respondents
for Selected Control Variables.
LD (n) Non LD (n) LD (%) Non LD (%)
GenderMale 703 9,480 52.23 45.29Female 643 11,450 47.77 54.71
Age Group45 years or less 888 11,019 65.97 52.6546 + 458 9,911 34.03 47.35
EducationLess than 7 163 793 12.11 3.79Some high school 421 3,971 31.28 18.97High school 274 5,519 20.36 26.37PSE – not University 126 3,792 9.36 18.12PSE – University 79 3,824 5.87 18.27Unknown 283 3,031 21.03 14.47
Mothers EducationLess than high school 645 10,777 47.92 51.49High school or + 545 8,515 40.49 40.68Unknown 156 1,638 11.59 7.82
Fathers EducationLess than high school 685 10,868 50.89 51.93High school or + 456 8,054 33.88 38.48Unknown 205 2,008 15.23 9.59
Hearing DisabilityYes 250 2,044 18.57 9.77No 967 17,163 71.84 82.00Unknown 129 1,723 9.58 8.23
Speech DisabilityYes 192 441 14.26 2.11No 1,025 18,766 76.15 89.66Unknown 129 1,723 9.58 8.23
Vision DisabilityYes 176 1,847 13.08 8.82No 1,040 17,359 77.27 82.94Unknown 129 1,723 9.65 8.23
(Continued)
22
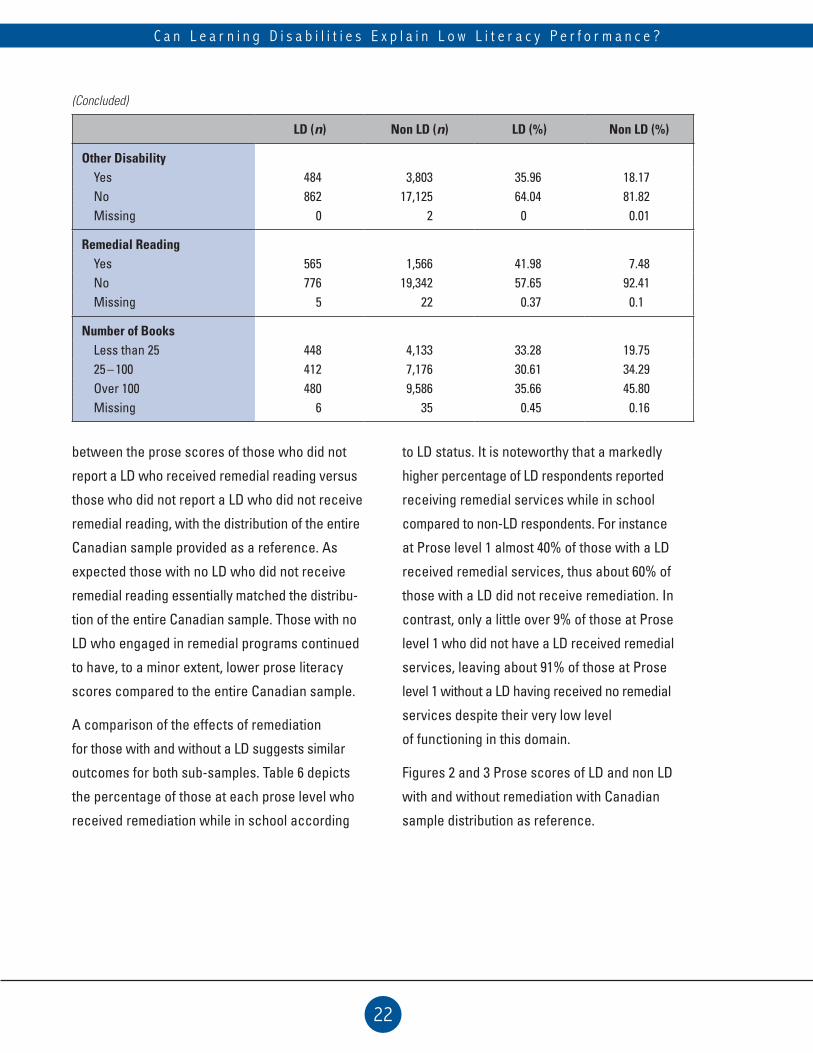
C a n L e a r n i n g D i s a b i l i t i e s E x p l a i n L o w L i t e r a c y P e r f o r m a n c e ? D a t a A n a l y s i s a n d R e s u l t s
between the prose scores of those who did not
report a LD who received remedial reading versus
those who did not report a LD who did not receive
remedial reading, with the distribution of the entire
Canadian sample provided as a reference. As
expected those with no LD who did not receive
remedial reading essentially matched the distribu-
tion of the entire Canadian sample. Those with no
LD who engaged in remedial programs continued
to have, to a minor extent, lower prose literacy
scores compared to the entire Canadian sample.
A comparison of the effects of remediation
for those with and without a LD suggests similar
outcomes for both sub-samples. Table 6 depicts
the percentage of those at each prose level who
received remediation while in school according
to LD status. It is noteworthy that a markedly
higher percentage of LD respondents reported
receiving remedial services while in school
compared to non-LD respondents. For instance
at Prose level 1 almost 40% of those with a LD
received remedial services, thus about 60% of
those with a LD did not receive remediation. In
contrast, only a little over 9% of those at Prose
level 1 who did not have a LD received remedial
services, leaving about 91% of those at Prose
level 1 without a LD having received no remedial
services despite their very low level
of functioning in this domain.
Figures 2 and 3 Prose scores of LD and non LD
with and without remediation with Canadian
sample distribution as reference.
(Concluded)
LD (n) Non LD (n) LD (%) Non LD (%)
Other DisabilityYes 484 3,803 35.96 18.17No 862 17,125 64.04 81.82Missing 0 2 0 0.01
Remedial ReadingYes 565 1,566 41.98 7.48No 776 19,342 57.65 92.41Missing 5 22 0.37 0.1
Number of BooksLess than 25 448 4,133 33.28 19.7525 – 100 412 7,176 30.61 34.29Over 100 480 9,586 35.66 45.80Missing 6 35 0.45 0.16

C a n L e a r n i n g D i s a b i l i t i e s E x p l a i n L o w L i t e r a c y P e r f o r m a n c e ?
23
5 D a t a A n a l y s i s a n d R e s u l t s
0.008
0.006
0.004
0.002
0
kernel = epanechnikov, bandwidth = 13.2431
100 200 300
Prose scores
FIGURE 2
Prose Scores of LD GroupsComparison of Kernel Density Estimate
Den
sity
400 500
LD remediated
LD not remediated
Entire sample
Vertical lines marklevel 3 – scores 276 – 325

24
C a n L e a r n i n g D i s a b i l i t i e s E x p l a i n L o w L i t e r a c y P e r f o r m a n c e ? D a t a A n a l y s i s a n d R e s u l t s
Mean prose scores at each prose level of those
1) with and without a LD who reported no remedial
reading, and 2) with and without LD who reported
remedial reading in school are also provided
in table 7. An ANOVA with prose scores as the
dependent variable and LD status and Remedial
status as independent variables was performed
to test for mean differences. Overall results were
significant, F = 66.23 (6), p > .0001. LD status alone
was not significant F = .67 (1), p > .41, remedial
status approached significance, F = 2.11 (3), p > .097
and there was a significant interaction between LD
status and Remedial status, F = 10.31 (2), p > .0001.
Follow up t-tests were performed to elucidate the
noted differences. Note that for these analyses
weighted data could not be used. The only signifi-
cant difference was noted between LD remediated
and LD not remediated at Level 1 prose, t = 2.99 (562),
p > .003.
0.008
0.006
0.004
0.002
0
kernel = epanechnikov, bandwidth = 9.9259
100 200 300
Prose scores
FIGURE 3
Prose Scores of Non LD GroupsComparison of Kernel Density Estimate
Den
sity
400 500
Non LD remediated
Non LD not remediated
Entire sample
Vertical lines marklevel 3 – scores 276 – 325

C a n L e a r n i n g D i s a b i l i t i e s E x p l a i n L o w L i t e r a c y P e r f o r m a n c e ?
25
5 D a t a A n a l y s i s a n d R e s u l t s
Finally, table 8 presents a summary of the main
association between the dependent variable, self
reported LD, the independent variables and control
variables based upon the probit analysis. Note that
for theoretical reasons, reported in the literature
review, variables in addition to those used in the
first regression were included in this analysis
(e.g. various disability categories) and the addi-
tion of these variables helps to address concerns
related to issues of multi-collinearity. The full regres-
sion table is available from the author. Significant
relationships were noted for age, educational levels,
Mothers’ education, hearing disability, speech
disability, other disability, number of books in the
household, and participation in a remedial reading
program in school.
These results begin to refine the current state
of knowledge regarding the relationship between
LD and a variety of variables that have been found
in previous studies to be related to LD, as well as
providing evidence for the relationship between
LD and other variables that have been less studied
or have been noted in clinical practice to appear
to have a link to LD.
TABLE 7Percentage of Those at Each Prose Level Who Were Remediated According to LD Status
and Mean Scores and Significance of LD and Non LD with and without remediation.
LD Status Prose Level 1 Prose Level 2 Prose Level 3 Prose Level 4/5
LD 39.36 41.16 50.17 33.87
Non LD 9.02 0.01 6.79 4.34
Means Level 1 Means Level 2 Means Level 3 Means Level 4/5
LD Remediated 186.00 253.38 296.57 341.70
Non LD Remediated 187.71 252.92 298.69 342.58
LD Not Remediated 177.84 251.04 298.46 343.45
Non LD Not Remediated 185.64 253.51 299.58 344.32
Significant Difference YES NO NO NO

26
C a n L e a r n i n g D i s a b i l i t i e s E x p l a i n L o w L i t e r a c y P e r f o r m a n c e ?
TABLE 8Abbreviated Regression Table for Learning Disability.
Regression Model2 3 6 10 23
coef se coef se coef se coef se coef se
Gender -0.017*** 0.01 -0.014*** 0.01 -0.014*** 0.01 -0.013*** 0.01 -0.01 0.00
Age -0.039*** 0.01 -0.049*** 0.01 -0.046*** 0.01 -0.051*** 0.01 -0.027*** 0.01
< Grade 7 0.136*** 0.03 0.143*** 0.03 0.112*** 0.02 0.093*** 0.02
Some High School
0.047*** 0.01 0.048*** 0.01 0.039*** 0.01 0.028*** 0.01
PSE Non-Univ 0.01 0.01 0.01 0.01 0.00 0.01 0.00 0.01
PSE Univ -0.034*** 0.01 -0.035*** 0.01 -0.028*** 0.01 -0.020*** 0.01
Mother’s Education
0.012* 0.01 0.01 0.01 0.012** 0.01
Father’s Education
0.00 0.01 0.00 0.01 0.01 0.01
Visual Disability
0.01 0.01 0.01 0.01
Hear Disability -0.049*** 0.01 -0.042*** 0.01
Speech Disability
-0.138*** 0.02 -0.100*** 0.02
Other Disability
-0.064*** 0.01 -0.053*** 0.01
Remedial Reading
0.169*** 0.02
Book 25 – 100 -0.023*** 0.01
Book 100+ -0.019*** 0.01
Number of Observation
22,276 22,276 22,276 22,276 22,274
Pseudo R 2 0.019 0.066 0.067 0.136 0.233
Log-Likelihood
-4,998.37 -4,757.12 -4,750.50 -4,401.31 -3,908.39
Note: *** p<0.01, ** p<0.05, * p<0.1

27
6 Discussion of Results
T his study was undertaken in order to
provide information on LD specific to an
adult population in Canada by using the
public data set from the 2003 International Adult
Literacy and Life Skills Survey (IALSS). The goal was
to answer two questions: 1) What is the influence
of self-reported LD status on prose literacy scores
after controlling for a number of variables known
to impact on prose literacy? and 2) What variables
are most strongly associated with self-reported LD?
For Question 1 What is the influence of
self-reported LD status on prose literacy scores
after controlling for a number of variables known
to impact on prose literacy?
The results provided evidence that literacy
scores are negatively influenced by a self-reported
LD. This is in keeping with a number of studies that
have demonstrated that those with LD have poorer
reading skills compared to those who do not have
a LD (e.g. Bone et al. 2002). However, these previous
studies typically used smaller sample sizes and
were not able to control for the same range of
confounding variables. Thus, the present analysis
lends significant support to these findings. However,
considering a literacy level consists of 50 points, it
is important to note that on average the difference
between the prose literacy scores of those with
and without a LD is approximately 15 points after
controlling for other variables.
For Question 2 What variables are most
strongly associated with self-reported LD?
The results further elucidate the relationship
between LD and a variety of variables found in
previous studies to be related to LD. In addition,
it provides evidence for the relationship between
LD and other less studied variables or variables
that have been noted in clinical practice to appear
to have a link to LD. Reviewing each of the variables
in turn the following was noted:
• Gender was not found to be a significant factor
associated with LD which was in opposition to
the hypothesized relationship predicting that males
would demonstrate a higher probability of a self
reported LD. These findings add significant sup-
port to the perspective that gender differences
found in many studies, often utilizing relatively
small sample sizes, may be explained by various
sources of bias including referral bias, definitional
criteria used, and statistical artifacts (Liederman,
et al. 2005; Siegel, & Smythe, 2005). This finding
suggests that more emphasis needs to be placed
on universal screening either formal or informal,
to ensure early identification of reading
difficulties in both genders.
• Age was determined to be significantly
associated with LD. Those in the older age
cohort (46 years old +) were 2.7% less likely of
reporting a LD. The split in age was based upon
research done by LDAC (2007) using the following
rationale: “The age of 44 was identified as the

28
C a n L e a r n i n g D i s a b i l i t i e s E x p l a i n L o w L i t e r a c y P e r f o r m a n c e ? D i s c u s s i o n o f R e s u l t s
upper end of the research for two reasons.
The term “learning disability” was first applied
in the early 1960’s, and those identified by diag-
nosticians in the late 1960’s and early 1970’s are
now in this age bracket”. Despite this, according
to the IALSS data, of those in the older age
groups, 46 – 55, 56 – 65 and 65 and older,
approxi mately 4.8, 4.5, and 3.8% respectively,
self-report a LD. This level of consistency across
these older age groups is remarkable considering
the date of emergence of the diagnostic label of
LD. More interesting is the progressive increase
in the percentage of individuals reporting a LD
at each 10 year interval, 6.3% of those aged 36 – 45,
7.1% of those aged 26 – 35, and 9.1% of those
16 – 25. The steadily increasing percentage of
the population reporting a LD may be a factor of
the increased recognition of LD as a diagnostic
category combined with increased demand for
formal diagnosis in order to attain needed reme-
dial and accommodative services. The author
speculates that with the adoption of a new
broader definition of LD by LDAC in 2002 that
the percentage of Canadians reporting a LD will
continue to increase over the next decade and
will likely exceed the estimated prevalence rate
endorsed by LDAC of 10% of the general popu-
lation. This may have significant public policy
implications since as the number of people with
LD expands so to will the demand for related
services – services that educational institutions
and workplaces are legally obliged to provide.
• Educational attainment was also found to be
significantly associated with LD, as hypothesized.
Using a benchmark of High School completion
it was found that those with less than grade 7
education and those with only some high
school education had a 9.3% and 2.8% greater
chance of reporting a LD respectively. Those
with non-university post-secondary education
were not different from those who completed
high school. In contrast, those with a university
education were 2% less likely to report a LD. This
apparent association to early school departure is
critical to explore given the clear links between
this and a host of negative personal and social
outcomes including unemployment, low income,
poor health and so forth (Boothby, 2002; Green
& Riddell, 2001; McIntosh, & Vignoles, 2001;
McMullen, 2005; Rudd, Moeykens, & Colton, 1999).
It is interesting to note that no difference in preva-
lence rates was apparent between those with
High School and those with non-university PSE.
This suggests that learners with a LD who com-
plete high school are choosing to continue their
studies at the college level as opposed to the
University level. This may reflect 1) the perception
that university programs are more challenging
than college programs, 2) the attractiveness of
the practical learning environment offered at
the college level, compared to the more theory
based learning that is associated with university
educations, 3) the typically shorter duration of
college programs compared to University pro-
grams and 4) the more direct link to employ ment
derived from college based training programs
compared to university programs. These issues
may be especially meaningful for those who may
have experienced greater struggle in school
settings. In addition having public school edu-
cators promote college education to the same
degree that University education is promoted

C a n L e a r n i n g D i s a b i l i t i e s E x p l a i n L o w L i t e r a c y P e r f o r m a n c e ?
29
6 D i s c u s s i o n o f R e s u l t s
may contribute to greater retention of LD
students and greater transition to PSE.
• Income was significantly associated with LD,
when education level was removed from the
regression, such that those with higher annual
income, $25,000.01 – $50,000 and 50,000.01 and
higher, were less likely (2.0 and 2.5%) to report a
LD. However, given the relationship between edu-
cation and income, common sense would dictate
that education would be the most pressing issue,
since it typically precedes employment and largely
dictates the nature and therefore the wages
associated with a job. In addition, productivity
characteristics may further explain any remaining
wage differences. For instance, Dickinson and
Verbeek (2002) found that for college graduates
in the U.S.A. there was a wage differential
between college graduates with and without
a LD that did not appear to be related to overt
discrimination, but rather to different productivity
characteristics of the individuals. These produc-
tivity characteristics may be explained by level
of literacy skills.
• Father’s education was not associated with LD.
The predictive value of Mother’s educational
level, though small, was fairly consistent as the
model was further specified. Those who reported
that their mother’s education was high school
or greater had a 1.2% higher chance of reporting
a LD compared to those whose mother had less
than high school education. This is in contrast
to the hypothesized relationship where it was
suggested that those whose parents had lower
levels of education would be more likely to self
report the presence of a learning disability and
that this would be more likely to occur with
father’s education being lower. The lack of
connection to father’s education may be at least
partially explained by the lack of gender differ-
ences related to self reported LD. It is curious
that higher levels of maternal education would
be more strongly associated with LD. Since intui-
tively one would expect that given the genetic
component of LD combined with the noted asso-
ciation of poorer levels of education with LD that
parents of those reporting LD would have a higher
probability of having a LD themselves and this
would have negatively influenced their educa-
tional attainment. However, such findings may be
explained by the possibility that a higher level of
education by the mother would 1) lead to greater
awareness of LD in general and 2) increased
concerns about off-spring who are struggling
in the education system, which may in turn
lead to a referral and diagnostic bias. This is
reinforced by findings that suggest that mothers’
are typically more directly involved in their chil-
dren’s educational issues compared to fathers
(Murray et al. 2006). This further supports the
need to provide services to those families with
lower levels of educational attainment.
• Consistent with the hypothesis reading practices,
as measured by the reported number of books
at home, were associated with self reported LD.
Those reporting 25 – 100 or more than 100 books
at home had a reduced chance of reporting a
LD, 2.3% and a 1.9% respectively. This suggests
that continuing to work toward increased liter-
acy practices at home may be one means
of enhancing literacy skill.

30
C a n L e a r n i n g D i s a b i l i t i e s E x p l a i n L o w L i t e r a c y P e r f o r m a n c e ? D i s c u s s i o n o f R e s u l t s
• Strong and robust associations to LD were noted
for the presence of comorbid reports of hearing
disabilities (-4.2%), speech disabilities (-10.0%),
and other disabilities (-5.3%). By definition LD is
not diagnosed if academic difficulties are caused
by other disabilities such as hearing, speech,
vision and other impairments. Nonetheless, the
co-occurrence of disabilities and a resultant dual
diagnosis is possible (LDAC, 2002). A number of
studies have attempted to explore the relationship
between LD and other disabilities such as those
mentioned above (Raitano et al. 2004; White, et
al. 2006). Likewise, some theories of LD suggest
that the underlying components of a LD are the
same as, or closely linked to, those underlying
issues associated with disabilities related to
speech or vision (White et al. 2006). However,
most research attempting to explore these issues
is plagued by small sample sizes and tends to
utilize school-aged participants. Thus, findings
are not necessarily robust, nor are they easily
generalizable to other populations and settings.
The findings from the present study make an
important contribution to our understanding of
comorbid diagnosis in these domains considering
the sample size and composition. There are at
least two interpretations of these results. The
first is it suggests that educators need to remain
alert to the possibility of multiple diagnoses when
working with individuals who experience the
noted disabilities. Such alertness may be impor-
tant since attempting to address the educational
concerns of learners may change with the
co-occurrence of another disability and failing
to recognize a dual-diagnosis may lead to stalled
educational advancement and increased
frustration for both learner and instructor.
Moreover, as implied, the remedial process may
become more complicated and require alternate
approaches as well as greater intensity, frequency
and duration. The second is related to the defini-
tion of LD and the link between the diagnosis of
a LD and the ability to receive remedial services.
If an individual has a speech or hearing disability
this is bound to affect reading skill given the
importance of accurate decoding (phonics skills)
to reading and reading development. If this under-
lying phonics skill is negatively influenced by a
speech or hearing disability it would seem that
the diagnosis should remain within these realms,
for instance, “a speech/hearing disability that
is negatively influencing phonics/reading skill”.
However, given the high percentage of dual
diagnosis it would appear that clinicians are
opting to diagnose two separate disabilities.
This may be directly linked to issues of funding
and receipt of remedial services contingent upon
particular diagnosis; it may reflect the lack of
clear definitional criteria, it could be due to short-
falls in the referral process within institutional
settings such as poor communication/interaction
within multi-disciplinary teams surrounding dif-
ferential diagnosis, and/or the order of service
delivery within such teams, or some combina-
tion of all of these factors. Regardless, this is
a significant issue at the policy level, in terms
of 1) requiring particular diagnosis to attain
service despite the domain through which the
difficulties manifest themselves being identical
(in our example difficulties with phonics/reading)
and 2) with respect to the workings of multi-
disciplinary teams within institutional settings.

C a n L e a r n i n g D i s a b i l i t i e s E x p l a i n L o w L i t e r a c y P e r f o r m a n c e ?
31
6 D i s c u s s i o n o f R e s u l t s
Moreover, there appears to be a significant
issue with the LDAC definition of LD considering
the noted lack of specificity surrounding the origin
of difficulties and a relatively poorly articulated
means by which to apply the exclusionary cri-
teria such that “unnecessary” dual diagnosis
are avoided.
• Finally, participation in a remedial reading
program in school was strongly associated
with self-reported LD. In fact, participation
in a remedial reading program is the strongest
predictor, with a 16.9% increased probability,
of a self-reported learning disability even after
controlling for numerous confounds.
The influence of remedial reading programs on
those with LD was illustrated in figure 2 where it
can be seen that those who received remediation
tended, as a group, to out perform those who did
not, and yet their scores remained lower than the
entire sample. Similarly, according to figure 3 non
LD individuals who were remediated also remained
below the performance of the entire sample. Com-
paring the two remediated groups at each level of
literacy indicates that a much higher percentage
of those with a LD are being provided with remedial
services compared to those without a LD, despite
similar levels of reading skill. This strongly suggests
a referral bias in favour of those with a diagnosis
of LD, which reflects poorly on policy makers who
establish such criteria and on advocacy groups
who push for diagnostic requirements in an envi-
ronment where the goal should be to assist all
learners develop their skills to their highest potential
regardless of diagnosis. Diagnostic/assessment
services may prove valuable in refining the specific
nature of intervention programs provided
to individuals, however intervention should not
be contingent on a specific diagnosis of LD, nor
should services be withheld until a formal assess-
ment and diagnosis is complete.
However, it is also important to note that the only
significant difference noted was between those
with a LD who were remediated compared to those
with a LD who were not remediated who were at
Level 1 prose literacy. Thus, it would appear that
in general, differences between the LD and non-
LD groups, with and without remedial services, in
terms of prose literacy scores are largely negligible.
This appears especially true for the bulk of respond-
ents who are functioning above level 1. At the
lowest level of literacy it would appear that those
with LD who receive remedial reading in school
demonstrate performance commensurate with non-
LD peers and higher levels of performance com-
pared to non-remediated LD peers; yet the mean
score for this LD remediated group remains solidly
in Level 1. In general, it is likely given the results of
intervention studies utilizing a pre/post test design,
that remedial interventions benefit those who par-
tici pate (Elbaum, Vaughn, Hughes, & Moody, 2000;
McKenna, McMillan, & Dempsey, 2004; McKenna,
& Violato, 2003), however, the mean scores of adults
who reported participating in remediation versus
those who reported not participating tend not to be
significantly different. This would suggest the need
to provide additional alternative supports such as
accommodations to those in settings where reading
prose is critical for success and/or providing reme-
dial programming to adults to bolster limited skills.
These results also call into question the need to
diagnose a LD given the similarity of performance

32
C a n L e a r n i n g D i s a b i l i t i e s E x p l a i n L o w L i t e r a c y P e r f o r m a n c e ? D i s c u s s i o n o f R e s u l t s
of those with and without a self-reported LD
on prose literacy.
Overall, these results help to clarify the
relationship between self-reported LD and a
variety of variables that have been previously
established, through research or clinical practice,
to be associated with LD. Policy implications are
significant when consid ering the impact LD has
on educational attainment as well as when recog-
nizing the concordance between LD and hearing,
speech and “other” disa bilities. However, the
most significant findings are 1) an apparent need
for additional alternative sup ports for those with
low literacy and 2) the lack of apparent utility of
labelling individuals with a LD when considering
the very similar levels of functioning with prose
literacy of those with and without a LD, and what
would appear to be similar outcomes in terms of
prose literacy levels for those with and without a
LD who receive remediation. This finding is consist-
ent with recent research on the response to inter-
vention of those who do and do not meet traditional
criteria for a LD in the area of reading (Stuebing
et al., 2009).
These trends have significant policy implications
at both the micro and macro levels. Firstly, within
schools, school districts, and the provinces, deci-
sions need to be made regarding the distribution
of resources. The current trend toward requiring
extensive psycho-educational assessment and
diagnosis by a trained professional requires large
cash expenditures to retain those appropriately
trained, as well as leading to long waiting times
for students to acquire these diagnostic services
prior to receiving remedial services. Moreover,
the characteristics of those with the most common
difficulty, phonological awareness and reading dif-
ficulties, and the interventions that can successfully
address these deficits are widely known, such that
classroom teachers are generally able to identify
those with difficulties and special education serv-
ices are able to implement programming that has
been generally demonstrated to effectively address
and remediate these difficulties if the interventions
are locally available. In short, simple and inexpen-
sive methods are available to identify children at
risk for reading difficulties and, children and adults
with reading problems; while specific, effective
interventions can be made available if appropriate
funding is allocated. Shifting resources from diag-
nostics to provision of service would allow for
increased investment in remedial services, better
programming and likely better outcomes for those
who are experiencing difficulties.
Secondly, within the provincial and federal
systems it may be prudent to move away from
allocating financial resources, such as grants, tax
incentives, funding for specific service and so forth,
based upon formal diagnosis. Rather, services may
be better provided and more equitably distributed
to all who require intervention by focusing on issues
of need based upon performance as identified by
front-line workers (regular and special education
teachers) or through population estimates adjusted
for demographic characteristics. Again this would
have the effect of providing more equitable access
to all who require assistance. Related to this would
be for Federal and/or Provincial governments
to provide funding for the development of brief
screening tests of reading skills (e.g. speed and
accuracy of basic decoding and word identification

C a n L e a r n i n g D i s a b i l i t i e s E x p l a i n L o w L i t e r a c y P e r f o r m a n c e ?
33
6 D i s c u s s i o n o f R e s u l t s
skills and perhaps of reading comprehension)
designed to be used by front line workers that
provide Canadian Normative data. Inexpensive
screening tools created within a Canadian context
would likely go far in reducing the cost, both in time
and money, and increase the effectiveness and
efficiency of identification of those with reading
difficulties.
Given the number of individuals with low literacy
skills, a significant concern is that only a relatively
small percentage are receiving remedial services
while in school (7.5% of the general population and
42% of those with a self-reported LD). The need
for increasing the quality and provision of remedial
reading services to those with relatively poor
liter acy skills while in school is supported given
related research on this topic (Elbaum, Vaughn,
Hughes, & Moody, 2000; McKenna, McMillan,
& Dempsey, 2004; McKenna, & Violato, 2003).
Yet, the need to specifically identify individuals as
LD or non LD does not appear to be a meaningful
exercise given the noted outcomes for these
groups in the present study.
The categorization of LD was a significant step
leading to the provision of services to those who
were unable to access needed supports because,
despite academic difficulties, they could not be
categorized with the diagnostic labels available
at that time in history. That situation has now been
addressed; recognition and services are now
avail able. However, history repeats itself in that
now the rigidity associated with diagnosis has
resulted in other large segments of the population
being unable to access services since they do not
meet diagnostic criteria and yet they struggle
academically. New labels are not the answer,
since it will simply recreate the same inequities.
Rather a moving away from service provision
based upon diagnosis has a greater probability of
meeting the needs of a wider more diverse group
of the population. Of course such suggestions will
be met with hostility and fear by those who have
a vested interest in the area of LD. However, this
will largely be grounded in concerns about the loss
or reduction of needed services. Actively allying
these fears through implementation of remedial
programming and continued support will go far
to addressing these issues.


35
7 Key Findings andPolicy Implications
LiteracyKey Findings• Literacy scores are negatively influenced
by a self-reported LD.
• The average difference between the prose
literacy scores of those with and without a LD
is approximately 15 points after controlling
for other variables.
Policy Implications• Those with a self-reported LD tend on the
whole to score lower than those without a
diagnosis, however, upon further analysis this
relationship is only significant at level 1 prose.
Gender and AgeKey Findings• Gender was not found to be a significant
factor associated with LD.
• Age was determined to be significantly
associated with LD and there was a progressive
increase in the percentage of individuals reporting
a LD at each 10 year interval. It is likely that the
percentage of Canadians reporting a LD will con-
tinue to increase over the next decade and will
likely exceed the estimated prevalence rate
endorsed by LDAC of 10% of the general
population, largely as a result of the current
definition.
Policy Implications• More emphasis needs to be placed on universal
screening to ensure early identification of reading
difficulties in both genders.
• With the progressive increase in the
percentage of individuals reporting a LD at
each 10 year interval combined with the new
broader definition of LD provided by LDAC, the
number of people with LD will likely continue to
expand and along with this the demand for related
services – services that educational institutions
and work places are legally obliged to provide.
The financial implications of this will likely
be significant.
Education and IncomeKey Findings• Educational attainment and level of income
were found to be significantly and negatively
associated with LD.
• Father’s education was not associated with LD.
• Mother’s educational level, though small, was
associated with LD, with higher levels of educa-
tion being more predictive of a LD.

36
C a n L e a r n i n g D i s a b i l i t i e s E x p l a i n L o w L i t e r a c y P e r f o r m a n c e ? K e y F i n d i n g s a n d P o l i c y I m p l i c a t i o n s
Policy Implications• The apparent association of LD to early school
departure is critical to explore given the clear
links between this and a host of negative personal
and social outcomes.
• It appears that learners with a LD who
complete high school are choosing to continue
their studies at the college level as opposed
to the University level. Working toward having
school personal express the same esteem for
College and Uni versity PSE and emphasising
the key differences in the nature of the training
experience and job outcomes may lead to more
individuals with LD remaining in school
and pursuing PSE.
• Given the largely uni-directional relationship
between education and income and literacy
scores and income, policy implications lean
largely on issues of early and continuing
education.
• The relationship between lower levels of
mother’s education and less self-reported LD
suggests more support needs to be provided to
those families with lower levels of educational
attainment in order to ensure early identification
and intervention.
Reading PracticesKey Findings• Reading practices, as measured by the reported
number of books at home, were associated with
self reported LD, with fewer books being more
predictive of a LD.
Policy Implications• Continued support of home literacy practices
may be one means of enhancing literacy skill.
Related DisabilitiesKey Findings• Strong and robust associations to LD were
noted for the presence of comorbid reports
of hearing disabilities, speech disabilities,
and other disabilities. Visual disabilities
were not associated with LD.
Policy Implications• Addressing the manifestation/symptoms should
be the area of focus as opposed to diagnosis or
differential diagnosis of particular disabilities.
• Frameworks for the interactions within multi-
disciplinary teams should be established
to limit unnecessary dual diagnosis.
Remedial Services in SchoolKey Findings• Participation in a remedial reading program
in school was the strongest predictor of self-
reported LD.
• A much higher percentage of those with a LD are
being provided with remedial services compared
to those without a LD, despite similar levels
of reading skill.
• In general, differences between the LD and non-
LD groups, with and without remedial services,
in terms of prose literacy scores are largely
negligible.

C a n L e a r n i n g D i s a b i l i t i e s E x p l a i n L o w L i t e r a c y P e r f o r m a n c e ?
37
7 K e y F i n d i n g s a n d P o l i c y I m p l i c a t i o n s
Policy Implications• Address the referral bias in favour of those
with a diagnosis of LD to receive remedial
programming, by focusing on the goal to assist
all learners develop their skills to their highest
potential regardless of diagnosis. Intervention
should not be contingent upon a specific diag-
nosis of LD, nor should services be withheld
until a formal assessment and diagnosis
is complete.
• Provide additional alternative supports such
as accommodations to those in settings where
reading prose is critical for success and/or
providing remedial programming to adults
to bolster limited skills.
• Address the need for additional alternative
supports for those with low literacy.
• Eliminate the need to label individuals with
a LD considering the very similar levels of
functioning with prose literacy of those with
and without a LD, and similar outcomes for
those who do and do not receive remedial
services.
• Re-direct incentives related to diagnosis to
the provision of services based upon need.
• Invest in the development of Canadian screening
measures to facilitate identification of those
requiring services.


39
Annex
TABLE 1Regression Table for Prose
Regression Model1 2 3
coef se coef se coef se
LD 29.146*** 2.973 28.983*** 2.965 35.012*** 2.679Gender 2.005 1.358 4.032*** 1.204Age 26 – 35 3.751** 1.847Age 36 – 45 -7.780*** 1.926Age 46 – 55 -11.657*** 1.765Age 56 – 65 -31.739*** 2.236Age 65 + -69.126*** 2.059Less than Grade 7
Some High School
PSE Non-University
PSE University
Mother’s Education
Father’s Education
Remedial Reading in School
25 – 100 Books in Household
100+ Books in Household
Education Imputation
Mother’s Education ImputationFather’s Education ImputationRemedial Reading in School ImputationBooks in Household ImputationCons 244.901*** 2.890 244.034*** 2.968 254.145*** 2.822
Number of Observations 22,276 22,276 22,276Adjusted R 2 0.016 0.016 0.198Log-Likelihood -120,794.72 -120,790.99 -118,505.87
(Continued)

40
C a n L e a r n i n g D i s a b i l i t i e s E x p l a i n L o w L i t e r a c y P e r f o r m a n c e ? A n n e x
(Continued)
Regression Model4 5 6
coef se coef se coef se
LD 20.150*** 2.251 21.036*** 2.244 20.990*** 2.225
Gender 3.645*** 1.059 4.229*** 1.032 4.347*** 1.028
Age 26 – 35 -11.198*** 1.785 -5.636*** 1.722 -4.672*** 1.728
Age 36 – 45 -18.374*** 1.771 -9.470*** 1.743 -7.987*** 1.751
Age 46 – 55 -19.222*** 1.662 -8.786*** 1.715 -6.884*** 1.736
Age 56 – 65 -31.600*** 1.988 -19.275*** 2.070 -17.518*** 2.099
Age 65 + -55.043*** 1.868 -43.264*** 1.927 -41.477*** 1.948
Less than Grade 7 -68.807*** 2.456 -64.115*** 2.427 -63.284*** 2.440
Some High School -24.954*** 1.612 -22.259*** 1.574 -21.622*** 1.572
PSE Non-University 16.010*** 1.422 14.531*** 1.393 14.155*** 1.385
PSE University 32.691*** 1.487 28.037*** 1.453 27.035*** 1.451
Mother’s Education 21.014*** 1.159 18.731*** 1.234
Father’s Education 6.045*** 1.220
Remedial Reading in School
25 – 100 Books in Household
100+ Books in Household
Education Imputation
Mother’s Education Imputation
Father’s Education Imputation
Remedial Reading in School Imputation
Books in Household Imputation
Cons 270.902*** 2.585 252.569*** 2.775 249.727*** 2.819
Number of Observations 22,276 22,276 22,276
Adjusted R 2 0.385 0.413 0.415
Log-Likelihood -115,544.73 -115,033.55 -114,996.08
(Continued)

C a n L e a r n i n g D i s a b i l i t i e s E x p l a i n L o w L i t e r a c y P e r f o r m a n c e ?
41
A n n e x
(Continued)
Regression Model7 8 9
coef se coef se coef se
LD 17.637*** 2.309 16.054*** 2.134 15.526*** 2.136
Gender 4.057*** 1.027 3.406*** 0.986 3.375*** 0.986
Age 26 – 35 -5.049*** 1.713 -4.551*** 1.670 -4.700*** 1.669
Age 36 – 45 -8.507*** 1.732 -11.159*** 1.677 -11.109*** 1.675
Age 46 – 55 -8.023*** 1.727 -12.138*** 1.663 -11.968*** 1.662
Age 56 – 65 -18.913*** 2.092 -23.394*** 2.020 -22.837*** 2.020
Age 65 + -42.965*** 1.944 -44.256*** 1.849 -43.065*** 1.859
Less than Grade 7 -63.365*** 2.439 -55.465*** 2.432 -61.810*** 2.674
Some High School -21.564*** 1.564 -18.694*** 1.514 -18.991*** 1.515
PSE Non-University 14.217*** 1.383 11.922*** 1.341 11.953*** 1.341
PSE University 26.851*** 1.450 22.871*** 1.397 23.018*** 1.396
Mother’s Education 18.550*** 1.228 14.966*** 1.169 14.852*** 1.170
Father’s Education 5.976*** 1.211 3.826*** 1.157 3.793*** 1.157
Remedial Reading in School -9.757*** 1.896 -10.447*** 1.789 -10.561*** 1.791
25 – 100 Books in Household 21.538*** 1.560 21.191*** 1.562
100+ Books in Household 36.720*** 1.537 36.237*** 1.539
Education Imputation 55.078*** 2.671
Mother’s Education Imputation
Father’s Education Imputation
Remedial Reading in School Imputation
Books in Household Imputation
Cons 254.887*** 2.923 236.538*** 2.955 237.293*** 2.957
Number of Observations 22,276 22,276 22,276
Adjusted R 2 0.417 0.469 0.474
Log-Likelihood -114,949.40 -113,910.89 -113,810.27
(Continued)

42
C a n L e a r n i n g D i s a b i l i t i e s E x p l a i n L o w L i t e r a c y P e r f o r m a n c e ? A n n e x
(Continued)
Regression Model10 11 12
coef se coef se coef se
LD 15.561*** 2.139 15.517*** 2.143 15.543*** 2.143
Gender 3.400*** 0.983 3.421*** 0.984 3.371*** 0.984
Age 26 – 35 -4.711*** 1.670 -4.693*** 1.669 -4.646*** 1.668
Age 36 – 45 -11.113*** 1.676 -11.094*** 1.675 -11.094*** 1.675
Age 46 – 55 -11.983*** 1.661 -11.981*** 1.661 -11.938*** 1.662
Age 56 – 65 -22.849*** 2.020 -22.851*** 2.019 -22.798*** 2.018
Age 65 + -43.118*** 1.860 -43.101*** 1.860 -43.085*** 1.861
Less than Grade 7 -61.867*** 2.684 -61.932*** 2.687 -61.839*** 2.689
Some High School -19.034*** 1.518 -19.018*** 1.520 -18.969*** 1.519
PSE Non-University 11.965*** 1.341 11.931*** 1.339 11.952*** 1.339
PSE University 23.040*** 1.396 23.003*** 1.396 23.018*** 1.396
Mother’s Education 14.964*** 1.192 15.053*** 1.200 15.079*** 1.200
Father’s Education 3.799*** 1.157 3.592*** 1.196 3.574*** 1.196
Remedial Reading in School -10.550*** 1.791 -10.518*** 1.791 -10.544*** 1.791
25 – 100 Books in Household 21.185*** 1.561 21.162*** 1.558 21.173*** 1.558
100+ Books in Household 36.241*** 1.538 36.198*** 1.532 36.228*** 1.532
Education Imputation 55.049*** 2.678 55.203*** 2.684 55.198*** 2.686
Mother’s Education Imputation 1.032 2.227 1.872 2.542 1.901 2.541
Father’s Education Imputation -1.599 2.255 -1.586 2.255
Remedial Reading in School Imputation -47.063*** 17.297
Books in Household Imputation
Cons 237.137*** 2.967 237.324*** 2.966 237.286*** 2.966
Number of Observations 22,276 22,276 22,276
Adjusted R 2 0.474 0.474 0.474
Log-Likelihood -113,809.82 -113,808.87 -113,799.15
(Continued)

C a n L e a r n i n g D i s a b i l i t i e s E x p l a i n L o w L i t e r a c y P e r f o r m a n c e ?
43
A n n e x
(Concluded)
Regression Model13
coef se
LD 15.550*** 2.142
Gender 3.407*** 0.985
Age 26 – 35 -4.590*** 1.669
Age 36 – 45 -11.048*** 1.674
Age 46 – 55 -11.895*** 1.661
Age 56 – 65 -22.794*** 2.017
Age 65 + -43.046*** 1.860
Less than Grade 7 -61.856*** 2.688
Some High School -18.966*** 1.519
PSE Non-University 11.955*** 1.339
PSE University 23.020*** 1.396
Mother’s Education 15.054*** 1.200
Father’s Education 3.570*** 1.196
Remedial Reading in School -10.532*** 1.791
25 – 100 Books in Household 21.304*** 1.569
100+ Books in Household 36.357*** 1.542
Education Imputation 55.239*** 2.686
Mother’s Education Imputation 1.868 2.542
Father’s Education Imputation -1.669 2.258
Remedial Reading in School Imputation -47.032*** 17.307
Books in Household Imputation 11.209** 4.743
Cons 237.117*** 2.972
Number of Observations 22,276
Adjusted R 2 0.474
Log-Likelihood -113,797.35


45
Bibliography
Bone, R. B., Cirino, P., Morris, R. D., & Morris, M. K.
(2002). Reading and phonological awareness
in reading-disabled adults. Developmental
Neuropsychology, 21, 305 – 320.
Dickenson, D. L., & Verbeek, R. L. (2002). Wage
differentials between college graduates with
and without learning disabilities. Journal
of Learning Disabilities, 35, 175 – 184.
Desjardins, R. (2005a). Comparative Profiles of
Adult Skills. In Learning a Living: First Results of
the Adult Literacy and Life Skills Survey (chap. 2).
Paris: Ministry of Industry, Canada, & Organi-
zation for Economic Cooperation
and Development.
Desjardins, R. (2005b). Education and Skills.
In Learning a Living: First Results of the Adult
Literacy and Life Skills Survey (chap. 3). Paris:
Ministry of Industry, Canada, & Organization
for Economic Cooperation and Development.
Desjardins, R., & Werquin, P. (2005). Skills and the
Nature of the Workplace. In Learning a Living:
First Results of the Adult Literacy and Life Skills
Survey (chap. 6). Paris: Ministry of Industry,
Canada, & Organization for Economic
Cooperation and Development.
Desjardins, R., Werquin, P., & Dong, L. (2005).
Skills and Economic Outcomes. In Learning
a Living: First Results of the Adult Literacy
and Life Skills Survey (chap. 3). Paris: Ministry
of Industry, Canada, & Organization for Eco-
nomic Cooperation and Development.
Elbaum, B., Vaughn, S. Hughes, M. T., & Moody,
S. W. (2000). How effective are one-to-one
tutoring programs in reading for elementary
students at risk for reading failure? A meta-
analysis of the intervention research. Journal
of Educational Psychology, 92, 605 – 619.
Felton, R. H., & Wood, F. B. (1992). A reading level
match study of nonword reading skills in poor
readers with varying IQ. Journal of Learning
Disabilities, 25, 318 – 326.
Fowler, A. E., & Scarborough, H. S. (1993).
Should readingdisabled adults be distinguished
from other adults seeking literacy instruction?
A review of theory and research (TR93-07).
Pennsylvania:PA: National Centre on Adult
Literacy. (ERIC Document Reproduction
Service No. 363 – 732).
Human Resources and Skills Development Canada,
& Statistics Canada, (2005). Building on Our
Competencies: Canadian Results of the Inter
national Adult Literacy and Skills Survey.
Minister of Industry, Ottawa.
46
C a n L e a r n i n g D i s a b i l i t i e s E x p l a i n L o w L i t e r a c y P e r f o r m a n c e ? B i b l i o g r a p h y
Kaplan, D., & Venezky, R. L. (1993). What Can
Employers Assume About the Literacy Skills
of GED Graduates? Technical Report TR93-5.
National Center on Adult Literacy. University
of Pennsylvania.
Kruidenier, J. (2000). ResearchBased Principles
for Adult Basic Education Reading Instruction.
National Institute for Literacy EdPubs:
Jessup: MD.
Learning Disability Association of Canada (2002).
Official Definition of Learning Disabilities.
http://www.ldac-taac.ca/Defined/defined_
new-e.asp Retrieved: June 23, 2008.
Learning Disability Association of Canada (2007).
Executive Summary of Putting a Canadian Face
on Learning Disabilities Study (PACFOLD).
Liederman, J., Kantrowitz, L., & Flannery, K. (2005).
Male Vulnerability to Reading Disability Is Not
Likely to Be a Myth: A Call for New Data. Journal
of Learning Disabilities, 38, 109 – 129.
Levine, P., & Nourse, S. W. (1998). What follow-up
studies say about postschool life for young
men and women with learning disabilities:
A critical look at the literature. Journal
of Learning Disabilities, 31, 212 – 233.
Mellard, D. F., & Patterson, M. B. (2008). Contrasting
adult literacy learners with and without specific
learning disability. Remedial and Special
Education, 29, 133 – 144.
McKenna, G. S., McMillan, B., & Dempsey, K.
(in submission). A Descriptive Profile of
Canadian Learners with Low Literacy Levels.
McKenna, G. S., McMillan, B., & Dempsey, K. (2004).
Low Literacy Adults: Employment, Reading and
Self Esteem. Unpublished Report. Holland
College:PE.
McKenna, G. S., & Violato, C. (2003). A Combined
Phonological Awareness, Whole Language
and Meta-cognitive Approach to Teaching
Reading to Reading Resistors. Canadian
Journal of School Psychology.
Murray, L., Woolgar, M., Martins, C., Christaki, A.,
Hipwell, A., & Cooper, P. (2006). Conversations
around homework: Links to parental mental
health, family characteristics and child psy-
chological functioning. British Journal of
Developmental Psychology, 24, 125 – 149.
Raitano, N. A., Pennington, B. F., Tunick, R. A.,
Boada, R., & Shriberg, L. D. (2004). Pre-literacy
skills of subgroups of children with speech
sound disorders. Journal of Child Psychology
and Psychiatry, 45, 821 – 835.
Shaywitz, B. A., Fletcher, J. M., Holahn, J. M., &
Shaywitz, S.E. (1992). Discrepancy compared to
low achievement definitions of reading disability:
Results from the Connecticut Longitudinal Study.
Journal of Learning Disabilities, 25, 639 – 648.
Shaywitz, S. E., & Shaywitz, B. A. (undated). The
Neurobiology of Reading Disability. NCSALL
paper. http://wwwncsall.net/?id=771&pid=278.
Downloaded June 13, 2008.
Siegel, L. S. (1989). IQ is irrelevant to the definition
of learning disabilities. Journal of Learning
Disabilities, 22, 469 – 478, 486.

C a n L e a r n i n g D i s a b i l i t i e s E x p l a i n L o w L i t e r a c y P e r f o r m a n c e ?
47
B i b l i o g r a p h y
Siegel, L. S., & Smythe, I. S. (2005). Reflections on
Research on Reading Disability with Special
Attention to Gender Issues. Journal of Learning
Disabilities, 38, 473 – 477.
Solan, H.A., Shelley-Tremblay, J., Hansen, P.,
& Larson, S. (2007). Is there a Common
Linkage Among Reading Comprehension,
Visual Attention, and Magnocellular processing?
Journal of Learning Disabilities, 40, 270 – 278.
Stein, J. (2001). The magnocellular theory of
developmental dyslexia. Dyslexia, 7, 12 – 36.
Stuebing, K.K., Barth, A.E., Molfese, P.J., Weiss,
B., & Fletcher, J.M. (2009). IQ is not strongly
related to response to reading instruction:
A meta-analytic interpretation. Exceptional
Children, 76, 31 – 53.
Torgesen, J. K., (2000). ‘Individual differences
in response to early interventions in reading:
The lingering problem of treatment resisters.’
Learning Disabilities Research & Practice, 15,
55 – 64.
Torgeson, J. K. (2004). Preventing early reading
failure – and it devastating downward spiral:
The evidence for early intervention. American
Educator, fall.
Vellutino, F. R., Scanlon, D. M., & Lyon, G. R. (2000).
Differentiating between difficult-to-remediate
and readily remediated poor readers: More
evidence against the IQ-achievement discrep-
ancy definition of reading disability. Journal
of Learning Disabilities, 33, 223 – 238.
White, S., Milne, E., Rosen, S., Hansen, P.,
Swettenham, J., Frith, U., & Ramus, F. (2006). The
role of sensorimotor impairments in dyslexia:
A multiple case study of dyslexic children.
Developmental Science, 9, 237 – 269.
Willms, J. D. (2005). Skills, Parental Education
and Literacy Practice in Daily Life. In Learning
a Living: First Results of the Adult Literacy and
Life Skills Survey (chap. 10). Paris: Ministry of
Industry, Canada, & Organization for Economic
Cooperation and Development.
