can mental health education using a storybook - qspace
TRANSCRIPT
Can Mental Health Education Using a Storybook
Reduce Mental Illness Stigma in Children?
By
Judeline Innocent
A thesis submitted to the Graduate Program in the School of Nursing
in conformity with the requirements for
the Degree of Doctor of Philosophy
Queen’s University
Kingston, Ontario, Canada
June, 2013
Copyright © Judeline Innocent, 2013
ii
Abstract
Individuals experiencing a mental illness are often stigmatized. Children also stigmatize
those who experience a mental illness. There is national interest in reducing the negative effects
of stigma, especially in children. Unfortunately, children anti-stigma interventions are being used
without being empirically tested for their effectiveness. A goal of the Opening Minds Anti-
stigma initiative of the Mental Health Commission of Canada is to identify programs and
resources that have been empirically tested and found to be effective in reducing stigma. This
study was funded by the Opening Minds Initiative of the Mental Health Commission of Canada
to: First, investigate the effectiveness of providing children ages 11-14 with mental illness
education using a storybook in order to reduce their mental illness stigma; and, second, to
examine children’s perceptions of the anti-stigma book used to provide the education.
A quasi-experimental design was used to test the effectiveness of the mental illness
educational storybook in reducing mental illness stigma. The Youth Opinion Survey for
Stereotype and Social Distance measurement was used to obtain baseline information before the
education was provided. A pre-test, post-test process was used.
Several qualitative questions, embedded in the post-test questionnaire, were provided to
the children participating with an opportunity to use their own words to describe what they
thought about mental illness before and after the education, what they learned from the
educational storybook and whether or not they liked the education they received.
The results show that the exposure to an educational storybook about children mental
illness stigma was effective in reducing the percentage of negative responses at post-test. The

iii
participants used less negative words to describe someone “with a mental illness”. An
improvement in the overall scores at post-test was seen for both stereotype and social distance.
After the study was completed, the feasibility of conducting a study of this type was
evaluated. Recommendations for the possibility of using this method for future studies are
included.
iv
Acknowledgements
All things are possible to those who believe. I am forever grateful for my enduring faith
in my Lord and confidently acknowledge that I can do all things through Him who strengthens
me. To my deceased father who instilled in me the desire to become powerful with the thirst for
and pursuit of knowledge, I say thank you. To my deceased brother whose drug misuse led him
to take his own life, I say thank you for not dying in vain, for the shame of losing you in such a
manner then, prompted my interest today to reduce stigma and remove the suffering caused by it.
To my brother who drowned at the age of twelve, when I was only ten, thank you for exposing
me to the meaning of death before I even knew the meaning of life. The subsequent pain of your
early departure provided a true understanding of human suffering and the agony of loss;
notwithstanding the resiliency created by such adversity.
To my husband Moise Innocent, my daughters Myriam and Rachelle, my sons Daniel and
Caleb, I thank you for allowing me to obsessively work towards a goal, often forgetting my
obligations to you. Your enduring love and forgiveness anchor me. It is with great pride that I
applaud Myriam for completing her Master’s Degree in Science in Nursing/Nurse Practitioner
attending Queen’s University together with me, as mother and daughter, during the first few
years of my program. It is with similar pride that I applaud my younger daughter Rachelle, who
finished her double major with honours and distinction. I hope to continue to be as much of an
inspiration to you as you are to me. To my sons, Daniel and Caleb, whose career paths are still
unfolding, may you pursue your dreams whatever they may be.
To my supervisors Dr. Cynthia Baker and Dr. Diane Buchanan, thank you for your
support and guidance. To Dr. Heather Stuart, thank you for narrowing my research to an area of
tremendous interest and for your knowledge and wisdom. To Dr. Rosemary Wilson, thank you

v
for your time and exemplary dedication. To Gayle Grass and Iris the Dragon, thank you for the
generous donations of books and supplies for the study and many thanks to the Mental Health
Commission of Canada for providing the funding for this study.
To Cathy Cudmore, Darlene Stuckless, Linda Kessler, Kathryn Stansfield, Jaclyn
Neufeld and Joan Anderson, thank you for your time and support. To all others who contributed
in whatever way, at one time or another, in many significant ways, I also say thank you.
vi
Table of Contents
Abstract……………………………………………………………………... ii
Acknowledgement………………………………………………………….. iv
List of figures……………………………………………………………….. x
List of tables………………………………………………………………… xi
Chapter 1 Introduction…………………………………………………… 1
Background………………………………………………………………… 2
Stigma Definition ……………………………………………………… 2
Psychological/Anthropological/Sociological Perspectives On Stigma.. 3
Mental Illness Stigma in Children…………………………………….. 5
Relevance of the Proposed Study……………………………………… 6
Chapter 2 Literature Review…………………………………………….. 7
Development of Mental Illness Stigma in Children…………………… 7
Media Contribution to the Development of Mental Illness Stigma…… 10
Anti-Stigma Strategies…………………………………………………. 11
Education………………………………………………………………. 12
Theoretical Framework………………………………………………… 14
Statement of Purpose…………………………………………………... 16
Research Objectives……………………………………………………. 17
Chapter 3 Methods…………………………..…………………………… 18
Research Design………………………………………………………… 18
Intervention……………………………………………………………... 18
Instrument………………………………………………………………. 19
vii
Parental Demographic Questionnaires………………………………..
Sample and setting……………………………………………………..
21
21
Inclusion/Exclusion Criteria…………………………………………... 22
Sample…………………………………………………………………. 22
Data Collection Management/Analysis……………………………….. 23
Survey and Narrative Responses ……………………………………… 24
Ethics…………………………………………………………………… 27
Chapter 4 Results………………………………………………………….
30
Demographic Characteristics of the Sample ………………………….. 31
Participants Characteristics……………………………………………. 33
Parental Characteristics……………………………………………….. 35
Knowledge of Someone with a Mental Illness………………………… 37
Primary Research Question……………………………………………. 37
Changes within the Stereotype and the Social Distance Subscales…..
Changes within the Social Distance Subscale…………………………
Changes in Stereotype Scores among Participants……………………
39
43
47
Controllability Items…………………………………………………… 47
Recovery Items………………………………………………………… 49
Violence/Unpredictability Items………………………………………. 50
Changes in Social Distance Scores among Participants...……………. 51
Social Responsibility………………………………………………….. 53
Significant Changes in Scores per Subcategory………………………. 55

viii
Participants’ Feelings about the Book………………………………..… 64
Chapter 5 Qualitative Findings………………………………………….. 66
Participants’ Perceptions of Mental Illness…………………………….. 66
Major Differences in Perceptions at Pre-test and Post-test…………….. 72
Qualitative Findings Results…………………………………………… 72
Participants’ Perceptions of the Book………………………………….. 73
Knowledge Acquired from Reading the Book…………………………. 76
Chapter 6 Discussion……………………………………………………… 80
Pre-test One and Pre-test Two…………………………………………. 81
Knowledge of Someone with a Mental Illness…………………………. 82
The Intervention………………………………………………………… 82
Instrument Subscale Distinctions and Results………………………….. 85
Stereotypes……………………………………………………………… 87
Verbatim Stereotype Discussion………………………………………... 89
Social Distance…………………………………………………………. 90
Thematic Analysis……………………………………………………… 91
Participants’ Written Views……………………………………………. 91
Significance of the Results……………………………………………..
Nursing Implications……………………………………………………
93
95
Generalizability of the Study…………………………………………… 96
Feasibility……………………………………………………………….. 97
Study Limitations………………………………………..……………… 100
Recommendations……………………………………………………… 102

ix
Conclusion……………………………………………………………… 102
References………………………………………………………………. 104
Appendix A: Manoeuvre…………………………..………………........ 112
Appendix B: YOS Pre-test…………..…………...……………………... 115
Appendix C: YOS Post-test…………………………….………………. 117
Appendix D: Feasibility Questions Logbook…………………………... 120
Appendix E: Queen’s University Ethics Approval Letter……………… 121
Appendix F: Limestone District School Board Approval………………. 122
Appendix G: Hastings and Prince Edward County Board Approval…… 123
Appendix H: Teacher Recruitment Poster……………………………… 125
Appendix I: Information Letter/Consent for Teachers…………………. 126
Appendix J: Information Letter/Consent for Parents and Students…….. 128
Appendix K: Parent Demographic Questionnaire……………………… 130
Appendix L: Information Letter/Consent for Parents ………………….. 132
Appendix M: Certificate of Appreciation………………………………. 133
Appendix N: Reduction of similar vocabulary for Pre-test/Post-test….. 134
Appendix O: Report to the Commission………………………………. 136
x
LIST OF FIGURES
Figure 1. Psychological, sociological and anthropological perspectives in
children’s stigma development…………….…………………………………
Figure 2. Theoretical Framework …………………………………………….
4
9
Figure 3. Flow of participants to final number of participants………..……. 31
Figure 4. Controllability items……………………………………………….. 48
Figure 5. Recovery items ……………………………………………………. 49
Figure 6. Violence /Unpredictability items…………………………………... 50
Figure 7. Social Distance……………………………………………………... 52
Figure 8. Social Responsibility items ………………………………………. 54
Figure 9. Change over 80% in Stereotype Scale Score (n=116)…………….. 62
Figure 10. Change over 80% in Social Tolerance Scale Score (n=108……… 63
xi
LIST OF TABLES
Table 1 Participants’ Characteristics Baseline Demographics……………... 34
Table 2 Parental Demographic Characteristics…………………………….. 36
Table 3 Knowledge of Someone with a Mental Illness……………………. 37
Table 4 Participants YOS Subscale Comparaisons ………………….…..... 38
Table 5 Direction of Change for the Stereotype Subscale between Pre and
Post Tests…………………………………………………………………….
41
Table 6 Direction of Change for the Social Distance Subscale between Pre
and Post Tests………………………………………..………………………
45
Table 7 Analysis of Significance for Controllability Items…………………. 56
Table 8 Analysis of Significance for Recovery Items………………………. 57
Table 9 Analysis of Significance for Violence and Unpredictability Items… 58
Table 10 Analysis of Significance for Social Distance and Social
Responsibility…………………………………………………………………
60
Table 11 Feelings on Learning about Mental Illness………………………… 65
Table 12 Qualitative Analysis of Perceptions of Persons with a
Mental Illness at Pre-test…………………………………………………....... 70
Table 13 Qualitative Findings Analysis of Perceptions of Persons with a
Mental Illness at Post-test……………………………………………………. 71
Table 14 Participants’ Perceptions of People with a Mental Illness…………. 72
Table 15 What Participants Liked about the Book…………………………... 74
Table 16 Dislikes about the book……………………………………………. 75
Table 17 Knowledge Acquired………………………………………………. 78

1
Chapter 1
Introduction
Young people have a poor understanding of mental illness (Cameron & Spitzer, 1995;
Sholl, Korkie, & Harper, 2009). For this reason, many school-aged children stigmatize those who
experience a mental illness (Schachter, Girardi, Lacroix, Lumb, van Berkom, & Gill, 2008). The
purpose of this research was to investigate the effectiveness of providing children ages 11-14
with mental illness education using a storybook in order to reduce their mental illness stigma and
to examine the children’s perceptions of the anti-stigma storybook. The Opening Minds Anti-
stigma Initiative of the Mental Health Commission of Canada (MHCC) is mandated with
addressing mental illness stigma nationally. Through the process of public engagement and
consultation, various entities have submitted an assortment of tools to the Commission to be
considered and endorsed as part of the Commission’s strategies to address mental illness stigma.
This study was funded by the Opening Minds Initiative of the Mental Health Commission of
Canada to evaluate the effectiveness of a children’s storybook, “He Shoots, He Scores” for
reducing stigmatizing views in children. “He Shoots, He Scores” is one of the “Iris the Dragon”
series of children’s story books designed to educate children about various facets of mental
illness. “He Shoots, He Scores” was written specifically with a focus to reduce mental illness
stigma in children (Grass, 2010).
This document is divided into six chapters. The first chapter provides selected stigma
background definitions and terminology leading to a more in-depth review of the literature.
Secondly, literature on how children exposed to mental illness stereotypes develop mental illness
stigma is reviewed. Common anti-stigma strategies are explored with a focus on how mental
illness education may or may not change attitudes. A theoretical framework providing the
2
rationale for the age group selected for the study is presented and the stigma framework
underpinning the study is explicated. Thirdly, the methodology, research design, instrument,
procedure and analyses are presented. The research findings, discussion and conclusions form
the final two chapters.
Background
Stigma definitions
The term “stigma” originated from the ancient Greeks and referred to someone who was
marked by a sign to expose something unusual or bad about the moral status of that individual
(Corrigan & O’Shaughnessy, 2007). These marks were burnt into the person’s body advertising
that the bearer of the sign was a slave, a criminal or a traitor (Goffman, 1963). Goffman’s (1963)
classic definition of stigma suggests it is a mark or trait that is deeply discrediting and reduces
the person to something that is tainted and discounted. Since then, added layers of religious and
medical allusions expanded the use of the term (Goffman, 1963). Today, the term stigma is
defined in the dictionary as, “a mark of shame or discredit, or an identifying mark or
characteristic…a specific diagnostic sign of a disease” (Merriam-Webster, 1994, p.1155). An
undeserved negative trait or characteristic assigned by society to a person or a group is often
reinforced by lack of knowledge, misconceptions and fear (Shah, 2004). For example, fear of
someone who experiences a mental illness is the result of a “dangerousness” stereotype that has
been associated with those who are mentally ill (Corrigan, Rowan, Green, Lundin, River,
Uphoff-Wasowski, et al. 2002; Link, Phelan, Bresnahan, Stueve, & Pescosolido, 1999; Wahl,
2003). The person who experiences a mental illness will often be seen as weak of character,
3
incompetent or inadequate because of the stereotypes associated with the illness (Corrigan &
Watson, 2002).
Psychological/anthropological/sociological perspectives on stigma
There are additional definitions of stigma that are commonly used in the literature (Link
& Phelan, 2001). The challenge for researchers is to sift through the myriad of views presented
about stigma (Stafford & Scott, 1986). Depending on the research study, researchers classify
stigma as a moral (Yang & Kleinman, 2008) or psychological process which refers to the
cognitive functions of the mind and the impact of the mind on behavior of a person or groups, it
relates to visceral reactions to a situation, like fear. Psychological definitions focus on negative
attitudes and beliefs people have about those who possess a stigmatized characteristic or trait
(Corrigan & O’Shaughnessy, 2007). Others choose to define stigma as a sociological
phenomenon, which relates to sociology where there is interaction of people, institutions, ways
in which people in groups behave and interact collectively (Link & Phelan, 2001). Yang and
Kleinman (2008), anthropologists, focused on the culturally-based moral stigma process
involved, it includes a set of shared attitudes, values, goals and practices that characterize a
group, institution, organization, religion or nation. Culture is the aggregate outcome of multi-
dimensional socialization. The stigma definition used to underpin this study is the one Shah
(2004) used to define stigma where an undeserving negative trait assigned by society is
reinforced by lack of knowledge, misconceptions and fear.
Society is comprised of family units within which a child is raised. Societal views about
mental illness are often learned at home, at school, from peers or from the media. The
psychological, anthropological/cultural and sociological perspectives of stigma affect how
children are socialized and how they view their worlds.
4
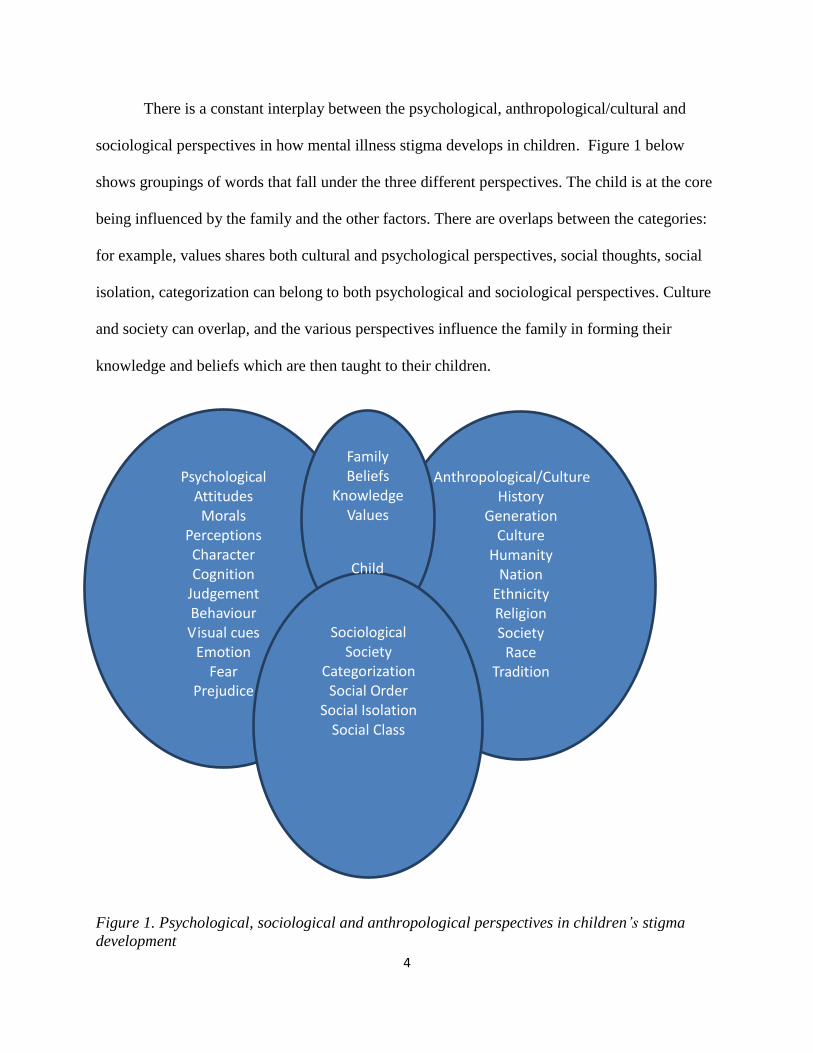
There is a constant interplay between the psychological, anthropological/cultural and
sociological perspectives in how mental illness stigma develops in children. Figure 1 below
shows groupings of words that fall under the three different perspectives. The child is at the core
being influenced by the family and the other factors. There are overlaps between the categories:
for example, values shares both cultural and psychological perspectives, social thoughts, social
isolation, categorization can belong to both psychological and sociological perspectives. Culture
and society can overlap, and the various perspectives influence the family in forming their
knowledge and beliefs which are then taught to their children.
Figure 1. Psychological, sociological and anthropological perspectives in children’s stigma
development
Psychological Attitudes
Morals
Perceptions
Character Cognition
Judgement Behaviour Visual cues
Emotion Fear
Prejudice
Anthropological/Culture
History
Generation
Culture
Humanity
Nation
Ethnicity
Religion
Society
Race
Tradition
Family
Beliefs
Knowledge Values
Sociological Society
Categorization
Social Order Social Isolation
Social Class
Child
5
A society who stigmatises people who experience a mental illness will result in
influencing children to do the same.
Mental illness stigma in children
Children, even at a young age, have been found to demonstrate negative attitudes and
behaviours toward people with mental or physical illness (Weiss, 1994). Shah (2004)
demonstrates that children as young as nine already show stigmatizing behaviour towards those
who experience a mental illness. In a study of 104 Grade 3 children, Adler and Wahl (1998)
found that although it was not clear that the children understood the word ‘mental illness’
specifically or even if the third graders understood the stereotypes related to the illness, the
children still demonstrated “negative expectations about mental illness” (p. 325). These children
labelled the people with a mental illness as dangerous, unpredictable, foolish, stupid and bad.
Link, Yang, Phelan and Collins (2004) reviewed published articles on mental illness
stigma research, written between January 1995 and June 2003. Of the 109 studies, only four
assessed mental illness stigma in children and adolescents. The two studies of interest to this
thesis are the one written by Wilson, Nairn, Coverdale and Panapa (2000), demonstrating salient
mental illness stereotypes in the cartoons that children watch every day, and the other by Adler
and Wahl (1998) showing that Grade 3 children did not understand the attributions of stereotypes
but knew that people with mental illnesses are “bad”. Four research articles reviewed by Link
and colleagues (2004) associated stereotyping as a stigma component in children and
adolescents.
6
Relevance of the proposed study
Children are exposed to a variety of negative stereotypes associated with mental illness.
They learn from the media that people who experience a mental illness should be feared and
locked away (Wahl, 2003). Although, children may not fully understand mental illness stigma,
research does show that children have negative stereotypes about mental illness and about those
who experience a mental illness. It is speculated that negative stereotypes about mental illness
that exist in society have contributed to children developing mental illness stigma, likely because
these stereotypes are learned early in their lives (Wahl, 2003). In this study, an exploration of the
effectiveness of providing children with literature that is aimed at counteracting the exposure to
negative stereotypes by educating them about mental illness was undertaken. Should the
education prove to be effective, it is hoped that these children will be less likely to discriminate
against those with mental illness and more likely to understand mental illness and to access
mental health care when and if required without fear of being stigmatized. At the very least, it is
important to assess the effectiveness of resources that claim to reduce mental illness stigma
before they are endorsed as tools to reduce mental illness stigma and to ensure that these
resources do not inadvertently reinforce negative stereotypes that lead children to stigmatize
(Chisholm, Patterson, Torgerson, Turner, & Birchwood, 2012).
7
Chapter 2
Literature Review
A search of the literature using Psych Info and MEDLINE databases with various stigma
key words, age birth to 13, restricted to the English language and journals from 2002 to 2010
revealed a paucity of knowledge related to children understanding of mental illness in general or
how mental illness stigma develops in children, 8 articles were found. This finding is not
dissimilar to the results of a study conducted in 2004, where a review of the literature using
stigma key words only revealed 4 studies pertaining to children (Link, Yang, Phelan, & Collins,
2004). Despite this gap in knowledge, anti-stigma strategies are being created and used without
prior evaluation to ascertain their effectiveness in decreasing children mental illness stigma.
Development of mental illness stigma in children
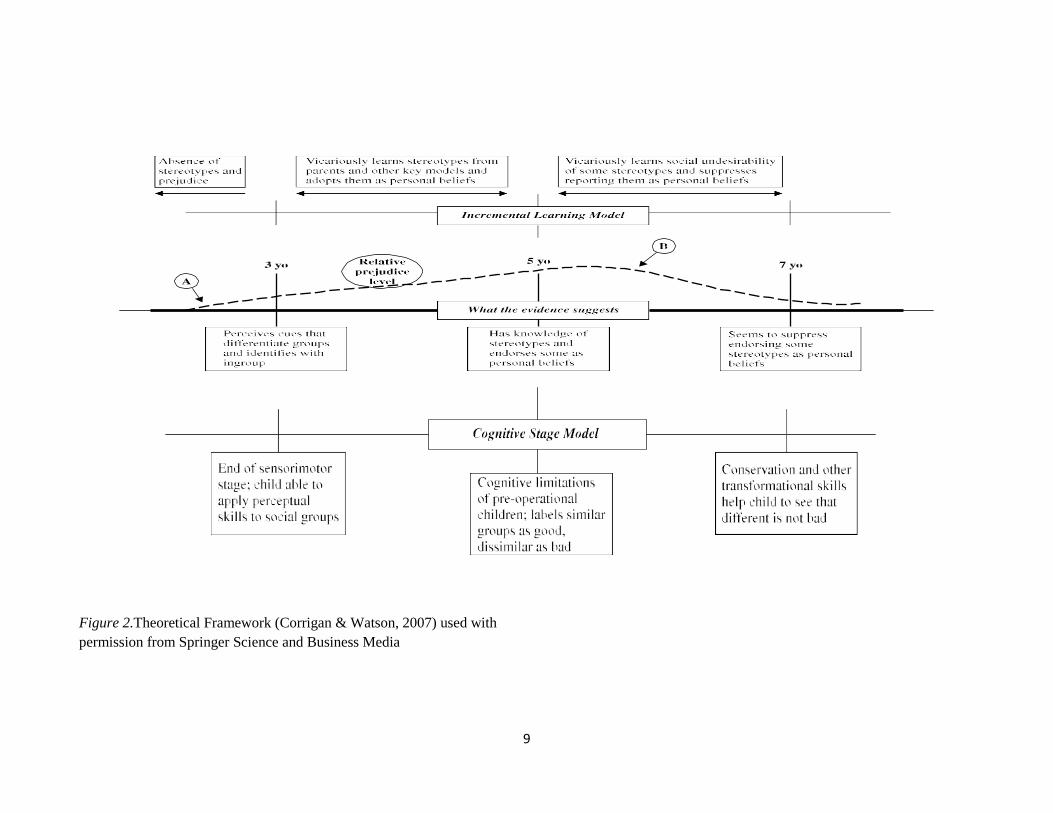
Corrigan and Watson (2007) present a compelling descriptor of how psychological
elements of stereotypes, prejudice and discrimination develop in children. They used children’s
sensorimotor stage and cognitive limitation phase to explain an incremental learning model of
stigma development in children. Figure 2 presents the theoretical framework for how children
begin stigmatizing. The dotted timelines show how perception, knowledge of stereotypes and
endorsement of the stereotypes are manifested in children ages 3 to 6 years of age. Children 8
years and older learn to suppress endorsing stereotypes as personal beliefs; they begin to form
their own beliefs; whereas prior to that age, younger children exposed to stereotype, endorsed
these stereotypes as personal beliefs vicariously (Corrigan & Watson, 2007). This framework
was used to select the age range for the student participants. By the age of 13, children have
formed their own views about stereotypes (Pinfold-Foltz & Logsdon, 2009). Therefore,

8
exploring those views and curtailing the negative views about mental illness through education
could prove to be very beneficial.
9
Figure 2.Theoretical Framework (Corrigan & Watson, 2007) used with
permission from Springer Science and Business Media
10
Media contribution to the development of mental illness stigma
Wahl (2003) conducted an analysis of studies that focused on depictions of mental illness
in children’s media. One study of media depictions of mental illness, more specifically, a study
that was conducted between 2000-2001 where researchers viewed 49 G (General Audience) and
PG (Parental Guidance) rated types of films found 24% of the actors were portrayed with a
mental illness and two-thirds of the mentally ill characters behaved badly. The messages in those
films conveyed to the viewer that those who experience a mental illness are violent,
unpredictable, “different,” and unlikely to recover. Other studies showed characters that are
labelled as mentally ill in children’s television shows that were frightening, irrational, and
aggressive towards other characters, reinforcing well-known North American societal
stereotypes. They committed crimes and were also involved in kidnapping and abducting the
“normal” characters. Wahl (2003) concluded that negative stereotypes are teaching children to
avoid those who experience a mental illness.
In a study by Wahl (2003) negative portrayals in children’s media were analyzed. They
found one in four films rated “G” (therefore, considered suitable for children) depicted a form of
“madness”. Many portrayed “crazy” characters with violence, aggression, and fear as major
themes. Secker, Armstrong and Hill (1999) found that young people, aged 15-18 feared those
with a mental illness. Could children’s understanding of mental illness be tainted by the frequent
exposure of negative stereotypical media portrayal in children’s television? Wahl (2003)
suggests that extensive exposures to negative portrayals of people who have a mental illness are
likely to have a strong negative influence on children, whose conceptions of the world are still
forming.

11
Lawson and Fouts (2004) posit that children who watch animated Disney films are
exposed to many more negative incidences of mental illness than they would be in their normal
day-to-day lives. For example, in Beauty and the Beast, the village people referred to Belle’s
father as being crazy and needing to be locked up. Dumbo’s “mad elephant mother” was killed.
In The Lion King, three hyenas were depicted as crazy, and the craziest one of all bit its own leg.
Considering that 85% of animated Disney films contain characters that are deemed to be acting
in crazy ways, children who are still forming views about those who have a mental illness are
subjected to those strongly reinforced negative stereotypes. Their study was specific to Disney
animated films; they did not compare their findings to other film makers. Lawson and Fouts
(2004) have linked negative stereotypes in children’s media, specifically Disney, with the
potential conceptualization of children’s mental illness stigma.
Anti-stigma strategies
A systematic review was conducted by Sakellari, Leino-Kilpi and Kalokerinou-
Anagnostopoulou (2011) to evaluate educational interventions in secondary education aiming to
improve students’ attitudes towards mental illness. They used Ovid interface, Medline (from
1950-2008), CINAHL (from 1982-2008), and with various key words pertaining to mental health
education, attitudes, students in schools, 149 references were found. Further search using psych
info yielded 504 references, when these were limited to English, students aged 12-18, only 12
articles were found. They found very limited educational interventions on improving mental
health attitudes. Worse yet, they found research on the effectiveness of educational interventions
aimed at improving children’s attitudes lacking rigor and generalizability. Moreover, of the
various types of educational materials used to decrease mental illness stigma in children, it is
difficult to know which one would be more effective.
12
There are numerous anti-stigma strategies that are currently being used to decrease
mental illness stigma in general. These include use of drama, technology and media. Protest,
personal contact, education, legislation, advocacy and stigma self-management are well
discussed in literature (Arboleda-Florez & Stuart, 2012). The use of education will be the focus
here. The first step in stigma reduction is education that may include presentations, discussions,
simulations, audiotapes films, targeting specific populations (Heijnders & Van Der Meij, 2006).
Mental illness stigma education aimed at children seemed promising in demonstrating positive
results in changing their views about mental illness (Pitre, Stewart, Adams, Bedard, & Landry,
2007). However, empirical evaluation of children’s storybooks in reducing mental illness stigma
is limited. Moreover, children’s books as a form of bibliotherapy to encourage a change of
attitudes in general has received mixed reviews, leading to the need for more research (Heath et
al., 2005).
Education
Adler and Wahl (1998) suggested developing elementary school curricula to provide
early mental health education in an attempt to curtail children’s progressive negative conceptions
of those who experience a mental illness. Those who believe that mental illness stigma can be
addressed in the school curriculum also acknowledge that “there is a strong need to further
develop and raise the standards of mental health education…in school children” (Hunt, 2008, p.
144). One of the barriers to curriculum development in schools that has been identified is related
to parents’ fear that mental illness education will frighten their children (De Socio, Stember, &
Schrinsky 2006). In addition, others report that when mental health/illness education is not
standardized or carefully crafted to meet the students’ needs, the opposite can occur; stigma is
reinforced (Essler, Stickley, & Arthur, 2006). Moreover, it is not known if delivering this

13
education using books is an effective method to teach children about mental illness or to reduce
mental illness stigma.
Education through various means is the most prevalent resource used to decrease mental
illness stigma among children (Essler, Arthur, & Stickley, 2006). Education is delivered through
a variety of methods such as drama, technology, media and the use of personal contact. Each of
these has shown various degrees of success among teenagers and adults. Education using books
received mixed reviews in terms of its success (Heath, Sheen, Leavy, Young, & Money, 2005).
The review will begin with an exploration of how mental illness stigma is developed in children.
Books have historically been used for various purposes. There are specific books for
entertainment, for education, for communication and more. Bibliotherapy refers to the use of
books for the purpose of promoting health, restoring a sense of self or for creating a sense of
reflective thinking (Pardeck, 1995; J. A. Pardeck, & J. T. Pardeck, 1997). When bibliotherapy is
used with children, the aim of the therapy is to successfully guide them through fundamental
stages that lead to building their own personal resources and coping skills (Heath, et al., 2005).
Books have also been used as tools to communicate or teach children about sensitive topics that
might be too delicate or potentially too painful for children to synthesize directly when these
topics relate specifically to their own situation. For example, books have been written to assist
children through loss or transition (Heath et al., 2005).
Psychologists have used children’s books to help children cope with anger management,
fear, adoption, foster care, moving, divorce (Brennan, 1990), alcohol abuse and more (Pardeck,
1995). However, the results and efficacy of evaluated children’s bibliotherapy have yielded
mixed reviews (Heath et al., 2005). For example, Wykes (2003) in her editorial review of

14
children’s books with a mental health theme, commented that certain children’s books
contributed to the stereotypes of mental illness by portraying the characters in the book as
frightening and unpredictable and cites a movement from behaviour to mental illness as a
motivation for what she calls, “despicable acts”, (p.309). Heath and her colleagues (2005)
recommend that further research be conducted to evaluate the effectiveness of using books as
interventions with children. They caution against using a book as a sole intervention, particularly
when social skills and attitude change are required. In addition, they further caution against the
use of books as magical fixes for child-related social issues. They also strongly suggest that
books must be carefully selected with storylines that are appropriate to the child’s emotional
needs and are suited to the child’s individuality, background and personal characteristics.
Theoretical framework
According to Corrigan and Watson (2007) ages three, five and seven demark
developmental periods that are significant with regards to the evolution of childhood impartial
prejudice and discrimination. Three year old children are already sensitive to cues that signal
group differences (Corrigan & Watson, 2007). They stigmatize anyone who appears different
than who they are. Five year old children demonstrate awareness of prevalent group stereotypes
and personally endorse them (Aboud, 2003; Augoustinos & Rosewarne, 2001). For example, in
Aboud (2003)’s study, white children demonstrated strong in-group preferences and were able to
identify social categories separating them from the black children. However, by the age of seven,
children begin to show a decrease in prejudicial endorsement despite their continued awareness
of certain negative societal stereotypes they learned about that specific group (Corrigan &
Watson, 2007).
15
According to Aboud (2003), the decrease in prejudicial endorsement is a result of a
developmental shift in children's cognitive abilities leading to less focus on group association to
an increased focus on specific individuals. Although Corrigan and Watson (2007) recommend
that additional studies be conducted, they hypothesize that older children are likely to begin to
form their own beliefs about whether or not to endorse stereotypes about mental illness by age
seven. I have chosen their framework to emphasize the developmental stage of readiness for
education to have an effect on stigma. According to Corrigan and Watson (2007), children can
suppress endorsing some stereotypes at age seven. As they begin forming their own views, they
are less vulnerable to vicarious endorsement of negative stereotypes (see Figure 2, above). This
rationale was used to select children 11-14 years of age in grades 6-8 because by this age, these
children have passed the stage of simple endorsement of societal prejudices to the stage of
forming their own opinions. Therefore, one could assume that any findings of mental illness
stigma would be deliberate prejudice expression of these children’s personal views. According to
Piaget’s (1972) Adaptation and Equilibrium Theory, adolescents are in the last phase of their
Formal Operational Stage of cognitive development. They can think with abstraction and use
logic to explain a point. The choices they make are deliberate.
As described throughout this document, negative mental illness stereotypes are
interwoven in societal views leading to untoward consequences for those with a mental illness.
Children demonstrate this negative consequence towards other children who display
psychological problems by displaying social distance from them. For example, Hennessy,
Swords and Heary (2007) reviewed the literature about children’s understanding of
psychological problems displayed by their peers; they found that children seek social distance
from other children who demonstrate psychological problems. They recommend conducting

16
research that will reveal the types of education that are more likely to maximize changes in
attitudes and transfer the sole responsibility of stigma from the individuals affected with the
psychological problems to those who stigmatize.
Link and Phelan (2001)’s conceptualization of mental illness stigma was also used to
frame the study because in their framework, the “stigmatizer” bears the responsibility for
stigmatizing. Their conceptualization of stigma begins with a negative label that leads to
negative stereotypes resulting in discriminatory behaviours grounded in the power imbalance
between the “stigmatizer” and the stigmatized. The theoretical framework of this study is based
on the facts that children 8 years of age and older can suppress endorsing stereotypes vicariously
and by age 11 they can bear the responsibility for stigmatizing or for choosing not to stigmatize.
The intent in conducting the study was to assess whether or not mental health education can alter
the negative stereotypes that produce mental illness stigma in children and change attitudes that
may lead to discriminatory behaviours such as social distance or intolerance towards those
children who experience a mental illness.
Statement of purpose
The purpose of this research was to assess a specific mental health educational book
geared for children 8 years and older for its effectiveness in decreasing mental illness stigma by
allowing children to learn about mental health/mental illness. In addition, children’s views
regarding reading and learning about mental illness using a storybook were elicited to determine
their perspectives on the book to assess their receptiveness to this intervention. An examination
of the feasibility of evaluating stigma reduction strategies among school age students using this
method was also conducted. If found to be effective, a recommendation would be made to

17
Opening Minds program of the Mental Health Commission of Canada to test the book more
widely as a potential tool to be used in elementary schools to teach children about mental illness
and to decrease mental illness stigma.
Research objectives
The objectives of the research were the following:
1. To evaluate whether exposure to age-appropriate anti-stigma storybook information
reduced mental illness stereotyping and social intolerance attitudes among school
children in grade 6 to grade 8;
2. To examine children’s perceptions of the anti-stigma storybook; and
3. To examine the feasibility of evaluating stigma reduction strategies among school age
children.

18
Chapter 3
Methods
Research Design
A quasi-experimental design was used with three measurement points; pre-test 1, pre-test
2 and post-test surveys. The pre-test/post-test design is suitable when change measurement is
required (Dimitrov & Rumrill, 2003). A comparison condition was created using the pre-tests.
The first pre-test (baseline) measurement was provided at approximately two weeks before the
study intervention. The second pre-test (pre-test 2) occurred immediately prior to the
intervention and the post-test measurement occurred immediately following the intervention
(Study Manoeuvre, Appendix A). The first pre-test was used to compare with the second pre-test
to establish a baseline condition before the intervention.
The intervention
The book, ‘He Shoots, He Scores’, was chosen from the Opening Minds anti-stigma
interventions available for investigation because it was written specifically “to educate and break
down the stigma and fears surrounding emotional, behavioural and neurodevelopmental
conditions and encourage a dialogue between children and their caregivers” (Grass, 2010). The
story is about a 13 year old boy who suffers stigma because he has a bipolar disorder. The book
shows how the boy overcomes self-stigma and how his friends support him through the process.
The book is available in many schools and has been endorsed by the following Canadian health
agencies: The Children’s Hospital of Eastern Ontario, The Provincial Centre of Excellence for
Child and Youth Mental Health, Dare to Dream program, eMentalHealth.ca, and
yoomagazine.net. Initial readability assessment was not performed; however, its use at a grade 3-

19
8 development level has been established. In order to remove confounding variables related to
reading speed, literacy levels and to ensure that the book was read in its entirety, the book was
provided to participants in both written and audiovisual formats simultaneously. The author of
the book created upon request, an audiovisual format of the “He Shoots, He Scores” storybook
that she read and recorded for the purpose of this study. The book took approximately 27
minutes to read from start to finish. I supervised the participants during the intervention period to
ensure compliance with either reading or attention to content provided. The audiovisual format
combined with the supervision standardized the intervention. The simultaneous presentation
ensured that the children had full exposure to the entire content of the book. I delivered the
intervention to all participants using the same scripted instruction for the children to follow as
described in the manoeuvre (Appendix A). No additional teaching or editorial comments were
made prior to or during the reading of the book.
Instrument
The Youth Opinion Survey (YOS) (MHCC, 2011, Appendix B & C), developed by
researchers working with the youth projects of the Opening Minds program to evaluate contact-
based education directed to middle and high school students (grade 7 to 12), was used as the
baseline, pre and post-test instruments. The YOS (MHCC, 2011) instrument was chosen because
it includes two major stigma domains: stereotypical attitudes and social intolerance. The
Stereotypes sub-scale contains four items related to Controllability, two items related to potential
for Recovery and five items for Potential for Violence and Unpredictability. The Social
Tolerance sub-scale contains seven items related to desire for Social Distance and four items
related to Social Responsibility for mental health issues. Some formatting changes were made to
the instrument to reduce the total number of pages to be used. The introduction section of the
20
instrument was changed to reflect the current study. A participant number space was inserted.
Open-ended questions were inserted in the post-test to reflect the relevance to the current study.
A pilot study to test the psychometric properties of the instrument was conducted in a
sample of 620 high school students matched surveys (MHCC, 2011) that participated in
programs designed to decrease mental illness stigma. The Stereotypes subscale was found to be
internally consistent with a Chronbach’s alpha of 0.85. Similarly, the Chronbach’s alpha for the
Social Tolerance subscale was 0.85. Psychometric testing including factor analysis for YOS total
score as a stable sum of the subscales is on-going and as such, the YOS was used with
permission from the Mental Health Commission of Canada.
The post-test included additional open and closed ended questions examining the
children’s perception of the storybook. Questions asked included: What did you like about the
book?; What did you not like?; What did you learn about mental illness?; Was the book easy to
read?; and, Did you enjoy reading it? These questions were used to further elucidate whether
the participants liked the book and whether they learned something about mental illness from
reading the book.
Given that the survey instrument was originally created by partner programs for the
Opening Minds initiative of the MHCC (2011) to evaluate programs administered to high school
students, a pilot test using the YOS (Appendix B & C) was conducted with a small group of 10
grade 7 and 8 participants ages 11-15 (one student in the group repeated grade 7 twice) to ensure
that the YOS (MHCC, 2011) survey measurement was appropriate to evaluate a book among this
age group.

21
In order to confirm the YOS was an appropriate instrument for my research study, a small
pilot group of participants was asked to participate in the research. The pilot test allowed time to
simply measure the duration of the study and to see if the questions on the YOS could be used to
evaluate the storybook. The pre-test took 5 minutes and the post-test 10 minutes to complete
without questions or concerns voiced.
Parental demographic questionnaires
The parents were asked to circle their age group, 25 or under; 26 – 40; 41 – 55, 56 or
older, to identify their gender and their primary language. They could select English, French,
Spanish, or other. They were asked about their level of education and could select elementary,
high school or equivalent, some college/universities, college diploma, undergraduate degree,
graduate degree, professional degree (MD, JD, etc.) with an option to handwrite their own
responses under separate category labeled, ‘other’. The parents were also asked, what is your
origin? They could select either Arab, Asian/Pacific Islander, black, Caucasian/white, Hispanic,
Indigenous or Aboriginal, Latino, Multiracial, would not say, or other. They were also asked
which of the following best described the location of their residence: they could select, urban,
suburban or rural. These questions will be useful for future analysis but also provide additional
contextual information on the participating students.
Sample and setting
The study originally targeted students in grades 7 and 8; however, in order to
accommodate a combined grade 6 and 7 class, a small grade 6 group was included. A
convenience sample of grade 6 to 8 children aged between 11 and 14 was sought from various
schools in the south-east and central-east areas of the province of Ontario. The selection of the

22
schools was based on school board acceptance, school principal acceptance and classroom
teacher acceptance. Once these approvals were received, the study was conducted within that
school.
Inclusion and exclusion criteria
All participants, boys and girls ages 11-14 in grades 6 and 8 who could read and write in
English, who were willing to participate, and who had obtained parental or guardian’s consent to
participate were included in the study. Given the age group, Queen’s University Ethics Board
specifically required that the participants provide their written consents as well (see Figure 3,
p.27 Flow of participants for final number of participants).
Prior exposure to the storybook was an exclusion criterion. None of the potential
participants screened reported exposure. All spoke English; therefore, none were excluded from
participating.
The sample
The estimated sample size was based on previous work completed by the school-based
programs done for the Mental Health Commission of Canada (MHCC, 2011). The school-based
programs study used a two-sample comparison of YOS scores following an anti-stigma
intervention with 620 high school students. Mean total YOS scores for the school based
programs were 36.6±6.5 and 33.1±7.2 for usual care and intervention groups respectively and are
consistent with a small effect size (Cohen, 1988). Using a small effect size, the calculated sample
size for this study was 81 participants (alpha=0.05, power=80%). Pinfold and her colleagues
(2003) conducted an evaluation of an education intervention in the UK; they found a small but
23
positive change in attitude. Therefore, the sample size was calculated to ensure that a small
change in attitude could be detected. In the study they conducted with the secondary school
students; they used similar survey method and reported a 74% response rate (Pinfold,
Thornicroft, Huxley, Farmer, & Graham, 2003). Therefore, the total sample size of 102 was
required for this study to account for a 26% attrition rate.
Data collection/Management/Analysis
Information pertaining to school location, class or community location was collected and
kept separate from the completed surveys. Pre-test 1 was administered two weeks before the
intervention and again the same pre-test now pre-test 2 was given immediately before the
intervention. The post-test was administered immediately following the intervention in
designated locations, assigned by each school. The pre-tests were matched with the repeated pre-
test, post-test and the parent demographic questionnaire, where appropriate. Consent forms were
kept in a separate sealed confidential envelope, locked in a filing cabinet and kept behind locked
doors in an office at the Centre for Health Services and Policy Research (Mental Health and
Anti-Stigma Research Program) within the Department of Community Health and Epidemiology
at Queen’s University. After the analysis, the forms continue to be kept separately in a sealed
envelope locked separately in a filing cabinet. On the day of the first data collection, upon
receiving the student consent package, a preprinted label sheet with 4 stickers with a unique
number on each sticker was applied to the right top corner of the 2 pre-tests, the post-test,
consent and parent questionnaire which I kept. The teacher placed the unique number by the
student’s name and kept the list of the students who were given permission to participate;
therefore, the numbers were easily assigned to the right student. I did not keep a list of
participant names and the teacher did not keep any documents with the unique numbers. Once
24
the study was completed and the data analyzed, the participants’ names were shredded as per
school practices. Prior to conducting the study, the parent demographic questionnaire which
contained relevant questions about age, gender, language spoken, education, culture, religion was
sent home with an information/consent form and a return sealable envelope with the unique
identifier number clearly marked on each document. Once the data were collected, the results
were combined into one group, with the school source not being a factor in tabulating the results.
There are various ways in which the effect of the storybook intervention could be
measured. In order to provide a measure of the overall effectiveness of the intervention in
reducing stigma and in keeping with the approach taken by the Mental Health Commission of
Canada, (a priori) a cut-off score of 80% correct (non-stigmatising responses) was selected to
measure its impact on the participants. The 80% cut-off was chosen somewhat arbitrarily, but is
in keeping with an excellent mark achieved at school for an assignment. Therefore, an 80% score
was used to determine the number of participants who achieved an “A” grade or higher (usual
equivalent of 80% for school work) following an educational session. More specifically, success
was measured by comparing the proportion of participants who obtained 80% or more correct
(non-stigmatizing) answers on the post-test compared to the pre-test.
A Feasibility Questions Logbook (Appendix D) was kept as soon as ethics approval was
received to document the process, obstacles and barriers related to the feasibility of this quasi-
experimental research method. The logbook guideline presents the feasibility questions that were
addressed in this study.

25
Survey and narrative responses
Baseline Demographic and YOS questionnaire data were entered into a database which
had been configured to include logic and range checks. Statistical analyses were performed using
SPSS 20 (IBM Corp., Released 2011). Baseline demographic information was presented using
descriptive statistics: means, standard deviations and frequencies where appropriate. Scaled YOS
questionnaire data are presented using descriptive statistics for the subscales: Stereotypical
Attitudes and Social Tolerance. Individual questionnaire items are presented using frequencies
and categorized by response depending on the distribution of the data. The main analysis of YOS
total and subscale scores employed a repeated measures analysis of variance (RM-ANOVA)
given that the data were normally distributed and all other assumptions of this test were not
violated. A non-parametric alternative was used where required or if categorization of the data
was necessary.
For ease of measurements and presentation, “strongly agree” and “agree” were combined
since the two meant that the student agrees with the statement. “Strongly disagree” and
“disagree” were also combined because both meant disagreement with the statements. After
collapsing the five Likert levels “strongly agree”, “agree”, “unsure”, “strongly disagree” and
“disagree” into three categories (combining “strongly agree” with “agree” and “strongly
disagree” with “disagree”), I began the analysis.
Narrative data provided by participants in the Post-Test YOS was abstracted from the
questionnaires verbatim, recorded and verified twice and analyzed using simple content analysis.
This method of analysis was used because no formal qualitative research tradition was used. A
simple content analysis of the narrative data obtained from responding to the feasibility questions
26
was performed. Instead of proscribing to a qualitative thematic methodology, I stayed true to the
data and exercised flexibility to provide detailed responses related to the open-ended questions.
Holloway and Todres (2003) reinforce the importance of choosing flexibility to analyze
qualitative data in its richest form rather than committing to methods that may not be suitable to
achieve accurate responses to the post-test questions.
The raw data provided by participants in the post-test YOS was abstracted from the
questionnaires verbatim, recorded and placed where it fitted into subcategories derived from the
YOS instrument, verified twice and coded. The codes, similar to simple content analysis coding
used in Graneheim and Lundman (2004), were identified and placed in a table showing the
codes, sub-category and category of either stereotype or social distance.
At the beginning of the analysis, all words from all three tests were used to perform the
content analysis. However, in order to avoid inflating the number of words used at pre-tests,
only pre-test two was used to compare with the post-test. This process is in alignment with the
selection of pre-test two as the test comparator for the quantitative analysis. In addition, it was
previously established that the differences between pre-test one and pre-test two were not
statistically significant. Therefore, using pre-test two as a comparator for the post-test is deemed
appropriate. Words that represented less than 10% of the total number of participants who wrote
pre-test two and post-test were not included in the tabulation of words used. For example, words
used only once or twice were not counted. Words that appeared more than 10 times, which
represented approximately 95% of the total participant responses, were included in the count.
Words at pre-test such as “mental” and “mental illness” with any combination of
“mental” with another word were counted together. Words such as ill and sick were counted

27
together. Sad and depression were counted together. Special and weird were counted together.
Different and unique were counted together (see Table 14). Words at post-test such as disabled
and someone with a disability were counted together. Words such as illness and sick were
counted together. Words such as sad, kind of sad and depressed were counted together. Words
such as different, unique, one of a kind and sometimes different were counted together. Words or
statements like, need help, get taken care of, in need or want to help them were counted together.
Words such as normal, like us, same as us, similar to us and not different were counted together.
Ethics
Ethics approval was obtained from the General Research Ethics Board (GREB) at
Queen’s University after the removal of one question from the YOS. The question, “do you have
a mental illness?” was removed because it was deemed sensitive and potentially distressing for
the respondents. Ethics approval was originally granted to conduct the study with students in
grades 7 and 8 (Appendix E). I sought additional approval to include grade 6 students because
one class was a combined grades 6 and 7 cohort class. In addition I received approval from the
two school boards where the study was conducted: Limestone District School Board (Appendix,
F) and Hastings and Prince Edward County ethics committees (Appendix, G); this was done to
ensure the proposed procedures were conducted in ethically appropriate ways and according to
each jurisdiction’s own requirements. Additional permission was sought from school principals,
homeroom grade 6, 7 and 8 teachers and parents. Despite approval from the school boards, the
principals could choose not to take part in the study. Similarly, even when a school principal
accepted to have the study conducted in their schools, the teachers also could choose not to
participate as well. A teacher recruitment poster (Appendix H) was sent to the schools where
approval was given by the school principals to solicit teacher participation prior to contacting the

28
parents. After a full explanation of the process and the purpose of the research were provided to
the interested teachers by phone calls and or e-mails, those who accepted to have their students
participate in the study sent their students home with a research package. There was no stipend
or financial compensation provided to the participants. Where the research occurred during lunch
hour and according to school policies and approvals, a pizza lunch was offered at no cost to the
participants.
The research package included letters describing the study and consent forms for teachers
(Appendix I), parental consent forms (Appendix J) for their own participation in completing the
demographic questionnaire, parental demographic questionnaires (Appendix K) and consent
forms (Appendix L) for their students to take home. The parents received a separate consent
form for their own participation in completing the demographic questionnaire. The
information/consent form outlined the purpose of the investigation and provided an explanation
of the likely benefits and the potential for the need for debriefing with the groups immediately
following the research. The parent/guardian kept the information section of the consent form for
future reference and returned the consent form section to the school.
Electronic consents were not used in order to keep the process similar for all schools and
all parents. Some parents may not have had access to the internet and may have chosen to not let
their child participate if the process was too cumbersome. The students who were willing to
participate and who had obtained consent from their parents were gathered in groups as selected
by their teachers.
Participation was strictly voluntary. Participants could withdraw at any time before or
during the study. Subjects’ privacy and confidentiality were protected by assigning a numerical
29
value to each interview document, instead of inscribing the children’ names on the
questionnaires. After the post-test, when I asked the participants if they had any questions or
concerns about the content of the study, none were voiced by anyone one of them. A certificate
of appreciation (Appendix M) for completing the study was given to each participating student,
if he or she wanted one.
In addition, each school that participated in the study received a box of books donated by
the author for its school library. Once the study was completed, thank you notes and cards were
provided to the schools’ teachers, principals and school boards as tokens of appreciation.

30
Chapter 4
Results
The results of the analysis are organized into several sections. The first section focuses
on the demographic characteristics of the sample. The second section focuses on responding to
the primary research question, can a storybook reduce mental illness stigma in children?
Thirdly, the participants’ hand written responses were analyzed to glean understanding of their
opinions about mental illness and their views about the intervention. Lastly, the feasibility of the
study is analyzed and recommendations are made for future studies.

31
Demographic characteristics of the sample
The flow diagram in Figure 3 shows the attrition of study participants.
Consent packages sent home with
parental demographic
questionnaires (n=250)
Returned packages (n=161)
Students
Total Excluded (n=13)
Did not return signed consents (n=11)
Teacher did not allow participation (n=2)
Parents
Total Excluded (n=39) Did not return parental demographic questionnaires
Students (n=148)
Parents who completed questionnaires (n=122)
Did not complete baseline test (n=7)
Did not complete test 2 (n=13)
Did not complete post-test (n=14)
Students who completed all three tests (n=127)
Total students who completed all three tests
with parental questionnaire (n=107)
Figure 3. Flow of participants to final number of participants

32
Of the packages sent home with the students, as seen in Figure 3, 64.4% were returned
indicating parental interest in their children participating in the study, but only 59% included a
completed parental consent form; 76% of parents (n=122) who returned the package also agreed
to participate in the study and completed the parental consent form, even though some of their
children did not participate in all three tests. The sample of 161 who returned the package was
reduced for various reasons, the most common being a failure to return both the student’s and the
parental consent forms.
Another situation contributing to the reduction in potential study participants occurred in
two cases where parental consent was received for a student to participate in the study. In each
instance, the teacher chose not to allow the students to participate because of their low reading
and comprehension levels, as well as the potential risk of behaviours that the teachers feared
could not be managed during the participation period of the research. Therefore, these two
students were excluded.
Ultimately, only a little over half (50.8%) of the total potential participants completed all
three questionnaires required to complete the study. A breakdown of the participant attrition is
provided in Figure 3.
Seven students did not complete the pre-test (baseline), 13 did not complete pre-test 2
and 14 did not complete the post-test. However, these numbers may include the same student
twice, for example one student may not have completed pre-test 1, 2 and 3. That student would
be counted within the 7, 13 and 14 participants who did not complete the tests. After attrition, the
study yielded 127 participants matched tests which represent well above the targeted 102 sample
33
required to detect a small change. Of the 127 participants who completed all three tests, 107 have
parental baseline characteristics information.
Participant characteristics
Characteristics of the students who participated in the study are presented in Table 1. The
geographical area where the study was conducted does not have as diverse a population as would
a major city like Toronto. Nevertheless, the process still yielded a heterogeneous sample of
participating students between the ages of 11 to 15 years.
The study originally targeted students in grade 7 and 8. However, a mixed class of grade
6 and 7 led to the initial inclusion of 10 grade 6 student participants. Of the 10, only 7 were
included as three did not complete all three tests. In total, of the students who completed all three
tests (n=127), there were slightly greater numbers of female participants than males; females
represented 54% whereas males represented 46%. The majority of the participants, 68%, were in
grade 8 and almost half of the group (49.6%) were 13 years of age. The proportions of
participants who completed one or more tests were similar to those who completed all three tests.
Those who did not write all three tests were absent on one of the days when the tests were given.

34
Table 1
Participants’ Characteristics Baseline Demographics
Participants
completing 1 or
more test
n=148 (%)
Participants
completing 3
tests
n=127 (%)
Age
11 6 (4.1) 5 (3.9)
12 33 (22.3) 30 (23.6)
13 76 (51.4) 63 (49.6)
14
15
32 (21.6)
1 (0.7)
29 (22.8)
Gender
Male 71 (48.1) 58 (45.7)
Female 77 (51.9) 69 (54.3)
Grade
6 8 (5.4) 7 (5.5)
7 39 (26.4) 34 (26.8)
8 101 (68.2)
86 (67.7)
35
Parental characteristics
Just over three quarters of the parents who provided consent for their children to
participate in the study (76%) also consented to complete the parental demographic
questionnaire.
Of those whose children completed all three tests (n=107), 80.3-81.3%% were completed
by a female parent. Among the 107 parents whose children completed the three tests, 95.3%
selected English as the language spoken at home and 90.5% described themselves as being
Caucasian. The parents’ educational background varied widely, with 39% indicating they have a
college diploma. There is only a slight difference in distribution of those selecting the location
of their residence as being located in an urban area (32.7%), a suburban area (35.6%), and a rural
area (31.7%).

36
Table 2
Parental Demographic Characteristics
Parents Parents of
total final sample
n=122 n=107
Age
<25 10 (8.2) 9 (8.4)
26-40 46 (37.7) 38(35.5)
41-55 64 (52.5) 58 (54.2)
56 > 2 (1.6) 2(1.9)
Gender
Female 98 (80.3) 87 (81.3)
Male 24 (19.7) 20 (18.7)
Language
English 116 (95.1) 102 (95.3)
French 1 (0.8) 1 (0.9)
Other 5 (4.1) 4(3.7)
Education
Elementary 10 (8.3) 9 (8.6)
High School or Equivalent 21 (17.5) 18 (17.1)
Some College/University 14(11.7) 10 (9.5)
College Diploma 47 (39.2) 41 (39.0)
Undergraduate Degree 13 (10.8) 12 (11.4)
Graduate Degree 9 (7.5) 9 (8.6)
Professional Degree (MD) 5 (3.0) 5 (4.8)
Other 1 (0.6) 1 (1.0)
Origin
Arab 2 (1.7) 2 (1.9)
Asian/Pacific Islander 1 (0.8) 1 (1.0)
Caucasian/white 109 (90.8) 95 (90.5)
Indigenous or Aboriginal 1 (0.8) 1 (1.0)
Multiracial 2 (1.4) 2 (1.9)
Would rather not say 1 (0.8) 1 (1.0)
Other 4 (3.3) 3 (2.9)
Residence
Urban 40 (33.6) 34 (32.7)
Suburban 42 (35.3) 37 (35.6)
Rural 37 (25.0) 33 (31.7)

37
There is a 5% change in demographic characteristics between the total parent participants
who responded to the questionnaires (n=122) when compared with the number of parents (107)
whose children completed all three required tests.
Knowledge of someone with a mental illness
The question, “Do you know someone who has a mental illness?” was asked on both the
student participants’ questionnaires as well as the parental questionnaires. The responses are
provided in table 3; 71.8% of all the participants who responded (n=103) to the question, said
yes. This percentage is slightly higher for the parents (84.1%) whose children completed all
three tests (n=107).
Table 3
Knowledge of Someone with a Mental Illness
Know someone with a mental
illness (pre-test 1)
Participants
n= 107 (%)
Parents
n = 107 (%)
Yes 74 (71.8) 90 (84.1)
No 12 (13.9) 15 (14.0)
Uncertain 17 (16.5) 2 (1.9)
No response 4 (3.7) 0
Primary research question
Table 4 shows for each subscale where there are statistically significant differences
between pre-test one and the post-test, and between pre-test two and the post-test, with a p-value
<0.01 indicating that the change occurring after the intervention did not occur by chance.
There was a statistically significant difference in stereotype and social distance subscale
scores following the intervention: F=24.79 (df 1.59), p<.01: F=12.20(1.83), p<.01 respectively.

38
There was no significant difference between pre-test one and pre-test two for the stereotype and
social distance subscale scores (p=.09 and p=1.00 respectively). However, there was a
statistically significant difference between pre-test one and the post-test for both subscales
(Stereotype mean difference = 3.77, p<.01: Social Distance mean difference = 1.61, p<.01).
Similarly, there was a significant difference between pre-test two and the post-test (Stereotype
mean difference = 2.46, p<.01: Social Distance mean difference = 1.93, p<.01) (see Table 4).
The entire YOS questionnaire has not been tabulated into one scale for measurement
purposes. The stereotype and social distance subscales are measured separately. The Cronbach’s
Alpha measurement for each subscale is 0.849 for the 11 stereotype items and 0.849 for 11 the
social distance items.
Table 4
Participants YOS Subscale Comparisons
(n) Pre-test 1
Mean (SD)
Pre-test 2
Mean (SD)
Post-test
Mean (SD)
Stereotype (112) 26.37(7.17) 25.07(6.56) 22.61(7.11)*
Social Distance (109) 24.78(6.22) 25.10(6.29) 23.17(6.54)*
*pre-test 1 and post-test p<.01; pre-test 2 and post-test p<.01
A detailed analysis was conducted to identify the effect of the intervention on specific
stigmatizing statements. This analysis further elucidated the statements where the participants’
responses were either more or less stigmatizing. The tabular analysis performed in Tables 5 and
6 show items where the participants were already non-stigmatizing and it shows percentage of
change from pre-test to post-test. A descriptive frequencies analysis was conducted to present the
direction of change in each of the items in the subscales (Table 5). The differences between pre-
test two and post-test were tabulated using only the participants who answered all of the
39
questions. Baseline pre-test one was not used for this analysis. The baseline test was used as a
control to demonstrate that the children’s opinions did not change between the baseline pre-test 1
and test 2. Pre-test 2 was used for all comparative analysis made with the post-test.
For most items in each scale, an increase in the number of participants who at post-test
disagreed with the stigmatizing statements is supportive of the stigma reducing effects of the
intervention. Similarly, for most items, a decrease in the number of participants who agreed with
the stigmatizing statements at pre-test should also decrease at post-test if the intervention is
effective. The direction, however, is reversed for some items and agreeing with the statement is
the non-stigmatizing response.
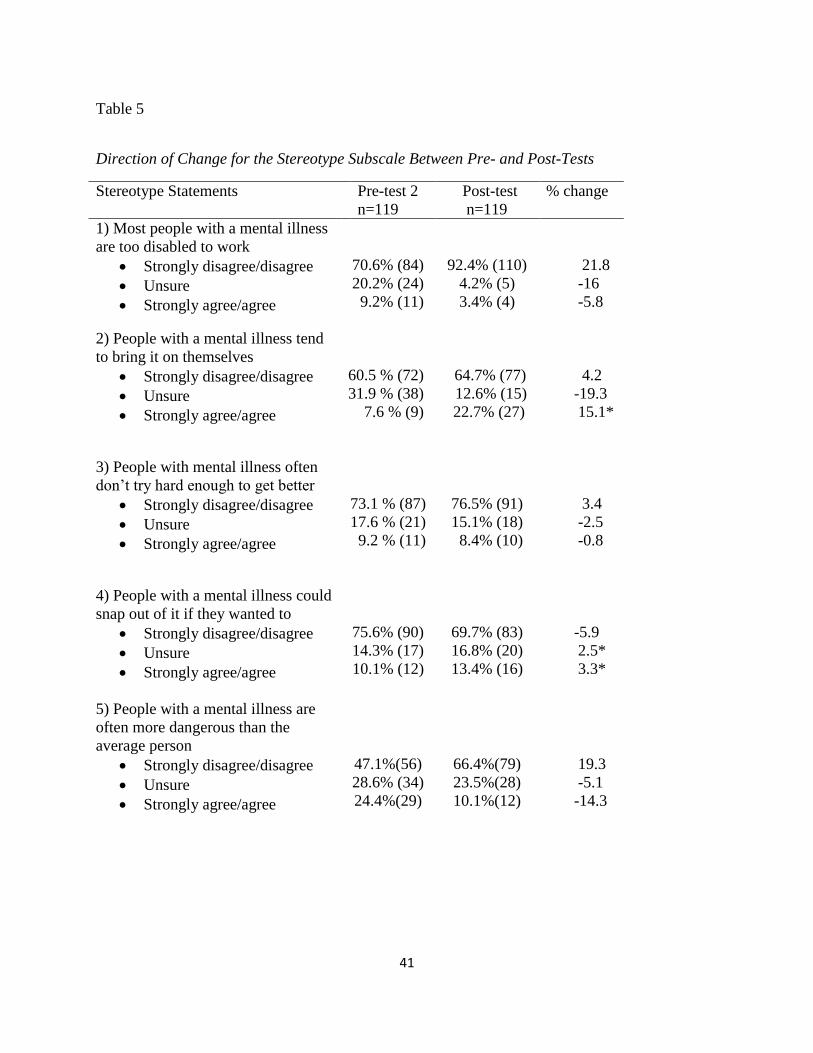
Changes within the stereotype and social distance subscale
As described in Table 5, the direction of percentage of change for the Stereotype subscale
between tests is calculated to evaluate the percentage of change observed. They are presented
below in order of significance. A positive change (less stereotyping) around 20% was found
between the pre-test and the post-test in the number of participants in responses to the following
statements: “Most people with a mental illness are too disabled to work” (21.8% improvement);
“People with a mental illness are often more dangerous than the average person” (19.3%); “You
can't rely on someone with a mental illness” (17.7%). A more modest positive change of about
10% is noted between the pre-test and the post-test in the number of participants who disagreed
with the following statements: “Most violent crimes are committed by people with a mental
illness” (10.9%); “People with a mental illness often become violent if not treated” (10.1%);
“You can never know what someone with a mental illness is going to do” (13.4%). For this last
statement, in addition to the positive change of those who disagreed, there is also a 21.8%
decrease noted in the number of participants who originally agreed with the stereotype: “You can
40
never know what someone with a mental illness is going to do”. Fewer participants agreed at
post-test, reinforcing the change. A lesser change is noted, (less than 10%) for the following
statements: “People with a mental illness tend to bring it on themselves” (4.2%); “People with
mental illnesses often don't try hard and enough to get better” (3.4%); “people with a mental
illness could snap out of it if they wanted to” (5.9%); “most people with a mental illness get
what they deserve” (4.2%) ; “people with serious mental illnesses need to be locked away”
(6.8%).
Contrary to the expected outcome, however, there was an increase in the number of
participants who agreed that “people with a mental illness tend to bring it on themselves”
(15.1%) following the intervention. There were also slight increases in the number of
participants who selected “unsure” and “agree” at post-test with the statement, “People with a
mental illness could snap out of it if they wanted to” with a 2.5% increase in those who were
unsure and a 3.3% increase in those who agreed with the statement. Similarly to the unexpected
outcome seen for the previous question, a 1% increase is noted for the statement, “Most people
with a mental illness get what they deserve” (0.9%), the latter represents only one student’s
response.
41
Table 5
Direction of Change for the Stereotype Subscale Between Pre- and Post-Tests
Stereotype Statements Pre-test 2
n=119
Post-test
n=119
% change
1) Most people with a mental illness
are too disabled to work
Strongly disagree/disagree
Unsure
Strongly agree/agree
70.6% (84)
20.2% (24)
9.2% (11)
92.4% (110)
4.2% (5)
3.4% (4)
21.8
-16
-5.8
2) People with a mental illness tend
to bring it on themselves
Strongly disagree/disagree
Unsure
Strongly agree/agree
60.5 % (72)
31.9 % (38)
7.6 % (9)
64.7% (77)
12.6% (15)
22.7% (27)
4.2
-19.3
15.1*
3) People with mental illness often
don’t try hard enough to get better
Strongly disagree/disagree
Unsure
Strongly agree/agree
73.1 % (87)
17.6 % (21)
9.2 % (11)
76.5% (91)
15.1% (18)
8.4% (10)
3.4
-2.5
-0.8
4) People with a mental illness could
snap out of it if they wanted to
Strongly disagree/disagree
Unsure
Strongly agree/agree
75.6% (90)
14.3% (17)
10.1% (12)
69.7% (83)
16.8% (20)
13.4% (16)
-5.9
2.5*
3.3*
5) People with a mental illness are
often more dangerous than the
average person
Strongly disagree/disagree
Unsure
Strongly agree/agree
47.1%(56)
28.6% (34)
24.4%(29)
66.4%(79)
23.5%(28)
10.1%(12)
19.3
-5.1
-14.3
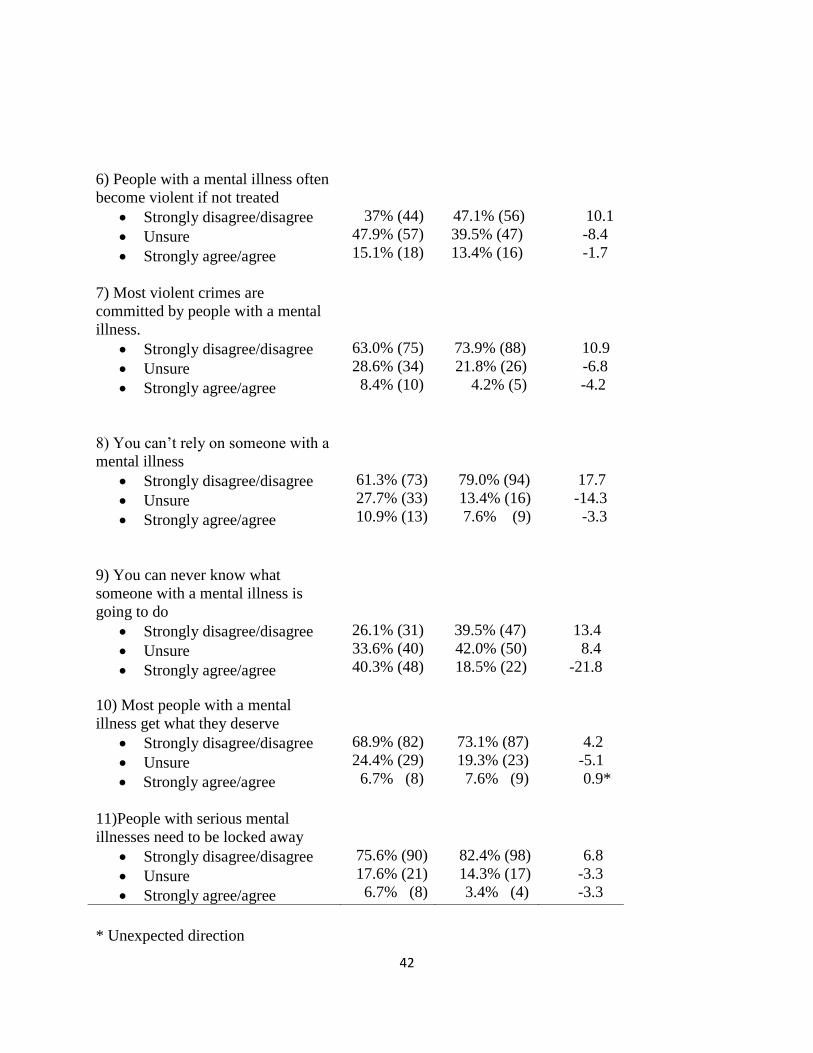
42
* Unexpected direction
6) People with a mental illness often
become violent if not treated
Strongly disagree/disagree
Unsure
Strongly agree/agree
37% (44)
47.9% (57)
15.1% (18)
47.1% (56)
39.5% (47)
13.4% (16)
10.1
-8.4
-1.7
7) Most violent crimes are
committed by people with a mental
illness.
Strongly disagree/disagree
Unsure
Strongly agree/agree
63.0% (75)
28.6% (34)
8.4% (10)
73.9% (88)
21.8% (26)
4.2% (5)
10.9
-6.8
-4.2
8) You can’t rely on someone with a
mental illness
Strongly disagree/disagree
Unsure
Strongly agree/agree
61.3% (73)
27.7% (33)
10.9% (13)
79.0% (94)
13.4% (16)
7.6% (9)
17.7
-14.3
-3.3
9) You can never know what
someone with a mental illness is
going to do
Strongly disagree/disagree
Unsure
Strongly agree/agree
26.1% (31)
33.6% (40)
40.3% (48)
39.5% (47)
42.0% (50)
18.5% (22)
13.4
8.4
-21.8
10) Most people with a mental
illness get what they deserve
Strongly disagree/disagree
Unsure
Strongly agree/agree
68.9% (82)
24.4% (29)
6.7% (8)
73.1% (87)
19.3% (23)
7.6% (9)
4.2
-5.1
0.9*
11)People with serious mental
illnesses need to be locked away
Strongly disagree/disagree
Unsure
Strongly agree/agree
75.6% (90)
17.6% (21)
6.7% (8)
82.4% (98)
14.3% (17)
3.4% (4)
6.8
-3.3
-3.3

43
Changes within the social distance subscale
The majority of participants demonstrated social acceptance at pre-test. For example,
85.2% of participants selected that they strongly agree with the statement, “I would stick up for
someone who had a mental illness if they were being teased”, and 84.3% of participants selected,
“I would tell a teacher if a student was being bullied because of their mental illness”. Three
quarters of them selected disagreed with the statement, “I would try to avoid someone with a
mental illness”. Nevertheless, a positive change (less desire for social distance) of almost 15% is
noted between the pre-test and the post-test in the number of participants who disagreed with the
following statements: “I would not be taught by a teacher who had been treated for a mental
illness”, and 11.3% of student participants selected, “If I knew someone had a mental illness, I
would not date them”. A 10% improvement is also seen with the two following statements, “I
would be upset if someone with a mental illness always sat next to me in class”; “I would
volunteer my time to work in a program for people with mental illness”.
Contrary to the positive change seen with the selected responses for the statements listed
above, the two following statements did not improve at post-test, but showed a slight increase in
the stigmatizing selection. Slightly fewer participants (3.4%) strongly agreed with the statement,
“I would tell a teacher if a student was being bullied because of their mental illness”. Also,
fewer participants (2.6%), selected agreed with the statement, “I would stick up for someone
who had a mental illness if they were being teased” at post-test. Although fewer participants
remained unsure at post-test, there continued to be a significant number of participants who were
still unsure of their responses at post-test. For example, almost half of the participants (49.6%)
continued to be unsure at post-test when selecting their responses to the statement, “If I knew
someone had a mental illness I would not date them”. Similarity, 36.5% of participants remained

44
unsure when selecting their responses to the statement, “I would volunteer my time to work in a
program for people with a mental illness”.
Overall, fewer participants were unsure at post-test, except for a slight increase (1.7%) in
the number of participants who were unsure when selecting the response to, “I would tell a
teacher if a student was being bullied because of their mental illness”, and there was a 1.7%
increase in the number of participants who remained unsure when selecting a response to, “I
would stick up for someone who had a mental illness if they were being teased”.
A slight increase was seen in the number of participants who disagreed with the
following statements: “I would stick up for someone who had a mental illness if they were being
teased” 0.9%; “I would tell a teacher if a student was being bullied because of their mental
illness” 1.7%; “I would volunteer my time to work in a program for people with mental illness”
1.8%; the largest increase observed for the selection of strongly disagree with this statement, “I
would tutor a classmate who got behind in their studies because of their mental illness” 4.3%.
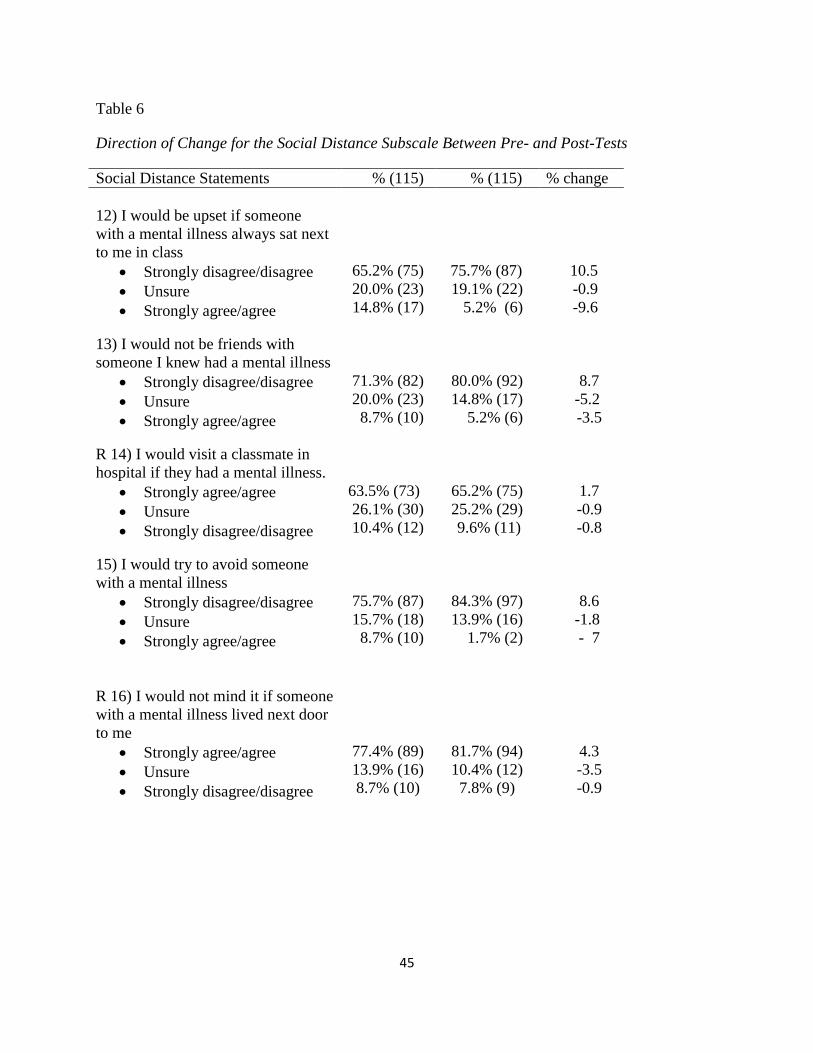
45
Table 6
Direction of Change for the Social Distance Subscale Between Pre- and Post-Tests
Social Distance Statements % (115) % (115) % change
12) I would be upset if someone
with a mental illness always sat next
to me in class
Strongly disagree/disagree
Unsure
Strongly agree/agree
65.2% (75)
20.0% (23)
14.8% (17)
75.7% (87)
19.1% (22)
5.2% (6)
10.5
-0.9
-9.6
13) I would not be friends with
someone I knew had a mental illness
Strongly disagree/disagree
Unsure
Strongly agree/agree
71.3% (82)
20.0% (23)
8.7% (10)
80.0% (92)
14.8% (17)
5.2% (6)
8.7
-5.2
-3.5
R 14) I would visit a classmate in
hospital if they had a mental illness.
Strongly agree/agree
Unsure
Strongly disagree/disagree
63.5% (73)
26.1% (30)
10.4% (12)
65.2% (75)
25.2% (29)
9.6% (11)
1.7
-0.9
-0.8
15) I would try to avoid someone
with a mental illness
Strongly disagree/disagree
Unsure
Strongly agree/agree
75.7% (87)
15.7% (18)
8.7% (10)
84.3% (97)
13.9% (16)
1.7% (2)
8.6
-1.8
- 7
R 16) I would not mind it if someone
with a mental illness lived next door
to me
Strongly agree/agree
Unsure
Strongly disagree/disagree
77.4% (89)
13.9% (16)
8.7% (10)
81.7% (94)
10.4% (12)
7.8% (9)
4.3
-3.5
-0.9

46
*Unexpected direction *** (R) Signifies the item was reverse coded in the scale calculation. Strongly agree is at the top.
17) If I knew someone had a mental
illness I would not date them
Strongly disagree/disagree
Unsure
Strongly agree/agree
27.0% (31)
50.4% (58)
22.6% (26)
38.3% (44)
49.6% (57)
12.2% (14)
11.3
-0.8
-10.4
18) I would not want to be taught by
a teacher who had been treated for a
mental illness
Strongly disagree/disagree
Unsure
Strongly agree/agree
57.4% (36)
28.7% (33)
13.9% (16)
72.2% (83)
19.1% (22)
8.7% (10)
14.8
-9.6
-5.2
R 19) I would tell a teacher if a
student was bullied because of their
mental illness
Strongly agree/agree
Unsure
Strongly disagree/disagree
84.3% (97)
12.2% (14)
3.5% (4)
80.9% (93)
13.9% (16)
5.2% (6)
-3.4 *
1.7
1.7
R 20) I would stick up for someone
who had a mental illness if they
were being teased
Strongly agree/agree
Unsure
Strongly disagree/disagree
85.2% (98)
12.2% (14)
2.6% (3)
82.6% (95)
13.9% (16)
3.5% (4)
-2.6 *
1.7
0.9
R 21) I would tutor a classmate who
got behind in their studies because of
their mental illness
Strongly agree/agree
Unsure
Strongly disagree/disagree
61.7% (71)
28.7% (33)
9.6% (11)
63.5% (73)
22.6% (26)
13.9% (16)
1.8
-6.1
4.3 *
R 22) I would volunteer my time to
work in a program for people with a
mental illness
Strongly agree/agree
Unsure
Strongly disagree/disagree
43.5% (50)
48.7% (56)
7.8% (9)
53.9% (62)
36.5% (42)
9.6% (11)
10.4
-12.2
1.8 *
47
Changes in Stereotype scores among participants
Within the Stereotype category in this section, the statements in the Youth Opinion
Survey (YOS) are itemized and grouped under specific sub-categories for analysis. For example,
statements pertaining to the notion that people with a mental illness are responsible for, or can
control, their illness are captured under controllability. Statements pertaining to the notion that
people with a mental illness “cannot work” is captured under recoverability, meaning whether or
not they can recover from their illness and become well enough to work and function in society
and statements pertaining to the notion that people with a mental illness are “dangerousness”
and/or have “split personality” not knowing what they might do are captured under violence and
unpredictability. Within this section, a closer analysis is presented to identify within each sub-
category which of the participants’ scores have worsened, remained the same or improved
between the pre-test and the post-test (stereotype n=119 pre-test/post-test pairs; social distance
n=115 pre-test/post-test pairs). The analysis and presentation below is a replica of similar work,
analysis and presentation produced by the Opening Minds Research Team on anti-stigma work
(Koller, Chen, Heeney, Potts, & Stuart, 2012).
Controllability items
The results presented in Figure 4 to Figure 10 and from Tables 5 to10 are from the
standard analysis created by the Opening Minds Research Team (e.g.: Koller, Chen, Heeney,
Potts, & Stuart, 2012). This portion of the analysis was completed with their assistance. These
results have been presented in a separate technical report (Innocent, Baker, Buchanan, Wilson, &
Stuart, 2013). Figure 4 shows the proportion of participants who showed any change on the
controllability items from pre-test to post-test (where pre-test and post-test surveys were

48
individually matched). The greatest positive shift (reflecting reduced stigma) was for the item
“People with a mental illness often don’t try hard enough to get better” (25% improvement),
followed by “People with a mental illness get what they deserve” (24% improvement). There
was a 21% improvement for the item “People with a mental illness tend to bring it on themselves
(20% improvement) and a 15% improvement for the item “People with a mental illness could
snap out of it if they wanted to”. The majority of participants (55% - 68%) did not change scores.
Percentages varied by item. These reflected two conditions: either participants already held a
non-stigmatizing attitude and stayed the same or they had a negative attitude on the pre-test and
did not improve. A relatively small proportion of responses (8%-24%) showed negative change.
Figure 4. Controllability items
24.4%
12.6%
21.8%
8.4%
55.5%
62.2% 63.0%
68.1%
20.2%
25.2%
15.1%
23.5%
0%
10%
20%
30%
40%
50%
60%
70%
80%
90%
100%
Tend to bring it on themselves
Often don't try hard enough to get better
Could snap out of it if they wanted to
Get what they deserve
Worse score No change Better score

49
Recovery items
Figure 5 shows the proportion of participants who made any change on the recovery
items. Thirty-six percent of the participants improved on the item, “Most people with a mental
illness are too disabled to work” and just fewer than twenty percent (19.3%) improved on the
item, “People with serious mental illnesses need to be locked away”. Participants whose scores
did not change reflected two conditions: either they already held a non-stigmatizing attitude and
stayed the same or they had a negative attitude on the pre-test and did not improve. A relatively
small proportion of participants (0.8% and 8.4%) showed a negative change.
Figure 5. Recovery items
0.8% 8.4%
63.0%
72.3%
36.1%
19.3%
0%
10%
20%
30%
40%
50%
60%
70%
80%
90%
100%
Are too disabled to work Need to be locked away
Worse score No change Better score

50
Violence/Unpredictability items
Figure 6 shows the proportion of participants who made any change on the items dealing
with violence and unpredictability. All showed a large improvement of 28% or more. The
greatest improvement was for the items, “People with a mental illness are often more dangerous
than the average person” (45% improvement) and “You can never know what someone with a
mental illness is going to do” (44% improvement). These were the largest improvements on any
single item. Participants whose scores did not change reflected two conditions: either they
already held a non-stigmatizing attitude and stayed the same or they had a negative attitude on
the pre-test and did not improve. Some participants (6% -14 %) showed a negative change.
Figure 6. Violence/Unpredictability items
5.9%
14.3%
8.4% 8.4% 9.2%
48.7%
54.6%
63.9%61.3%
47.1%45.4%
31.1%27.7%
30.3%
43.7%
0%
10%
20%
30%
40%
50%
60%
70%
80%
90%
100%
Often more dangerous
than the
average person
Often become violent if not
treated
Commit most violent crimes
Can't be relied on
Never know what they will
do
Worse score No change Better score
51
Changes in Social Distance scores among participants
Within the social distance category in this section, statements in the Youth Opinion
Survey (YOS) are itemized and grouped under two specific sub-categories for analysis. First,
statements pertaining to the desire to stay away from or not associate with someone with a
mental illness are captured under social distance. Secondly, statements pertaining to the desire to
assist those who experience a mental illness are captured under social responsibility.
Prior to the intervention, participants showed generally positive, non-stigmatizing
responses to six out of the seven Social Distance items. For example, 77% agreed with the
statement “I would not mind if someone with a mental illness lived next door to me”; and 76%
disagreed with the statements “I would try to avoid someone with a mental illness” and 71% “I
would not be close friends with someone I knew had a mental illness”.
Figure 7 shows the proportion of participants who made any change on the seven Social
Distance items. Some participants’ scores improved for all items. For example, following the
intervention 30.4% participants improved on the item, “I would not want to be taught by a
teacher who had been treated for a mental illness” and 31.3% improved on the item “If I knew
someone had a mental illness I would not date them”. Participants whose scores did not change
reflected two conditions: either they already held a non-stigmatizing attitude and stayed the same
or they had a negative attitude on the pre-test and did not improve. There was a negative change,
however, among a small proportion of participants for all items (7.8-17.4%).
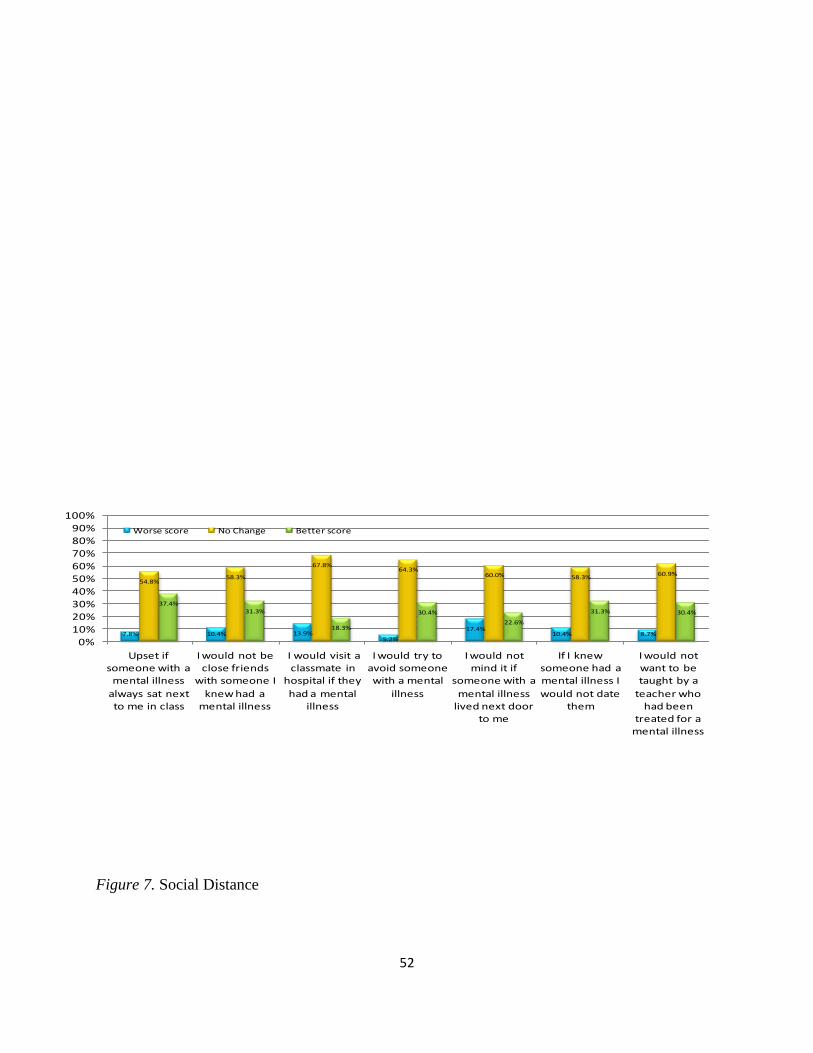
52
Figure 7. Social distance it
Figure 7. Social Distance
7.8% 10.4% 13.9%5.2%
17.4%10.4% 8.7%
54.8%58.3%
67.8%64.3%
60.0% 58.3%60.9%
37.4%31.3%
18.3%
30.4%
22.6%
31.3% 30.4%
0%10%20%30%40%50%60%70%80%90%
100%
Upset if someone with a
mental illness
always sat next to me in class
I would not be close friends
with someone I
knew had a mental illness
I would visit a classmate in
hospital if they
had a mental illness
I would try to avoid someone with a mental
illness
I would not mind it if
someone with a
mental illness lived next door
to me
If I knew someone had a mental illness I
would not date them
I would not want to be taught by a
teacher who had been
treated for a mental illness
Worse score No Change Better score
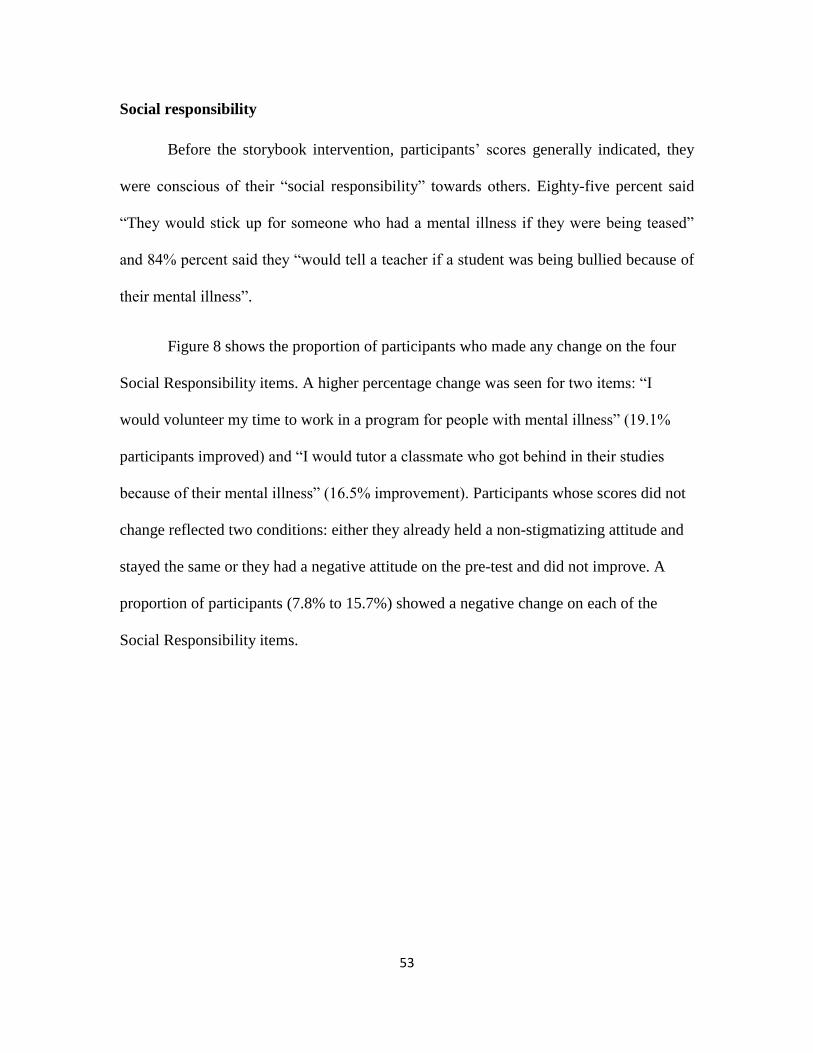
53
Social responsibility
Before the storybook intervention, participants’ scores generally indicated, they
were conscious of their “social responsibility” towards others. Eighty-five percent said
“They would stick up for someone who had a mental illness if they were being teased”
and 84% percent said they “would tell a teacher if a student was being bullied because of
their mental illness”.
Figure 8 shows the proportion of participants who made any change on the four
Social Responsibility items. A higher percentage change was seen for two items: “I
would volunteer my time to work in a program for people with mental illness” (19.1%
participants improved) and “I would tutor a classmate who got behind in their studies
because of their mental illness” (16.5% improvement). Participants whose scores did not
change reflected two conditions: either they already held a non-stigmatizing attitude and
stayed the same or they had a negative attitude on the pre-test and did not improve. A
proportion of participants (7.8% to 15.7%) showed a negative change on each of the
Social Responsibility items.
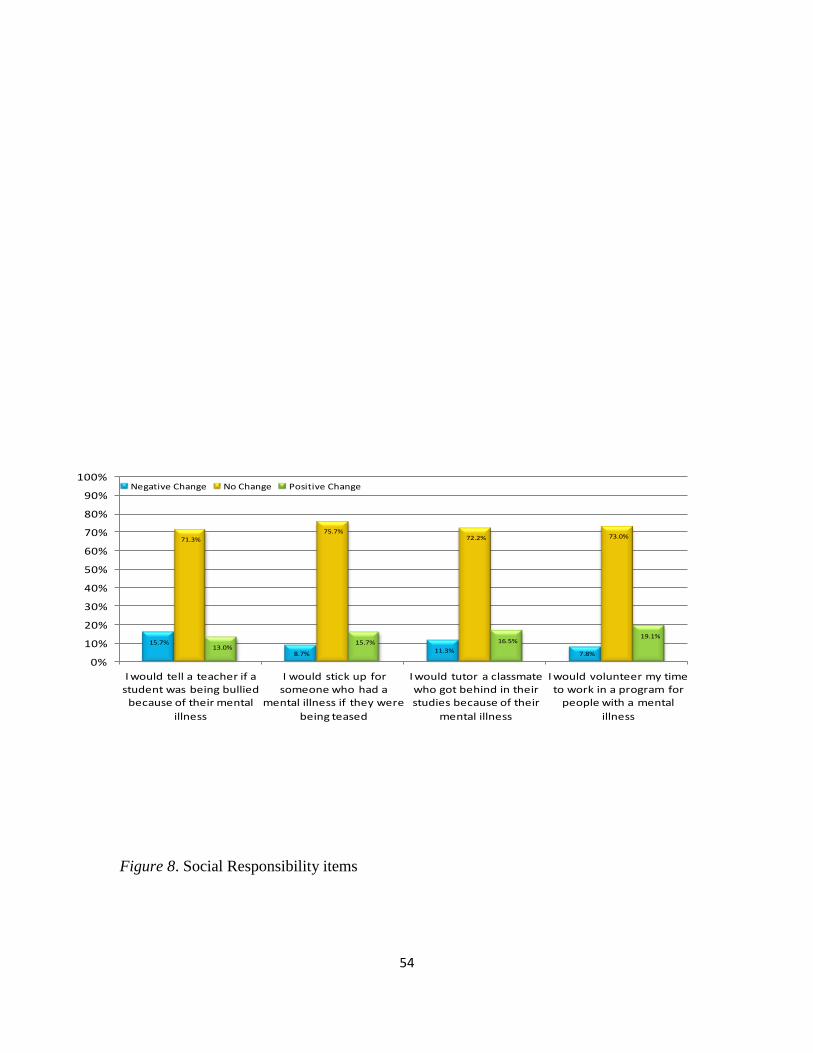
54
Figure 8. Social Responsibility items
15.7%
8.7% 11.3% 7.8%
71.3%75.7%
72.2% 73.0%
13.0%15.7% 16.5%
19.1%
0%
10%
20%
30%
40%
50%
60%
70%
80%
90%
100%
I would tell a teacher if a student was being bullied
because of their mental
illness
I would stick up for someone who had a
mental illness if they were
being teased
I would tutor a classmate who got behind in their studies because of their
mental illness
I would volunteer my time to work in a program for
people with a mental
illness
Negative Change No Change Positive Change

55
Significant changes in scores per subcategory
Not all changes in items were statistically significant. Some responses were
deemed significant with a p value of <0.001 to a p value of <0.05. A McNemar-Bowker
analysis of significance was conducted for each statement. The chart is divided into the
Stereotype and Social Distance categories; within each category, the items were divided
into subcategories.
For Stereotype, the subcategories are Controllability, Recovery, and Violence and
Unpredictability items. Under Controllability, three statements were significant: “People
with mental illness tend to bring it upon themselves”, from pre-test to post-test, 24.4%
experienced a negative change, selecting a more stigmatizing response, 55.5%
experienced no change and 20.2% experienced a positive change with a p< 0.001. For
the second statement, “People with mental illnesses often don't try hard enough to get
better”, 12.6% experienced a negative change, 62.2% experienced no change, and 25.2%
experienced a positive change with a p value of <0.001. For the third statement, “Most
people with a mental illness get what they deserve”, 8.4% experienced a negative change,
68.1% did not change and 23.5% experienced the positive change with significant results
(p < 0.01). The only statement within this sub-category that did not have a significant
result is: “People with a mental illness could snap out of it if they wanted to”, 21.8%
experienced a negative change, 63.0% experienced no change, 15.1% experienced a
positive change with an insignificant value of p=.765.

56
Table 7
Analysis of Significance for Controllability Items
Survey Item
Negative
change
% (n)
No change % (n) Positive
change
% (n)
McNemar-
Bowker
Significance Stigmatizing*
% (n)
Non-
stigmatizing*
% (n)
Controllability Items
People with a
mental illness tend
to bring it on
themselves.
24.4%(29)
55.5%(66)
20.2%(24)
χ2 =20.8;
df =3;
p<.001* 13.4%(16) 42.0%(50)
People with mental
illnesses often
don’t try hard
enough to get
better.
12.6%(15)
62.2%(74)
25.2%(30)
χ2 = 10.8;
df =9;
p<.001 10.9%(13) 51.3%(61)
People with a
mental illness
could snap out of it
if they wanted to.
21.8%(26)
63.0%(75)
15.1%(18)
χ2 =4.9;
df = 8;
p=.765 14.3%(17) 48.7%(58)
Most people with a
mental illness get
what they deserve.
8.4%(10)
68.1%(81)
23.5%(28)
χ2 =16.3;
df =6;
p<.012
21.0%(25)
47.1%(56)
Under the Recovery subcategory, one statement was significant and the other was
not. For the statement, “Most people with a mental illness are too disabled to work,”
0.8% experienced a negative change, 63.0% experienced no change and 36.1%
experienced a positive change with the significant p value of p<0.001. Whereas, for the
second statement, “ People with serious mental illnesses need to be locked away”, 8.4%
experienced a negative change, 72.3% experienced no change, 19.3% experienced the
positive change with an insignificant p value of p=.436.
57
Table 8
Analysis of Significance for Recovery Items
Survey Items
Negative
change
% (n)
No change % (n) Positive
change
% (n)
McNemar-Bowker
Significance Stigmatizing*
% (n)
Non-
stigmatizing*
% (n)
Recovery Items
Most people
with a
mental
illness are
too disabled
to work.
0.8%(1)
63.0%(75)
36.1%(43) χ2 =40.2; df = 6;
p<.001 6.7%(8) 56.3%(67)
People with
serious
mental
illnesses
need to be
locked away.
8.4%(10)
72.3%(86)
19.3%(23) χ2 =6.9; df = 7;
p=.436 13.4%(16) 58.8%(70)
On the Violence and Unpredictability subcategory, all five items are deemed
significant with the p value ranging from 0.002- 0.16. The item with the greatest positive
change is seen with the statement, “People with mental illness are often more dangerous
than the average person”, 45.4% showed a positive change with only a small percentage
5.9% negative change. The next item with the greatest positive change is seen with the
statement, “You can never know what someone with a mental illness is going to do.”
43.7% showed a positive change with a small percentage of 9.2% negative change. The
next item with the greatest positive change is seen with the statement “People with a
mental illness often become violent if not treated”, 31.1% positive change with the 14.3%
negative change. The last two with significant changes are seen with the statement “You
can't rely on someone with a mental illness”, 30.3% positive change with a 8.4% negative
change; followed by the statement, “Most violent crimes are committed by people with

58
a mental illness”, 27.7% positive change followed by an 8.4% negative change. Those
who experienced no change fall within 47.1% to 63.9%.
Table 9
Analysis of significance for Violence and Unpredictability Items
Survey Item
Negative
change
% (n)
No change % (n) Positive
change
% (n)
McNemar-
Bowker
Significance Stigmatizing*
% (n)
Non-
stigmatizing*
% (n)
Violence /Unpredictability
People with a mental
illness are often more
dangerous than the
average person.
5.9%(7)
48.7 %(58)
45.4% (54)
χ2= 40.5;
df =8;
p<.001 21.0%(25) 27.7%(33)
People with a mental
illness often become
violent if not treated.
14.3%(17) 54.6%(65)
31.1%(37)
χ2 =17.2;
df =7;
p<.016 35.3%(42) 19.3%(23)
Most violent crimes are
committed by people with
a mental illness.
8.4%(10) 63.9%(76)
27.7%(33)
χ2 =16.0;
df =5;
p<.007 17.6%(21) 46.2%(55)
You can’t rely on
someone with a mental
illness.
8.4%(10) 61.3%(73)
30.3%(36)
χ2 =20.1;
df =6;
p<.003 16.8%(20) 44.5%(53)
You can never know what
someone with a mental
illness is going to do.
9.2%(11) 47.1%(56)
43.7%(52)
χ2 =31.3;
df =7;
p<.001 32.8%(39) 14.3%(17)
***Notes for all sub-categories:
Base size is those who responded to all the pre-test and post-test items (n=119)
Change was defined as moving on 5-point Likert Scale from the pre-test to the post-test (negative
change: toward a more stigmatizing answer; positive change: toward a less stigmatizing answer)
*The non-stigmatizing response means agree or strongly agree; the stigmatizing response includes
unsure, disagree, and strongly disagree.
Statistical tests use the original five point scale, positive change does not necessary imply non-
stigmatizing response.
*The Statistical test used 3-point collapsed Scale from the pre-test to the post-test (Strongly
disagree/disagree; unsure; strongly agree/agree).
Degrees of freedom depend on the number of non-empty cells and may vary by question due to
different response patterns.
Same procedures apply to Table 10 Analysis of significance for Social Distance and Social
Responsibility on page 60.
59
Within the Social Distance category (Table 10), the items are divided into two
subcategories, Social Distance and Social Responsibility. Not all changes in items were
statistically significant. Some responses were deemed significant with a p value of <0.001
to a p value of <0.05. A McNemar-Bowker analysis of significance was conducted for
each statement, five statements were significant: “I would be upset if someone with a
mental illness always sat next to me in class”, from pre-test to post-test, 7.8%
experienced a negative change, selecting a more stigmatizing response, 54.8%
experienced no change and 37.4% experienced a positive change with a p<.001. The
second statement: “I would try to avoid someone with a mental illness”, from pre-test to
post-test, 5.2% experienced a negative change, selecting a more stigmatizing response,
64.3% experienced no change and 30.4% experienced a positive change with a p<.001.
The third statement: “If I knew someone had a mental illness, I would not date them”,
from pre-test to post-test, 10.4% experienced a negative change, selecting a more
stigmatizing response, 58.3% experienced no change and 31.3% experienced a positive
change with a p<.041. The fourth statement: “I would not want to be taught by a teacher
who had been treated for a mental illness”, from pre-test to post-test, 8.7% experienced a
negative change, selecting a more stigmatizing response, 60.9% experienced no change
and 30.4% experienced a positive change with a p<.024. For the fifth statement: “I would
volunteer my time to work in a program for people with a mental illness”, from pre-test
to post-test, 7.8% experienced a negative change, selecting a more stigmatizing response,
73.0% experienced no change and 19.1% experienced a positive change with a p<.052.
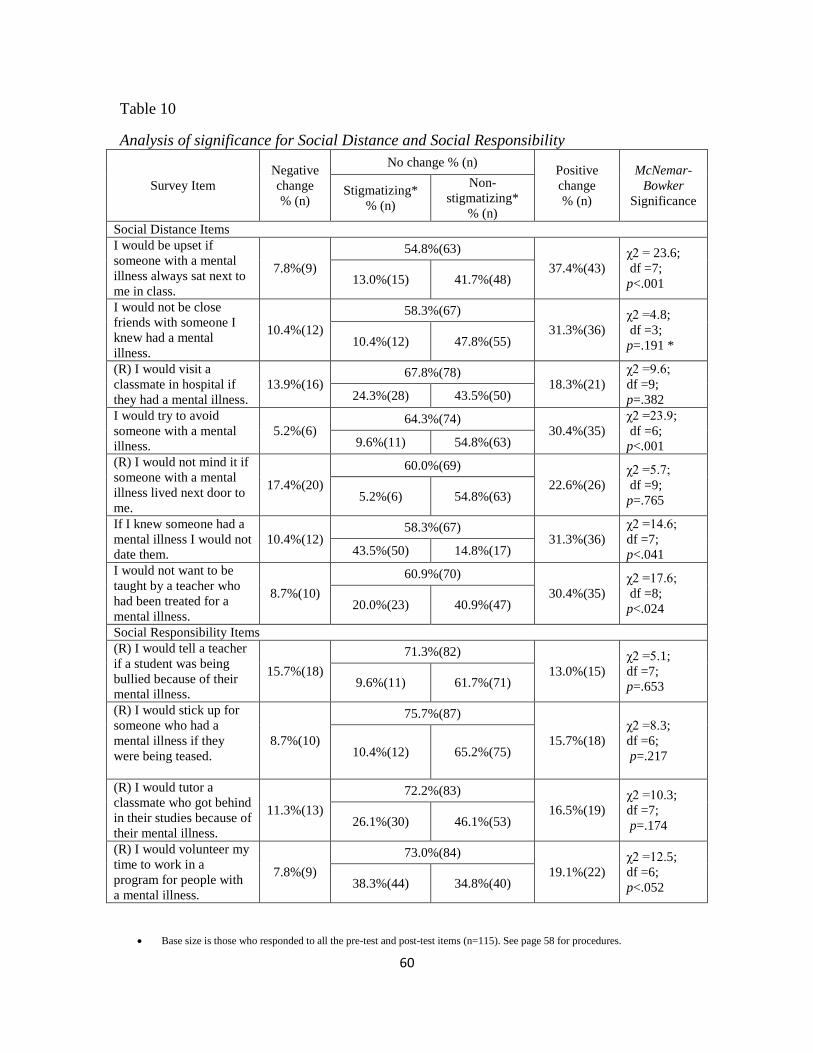
60
Table 10
Analysis of significance for Social Distance and Social Responsibility
Survey Item
Negative
change
% (n)
No change % (n) Positive
change
% (n)
McNemar-
Bowker
Significance Stigmatizing*
% (n)
Non-
stigmatizing*
% (n)
Social Distance Items
I would be upset if
someone with a mental
illness always sat next to
me in class.
7.8%(9)
54.8%(63)
37.4%(43)
χ2 = 23.6;
df =7;
p<.001 13.0%(15) 41.7%(48)
I would not be close
friends with someone I
knew had a mental
illness.
10.4%(12)
58.3%(67)
31.3%(36)
χ2 =4.8;
df =3;
p=.191 * 10.4%(12) 47.8%(55)
(R) I would visit a
classmate in hospital if
they had a mental illness.
13.9%(16) 67.8%(78)
18.3%(21)
χ2 =9.6;
df =9;
p=.382 24.3%(28) 43.5%(50)
I would try to avoid
someone with a mental
illness.
5.2%(6) 64.3%(74)
30.4%(35)
χ2 =23.9;
df =6;
p<.001 9.6%(11) 54.8%(63)
(R) I would not mind it if
someone with a mental
illness lived next door to
me.
17.4%(20)
60.0%(69)
22.6%(26)
χ2 =5.7;
df =9;
p=.765 5.2%(6) 54.8%(63)
If I knew someone had a
mental illness I would not
date them.
10.4%(12) 58.3%(67)
31.3%(36)
χ2 =14.6;
df =7;
p<.041 43.5%(50) 14.8%(17)
I would not want to be
taught by a teacher who
had been treated for a
mental illness.
8.7%(10)
60.9%(70)
30.4%(35)
χ2 =17.6;
df =8;
p<.024 20.0%(23) 40.9%(47)
Social Responsibility Items
(R) I would tell a teacher
if a student was being
bullied because of their
mental illness.
15.7%(18)
71.3%(82)
13.0%(15)
χ2 =5.1;
df =7;
p=.653 9.6%(11) 61.7%(71)
(R) I would stick up for
someone who had a
mental illness if they
were being teased.
8.7%(10)
75.7%(87)
15.7%(18)
χ2 =8.3;
df =6;
p=.217 10.4%(12) 65.2%(75)
(R) I would tutor a
classmate who got behind
in their studies because of
their mental illness.
11.3%(13)
72.2%(83)
16.5%(19)
χ2 =10.3;
df =7;
p=.174 26.1%(30) 46.1%(53)
(R) I would volunteer my
time to work in a
program for people with
a mental illness.
7.8%(9)
73.0%(84)
19.1%(22)
χ2 =12.5;
df =6;
p<.052 38.3%(44) 34.8%(40)
Base size is those who responded to all the pre-test and post-test items (n=115). See page 58 for procedures.
61
The Mental Health Commission of Canada selected an 80% achievement
threshold measurement that was applied to measure other tools and resources. Figure 9
and 10 show the change in Stereotype and Social Tolerance scale scores. Prior to the
intervention, more respondents were positive (80% threshold, 9 out of 11 positive
responses) on the Tolerance scale (33.3%) compared to the Stereotype scale (25.0%).
After the intervention, the percentage who improved their attitudes by crossing the 80%
threshold was 16% (Stereotype scale) and 19% (Tolerance scale). The percentage who
improved their scores but did not cross the 80% threshold was 33% (Stereotype scale)
and 18% (Tolerance scale).
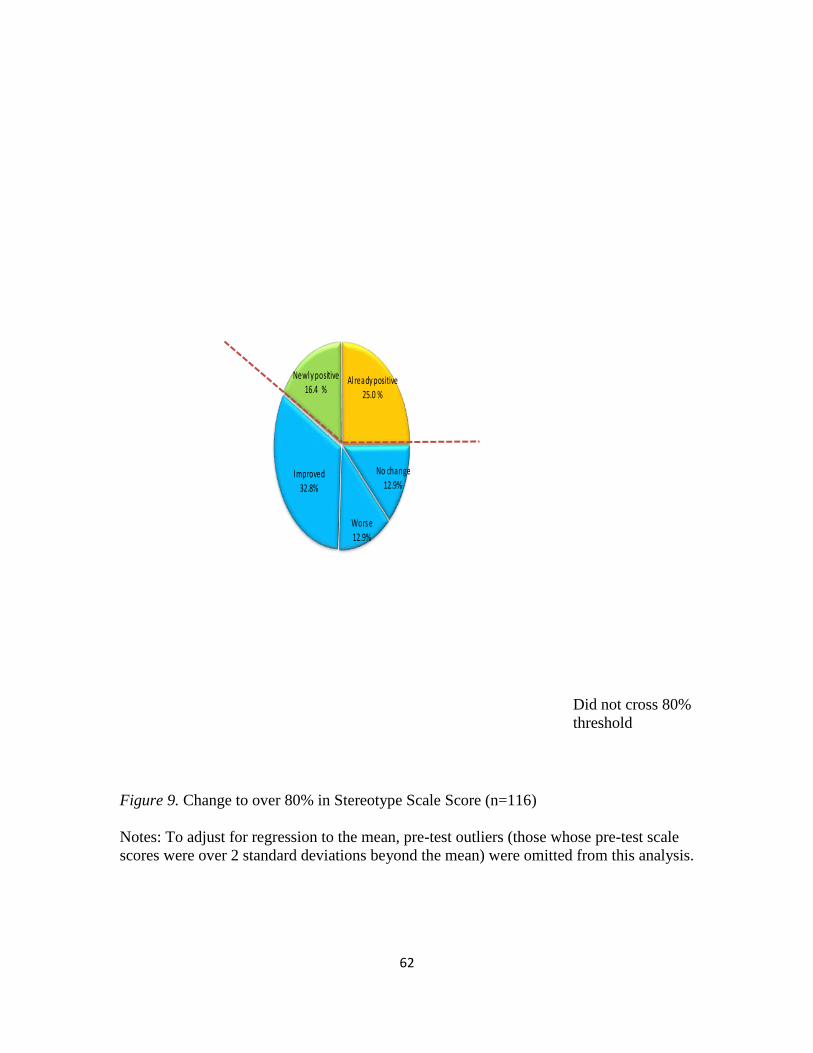
62
Worse12.9%
Improved 32.8%
Newly positive 16.4 %
Already positive
25.0 %
No change 12.9%
Figure 9. Change to over 80% in Stereotype Scale Score (n=116)
Notes: To adjust for regression to the mean, pre-test outliers (those whose pre-test scale
scores were over 2 standard deviations beyond the mean) were omitted from this analysis.
Did not cross 80%
threshold

63
Figure 10. Change to over 80% in Social Tolerance Scale Score (n=108)
Notes: To adjust for regression to the mean, pre-test outliers (those whose pre-test scale
scores were over 2 standard deviations beyond the mean) were omitted from this analysis
Worse
16.7%
Improved 17.6%
Newly positive
19.4%
Already positive33.3%
No change
13.0%
Did not cross 80%
threshold

64
The results show that this intervention was successful in improving the proportion
of participants who got 80% of the answers correct, on the tests used to assess social
stereotypes and social tolerance. Findings also showed that a small number of
participants continued to hold stigmatizing beliefs despite their participation—for
example, almost 25% did not disagree with the stigmatizing statement that people with a
mental illness tend to bring it upon themselves. These findings suggest that while certain
elements of the story appear to be reducing stigma, there may be some messages that
consolidate stereotypes, or fail to eradicate them, among certain sub-groups of
participants.
Participants’ feelings about the book
A descriptive analysis of the participants’ responses to the statements: “I enjoyed
learning about mental illnesses”; “Now I think about mental illnesses in a new way”; “I
would like to read more books like this”; “More class time should be spent learning from
people with mental illnesses” was conducted. The results are seen below in Table 11. In
order to remain consistent, this analysis was conducted on the 127 participants who
completed all three tests, pre-test one, pre-test two and the post-test. The results show
77.4% enjoyed learning about mental illness; however, only 32.3% would like to read
more books like the one used in the study; 69.3% now think about mental illness in a new
way but only 14.1% think more class time should be spent learning from people with a
mental illness.
The results below demonstrate that the participants enjoyed learning about mental
illness. However, over a quarter (27.8 %) do not want to learn about mental illness using
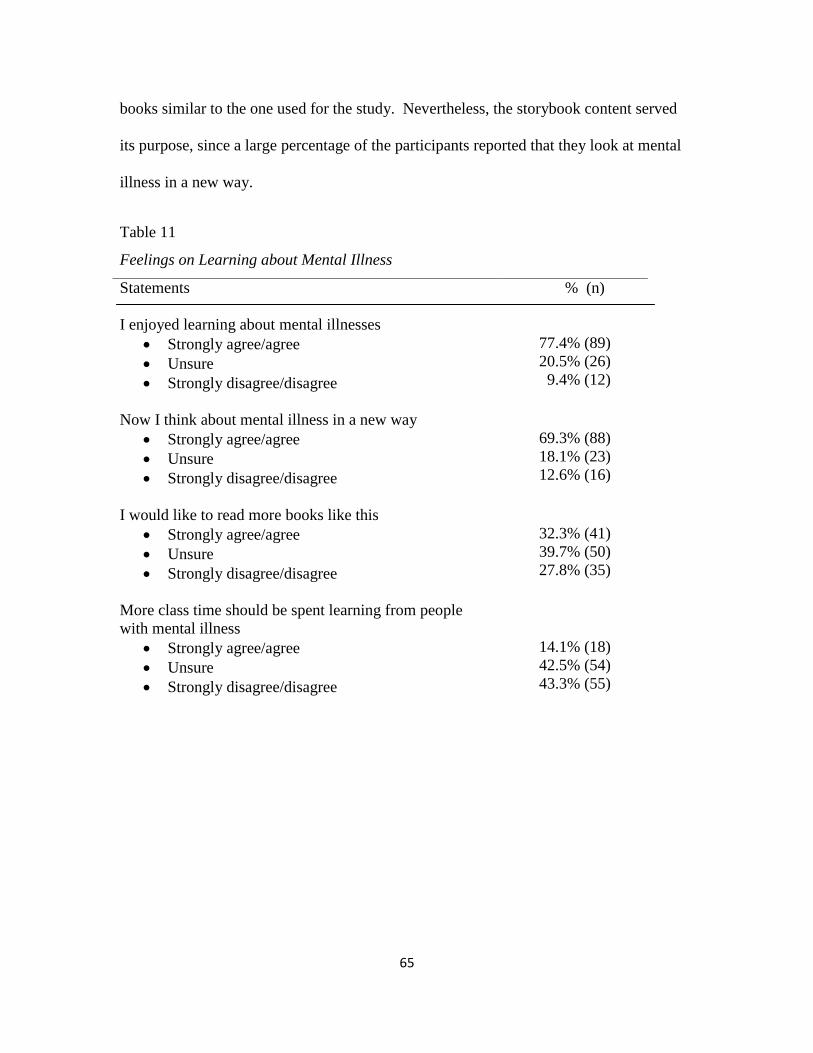
65
books similar to the one used for the study. Nevertheless, the storybook content served
its purpose, since a large percentage of the participants reported that they look at mental
illness in a new way.
Table 11
Feelings on Learning about Mental Illness
Statements
I enjoyed learning about mental illnesses
Strongly agree/agree
Unsure
Strongly disagree/disagree
% (n)
77.4% (89)
20.5% (26)
9.4% (12)
Now I think about mental illness in a new way
Strongly agree/agree
Unsure
Strongly disagree/disagree
69.3% (88)
18.1% (23)
12.6% (16)
I would like to read more books like this
Strongly agree/agree
Unsure
Strongly disagree/disagree
32.3% (41)
39.7% (50)
27.8% (35)
More class time should be spent learning from people
with mental illness
Strongly agree/agree
Unsure
Strongly disagree/disagree
14.1% (18)
42.5% (54)
43.3% (55)
66
Chapter 5
Qualitative Findings
Qualitative analyses of the open ended questions were conducted. The questions
investigated participants’ perceptions of individuals with mental illness, their perceptions
of the book, and their perceptions of the knowledge they acquired from the storybook.
Participants’ perceptions of mental illness
In the pre-test and post-test questionnaires the participants were asked what words
come to mind to describe someone with a mental illness. Out of the 127 who wrote all
three tests, 111 (87.4%) responded with one or more words at pre-test; 103 (81.1%)
responded with one or more words at post-test. A few handwritten words, fewer than
2%, were not legible, therefore not included in the analysis and other questionnaire
responses were left blank causing a drop in the percentage of words used at post-test. The
analysis of the participants’ responses involved the following steps: firstly, four
subcategories were identified and derived from the two subscales of the Mental Health
Commission of Canada’s Youth Opinion Survey (YOS), the instrument used for this
study. Two subcategories reflect positive perceptions of a person with mental illness and
two reflect negative perceptions. Secondly, the responses in each subcategory were coded
using codes that were close to the actual words. Thirdly, the codes in each category were
reduced into broader themes.
As noted earlier, the Mental Health Commission of Canada’s youth opinion
survey (YOS) is divided into two subscales, Stereotype and Social Distance. In previous
67
research with the instrument, the questions were grouped into five subcategories that fit
either the Stereotype or Social Distance subscales: 1) Controllability, 2) Recovery and 3)
Violence\Unpredictability were subcategories under Stereotype; 4) Social Tolerance and
5) Social Responsibility were subcategories under Social Distance. For example, under
the subcategory Controllability, statements such as “People with a mental illness tend to
bring it upon themselves”; “People with mental illnesses often don't try hard enough to
get better”; “People with mental illness could snap out of it if they wanted to”; “Most
people with a mental illness get what they deserve” are used to demonstrate that people
with mental illness can control or have responsibility for their illness. The subcategories
of the Youth Opinion Survey were used to classify the participants’ written words in the
qualitative analysis of data. Therefore, any statements participants used in their responses
that indicate blame or responsibility for mental illness were categorized under
Controllability.
Under the subcategory “Recovery”, the (YOS) statements used were: “Most
people with a mental illness are too disabled to work”, and “People with serious mental
illnesses need to be locked away”. These two statements imply that recovery is not
possible for such people and therefore would not be classified under Recovery; in
contrast however, any words or statements participants used in their responses that
related to the possibility of recovery were categorized under Recovery.
Under the subcategory of “Violence and Unpredictability”, the statements which
were included were the following: “People with mental illness are often more dangerous
than the average person”; “People with a mental illness often become violent if not
treated”; “Most violent crimes are committed by people with a mental illness”; “You

68
can't rely on someone with a mental illness”; “You can never know what someone with a
mental illness is going to do”. Any words or statements participants used in their
responses that related to Violence and Unpredictability were categorized under this
section.
Finally for the Social Distance category, the subcategories identified in the (YOS)
instrument were Social Tolerance and Social Responsibility. Under the subcategory
Social Distance, the statements used were these: “I would be upset if someone with a
mental illness always sat next to me in class”; “I would not be close friends with someone
I knew had a mental illness”; “I would visit a classmate in hospital if they had a mental
illness”; “I would try to avoid someone with a mental illness”; “I would not mind if
someone with a mental illness lived next door to me”; “If I knew someone had a mental
illness I would not date them”; “I would not want to be taught by a teacher who had been
treated for a mental illness”. Any words or statements participants used in their
responses that suggested social tolerance were categorized under this section.
Similarly, under the subcategory of Social Responsibility, the statements used
were those such as: “I would tell a teacher if a student was being bullied because of their
mental illness”; “I would stick up for someone who had a mental illness if they were
being teased”; “I would tutor a classmate who got behind in their studies because of their
mental illness”; “I would volunteer my time to work in a program for people with a
mental illness”. Thus, any words or statements participants used in their responses that
related to social responsibility were categorized under this section.
69
Using the participants’ words as codes, the themes Unstable, Unpredictable and
Violent emerged as a Negative Subcategory and Direction for Stereotype. These themes
fit perfectly under the Controllability, Violence and Unpredictability subcategory of the
YOS instrument of the Mental Health Commission of Canada questionnaire. Using the
participants’ words as codes, the themes Illness and Treatable emerged as a Positive
Subcategory and Direction for Stereotype. These themes fit the Recovery subcategory of
the YOS instrument of the Mental Health Commission of Canada questionnaire.
Using the participants’ words as codes, the themes Different and Strange emerged
as a negative subcategory and direction for Social Distance. These themes fit well under
the Social Distance subcategory of the YOS instrument of the Mental Health Commission
of Canada questionnaire. Using the participants’ words as codes, the themes Like Us and
Deserving emerged as a Positive Subcategory and Direction for Social Distance. These
themes fit the Social Distance and Social Responsibility subcategory of the YOS
instrument of the Mental Health Commission of Canada questionnaire.
In the sections where several expressions were used to signify the same meaning,
these expressions were reduced to a simplified code to better manage the data. Simplified
codes were used for words that were similar; these reduced words were used for both the
Pre-tests and Post-test as described in the Appendix N.
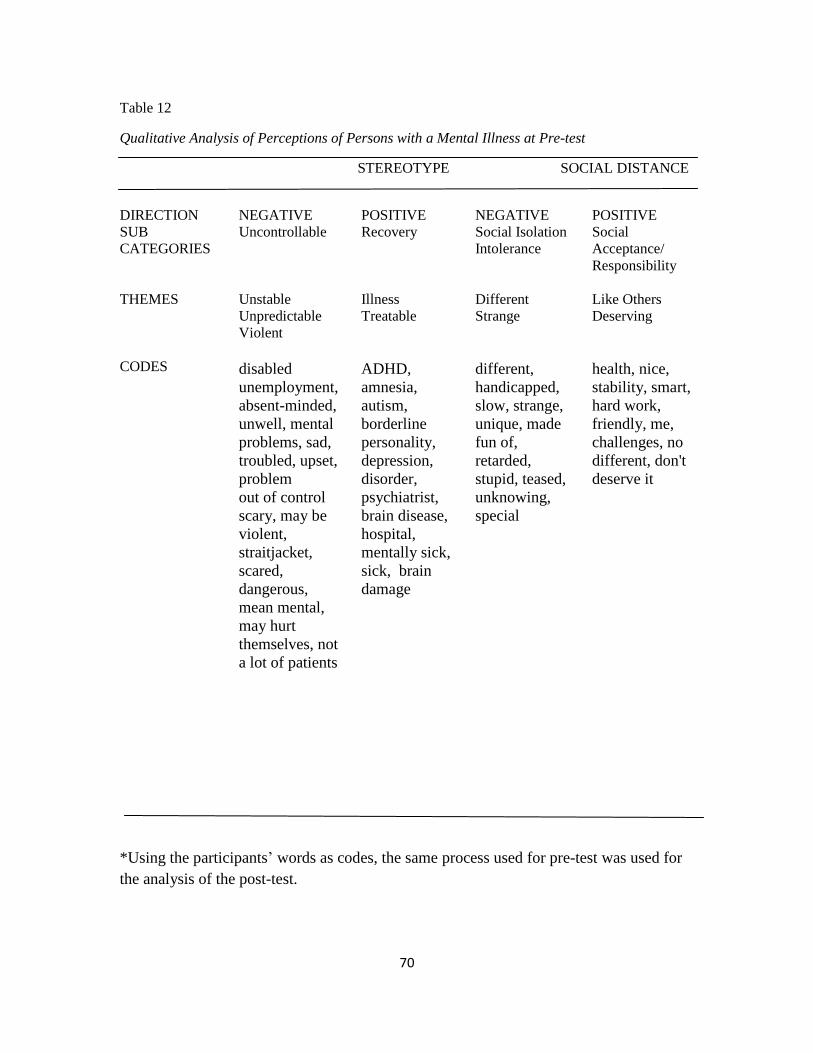
70
Table 12
Qualitative Analysis of Perceptions of Persons with a Mental Illness at Pre-test
STEREOTYPE SOCIAL DISTANCE
DIRECTION
NEGATIVE
POSITIVE
NEGATIVE
POSITIVE
SUB
CATEGORIES
Uncontrollable Recovery Social Isolation
Intolerance
Social
Acceptance/
Responsibility
THEMES Unstable
Unpredictable
Violent
Illness
Treatable
Different
Strange
Like Others
Deserving
CODES
disabled
unemployment,
absent-minded,
unwell, mental
problems, sad,
troubled, upset,
problem
out of control
scary, may be
violent,
straitjacket,
scared,
dangerous,
mean mental,
may hurt
themselves, not
a lot of patients
ADHD,
amnesia,
autism,
borderline
personality,
depression,
disorder,
psychiatrist,
brain disease,
hospital,
mentally sick,
sick, brain
damage
different,
handicapped,
slow, strange,
unique, made
fun of,
retarded,
stupid, teased,
unknowing,
special
health, nice,
stability, smart,
hard work,
friendly, me,
challenges, no
different, don't
deserve it
*Using the participants’ words as codes, the same process used for pre-test was used for
the analysis of the post-test.

71
Table 13
Qualitative Findings Analysis Perceptions of Persons with a Mental Illness at Post Test
STEREOTYPE SOCIAL DISTANCE
DIRECTION NEGATIVE POSITIVE NEGATIVE POSITIVE
SUBCATEG
ORIES
Controllability Recovery Social Isolation
Intolerance
Social Acceptance/
Responsibility
THEMES Unstable
Unpredictable
Violent
Illness
Treatable
Different
Strange
Like Us
Deserving
CODES drunk
embarrassed
troubled
unhappy
unhealthy
unwell, blame
worried, scared
trapped
insecure
struggle absent-
minded
incapable
can’t work,
mental
problems,
upset, mad
unstable
unpredictable
crazy
confused
mental
fear
bipolar
autism
depression/
sad amnesia
illness/sick
attention
deficit
disorder
schizophrenia
medication,
treatable
can overcome
themselves
different/
unique
odd, retard,
special stigma
broken
not smart
dumb
not accepted
think different,
average
strange
weird/special
misunderstood,
not different
Energetic,
happy friendly,
healthy determined,
leader,
hope they’re not
bullied, not fair faith,
feel bad
hopeful,
not their fault,
unfortunate
vulnerable
understanding, sad
alone
*Using the participants’ words as codes, the same process used for pre-test was used for
the analysis of the post-test

72
Major differences in perceptions at pre-test and post-test
Table 14
Participants’ Perceptions of People with a Mental Illness
STEREOTYPE SOCIAL DISTANCE
NEGATIVE POSITIVE NEGATIVE POSITIVE PRE-TEST
48 (49%)
49 (51%)
33 (70%)
14 (30%)
POST TEST
14 (30%)
35 (70%)
16 (29%)
38 (71%)
NUMBER/PERCENTAGE WORDS CHANGE FROM NEG TO POSITIVE
34 (19%)
14 (19%)
17 (41%)
-24 (41%)
Qualitative findings results
The participants used various words to describe mental illness. Some positive
changes in perceptions were seen; certain negative words at pre-test were not used in the
post-test. For example, at pre-test the following words were used: dangerous, mean,
stupid, scary, scary looking, slow, straitjacket, maybe violent. Such words were not used
at post-test. However, new words were used, such as: broken, confused, not smart, dumb,
absent-minded and unpredictable.
There was a decrease in the number of negative words (19%) used under the
Controllability Subcategory of Stereotype, from 48 at pre-test to 14 at post-test. There
was a significant increase in the number of positive words (41%) used within the Social
Acceptance/Responsibility of Social Distance, from 14 at pre-test to 38 at post-test with
more participants using words indicating positive attitudes such as I want to help, in need,
get taken care of as well as more words such as like us, normal, not different, same as us
73
and similar to us. There was also a decrease in the number of negative words (41%) used
under the Social Acceptance/Responsibility of Social Distance, from 33 at pre-test to 16
at post-test. However, there was a notable decrease in the number of positive words
(19%) used under the subcategory Recovery of the Stereotype category, from 49 in pre-
test to 35 at post-test. In addition, certain pervasive negative words such as dumb, not
smart, strange and weird continue to be used at post-test under negative stereotype
subcategory.
Participants’ perceptions of the book
In the Post-test participants were asked, “Do you know more about mental illness
now than you did before you reading the book?” 83.5% said “yes”, 15.7% said “no”.
When asked what they liked about the book, some identified positive attributes (see Table
15). They were also asked what they disliked about the book and some identified
negative attributes. The positive attributes they noted were listed and classified into four
themes: Message, Information, Story, and Illustrations. Similarly their comments about
what they disliked about the book were listed and classified into two themes: Length and
Story.
The vast majority of participants liked the message in the book; the second most
common aspect they liked was the informative facet of the book. Others liked the
illustration or the pictures and others liked the content of the story, for example, some
liked that the character who experienced a mental illness was supported and people stuck
up for him, others liked that the story ended well, or that the character with a mental
illness had friends and some commented on how they learned more about mental illness.
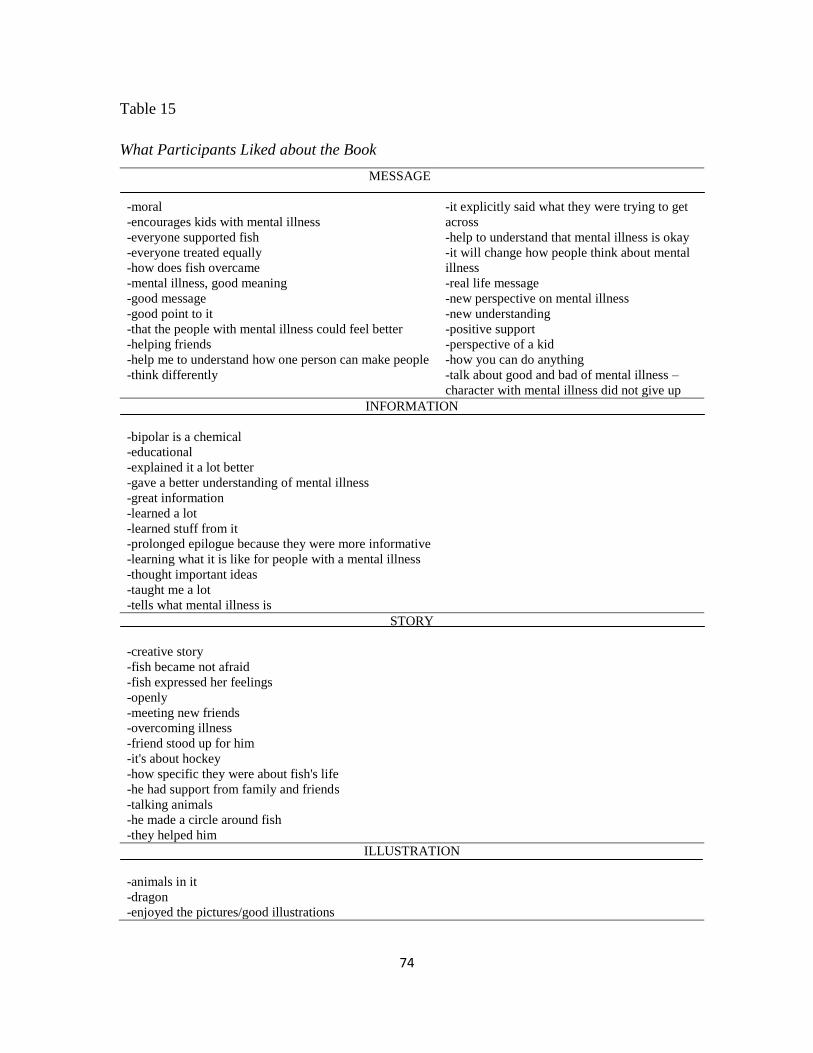
74
Table 15
What Participants Liked about the Book
MESSAGE
-moral
-encourages kids with mental illness
-everyone supported fish
-everyone treated equally
-how does fish overcame
-mental illness, good meaning
-good message
-good point to it
-that the people with mental illness could feel better
-helping friends
-help me to understand how one person can make people
-think differently
-it explicitly said what they were trying to get
across
-help to understand that mental illness is okay
-it will change how people think about mental
illness
-real life message
-new perspective on mental illness
-new understanding
-positive support
-perspective of a kid
-how you can do anything
-talk about good and bad of mental illness –
character with mental illness did not give up
INFORMATION
-bipolar is a chemical
-educational
-explained it a lot better
-gave a better understanding of mental illness
-great information
-learned a lot
-learned stuff from it
-prolonged epilogue because they were more informative
-learning what it is like for people with a mental illness
-thought important ideas
-taught me a lot
-tells what mental illness is
STORY
-creative story
-fish became not afraid
-fish expressed her feelings
-openly
-meeting new friends
-overcoming illness
-friend stood up for him
-it's about hockey
-how specific they were about fish's life
-he had support from family and friends
-talking animals
-he made a circle around fish
-they helped him
ILLUSTRATION
-animals in it
-dragon
-enjoyed the pictures/good illustrations

75
The most common aspect of the book the participants disliked was its length
(likely because they had to read it all at once). Although many participants identified
aspects of the story as something they liked about the book, some disliked the storyline.
A number felt it was too childish, too unrealistic (talking animals) or disliked how the
character in the book was treated.
Table 16
Dislikes about the Book
LENGTH
-a bit too long
-dragged on in some places
-slow
-too easy to read
-repetitive
-overdone, too much talking
STORY
-people make fun of him
-cheesy
-didn't explain what mental illness is very well
-he could not play hockey
-how people treated fish
-talking animals
-kids teasing fish
-not very realistic
-kids were mean
-we should have stories that are true
-talking animals were a bit too much
-they are foreshadowing some of the realities of mental illness
Repeated measures ANOVA analysing the differences in the pre-test and post-test
after reading the book revealed that participants who did not like the book had a greater
change in test scores for Stereotype subscale than participants who liked the book.
76
Specifically, the mean difference between the post-test and the pre-test scores for
participants who did not like the book was 5.083 (p<0.01) compared to a difference of -
2.156 (p<0.01) in participants who liked the book. These results indicate a significant and
meaningful interaction whereby the effect of reading the book had a greater impact on
reducing stigma on participants who did not like the book.
Similarly, repeated measures ANOVA analysing the differences in the pre-test 1
and post-test after reading the book revealed that participants who did not like the book
had a greater change in test scores for Social Distance subscale than participants who
liked the book. The mean difference between post-test and pre-test scores for participants
who did not like the book was 2.077 (p=.04) compared to a not statistically significant
difference of 0.526 (p=1.0) for those who liked the book. Those who liked the book may
have already provided non-stigmatizing responses leading to a ceiling effect where
additional gain is not captured. Further analysis of the two sub-groups was not
performed for this study; future analysis of the differences between the two sub-groups
could yield greater insights in the meaning of the differences.
When they were asked if they found the book easy to read, the vast majority (118)
responded “yes” (95.2%) and 6 said “no” (4.8%); when they were asked if they enjoyed
reading it, most (93) answered “yes” (74%), a couple said unsure (4.4%) and the
remaining 27 of them said “no”(21.6%), they had not enjoyed reading the book.
Knowledge acquired from reading the book
Participants were asked what they learned about mental illness. Many responded
they learned that recovery is possible, people can get help, people can get better, it can

77
happen to anyone, and that it is not a bad thing. They also made statements that
demonstrated greater social tolerance. Nevertheless, certain statements written indicate
negative perceptions of mental illness such as mental illness, can be very dangerous, hard
to get over, difficult to cope with, and horrible.
The following words were similar in meaning and were coded and placed under
the appropriate themes. Subcategories of the Youth Opinion Survey were used to classify
the participants’ written words in the qualitative analysis of data. Therefore, any
statements participants used in their responses that indicated Recovery (for Stereotype) or
Social Tolerance (for social distance) for mental illness was categorized in Table 17
accordingly.

78
Table 17
Knowledge Acquired
RECOVERY
-bipolar disorder is very treatable
-people can get help
-they can be treated, even though not completely
-can be very minor
-can get better
-curable
-you can still do anything
-if treated can be the same as any other treatment
SOCIAL TOLERANCE
-anyone can get it
-anyone can have bipolar
-doesn't matter if you have one
-if treated you can be the same, just like us
-normal people
-not always obvious
-not freaks
-a lot of people are different
-does not always change who you are
-doesn't have to be bad
-not their fault
-nothing to be ashamed of
-people are meant to survive them
In summary, when the participants were asked, “What comes to mind when you
think about mental illness?” at pre-test, which includes the baseline test 1 and pre-test
number 2, the top five answers were: “sick/illness” appeared 83 times, “disabled”
appeared 61 times, “Mental” or “mentally challenged” appeared 39 times, “special”
appeared 34 times; lastly, “different” appeared 29 times. At post-test, the top five
responses remained the same top five words written at pre-test, except “needing help”
became number 5; replacing “special” which was number 4 at pre-test; whereas, “needing
help” was number six at pre-test. The top word used at post-test was “mental”, which
79
appeared 17 times, followed by a tie between “different”, and “disabled” which both
appeared 13 times, then “sick” which appeared 12 times, lastly “needing help” came in
the fifth position which appeared 11 times.
At the end, when participants were asked whether or not they knew more about
mental illness, 126 of them responded “Yes” and 20 responded ”No”. When they were
asked what they liked about the book, the top three words written were: first,
“educational”, “informative” and “teaching”, all words related to the teaching aspect of
the book, and appeared 25 times. Secondly, the word written the most often was
“illustration”, which appeared 10 times. Lastly, the third word chosen was “fish” (the
name of the lead character in the book) which appeared eight times. When the
participants were asked about things that they did not like: the top three written words or
statements were “too long” which appeared 48 times, “nothing” which appeared 15 times,
followed by the participants writing that they did not like the fact that the character in the
book was being teased, which appeared five times. When the participants were asked
what they learned, the top three written words were: number one “treatable”, which
appeared 28 times, followed by “nothing” which appeared 12 times and lastly by
“bipolar” which appeared eight times. When asked if they found the book easy to read,
110 responded, “Yes”. Others selected “no” (n=3), “kind of” (n=6), and “easy” (n=3).
When asked if they think about mental illness in a new way, 74 responded “Yes”, 20
selected “No” and “Not really”, followed by responses that would not commit, such as
“kind of” and “somewhat” and “sort of” (n=19).

80
Chapter 6
Discussion
Children learned from their immediate environment. The family is the setting
where children are likely to first learn about mental illness. Telling age appropriate first
stories about mental illness is critical in educating children about mental illness and/or in
changing the children’s attitudes about those who experience a mental illness (Pinto-Foltz
& Logsdon, 2009). Parents may be interested in selecting evidence-based resources to
help them educate their children about mental illnesses.
The storybook, “He Shoots, He Scores” was evaluated for its effectiveness in
reducing mental illness stigma in children. The participants’ views vis-à-vis the
education, their likes and dislikes were sought, compiled and aggregated. The results
were obtained and stereotype and social distance were analyzed separately. Each subscale
yielded positive results, the participants became less stigmatizing at post-test after the
intervention was given. Within this chapter, a closer examination is undertaken to
examine the key successful features of this research study. First, a look at the methods
used in this study will help to identify the likelihood of using such a method for future
studies. Secondly, the storybook intervention will be analyzed and contrasted with other
interventions that are commonly used to educate children and to decrease mental illness
stigma. Thirdly, both stereotype and social distance subscales will be looked at separately
to compare and contrast the success achieved with that of other results seen within the
literature. Additional interpretations will be provided relating to the participants use of
their own words to describe mental illness. The findings from the interpretations will be
used to compare with the findings currently seen in the literature. Then, the significance

81
of the results, their generalizability, feasibility, participation and parental engagement
will be discussed followed by the study limitations and conclusion.
Pre-test one and Pre-test two
Not all students were able to complete all three tests. There are several
contributing factors for the high attrition. First, students had to remember to bring the
signed consent forms back to the school prior to the study (many students forgot).
Secondly, the students were tested at three points in time. Some were absent the first or
second day of the study or both. In one situation, a student was getting prepared to start
the post-test when he was called to the office to meet his parent for a medical
appointment; when participants missed either pre-test one, pre-test two or the post-test
because they were absent, their data was excluded.
The results of pre-test one compared to pre-test two demonstrate that the
participants’ views remained stable over the two week lapse between these two tests.
The results demonstrate no statistically significant changes between pre-test one and pre-
test two and suggest that there was no test effect. However, the differences between pre-
test two and the post-test; and pre-test one and the post-test were statistically significant.
The participants were used as their own control; this approach removed the confounding
variables such as reading levels, comprehension, maturity, gender and such that exist
between participants. Pre-test one and pre-test two were used as comparators to establish
baseline prior to the intervention. The second pre-test was used instead of the first to
compare with the post-test primarily because pre-test two was given right before the
intervention, using the second test removed the potential confounding variables found in
82
history, exposure to education or other potential confounding variable prior to the
intervention.
Knowledge of someone with a mental illness
To the question, “Do you know someone with a mental illness?” the majority
responded ‘yes’. Interestingly, 3.7% of student participants did not respond to the
question. It is not known whether or not it is because they were uncertain or preferred
not to answer. However, slightly over 15% of all student participants selected uncertain
to “knowing someone with a mental illness”.
The intervention
The second pre-test was given immediately before the 27-minute long
intervention storybook. As soon as the storybook ended, the participants were given the
post-test to write. The participants did not have an opportunity to discuss the questions or
their thoughts with each other. They wrote the post-test individually and responded
according to their own views. The participants were used as their own control to provide
a pre-intervention comparison condition. Only two weeks elapsed between pre-test 1 and
pre-test 2 which reduced the potential for history and maturation biases. Instrumentation
was mitigated by having a consistent investigator deliver the tests at a similar times for
all groups (the study was conducted before lunch), the change seen between the pre-tests
and the post-test is likely attributed to the exposure to the storybook. Campbell and
Stanley (1963) caution researchers of potential internal validity biases and provide
guidance on ways to avoid them. Their principles have been used to assess biases in this
study.
83
Many successful anti-stigma interventions are contact based (where someone with
a mental illness makes contact and shares their personal experiences with an audience or
a person with the goal of dispelling mental illness myths of dangerousness, laziness, low-
achievements, dumb and other forms of mental illness stigma). For example, Pinfold,
Thornicroft, Huxley and Farmer (2005) studied contact-based education with 472
students aged 14-15; they found as in many other studies that personal contact was a key
factor in changing students’ attitudes (Chisholm, Patterson, Torgeson, Turner, &
Birchwood, 2012; Economou et al.,2012; Pinto-Foltz, Logsdon & Myers, 2011; Ventieri,
Clarke, & Hay, 2011). Stuart (2006) studied 571 students in grade 8 across Canada; she
used a video-based contact anti-stigma strategy. The results were positive in educating
the students about schizophrenia and reducing desire for social distance.
Although contact-based anti-stigma strategies are used and promoted extensively;
Mathisen (2000), however, did not find such positive results. Mathisen (2000) studied the
effect of strategic contact in decreasing stigmatizing attitudes among high school students
towards those who experience with a mental illness. Strategic contact is the use of forums
that are organized specifically to provide the public or targeted groups with interactions
with those who are recovering from a mental illness in hopes of decreasing mental illness
stigma. Mathisen’s study results show that strategic contact with a person who
experiences a mental illness did not improve the negative attitude held prior to the
strategic contact. Similarly, Reinke, Corrigan, Leonhard, Lundin and Kubiak (2004)
when examining aspects of contact on the stigma of mental illness found that contact with
acutely mentally ill persons may confirm existing stereotypes.

84
In seeking to find less contradicting evidence for contact-based education, a more
in-depth exploration of the elements that contribute to contact-based anti-stigma strategy
need to be conducted. For example, the effectiveness of the storybook in reducing mental
illness stigma used in this study could be linked to the storyline within it. The exposure
to the storybook about a young boy who experiences bipolar disorder provides an indirect
form of contact. Embedded in the story, a young boy is seen experiencing a mental
illness. His fears, joys and pains are depicted in the storybook to create sympathy in the
reader. Given how successful contact-based mental illness stigma education has proven to
be in many instances, in order to remove the few instances where contact based education
has proven ineffective, an alternate approach could be to provide such a contact through
well written reading mediums, where school-aged students can learn and relate safely and
compassionately to the character who experiences with a mental illness.
There are other key elements that likely contributed to the success observed from
using this specific storybook. The success could also be linked to the medium chosen to
present the story to the children. According to the author, the fairy-tale format was
specifically chosen because this medium disassociates the topic from the real world and
allows the reader to see mental illness and its effects on the individual in a non-
threatening light. The author has extensive experience in children’s literature. Several
psychiatrists, psychologists and child mental illness experts as well as children
themselves, were consulted in the creation of the book, “He Shoots, He Scores”. The
author relied on teachings from Bettelheim (1989) for the use of enchantment. According
to Bettelheim (1989), “For a story to hold the child’s attention, it must entertain him and
arouse his curiosity. But to enrich his life, it must stimulate his imagination; help him to
85
develop his intellect and to clarify his emotions; be attuned to his anxieties and
aspirations; give full recognition to his difficulties, while at the same time suggest
solutions to the problems that perturb him” (p.5). In the storybook “He Shoots, He
Scores”, those elements are purposely embedded. I witnessed the students’ captivation to
be listening to the storybook in anticipation of what was going to happen next. Another
key characteristic of the storybook is “the hero of a fairy-tale, during a traumatic struggle,
is helped by primitive things – a tree, an animal, nature. This connection with the Earth
and its creatures appeal to a child as the child feels more in touch, and more “in synch”
with these organic elements, than do most adults. The fate of these heroes gives the child
the hope that, like them, he will be guided and given help when it is needed. It is
noteworthy to mention, that the Iris the Dragon tales depicts life as it exists in the
“Riverbank Community” of animals who live in harmony with nature, and in care and
consideration of one another” (Grass, 2011).
Instrument, subscale distinctions and results
To establish the validity and reliability of the results achieved, an overview of the
instrument and the distinctiveness of each subscale are presented here. The YOS
instrument used in this study measured stereotype and social distance separately. The
method of testing the participants twice prior to the intervention provided a test, retest
reliability. In this study, no statistically significant differences were noted between the
baseline test and the second test. The timeframe between the two tests was relatively
short at two weeks interval because keeping the testing timeframe short between tests
when studying with children is particularly important because of rapid developmental
86
changes that may occur over time (Gliner, Morgan, & Harmon, 2001). Although testing
at three points in time may have caused a testing effect, the results achieved when
compared to groups from the Talking About Mental Illness (TAMI) study using the same
instrument show comparable results. TAMI is a program that encourages interaction
between students and people who have a mental illness (CAMH, 2001). In addition, the
participants did not change their views between the first and the second test, the only
difference between the second and third test was the exposure to the intervention.
The inter-item reliability for each subscale was particularly good. Inter-item
reliability scores greater than 0.8 are considered good, particularly given that each
subscale only contains 11 items within it. Because the coefficient is linked to the number
of items that make up the composite score, the more items related to a higher score may
not indicate a high inter-item correlation (Gliner, Morgan, & Harmon, 2001). In this
study, an alpha value of 0.85 is obtained for each 11 item subscale making the instrument
a reliable tool to use.
The YOS instrument is subdivided in two subscales. The first subscale measures
Stereotype, whereas the second subscale measures Social Distance. The overall
improvement of each subscale is slightly less than 10%. However, the economy of scale
would dictate a 27- minute exposure to the storybook without additional teaching,
comments or influence produced a remarkable result. In fact, most interventions used to
decrease mental illness stigma, have only yielded similar small results (Watson, 2004)).
The results indicate that elaborate, expensive or extensive interventions may not be
necessary. Watson and colleagues (2004) agree that a brief educational program can yield
positive results by providing increased knowledge and positive changes in attitudes. In
87
essence, a small change noted in the responses that would indicate a movement from a
stigmatizing stance to more positive responses, that are deemed not stigmatizing, still
constitutes a step in the right direction.
Although change is noted on both subscales, it is typically more difficult for
changes to occur within the social distance (Economou, et al., 2012). Previous studies
have demonstrated that the Social Distance aspect of mental illness stigma is by far more
difficult to change than Stereotype would be (Yamaguchi, Mino, & Uddin, 2011).
However, within this study, a shift occurred for both Stereotype and Social Distance.
Stereotypes
It is noted that overall, most participants already had the non-stigmatizing answers
when they gave their responses for the stereotype subscale creating a potential for a
ceiling effect, where additional gains can only be marginal. Despite this observation,
there is a shift in the number of those who responded “Unsure” as a selection for their
responses to a shift to a non-stigmatizing response after the intervention. For example,
for the question “People with mental illness tend to bring it upon themselves”, there is a
5% change between the pre-test and post-test, and it is also noted that 19.1% of the
participants changed their responses from “Unsure” to a more positive definitive
response. The most significant response shift is noted for the statement “Most people
with a mental illness are too disabled to work”, with a 21.8% improvement from pre-test
to post-test. These results demonstrate that education can change the way young people
think about those who experiences a mental illness (Stuart, 2006; Ventieri et al., 2011;
Yamaguchi, et al., 2011). “Mental illness” or “Too disabled to work” showed a 21.8%
88
improvement from pre-test to post-test. These results demonstrate that education can
change the way young people think about those who experience with a mental illness
(Ventieriet al., 2011; Yamaguchi, et al., 2011).
Some of the improvements noted in the responses could be linked directly to the
storyline. For example, the fact that the participants were able to see from the story that
the boy who experienced with bipolar disorder was still able to go to school and
participate in sports may very well have influenced the change noted in the responses
related to “too disabled to work”. Similarly, the storyline may have caused some
confusion and an increase towards a more stigmatizing response in some cases. For
example, in the participants’ responses to the statement, “You can never know what
someone with a mental illness is going to do”, at pre-test, 32.5% of the participants
responded “unsure”, whereas instead of the percentage decreasing at post-test, the
number of participants who were unsure for this statement increased by almost 8%, the
percentage moved from 33.6% to 42%. In the storybook, the young person who
experienced bipolar disorder was seen kayaking in a dangerous area of a river without
being sure of what he was going to do when he headed in that direction. This part of the
story may have contributed to the increase in the participants who answered unsure at
post-test to the statement, “you can never know what someone with a mental illness is
going to do”. Other anti-stigma intervention studies have yielded similar arguable,
inconclusive results (Chisholm, et al., 2012; Yamaguchi, et al., 2011).
89
Verbatim stereotype discussion
A key feature of this research study is the combination of the quantitative survey
type questionnaire combined with sections within the post questionnaire where
participants could express their own views. In addition to measuring quantitatively for
change between the pre-test and post-test, the participants were asked in the post-test to
provide their views about the education they received. They were asked whether or not
they enjoyed the education they received; if they think about mental illness in a new way;
if they would like to read more books like the storybook they read about mental illness; if
more class time should be spent learning from people with mental illnesses. They were
asked if they knew more information on mental illness after reading the book; what they
liked and what they did not like about the book; what they learned and whether or not the
book was easy to read and whether they enjoyed reading it.
Woolfson, Woolfson, Mooney and Bryce (2008) stress the importance of asking
the students’ views about the mental health education they receive in order to tailor future
interventions accordingly. The results seen in the verbatim section of the questionnaire
provide a context for the results seen in the quantitative section. For example, while
analyzing the participants’ responses, it became clear that an acknowledgment of
knowing a stereotype does not necessarily equate to an endorsement of that specific
stereotype. For example, the participants who selected a medical term to describe
someone who experiences with a mental illness were merely naming a condition.
Stereotypes are the recognition of particular groups of behaviours associated with groups
of people. Since the participants were not asked what they meant by the words they used,
stereotype could be considered as value neutral.

90
Like Watson and colleagues (2004) observed in their study, the participants did
not strongly endorse well-known stereotypes about mental illness at baseline (see
quantitative section). Similarly, in this study the results show that many participants held
non-stereotyping views at baseline. Therefore, mentioning those stereotypes in their
handwritten descriptions of someone with a mental illness does not necessarily conclude
that the participants believe or endorse those stereotypes. Despite this caveat, the
analysis of the words used to describe someone with a mental illness still showed
participants used less stereotyping vocabulary at post-test. As well, judging from the
freedom of expression seen in the verbatim provided in the participants’ written words, it
is evident that the participants felt comfortable sharing their views openly on paper.
Social distance
Similar to the Stereotypes subscale, it is noted that most participants responded
favourably to statements made that would indicate positive social tolerance. For
example, at pre-test 83.2% of participants strongly agreed with the statement that “They
would stick up for someone who had a mental illness if they were being teased”.
However, when responding to the statement, “I would tell a teacher if a student was being
bullied because of their mental illness”, fewer participants agreed. At pre-test, 84.3% of
participants responded that they would strongly agree with telling the teacher but that
number dropped to 80.9% at post-test. Similarly, for the same statement, “I would tell a
teacher if a student was being bullied because of their mental illness”, more participants,
12.2% at pre-test increased to 13.9% at post-test, answered unsure. Similarly, more
participants disagreed, 3.5% at pre-test and 5.2% at post-test that they would tell a
teacher. This negative change could be attributed to the storyline because the participants
91
may have detected a potential risk to disclosing a mental illness that may not be in the
best interest of the student who is being bullied. For example, the boy who experiences a
mental illness in the storybook was very nervous about telling his teachers that he had a
mental illness. The boy was afraid that should people become aware that he may
experience negative consequences as a result.
Thematic analysis
When a comparison is made between the pre-test and the post-test analyzing the
words the participants used, the changes are not necessarily that obvious. The words
were classified under the same subcategories of the Youth Opinion Survey, YOS:
“Controllability”, “Recovery”, “Violence and Unpredictability”, “Social Distance”, and
“Social Responsibility” leading to the category of “Stereotype and Social Distance”.
Both pre-test words and post-test words generated the same subcategories that lead to the
broader category of “Stereotype and Social Distance”. At post-test, there is an increased
use of bipolar disorder to describe mental illness. This increase could be linked to the
storyline where bipolar disorder is explicitly explained as a medical condition. The
storyline also contributed to an increase in words used that describe “Social
Responsibility”. Some of the negative stereotypes and negative labels remained;
however, more positive words such as “like us”, “normal”, “not different” “same as us”
were used normalizing mental illness.
Participants’ written views
The participants provided excellent feedback for the author to consider. Although
many participants complained about the length of the book and how childish the storyline
92
was, the book as an intervention still provided a medium to improve stereotypes and
social distance scores by producing more positive results on the post-test. Given the
specificity of the responses, the adoption of soliciting verbatim information about a
mental illness intervention is important.
The written word portion of the study was also beneficial in establishing the
participants’ comfort level in speaking their minds. One could extrapolate from the
candidness of the written responses that the participants were also comfortable in
responding honestly to the statements by selecting “Strongly agree”, “Agree”, “Unsure”,
“Disagree” and “Strongly disagree”.
It is unequivocal that the participants enjoyed learning about mental illness, since
77.4% chose strongly agree. Some students also acknowledge that they now think about
mental illness in a new way (69.3%). However, 21.6% did not particularly like the book;
and 32.3% do not want to read more books like the book used in this study. This could be
related to the length of the storybook given that most participants disliked the length of
the book. In a conversation with the author (June, 2012) she indicated that the book was
not meant to be read in one seating; therefore, the participants may not wish more books
like this because they do not want to spend that long reading a storybook about mental
illness. This view is further reinforced by the 14.1% of participants who selected that they
do not want more class time spent learning from people with mental illness. In this study,
participants had to hear and read the whole story but in a natural environment, this stigma
reduction strategy might be less effective because participants might not be motivated
enough to read it through. Given that so many participants disliked the length it took to
read the book, they naturally would not wish to spend more class time learning using
93
similar long storybooks about mental illnesses. Age may also be a contributing factor to
not liking the book. The book is written for participants in grades 4-8. This range may be
too broad and not meet the needs of older participants. An educational book needs to be
age-appropriate. A wide range targeting students from grades 4 to 8 is not appropriate.
The best approach is to narrow the gap and select books for children of similar age
groups and grades. For example, writing for students in grades 4-6 would result in more
students of those grades liking the book. Similarly students in grades 7-8 are also a
grouping that would be suitable to target as a collective.
Significance of the results
It is interesting to note that a link can be made between the storyline and the way
the participants responded to the statements posed. Some responses to the various
statements selected can be attributed to the storyline. Therefore, when interventions are
being created, it is critically important to evaluate a storybook for unintentional, potential
negative outcome of certain statements or incidents. Although the overall results of the
study demonstrate that the storybook is effective in influencing positive changes towards
non-stigmatizing responses, noting undesired outcome is also important (Sakellari,
Leino-Kilpi, & Kalokerinou-Anagnostopoulou, 2011). In addition, the analysis of
responses to scale items also demonstrates the importance of evaluating interventions
prior to endorsement. The potential risk for unintentional outcomes is a significant
reality that cannot be overlooked. By conducting the appropriate evaluation of possible
interventions, one could then mitigate the risk of unintentional outcome (Flay, Biglan,
Boruch, Castro, Gottfrdson, Kellam et al., 2005; Schachter et al., 2008). As Koller and
colleagues (2012) discovered in their anti-stigma work, considering that some
94
participants did not move in the expected direction, there may be some value in assessing
their ‘readiness for change’ in future evaluations to determine if their stage of change is
predictive of intervention outcomes.
Caution needs to be exercised when selecting tools and resources to educate
children about mental illness. Disliking the book may have compromised the results in
the study. However, in this specific study a post-hoc analysis for a potential interaction
effect of subgroup analysis stratified by participants who “Liked” and those who “Did not
like” the book was performed. Participants were classified as having liked the book if
they answered positively (i.e. “Yes”, “Sure”, ‘Interesting”) to the question: “Did you like
the book”. Participants were classified as not liking the book if they answered negatively
(i.e. “No”, “Horrible”, “Bored”).
Likewise, only 14.1% of participants wish for more class time spent on learning
from people with a mental illness. This low percentage may lead educator to misconstrue
a dislike for learning about mental illness in school; whereas, the feelings expressed may
unilaterally reflect a direct dislike for the methodology or tool and not the content as
demonstrated in the results from this study. The participants enjoyed learning about
mental illness, yes. But they do not wish to read more books like they used in the study.
Considering the book was administered in one seating, a shorter book with a pointed
story that is not as lengthy may have resulted in more students liking the book. However,
it is not known at what point the students felt that they had heard enough and did not wish
to continue on reading or listening.

95
Nursing implications
Nurses are often involved in promoting mental health and fostering a better
understanding of mental illnesses. Nurses have contributed to research on adult mental
illness stigma. Too few studies have been conducted evaluating resources that are used to
promote mental health or to decrease mental illness stigma (Sakellari, Leino-Kilpi, &
Kalokerinou-Anagnostopoulou, 2011). One major gap is in evaluating resources to
decrease mental illness stigma in children. Best practice would suggest the use of
evidence based tools for such important work. Nurses need to ensure that mental health
resources used to educate children about mental illnesses and reduce mental illness
stigma are accurate and effective.
The attitudes children have regarding mental illness can negatively affect whether
or not they access mental health care when they get older and need services. Nurses
should be more involved in investigating anti-stigma interventions that are commonly
used in schools. According to WHO (2005), by 2020 an estimated 15% of the total
disease burden will be attributed to mental and behavioural disorders. Nurses involved in
policy developments are encourage to become involved in curriculum developments that
promote mental health care and decrease mental illness stigma.
Lastly, children mental illness stigma research involving parents will yield better
understanding of how to change attitudes at home to decrease mental illness stigma
collectively. More positive perceptions of mental illness at home will yield less
stigmatizing societies and less mental illness stigma in children.

96
Generalizability of the study
The study participants were not randomly selected. They were part of a
convenient sample of students in the south east of Ontario region. The parental data
provided contextual information pertaining to the participants’ demography. Overall, it is
fair to say that using this intervention is likely to produce similar results with other
students of similar ages and grades of the same demography.
In addition, in this study, 72% of the children answered “yes” to knowing
someone with a mental illness; 84.1% of their parents also answered “yes” to knowing
someone with a mental illness. Although, the percentages might not be high when one
considers how prevalent mental illness actually is, in the population, it may be high in
contexts where mental illness is often concealed because of stigma. It is not known if
many of the parents’ consent for their child’s participation was prompted by personal
experience with someone who has a mental illness or whether their participation simply
reflected a greater openness in society about having a diagnosis of mental illness.
Several studies confirm that education does change adolescents’ attitudes towards mental
illness (Economou, et al., 2012; Pinto-Foltz, et al., 2011; Ventieri, et al., 2011; Watson, et
al. 2004). Although the study was conducted in southeastern Ontario, the results can be
generalized to other students of similar ages in different areas of the province and country
meeting the same demography. However, a larger sample of younger students would
likely yield different results, since many students in the study found the book too
childish. The results achieved in this study were produced by a convenience sample of
schools and students within these schools, limiting generalization.

97
Feasibility
The within subject, quasi-experimental design of evaluating the storybook
intervention for its effectiveness in reducing mental illness stigma has proven to be
feasible, cost-effective and successful. Contrary to studies conducted where bibliotherapy
failed when used to decrease mental illness stigma in children, the storybook used in this
study was effective. The storyline is the biggest factor in the success of administering this
type of intervention. A storyline that is appealing to the audience in this case, young
people, using characters of similar age is important in producing good results. Cameron
and Spitzer (1995) in their study of school-age children’s perceptions of mental illness
agree that young people did not relate to the adult characters used in their vignette
studies. Therefore, using an age appropriate character is essential in obtaining positive
results.
There were challenges in accessing students. In order to conduct a study with
children, various levels of permission were required. The first was obtaining ethics
clearance from the university (a doctorate student requires school ethics clearance first).
The second approval was required from each geographical school board. Each school
board has their own application process and timelines for review. For example, one
school board deadline was missed as they reviewed research proposals only before March
for the subsequent school year. I was seeking approval within the same school year;
therefore, my application was denied. Another school board would not conduct a study
that was similar to previous research undertaken there. One school board had just finished
a major evaluation of a contact-based mental health program the year before; therefore,
my application was denied. Once the school board approved the study, I was then

98
required to seek approval from the school principals. One school principal declined the
study because of teacher workload; therefore, my request to the school principal to access
their teachers was denied. Once the school principal agreed to participate in the study,
teacher participation was optional. Only the teachers who were interested contacted me,
others made no contacts. Once a teacher agreed to participate, the packages were sent
home for both parental and students’ interest in the study. Some students may have been
interested but could not participate without parental consent.
There were also challenges in achieving an appropriate sample size. The biggest
challenge was the number of testing times. Because the students received the YOS at
three points in time, even with parental consent, some were not present for the first test or
if they were present for the first test, some were not present for the second or in a
particular instance, a student did the second test but had to leave for a medical
appointment prior to completing the post-test. In addition, when a teacher was not fully
engaged in participating in the study and did not remind the participants to return their
signed consents to the school, the number of student participants declined. In one
instance, although 2 full classrooms of participants received consent packages to take
home, only 10 participants returned their forms. When the teacher was asked about the
low enrolment, she indicated the students were not reminded to return their consents,
therefore could not participate.
The data collection was relatively easy; the YOS forms were pre-printed with
participant numbers for ease of identification. The participants filled or placed an “x” on
their chosen responses easily. Occasionally, a student selected more than one response. In
that situation, the response was not entered. The teachers emphasized to the participants

99
to print neatly which alleviated the need to try and decipher messy handwriting. The
students paid attention during the entire data collection. They remained in their seats
when finished and were eager to hand in their work. All of the participants returned their
completed YOS forms. None of the participants placed their names on the forms since
their teachers instructed them not to do that.
Administration of the automated intervention was also relatively easy. All the
classrooms were equipped with smart boards where the automated book was easily
projected on a screen. The majority of them listened and watched the screen, some looked
in their books, others did both, followed on the screen and turned the pages in their
books.
Teachers and participants were relatively well engaged in the study; the practical
application of doing such a research study is contingent upon the ability to access the
students at more than one point in time. The large attrition rate was primarily produced
by the students not being available at the three testing times. In addition, one particular
scenario occurred where a potential group of 75 students could have been obtained, but
because of the lack of engagement from the instructor, only a group of 10 students
participated. The instructor plays a critical role in ensuring that the students take all the
required documents home for signature and return these documents to the school in time
for the study. In this particular instance, the instructor or teacher did not feel that it was
her duty to remind the students to bring the appropriate forms. Similarly, a well-engaged
instructor will be a powerful facilitator in ensuring that as many students as possible get
the opportunity to participate in a research study.
100
It was pleasantly surprising to see the engagement of the parents in completing
the parental questionnaire. Future analysis of the data collected in this study will allow
for comparison and contrasting correlations between the students’ response and the
parental demographic. Such correlation is proven to be feasible given the response rate
of the parents from this study. The questions were answered because they were not too
personal in nature. Different results may be achieved if more personal questions are
asked.
Study Limitations
The book “He Shoots, He Scores” is part of a unit of study. However, the book
was researched in isolation from its typical interactive intent. The book was given to read
in one seating; whereas, the book was meant to be divided in four sections, typically
according to the four seasons as the story unfolded in the book. In addition, “He Shoots,
He Scores” is part of a series of books the author wrote addressing mental illness with
children. Because of the original mandate of the study, I only focused on the one book.
It is not known if the changes noted from a 27 minute exposure to an anti-stigma
storybook are likely going to be sustained over time; it is also not known if a discussion
period after the book could produce more positive changes. Many studies have
demonstrated that some of the positive gained from education were not sustained over
time (Conrad, Dietrich, Heider, Blume, Angermeyer, & Riedel-Heller, 2009). A retest
over time could yield more information about the lasting effect of a single exposure to a
storybook intervention.
101
In addition, in order for this type of intervention to yield positive results, each
student needs to have a copy of the storybook in front of them to read, an automated
version of the book also needs to be used. The researcher, not the teachers from
individual schools need to ensure that the students are paying attention to the automated
audiovisual reading which is used to remove confounding variables related to reading
speed, literacy levels and to ensure that the storybook is read in its entirety. Otherwise the
delivery of the intervention may not be consistent and may yield different results
(Chisholm et. al, 2012). This process standardizes the intervention and guarantees (as
much as possible) that the children would have full exposure to the entire contents of the
book. The intervention, however, may be less effective in a natural setting where these
controls are absent.
Another limitation is the possibility of a testing effect. Given the students were
tested at 3 points in time; the positive post-test results could be attributed to learned
responses or social desirability bias. However, given that the differences between pre-test
1 and pre-test 2 were not statistically significant, social desirability was not likely a major
contributor in this study. Similar limitations were found in a study where they used a quiz
before and after an educational program to evaluate a school-based intervention to
challenge stigmatizing attitudes in teenagers (Essler, Arthur, & Stickley, 2006).
The responses obtained from the students were entered in the database and
analyzed as one group. The responses were not clustered by region, schools or
classrooms. Therefore, fluctuations in performance based on region, schools or classroom
strengths were not considered. Clustering per group was beyond the scope of this specific
102
research and not necessary to respond to the research objectives of this study; however,
clustering per group will be considered for future analysis.
Recommendations
Given the success of the single storybook “He Shoots, He Scores”, longitudinal
research of the entire unit of study would be beneficial. For example, students who
receive education using the unit of study should be followed over time to evaluate if the
positive changes seen would be sustained. In the meantime, a report of the study findings
was submitted to the Mental Health Commission of Canada for future publication and
dissemination (Appendix O).
The storybook is about a Caucasian boy playing hockey; a shorter story with a
storyline that is more generalizable to other ethnic groups and more gender neutral may
yield different results. Finally, a storybook targeting a narrower age group is
recommended.
Conclusion
There are various interventions that are currently being used to decrease mental
illness stigma in children (Sakellari, Leino-Kilpi, & Kalokerinou-Anagnostopoulou,
2011). Until recently, most of these interventions were not evaluated for their
effectiveness (Chisholm et al., 2012). This study evaluated the effectiveness of a
storybook in reducing mental illness stigma in children as well as its effectiveness in
improving mental health literacy. Although small, a positive change was noted in both
stereotype and social distance subscale. Most study results demonstrate Social Distance

103
as being tenacious to change. However, the results of the intervention in this study do
support positive effect on Social Distance.
Like the results Watson and colleagues (2004) obtained in a study about changing
middle school children’s’ attitudes about mental illness through education, most
participants demonstrated good baseline knowledge and did not support Stereotyping
responses. They also demonstrated positive baseline Social Tolerance. The largest gains
were made in the positive changes noted within the Stereotype subscale under the
Violence Unpredictability items, “People with a mental illness are often more dangerous
than the average person”, 45.4% change and “You can never know what someone with a
mental illness is going to do”, 43.7% change. This is consistent with previous studies
where knowledge changed certain myths about mental illnesses. Given the gamut of
intervention options available to decrease mental illness stigma in children, an
intervention that is easy to provide and cost-effective is worth pursuing. Additional
research will be required to identify if the learning gleaned is sustainable over time.

104
References
Aboud, F. E. (2003). The formation of in-group favorism and out-group prejudice in
young children: Are they distinct attitudes? Developmental Psychology, 39(1), 48-
60.
Adler, D. A., & Wahl, O. F. (1998). Children’s beliefs about people labeled mentally ill.
American Orthopsychiatric Association, Inc. 68(2), 321-326.
Arboleda-Flôrez, J., & Stuart, H. (2012). From sin to science: Fighting the stigmatization
of mental illnesses. The Canadian Journal of Psychiatry, 57(8), 457-463.
Augoustinos, M., & Rosewarne, D. L. (2001). Stereotype knowledge and prejudice in
children. British Journal of Developmental Psychology, 19(1), 143.
Bettelheim, B. (1989) The Uses of Enchantment: The Meaning and Importance of Fairy
Tales.
New York: Vintage Books.
Brennan, D. J. (1990) Effects of group counselling and interactive bibliotherapy on
children’s adjustment to separation and divorce, Dissertation Abstracts
International, 51/01, 413B.
Campbell, D. T., & Stanley, J. C. (1963). Experimental and Quasi-Experimental Designs
for Research. Chicago: Rand McNally.
Centre for Addiction and Mental Health, (2001). Talking about Mental Illness: A guide
for developing an awareness program for youth, 1-173. CAMH.
Chisholm, K. E., Patterson, P., Torgeson, C., Turner, E., & Birchwood, M. (2012) A
randomized controlled feasibility trial for an educational school-based mental health
intervention: Study protocol. BMC Psychiatry, 12 Mar, Art 23-7.

105
Conrad, I., Dietrich, S., Heider, D., Blume, A., Angermeyer, M. C., & Riedel-Heller, S.
(2009). “Crazy so what!”: A school programme to promote mental health and reduce
stigma—results of a pilot study. Health Education, 109(4), 314-328.
Corrigan, P. W. (2004). How stigma interferes with mental health care. American
Psychologist, 59(7), 614-625.
Corrigan, P. W., & O’Shaughnessy, J, R. (2007). Changing mental illness stigma as it
exists in the real world. Australian Psychologist, 42, 90-97.
Corrigan, P. W., Rowan, D., Green, A., Lundin, R., River, P., Uphoff-Wasowski, K. et al.
(2002). Challenging two mental illness stigmas: Personal responsibility and
dangerousness. Schizophrenia Bulletin, 28, 293–310.
Corrigan, P. W., & Watson, A. C. (2002). Understanding the impact of stigma on people
with mental illness. World Psychiatry, 1(1):16-20.
Corrigan, P.W., & Watson, A.C. (2007). How children stigmatize people with mental
illness. International Journal of Social Psychiatry, 53(6), 526-546.
De Socio J., Stember L., & Schrinsky J. (2006). Teaching children about mental health
and illness: a school nurse health education program. Journal of School of Nursing
22(2), 81-86.
Dimitrov, D. M., & Rumrill, P. D. (2003). Pre-test-post-test designs and measurement of
change. Work: A Journal of Prevention, Assessment and Rehabilitation, 20(2), 159-
165.
Economou, M., Louki E., Peppou, L. E., Gramandani, C., Yotis, L., & Stefanis, C. N.
(2012). Fighting psychiatric stigma in the classroom: The impact of an educational
106
intervention on secondary school students’ attitudes to schizophrenia. International
Journal of Social Psychiatry, 58(5), 544-551.
Essler, V., Stickley, T., & Arthur, A. (2006). A better place for everyone. Mental Health
Today (Brighton, England), 16-18.
Gliner, J. A., Morgan, G.A., & Harmon, R.J. (2001). Clinicians’ guide to research
methods and statistics. Journal American Academia Child Adolescent Psychiatry,
40(4), 486-488.
Goffman, E. (1963). Stigma: Notes of the Management of Spoiled Identity. New York:
Simon & Schuster.
Grass, G. (2010). He Shoots! He Scores! A Tale from Iris the Dragon Series. Smith Falls,
Ontario: Dollco Printing.
Graneheim, U. H., & Lundman, B. (2004). Qualitative content analysis in nursing
research: concepts, procedures and measures to achieve trustworthiness. Nurse
Education Today, 24, 105-112.
Heath, M. A., Sheen, D., Leavy, D., Young, E., & Money, K. (2005). Bibliotherapy a
resource to facilitate emotional healing and growth. School Psychology
International, 26(5), 563-580.
Heijnders, M., & Van Der Meij. (2006). The fight against stigma: an overview of stigma-
reduction strategies and interventions. Psychology, Health & Medicine, 11(3), 353-
363.
Hennessy, E., Sword, L., & Heary, C. (2007). Children's understanding of psychological
problems displayed by their peers: a review of the literature. Child: Care, Health
and Development, 34(1), 4-9.
107
Hunt, S. (2008). Raising awareness of mental health in schoolchildren. Nursing Times,
104(25), 32-33.
Holloway, I., & Todres, L. (2003). The status of method: flexibility, consistency and
coherence. Qualitative Research, 3(3), 345-357.
IBM Corp. Released (2011). IBM SPSS Statistics for Windows, Version 20.0. Armonk,
NY: IBM Corp.
Innocent, J., Baker, C., Buchanan, D., Wilson, R., & Stuart, H. (2013). Opening Minds In
Middle School: Results of a Storybook Intervention. Kingston, Ontario. Mental
Health Commission of Canada.
Lawson, A., & Fouts, G. (2004). Mental illness in Disney animated films. Canadian
Journal of Psychiatry. Revue Canadienne De Psychiatrie, 49(5), 310-314.
Link, B. G., & Phelan, J. C. (2001). Conceptualizing stigma. Annual Review Sociology,
27, 363-385.
Link, B. G., Yang, L.H., Phelan, J. C., & Collins, P. Y. (2004). Measuring mental illness
stigma. Schizophrenia Bulleting, 30(3), 511-541.
Link, B. G., Phelan, J., Bresnahan, M., Stueve, A., & Pescosolido, B. (1999). Public
conceptions of mental illness: Labels, causes, dangerousness, and social distance.
American Journal of Public Health, 89, 1328–1333.
Mathisen, J. H. (2000). Stigma busting: Does strategic contact with individuals with
severe mental illness reduce negative attitudes in an adolescent population?
Dissertation Abstracts International: Section B: The Sciences and Engineering,
60(7-B), 3572.
108
Merriam-Webster's collegiate dictionary. (1994). In Merriam-Webster I. (Ed.), (10th ed.
ed.). Springfield, Mass: Merriam-Webster.
Koller, M., Chen, S-P, Heeny, B., Potts, A. Stuart, H. (2012). Opening Minds In High
School: Results of a Contact-Based Anti-Stigma Intervention. Kingston, Ontario.
Mental Health Commission of Canada.
Pardeck, J. T. (1995). Bibliotherapy: An innovative approach for helping children, Early
Child Development and Care, 110, 83-88.
Pardeck, J. T., & Pardeck, J. A. (1997). Recommended books for helping young children
deal with social and developmental problems, Early Child Development and Care
136, 57-63.
Pinfold, V., Thornicroft, G., Huxley, P., & Farmer, P. (2005). Active ingredients in anti-
stigma programmes in mental health. International Review of Psychiatry, 17(2). 123-
131.
Pinfold, V., Toulmin, H. Thornicraft, G., Huxley, P., Farmer, P., & Graham, T. (2003).
Reducing psychiatric stigma and discrimination: Evaluation of educational
interventions in UK secondary schools, British Journal of Psychiatry, 182, 342-346.
Pinto-Foltz, M.D., Logsdon, M. C., & Myers, J.A. (2011) Feasibility, acceptability, and
initial efficacy of a knowledge-contact program to reduce mental illness stigma and
improve mental health literacy in adolescents. Social Science & Medicine, 72 (12),
2011-2019.
Pinto-Foltz, M. D., & Logsdon, M. C. (2009). Conceptual model of research to reduce
stigma related to mental disorders in related to mental disorders in adolescents.
Issues in Mental Health Nursing, 30, 788-795.
109
Pitre, N., Stewart, S., Adams, S., Bedard, T., & Landry, S. (2007). The use of puppets
with elementary school children in reducing stigmatizing attitudes towards mental
illness, Journal of Mental Health, 16(3), 415-429.
Reinke, R. R., Corrigan, P. W., Leonhard, C., Lundin, R. K., & Kubiak, M. A. (2004).
Examining two aspects of contact on the stigma of mental illness. Journal of social
and clinical psychology, 23(3), 389.
Sakellari,E., Leino-Kilpi, H., & Kalokerinou-Anagnostopoulou,A. (2011). Educational
interventions in secondary education aiming to affect few pills attitudes towards
mental illness: a review of the literature. Journal of psychiatric and mental health
nursing, 18, 166-176.
Schachter, H. M., Girardi, A., Ly, M., Lacroix, D., Lumb, A. B., van Berkom, J., & Gill,
R. (2008). Effects of school-based interventions on mental health stigmatizing: A
systemic review. Child and Adolescent Psychiatry and Mental Health, 2,(18), 1-14.
Secker, J., Armstrong, C., & Hill, M. (1999). Young people’s understanding of mental
illness. Health Education Research Theory and Practice, 14(6), 729-739.
Shah, N. (2004). Changing minds at the earliest opportunity. Psychiatric Bulletin, 28(6),
213-215.
Sholl, C., Korkie, J., & Harper, D. (2009). Working with young people to challenge
discrimination against mental health service users. Clinical Psychology Forum, 196,
45-49.
Stafford, M. A., & Scott, R. R. (1986). Stigma deviance and social control: some
conceptual issues. In The Dilemma of Difference, (77-91). SC. Ainlay, G. Becker,
LM Coleman. New York: Plenum.

110
Stuart, H. (2006). Reaching out to high school youth: The effectiveness of a video-based
anti-stigma program. The Canadian Journal of Psychiatry / La Revenue Canadienne
De Psychaitrie, 51(10), 646-653.
Ventieri, D., Clarke, D. M., & Hay M. (2011). The effects of a school-based educational
intervention on pre-adolescents’ knowledge of and attitudes towards mental illness.
Advances in School Mental Health Promotion, 4(3), 5-17.
Wahl, O. E. (2003). Depictions of mental illnesses in children’s media. Journal of Mental
Health, 12(3), 249-258.
Watson, A. C., Otey, E., Westbrook, A. L., Lamb, T. A., Corrigan, P.W., & Fenton, W. S.
(2004). Changing middle schoolers’ attitudes about mental illness through education.
Schizophrenia Bulletin, 30(3), 563-572.
Weiss, M. (1994). Children’s attitudes towards the mentally ill: an eight-year longitudinal
follow-up. Psychological Reports, 74, 51-56.
WHO (2005). Child and adolescent mental health policies and plans (Mental Health
Ploicy and Service Guidance Package). [online]. Available at:
http://www.who.int/mental_health/policy/childado_mh_module.pdf.
Wilson, C. Nairn, R., Coverdale, J., & Panapa, A. (2000). How mental illness is
portrayed in children’s television. A prospective study. The British Journal of
Psychiatry: The Journal of Mental Science, 176, 440-443.
Woolfson, L., Woolfson, L., Mooney, L., & Bryce, D. (2008). Young people's view of
mental health education in secondary schools: a Scottish study. Child: care, health
and development, 35(6), 790-798.
111
Wykes, T. (2003). Book reviews reducing discrimination: review of children's book with
the mental health theme. Journal of mental health, 12(3), 307-331.
Yamaguchi, S., Mino, Y., & Uddin, S. (2011). Strategies and future attempts to reduce
stigmatization and increase awareness of mental health problems among young
people: A narrative review of educational interventions. Psychiatry and Clinical
Neurosciences, 65(5), 405-415.
Yang, L. H., & Kleinman, A. (2008). Face and the embodiment of stigma in China: The
cases of schizophrenia and AIDS. Social Science & Medicine, 67, 398-408.
112
Appendix A
Manoeuvre
The study occurred in classrooms and designated areas of schools where
permission to conduct the study was granted. The total classroom instructional time
required for the study was 1 hour maximum broken into two visits. During the first visit it
took 5 minutes to collect baseline data after the students were settled and ready; the
second visit took 50-55 minutes to complete the study. The first pre-test was given at
approximately two weeks before the anti-stigma book intervention was given to read in
both hands on and audio/visual format. At the second visit, the same 5 minute pre-test
questionnaire was given again immediately prior to the 27 minute anti-stigma book
intervention. The post-test took 10 minutes to complete; some students took a little
longer. The 10 minute post-test was given immediately following the intervention and at
the end of the storybook, the students were asked if they had any questions. None of them
did.
Scripted instructions:
The students were asked to complete the YOS questionnaire based on their own thoughts
and experiences. They were told that their responses were anonymous since their names
were not going to appear on any of their responses. The same two sentences were
repeated at the second visit. Their teachers reminded them to write neatly and not to erase
responses if at all possible. The students were all provided with a short pencil with the
YOS questionnaire. No other information or education was provided.
113
Recruitment
Once approved by the school boards, a poster that described the study was sent to
the school principals with a teacher consent form to give to grades 7 and 8 teachers. I also
contacted school principals by phone to explain the study and to personally answer any
questions they may have had about the study. Teachers who consented to participate in
the study were provided with consent forms from their school principals. I followed up
with a phone call to the principal or their designate (often the secretary) to obtain the
signed consent forms. I picked up most of them upon arrival the day of the study. The
teachers who consented to participate were then contacted to provide them with letters of
information, parental consent forms and confidential envelopes to send home with the
students. The teachers were contacted one week prior to picking up the confidential
envelopes that were sent home with the students. Once picked up, a date and time were
set with the teacher to collect the first 5 minute questionnaire from the first group of 20
students who returned their signed consent forms.
Once in the classroom or designated area, the students were asked again if they
wished to participate and told that they could withdraw at any time from the study even
though they had agreed to participate. Those who wished to continue (which was all of
them) received the first questionnaire. The students were advised that I would return in
two weeks to complete the study. Two weeks later, I returned to the group to provide the
same 5 minute questionnaire, the book and the post-test. The second visit took between
50-55 minutes depending on whether or not the students used the entire time. The
114
students who wished to continue with the study were each given a book. The audio-visual
book was projected on the wall using my laptop and projector or Smart Boards. The
students either read from the book in their hands or followed the audio-visual book on the
screen.
Once the story book was read, the students were given the post-test to complete.
The tests was placed in envelopes and sealed for analysis. After the post-test, the students
were asked to debrief by asking any questions about the book. None had questions. The
prepared response had been: “The intent of the study was to inform you about perceptions
people may have about people who experience a mental illness. People who experience a
mental illness are not bad people. They simply have an illness like other people who have
a physical illness”. In order not to confuse the students and to maintain a consistent
message about mental illnesses, students were to be referred back to their health class
curriculum under the healthy living heading, where mental health is taught
(http://www.edu.gov.on.ca/eng/curriculum/elementary/healthcurr18.pdf.). Each student
who wanted one received a study participation certificate and the classroom teacher was
thanked for allowing access to their students. My thesis supervisors were the only ones
who had access to the data collected. A research assistant was hired to enter the data. She
did not have access to any students’ names. However, she still ensured anonymity of the
results.

115
Appendix B
Youth Opinion survey (YOS)
Pre-test Participant Number ________________________ Page 1 of 2
In preparation for a study I am conducting, I am going to ask you a few questions about
mental illnesses. This will help me to understand your learning needs. Please answer the
following questions.
Some General Information About You:
Year of birth: ______ Month of birth: ______ Day of birth: ______
Female ( ) Male ( ) What grade are you in? _______
What words or phrases come to your mind to describe someone with a mental illness?
1._____________________________ 2. _____________________ 3___________________
The next few questions ask
you to agree or disagree
with a series of statements.
Please check the box that
best fits your opinion.
Strongly Disagree
Disagree Unsure Agree Strongly Agree
1 Most people with a mental illness are too disabled to work.
O O O O O
2 People with a mental illness tend to bring it on themselves.
O O O O O
3 People with mental illnesses often don’t try hard enough to get better.
O O O O O
4 People with a mental illness could snap out of it if they wanted to.
O O O O O
5 People with a mental illness are often more dangerous than the
average person.
O O O O O
6 People with a mental illness often become violent if not treated.
O O O O O
7 Most violent crimes are committed by people with a mental illness.
O O O O O
8 You can’t rely on someone with a mental illness.
O O O O O
9 You can never know what someone with a mental illness is going to do.
O O O O O
10 Most people with a mental illness get what they deserve.
O O O O O
11 People with serious mental illnesses need to be locked away.
O O O O O
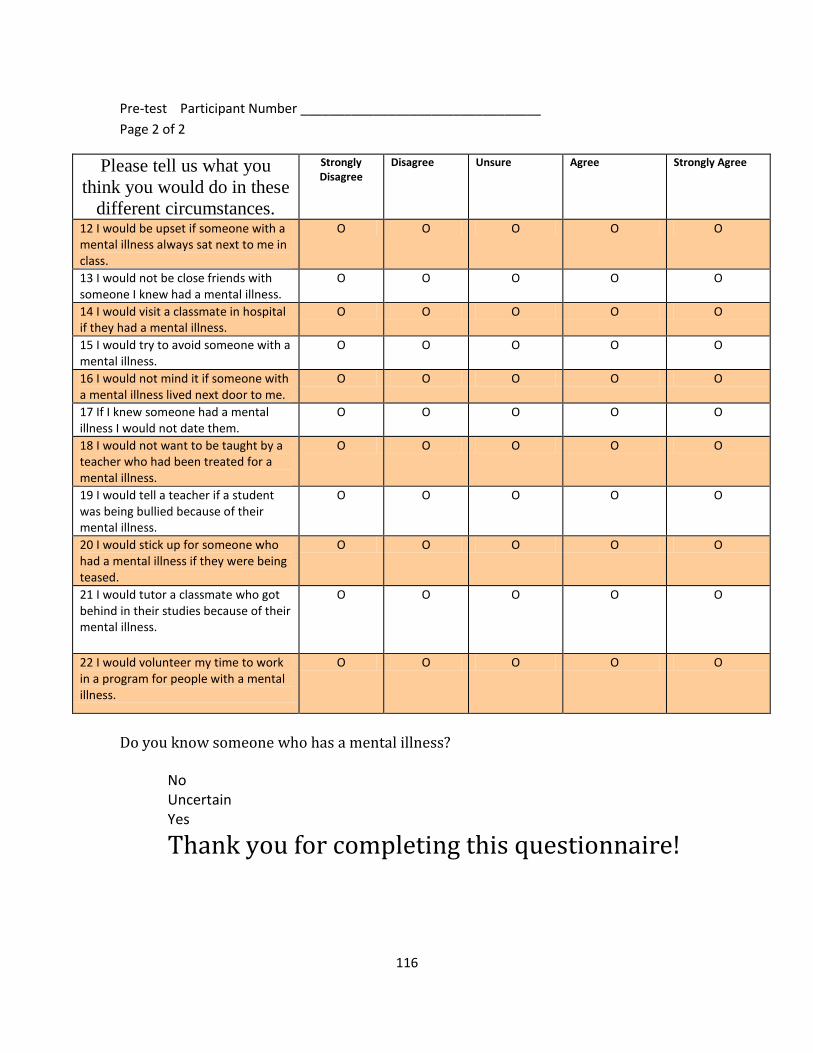
116
Pre-test Participant Number _________________________________
Page 2 of 2
Please tell us what you
think you would do in these
different circumstances.
Strongly Disagree
Disagree Unsure Agree Strongly Agree
12 I would be upset if someone with a mental illness always sat next to me in class.
O O O O O
13 I would not be close friends with someone I knew had a mental illness.
O O O O O
14 I would visit a classmate in hospital if they had a mental illness.
O O O O O
15 I would try to avoid someone with a mental illness.
O O O O O
16 I would not mind it if someone with a mental illness lived next door to me.
O O O O O
17 If I knew someone had a mental illness I would not date them.
O O O O O
18 I would not want to be taught by a teacher who had been treated for a mental illness.
O O O O O
19 I would tell a teacher if a student was being bullied because of their mental illness.
O O O O O
20 I would stick up for someone who had a mental illness if they were being teased.
O O O O O
21 I would tutor a classmate who got behind in their studies because of their mental illness.
O O O O O
22 I would volunteer my time to work in a program for people with a mental illness.
O O O O O
Do you know someone who has a mental illness? No Uncertain Yes
Thank you for completing this questionnaire!
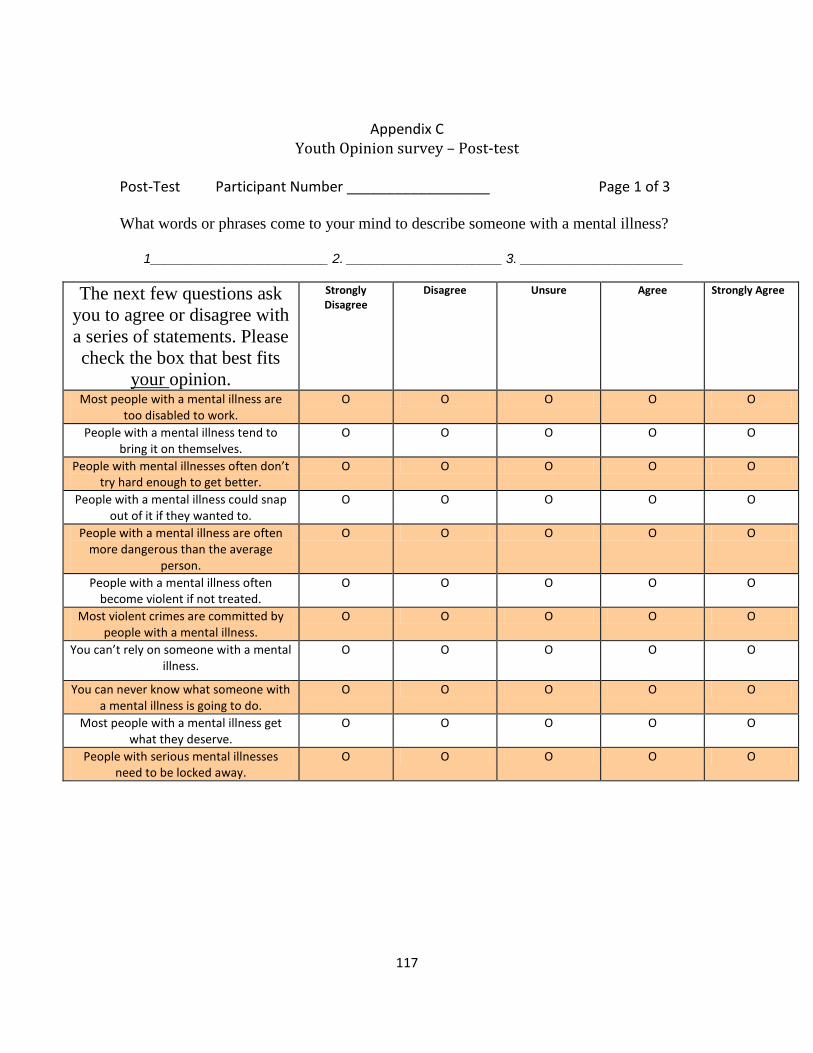
117
Appendix C
Youth Opinion survey – Post-test
Post-Test Participant Number __________________ Page 1 of 3
What words or phrases come to your mind to describe someone with a mental illness?
1________________________ 2. _____________________ 3. ______________________
The next few questions ask
you to agree or disagree with
a series of statements. Please
check the box that best fits
your opinion.
Strongly Disagree
Disagree Unsure Agree Strongly Agree
Most people with a mental illness are too disabled to work.
O O O O O
People with a mental illness tend to bring it on themselves.
O O O O O
People with mental illnesses often don’t try hard enough to get better.
O O O O O
People with a mental illness could snap out of it if they wanted to.
O O O O O
People with a mental illness are often more dangerous than the average
person.
O O O O O
People with a mental illness often become violent if not treated.
O O O O O
Most violent crimes are committed by people with a mental illness.
O O O O O
You can’t rely on someone with a mental illness.
O O O O O
You can never know what someone with a mental illness is going to do.
O O O O O
Most people with a mental illness get what they deserve.
O O O O O
People with serious mental illnesses need to be locked away.
O O O O O
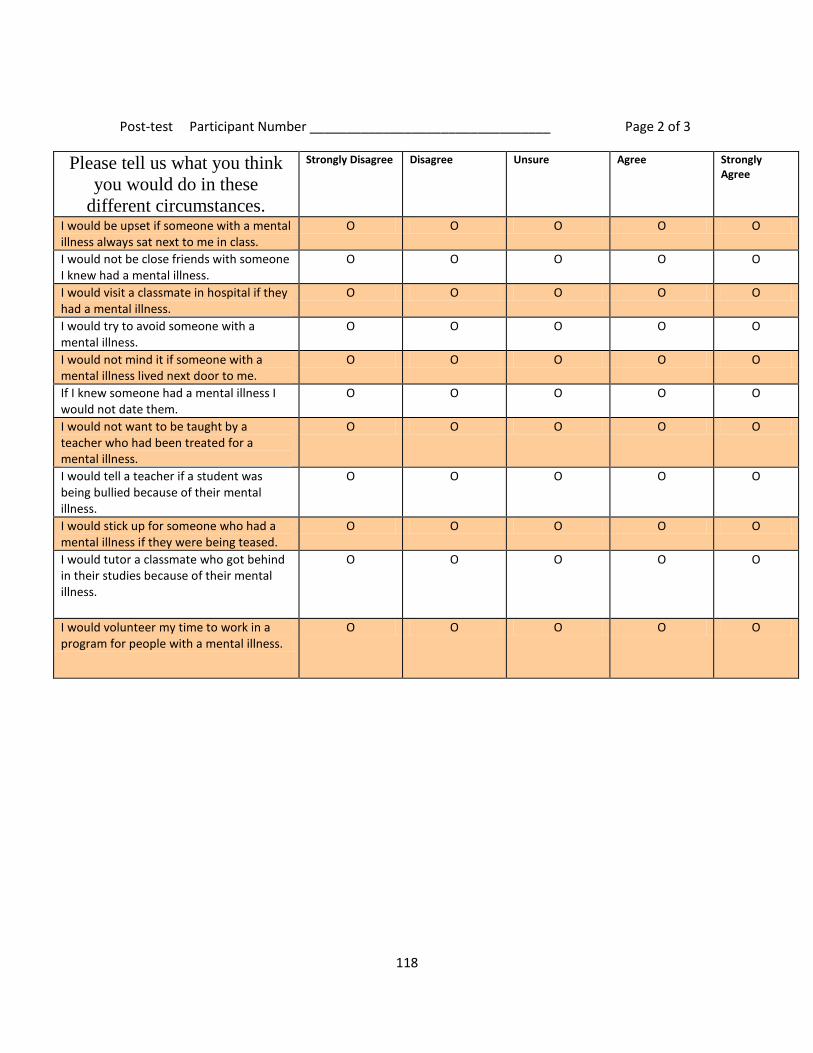
118
Post-test Participant Number _________________________________ Page 2 of 3
Please tell us what you think
you would do in these
different circumstances.
Strongly Disagree Disagree Unsure Agree Strongly Agree
I would be upset if someone with a mental illness always sat next to me in class.
O O O O O
I would not be close friends with someone I knew had a mental illness.
O O O O O
I would visit a classmate in hospital if they had a mental illness.
O O O O O
I would try to avoid someone with a mental illness.
O O O O O
I would not mind it if someone with a mental illness lived next door to me.
O O O O O
If I knew someone had a mental illness I would not date them.
O O O O O
I would not want to be taught by a teacher who had been treated for a mental illness.
O O O O O
I would tell a teacher if a student was being bullied because of their mental illness.
O O O O O
I would stick up for someone who had a mental illness if they were being teased.
O O O O O
I would tutor a classmate who got behind in their studies because of their mental illness.
O O O O O
I would volunteer my time to work in a program for people with a mental illness.
O O O O O
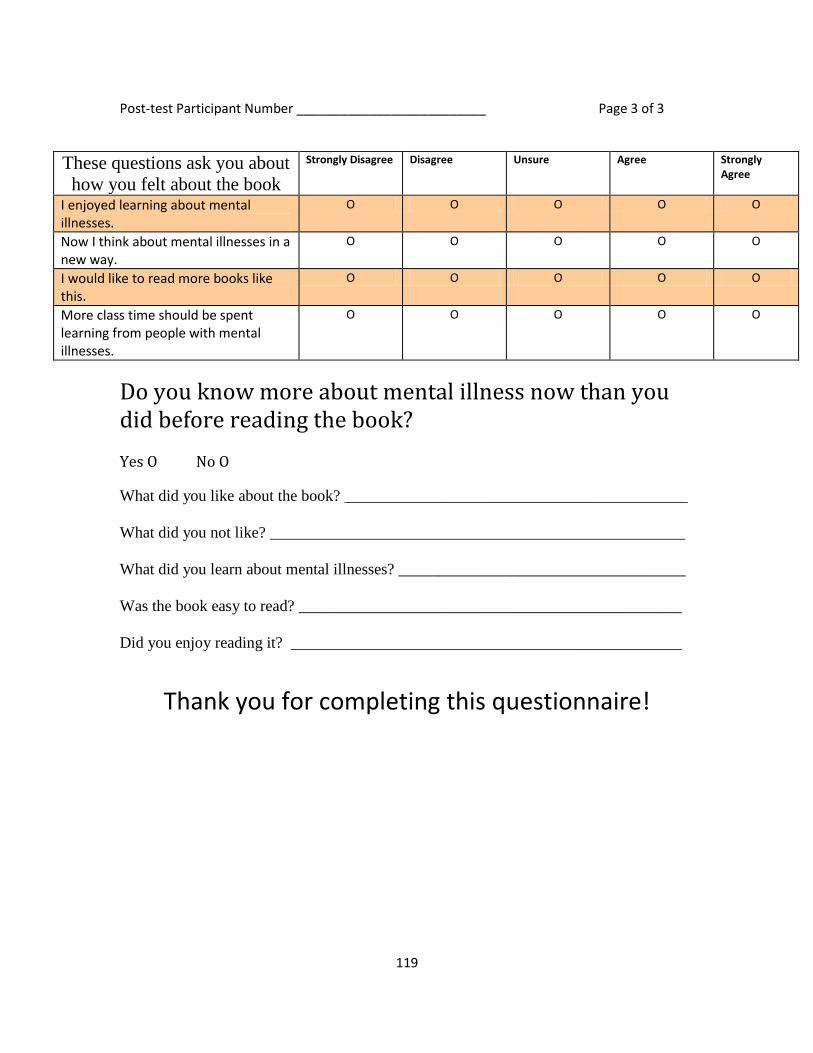
119
Post-test Participant Number __________________________ Page 3 of 3
These questions ask you about
how you felt about the book
Strongly Disagree Disagree Unsure Agree Strongly Agree
I enjoyed learning about mental illnesses.
O O O O O
Now I think about mental illnesses in a new way.
O O O O O
I would like to read more books like this.
O O O O O
More class time should be spent learning from people with mental illnesses.
O O O O O
Do you know more about mental illness now than you did before reading the book? Yes O No O
What did you like about the book? ___________________________________________
What did you not like? ____________________________________________________
What did you learn about mental illnesses? ____________________________________
Was the book easy to read? ________________________________________________
Did you enjoy reading it? _________________________________________________
Thank you for completing this questionnaire!
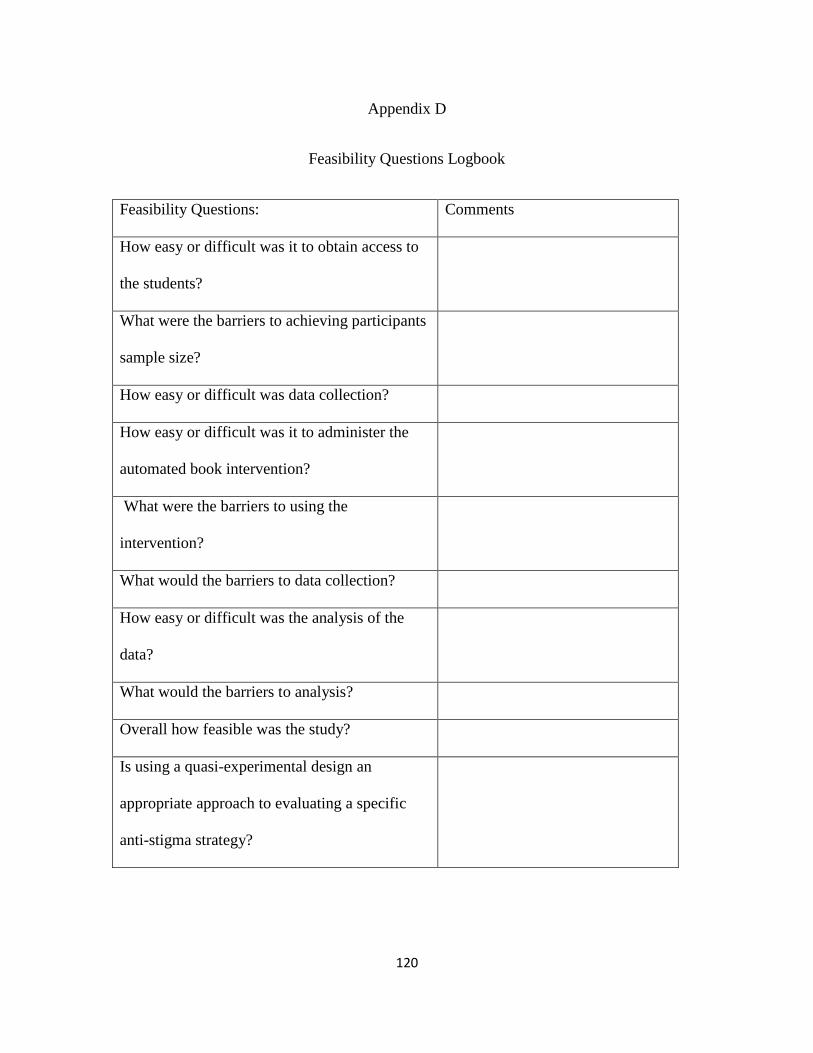
120
Appendix D
Feasibility Questions Logbook
Feasibility Questions: Comments
How easy or difficult was it to obtain access to
the students?
What were the barriers to achieving participants
sample size?
How easy or difficult was data collection?
How easy or difficult was it to administer the
automated book intervention?
What were the barriers to using the
intervention?
What would the barriers to data collection?
How easy or difficult was the analysis of the
data?
What would the barriers to analysis?
Overall how feasible was the study?
Is using a quasi-experimental design an
appropriate approach to evaluating a specific
anti-stigma strategy?
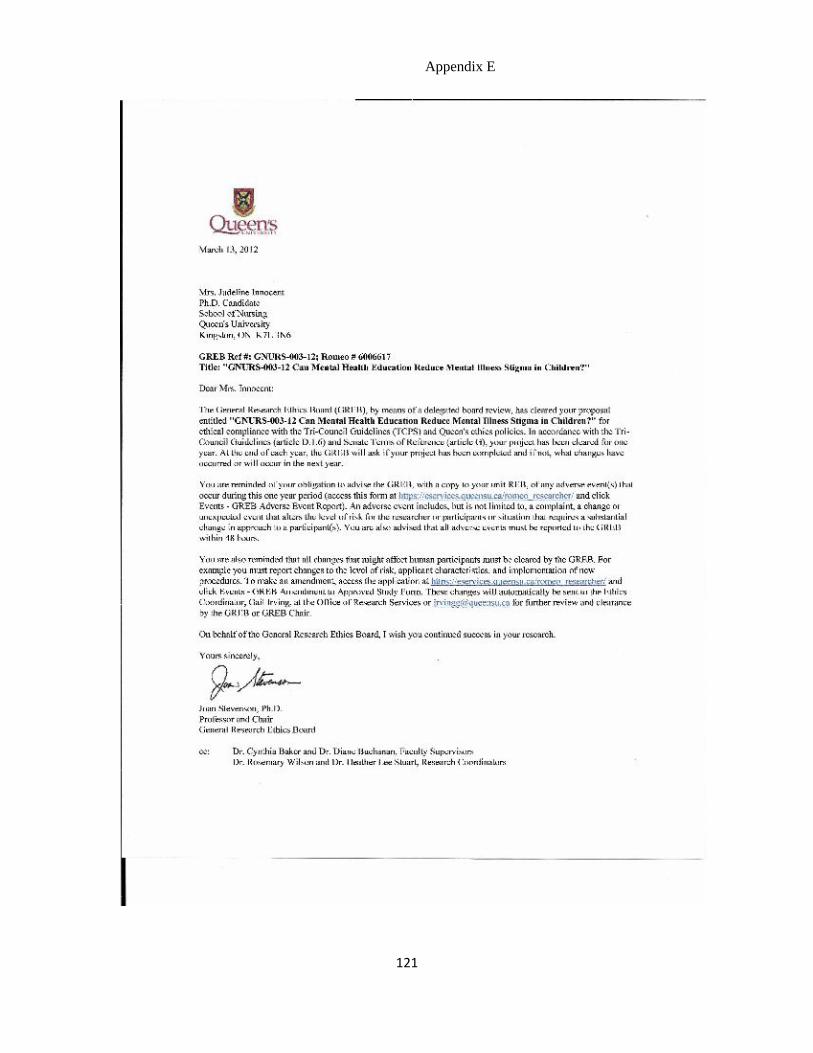
121
Appendix E
122
Appendix F

123
Appendix G
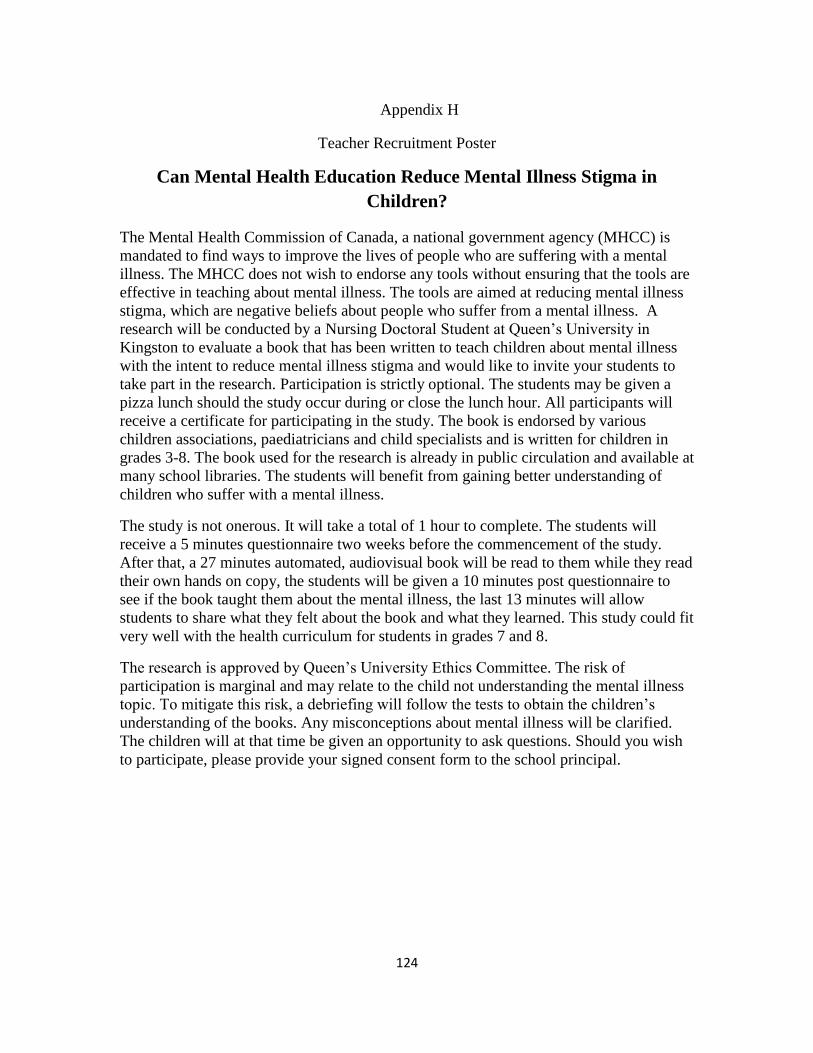
124
Teacher Recruitment Poster
Can Mental Health Education Reduce Mental Illness Stigma in
Children?
The Mental Health Commission of Canada, a national government agency (MHCC) is
mandated to find ways to improve the lives of people who are suffering with a mental
illness. The MHCC does not wish to endorse any tools without ensuring that the tools are
effective in teaching about mental illness. The tools are aimed at reducing mental illness
stigma, which are negative beliefs about people who suffer from a mental illness. A
research will be conducted by a Nursing Doctoral Student at Queen’s University in
Kingston to evaluate a book that has been written to teach children about mental illness
with the intent to reduce mental illness stigma and would like to invite your students to
take part in the research. Participation is strictly optional. The students may be given a
pizza lunch should the study occur during or close the lunch hour. All participants will
receive a certificate for participating in the study. The book is endorsed by various
children associations, paediatricians and child specialists and is written for children in
grades 3-8. The book used for the research is already in public circulation and available at
many school libraries. The students will benefit from gaining better understanding of
children who suffer with a mental illness.
The study is not onerous. It will take a total of 1 hour to complete. The students will
receive a 5 minutes questionnaire two weeks before the commencement of the study.
After that, a 27 minutes automated, audiovisual book will be read to them while they read
their own hands on copy, the students will be given a 10 minutes post questionnaire to
see if the book taught them about the mental illness, the last 13 minutes will allow
students to share what they felt about the book and what they learned. This study could fit
very well with the health curriculum for students in grades 7 and 8.
The research is approved by Queen’s University Ethics Committee. The risk of
participation is marginal and may relate to the child not understanding the mental illness
topic. To mitigate this risk, a debriefing will follow the tests to obtain the children’s
understanding of the books. Any misconceptions about mental illness will be clarified.
The children will at that time be given an opportunity to ask questions. Should you wish
to participate, please provide your signed consent form to the school principal.
Appendix H
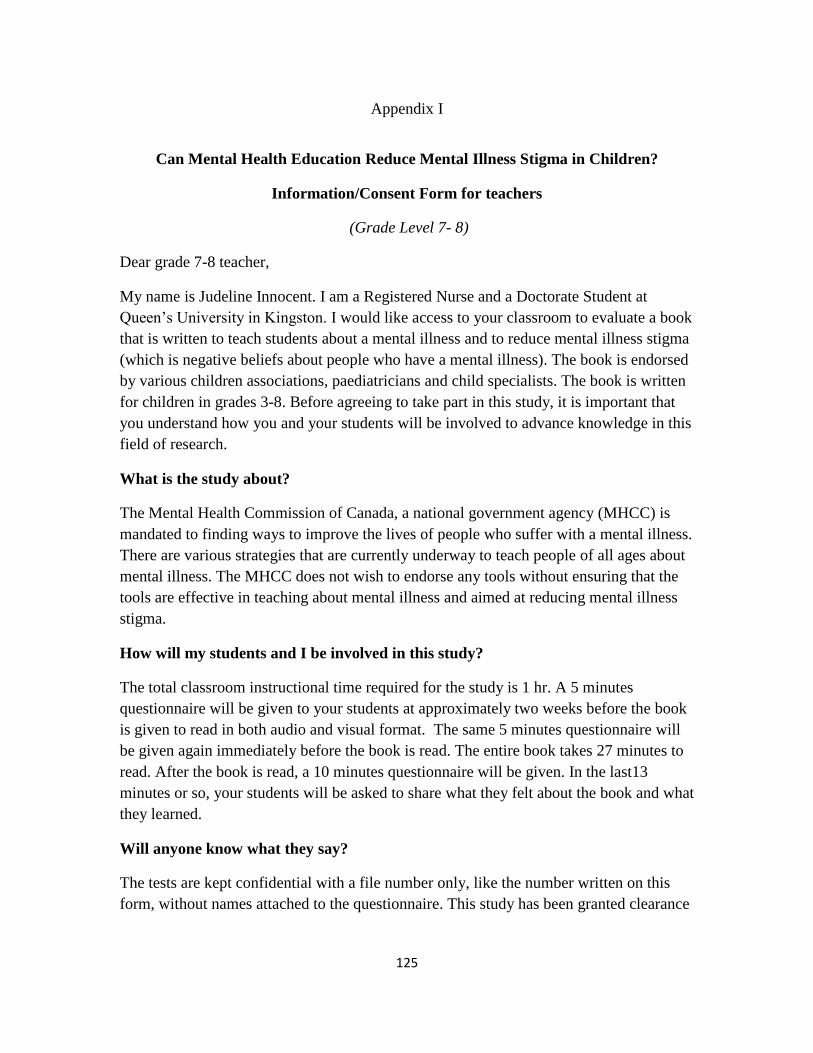
125
Appendix I
Can Mental Health Education Reduce Mental Illness Stigma in Children?
Information/Consent Form for teachers
(Grade Level 7- 8)
Dear grade 7-8 teacher,
My name is Judeline Innocent. I am a Registered Nurse and a Doctorate Student at
Queen’s University in Kingston. I would like access to your classroom to evaluate a book
that is written to teach students about a mental illness and to reduce mental illness stigma
(which is negative beliefs about people who have a mental illness). The book is endorsed
by various children associations, paediatricians and child specialists. The book is written
for children in grades 3-8. Before agreeing to take part in this study, it is important that
you understand how you and your students will be involved to advance knowledge in this
field of research.
What is the study about?
The Mental Health Commission of Canada, a national government agency (MHCC) is
mandated to finding ways to improve the lives of people who suffer with a mental illness.
There are various strategies that are currently underway to teach people of all ages about
mental illness. The MHCC does not wish to endorse any tools without ensuring that the
tools are effective in teaching about mental illness and aimed at reducing mental illness
stigma.
How will my students and I be involved in this study?
The total classroom instructional time required for the study is 1 hr. A 5 minutes
questionnaire will be given to your students at approximately two weeks before the book
is given to read in both audio and visual format. The same 5 minutes questionnaire will
be given again immediately before the book is read. The entire book takes 27 minutes to
read. After the book is read, a 10 minutes questionnaire will be given. In the last13
minutes or so, your students will be asked to share what they felt about the book and what
they learned.
Will anyone know what they say?
The tests are kept confidential with a file number only, like the number written on this
form, without names attached to the questionnaire. This study has been granted clearance
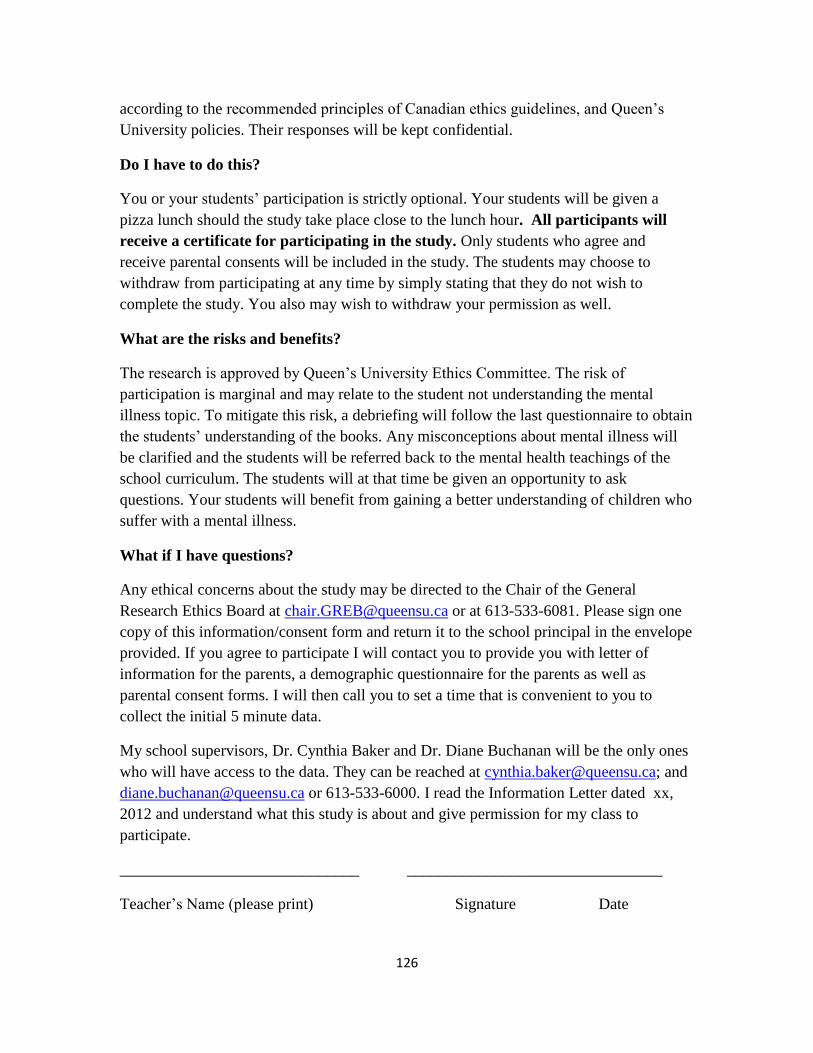
126
according to the recommended principles of Canadian ethics guidelines, and Queen’s
University policies. Their responses will be kept confidential.
Do I have to do this?
You or your students’ participation is strictly optional. Your students will be given a
pizza lunch should the study take place close to the lunch hour. All participants will
receive a certificate for participating in the study. Only students who agree and
receive parental consents will be included in the study. The students may choose to
withdraw from participating at any time by simply stating that they do not wish to
complete the study. You also may wish to withdraw your permission as well.
What are the risks and benefits?
The research is approved by Queen’s University Ethics Committee. The risk of
participation is marginal and may relate to the student not understanding the mental
illness topic. To mitigate this risk, a debriefing will follow the last questionnaire to obtain
the students’ understanding of the books. Any misconceptions about mental illness will
be clarified and the students will be referred back to the mental health teachings of the
school curriculum. The students will at that time be given an opportunity to ask
questions. Your students will benefit from gaining a better understanding of children who
suffer with a mental illness.
What if I have questions?
Any ethical concerns about the study may be directed to the Chair of the General
Research Ethics Board at [email protected] or at 613-533-6081. Please sign one
copy of this information/consent form and return it to the school principal in the envelope
provided. If you agree to participate I will contact you to provide you with letter of
information for the parents, a demographic questionnaire for the parents as well as
parental consent forms. I will then call you to set a time that is convenient to you to
collect the initial 5 minute data.
My school supervisors, Dr. Cynthia Baker and Dr. Diane Buchanan will be the only ones
who will have access to the data. They can be reached at [email protected]; and
[email protected] or 613-533-6000. I read the Information Letter dated xx,
2012 and understand what this study is about and give permission for my class to
participate.
______________________________ ________________________________
Teacher’s Name (please print) Signature Date
127
Appendix J
Can Mental Health Education Reduce Mental Illness Stigma in Children?
Information/Consent Form for Parents and Student
(Grade Level 7- 8)
Dear [name of parent],
My name is Judeline Innocent. I am a Registered Nurse and a Doctorate Student at
Queen’s University in Kingston. I will be in your child’s classroom in two weeks to
evaluate a book that is written to teach children about a mental illness and to reduce
mental illness stigma (which is negative beliefs about people who have a mental illness).
I would like to invite your child to take part in the research. The book is endorsed by
various children associations, paediatricians and child specialists. The book is written for
children in grades 3-8. Before agreeing to take part in this study, it is important that you
understand how you and your child will be involved to advance knowledge in this field of
research.
What is the study about?
The Mental Health Commission of Canada, a national government agency (MHCC) is
mandated to finding ways to improve the lives of people who suffer with a mental illness.
There are various strategies that are currently underway to teach people of all ages about
mental illness. The MHCC does not wish to endorse any tools without ensuring that the
tools are effective in teaching about mental illness and aimed at reducing mental illness
stigma.
How will my child and I be involved in this study?
The total classroom instructional time required for the study is 1 hr. A 5 minutes
questionnaire will be given to your child at approximately two weeks before the book is
given to read in both audio and visual format. The same 5 minutes questionnaire will be
given again immediately before the book is read. The entire book takes 27 minutes to
read. After the book is read, a 10 minutes questionnaire will be given. In the last13
minutes or so, your child will be asked to share what they felt about the book and what
they learned. Information given will be the same as used in the school health curriculum.
Will anyone know what I say?
The tests are kept confidential with a file number only, like the number written on this
form, without names attached to the questionnaire. This study has been granted clearance
according to the recommended principles of Canadian ethics guidelines, and Queen’s
University policies.
128
Do I have to do this?
You or your child’s participation is strictly optional. Your child will be given a pizza
lunch should the study take place close to the lunch hour. All participants will receive a
certificate for participating in the study. Your child’s option not to participate will not
affect their grades or schooling in anyway and your child may choose withdraw from
participating at any time by simply stating that they do not wish to complete the study.
What are the risks and benefits?
The research is approved by Queen’s University Ethics Committee. The risk of
participation is marginal and may relate to the child not understanding the mental illness
topic. To mitigate this risk, a debriefing will follow the last questionnaire to obtain the
children’s understanding of the books. Any misconceptions about mental illness will be
clarified. The children will at that time be given an opportunity to ask questions. Your
child will benefit from gaining a better understanding of children who suffer with a
mental illness.
What if I have questions?
Any ethical concerns about the study may be directed to the Chair of the General
Research Ethics Board at [email protected] or at 613-533-6081. Please sign one
copy of this information/consent form and return it to the school with the demographic
questionnaire in the envelope attached. The questionnaire is meant to collect general
information about you. Do not write your name and keep a copy for your records.
If you agree for your child to participate and if your child agrees to participate, please ask
them to sign below your signature and return this consent form with your questionnaire to
the classroom teacher in the envelope provided. Don’t forget to seal the envelope. My
school supervisors, Dr. Cynthia Baker and Dr. Diane Buchanan will be the only ones who
will have access to the information you provided. They can be reached at
[email protected]; and [email protected] or 613-533-6000.
I read the Information Letter dated xx, 2012 and understand what this study is about. I
understand that my child or I may drop out of the study at any time. I also consent to
completing the parental questionnaire attached to this consent form and return it to the
school.
____________________________________ _______________________________
Parent’s Name (please print) Signature Date
Your child’s consent and signature is required below:
I ________________agree to participate in this study _______________________Child’s
name Signature
Thank you
129
Appendix K
Can Mental Health Education Reduce Mental Illness Stigma in Children?
Parental Demographic Questionnaire
Participant Number __________________ School Number_________ Date__________________
Please circle your response to the questions below
Is your age?
25 or under
26-40
41-55
56 or older
What is your gender? Female Male
What is your primary language? English French Spanish Other ___________
What is your level of education?
Elementary school
High school or equivalent
Some college/University
College diploma )
Undergraduate degree
Graduate degree
Professional degree (MD, JD, etc.)
Other __________________________________________
What is your origin?
Arab
130
Asian/Pacific Islander
Black
Caucasian/White
Hispanic
Indigenous or Aboriginal
Latino
Multiracial
Would rather not say
Other
Do you know someone with a mental illness?
Yes
No
Other
Which of the following best describes the area you live in?
Urban
Suburban
Rural
THANK YOU
131
Appendix L
Can Mental Health Education Reduce Mental Illness Stigma in Children?
Information/Consent Form for Parents to Complete Demographic Questionnaire
Dear parent,
Attached to this package, you will find a document called parental demographic
questionnaire. This questionnaire provides information that may further add value to the
entire research; for example, the questions allow me to compare groups of people to see
how opinions may vary between groups. You may choose to complete this document
and return it to the school. It will take you less than 5 minutes to complete. You may
choose to allow your child to participate in the study but choose not complete the
parental demographic questionnaire, that is perfectly fine as well.
Risks and benefits
The option to complete the parental questionnaire or not is entirely yours, should you
decide not to complete the questionnaire, it will not alter or decrease the value of your
child’s participation.
Will anyone know what I say?
The tests are kept confidential so is your questionnaire. The questionnaire is only
identified with a file number only, without names attached to the questionnaire. This
study and questionnaire has been granted clearance according to the recommended
principles of Canadian ethics guidelines, and Queen’s University policies.
What if I have questions?
Any ethical concerns about the study may be directed to the Chair of the General
Research Ethics Board at [email protected] or at 613-533-6081 for any other
research related questions, please contact me at [email protected]. Please
sign one copy of this information/consent form and return it to the school with the
demographic questionnaire in the envelope attached. My school supervisors, Dr.
Cynthia Baker and Dr. Diane Buchanan will be the only ones who will have access to
the information you provided. They can be reached at [email protected]; and
[email protected] or 613-533-6000.
I read the Information Letter and understand that completing the questionnaire is
optional.
I choose to complete the questionnaire attached and return it to the school
___________________________________Signature
I choose not to complete the questionnaire attached. Thank you

132
Appendix M
Certificate of Participation

133
Appendix N
Reduction of similar vocabulary into simplified codes for Pre-test
The following words were similar in meaning to those in the simplified code, and
therefore were included under those codes:
Sub-category Expression Simplified Code
Social Responsibility & Desirability need a worker help
needs attention
difficult time learning
special education
need help
needs more help
Words used where meaning is unclear
Wheelchair

134
Reduction of similar vocabulary into simplified codes for Post-test
The following words were similar in meaning to others and therefore were included
under the simplified codes:
Sub-category Expression Simplified Code
Social Acceptance/Responsibility okay, equal, not different like us
still people, normal, gifted
equal, strong
hardworking, handy energetic
smiles, fun happy
nice, when treated nicely nice
kind nice
friend, smile, trust friendly
health healthy
can do what they want determined
confident, able determined
reliant leader
help from community help
needs attention
need extra
get taken care of
needs support
special help
without help
handicap
care
Words used where meaning is unclear
Uncertain, fear, mistaken, paying, sports, ignorance,
liability, nothing, self-conscious, willing, self-aware

135
Appendix O
136
Judeline Innocent, PhD (Candidate), Cynthia Baker PhD, Diane Buchanan, PhD,
Rosemary Wilson, PhD, and Heather Stuart, PhD.
November, 2012
Acknowledgements
This project was made possible through funding from the Opening Minds Anti-stigma Anti-
discrimination Initiative of the Mental Health Commission of Canada. The work of the
Mental Health Commission of Canada is supported by a grant from Health Canada. The
views expressed in this publication are those of the authors.
The authors wish to thank the Gayle Grass and the Iris the Dragon charity, and the school
boards, principals, teachers, staff, parents and students who participated in this project.
Michelle Koller, PhD Candidate, Queen’s University, developed the template for the
analysis used in this report. Dr. Heather Stuart, Michelle Koller, PhD Candidate and Dr.
Shu-Ping Chen developed the template for the report with input from Opening Minds staff,
Opening Minds Principal Investigators, and the Youth Program network.
This report is a part of a dissertation that has not yet been defended or copyrighted; it is a
draft report and is not for external public dissemination at this time. A final report with the
approved thesis will be sent to the Commission as soon as it becomes available.

137
OPENING MINDS: Changing how we see mental illness.
As part of its 10-year mandate, The Mental Health Commission of Canada has embarked on an anti-stigma initiative
called Opening Minds to change the attitudes and behaviours of Canadians towards people with a mental illness.
Opening Minds is the largest systematic effort undertaken in Canadian history to reduce the stigma and
discrimination associated with mental illness. Opening Minds is taking a targeted approach, initially reaching out to
healthcare providers, youth, the workforce and media. Opening Mind’s philosophy is to build on the strengths of
existing programs from across the county, and to scientifically evaluate their effectiveness. A key component of
programs being evaluated is contact-based educational sessions and educational materials intended to decrease
stigma, where target audiences hear personal stories from and interact with individuals who have experience with a
mental illness and have recovered or are managing their illness. Opening Mind’s goal is to replicate effective
programs nationally, develop new interventions to address gaps in existing programs and add other target groups
over time.
For more information go to:
www.mentalhealthcommission.ca/English/Pages/OpeningMinds.aspx
Introduction and Purpose
Stigma and discrimination have gained the attention of the public health and policy communities as a hidden and
costly burden cause by society’s prejudicial reaction to people with a mental illness (World Health Organization,
2001). Stigma and discrimination pose major obstacles in virtually every life domain, carrying significant negative
social and psychological impacts. Reducing stigma and discrimination have become important policy objectives at
both international and national levels (Sartorius & Schulze, 2005). The 2009 launch of the Mental Health
Commission’s Opening Minds anti-stigma anti-discrimination initiative marked the largest systematic effort to
combat mental illness related stigma in Canadian History.
The Opening Minds program has partnered with a number of programs that deliver contact-based education to
primary and high school students throughout Canada. Contact-based education involves people who have
experienced a mental illness to educate students by telling their personal stories and allowing time for active
discussion. In some cases, teacher lesson plans accompany the classroom presentations.
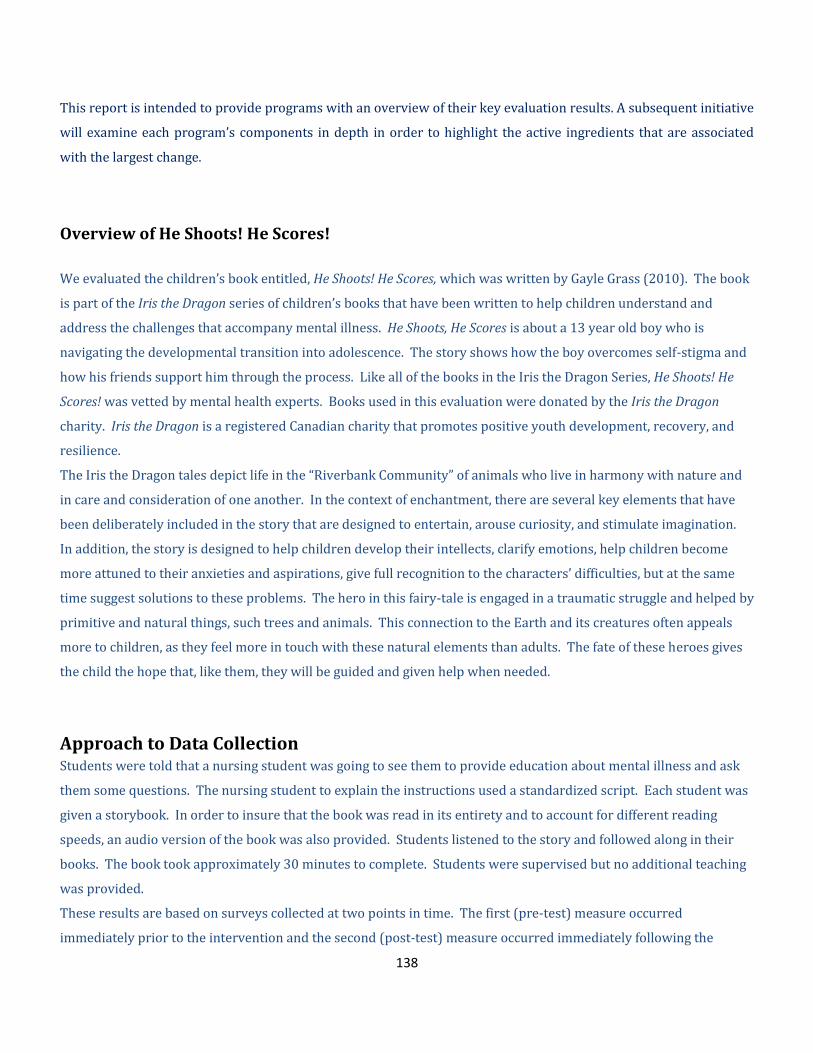
138
This report is intended to provide programs with an overview of their key evaluation results. A subsequent initiative
will examine each program’s components in depth in order to highlight the active ingredients that are associated
with the largest change.
Overview of He Shoots! He Scores!
We evaluated the children’s book entitled, He Shoots! He Scores, which was written by Gayle Grass (2010). The book
is part of the Iris the Dragon series of children’s books that have been written to help children understand and
address the challenges that accompany mental illness. He Shoots, He Scores is about a 13 year old boy who is
navigating the developmental transition into adolescence. The story shows how the boy overcomes self-stigma and
how his friends support him through the process. Like all of the books in the Iris the Dragon Series, He Shoots! He
Scores! was vetted by mental health experts. Books used in this evaluation were donated by the Iris the Dragon
charity. Iris the Dragon is a registered Canadian charity that promotes positive youth development, recovery, and
resilience.
The Iris the Dragon tales depict life in the “Riverbank Community” of animals who live in harmony with nature and
in care and consideration of one another. In the context of enchantment, there are several key elements that have
been deliberately included in the story that are designed to entertain, arouse curiosity, and stimulate imagination.
In addition, the story is designed to help children develop their intellects, clarify emotions, help children become
more attuned to their anxieties and aspirations, give full recognition to the characters’ difficulties, but at the same
time suggest solutions to these problems. The hero in this fairy-tale is engaged in a traumatic struggle and helped by
primitive and natural things, such trees and animals. This connection to the Earth and its creatures often appeals
more to children, as they feel more in touch with these natural elements than adults. The fate of these heroes gives
the child the hope that, like them, they will be guided and given help when needed.
Approach to Data Collection Students were told that a nursing student was going to see them to provide education about mental illness and ask
them some questions. The nursing student to explain the instructions used a standardized script. Each student was
given a storybook. In order to insure that the book was read in its entirety and to account for different reading
speeds, an audio version of the book was also provided. Students listened to the story and followed along in their
books. The book took approximately 30 minutes to complete. Students were supervised but no additional teaching
was provided.
These results are based on surveys collected at two points in time. The first (pre-test) measure occurred
immediately prior to the intervention and the second (post-test) measure occurred immediately following the
139
intervention. One hundred and twenty-seven students from five middle schools participated in all the components of
this evaluation.
All programs participating in this network initiative have used the same pre- and post-test survey questionnaires to
collect their data. These surveys were adapted from items used by the six contact based programs that participated
in the instrument development phase of this project. The resulting Stigma Evaluation Survey contained 22 self-
report items. Of these:
11 items measured stereotyped attributions
o controllability of illness – 4 items,
o potential for recovery – 2 items, and
o potential for violence and unpredictability – 5 items
11 items measured expressions of social tolerance, which include both social distance and social
responsibility items
o desire for social distance – 7 items, and
o social responsibility for mental health issues – 4 items
All items were scored on a 5-point agreement scale, ranging from strongly agree to strongly disagree. To avoid
potential response sets some items were positively worded while others were negatively worded. Items were scored
so that higher scores on any item would reflect higher levels of stigma. The scales had good reliability in this pooled
sample with a pre-test Cronbach’s alpha of 0.85 for the Stereotype Scale and 0.85 for the Social Tolerance Scale. Both
are well above the conventional threshold of .70 indicating that they are highly reliable. Information on gender, age
and grade was also collected.
Results
Sample Characteristics
Unless otherwise specified, the analysis is based on 127 matched pre and post-tests out of the 159 students (80%)
who completed the pre-test and post-test surveys. The characteristics of the students are presented in Table 1. The
majority (54%) were female. About half (49.6%) were 13 years old and most (68%) were in either grade 8. On the
pre-test almost three quarters (73%) of the students indicated they knew someone with a mental illness.
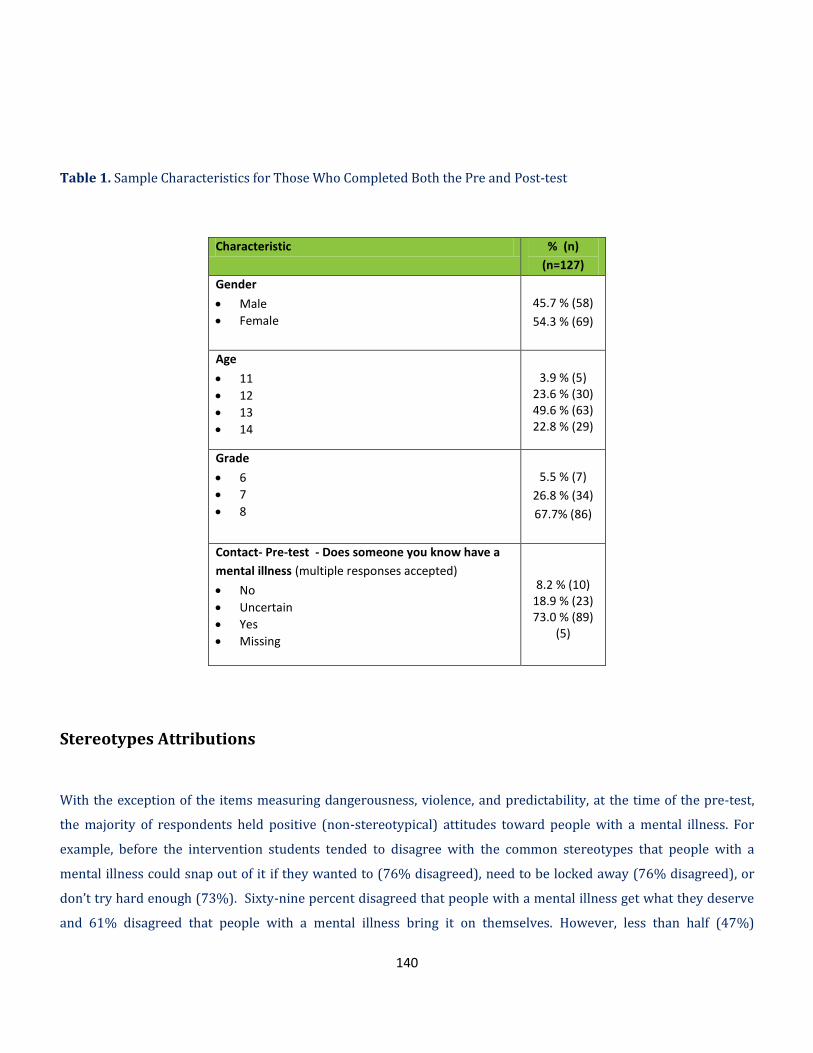
140
Table 1. Sample Characteristics for Those Who Completed Both the Pre and Post-test
Characteristic % (n)
(n=127)
Gender
Male
Female
45.7 % (58)
54.3 % (69)
Age
11
12
13
14
3.9 % (5) 23.6 % (30) 49.6 % (63) 22.8 % (29)
Grade
6
7
8
5.5 % (7)
26.8 % (34)
67.7% (86)
Contact- Pre-test - Does someone you know have a
mental illness (multiple responses accepted)
No
Uncertain
Yes
Missing
8.2 % (10) 18.9 % (23) 73.0 % (89)
(5)
Stereotypes Attributions
With the exception of the items measuring dangerousness, violence, and predictability, at the time of the pre-test,
the majority of respondents held positive (non-stereotypical) attitudes toward people with a mental illness. For
example, before the intervention students tended to disagree with the common stereotypes that people with a
mental illness could snap out of it if they wanted to (76% disagreed), need to be locked away (76% disagreed), or
don’t try hard enough (73%). Sixty-nine percent disagreed that people with a mental illness get what they deserve
and 61% disagreed that people with a mental illness bring it on themselves. However, less than half (47%)

141
disagreed with the stereotype that people with a mental illness are more dangerous than the average person and
slightly over one quarter (26%) disagreed with the stereotype that you can never know what someone with a
mental illness is going to do (see Appendix A for detailed tables).
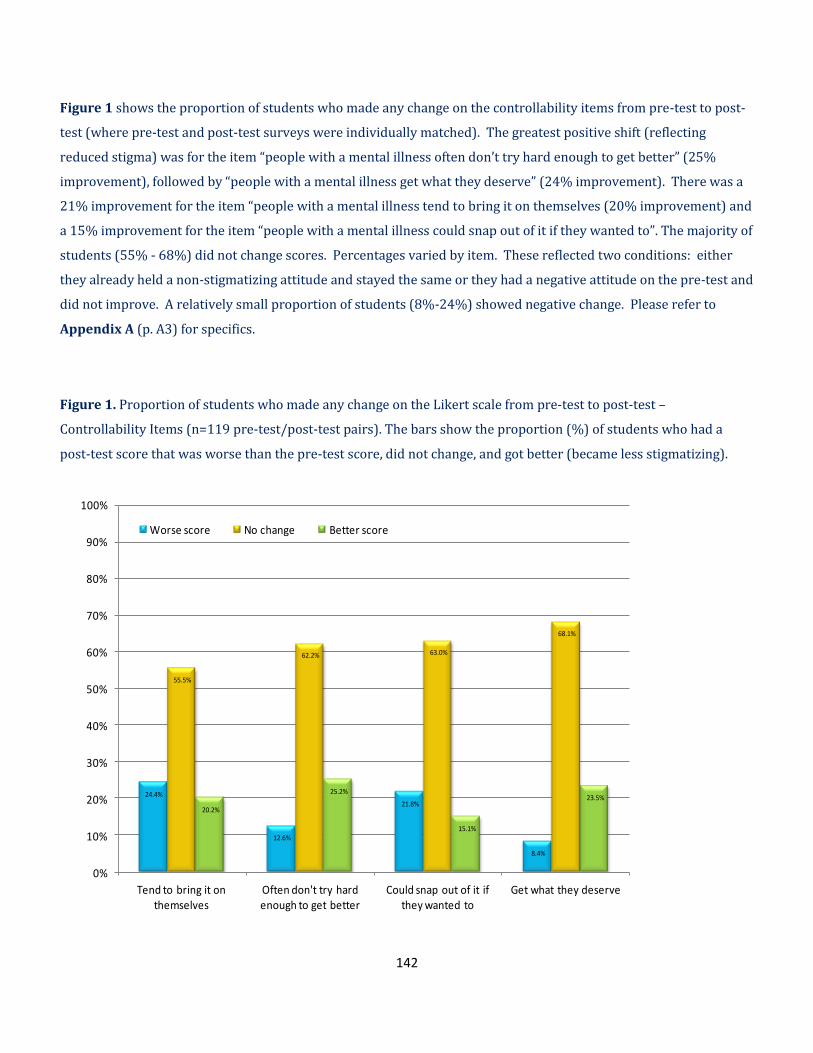
142
Figure 1 shows the proportion of students who made any change on the controllability items from pre-test to post-
test (where pre-test and post-test surveys were individually matched). The greatest positive shift (reflecting
reduced stigma) was for the item “people with a mental illness often don’t try hard enough to get better” (25%
improvement), followed by “people with a mental illness get what they deserve” (24% improvement). There was a
21% improvement for the item “people with a mental illness tend to bring it on themselves (20% improvement) and
a 15% improvement for the item “people with a mental illness could snap out of it if they wanted to”. The majority of
students (55% - 68%) did not change scores. Percentages varied by item. These reflected two conditions: either
they already held a non-stigmatizing attitude and stayed the same or they had a negative attitude on the pre-test and
did not improve. A relatively small proportion of students (8%-24%) showed negative change. Please refer to
Appendix A (p. A3) for specifics.
Figure 1. Proportion of students who made any change on the Likert scale from pre-test to post-test –
Controllability Items (n=119 pre-test/post-test pairs). The bars show the proportion (%) of students who had a
post-test score that was worse than the pre-test score, did not change, and got better (became less stigmatizing).
24.4%
12.6%
21.8%
8.4%
55.5%
62.2% 63.0%
68.1%
20.2%
25.2%
15.1%
23.5%
0%
10%
20%
30%
40%
50%
60%
70%
80%
90%
100%
Tend to bring it on themselves
Often don't try hard enough to get better
Could snap out of it if they wanted to
Get what they deserve
Worse score No change Better score
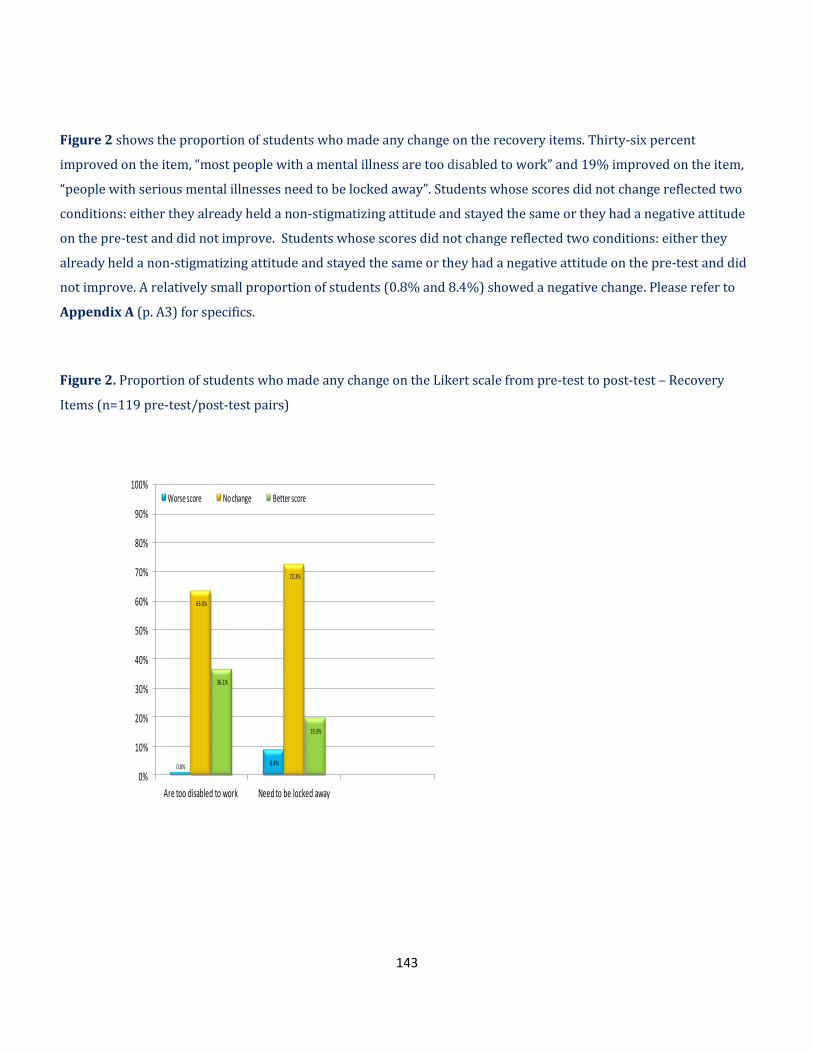
143
Figure 2 shows the proportion of students who made any change on the recovery items. Thirty-six percent
improved on the item, “most people with a mental illness are too disabled to work” and 19% improved on the item,
“people with serious mental illnesses need to be locked away”. Students whose scores did not change reflected two
conditions: either they already held a non-stigmatizing attitude and stayed the same or they had a negative attitude
on the pre-test and did not improve. Students whose scores did not change reflected two conditions: either they
already held a non-stigmatizing attitude and stayed the same or they had a negative attitude on the pre-test and did
not improve. A relatively small proportion of students (0.8% and 8.4%) showed a negative change. Please refer to
Appendix A (p. A3) for specifics.
Figure 2. Proportion of students who made any change on the Likert scale from pre-test to post-test – Recovery
Items (n=119 pre-test/post-test pairs)
0.8% 8.4%
63.0%
72.3%
36.1%
19.3%
0%
10%
20%
30%
40%
50%
60%
70%
80%
90%
100%
Are too disabled to work Need to be locked away
Worse score No change Better score
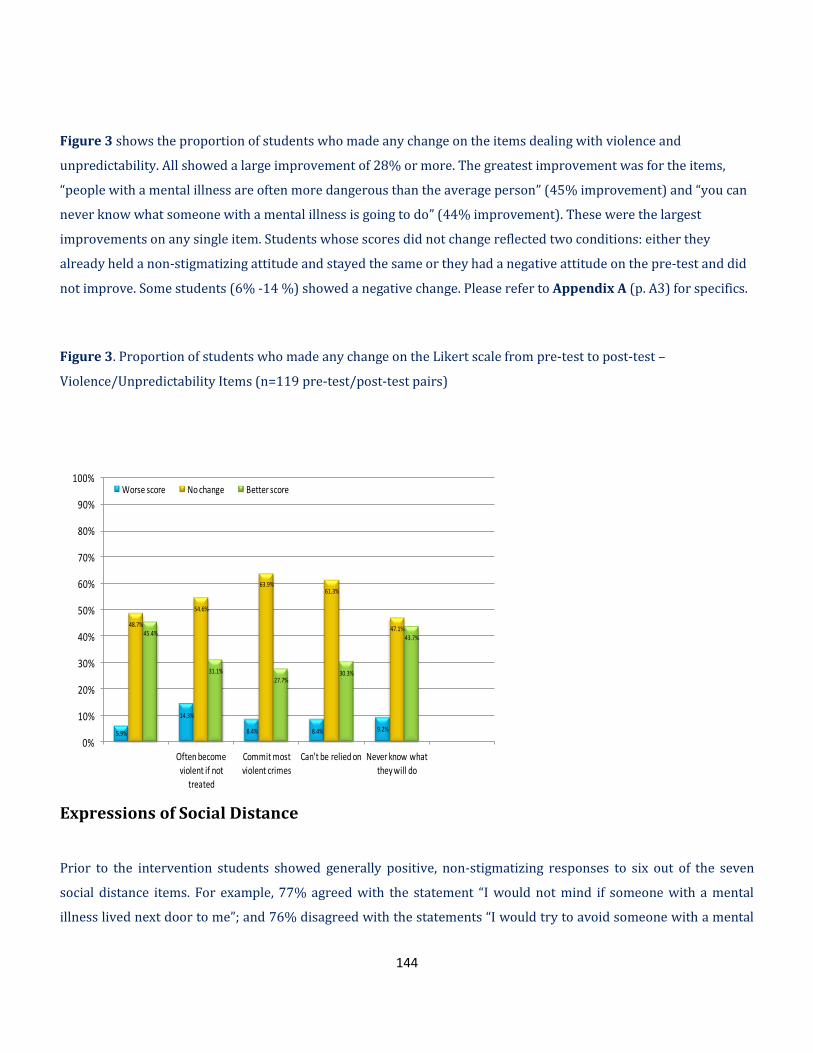
144
Figure 3 shows the proportion of students who made any change on the items dealing with violence and
unpredictability. All showed a large improvement of 28% or more. The greatest improvement was for the items,
“people with a mental illness are often more dangerous than the average person” (45% improvement) and “you can
never know what someone with a mental illness is going to do” (44% improvement). These were the largest
improvements on any single item. Students whose scores did not change reflected two conditions: either they
already held a non-stigmatizing attitude and stayed the same or they had a negative attitude on the pre-test and did
not improve. Some students (6% -14 %) showed a negative change. Please refer to Appendix A (p. A3) for specifics.
Figure 3. Proportion of students who made any change on the Likert scale from pre-test to post-test –
Violence/Unpredictability Items (n=119 pre-test/post-test pairs)
Expressions of Social Distance
Prior to the intervention students showed generally positive, non-stigmatizing responses to six out of the seven
social distance items. For example, 77% agreed with the statement “I would not mind if someone with a mental
illness lived next door to me”; and 76% disagreed with the statements “I would try to avoid someone with a mental
5.9%
14.3%
8.4% 8.4% 9.2%
48.7%
54.6%
63.9%61.3%
47.1%45.4%
31.1%27.7%
30.3%
43.7%
0%
10%
20%
30%
40%
50%
60%
70%
80%
90%
100%
Often become violent if not
treated
Commit most violent crimes
Can't be relied on Never know what they will do
Worse score No change Better score

145
illness” and 71% “I would not be close friends with someone I knew had a mental illness” (see Appendix A for
detailed tables.)
Figure 4 shows the proportion of students who made any change on the social distance items. All items showed
improvement. For example, following the intervention there was a 37% improvement in the item “I would be upset
if someone with a mental illness always sat next to me in class, and a 31% improvement in the items “I would not be
close friends with someone I knew had a mental illness” and “If I knew someone had a mental illness I would not
date them”. Similarly, there was a 30% improvement for the items, “I would not want to be taught by a teacher who
had been treated for a mental illness” and “I would try to avoid someone with a mental illness”. Students whose
scores did not change reflected two conditions: either they already held a non-stigmatizing attitude and stayed the
same or they had a negative attitude on the pre-test and did not improve. Some students (5-17%) showed a
negative change (see Appendix A, p. A8).
Figure 4. Proportion of students who made any change on the Likert scale from pre-test to post-test – Social
Distance Items (n=115 pre-test/post-test pairs)
Social Responsibility
Before the storybook intervention, students were generally socially conscious. Eighty-five percent said “they would
stick up for someone who had a mental illness if they were being teased” and 84% percent said they “would tell a
teacher if a student was being bullied because of their mental illness” (see Appendix A for detailed tables).
7.8% 10.4%13.9%
5.2%
17.4%
10.4% 8.7%
54.8%58.3%
67.8%64.3%
60.0% 58.3%60.9%
37.4%
31.3%
18.3%
30.4%
22.6%
31.3% 30.4%
0%
10%
20%
30%
40%
50%
60%
70%
80%
90%
100%
Upset if someonewith a mental
illness always satnext to me in
class
I would not beclose friends with
someone I knewhad a mental
illness
I would visit aclassmate in
hospital if theyhad a mental
illness
I would try toavoid someone
with a mentalillness
I would not mindit if someone
with a mentalillness lived next
door to me
If I knewsomeone had a
mental illness Iwould not date
them
I would not wantto be taught by a
teacher who hadbeen treated fora mental illness
Worse score No Change Better score

146
Figure 5 shows the proportion of students who made any change on the social responsibility items. The highest
changes were noted for two items: “I would volunteer my time to work in a program for people with mental illness”
(19% improvement) and “I would tutor a classmate who got behind in their studies because of their mental illness”
(17% improvement). Students whose scores did not change reflected two conditions: either they already held a non-
stigmatizing attitude and stayed the same or they had a negative attitude on the pre-test and did not improve. A
proportion of students (8% to 16%) showed a negative change (see Appendix A, p. A8).
Figure 5. Proportion of students who made any change on the Likert scale from pre-test to post-test – Social
Responsibility items (n=115 pre-test/post-test pairs)
Overall Success
In order to provide a measure of the overall success of the intervention, we chose (a priori) a cut-off score of 80%
correct. Though somewhat arbitrary, we have used this cutoff in previous work to count the number of students who
achieve an A grade or higher following an educational session. More specifically, success was measured by
15.7%
8.7%11.3%
7.8%
71.3%
75.7%72.2% 73.0%
13.0%15.7% 16.5%
19.1%
0%
10%
20%
30%
40%
50%
60%
70%
80%
90%
100%
I would tell a teacher if a student was being
bullied because of their
mental illness
I would stick up for someone who had a mental illness if they
were being teased
I would tutor a classmate who got behind in their studies because of their
mental illness
I would volunteer my time to work in a
program for people with
a mental illness
Negative Change No Change Positive Change

147
comparing the proportion of students who obtained 80% or more correct (non-stigmatizing) answers on the post-
test compared to the pre-test.
Figure 6 shows the cumulative percent of items reflecting non-stigmatizing responses for the Stereotype Scale. Prior
to the intervention, 28% of students gave a non-stigmatizing response to at least 9 of the 11 stereotype items
reflecting 80% correct (corresponding to the red-dotted line on the graphs below). At post-test this had increased to
41% (reflecting a 13% improvement overall). When item scores were aggregated to reflect a scale value out of 55,
the average (median) score dropped from 25 at the pre-test to 23 at the post-test (reflecting an 4% drop in the
average scale score). A Wilcoxon Signed Rank Test showed that at post-test there was a significant drop in the
Stereotype Scale Score (Z=-6.328, p<.001).
Figure 6. Cumulative Percent of Stereotype Scale Items Reflecting Non-stigmatizing response (n=119)
80% correct (Threshold of Success)

148
Figure 7 shows the cumulative percent of items reflecting non-stigmatizing responses for the Social Tolerance Scale.
Prior to the intervention 39% of the students gave a non-stigmatizing response to 9 the 11 items reflecting 80%
correct (corresponding to the red-dotted line on the graphs below). At post-test this had increased to 52%
(reflecting a 13% improvement overall). When item scores were aggregated to reflect a scale value out of 55, the
average (median) score dropped from 24 at the pre-test to 23 at the post-test (reflecting a 2% drop in the average
scale score). A Wilcoxon Signed Rank Test showed that at post-test there was a significant drop in the Social
Tolerance Scale Score (Z=-4.227, p<.001).
Figure 7. Cumulative Percent of Tolerance Items Reflecting Non-stigmatizing response (n=115)
80% correct (Threshold of Success)

149
Worse12.9%
Improved 32.8%
Newly positive
16.4 %Already positive
25.0 %
No change 12.9%
Figure 8 and 9 show the change in stereotype and social tolerance scale scores. Prior to the intervention more
respondents were positive (80% threshold, 9 out of 11 positive responses) on the tolerance scale (33.3%) compared
to the stereotype scale (25.0%). After the intervention, the percent that improved their attitudes by crossing the
80% threshold was 16% (stereotype scale) and 19% (tolerance scale). The percent that improved their scores but
did not cross the 80% threshold was 33% (stereotype scale) and 18% (tolerance scale).
Figure 8. Change in Stereotype Scale Score (n=116)
Notes: To adjust for regression to the mean, pre-test outliers (those whose pre-test scale scores were over 2 standard deviations beyond the mean) where omitted from this analysis.
Did not cross 80% threshold

150
Figure 9. Change in Social Tolerance Scale Score (n=108)
Notes: To adjust for regression to the mean, pre-test outliers (those whose pre-test scale scores were over 2 standard deviations beyond the mean) where omitted from this analysis.
Conclusion
This report describes the results of a storybook anti-stigma intervention provided to middle school students. The
results show that this intervention was successful in improving the proportion of students who got 80% of the
answers correct, so received an A grade, on the tests used to assess social stereotypes and social tolerance.
Findings also showed that a small number of students continued to hold stigmatizing beliefs despite their
participation—for example, almost 25% did not disagree with the stigmatizing statement that people with a mental
illness tend to bring it upon themselves. These findings suggest that while certain elements of the story appear to be
reducing stigma, there may be some messages that consolidate stereotypes, or fail to eradicate them, among certain
sub-groups of students. Considering that some students did not move in the expected direction, there may be some
value in assessing their ‘readiness for change’ in future evaluations to determine if their stage of change is predictive
Worse
16.7%
Improved 17.6%
Newly positive 19.4%
Already positive33.3%
No change 13.0%
Did not cross 80%
threshold

151
of program outcomes. Qualitative investigation may also help identify the active ingredients in the program or why
some students benefited more than others.
An important limitation of this evaluation was that the story was given in isolation from the usual interactive lesson
content and read in one sitting. The book is divided into four sections according to the four seasons that unfold in
the story line and should be read in four sections; each followed by discussion. By examining the book in isolation,
the full impact of the lesson plan was not realized. This may account for some of the variability across students and
likely underestimates the full effect. One outstanding question that was not addressed in this evaluation is how long
the effects last. Follow-up surveys, which were out of the scope of this study, would be needed to address this
question.
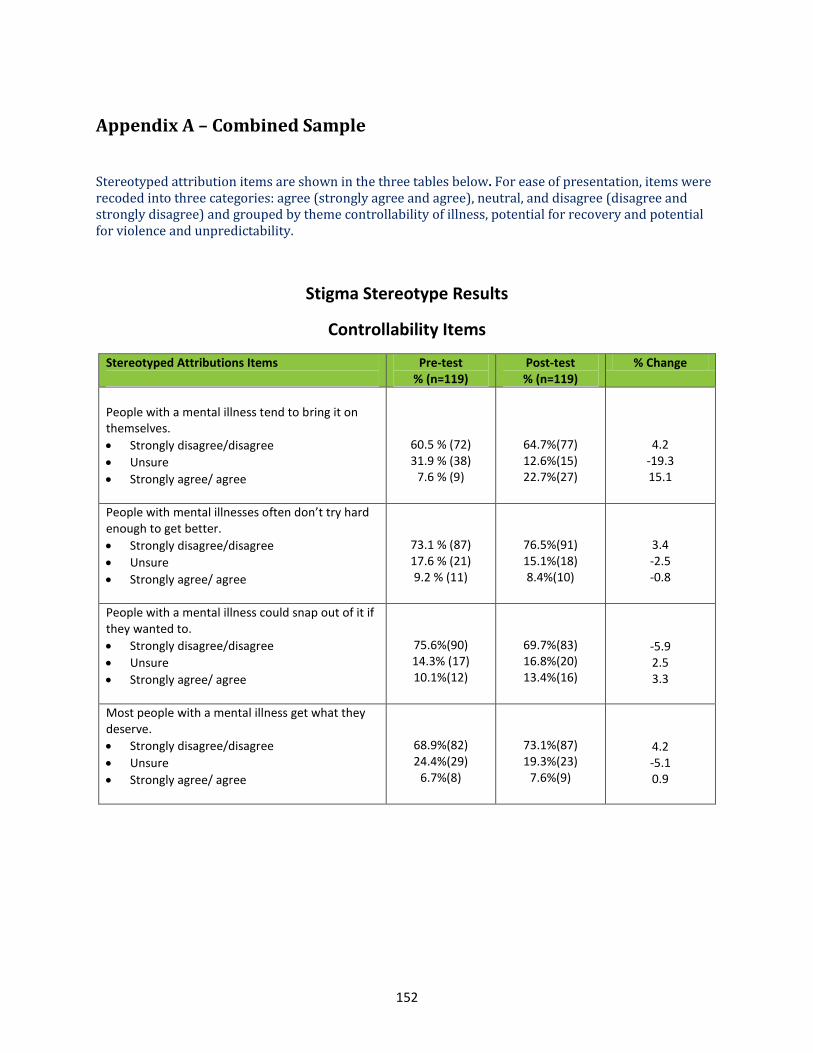
152
Appendix A – Combined Sample
Stereotyped attribution items are shown in the three tables below. For ease of presentation, items were recoded into three categories: agree (strongly agree and agree), neutral, and disagree (disagree and strongly disagree) and grouped by theme controllability of illness, potential for recovery and potential for violence and unpredictability.
Stigma Stereotype Results
Controllability Items
Stereotyped Attributions Items
Pre-test % (n=119)
Post-test % (n=119)
% Change
People with a mental illness tend to bring it on themselves.
Strongly disagree/disagree
Unsure
Strongly agree/ agree
60.5 % (72) 31.9 % (38)
7.6 % (9)
64.7%(77) 12.6%(15) 22.7%(27)
4.2 -19.3 15.1
People with mental illnesses often don’t try hard enough to get better.
Strongly disagree/disagree
Unsure
Strongly agree/ agree
73.1 % (87) 17.6 % (21) 9.2 % (11)
76.5%(91) 15.1%(18) 8.4%(10)
3.4 -2.5 -0.8
People with a mental illness could snap out of it if they wanted to.
Strongly disagree/disagree
Unsure
Strongly agree/ agree
75.6%(90) 14.3% (17) 10.1%(12)
69.7%(83) 16.8%(20) 13.4%(16)
-5.9 2.5 3.3
Most people with a mental illness get what they deserve.
Strongly disagree/disagree
Unsure
Strongly agree/ agree
68.9%(82) 24.4%(29)
6.7%(8)
73.1%(87) 19.3%(23)
7.6%(9)
4.2 -5.1 0.9

153
Recovery Items
Stereotyped Attributions Items
Pre-test % (n=119)
Post-test % (n=119)
% Change
Most people with a mental illness are too disabled to work.
Strongly disagree/disagree
Unsure
Strongly agree/ agree
70.6%(84) 20.2%(24) 9.2%(11)
92.4%(110) 4.2%(5) 3.4%(4)
21.8 -16 -5.8
People with serious mental illnesses need to be locked away.
Strongly disagree/disagree
Unsure
Strongly agree/ agree
75.6%(90) 17.6%(21) 6.7%(8)
82.4%(98) 14.3%(17)
3.4%(4)
6.8 -3.3 -3.3
Note: Missing excluded from percent calculation

154
Violence/ Unpredictability Items
Stereotyped Attributions Items
Pre-test % (n=119)
Post-test % (n=119)
% Change
People with a mental illness are often more dangerous than the average person.
Strongly disagree/disagree
Unsure
Strongly agree/ agree
47.1%(56) 28.6% (34) 24.4%(29)
66.4%(79) 23.5%(28) 10.1%(12)
19.3 -5.1
-14.3
People with a mental illness often become violent if not treated.
Strongly disagree/disagree
Unsure
Strongly agree/ agree
37.0% (44) 47.9% (57) 15.1% (18)
47.1% (56) 39.5% (47) 13.4% (16)
10.1 -8.4 -1.7
Most violent crimes are committed by people with a mental illness.
Strongly disagree/disagree
Unsure
Strongly agree/ agree
63.0%(75) 28.6%(34) 8.4%(10)
73.9%(88) 21.8%(26)
4.2%(5)
10.9 -6.8 -4.2
You can’t rely on someone with a mental illness.
Strongly disagree/disagree
Unsure
Strongly agree/ agree
61.3%(73) 27.7%(33) 10.9%(13)
79.0%(94) 13.4%(16)
7.6%(9)
17.7 -14.3 -3.3
You can never know what someone with a mental illness is going to do.
Strongly disagree/disagree
Unsure
Strongly agree/ agree
26.1%(31) 33.6%(40) 40.3%(48)
39.5% (47) 42.0%(50) 18.5%(22)
13.4 8.4
-21.8
Note: Missing excluded from percent calculation.
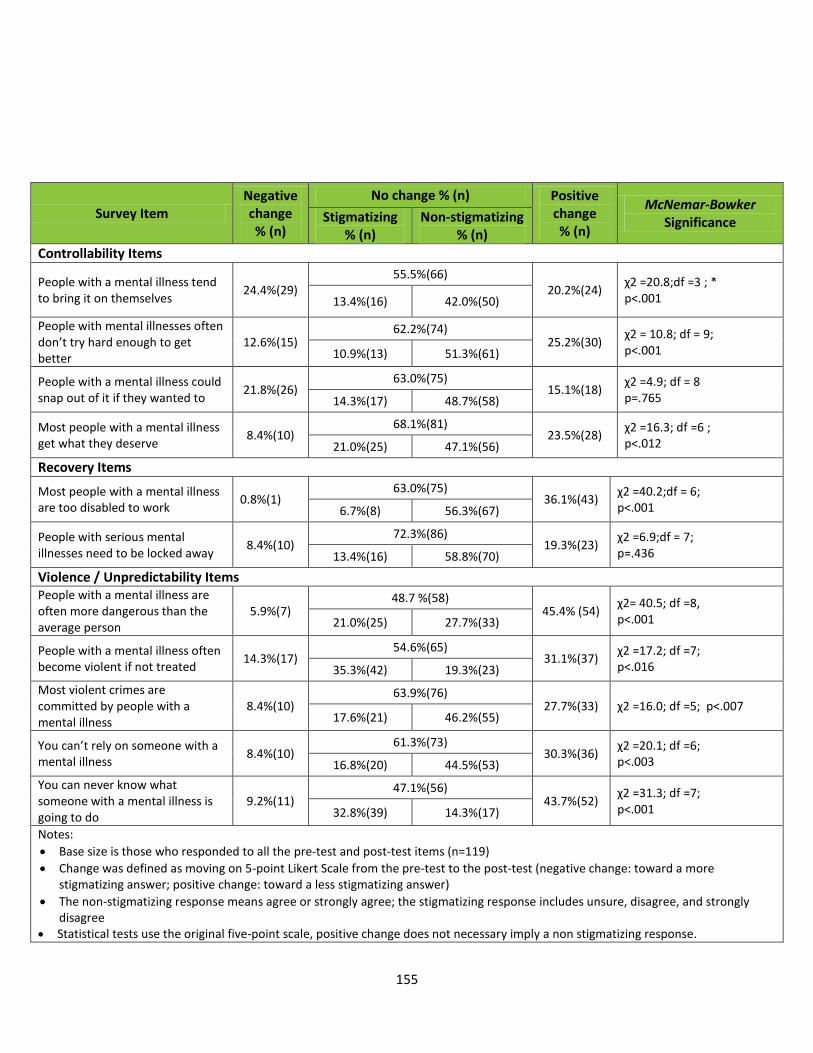
155
Survey Item Negative change % (n)
No change % (n) Positive change % (n)
McNemar-Bowker Significance Stigmatizing
% (n) Non-stigmatizing
% (n)
Controllability Items
People with a mental illness tend to bring it on themselves
24.4%(29) 55.5%(66)
20.2%(24) χ2 =20.8;df =3 ; * p<.001 13.4%(16) 42.0%(50)
People with mental illnesses often don’t try hard enough to get better
12.6%(15)
62.2%(74) 25.2%(30)
χ2 = 10.8; df = 9; p<.001 10.9%(13) 51.3%(61)
People with a mental illness could snap out of it if they wanted to
21.8%(26) 63.0%(75)
15.1%(18) χ2 =4.9; df = 8 p=.765 14.3%(17) 48.7%(58)
Most people with a mental illness get what they deserve
8.4%(10) 68.1%(81)
23.5%(28) χ2 =16.3; df =6 ; p<.012 21.0%(25) 47.1%(56)
Recovery Items
Most people with a mental illness are too disabled to work
0.8%(1) 63.0%(75)
36.1%(43) χ2 =40.2;df = 6; p<.001 6.7%(8) 56.3%(67)
People with serious mental illnesses need to be locked away
8.4%(10) 72.3%(86)
19.3%(23) χ2 =6.9;df = 7; p=.436 13.4%(16) 58.8%(70)
Violence / Unpredictability Items
People with a mental illness are often more dangerous than the average person
5.9%(7) 48.7 %(58)
45.4% (54) χ2= 40.5; df =8, p<.001 21.0%(25) 27.7%(33)
People with a mental illness often become violent if not treated
14.3%(17) 54.6%(65)
31.1%(37) χ2 =17.2; df =7; p<.016 35.3%(42) 19.3%(23)
Most violent crimes are committed by people with a mental illness
8.4%(10) 63.9%(76)
27.7%(33) χ2 =16.0; df =5; p<.007 17.6%(21) 46.2%(55)
You can’t rely on someone with a mental illness
8.4%(10) 61.3%(73)
30.3%(36) χ2 =20.1; df =6; p<.003 16.8%(20) 44.5%(53)
You can never know what someone with a mental illness is going to do
9.2%(11) 47.1%(56)
43.7%(52) χ2 =31.3; df =7; p<.001 32.8%(39) 14.3%(17)
Notes:
Base size is those who responded to all the pre-test and post-test items (n=119)
Change was defined as moving on 5-point Likert Scale from the pre-test to the post-test (negative change: toward a more stigmatizing answer; positive change: toward a less stigmatizing answer)
The non-stigmatizing response means agree or strongly agree; the stigmatizing response includes unsure, disagree, and strongly disagree
Statistical tests use the original five-point scale, positive change does not necessary imply a non stigmatizing response.
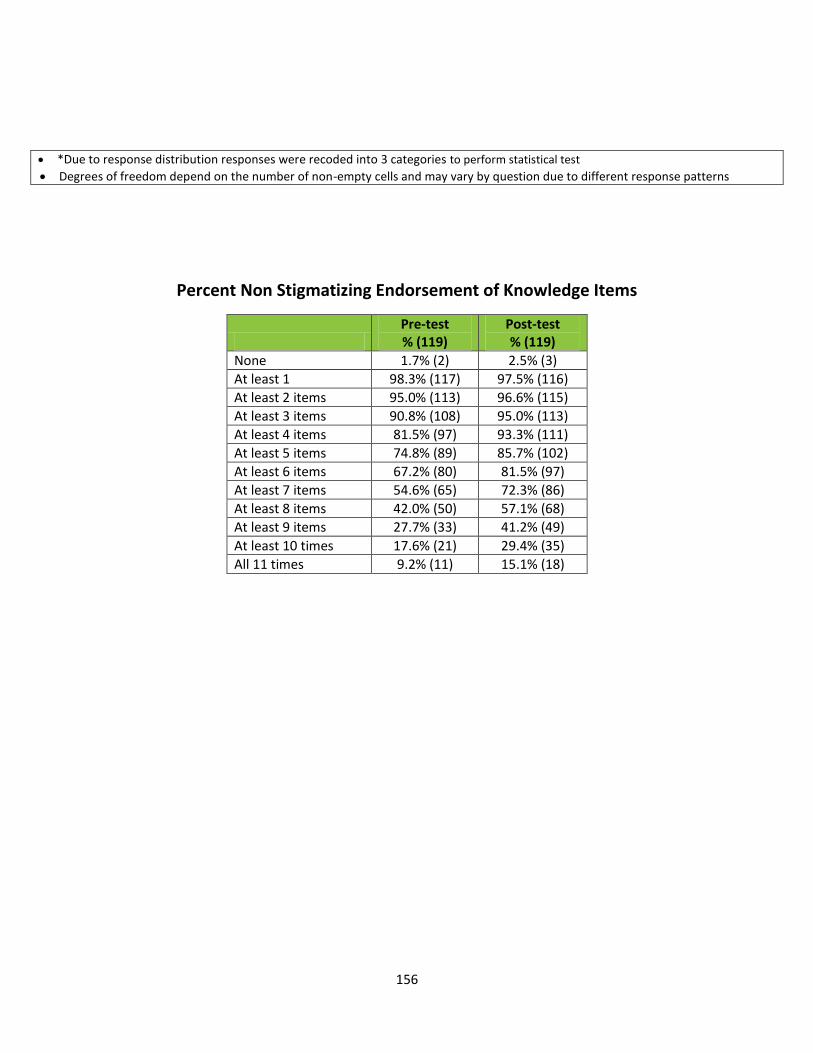
156
*Due to response distribution responses were recoded into 3 categories to perform statistical test
Degrees of freedom depend on the number of non-empty cells and may vary by question due to different response patterns
Percent Non Stigmatizing Endorsement of Knowledge Items
Pre-test % (119)
Post-test % (119)
None 1.7% (2) 2.5% (3)
At least 1 98.3% (117) 97.5% (116)
At least 2 items 95.0% (113) 96.6% (115)
At least 3 items 90.8% (108) 95.0% (113)
At least 4 items 81.5% (97) 93.3% (111)
At least 5 items 74.8% (89) 85.7% (102)
At least 6 items 67.2% (80) 81.5% (97)
At least 7 items 54.6% (65) 72.3% (86)
At least 8 items 42.0% (50) 57.1% (68)
At least 9 items 27.7% (33) 41.2% (49)
At least 10 times 17.6% (21) 29.4% (35)
All 11 times 9.2% (11) 15.1% (18)
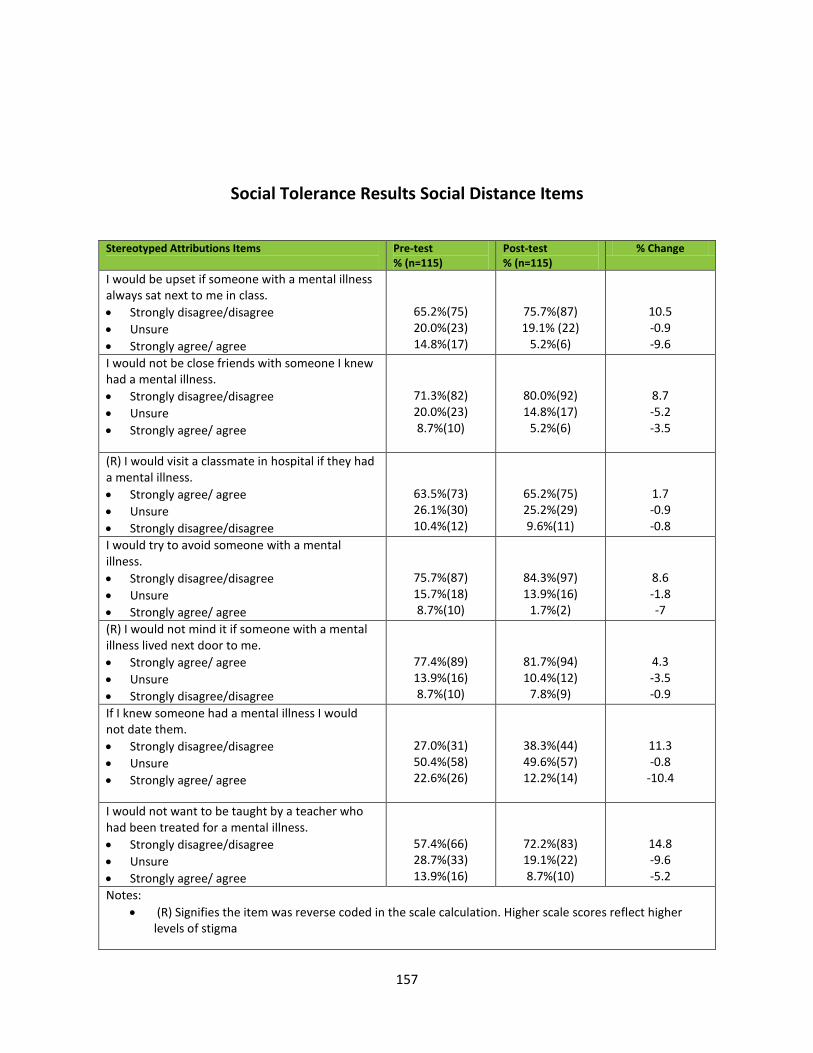
157
Social Tolerance Results Social Distance Items
Stereotyped Attributions Items
Pre-test % (n=115)
Post-test % (n=115)
% Change
I would be upset if someone with a mental illness always sat next to me in class.
Strongly disagree/disagree
Unsure
Strongly agree/ agree
65.2%(75) 20.0%(23) 14.8%(17)
75.7%(87) 19.1% (22)
5.2%(6)
10.5 -0.9 -9.6
I would not be close friends with someone I knew had a mental illness.
Strongly disagree/disagree
Unsure
Strongly agree/ agree
71.3%(82) 20.0%(23) 8.7%(10)
80.0%(92) 14.8%(17)
5.2%(6)
8.7 -5.2 -3.5
(R) I would visit a classmate in hospital if they had a mental illness.
Strongly agree/ agree
Unsure
Strongly disagree/disagree
63.5%(73) 26.1%(30) 10.4%(12)
65.2%(75) 25.2%(29) 9.6%(11)
1.7 -0.9 -0.8
I would try to avoid someone with a mental illness.
Strongly disagree/disagree
Unsure
Strongly agree/ agree
75.7%(87) 15.7%(18) 8.7%(10)
84.3%(97) 13.9%(16)
1.7%(2)
8.6 -1.8 -7
(R) I would not mind it if someone with a mental illness lived next door to me.
Strongly agree/ agree
Unsure
Strongly disagree/disagree
77.4%(89) 13.9%(16) 8.7%(10)
81.7%(94) 10.4%(12)
7.8%(9)
4.3 -3.5 -0.9
If I knew someone had a mental illness I would not date them.
Strongly disagree/disagree
Unsure
Strongly agree/ agree
27.0%(31) 50.4%(58) 22.6%(26)
38.3%(44) 49.6%(57) 12.2%(14)
11.3 -0.8
-10.4
I would not want to be taught by a teacher who had been treated for a mental illness.
Strongly disagree/disagree
Unsure
Strongly agree/ agree
57.4%(66) 28.7%(33) 13.9%(16)
72.2%(83) 19.1%(22) 8.7%(10)
14.8 -9.6 -5.2
Notes:
(R) Signifies the item was reverse coded in the scale calculation. Higher scale scores reflect higher levels of stigma
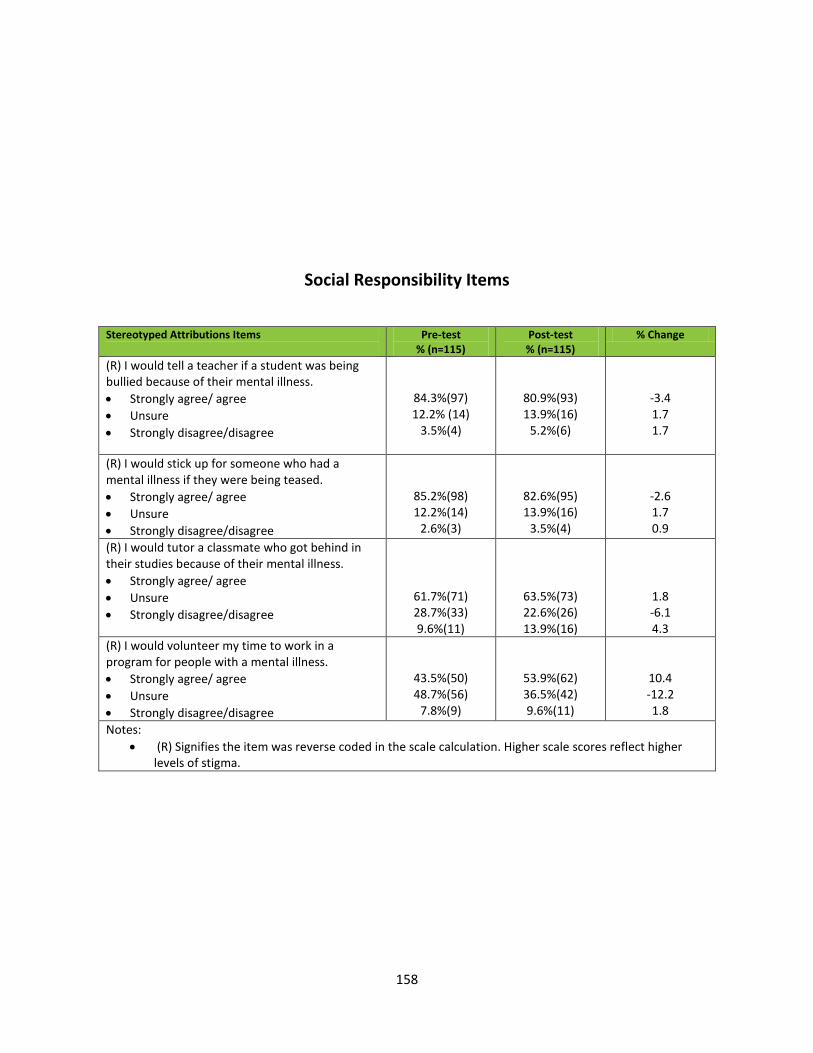
158
Social Responsibility Items
Stereotyped Attributions Items
Pre-test % (n=115)
Post-test % (n=115)
% Change
(R) I would tell a teacher if a student was being bullied because of their mental illness.
Strongly agree/ agree
Unsure
Strongly disagree/disagree
84.3%(97) 12.2% (14)
3.5%(4)
80.9%(93) 13.9%(16)
5.2%(6)
-3.4 1.7 1.7
(R) I would stick up for someone who had a mental illness if they were being teased.
Strongly agree/ agree
Unsure
Strongly disagree/disagree
85.2%(98) 12.2%(14)
2.6%(3)
82.6%(95) 13.9%(16)
3.5%(4)
-2.6 1.7 0.9
(R) I would tutor a classmate who got behind in their studies because of their mental illness.
Strongly agree/ agree
Unsure
Strongly disagree/disagree
61.7%(71) 28.7%(33) 9.6%(11)
63.5%(73) 22.6%(26) 13.9%(16)
1.8 -6.1 4.3
(R) I would volunteer my time to work in a program for people with a mental illness.
Strongly agree/ agree
Unsure
Strongly disagree/disagree
43.5%(50) 48.7%(56)
7.8%(9)
53.9%(62) 36.5%(42) 9.6%(11)
10.4 -12.2 1.8
Notes:
(R) Signifies the item was reverse coded in the scale calculation. Higher scale scores reflect higher levels of stigma.
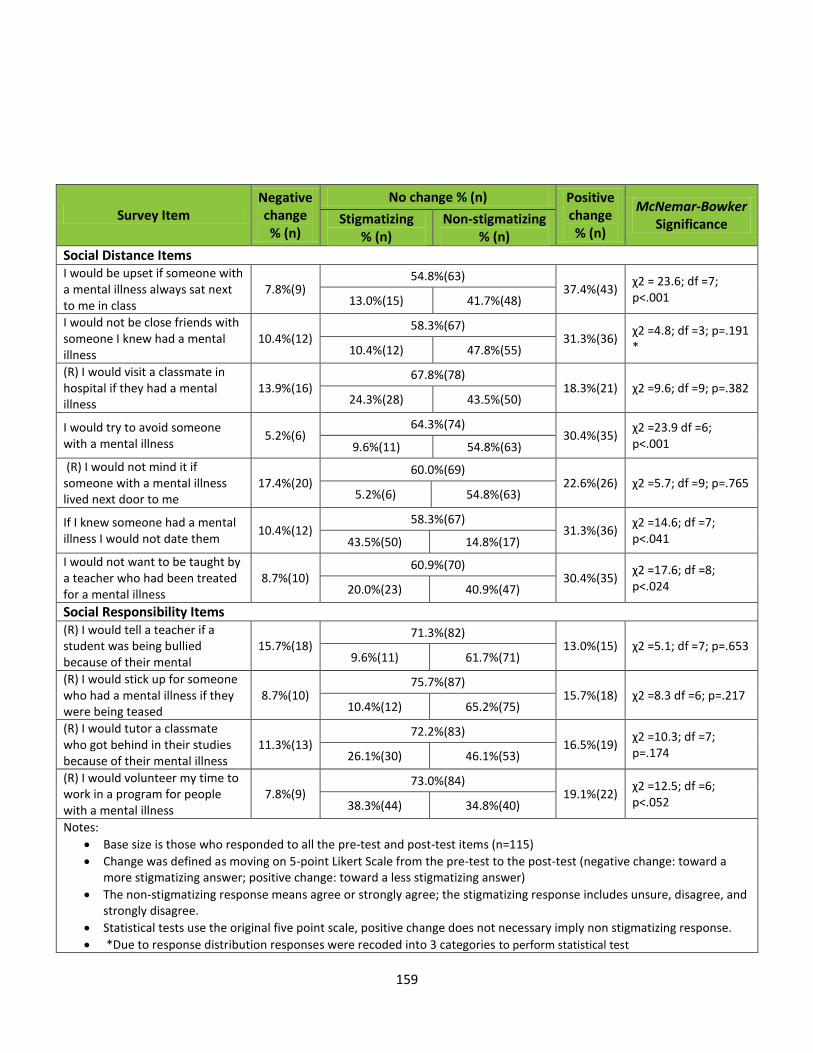
159
Survey Item Negative change % (n)
No change % (n) Positive change % (n)
McNemar-Bowker Significance Stigmatizing
% (n) Non-stigmatizing
% (n)
Social Distance Items I would be upset if someone with a mental illness always sat next to me in class
7.8%(9) 54.8%(63)
37.4%(43) χ2 = 23.6; df =7; p<.001 13.0%(15) 41.7%(48)
I would not be close friends with someone I knew had a mental illness
10.4%(12) 58.3%(67)
31.3%(36) χ2 =4.8; df =3; p=.191 * 10.4%(12) 47.8%(55)
(R) I would visit a classmate in hospital if they had a mental illness
13.9%(16) 67.8%(78)
18.3%(21) χ2 =9.6; df =9; p=.382 24.3%(28) 43.5%(50)
I would try to avoid someone with a mental illness
5.2%(6) 64.3%(74)
30.4%(35) χ2 =23.9 df =6; p<.001 9.6%(11) 54.8%(63)
(R) I would not mind it if someone with a mental illness lived next door to me
17.4%(20) 60.0%(69)
22.6%(26) χ2 =5.7; df =9; p=.765 5.2%(6) 54.8%(63)
If I knew someone had a mental illness I would not date them
10.4%(12) 58.3%(67)
31.3%(36) χ2 =14.6; df =7; p<.041 43.5%(50) 14.8%(17)
I would not want to be taught by a teacher who had been treated for a mental illness
8.7%(10) 60.9%(70)
30.4%(35) χ2 =17.6; df =8; p<.024 20.0%(23) 40.9%(47)
Social Responsibility Items (R) I would tell a teacher if a student was being bullied because of their mental
15.7%(18) 71.3%(82)
13.0%(15) χ2 =5.1; df =7; p=.653 9.6%(11) 61.7%(71)
(R) I would stick up for someone who had a mental illness if they were being teased
8.7%(10) 75.7%(87)
15.7%(18) χ2 =8.3 df =6; p=.217 10.4%(12) 65.2%(75)
(R) I would tutor a classmate who got behind in their studies because of their mental illness
11.3%(13) 72.2%(83)
16.5%(19) χ2 =10.3; df =7; p=.174 26.1%(30) 46.1%(53)
(R) I would volunteer my time to work in a program for people with a mental illness
7.8%(9) 73.0%(84)
19.1%(22) χ2 =12.5; df =6; p<.052 38.3%(44) 34.8%(40)
Notes:
Base size is those who responded to all the pre-test and post-test items (n=115)
Change was defined as moving on 5-point Likert Scale from the pre-test to the post-test (negative change: toward a more stigmatizing answer; positive change: toward a less stigmatizing answer)
The non-stigmatizing response means agree or strongly agree; the stigmatizing response includes unsure, disagree, and strongly disagree.
Statistical tests use the original five point scale, positive change does not necessary imply non stigmatizing response.
*Due to response distribution responses were recoded into 3 categories to perform statistical test

160
Degrees of freedom depend on the number of non-empty cells and may vary by question due to different response patterns.
Percent Non Stigmatizing Endorsement of Social Distance Items
Pre-test
% (n) Post-test
% (n)
None 2.6% (3) 1.7% (2)
At least 1 97.4% (112) 98.3% (113)
At least 2 items 94.8% (109) 94.8% (109)
At least 3 items 90.4% (104) 91.3% (105)
At least 4 items 88.7% (102) 91.3% (105)
At least 5 items 79.1% (91) 82.6% (95)
At least 6 items 73.0% (84) 79.1% (91)
At least 7 items 62.6% (72) 72.2% (83)
At least 8 items 52.2% (60) 64.3% (74)
At least 9 items 39.1% (45) 52.2% (60)
At least 10 times 25.2% (29) 39.1% (45)
All 11 times 9.6% (11) 13.0% (15)