can public housing decrease segregation? lessons *and
TRANSCRIPT

1
Can Public Housing Decrease Segregation?
Lessons and Challenges from Non-European Immigration in France*
Gregory Verdugo†
Centre d’Économie de la Sorbonne, Université Paris 1, OFCE, IZA
Sorana Toma‡
Crest-LSQ, ENSAE - Université Paris Saclay
27 July 2017
Abstract
Recent decades have seen a rapid increase in the flows of non-European immigrants into
public housing in Europe, which led to concern regarding the rise of “ghettos” in large cities.
Using French census data over three decades, we examine how this increase in public housing
participation affected segregation. While segregation levels increased only moderately on
average, we find that the number of immigrant enclaves has grown. The growth of enclaves is
driven by the large increase in non-European immigrants in the census tracts where the largest
housing projects are located, both in public and private housing. As a result, contemporary
differences in segregation levels across metropolitan areas are shaped by the spatial
distribution of housing projects within cities and by the share of immigrants who live in large
projects. Nevertheless, the overall effect of public housing on segregation has been
ambiguous. While large projects increased segregation, the inflows of non-European
immigrants into small housing projects brought many immigrants into census tracts where
they have previously been rare and thus diminished segregation levels. However, the
characteristics of non-European immigrants vary across projects, and those observed in the
less segregated housing projects have a higher socio-economic status.
* The authors accessed the data via the Centre d'accès sécurisé distant (CASD), dedicated to the use of
authorized researchers, following the approval of the Comité français du secret statistique. This research was
supported by a French state grant (grant no. ANR-10-EQPX-17) (Centre d’accès sécurisé aux données, CASD),
the LABEX Ecodec (ANR-11-LABX-0047) and the “Flash Asile” program of the Agence Nationale de la
Recherche (ANR-16-FASI-0001). We thank conference participants at the Population Association of America in
Chicago and at INED in Paris for insightful comments that helped to shape the paper. † Contact details: 106-112 Boulevard de l'Hôpital, 75647 Paris cedex 13, France, email: gregory.verdugo@univ-
paris1.fr ‡ Contact details : 60 rue Étienne Dolet, 92240 Malakoff, email : [email protected]

2
I. Introduction
The rise of non-European immigration in the last several decades has greatly diversified the
population in European countries. According to Eurostat (Vasileva, 2011), in 2010, the
population of individuals who were born outside the European Union represents on average 8%
of the population in these countries. This new immigration poses challenges that are different
than the intra-European migration that long prevailed in Europe. Non-European immigrants
encounter substantial barriers in the labor markets that are associated with higher levels of
residential segregation (Glitz, 2014; Moraga et al., 2015; Musterd, 2005; Préteceille, 2009;
Quillian and Lagrange, 2016; Safi, 2009; Tammaru et al., 2016). This leads to concern over the
consequences of the isolation of these groups from the rest of the population, in particular for the
children of immigrants (Bolt et al., 2013). Furthermore, a large and increasing share of non-
European immigrants live in public housing, whose impact on segregation levels is as-yet under-
studied.
In this paper, we use restricted access census data over the last three decades in France to
document how the growth of the non-European immigrant population in public housing has
affected their spatial segregation. France is an interesting country to study with regard to these
questions because its non-European population is large, diverse and has grown rapidly. Between
1968 and 2012, the share of non-European immigrants in the population multiplied by four, at
first fueled by immigration from Maghreb and, increasingly since the 1980s, by immigration
from Sub-Saharan Africa and Asia. As in many European countries, the French welfare state
offers a wide range of social programs that could influence the assimilation of immigrants. In
particular, public housing remains a cornerstone of urban policies in France, as it does more
broadly in Europe. In 2011, public housing accounted for more than 32% of the total housing

3
stock in the Netherlands; 24% in Austria and Scotland, and approximately 18% in England,
France, Sweden and Denmark (Musterd, 2014; Priemus and Dieleman, 2002; Scanlon et al.,
2014).
There is overwhelming evidence that, in recent years, non-European immigrants
disproportionately settled into public housing. In Amsterdam, more than 80% of Turkish and
Moroccan immigrants lived in public housing in the 1990s (Musterd and Deurloo, 1997). In
2008, in London, 40% of foreign-born residents were “social tenants” (Rutter and Latorre, 2008).
In France, we document below that approximately 50% of immigrants from Maghreb and sub-
Saharan Africa lived in public housing in 2012, which is up from 35% in 1982.
In the European context, which is characterized by a large social housing supply and a
relatively diverse population that lives in the projects, the influence of public housing on
segregation might be a priori ambiguous. In accordance with models of segregation that
emphasize natives’ nonlinear response to inflows of minorities in neighborhoods (Card et al.,
2008), we expect the consequences of the inflows of immigrants into public housing for
segregation to vary with the size of the housing projects. Segregation might decrease when
projects are small as an inflow of immigrants into a small project might be less likely to trigger
an outflow of natives from the census tract. Furthermore, such small projects may be more likely
to be located in low-immigration and more desirable neighborhoods. However, if large housing
projects hold a rising concentration of immigrants, segregation will increase even more if, at the
same time, natives leave the private housing in the census tract in response.
We examine these dynamics at three different levels: first, at the metro area level, we
study how public housing characteristics influence the dissimilarity and isolation indexes of non-
European immigrants; second, at the neighborhood level, we trace how inflows of immigrants

4
are distributed across census tracts and housing projects; and, finally, at the individual level, we
examine the sorting of immigrants by origin and by the socio-economic characteristics among
public housing projects.
In accordance with the previous research (Pan Ké Shon and Verdugo, 2015; Préteceille,
2009; Safi, 2009), we find that the average segregation levels of non-European immigrants have
increased slightly in recent years but remained moderate, even if higher than those of European
immigrants. In contrast, the share of non-Europeans who live in an immigrant enclave – which is
defined as a census tract where the proportion of immigrant heads of households is above 30% -
has increased threefold in thirty years. Consistent with our hypotheses, we find that the effect of
public housing on segregation depends largely on the size of the housing projects in the metro
area. While the share of non-European immigrants in small projects does not affect segregation
levels, a similar share in large projects is associated with dramatically higher segregation levels
and in particular a high concentration of immigrants in enclaves.
Examining tract level trends, we find that the incoming non-European immigrants are
relatively evenly spread across public housing projects within the metro areas, even if the share
of non-European immigrants progressed one-third more rapidly in large housing projects. In
contrast, the progression of non-Europeans in private housing was three times larger next to the
largest projects than next to the smaller-scale projects. Overall, we interpret our findings as
evidence that small-scale public housing projects enabled non-European immigrants to enter
neighborhoods where they were previously rare, thus potentially decreasing segregation. At the
same time, the disproportionate growth of the immigrant population both within large public
housing projects as well as around them has contributed to the rise of immigrant enclaves.

5
This paper thus contributes to the literature by offering a systematic account of the
ambivalent role of public housing in the evolution of segregation patterns. The prior research,
which mostly focused on the North American context where government-subsidized housing
represents a very small share of the market, has paid little attention to this factor. In addition to
quantifying the impact of public housing in segregation patterns, we uncover the mechanisms
through which it operates. We argue here that to understand contemporary segregation patterns
in France, and in Europe more broadly, the morphology and composition of public housing need
to be taken into account. Most notably, the concentration of public housing can have important
spillover effects on private housing inhabitants’ behavior, which thus amplifies the influence of
project size on segregation.
The paper is organized as follows: section two provides an overview of the main
theoretical models that explain immigrant segregation and discusses how the functioning of the
French public housing sector may shape segregation patterns in that context. Section three
presents the data and the methods that we employ, while sections four and five introduce some
descriptive statistics about the evolution of the composition of public housing and segregation
patterns in France. Sections six, seven and eight present the core of our empirical analysis and
discuss the results, while the final section advances our conclusions.
II. Theoretical background
Two main theoretical models have been put forward to explain the residential segregation of
immigrants and minorities: spatial assimilation and place stratification (Charles, 2003). These
models were developed and tested in the North American context (Crowder et al., 2012; Iceland
and Scopilliti, 2008; Iceland and Wilkes, 2006; Logan et al., 2002, 2004; Logan and Alba, 1993;
South et al., 2008; Wagmiller et al., 2017); however, they have only recently been examined in

6
Europe (Bolt et al., 2008; Friedrichs, 1998; Glitz, 2014; Mcavay, 2016; Musterd, 2005; Musterd
and Ostendorf, 2009; Pan Ké Shon and Verdugo, 2014, 2015; Peach, 1996; Rathelot and Safi,
2014; Schönwälder and Söhn, 2009; Simpson and Finney, 2009).
The spatial assimilation model (Alba and Logan, 1993; Massey and Denton, 1985)
predicts that as immigrants and their descendants experience acculturation and upward socio-
economic mobility, they gradually move out of concentrated areas and into more diverse
neighborhoods. As a result, the differences in segregation levels across immigrant groups should
be accounted for by compositional differences, in terms of socio-economic standing, nativity,
language proficiency and length-of-stay. Neighborhoods of high immigrant concentration –
termed immigrant enclaves – are thus conceptualized as port-of-entry types of neighborhoods,
mostly situated in inner cities and characterized by a well-developed ethnic economy and
infrastructure, and transitory along immigrants’ residential trajectories.
To explain the persistence of segregation, proponents of the place stratification model
(Logan, 1978; Logan and Molotch, 1987) have emphasized the role of prejudice and
discrimination (Massey and Denton, 1985; Yinger, 1995) as well as racial residential preferences
(Boschman and Ham, 2015; Krysan et al., 2009; Krysan and Farley, 2002). High and persistent
levels of segregation may reflect discriminatory practices in the private housing market by real
estate agents and landlords as well as white tenants who ‘flee’ neighborhoods in response to
immigrant concentration (Bobo and Zubrinsky, 1996; Hall and Crowder, 2014; Ross and Turner,
2005). They may also partly reflect immigrants’ preferences for living in neighborhoods with a
higher share of co-ethnics (Rathelot and Safi, 2014; Vigdor, 2003).
France offers an interesting context in which to examine the drivers of immigrant
segregation. In addition to their different migration histories and urban forms, a notable

7
difference between the US and France is the high prevalence of government-assisted housing in
the latter context, particularly among non-European immigrants. In the presence of
discrimination in private housing, the large public housing sector in France may distribute
immigrants across a wider range of neighborhoods, without concern for their origin or socio-
economic status (Algan et al., 2016; Kesteloot and Cortie, 1998; Oberti and Préteceille, 2016;
Quillian and Lagrange, 2016). Public housing may thus provide an escape from the more
discriminatory private housing market (Bonnet et al., 2016; Combes et al., 2012; Dietrich-Ragon,
2013) and relax the structural barriers to immigrants’ spatial incorporation, thus decreasing their
segregation.
Assuming that the objectives of housing authorities are to diminish segregation,
Schmutz (2013) demonstrates that their ability to do so is constrained by the responses of the
inhabitants of private housing. The theoretical models of segregation emphasize that the
equilibrium in neighborhoods characterized by ethnic diversity may be unstable and
characterized by “tipping points” in the share of a minority in the neighborhood, above which
members of the majority start to leave the neighborhood en masse (Card et al., 2008). A
disproportionate increase in the share of immigrants who live in large housing projects may deter
natives and attract immigrants in private housing in the neighborhood, which thus reinforces the
homogeneity of the neighborhood and increases segregation. However, the progression of
immigration in small projects may be less problematic for segregation because the share of
minorities remains far from the tipping point and thus does not change the equilibrium of the
neighborhood.
The prior qualitative research also raises some doubts with respect to the desegregation
potential of public housing in Europe due to discriminatory practices in the allocation of housing.

8
Studies show substantial segmentation across housing projects, with non-European minorities
being disproportionately allocated to the largest and least desirable housing projects (Bourgeois,
2013; Masclet, 2006; Sala Pala, 2005; Tissot, 2006), while better housing projects are reserved
for loyal constituents. The prior findings reveal a clear hierarchy of projects that are based on
their real estate value, their localization and their occupation, with housing authorities limiting
the access of certain immigrant groups to the most desired places. This resonates closely with the
tenets of the place stratification model.
Based on the discussion above, we draw three main hypotheses that we test empirically in
the rest of the paper:
H1: First, we examine under what conditions the growth of immigration in public
housing will affect segregation indexes and the prevalence of immigrant enclaves. We expect the
consequences to depend on the size of the projects in the census tract. More precisely, we expect
that a larger share of non-European immigrants in large projects will increase segregation. In
contrast, we expect that a larger share of non-European immigrants in small projects will have no
influence or even decrease segregation.
H2. Second, we examine how public housing contributes to rising segregation and to the
growth of enclaves. We expect that the differential effect of public housing by size on
segregation is compounded by the responses of the private housing inhabitants in the census
tract. We expect census tracts with larger housing projects to attract higher inflows of non-
European migrants, not only in the public housing sector but also in private housing.
H3. Finally, we test whether public housing allocation depends on origin and socio-
economic status, as has been argued by the prior qualitative research. We expect non-European
9
immigrants and individuals of a lower socio-economic status to have higher chances of entering
larger projects than smaller ones.
III. Data and methods
The empirical analysis exploits restricted-access census data from the French Census over three
decades using the 1982, 1990, 1999 and 2012 census years.4 We use detailed individual files that
contain information on location and nationality at the census block level (approximately 500
inhabitants) for all of the years. We had access to extremely large samples as we exploit 25%
sample extracts for almost all of the years. Such consistently large samples allow for the precise
measurement of the composition of the population across neighborhoods, and they are less
vulnerable to the measurement types of errors that may affect segregation trends. An immigrant
is defined as a person who is born abroad without being of French nationality at birth, which thus
includes foreigners and naturalized immigrants. We classify immigrants across origins using the
country of birth. As is often the case in continental Europe, the data do not contain any variables
to measure segregation along racial or ethnic lines. In addition, the children of immigrants – the
second-generation – cannot be identified in the data. The paper focuses on non-Europeans
because the segregation levels of European immigrants are low and declining (Pan Ké Shon and
Verdugo, 2014; Préteceille, 2009) and they are much less likely to live in public housing.
Finally, while the census contains detailed information on labor force status and occupation, it
does not include any measure of income.
We follow Quillian and Lagrange (2016) by using “metro areas” as the local unit of
analysis. Defined by the French statistical institute, they consist of a set of municipalities
4 We do not include the 1968 and 1975 censuses in the analysis as they do not contain information on public housing
participation.

10
characterized by a continuous built-up area.5 To ensure comparability over time, the boundaries
of metro areas are fixed using the definition of these metro areas from the 1999 census.
We measure segregation and change in neighborhood characteristics at the level of the
French equivalent of the census tract, the “Ilots Regroupés pour l'Information Statistique”
(IRIS). The IRIS is a socio-spatial division that was introduced by the French statistical institute
with the 1999 census. IRISs are half the size of average US census tracts, and they delineate
geographic areas with an average of 2,500 inhabitants following natural boundaries such as
major streets, railway lines and watercourses.6 For the 1990 and 1982 censuses, we use
information at the census block level to recover the IRISs.7 Pan-Ké-Shon and Verdugo (2015)
demonstrate that using such “pseudo-IRISs” instead of using actual IRISs has little effect on the
measurement of segregation. For simplicity’s sake, we refer to the IRIS as census tracts in the
rest of the paper.
Following Cutler et al. (2008) and several studies, we measure segregation at the census
tract level through two standard indexes: dissimilarity and isolation, which are related to the
crucial dimensions of segregation, evenness and exposure (Massey and Denton, 1988). The
formula of these indexes is reproduced in the Appendix. The index of dissimilarity (henceforth,
ID) can be interpreted as the proportion of individuals from a particular group who would need
to change residence for each census tract to have the same percentage of their group as the
metropolitan area overall. The index of isolation follows Bell (1954) and reports the percentage
of the immigrant group in the census tract that is occupied by the average immigrant from the
5 This corresponds to the definition of “unites urbaines.” 6 Quillian and Lagrange (2016) demonstrate that, as a consequence of these differences in scale, segregation
measures are inflated in France in comparison with the US. 7 For the 1990 Census, we use a correspondence table that was provided by the French statistical institute that
aggregates census blocks into IRISs. However, such matching does not exist for the 1982 Census. For 1982, we
constructed “pseudo-IRISs” by aggregating contiguous census blocks to create a zone with a population of
approximately 2,500 inhabitants.

11
group. Following Cutler et al. (2008), we calculate indexes of segregation with respect to the rest
of the population, not only natives. Furthermore, the indexes are estimated using only the
population of heads of households8 to avoid the risk that the segregation indexes of immigrants
might be lowered by the presence of the children of immigrants in the sample. We carried out the
same analyses with indices calculated for all individuals (not only heads of household) with
similar results (available upon request).
IV. Basic facts on public housing and immigration
Both in Europe and the US, the initial ambitions of public housing programs were to eliminate
slums around metro areas and to improve housing conditions. In Europe, most of the programs
emerged after the Second World War in reaction to housing shortages and the demographic
pressures of the baby boom.9 Initially, in both continents, the targeted population was quite large.
To avoid poverty concentration, the programs were conceived for various segments of the
working class, not only for the “poorest of the poor.” However, with less than 1% of US
households living in public housing in 201710, the supply of public housing remains extremely
low relative to Europe, where public housing aims to cover a large share of the population
(Scanlon et al., 2014) and to ensure a “social mix” (Blanc, 2010; Deschamps, 2001). In France,
while 15% of the population lived in public housing in 2012, nearly 70% of the population was
eligible for it.
These objectives of diversity are challenged by the increase in non-European immigration
and its over-representation in the public housing sector. Panels A and B in Table 1 show that
8 We categorize a household as immigrant if the head of household is an immigrant. 9 This discussion focuses on Western Europe. Eastern Europe had a different experience under planned economies
and communist regimes. 10 According to figures from the US department of Housing and Urban Development. See
https://portal.hud.gov/hudportal/HUD?src=/program_offices/public_indian_housing/programs/ph (accessed 14th
April 2017)

12
non-European immigrants have progressively become the majority of immigrants since 1982,
and they are increasingly concentrated in public housing. While the proportion of native
households that live in public housing remained stable at the 13% level, for immigrant
households that proportion increased from 21% to 30% from 1982 to 2012. This increase is even
more marked for immigrant heads of households from Maghreb and sub-Saharan Africa, as
almost half lived in public housing in 2012, which is up from 33% and 26%, respectively, in
1982. However, even if immigrants are overrepresented in housing projects, the large supply of
public housing guarantees that they remain far from being the majority of the inhabitants
(Musterd, 2014). Panel C shows that non-European immigrants accounted for only 18% of heads
of households on average in public housing in 2012, which is a proportion that has increased by
10 p.p. since 1982.
A crucial factor for segregation is that the size and concentration of housing projects vary
widely within and across cities. To distinguish housing projects by size, we construct quartiles of
the share of public housing inhabitants in the census tract. We define large housing projects as
projects in tracts where more than 37% of the inhabitants live in public housing – which is the
threshold of the last quartile. Panel A of Table 2 shows that 47% of households in public housing
live in a large project. Clearly, non-European households in public housing are even more likely
to live in large projects as 61% of them live in the census tracts of the last quartile. Panels C and
D more systematically document the trends in segregation of housing projects over time using
the indexes of dissimilarity and isolation, respectively. Over the period, public housing
segregation remains important; however, it declined moderately from 1982 to 2012, as both the
dissimilarity and isolation indexes of public housing inhabitants declined by 7 p.p. and 4 p.p.,
respectively.

13
The table also illustrates that the segregation of housing projects varies substantially
across metro areas. Panel B shows that there are quite large disparities across metro areas in the
distribution of the population between small and large projects. In Paris, non-European
households in public housing are three times as likely to live in large housing projects, while in
Marseille, they are only twice as likely. Panel C shows that the dissimilarity level of public
housing inhabitants in Marseille was 60% in 2012, which is 10 p.p. and 5 p.p. higher than it is in
Lyon or Paris, respectively.
V. Patterns of immigrant segregation 1982 to 2012
Table 3 and 4 presents the evolution of segregation of non-European immigrants in major French
metro areas over the period from 1982 to 2012 measured by dissimilarity and isolation indexes.
In the first rows, following Cutler et al. (2008), we report the average of the IDs using the
number of non-European immigrants per metro area as weights.11 For comparison, the average
dissimilarity level of European immigrants is reported in the second row. Clearly, non-Europeans
are more segregated than European immigrants. In 2012, the average dissimilarity level was 34%
for non-Europeans against only 18% for European immigrants. These levels are moderate with
respect to the US: Iceland and Scopilliti (2008) report dissimilarity indexes of 44% for foreign-
born people and of 60% for foreign-born Hispanics with respect to white natives in 2000.12
An important result is that, in spite of the large growth of the non-European population
and its inflows into public housing, the average dissimilarity indexes increased only by
approximately 1 p.p. over this thirty-year period. Panel B of the table shows considerable
disparities in segregation trends and levels across metro areas. In 2012, the dissimilarity indexes
11 We include only metro areas with a population of non-European migrants larger than 500 individuals. 12 A limitation of these comparisons is that our dissimilarity indexes are calculated using all non-group members
instead of white natives. We calculated dissimilarity indexes using only natives with our data and found that it only
marginally changed the indexes. Our data does not allow us to use white natives as a comparison group.

14
were close to 33% in Paris and Nice, while they were higher by 8 p.p. in Marseille and Lille. The
dissimilarity trends have also varied across metro areas. From 1982 to 2012, while the
dissimilarity levels declined in Nantes and Douai by 7 p.p., they increased by 5 p.p. in Lyon and
Marseilles and by 12 p.p. in Nice (albeit from a low level in the latter case).
Table 4 further reports the isolation indexes across metro areas. To some extent reflecting
the growth in the non-European population, the isolation indexes increased in the last thirty
years. In Paris and Lyon, the indexes increased by 12 and 9 p.p., respectively. In Montpellier, the
index has doubled. These levels are large given that the share of non-European households in the
French population was 6.4% in 2012. However, it is well-known that the isolation indexes are
sensitive to the size of the group in the population. To account for the growth of the population,
the last two columns show the difference between the isolation index and the proportion of non-
European households in the metro area population in 1982 and 2012. By definition, this
difference would be zero when the share of immigrants in the population is the same across all of
the census tracts of the metro area. We find that approximately half of the increase in isolation
can be explained by the increase in the share of the population with non-European origins. The
‘residual’ isolation levels are comprised of between 7% and 11%, and they increased by
approximately 5 p.p. over the period. Such an increase is substantial but clearly not massive.
Rise of immigrant enclaves
The finding that segregation remained moderate in the last several decades might surprise the
readers of ethnographic accounts which alerted to the formation of “urban ghettos” since the
early 1990s (Delarue, 1991; Dubet, 1987; Lapeyronnie, 2008; Lepoutre, 2001). Most of these
works describe the life in segregated housing projects as being plagued by poverty and as places
where the majority of the population is of immigrant origins. Clearly, the previous figures

15
indicate that such situations are far from representative of the census tracts where most
immigrants live. However, the indexes of dissimilarity and isolation are averages of very diverse
census tracts that do not effectively capture what occurs at the tails of the distribution. As
demonstrated by Bell and Machin (2013) in the case of the U.K. and Préteceille (2009) for
France, stable dissimilarity indexes can hide an increase in the number of high immigrant census
tracts if the growth of the latter is mitigated by the diffusion of immigration in tracts where they
were previously rare.
Panel A of Table 5 shows the distribution of census tracts with varying proportions of
immigrants in their population, while Panel B shows the distribution of non-European
immigrants across these types of tracts. The figures show considerable changes in the
proportions of the census tracts with both very few or many immigrants. First, the proportion of
census tracts with less than 1% of immigrants declined rapidly, which clearly contributed to
decreasing the segregation levels. In 2012, it is basically impossible to find a census tract with no
or very few immigrants in the population. At the opposite tail of the distribution, the share of
immigrants in census tracts where more than 30% of household heads are immigrants – tracts
that we refer to as ‘immigrant enclaves’, following Wilson and Portes (1980) or Logan et al
(2002) - increased by 10 p.p. both in the 1990s and the 2000s. In 2012, approximately one-third
of non-European households lived in these high immigrant census tracts.
Not only have the enclaves grown since the 1990s, but they appear to be quite different
from enclaves of 30 years earlier. First, the enclaves are increasingly tied to the presence of large
housing projects: among those who live in an immigrant enclave, the median proportion of
inhabitants in public housing was 50% in 2012 against 15% in 1982. A substantial fraction of
enclaves is plagued by high unemployment rates: the unemployment rate of prime age non-

16
European heads of households in enclaves increased by 10 p.p. from 14% to 24% on average
from 1982 to 2012. Also, in 15% of enclaves in 2012, the unemployment rate of prime-age non-
European immigrant heads of households is superior to 40%, which is a situation that was
observed in only 5% of enclaves in 1982.
VI. How much does public housing influence segregation?
What explains differences in the segregation levels across metro areas and their evolution? To
assess how different factors predict segregation across metro areas, we follow Iceland and
Scopilliti (2008) and Cutler et al. (2008), among others, and use regression models that relate the
dissimilarity or isolation index to characteristics of the groups of immigrants and of public
housing across metro areas. Using the 1982 and 2012 census years, we estimate:
lt lt t lt t lt t ltS PH X Z u
where ltS is a segregation index, dissimilarity or isolation, for non-European immigrants in
metro area l and census year t . The vector ltPH contains variables that describe the
characteristics of the public housing supply. Depending on the dependent variable, we include
either the dissimilarity or the isolation index of the public housing inhabitants in the metro area.
Also included are the shares of the non-European immigrants and of the overall population that
lives in public housing. Importantly, in some specifications, we introduce separately the share of
immigrants and natives in large housing projects to test the hypothesis that the share of the
population in each type of project has a different effect on segregation.
The vector ltX accounts for the differences in the composition of non-European
immigrants across metro areas and includes variables related to economic assimilation. It
includes the share of managers, blue-collar workers and unemployed workers among the heads

17
of households of the group.13 The model also includes the share of the group in the metro area
population, the share of the group that arrived since the last census and, after 1999, the average
length of stay of the group in France. Finally, the vector ltZ includes the metro areas
characteristics that have been shown to influence segregation in other studies (Pais et al., 2012)
such as the log of the population, the share of immigrants in the city and the share of managers,
blue-collar and unemployed among the city population. These variables capture the economic
specialization and social composition of the population.
Before turning to the results, it is useful to note that while this model identifies how
different factors are correlated with segregation levels, it does not provide a causal interpretation.
Among other issues, reverse causality is possible in the sense that economic assimilation might
be influenced by geographical segregation.14 In addition, the characteristics of immigrants might
be affected by the characteristics of the public housing in the city (Verdugo, 2016).
Table 6 shows the estimation results of the models for the dissimilarity and the adjusted
isolation indexes which is defined as the difference between the isolation index and the
proportion of non-European households in the metro area population. For each index, we report
the results using 2012 data in cross-section but also estimates obtained from long-differences
from 1982 to 2012. This last specification identifies the coefficients using within-city variations
over time, and it accounts for the effects of the metro-area-level factors that are constant over
time and that influence segregation. The model is estimated based on a sample of 192 metro
areas with at least 500 non-European immigrants in both 1982 and 2012. To save space, only the
13 We use occupation instead of education as it is a better proxy for economic assimilation in the host society than
education. It is well known that for immigrants the returns to education that is acquired abroad are lower (Friedberg,
2000), and as a results immigrants tend to downgrade (Akresh, 2008). Notwithstanding, the results are similar when
controlling for education instead of occupation. 14 A large body of literature on spatial mismatch shows how segregation could influence labor market outcomes and
as a result the socio-economic status of immigrants (Gobillon et al., 2007).

18
coefficients of public housing variables are displayed, while the estimates for other covariates are
reproduced in the supplementary appendix Table A1 and A2.
The results show that in 2012, the dissimilarity of public housing is positively and
substantially associated with non-European immigrants’ ID. In column (1), the model predicts
that an increase in the dissimilarity of public housing by 10 p.p. increases by 2.4 p.p. the
dissimilarity of immigrants. Similarly, column (5) shows that the isolation of public housing is
strongly related to the isolation of immigrants in 2012 but not in first-difference regression.
Another important result is that a higher share of non-Europeans in public housing is associated
with higher dissimilarity and isolation levels in both 1982 and 2012. In contrast, segregation
levels decline as the share of the overall population in public housing in the metropolitan area
increases.
In columns 2 and 4, for dissimilarity and 6 and 8 for isolation, the model introduces
separately the share of the population and of non-European immigrants who live in large housing
projects. The results strongly support our first hypothesis that large projects have a negative
effect on segregation in contrast to smaller projects. When introduced separately, the coefficients
of the share of immigrants in large projects are large and statistically significant. At the same
time, the effect of the overall share of non-European immigrants or of the metro area population
in all types of projects is no longer statistically significant.
Columns 9-12 of Table 6 show the regression results of models where the dependent
variable is the share of non-European immigrants who live in an immigrant enclave. The results
indicate that the share of non-European immigrants and of the metro area population in large
public housing are strong predictors of the share of non-European immigrants who live in

19
enclaves. In particular, the share of non-European immigrants in large public housing is a strong
predictor of the share of immigrants in enclaves, with a coefficient that is close to 0.85.
The rest of the table in the supplementary appendix shows how the differences in the
average characteristics of the groups across cities relate to the differences in segregation levels.
Consistent with assimilation theory, dissimilarity and isolation are higher when there are more
blue-collar workers and unemployed persons in the group. Finally, both dissimilarity and
isolation levels tend to be larger in more populated metro areas. There is also some evidence that
segregation levels were higher in 2012 in metro areas with a larger share of immigrants who
arrived in the last ten years.
VII. Project size and immigrant inflows
Next, we turn to the census tract data to assess how the increase in non-European immigration
across metro areas affected different types of housing projects and their neighborhoods. In
particular, we investigate whether the increase in the share of non-Europeans has been more
rapid in the census tracts of large housing projects and how the population in private housing
next to each type of housing project responded to the inflows of immigrants. Using the data from
the 1990, 1999 and 2012 censuses that allow us to follow census tracts over time, we consider
the following model15:
nlt lt q nltp p e
where nltnlt
nlt
Ip
L
is the change in the share of non-European immigrants in the census tract
n between two censuses (either 1990-99 and 1999-2014) in metro areas l with nltI the number
15 As discussed above, we cannot track census tracts from the 1982 census over time, thus the sample is restricted to
the period from 1990 to 2012.

20
of non-European immigrants in the census tract and nltL the total population of the tract. The
term ltp is defined similarly; however, it refers to the change in the share of non-European
immigrants in the overall population of the metro area.16 To assess the differences across housing
projects of different scale, we estimate the model separately across the quartiles q of the initial
distribution of the share of public housing across the census tracts.17 We also examine separately
what occurred in neighborhoods with no public housing inhabitants (approximately 8% of the
census tracts).
One concern with the previous regression is that the increase in the immigrant share at the
city level might be endogenous. Among other issues, reverse causality is possible if, for example,
natives leave the less desirable housing projects for the suburbs for reasons that are unrelated to
immigration, and immigrants respond to vacancies in public housing by moving to the metro
area.18 In that case, the increase in immigration in the metro area would be driven by the decision
of natives to leave the projects. To isolate the causal effect of immigrant inflows, we construct an
instrumental variable. As in Card (2001) and Cortes (2008), our instrument is based on ethnic
networks. The idea that underlies this widely used instrument is that, to some extent, the location
choice of immigrants in their destination country depends on the pre-existing presence of
networks that are unrelated to unobserved city-specific factors that might bias our regressions.
To construct the instrument, we use the most distant distribution of network that is available
from the 1968 census.19 Specifically, we predict ˆlctI the number of immigrants from country c in
16 We do not add any other covariates to this model as they are all potentially endogenous. 17 The distribution is taken conditionally on having at least some inhabitants in public housing. 18 See, e.g., Verdugo (2016) for evidence that immigrants have been attracted to cities with a large supply of public
housing. 19 A crucial advantage of using 1968 as a reference year is that the 1960s were a period during which the access of
immigrants to public housing was very restricted (see Verdugo, 2016, and the references therein). This ensures that

21
metro area k in 1990, 1999 and 2012 by multiplying the total number of immigrants ctI from that
country in year t with the proportion of immigrants of that nationality who were observed in the
metro area in the 1968 census ,68
,68
,68
cl
cl
c
I
I . Adding up across the countries of origin, the
predicted total number of immigrants in metro area k is then given by ,68ˆ ˆlt lct cl ct
c c
I I I .
Given the large sample size, we exploit the 54 different countries of birth that are available in the
data. Because the endogenous variable is a percentage, our final instrument ˆltp is defined by
using changes in the number of predicted immigrants in the location divided by the initial
population of the metro area 1ktL , i.e., 1
1
ˆ ˆˆ lt lt
lt
lt
I I
Lp
.
Table 7 shows the regression results. To ensure representativeness, we weight each
regression by the number of inhabitants in the census tract. Below each panel for the 2SLS
estimates, the first stage Fisher statistics indicates that our instrument is reasonably strong, with a
F-stat that is superior to 10 in most of the specifications. Panel A shows the results where the
dependent variable is the share of non-European households in the census tract, in all types of
housing. Column 1 reports that the share of non-European households increases by 1 p.p. on
average across the census tracts in response to an increase by 1 p.p. of non-European immigrants
in the metro area population, as expected.20 Other columns show the extent to which the share of
non-European immigrants progressed across the census tracts with a varying share of public
housing.
the initial distribution of immigrants across metro areas is not related to their presence in public housing or the initial
characteristics of the public housing stock. 20 The coefficient is slightly above one because our census tract sample does not include a small number of recently
created census tracts for which changes cannot be observed as well as census tracts for which the boundaries have
changed.

22
Unambiguously, the census tracts with large housing projects received much larger
inflows of non-European immigrants. We find that an increase by 1 p.p. in the share of non-
European immigrants in the metro area translates into an increase of 1.7 p.p of the share of non-
Europeans in the census tracts in the last quartile but by only 0.6 p.p. in the first quartile. Note
that, even if immigration progressed twice as rapidly in the census tracts with large projects, the
patterns of segregation are not extreme as the share of non-European immigrants progressed
substantially across all of the census tracts. Finally, the results are very similar across the OLS
and 2SLS models.
In panels B and C, we separately examine what occurred in public and private housing,
respectively, across these census tracts. Column (1) in panel B shows that an increase in 1 p.p. of
non-European immigration at the metro area level increased by 1.9 p.p. on average the share of
non-European immigrants among public housing inhabitants across tracts, which indicates that
non-European households were more likely to enter the public housing sector rather than the
private one. Other columns indicate the extent to which immigration progressed across housing
projects of different sizes. The coefficients tend to increase across quartiles in the OLS estimates,
with a coefficient of 1.6 for the first quartile against 2.0 in the last quartile. The 2SLS estimates
report a substantially higher coefficient for the census tracts in the first quartile. However,
because the 2SLS estimates have particularly large standard errors, we cannot reject the
hypothesis of equality across the coefficients for each type of census tract in these specifications.
Panel C examines how the share of immigrants progressed in private housing in response
to immigrant inflows. As discussed above, an inflow of immigrants in public housing might
affect the value of living in the census tract and deter natives if the latter have preferences for
neighborhoods with a more homogenous population. These effects are more likely to be

23
observed when public housing inhabitants represent a very large share of the population in the
census tract. Clearly, the results are consistent with this hypothesis. The share of immigrants in
private housing progressed much more rapidly in tracts where the largest housing projects were
situated. An increase by 1 p.p. of the immigrant share translates into an increase by 1.5 p.p. of
the share of non-European immigrants in the census tracts of the last quartile, where large
housing projects are located, in contrast to only 0.5 p.p. for the census tracts with no public
housing inhabitants.
These results suggest that public housing plays an ambiguous role in segregation
dynamics. On the one hand, the non-negligible progression of non-European immigrants in small
housing projects may decrease segregation as they live in census tracts where the share of
immigrants in private housing progressed much less rapidly. On the other hand, the progression
of non-European immigrants in the largest public housing projects was compounded by their
disproportionate growth in private housing. In line with our second hypothesis, this combination
of large inflows of non-European immigrants into census tracts where large projects are located
in both public housing and private housing contributes in the explanation of persisting
segregation and the growth of enclaves.
VIII. Are immigrants segregated across housing projects?
While the number of non-European immigrants progressed across all of the housing projects, an
important question is whether the immigrants who were allocated to projects of different size are
systematically different. Qualitative work from Masclet (2006) and Sala Pala (2005) among
others describes how housing authorities make a clear hierarchy of projects based on their real
estate value, which varies with their localization and leads to the concentration of non-European
immigrants in projects that are ‘sacrificed’ to protect more ‘valuable’ projects. In contrast, Algan
24
and al (2016) argue that because of the French republican ideology, housing authorities allocate
applicants across projects without concern for their socio-economic status or origin.
To test for sorting along origin and socio-economic lines, we investigate how the
characteristics of new entrants in public housing are correlated with the size of the project as
measured by the share of inhabitants in public housing in the census tract. Using the 2012
census, we estimate the following model:
nl inl l inlX uPH
where nlPH is the share of inhabitants in public housing in census tract n and metro area l
while the vector inlX contains a set of characteristics for individual i who is observed in public
housing in the 2012 census but who reports to have lived in another dwelling the year previous to
the census. The vector of individual covariates includes years of education, labor force status,
non-European origin, whether the household is a single-parent family or a two-parent household
with children. The model also includes metro area fixed effects l that takes into account
systematic differences in immigrant characteristics across metro areas.
A concern is that differences in sorting across projects at the metro area level might
largely reflect the sorting of immigrants across the municipalities that form the metro area.
Indeed, French metro areas are highly fragmented. For example, the metro area of Paris, Lyon
and Marseille include 396, 102, and 38 municipalities, respectively. Most of the time, each
municipality possesses its own independent housing authority that manages the projects that are
located in the municipality. To test for a sorting within municipalities, we also estimate models
with municipality fixed effects instead of metro area fixed effects.
Table 8 reports the estimation results of the model. In Columns 1 and 2, we start with a
sample of new-entrants that includes both natives and immigrants of all origins. Consistent with

25
the previous results, immigrants, in particular non-European immigrants, are more likely to be
observed in larger housing projects within metro areas or municipalities. Column 1 indicates that
being an immigrant increases by 4 p.p. the share of public housing inhabitants in the census tract,
with an additional 4 p.p. effect for non-European immigrants. We also find that individuals with
the least favorable socio-economic characteristics tend to enter larger projects: having 10
additional years of education decreases the share of public housing inhabitants in the
neighborhood by approximately 9 p.p. with respect to other new entrants in the metro area or the
municipality. In addition, being unemployed during the census year is correlated with a share of
public housing inhabitants in a census tract that is larger by 4 p.p.21 Column 2 reports the
regression results of the model that include municipality fixed effect. The coefficients are lower
by 10% on average, which indicates that some of the sorting that has previously been identified
occurs across municipalities. However, the coefficients are still large and indicate substantial
sorting along origin and socio-demographic lines across projects within municipalities. In
Columns 3 and 4, we restrict our sample to non-European immigrants to identify sorting among
the members of that group. We find very similar results, with a strong effect of education and
employment status among individuals from that group.22
Overall, our findings support our third hypothesis, with regard to a sorting of individuals
across projects by origin and socio-economic status. However, it is important to keep in mind
that such an empirical test cannot definitively prove that housing authorities discriminate. While
the previous results are consistent with discrimination, they could also be explained by refusals
of proposals from housing authorities by households with higher outside opportunities in the
21 One issue is that employment status might be affected by the characteristics of the housing project. However, the
results are very similar if that variable is omitted from the model. 22 We also estimated a model where the dependent variable was the probability of living in a large project instead of
the share of public housing in the census tract. The results were qualitatively very similar.

26
private market. Algan et al. (2016: 708) report that many households refuse an offer from
housing authorities, which implies that some households are ready to wait several years before
receiving another offer to be able to choose another neighborhood. A relationship between the
characteristics of recently arrived inhabitants and the size of the project is consistent with a
systematic refusal of offers in large and segregated housing projects by well-off applicants.
IX. Conclusions
This paper has documented how the increasing participation of non-European immigrants in
public housing has influenced their segregation. While average segregation levels rose only
moderately, we find that differences in segregation patterns across cities reflect the spatial
dispersion of public housing, in particular to the share of very large housing projects. In addition,
a novelty of recent segregation patterns has been the increase in the number of immigrant
enclaves in census tracts where large housing projects are located. We also find evidence of
segregation along immigrant origin and socio-economic lines among new-entrants across
projects. Not only are there more non-European immigrants in census tracts with large projects,
but the inhabitants of these projects tend to have a lower socio-economic status, which adds an
additional socio-economic dimension to the segregation of non-European immigrants.
Overall, the consequences of public housing on segregation are notably ambiguous
because of the effects of the progression of the share of immigrants into small housing projects.
The results clearly suggest that the construction of small-scale and more dispersed housing
projects might prevent the formation of enclaves in public housing and thus decrease the
segregation of immigrants. However, constructing smaller projects is more costly and often
meets the opposition of local inhabitants in the more desirable census tracts.

27
X. References
Akresh IR (2008) Occupational Trajectories of Legal US Immigrants: Downgrading and
Recovery. Population and Development Review 34(3): 435–456.
Alba RD and Logan JR (1993) Minority Proximity to Whites in Suburbs: An Individual-Level
Analysis of Segregation. American Journal of Sociology 98(6): 1388–1427.
Algan Y, Hémet C and Laitin DD (2016) The Social Effects of Ethnic Diversity at the Local
Level: A Natural Experiment with Exogenous Residential Allocation. Journal of Political
Economy 124(3): 696–733.
Bell B and Machin S (2013) Immigrant Enclaves and Crime*. Journal of Regional Science
53(1): 118–141.
Bell W (1954) A Probability Model for the Measurement of Ecological Segregation. Social
Forces 32(4): 357–364.
Blanc M (2010) The Impact of Social Mix Policies in France. Housing Studies 25(2): 257–272.
Bobo L and Zubrinsky CL (1996) Attitudes on Residential Integration: Perceived Status
Differences, Mere In-Group Preference, or Racial Prejudice? Social Forces 74(3): 883–
909.
Bolt G, van Kempen R and van Ham M (2008) Minority Ethnic Groups in the Dutch Housing
Market: Spatial Segregation, Relocation Dynamics and Housing Policy. Urban Studies
45(7): 1359–1384.
Bolt G, Özüekren AS and Phillips D (2013) Linking Integration and Residential Segregation.
Routledge.
Bonnet F, Lalé E, Safi M, et al. (2016) Better residential than ethnic discrimination! Reconciling
audit and interview findings in the Parisian housing market. Urban Studies 53(13): 2815–
2833.
Boschman S and Ham M van (2015) Neighbourhood selection of non-Western ethnic minorities:
testing the own-group effects hypothesis using a conditional logit model. Environment
and Planning A 47(5): 1155–1174.
Bourgeois M (2013) Choisir les locataires du parc social ? Une approche ethnographique de la
gestion des HLM. Sociologie du Travail 55(1): 56–75.
Card D (2001) Immigrant Inflows, Native Outflows, and the Local Labor Market Impacts of
Higher Immigration. Journal of Labor Economics 19(1): 22–64.
Card D, Mas A and Rothstein J (2008) Tipping and the Dynamics of Segregation. Quarterly
Journal of Economics 123(1): 177–218.
Charles CZ (2003) The Dynamics of Racial Residential Segregation. Annual Review of
Sociology 29: 167–207.
Combes P-P, Decreuse B, Schmutz B, et al. (2012) The Neighbor is King: Customer
Discrimination in the Housing Market. CEPR Discussion Paper, Rochester, NY: Center
for Economic Policy Research. Available from: https://papers.ssrn.com/abstract=2155530
(accessed 14 July 2017).
Cortes P (2008) The Effect of Low‐Skilled Immigration on U.S. Prices: Evidence from CPI Data.
Journal of Political Economy 116(3): 381–422.
Crowder K, Pais J and South SJ (2012) Neighborhood Diversity, Metropolitan Constraints, and
Household Migration. American Sociological Review 77(3): 325–353.

28
Cutler DM, Glaeser EL and Vigdor JL (2008) Is the Melting Pot Still Hot? Explaining the
Resurgence of Immigrant Segregation. The Review of Economics and Statistics 90(3):
478–497.
Delarue J-M (1991) Banlieues en difficultés : La relégation, rapport au ministre d’Etat,... Paris:
Syros.
Deschamps E (2001) La politique urbaine du logement : l’objectif de mixité sociale, Abstract.
Revue française des affaires sociales (3): 81–97.
Dietrich-Ragon P (2013) Qui rêve du logement social ? Sociologie (N°1, vol. 4). Available from:
https://sociologie.revues.org/1512 (accessed 6 March 2017).
Dubet F (1987) La Galère : jeunes en survie. Paris: Fayard.
Friedberg RM (2000) You Can’t Take It with You? Immigrant Assimilation and the Portability
of Human Capital. Journal of Labor Economics 18(2): 221–251.
Friedrichs J (1998) Ethnic Segregation in Cologne, Germany, 1984-94. Urban Studies 35(10):
1745–1763.
Glitz A (2014) Ethnic segregation in Germany. Labour Economics 29: 28–40.
Gobillon L, Selod H and Zenou Y (2007) The Mechanisms of Spatial Mismatch. Urban Studies
44(12): 2401–2427.
Hall M and Crowder K (2014) Native Out-Migration and Neighborhood Immigration in New
Destinations. Demography 51(6): 2179–2202.
Iceland J and Scopilliti M (2008) Immigrant Residential Segregation in U.S. Metropolitan Areas,
1990–2000. Demography 45(1): 79–94.
Iceland J and Wilkes R (2006) Does Socioeconomic Status Matter? Race, Class, and Residential
Segregation. Social Problems 53(2): 248–273.
Kesteloot C and Cortie C (1998) Housing Turks and Moroccans in Brussels and Amsterdam: The
Difference between Private and Public Markets. Urban Studies 35(10): 1835–1853.
Krysan M and Farley R (2002) The Residential Preferences of Blacks: Do They Explain
Persistent Segregation? Social Forces 80(3): 937–980.
Krysan M, Couper MP, Farley R, et al. (2009) Does race matter in neighborhood preferences?
Results from a video experiment. AJS; American journal of sociology 115(2): 527–559.
Lapeyronnie D (2008) Ghetto Urbain. Paris: Robert Laffont.
Lepoutre D (2001) Coeur de banlieue. Codes, rites et langages. Poche, Paris: Odile Jacob.
Logan JR and Alba RD (1993) Locational Returns to Human Capital: Minority Access to
Suburban Community Resources. Demography 30(2): 243–268.
Logan JR, Zhang W and Alba RD (2002) Immigrant Enclaves and Ethnic Communities in New
York and Los Angeles. American Sociological Review 67(2): 299–322.
Logan JR, Stults BJ and Farley R (2004) Segregation of minorities in the metropolis: two
decades of change. Demography 41(1): 1–22.
Masclet O (2006) Du « bastion » au « ghetto ». Actes de la recherche en sciences sociales no
159(4): 10–25.
Massey DS and Denton NA (1985) Spatial Assimilation as a Socioeconomic Outcome. American
Sociological Review 50(1): 94–106.
Massey DS and Denton NA (1988) The Dimensions of Residential Segregation. Social Forces
67(2): 281–315.
Mcavay H (2016) Trajectoires socio-spatiales et statut d’occupation du logement des immigrés et
de leurs descendants en France : les facteurs individuels et contextuels.

29
http://www.theses.fr. Available from: http://www.theses.fr/s82393 (accessed 18 January
2017).
Moraga JF-H, Ferrer-Carbonell A and Saitz A (2015) Immigrant Locations and Native
Residential Preferences in Spain: New Ghettos? IAE, CSIC.
Musterd PS and Ostendorf PW (2009) Residential Segregation and Integration in the
Netherlands. Journal of Ethnic and Migration Studies 35(9): 1515–1532.
Musterd S (2005) Social and Ethnic Segregation in Europe: Levels, Causes, and Effects. Journal
of Urban Affairs 27(3): 331–348.
Musterd S (2014) Public Housing for Whom? Experiences in an Era of Mature Neo-Liberalism:
The Netherlands and Amsterdam. Housing Studies 29(4): 467–484.
Musterd S and Deurloo R (1997) Ethnic Segregation and the Role of Public Housing in
Amsterdam. Tijdschrift voor economische en sociale geografie 88(2): 158–168.
Oberti M and Préteceille E (2016) La ségrégation urbaine. La Découverte. Repères. Available
from: https://www.cairn.info/la-segregation-urbaine--9782707164254.htm (accessed 14
July 2017).
Pais J, South SJ and Crowder K (2012) Metropolitan Heterogeneity and Minority Neighborhood
Attainment: Spatial Assimilation or Place Stratification? Social problems 59(2): 258–281.
Pan Ké Shon J-L and Verdugo G (2014) Ségrégation et incorporation des immigrés en France:
Ampleur et intensité entre 1968 et 2007. Revue française de sociologie 55(2): 245–283.
Pan Ké Shon J-L and Verdugo G (2015) Forty years of immigrant segregation in France, 1968–
2007. How different is the new immigration? Urban Studies 52(5): 823–840.
Peach C (1996) Does Britain Have Ghettos? Transactions of the Institute of British Geographers
21(1): 216–235.
Préteceille E (2009) La ségrégation ethno-raciale a-t-elle augmenté dans la métropole
parisienne ? Revue française de sociologie Vol. 50(3): 489–519.
Priemus H and Dieleman F (2002) Social Housing Policy in the European Union: Past, Present
and Perspectives. Urban Studies 39(2): 191–200.
Quillian L and Lagrange H (2016) Socioeconomic Segregation in Large Cities in France and the
United States. Demography 53(4): 1051–1084.
Rathelot R and Safi M (2014) Local Ethnic Composition and Natives’ and Immigrants’
Geographic Mobility in France, 1982–1999. American Sociological Review 79(1): 43–64.
Ross SL and Turner MA (2005) Housing Discrimination in Metropolitan America: Explaining
Changes between 1989 and 2000. Social Problems 52(2): 152–180.
Rutter J and Latorre M (2008) Social housing allocation and immigrant communities. Equality
and Human Rights Commission. Manchester, UK.
Safi M (2009) La dimension spatiale de l’intégration : évolution de la ségrégation des
populations immigrées en France entre 1968 et 1999. Revue française de sociologie
50(3): 521.
Sala Pala V (2005) Le racisme institutionnel dans la politique du logement social. Sciences de la
Société (65): 87–102.
Scanlon K, Whitehead C and Arrigoitia MF (2014) Social Housing in Europe. John Wiley &
Sons.
Schmutz B (2013) Public Housing Quotas and Segregation. Urban Public Economics Review
(18). Available from: http://www.redalyc.org/resumen.oa?id=50428804003 (accessed 14
July 2017).

30
Schönwälder K and Söhn J (2009) Immigrant Settlement Structures in Germany: General
Patterns and Urban Levels of Concentration of Major Groups. Urban Studies 46(7):
1439–1460.
Simpson L and Finney N (2009) Spatial patterns of internal migration: evidence for ethnic
groups in Britain. Population, Space and Place 15(1): 37–56.
South SJ, Crowder K and Pais J (2008) Inter-neighborhood Migration and Spatial Assimilation
in a Multi-ethnic World: Comparing Latinos, Black and Anglos. Social forces; a
scientific medium of social study and interpretation 87(1): 415–444.
Tammaru T, Musterd S, van Ham M, et al. (2016) A multi-factor approach to understanding
socio-economic segregation in European capital cities. Taylor & Francis. Available
from: http://www.oapen.org/search?identifier=615512 (accessed 14 July 2017).
Tissot S (2006) Une « discrimination informelle » ? Actes de la recherche en sciences sociales no
159(4): 54–69.
Vasileva K (2011) 6.5% of the EU population are foreigners and 9.4% are born abroad.
Eurostat. Available from: http://ec.europa.eu/eurostat/fr/web/products-statistics-in-focus/-
/KS-SF-11-034 (accessed 14 July 2017).
Verdugo G (2016) Public housing magnets: public housing supply and immigrants’ location
choices. Journal of Economic Geography 16(1): 237–265.
Vigdor JL (2003) Residential segregation and preference misalignment. Journal of Urban
Economics 54(3): 587–609.
Wagmiller RL, Gage-Bouchard E and Karraker A (2017) Does Black Socioeconomic Mobility
Explain Recent Progress Toward Black-White Residential Integration? Demography: 1–
25.
Wilson KL and Portes A (1980) Immigrant Enclaves: An Analysis of the Labor Market
Experiences of Cubans in Miami. American Journal of Sociology 86(2): 295–319.
Yinger J (1995) Closed Doors, Opportunities Lost: The Continuing Costs of Housing
Discrimination. Russell Sage Foundation. Available from:
http://www.jstor.org/stable/10.7758/9781610445627 (accessed 14 July 2017).

31
XI. Tables
Table 1: Immigration and public housing in France, 1982-2012
A. Composition of immigration
1982 1990 1999 2012
Immigrants to population 7.4 7.4 7.4 8.8
Immigrant households to population 9.1 9.0 9.1 10.5
Among immigrants households share of:
Non-Europeans (all origins) 37.9 43.7 51.6 60.6
Maghrebis 26.2 27.1 30.0 31.3
Sub-Saharan Africans 3.5 4.8 8.1 13.0
Asians 6.8 9.8 11.2 12.6
B. Share of households from the group living in public housing
Natives 12.7 13.5 14.7 12.7
Immigrants 20.8 24.1 28.9 30.3
Non-Europeans 30.2 36.6 41.1 41.3
Maghrebis 32.9 39.1 45.9 46.9
Sub-Saharan Africans 26.1 31.8 42.2 48.0
C. Share of the group among households in public housing
Immigrants 14.1 14.9 16.4 21.7
Non-Europeans 7.8 9.4 12.0 17.9
Maghrebis 5.9 6.6 7.8 10.5
Sub-Saharan Africans 0.6 1.0 1.9 4.5
Source: 1982, 1990, 1999, 2012 Censuses. Notes: Tabulations from the authors. We categorize a
household as immigrant if the head of household is an immigrant.

32
Table 2: How segregated are public housing projects? A. Distribution of households in public housing according to the share of public
housing inhabitants in the census tract in 2012
Q1: Share
Public
Housing
in (0;5%]
Q2: Share
Public
Housing in
(5;16%]
Q3: Share
Public
Housing in
(16;37%]
Q4: Share
Public
Housing>37%
Households in public housing 4.4 19.5 29.8 47.2
Immigrant households in public
housing 2.2 12.1 24.7 61.0
Non-European households in public
housing 1.9 10.8 23.7 63.5
B. Share of natives and immigrants households across projects in 2012
All households
Non-European
immigrants
Small
projects
Large
projects
Small
projects
Large
projects
France 7.6 7.6 13.5 26.9
Paris 8.5 17.6 10.6 29.2
Lyon 10.1 11.0 19.5 30.1
Marseille 7.4 11.2 10.2 24.4
Lille 10.5 12.9 14.5 31.1
C. Dissimilarity Index of households in public housing by years
1982 1990 1999 2012
France 57.9 55.6 54.9 51.4
Paris 60.7 63.4 59.2 55.8
Lyon 58.8 61.2 54.0 50.1
Marseille 68.8 68.2 61.9 60.7
Lille 55.5 56.3 52.0 48.7
D. Isolation index of households in public housing by years
France 49.2 48.8 51.1 46.9
Paris 48.9 54.6 54.6 50.6
Lyon 47.8 51.4 47.7 42.7
Marseille 51.4 53.0 49.5 47.6
Lille 49.7 50.9 49.1 45.1
Source: 1982, 1990, 1999, 2012 Censuses. Notes: Tabulations from the authors. Large projects
are projects located in census tracts where the share of households in public housing is superior
to 37%. We categorize a household as Non-European if the head of household is a Non-
European immigrant.

33
Table 3: Dissimilarity Indexes across Metro Areas, 1982-2012
1982 1990 1999 2012
A. Weighted average by group
European households 20 18 18 18
Non-European households 33 33 34 34
B. Dissimilarity Indexes of Non-European households
across major metro areas
Paris 31 30 32 33
Lyon 31 33 36 36
Marseille 35 33 36 41
Nice 21 22 26 33
Lille 42 42 43 41
Toulouse 31 32 32 30
Bordeaux 37 35 37 35
Nantes 43 45 41 38
Toulon 36 37 36 45
Douai 40 39 36 33
Strasbourg 32 35 39 35
Grenoble 31 32 34 33
Rouen 36 39 37 35
Montpellier 28 28 27 30
Nancy 36 40 37 35
Standard deviation 4.4 4.3 3.3 3.1
Source: 1982, 1990, 1999, 2012 Censuses. Note: Panel A shows the weighted average
dissimilarity index of European and non-European households across French metro areas using
the population of the group in the metro area as weights. Only metro areas with more than 500
immigrants have been included in the calculation of the average. We categorize a household as
Non-European if the head of household is a Non-European immigrant.

34
Table 4: Isolation Indexes across Metro Areas, 1982-2012
Isolation index
Difference
(Isolation index -
Share of the Group in
Metro Area
Population)
1982 1990 1999 2012 1982 2012
A. Weighted average by group
European household 7.6 6.5 5.8 6.0 2.3 2.0
Non-European households 11.5 13.0 16.0 20.7 5.9 10.7
B. Non-Europeans households across major metro areas
Paris 13.0 15.0 18.8 25.4 5.0 8.4
Lyon 10.2 12.5 15.4 19.3 4.0 8.8
Marseille 16.3 15.3 17.1 20.5 8.6 10.7
Nice 7.9 8.5 10.2 14.6 2.1 6.8
Lille 10.2 11.8 14.4 17.2 5.7 8.9
Toulouse 7.7 9.8 14.0 15.8 3.7 7.9
Bordeaux 5.0 5.9 8.2 11.2 2.5 5.5
Nantes 3.9 6.2 8.2 12.4 2.4 7.1
Toulon 13.0 12.0 11.0 12.8 8.1 8.4
Douai 6.2 6.2 5.8 6.1 3.3 2.5
Strasbourg 8.6 12.9 17.5 21.3 3.6 8.7
Grenoble 10.0 10.8 13.6 15.9 3.9 6.9
Rouen 5.3 8.1 10.5 14.3 2.7 7.1
Montpellier 9.1 11.6 15.3 20.1 3.1 8.9
Nancy 6.5 8.0 8.7 12.6 3.2 6.7
Standard deviation 2.6 2.6 3.4 3.7 1.5 1.4
Source: 1982, 1990, 1999, 2012 Censuses. Note: Panel A shows the weighted average isolation
index of European and non-European immigrants across French metro areas. Only metro areas
with more 500 immigrants in the group have been included in the calculation of the weighted
average. The last two columns show the difference between the isolation index and the share of
the immigrant group in the population of the metro area. We categorize a household as Non-
European if the head of household is a Non-European immigrant.

35
Table 5: Distribution of census tracts and non-European households by the share of immigrant
households in the population
A. Distribution of census tracts
Share of immigrant households in the census tract population
00-01 01-05 06-10 10-15 16-20 21-25 26-30 >30
1982 9.9 24.7 25.8 18.6 10.8 5.2 2.5 2.5
1990 9.2 26.2 26.2 18.2 10.1 5.2 2.4 2.6
1999 7.2 28.7 27.3 16 9.0 4.7 2.8 4.2
2012 4.7 29.8 26.1 14.6 8.8 4.9 3.3 7.9
B. Distribution of non-European immigrant households across census tracts
Share of immigrant households in the census tract population
00-01 02-05 06-10 10-15 16-20 21-25 26-30 >30
1982 0.2 4.9 15.4 23.2 21.1 14.3 9.1 11.7
1990 0.2 5.2 15.9 22.3 20.3 14.2 8.4 13.3
1999 0.2 5.6 15.2 18.9 16.9 12.7 9.6 21.0
2012 0.1 4.8 13.1 15.2 14.3 11 9.1 32.5
Source: 1982, 1990, 1999, 2012 Censuses. Notes: Panel A shows the distribution of census tracts
by the share of immigrant in the population of the tract. Panel B shows how non-European
immigrant household are distributed across these census tracts. We categorize a household as
Non-European if the head of household is a Non-European immigrant.

36
Table 6: What explain differences in segregation levels across metro areas?
Dependent variable A. Dissimilarity B. Adjusted Isolation
C. Share of non-Europeans in
enclaves
2012 Cross-section
Long Differences
1982-2012 2012 Cross-section
Long Differences
1982-2012 2012 Cross-section
Long Differences
1982-2012
(1) (2) (3) (4) (5) (6) (7) (8) (9) (10) (11) (12)
Dissimilarity of public housing 0.242*** 0.200*** 0.109* 0.007 0.180 0.378 0.137 0.272
(0.042) (0.067) (0.058) (0.074) (0.201) (0.243) (0.207) (0.233)
Isolation of public housing 0.095*** 0.010 0.019 0.035 0.145 -0.183 -0.331 -0.301
(0.030) (0.038) (0.034) (0.037) (0.245) (0.243) (0.254) (0.247)
Share non-Europeans 0.246*** 0.033 0.347*** 0.161** 0.092*** -0.046 0.084*** -0.016 0.458*** -0.125 0.387*** 0.072
in public housing (0.047) (0.072) (0.051) (0.065) (0.028) (0.040) (0.024) (0.031) (0.117) (0.164) (0.108) (0.138)
Share non-Europeans 0.295*** 0.321*** 0.222*** 0.160*** 0.845*** 0.479***
in large public housing projects (0.079) (0.070) (0.046) (0.033) (0.184) (0.151)
Share metro area population -0.073 0.217 -0.371** -0.350 -0.135*** -0.004 -0.260*** 0.029 -0.482* 0.939 -0.722* 0.755
in public housing (0.079) (0.222) (0.153) (0.279) (0.051) (0.099) (0.075) (0.0108) (0.252) (0.585) (0.413) (0.356)
Share metro area population -0.515** -0.255 -0.238** -0.438*** -1.849*** -1.936***
in large public housing projects (0.230) (0.269) (0.113) (0.118) (0.546) (0.574)
Controls for
Characteristics of non-European
households Yes Yes Yes Yes Yes Yes Yes Yes Yes Yes Yes Yes
Characteristics of metro area Yes Yes Yes Yes Yes Yes Yes Yes Yes Yes Yes Yes
R2 0.64 0.67 0.43 0.49 0.57 0.63 0.22 0.31 0.91 0.90 0.78 0.76
N 192 192 192 192 192 192 192 192 192 192 192 192
Source: 1982 and 2012 Censuses. Note: The table shows regression results of the dissimilarity index (columns 1-4), the isolation index
(columns 5-8), the share of non-Europeans in enclaves (columns 9-12) on the indicated variables. The segregation indexes are
measured for non-European immigrants at the metro area level. The sample includes 192 metro areas with at least 500 non-European
immigrants both in 1982 and in 2012. Columns 1 & 2, 5 & 6 and 9 & 10 estimate the model using the cross-section of metro areas in
2012. Columns 3 & 4, 7 & 8 and 11 & 12 estimate the model using long-differences between 1982 and 2012. Large projects are
projects located in census tracts where the share of households in public housing is superior to 37%. Robust standard errors are
displayed in parenthesis. (*), (**), and (***) denote statistical significance at, respectively, 10%, 5% level, and 1% level.

37
Table 7: Which census tracts absorbed the increase in non-European immigration within metro
areas?
Census Tracts All tracts
Tracts with
no Public
housing
Q1: Share
Public
Housing in
(0;5%]
Q2: Share
Public
Housing in
(5;16%]
Q3: Share
Public Housing
in (16;37%]
Q4: Share
Public
Housing>37%
(1) (2) (3) (4) (5) (6)
A. Dependent variable: Δ share of non-European households in the census tract
OLS Estimates
Δ Share non-Europeans 1.077*** 0.575*** 0.548*** 0.711*** 1.078*** 1.703***
in metro area (0.012) (0.045) (0.045) (0.023) (0.023) (0.080)
2SLS Estimates
Δ Share non-Europeans 1.090*** 0.523*** 0.463*** 0.744*** 1.161*** 1.707***
in metro area (0.014) (0.075) (0.023) (0.021) (0.051) (0.0923)
First Stage Fisher 14 7 9 13 19 25
N 26 580 2 231 5 995 6 003 6 151 6 200
B. Dependent variable: Δ share of non-European households in the census tract
among public housing inhabitants
OLS Estimates
Δ Share non-Europeans 1.858***
1.622*** 1.705*** 1.886*** 2.040***
in metro area (0.073)
(0.151) (0.094) (0.072) (0.087)
2SLS Estimates
Δ Share non-Europeans 2.114***
2.301*** 1.899*** 1.976*** 2.047***
in metro area (0.164)
(0.441) (0.120) (0.091) (0.110)
First Stage Fisher 16
9 13 20 25
N 24 349
5 995 6 003 6 151 6 200
C. Dependent variable: Δ share of non-European households in the census tract
among private housing inhabitants
OLS Estimates
Δ Share non-Europeans 0.924*** 0.575*** 0.530*** 0.626*** 0.863*** 1.479**
in metro area (0.026) (0.045) (0.048) (0.019) (0.023) (0.107)
2SLS Estimates
Δ Share 0.922*** 0.523*** 0.442*** 0.637*** 0.922*** 1.443***
non-Europeans (0.021) (0.075) (0.021) (0.019) (0.045) (0.094)
First Stage Fisher 14 7 9 13 20 25
N 26 580 2 231 5 995 6 003 6 151 6 200
Source: 1990, 1999, 2012 Censuses. Note: The table shows regression results where the
dependent variable is the change in the share of non-European immigrants in the census tract
(Panel A), among public housing inhabitants in the census tract (Panel B) and among private
housing inhabitants in the census tract (Panel C). The independent variable is the change in the
share of non-European immigrants in the metro area. Within each panel the model is estimated
alternatively with OLS and with 2SLS using a shift-share instrument based on the distribution of
immigrants in 1968. Column 1 reports estimates using all census tracts and column 2 estimates
obtained from census tracts with no public housing inhabitants. Column 3 to 6 estimate the
model on different quartile of the distribution of the share of public housing in the population

38
across census tracts. Regressions are weighted by the number of inhabitants in the census tract in
panel A, the number of inhabitants in public housing in panel B, and in private housing in panel
C. Standard errors are clustered at the metro area level within each panel. (*), (**), and (***)
denote statistical significance at, respectively, 10%, 5% level, and 1% level.
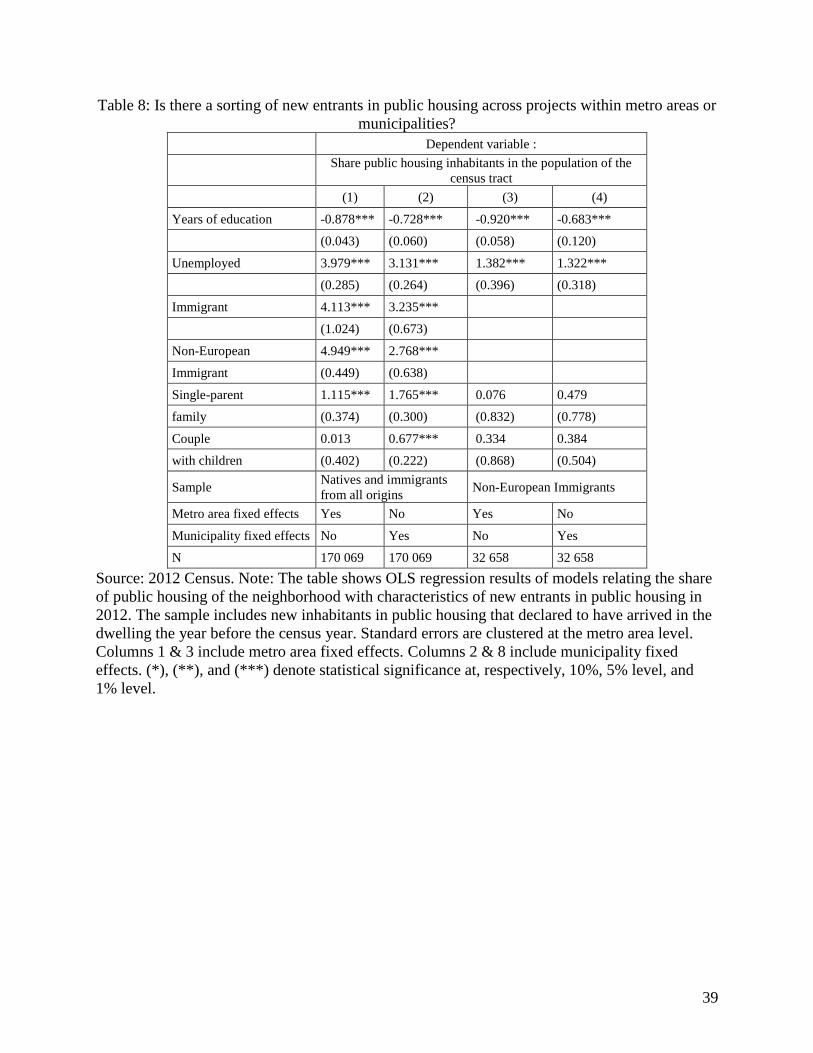
39
Table 8: Is there a sorting of new entrants in public housing across projects within metro areas or
municipalities?
Dependent variable :
Share public housing inhabitants in the population of the
census tract
(1) (2) (3) (4)
Years of education -0.878*** -0.728*** -0.920*** -0.683***
(0.043) (0.060) (0.058) (0.120)
Unemployed 3.979*** 3.131*** 1.382*** 1.322***
(0.285) (0.264) (0.396) (0.318)
Immigrant 4.113*** 3.235***
(1.024) (0.673)
Non-European 4.949*** 2.768***
Immigrant (0.449) (0.638)
Single-parent 1.115*** 1.765*** 0.076 0.479
family (0.374) (0.300) (0.832) (0.778)
Couple 0.013 0.677*** 0.334 0.384
with children (0.402) (0.222) (0.868) (0.504)
Sample Natives and immigrants
from all origins Non-European Immigrants
Metro area fixed effects Yes No Yes No
Municipality fixed effects No Yes No Yes
N 170 069 170 069 32 658 32 658
Source: 2012 Census. Note: The table shows OLS regression results of models relating the share
of public housing of the neighborhood with characteristics of new entrants in public housing in
2012. The sample includes new inhabitants in public housing that declared to have arrived in the
dwelling the year before the census year. Standard errors are clustered at the metro area level.
Columns 1 & 3 include metro area fixed effects. Columns 2 & 8 include municipality fixed
effects. (*), (**), and (***) denote statistical significance at, respectively, 10%, 5% level, and
1% level.

40
XII. Supplementary Appendix for online publication
Indexes of Segregation
The index of dissimilarity (henceforth, ID) is given by:
1
2
iu iuu
i u u u
G NID
G N
where for each urban unit u , the IDs are calculated at the IRIS level i , using immigrants of a
given origin with respect to the rest of the population. The term iuG denotes the number of
immigrants living in census tract i , and uG is the total number of immigrants in the urban unit.
The terms iuN and uN refer to the number of inhabitants in the census tract and in the metro
area, respectively who do not belong to the immigrant group, which by definition might includes
immigrants from other groups.
The index of isolation follows Bell (1954) and reports the percentage of the immigrant
group in the area occupied by the average immigrant from the group:
iu iuu
i u u iu
G GI
G population
where iupopulation refers to the total population of tract u. An immigrant group concentration is
assessed as the share of the group in the census tract of a member of the group in question.

41
Appendix Table A1: Additional coefficients of the model of Table 7
Dependent variable Dissimilarity Adjusted Isolation Share of non-Europeans in enclaves
2012 Cross-section
Long Differences
1982-2012 2012 Cross-section
Long Differences
1982-2012 2012 Cross-section
Long Differences
1982-2012
(1) (2) (3) (4) (5) (6) (7) (8) (9) (10) (11) (12)
Characteristics of non-European immigrants
Share of the group in the -0.174 -0.062 0.176 0.072 0.178* 0.305*** 0.153 0.131 2.047*** 1.507*** 2.556*** 2.543***
metro area population (0.161) (0.158) (0.220) (0.211) (0.098) (0.096) (0.106) (0.101) (0.397) (0.403) (0.459) (0.469)
Share blue-collar workers 0.275*** 0.219*** 0.160** 0.169** 0.222*** 0.164*** -0.010 0.005 0.132 0.350* -0.004 -0.069
(0.083) (0.082) (0.078) (0.075) (0.048) (0.047) (0.037) (0.035) (0.192) (0.198) (0.160) (0.165)
Share managers 0.089 0.009 -0.070 -0.030 -0.010 -0.065 0.007 0.018 0.268 0.522 0.127 0.116
(0.151) (0.147) (0.198) (0.188) (0.087) (0.083) (0.095) (0.089) (0.334) (0.350) (0.403) (0.417)
Share unemployed 0.091 0.074 0.148 0.151* 0.077 0.071 0.089* 0.096* 0.418* 0.413 0.453** 0.412**
(0.108) (0.104) (0.095) (0.090) (0.062) (0.058) (0.045) (0.043) (0.239) (0.252) (0.195) (0.201)
Share arrived since last census 0.197** 0.203** 0.173*** 0.126** 0.061 0.076 0.016 0.006 -0.001 -0.010 -0.019 -0.015
(0.099) (0.097) (0.057) (0.055) (0.057) (0.054) (0.027) (0.026) (0.219) (0.231) (0.119) (0.120)
Average length of stay in
France (in years) 0.594*** 0.669*** na na 0.185* 0.278*** na na 0.539 0.326
(0.180) (0.179) (0.103) (0.101) (0.406) (0.420)
Note: See text and Table 6.

42
Appendix Table A2: Additional coefficients of the model of Table 7
Dependent variable Dissimilarity Adjusted Isolation Share of non-Europeans in enclaves
2012 Cross-section
Long Differences
1982-2012 2012 Cross-section
Long Differences
1982-2012 2012 Cross-section
Long Differences
1982-2012
(1) (2) (3) (4) (5) (6) (7) (8) (9) (10) (11) (12)
Metro area characteristics
Log population 1.976*** 1.775*** 1.784 1.019 0.457** 0.377* 5.222*** 5.192*** 1.539* 2.112 -0.600 -1.382
(0.367) (0.363) (2.793) (2.670) (0.213) (0.204) (1.822) (1.205) (0.824) (0.858) (5.722) (5.927)
Share immigrants in population -0.090 -0.113 -0.292 -0.161 0.057 0.012 0.108 0.138 2.149*** 2.361*** 2.778*** 2.771***
(0.128) (0.124) (0.247) (0.238) (0.076) (0.073) (0.118) (0.111) (0.300) (0.314) (0.513) (0.524)
Share managers -0.290* -0.239 -0.208 -0.205 -0.012 0.027 -0.035 -0.014 -0.592 -0.765** -0.193 -0.300
(0.166) (0.162) (0.179) (0.170) (0.095) (0.090) (0.085) (0.080) (0.367) (0.386) (0.364) (0.376)
Share blue-collard -0.266* -0.223 -0.081 -0.092 -0.352*** -0.286*** 0.087 0.111 -0.377 -0.605* 0.380 0.262
(0.152) (0.147) (0.176) (0.168) (0.082) (0.080) (0.084) (0.080) (0.343) (0.360) (0.361) (0.372)
Share unemployed 0.447** 0.369* 0.042 0.142 0.321*** 0.267** 0.175 0.181 -0.109 0.186 -0.720 -0.646
(0.208) (0.203) (0.254) (0.243) (0.120) (0.114) (0.121) (0.115) (0.462) (0.484) (0.520) (0.532)
Note: See text and Table 6

43