can slow-release monoammonium phosphate and struvite … · 2018-09-21 · can slow-release...
TRANSCRIPT

Can Slow-Release Monoammonium Phosphate and Struvite
Improve Phosphorus Use Efficiency and Reduce
Seedling Toxicity in Canola?
FINAL REPORT
Submitted to the Canola Council of Canada
June 3, 2014
Y. Katanda1, F. Zvomuya1, D. Flaten1, and N. Cicek2
1 Dept. of Soil Science, University of Manitoba, Winnipeg, MB R3T 2N2, Canada
2 Dept. of Biosystems Engineering, University of Manitoba, Winnipeg, MB R3T 2N2, Canada

2
ACKNOWLEDGEMENTS
We greatly appreciate funding from the Canola Council of Canada (Alberta Canola
Producers Commission, Manitoba Canola Growers Association, SaskCanola, and the Alberta
Crop Industry Development Fund), Manitoba Pork Council, and Agrium Inc. We also thank
Christian Austema (Roseisle, MB) and Dan Mazier (Justice, MB) for generously providing the
soils used in this study. Technical support from Rob Ellis, Bo Pan, Anthony Buckley and Andre
Dufresneis gratefully acknowledged. We also thank the following graduate and summer students
for their assistance: Nicholson Jeke, Lebogang Motaung, Natashia Durand, Acqueline
Masvikeni, Meagan Grenkow, and Erica Flaten.

3
TABLE OF CONTENTS
ACKNOWLEDGEMENTS ..................................................................................................... 2
TABLE OF CONTENTS ......................................................................................................... 3
LIST OF TABLES ................................................................................................................... 5
LIST OF FIGURES ................................................................................................................. 6
EXECUTIVE SUMMARY ..................................................................................................... 8
Background .......................................................................................................................... 8
Procedures ............................................................................................................................ 8
Results .................................................................................................................................. 9
Canola Biomass Yield and Phosphorus Uptake .............................................................. 9
Wheat Biomass Yield and Phosphorus Uptake ............................................................. 10
Seedling Toxicity ........................................................................................................... 11
Conclusions ........................................................................................................................ 11
BACKGROUND ................................................................................................................... 13
LITERATURE REVIEW ...................................................................................................... 17
CROP GROWTH AND PHOSPHORUS UPTAKE STUDIES ............................................ 19
Materials and Methods ....................................................................................................... 19
Hog Manure Recovered Struvite ................................................................................... 19
Soils ............................................................................................................................... 19
Laboratory Analyses ...................................................................................................... 19
Experiment Setup ........................................................................................................... 20
Soil Preparation and Planting ........................................................................................ 21

4
Harvesting ...................................................................................................................... 22
Calculations ................................................................................................................... 23
Statistical Analyses ........................................................................................................ 24
Results ................................................................................................................................ 24
Recovered Struvite Properties ....................................................................................... 24
Soil Properties ................................................................................................................ 25
Dry Matter Yield ............................................................................................................ 26
Phosphorus Uptake ........................................................................................................ 32
Phosphorus Use Efficiency Indices ............................................................................... 35
Crop Sequence Effects on Cumulative P Uptake and P Uptake Efficiency .................. 44
Bicarbonate-Extractable Phosphorus ............................................................................. 48
Discussion .......................................................................................................................... 48
Conclusions ........................................................................................................................ 55
SEEDLING TOXICITY STUDIES ....................................................................................... 56
Methods and Materials ....................................................................................................... 56
Experiment setup ........................................................................................................... 56
Statistical Analyses ........................................................................................................ 57
Results ................................................................................................................................ 60
Cumulative Time-Course and Extent of Seedling Emergence ...................................... 60
Discussion .......................................................................................................................... 69
Conclusions ........................................................................................................................ 72
REFERENCES ...................................................................................................................... 73

5
LIST OF TABLES
Table 1. Selected chemical properties of hog manure recovered struvite and commercial
fertilizers used in the greenhouse bioassay ..................................................................... 25
Table 2. Selected chemical and physical properties of soils used in the experiments .................. 25
Table 3. Canola and wheat dry matter yield (DMY), phosphorus uptake, and phosphorus
efficiency (PUE), and agronomic efficiency (AE) as affected by struvite, MAP and
CMAP application .......................................................................................................... 29
Table 4. Cumulative P uptake (PU) and P uptake efficiency (PUE) as affected by crop sequence,
P source, P rate, application method and soil. ................................................................ 45
Table 5. The AIC results from fitting the Mitscherlich, Gompertz, and Logistic functions to
canola emergence data, as affected by soil, P source, seedbed utilization (SBU), and P
rate. ................................................................................................................................. 59
Table 6. Cumulative canola seedling counts as affected by P source, P rate, seedbed utilization
(SBU), days after planting (DAP), and soil. ................................................................... 61
Table 7. Final seedling counts at 16 days after planting (DAP) as affected by P source, P rate,
seedbed-utilization (SBU), and soil. ............................................................................... 63
Table 8. Phosphorus source, rate, and SBU effects on final canola seedling counts and Gompertz
function parameters for cumulative percentage emergence data. ................................... 66

6
LIST OF FIGURES
Figure 1. Canola dry matter yield as affected by P sources in the three crop phases. .................. 27
Figure 2. Effects of P source and rate on canola dry matter yield. ............................................... 28
Figure 3. Changes in canola biomass yield over three crop phases as affected by P application
rate. ................................................................................................................................. 30
Figure 4. Effects of P placement on canola DMY over 3 crop phases.. ....................................... 31
Figure 5. Wheat DMY as affected by P source and soil over 3 growth phases.. .......................... 32
Figure 6. Effects of P rate and soil on canola P uptake over three crop phases.. ......................... 33
Figure 7. Effects of; (a) P source, (b) P rate, and (c) soil type on wheat P uptake over 3 growth
phases.. ............................................................................................................................ 35
Figure 8. Phosphorus uptake efficiency of canola as affected by P source and soil type. ............ 36
Figure 9. Phosphorus uptake efficiency of canola as affected by P rate and crop phase. ............. 37
Figure 10. Phosphorus uptake efficiency of canola as affected by soil and crop phase. .............. 38
Figure 11. Wheat PUE as affected by soil, P rate, and crop phase. .............................................. 39
Figure 12. Phosphorus source and crop phase effects on canola AE. ........................................... 40
Figure 13. Effects of P rate, soil, and crop phase on canola AE. .................................................. 41
Figure 14. Phosphorus placement and crop phase effects on canola AE. ..................................... 42
Figure 15. Phosphorus rate effects on wheat AE over 3 growth phases.. ..................................... 43
Figure 16. Wheat AE as influenced by soil type and crop phase. ................................................ 44
Figure 17. Effects of soil texture on the cumulative P uptake of three crop phases of canola-
wheat-canola (CWC) or wheat-canola-wheat (WCW). .................................................. 46
Figure 18. Cumulative P uptake efficiency for 3 phases of canola-wheat crop sequences as
affected by P source and soil.. ........................................................................................ 47

7
Figure 19. Residual soil P after harvesting wheat in the first phase. .......................................... 49
Figure 20. Cumulative emergence in a clay loam and sand soil over a 16-d study period. .......... 62
Figure 21. Effects of P source, rate, and soil on final seedling counts (out of 10 planted seeds)..64
Figure 22. Fitted Gompertz function on canola emergence as affected by P source, rate, SBU,
and soil type. ................................................................................................................... 68

8
EXECUTIVE SUMMARY
Background
The management of large volumes of hog manure on agricultural land is a critical challenge
due to its low N:P ratio and stringent regulations based on soil test phosphorus (P) levels. One
potential option to reduce the concentrations of P in hog manure is the recovery, prior to land
application, of manure P as struvite, a highly concentrated and readily transported product that
also contains the plant nutrients nitrogen (N) and magnesium (Mg). The recovered struvite has
low solubility or slow release properties, which may result in greater crop uptake of P compared
with conventional fertilizers. The slow-release properties of struvite may also allow seed-row
placement of P at higher rates than feasible with conventional fertilizers for salt sensitive crops.
Procedures
These pot experiments evaluated the effectiveness of struvite recovered from liquid hog
manure as a P source for canola grown in rotation with wheat. Two separate experiments were
conducted: (i) a greenhouse bioassay to evaluate the effectiveness of struvite on dry matter yield,
which is directly correlated with grain yield), P uptake from applied struvite, P uptake efficiency
(PUE, which is the percentage of applied P taken up by the crop), and agronomic P use
efficiency (AE, which is a measure of dry matter produced per unit P applied) of canola grown in
rotation with spring wheat, and (ii) a growth room experiment to assess canola seedling toxicity
following seed-row placement of struvite. Two low-P soils with contrasting texture [a dark grey
Gleyed Regosolic sand from a farm near Roseisle, Manitoba, and an Orthic Black Chernozemic
clay loam from a farm near Justice, Manitoba, were used in the study which compared struvite
with monoammonium phosphate (MAP) and polymer-coated MAP (CMAP, which is a

9
controlled-release form of MAP) at rates corresponding to 25 and 50 kg P2O5 ha-1
. The lower rate
approximates the maximum above which canola seed toxicity usually becomes a problem when
MAP is the P source.
In the greenhouse bioassay, two sequences of alternating crops of canola and spring wheat
(one crop sequence of canola-wheat-canola and the other of wheat-canola-wheat) were grown
and harvested at early flowering. The P sources were placed either with the seeds in a 2.5-cm
wide seed-row or in a 2.5-cm wide sideband 2.5 cm below and beside the seed-row. In the
growth chamber study, seedbed utilizations of 5.5% and 10.9% were also tested, but with P-
sources placed only in the seed-row. Seedlings were counted daily over a 14-day period to assess
toxicity effects.
Results
Canola Biomass Yield and Phosphorus Uptake
Results from the greenhouse bioassay indicated significant responses of canola dry matter
yield to all P sources relative to checks that did not receive P application, but only in the first
crop in the rotation. In both soils, struvite produced canola dry matter yields comparable to MAP
and CMAP in the first crop. By comparison, at the high P rate (50 kg P2O5 ha-1
), struvite out-
yielded MAP in the second crop and both MAP and CMAP in the third crop. However,
differences in yield between struvite and the MAPs at the low P rate were small. Across soils and
placement methods, doubling the rate of struvite and MAP from 25 kg P2O5 ha-1
to 50 kg P2O5
ha-1
improved canola dry matter yield, whereas CMAP rate did not have a significant effect on
the yield.
Seed-row placement produced significantly greater canola dry matter yield than side-
banding in the first crop, but there were no significant differences in subsequent crop phases.

10
Overall, canola dry matter yield significantly declined with subsequent phases regardless of P
source, indicating the progressive decrease in plant available P.
Over each entire crop cycle, plant uptake of applied P was similar for struvite, MAP and
CMAP regardless of soil, placement method or rate. In both soils, canola recovered more P at the
50 kg P2O5 ha-1
rate than at the 25 kg P2O5 ha-1
rate in the first phase, regardless of placement
method or P source. Overall, the higher P rate produced greater canola P uptake in the sand than
in the clay loam. There were no significant differences in canola P-uptake between seed-row
placement and side-banding regardless of P source.
In the first crop after applying P, canola recovered 46% of P applied to the sand compared to
40% recovery of P applied to the clay loam. Similar amounts of P were recovered from
equivalent rates of the three P sources in both soils. On average, canola recovered a greater
percentage of P applied at the lower (25 kg P2O5 ha-1
) rate (47%) compared with the 50 kg P2O5
ha-1
rate (39%) in the first crop.
Wheat Biomass Yield and Phosphorus Uptake
Wheat dry matter yield was generally similar for struvite, MAP, and CMAP, regardless of
soil type, placement method, P rate, or crop phase. On average, wheat dry matter yield was 13%
greater at the 50 kg P2O5 ha-1
rate (1.7 g dry matter kg-1
soil) than at the 25 kg P2O5 ha-1
rate (1.5
g dry matter kg-1
soil). Overall, wheat dry matter yield did not vary significantly from one phase
to another in the clay loam, but declined from the first to the second phase in the sand.
In the first crop after P application, wheat recovered less P, averaged across rates, soils, and
placement methods, from struvite (4.1 g mg-1
) than from MAP (5.1 g mg-1
) and CMAP (4.9 g
mg-1
). Phosphorus recovery from all P sources was significantly greater at the high P rate than at
the low rate in the first crop. Wheat recovered similar percentages of P (averaged across crop

11
phases, rates, soils, and placement methods) applied as struvite (8.9%), MAP (11.5%), and
CMAP (12.4%). Also, no significant differences in P recovery were observed between P rates in
either soil.
In the clay loam, more P (averaged over P rates and P sources) was recovered by the wheat-
canola-wheat sequence (12.6 mg P kg-1
) than by the canola-wheat-canola crop sequence (10.4
mg P kg-1
). This was reversed in the sand, in which the wheat-canola-wheat sequence recovered
more P (10.9 mg P kg-1
) than the canola-wheat-canola sequence (9.5 mg P kg-1
). Overall, 55% of
applied P was recovered (averaged across P-sources, placement methods, P rates, and soils) in
the canola-wheat-canola crop sequence compared with 38% in the wheat-canola-wheat sequence.
Seedling Toxicity
The higher rate of MAP reduced overall seedling emergence in the clay loam by over 50%.
By comparison, the slow release P sources, struvite and CMAP, showed no significant evidence
of seedling toxicity in either soil. The apparent toxicity of MAP is mainly due to its high
solubility, which tends to increase salt concentrations in the fertilizer band much more rapidly
than CMAP and struvite. Averaged across soils, SBUs, and rates, final emergence decreased in
the order: struvite (88%) > CMAP (86%) > MAP (69%), indicating the superiority of struvite
with respect to reducing toxicity.
Conclusions
Results from this study indicate great potential for hog manure-recovered struvite to be an
effective P-source for both canola and wheat. We found evidence of beneficial residual effects of
struvite in the second and third crop phases in which struvite produced greater canola dry matter
yields than MAP and CMAP. Thus, struvite may be a viable alternative to the widely used MAP

12
and can alleviate toxicity issues associated with seed-row placement while improving P use
efficiency in canola-wheat rotations. Importantly, this study demonstrates that struvite can be
safely applied at higher P rates than can be safely applied with MAP, an important value for
those farmers with P-deficient soils. In addition to the agronomic benefits, recovery of struvite
from hog manure could be a sustainable way of recycling P from livestock operations, which are
coming under increasing regulatory pressure due to environmental concerns (i.e., water quality
problems in streams and lakes).

13
BACKGROUND
There is increasing pressure on agricultural producers to adopt best management practices
(BMPs) to mitigate the increasing threat of eutrophication of surface water bodies (Beaulieu,
2004). Eutrophication is mainly attributed to phosphorus (P) from sediments deposited in runoff
from P-enriched agricultural soils receiving high rates of P fertilizers or manure (Daniel et al.,
1998; Sharpley et al., 2003a). This is a common problem for lakes such as Lake Winnipeg, MB,
which receive large amounts of runoff from agricultural fields. According to a survey by
Statistics Canada (2011), 98% of farms in Canada have some form of surface water on them
(seasonal wetlands, permanent wetlands or waterways), and most of these ultimately offload in
large lakes. The problem of agricultural pollution is aggravated by a lack of adequate
environmental management strategies on farms. More than 50% of farmers in Canada fail to
implement BMPs due to economic pressures (Statistics Canada, 2013).
Intensive hog production in western Canada generates large volumes of manure daily, with
annual production estimated at > 16 million metric tons (fresh wt.) as of 2006 (Hofmann, 2013).
Manitoba, which has the third largest hog population (2.8 million) of all Canadian provinces
(12.7 million total) as of January 2014 (Statistics Canada, 2014), accounts for about 20% of daily
manure output from hogs in Canada. Manure from hog operations is typically applied to
agricultural land as a source of nutrients for crops. In some jurisdictions, including Manitoba,
manure is often applied based on crop N needs. However, because the N:P ratios of hog manures
(2:1 - 4:1) are usually lower than crop uptake ratios (4:1 - 7:1) (Nelson and Janke, 2007), annual
applications of manure to meet crop N requirements can result in excessive soil test P (STP)
levels. The excess soil P from manure application limits the amount of hog manure that can be
applied on agricultural land without risking noncompliance with increasingly stringent

14
regulations. Finding suitable land proximal to hog operations can be a daunting task, particularly
where soils have received repeated applications of manure. This would necessitate transfer of
manure to and its application on low P agricultural lands. However, transportation of large
volumes of manure over long distances is economically unviable. There is, therefore, a need for
alternative, more viable manure management options.
A promising alternative is the recovery of manure P as struvite [magnesium ammonium
phosphate hexahydrate (MgNH4PO4∙6H2O)] prior to land application of manure. Since as early
as 1858, waste-recovered P has been proposed for crops (Barak and Stafford, 2006). These
proposals may have gone mostly unheeded in the agricultural sector due to the relative
abundance and affordability of conventional P fertilizers. However, recently there has been
increasing awareness on the potential benefits of using controlled- or slow-release fertilizers
(SRFs) to minimize environmental hazards and to improve and maintain nutrient use efficiency
(Shaviv and Mikkelsen, 1993).
The more gradual release of nutrients from struvite compared with conventional fertilizers
qualifies it as a SRF (Shaviv, 2001a; Shaviv and Mikkelsen, 1993; Shaviv et al., 2003; Trenkel,
1997). The higher N:P ratio of manure following recovery of struvite allows the processed
manure to be applied at rates that meet both N and P crop needs with minimal risk of excessive P
build-up in the receiving soil, while the recovered struvite can be more economically transported
for application on distant, low-P soils.
More than 75% of Canadian farmers rely on commercial fertilizers for profitable crop
production (Statistics Canada, 2012). Monoammonium phosphate is the most commonly used P
fertilizer on the Canadian prairies. In the 2011/2012 season, 2.9 million metric tonnes of MAP
were shipped to the Canadian market, with 77% of this going to the prairies (Statistics Canada,

15
2012). Uncertainty over future supplies of P fertilizers, compounded by speculation that global
phosphate rock deposits will be exhausted by 2050, is increasingly driving the search for
alternative sources of P (Jasinski, 2006), such as struvite. However, there is a dearth of
information on the agronomic performance of hog manure-derived struvite on high P-demand
crops such as canola, which is also sensitive to high rates of seed row-placed soluble P fertilizers.
Seed row-placement is the most efficient method for placing P fertilizers under prairie
conditions (Karamanos et al., 2002). However, despite the low salt toxicity index of MAP
relative to other fertilizers (Rader et al., 1943), high rates in contact with seeds pose a risk of
reduced germination and increased seedling mortality (Canola Council of Canada, 2011b; (Henry
et al., 1995). Consequently, recommended rates for seedrow-placed MAP (22-28 kg P2O5 ha-1
)
can only supply half the requirements of current high-yielding canola cultivars, which have a
high P requirement (40-50 kg P2O5 ha-1
) (Grant and Bailey, 1993). To accommodate high rates, P
fertilizers can be side-banded or broadcasted, but these placement methods require specialized
equipment or reduce P use efficiency, respectively, relative to seed-placement.
The physical form of a fertilizer, its nutrient composition, and width of the fertilizer/seed
band are critical factors influencing the safety (or toxicity) of fertilizers. Research has shown that
when placed close to the seed, high rates of most fertilizers cause seedling toxicity (Qian et al.,
2012). Moreover, liquid, powdery and fine textured fertilizers cause more damage than coarsely-
granulated fertilizers as they tend to dissolve faster and rapidly increase salt concentrations in the
band (Lombi et al., 2004). On the other hand, the width of fertilizer bands, the width of the row-
space, and soil properties can influence the extent of damage from seed-placed fertilizers. The
fraction of row width that is used by the fertilizer band [seedbed-utilization (SBU)] determines
the influence of fertilizer salts on the solute potential of the soil solution (Roberts and Harapiak,

16
1997). Wide-spaced rows with narrow bands cause the most seedling damage, especially in dry
soils.
Differences in fertilizer formulations and compositions cause some fertilizers to be less toxic
than others, even when applied at the same rate. To date, it has not been established how
different physical (powdery or granular) or chemical (purity and origin) forms and rates of
struvite affect developing seedlings when placed in the seedrow. Specifically, there is a dearth of
information on the agronomic performance of hog manure-derived ‘low-purity’ struvite on crops
such as canola and spring wheat, which have a high P requirement. The overall objective of this
study was, therefore, to evaluate the agronomic value of struvite recovered from liquid hog
manure in canola and wheat production in P-deficient calcareous soils. Specific objectives were
to compare the effects of differential rates of seedrow placed or side-banded struvite, MAP, and
controlled-release monoammonium phosphate (CMAP) on: (i) canola plant stand; (ii) canola and
wheat above-ground dry matter yield (DMY); and (iii) P use indices.

17
LITERATURE REVIEW
Pure struvite has a theoretical composition of 5.7% N, 12.6% P, and 9.9% Mg. Struvite can
precipitate out of solutions containing the right proportions of Mg2+
, PO4-, and NH4
+.
Tremendous progress has been made in the struvite precipitation technology, with successful
recovery of P (> 80% of reactive P) from dairy manure (Shen et al., 2010), human excreta (Gell
et al., 2011; Jaffer et al., 2002), and swine manure (Ackerman and Cicek, 2011; Beal et al., 1999;
Jordaan et al., 2010; Nelson et al., 2003; Quintana et al., 2005; Ryu and Lee, 2010). Due to its
low solubility (Aage et al., 1997; Barak and Stafford, 2006; Doyle and Parsons, 2002; Nelson et
al., 2003), hence slow-release nature, struvite could conceivably allow seed row placement of P
at higher rates than currently feasible with conventional fertilizers such as MAP, without causing
toxicity to canola seedlings.
The differences in physical and chemical form between struvite and MAP may be important
for the rate of P supply to crops. However, the amount of readily-soluble P is more important in
determining yields (Goh et al., 2013) . Goh et al. (2013) reported that short term differences in
physical form, P solubility and availability of two ammonium orthophosphates (6 - 24 - 6 and 9 -
18 - 9), ammonium polyphosphate (10 - 34 - 0), and MAP (11 - 52 - 0) did not influence long-
term solubility and P availability. Nonetheless, short term solubility is critical in determining
seedling toxicity (Lombi et al., 2004) as it influences the osmotic potential gradient around seeds
and developing seedlings.
Struvite has been shown to be an effective P fertilizer for corn (Barak and Stafford, 2006;
Gell et al., 2011). When compared with monocalcium phosphate, it gave similar ryegrass DMY
in sandy CLs with medium to high Olsen P concentrations (Johnston and Richards, 2003). In a
greenhouse experiment using Italian ryegrass and corn, DMY and P uptake from struvites

18
recovered from urine and manure equaled or exceeded those for Cederan phosphate fertilizer
(Antonini et al., 2012). Plaza et al. (2007) also reported that struvite recovered from an anaerobic
digester supernatant was as effective as single superphosphate at increasing DMY and supplying
P to ryegrass. Similarly, wastewater-derived struvites gave similar spring wheat DMY to triple
super phosphate fertilizer in slightly acidic (pH 6.5) and alkaline (pH 7.6) soils (Massey et al.,
2009).
The salt toxicity index for MAP (29.9%) is relatively low, making it safer than most
ammonium-based fertilizers (Rader et al., 1943). However, research has persistently shown that
there is a risk of seedling toxicity associated with seed-placed MAP (Nyborg, 1961; Roberts and
Harapiak, 1997). Some researchers suggest that the salt toxicity of MAP is less likely due to the
generation of free ammonia (Moody et al., 1995) because there is negligible evolution of
ammonia vapor from MAP (Allred and Ohlrogge, 1964). Hood and Ensminger (1964) concluded
that detrimental effects of MAP on germinating cotton and wheat seeds were due to interference
with enzymatic activity and not high levels of ammonium or phosphate ions. Monoammonium
phosphate has also been found to induce severe Ca deficiency in developing seedlings in acid
soils due to the precipitation of Ca in the fertilizer band (Moody et al., 1995), a mechanism
which is of little consequence in the calcareous soils of western Canada. However, the salt index
of struvite is unknown, and little is known about its safety or toxicity when applied at high rates
close to or with seeds.

19
CROP GROWTH AND PHOSPHORUS UPTAKE STUDIES
MATERIALS AND METHODS
Hog Manure Recovered Struvite
The air-dry, finely-ground struvite was precipitated from anaerobically digested hog manure
effluent with an optimal Mg:P ratio of 1.6:1 at pH 7.5 (Jordaan et al., 2010). For consistency of
P source application, reverse osmosis (RO) water was added to moisten the struvite, forming a
paste that was then dried and broken into uniform granules similar in size to MAP (11-52-0)
granules.
Soils
The two soils (0- to 15-cm layer) used in this greenhouse bioassay were a dark-grey Gleyed
Regosolic sand (Entisol) from Roseisle, MB (N 49o 33.577′; W 098
o 24.824′) and an Orthic
Black Chernozemic clay loam (CL) (Udic Boroll) from Justice (N 49o 58.590′; W 099
o 52.908′),
MB.
Laboratory Analyses
The hog manure-derived struvite was analyzed for total N using a Vario Max Elementar
combustion analyzer (Elementar Analysensysteme GmbH, Donaustrasse, Germany). Ammonium
N concentration was determined with a Timberline ammonium analyzer (Timberline
Instruments, Boulder, Colorado) following extraction with 10 mL of 2 M KCl solution per gram
of dry soil and 1 h shaking time (Mulvaney, 1996). Total P, K, Ca, and Mg in struvite extracts
were determined by inductively coupled plasma - optical emission spectrometry (ICP-OES) with
a Perkin Elmer 5400 (Perkin Elmer, Waltham, Massachusetts) following USEPA Method 3050B

20
nitric acid/hydrogen peroxide/HCl digestion. Struvite pH was determined in a 1: 1 struvite: water
suspension.
Plant available (Olsen) P was determined before initial planting and after each harvest using
the ascorbic acid-molybdate method (Murphy and Riley, 1962) with a Skalar SAN++ segmented
flow analyzer (Skalar Analytical B.V., Breda, Netherlands) following extraction with 0.5 M
NaHCO3 at a pH of 8.5 (Olsen et al., 1954). Nitrate N was determined by the Cd reduction
method following extraction of 1 g soil in 10 mL of a 0.01 M KCl solution. Calcium and Mg
were determined by ICP-OES (Perkin Elmer 5400, Perkin Elmer, Waltham, Massachusetts)
following extraction of 5 g of soil with 33 mL ammonium acetate at pH 7. Particle size analysis
was measured using the hydrometer method (Gee and Or, 2002). Electrical conductivity and pH
were measured in a 1:1 soil to water solution. Soil organic matter content was determined using
the loss on ignition method (Nelson and Sommers, 1996).
Total P in plant tissue was analyzed following digestion of 0.5 g of ground plant tissue with
10 mL concentrated HNO3 using a MARS 5 microwave system (CEM Corporation, Matthews,
NC). The temperature was ramped over 5 min from ambient to 175°C, at which it was held for
an additional 15 min. After cooling, the digest was diluted to 100 mL with deionized water and
analyzed with ICP - OES (Thermo iCAP 6300 Radial, Thermo Electron Corporation,
Cambridge, UK).
Experiment Setup
The greenhouse bioassay was laid out in a randomized complete block design with a
factorial combination of P source (struvite, MAP or CMAP), P rate (7.5 or 15 mg P kg-1
, which
correspond to 25 and 50 kg P2O5 ha-1
, respectively), placement method (seed row or sideband),
soil type (CL or sand), and three crop phases. Canola and wheat were alternately grown in two

21
sequences (one sequence of canola-wheat-canola and the other of wheat-canola-wheat) to
facilitate assessment of residual effects of fertilizer P. The canola-wheat rotation was chosen to
reflect common practice on canola farms in the Canadian prairies. Unfertilized soils (controls)
were included for comparison.
Soil Preparation and Planting
Field-moist soil was passed through a 4-mm sieve and thoroughly mixed before weighing 8
kg (dry wt.) into 12.5-L (23.5 cm L × 23.5 cm W × 23.5 cm H) plastic pots. Bulk densities after
fertilizer application and packing were approximately 1.3 g cm-3
for the sand and 0.9 g cm-3
for
the clay loam. Prior to seeding, all pots received 100-mL aliquots of a full-strength nutrient
solution from which P was omitted (Zvomuya et al., 2006). Reverse osmosis water was added to
bring soil moisture contents to 260 g kg-1
for the sand and 390 g kg-1
for the clay loam, which
correspond to 65% and 61% water-filled pore space (WFPS), respectively. The pots were
weighed and stored in the greenhouse for 24 h prior to planting.
Eight canola (cv. Invigor 5440) or 20 spring wheat (cv. A.C. Barrie) seeds were planted by
hand at the 2-cm depth in 2.5-cm wide rows across the middle of each pot. Canola seeds were ~
2.5 cm apart and wheat seeds were ~ 1.2 cm apart, giving target plant densities of 145 and 362
plants m-2
, respectively. Struvite (5.7-23-0.4), MAP (11-52-0) and CMAP (11-52-0) were
applied to the potted soils at rates of 7.5 or 15 mg P kg-1
soil, which correspond to 25 and 50 kg
P2O5 ha-1
, respectively. The 25 kg P2O5 ha-1
rate reflects the current recommended safe rate for
seed-placed P for canola (22-28 kg P2O5 ha-1
) whereas the 50 kg P2O5 ha-1
rate reflects the P
requirements for canola (Thomas, 2003). The fertilizers were placed either with the seed
(seedrow placement) or 2.5 cm beside and below the seedrow (side-banding) in 2.5-cm wide
bands across the center of each pot.

22
The weight of each pot after initial watering (to 65% WFPS for the sand and 61% WFPS for
the clay loam) was noted and used as the basis for subsequent watering events. Throughout the
study, the pots were weighed and watered with RO water at least once a week to replenish any
moisture lost through evapotranspiration.
Harvesting
Plants were harvested at early flowering (39–43 d after emergence, DAE), which
corresponded to BBCH stages 50 – 62 for canola (Lancashire et al., 1991) and Zadoks stages 39
– 57 for wheat (Zadoks et al., 1974). The plants were cut at approximately 2.5 cm above the soil
surface using clippers. Harvested above-ground biomass from each pot was weighed after drying
at 60oC for 48 h for dry mass determination. Dry samples were fine-ground (≤0.15 mm) prior to
laboratory analysis.
After harvest, the soil in each pot was thoroughly mixed and a sample (~20-g dry wt.) taken,
air-dried, and passed through a 2-mm sieve for laboratory analysis. Roots were chopped and
mixed with the remaining soil. After re-potting the soil, 50 mL of a 0.6 M CuSO4∙5H2O solution
were added to each pot and thoroughly mixed with the soil. This was done to achieve a rate of 5
mg Cu kg-1
because signs of Cu deficiency were observed in the first wheat crop. Pots were
reseeded with the alternate crop in the rotation. These procedures were repeated twice to give a
total of three crops of canola and wheat, with 14-d fallow periods allowed between successive
crops. After planting, soils were watered with a nutrient solution containing the remaining
nutrients, except for P, at 50% of the concentration added at the first planting. Reverse osmosis
water was added to correct the moisture content to the first crop levels.

23
Calculations
Phosphorus uptake (PU, mg P kg-1
) by plant shoots (aboveground biomass) in each pot was
calculated as:
concPU = DM × P [1]
where DM is the shoot dry matter yield (g kg-1
soil) and Pconc is the corresponding shoot P
concentration (mg g-1
).
Fertilizer P uptake efficiency (PUE, %) was calculated as the difference in P uptake between
fertilized (PUfert g P kg
-1) and non-fertilized (PU0, g P kg
-1) plants, expressed as a percentage of
fertilizer P applied (Papp, g kg-1
):
0fe
ap
t
p
rPU - PUPUE = × 00
P 1
[2]
Agronomic efficiency (AE, g DM g-1
P), which is the amount of biomass produced per unit
P applied, was calculated as:
fert 0
app
DM DMAE
P
[3]
where DMfert is the dry matter yield from fertilized pots and DM0 is the dry matter yield from the
control.
Cumulative PU was the total P uptake summed for all three crops in each of the two crop
sequences, canola-wheat-canola and wheat-canola-wheat.
1 2 3CumulativePU PU PU PU [4]
where PU1, PU2, and PU3 are the PU values for the first, second, and third crops, respectively. A
similar calculation was done for cumulative PUE.

24
Statistical Analyses
A repeated measures analysis of variance (ANOVA) was performed using the GLIMMIX
procedure of SAS (SAS, 2011). Consistent with the factorial plus control design, the ANOVA
was carried out in two steps: (i) comparison of fertilized treatments to the non-fertilized controls
and (ii) comparison of fertilized treatments excluding the controls (factorial component). Soil,
crop phase, P source, P rate, and placement method were fixed effects while block was the
random effect in the model and crop phase was the repeated variable. Treatment effects were
considered significant when P < 0.05. The Tukey-Kramer multiple comparison procedure was
used to compare treatment means. Another ANOVA was performed on the cumulative P uptake
and PUE, with crop sequence as a fixed effect in the model along with soil, P source, P rate, and
placement method while block was a random effect.
Results
Recovered Struvite Properties
Recovered struvite had a pH of 5.5 and contained 10% elemental P and 5.7% TN (Table 1).
X-ray diffraction analysis results performed previously indicated that all the Mg in the product
was in the form of struvite (Jordaan et al., 2010). Therefore, calculations based on the Mg
content suggested a maximum purity of approximately 65%, with a N:P:Mg ratio of 3.7:8.2:6.4
compared with 5.7:12.6:9.9 for pure struvite. About 81% of P in the recovered product was
therefore in the form of struvite, with the remaining 19% as calcium phosphates or organic
forms. The recovered struvite was in the form of a powder, and the hand-prepared granules were
soft and crumbled easily after wetting.

25
Table 1. Selected chemical properties of hog manure recovered struvite and commercial
fertilizers used in the greenhouse bioassay
†MAP is monoammonium phosphate (11-52-0) and CMAP is polymer-coated MAP
Soil Properties
Selected properties of the soils used in the bioassay are shown in Table 2. Bicarbonate-
extractable (Olsen) P concentrations of the clay loam (5.5 mg P kg-1
soil) and the sand (3.5 mg P
kg-1
) were in the deficient range for canola and wheat. The clay loam had higher CEC, OM
content, EC, field capacity moisture and, Ca and Mg contents.
Table 2. Selected chemical and physical properties of soils used in the experiments
Nutrient/Parameter Sand Clay loam
Nitrate (kg ha-1
) 5.9 26.5
Olsen P (mg kg-1
) 3.5 5.5
Mg (mg kg-1
) 192 907
Ca (mg kg-1
) 2348 3823
OM (%) 1.6 5.8
EC (S m-1
) 0.02 0.04
pH 7.95 7.6
CEC (cmolc kg−1
) 13.6 27.3
Field capacity moisture (kg kg-1
) 0.1 0.3
Analyte Struvite MAP CMAP
g kg-1
(air-dry basis)
Total N 57.7 110 110
Ammonium N 16 110 110
Total P (P2O5) 230 520 520
K2O 4.4 - -
Ca 5 - -
Mg 64 - -
pH 5.5 4.8 4.8
Moisture (%) 40 1.2 1.2

26
Dry Matter Yield
Canola
In the first crop after P application, there were significant DMY responses to P fertilization
in both soils (P < 0.001). In the second crop phase, all struvite treatments, seed-placed MAP and
CMAP at 15 mg P kg-1
, MAP side-banded at 15 mg P kg-1
, and CMAP side-banded at 7.5 mg P
kg-1
, produced significant responses in the clay loam. In the third crop, significant responses to
seed-placed and side-banded struvite and seed-placed MAP and CMAP were attained in the clay
loam at the 15 mg P kg-1
rate. In contrast, there were no significant canola DMY responses to P
application in the sand in crop phases 2 and 3.
Results from the factorial component of the ANOVA (excluding the controls) showed a
significant P source × crop phase interaction (P = 0.004) (Table 3). While canola DMY did not
differ significantly among P sources in the first crop phase, struvite significantly outperformed
MAP in the second phase and both MAP and CMAP in the third phase with respect to DMY
(Figure 1). Overall, DMY significantly declined with each subsequent phase for all P sources.
There was also a significant P source × rate interaction (P = 0.04) for canola DMY, averaged
across all phases (Table 3). At the high P rate, struvite produced significantly greater canola
DMY than MAP and CMAP, but there were no significant differences among the P sources at
the 7.5 mg P kg-1
rate (Figure 3). There were significant increases in canola DMY when struvite
and MAP were applied at the 15 mg P kg-1
rate compared with the 7.5 mg P kg-1
rate, but the rate
effect was not significant for CMAP.
The effect of P rate on canola DMY varied with soil and crop phase, as indicated by the
significant (P = 0.001) rate × soil × crop phase effect (Table 3). Averaged across P sources,
canola DMY in the third phase was significantly greater for the 15 mg P kg-1
rate than for the 7.5

27
mg P kg-1
rate in the clay loam (Fig. 3). By comparison, there were no significant differences
between P rates in the first and second phases in the clay loam, and in all phases in the sand.
1 2 30
1
2
3
ee
d
cbc
b
aaa
Struvite
CMAP
MAP
Control
Can
ola
yie
ld (
g D
M k
g-1
so
il)
Crop Phase
Figure 1. Canola dry matter yield as affected by P sources in the three crop phases. Columns
with the same letter are not significantly different according to the Tukey-Kramer mean
comparison procedure (P > 0.05). Error bars represent standard errors of the least squares
means.
Placement method effects varied significantly with crop phase (P = 0.001). In the first phase,
seedrow placement produced significantly greater DMY than side-banding, but no differences
were observed in the second and third phases.

28
7.5 15.00
1
2
3
Can
ola
yie
ld (
g D
M k
g-1
so
il)
P Rate (mg P kg-1
)
Struvite
CMAP
MAPControl
bbc
a
ccc
Figure 2. Effects of P source and rate on canola dry matter yield. Columns with the same letter
are not significantly different according to the Tukey-Kramer mean comparison procedure
(P > 0.05). Error bars represent standard errors of the least squares means.

29
Table 3. Canola and wheat dry matter yield (DMY), phosphorus uptake, and phosphorus
efficiency (PUE), and agronomic efficiency (AE) as affected by struvite, MAP and CMAP
application
Effect DMY P uptake PUE
AE
Canola Wheat Canola Wheat Canola Wheat Canola Wheat
g kg-1 mg kg-1 % g tissue mg-1 P
Crop Phase (C)
1 2.39 1.87 5.92 4.69 42.8 16.9 0.15 0.06
2 1.81 1.46 3.56 2.97 13.4 8.3 0.06 0.01
3 1.18 1.43 1.91 2.74 4.3 7.6 0.03 0.03
P source (P)
CMAP 1.72 1.59 3.66 3.61 19.7 12.4 0.07 0.03
MAP 1.76 1.62 3.77 3.55 20.0 11.5 0.08 0.04
Struvite 1.91 1.55 3.95 3.25 20.8 8.9 0.09 0.03
Rate (R)
7.5 1.65 1.50 3.26 3.16 21.8 11.5 0.09 0.03
15 1.94 1.67 4.33 3.78 18.6 10.3 0.07 0.03
Placement (Ap)
Seedrow 1.84 1.62 3.79 3.49 20.4 10.4 0.08 0.03
Sideband 1.75 1.56 3.80 3.45 20.0 11.4 0.08 0.03
Soil (S)
Clay loam 1.77 1.84 3.64 4.10 23.3 11.2 0.10 0.03
Sand 1.82 1.33 3.95 2.84 17.0 10.6 0.06 0.03
P-value
C < 0.001 < 0.001 < 0.001 < 0.001 < 0.001 < 0.001 < 0.001 < 0.001
P < 0.001 0.35 0.15 0.07 0.62 0.08 0.01 0.16
R < 0.001 < 0.001 < 0.001 < 0.001 0.002 0.33 < 0.001 0.62
Ap 0.01 0.15 0.87 0.74 0.72 0.40 0.19 0.61
S 0.12 < 0.001 0.01 < 0.001 < 0.001 0.66 < 0.001 0.29
P × C 0.004 0.61 0.38 0.01 0.25 0.17 0.003 0.96
Ap × C 0.001 0.13 0.81 0.73 0.65 0.46 0.001 0.22
R × C 0.03 0.86 < 0.001 0.02 0.001 0.54 < 0.001 0.049
S × C < 0.001 < 0.001 < 0.001 < 0.001 < 0.001 < 0.001 < 0.001 0.002
R × Ap 0.18 0.36 0.94 0.21 0.79 0.26 0.77 0.84
P × S 0.07 0.50 0.14 0.58 0.01 0.56 0.53 0.92
R × S 0.01 1.00 0.37 0.06 0.52 0.10 0.55 1.00
P × Ap 0.63 0.15 0.81 0.68 0.87 0.81 0.68 0.18
Ap × S 0.41 0.54 0.85 0.29 0.97 0.78 0.80 0.32
P × R 0.04 0.70 0.52 0.84 1.00 0.61 0.48 0.47
R × S × C 0.001 0.61 0.01 0.67 0.67 0.01 0.03 0.39
P × S × C 0.24 0.01 0.69 0.45 0.42 0.73 0.69 0.29
P × R × C 0.75 0.69 0.79 0.60 0.40 0.81 0.24 0.94
P × Ap × C 0.73 0.88 0.91 0.96 0.86 0.96 0.66 0.94
R × Ap × C 0.61 0.70 0.82 0.80 0.82 0.74 0.82 0.27
Ap × S × C 0.63 0.15 0.72 0.35 0.85 0.41 0.52 0.49
P × R × S 0.25 0.73 0.90 0.93 0.17 0.88 0.30 0.66
P × Ap × S 0.97 0.63 0.98 0.37 0.88 0.30 0.56 0.70

30
R × Ap × S 0.15 0.33 0.66 0.69 0.35 0.94 0.61 0.84
P × R × Ap 0.22 0.69 0.69 0.50 0.62 0.39 0.56 0.97
P × R × Ap × C 0.91 0.74 0.93 0.64 0.70 0.95 0.97 0.99
P × R × S × C 0.40 0.87 0.87 0.41 0.53 0.85 0.88 0.92
P × Ap × S × C 0.41 0.62 0.36 0.93 0.75 1.00 0.65 0.93
R × Ap × S × C 0.64 0.83 0.78 0.63 0.92 0.97 0.35 0.97
P × R × Ap × S 0.86 0.83 0.89 0.86 0.99 0.95 0.64 0.83
P × R × Ap × S × C 0.88 0.83 0.93 0.94 0.99 0.99 0.78 0.91
0
1
2
3
g
ef
cdbcbc
ab
Clay loam 7.5 mg P kg-1
15 mg P kg-1
Control
1 2 30
1
2
3
f efefde
ab
Can
ola
yie
ld (
g D
M k
g-1
so
il)
Crop Phase
aSand
Figure 3. Changes in canola biomass yield over three crop phases as affected by P application
rate. Columns with the same letter are not significantly different according to the Tukey-
Kramer mean comparison procedure (P > 0.05). Error bars represent standard errors of the
least squares means.

31
1 2 30
1
2
3
a
b
c c
d d
Control
Seedrow
Sideband
Can
ola
yie
ld (
g D
M k
g-1
so
il)
Crop Phase
Figure 4. Effects of P placement on canola DMY over 3 crop phases. Columns with the same
letter are not significantly different according to the Tukey-Kramer mean comparison
procedure (P > 0.05). Error bars represent standard errors of the least squares means.
Wheat
In the first crop phase, the only significant wheat DMY response to P application was in the
sand when MAP was applied in the seedrow at the 7.5 mg P kg-1
rate (2.3 vs 1.2 g kg-1
for the
control). In all phases, there were no significant responses to any of the treatments in the clay
loam.
Wheat DMY significantly varied with rate (Table 3). The 15 mg P kg-1
rate produced
significantly greater wheat DMY (1.7 g kg-1
) than the 7.5 mg P kg-1
rate (1.5 g kg-1
), regardless
of P source, placement, soil type, or crop phase. The effect of P source on DMY varied with soil
and crop phase, as indicated by the significant soil × P source × crop phase interaction. In the
sand, wheat DMY significantly decreased from Phase 1 to Phase 2, with no further significant

32
decrease in Phase 3 (Figure 5). In contrast, no significant decrease in DMY was observed for any
P source in the clay loam. In both soils, wheat DMY did not vary significantly among P sources
in all phases.
0
1
2
3Control Struvite CMAP MAP
aaaa
aaaa
ab
Wh
eat
yie
ld (
g D
M k
g-1
so
il)
Clay loam
1 2 30
1
2a a
a
cbc
c c c c
Crop Phase
Sand
Figure 5. Wheat DMY as affected by P source and soil over 3 growth phases. Columns with the
same letter are not significantly different according to the Tukey-Kramer mean comparison
procedure (P > 0.05). Error bars represent standard errors of the least squares means.
Phosphorus Uptake
Canola
In the first phase, P uptake was significantly greater in P-fertilized soils than in the control.
However, there were no further responses in P uptake to P application in the second and third

33
crop phases. Analysis of variance of data excluding the controls showed a significant rate × soil
× phase interaction on P uptake by canola (Table 3). Phosphorus uptake was greater at the 15 mg
P kg-1
rate than at the 7.5 mg P kg-1
rate in the first phase in both soils. However, no significant
differences were observed in subsequent phases (Figure 6). Also, no significant differences were
observed among the P sources or between placement methods in both soils regardless of crop
phase. Phosphorus uptake, averaged across P sources and placement methods, generally declined
with subsequent canola phases at both rates, except for the 15 mg P kg-1
rate in the sand, which
showed no decrease after the second phase.
0
2
4
6
8
Control
7.5 mg P kg-1
15 mg P kg-1
Clay loam
ghh
cddef
b
c
1 2 30
2
4
6
8
gh
c
Can
ola
P U
pta
ke
(mg
P k
g-1
)
Crop Phase
a
de effg
Sand
Figure 6. Effects of P rate and soil on canola P uptake over three crop phases. Columns with the
same letter are not significantly different according to the Tukey-Kramer mean comparison
procedure (P > 0.05). Error bars represent standard errors of the least squares means.

34
Wheat
In the first crop after P application, there was a significant increase in P uptake by wheat to
MAP application at 15 mg P kg-1
in the sand (5.9 vs 1.8 g mg-1
for the control). However, no
significant responses were observed for CMAP and struvite in this phase. Also, none of the
treatments significantly increased wheat P uptake relative to the controls in the clay loam.
There were significant P source effects on wheat P uptake, which varied with phase, as
indicated by the significant (P = 0.01) source × phase interaction (Table 3). In the first phase, P
uptake by wheat was significantly lower with struvite (4.1 g mg-1
) application than with MAP
(5.1 g mg-1
) or CMAP (4.9 g mg-1
) (Figure 7a). By comparison, P source differences were not
significant in the second and third phases (Figure 7a).
There was a significant rate × phase interaction (P = 0.02) for P uptake (Table 3). In the first
phase, P uptake from all P sources was significantly greater at the 15 mg P kg-1
rate than at the
7.5 mg P kg-1
rate (Figure 7b). There were no significant differences between the soils in all
phases (Figure 7c). Wheat P uptake significantly declined in the second phase relative to the first
phase, but there was no significant decline in the uptake in the third phase (Figure 7).

35
a
c bca
cbc
a
c bca
cbc
0
1
2
3
4
5
(c)
(b)
cccccc
a a
b
Control Struvite
CMAP
MAP
(a)
0
1
2
3
4
5
cc
c
Wheat
P U
pta
ke (
mg P
kg
-1 7.5 mg P kg
-1
15 mg P kg-1
a
b
c
1 2 30
1
2
3
4
5
Crop Phase
Clay loam
Sand
Figure 7. Effects of; (a) P source, (b) P rate, and (c) soil type on wheat P uptake over 3 growth
phases. Columns with the same letter are not significantly different according to the Tukey-
Kramer mean comparison procedure (P > 0.05). Error bars represent standard errors of the
least squares means.
Phosphorus Use Efficiency Indices
Canola Phosphorus Uptake Efficiency
There was a significant P source × soil interaction (P = 0.01) for PUE averaged across
phases. Struvite and CMAP produced significantly greater PUE in the clay loam than in the sand

36
(Figure 8). However, within each soil, the PUE was not significantly different among the P
sources and ranged between 21% and 26% in the clay loam and 16% and 19% in the sand.
Clay loam Sand0
5
10
15
20
25
30
abc
Can
ola
PU
E (
%)
Struvite
CMAP
MAP
a
ab
bcdcd
d
Figure 8. Phosphorus uptake efficiency of canola as affected by P source and soil type. Columns
with the same letter are not significantly different according to the Tukey-Kramer mean
comparison procedure (P > 0.05). Error bars represent standard errors of the least squares
means.
There was also a significant rate × phase interaction (P = 0.001) (Table 3). In the first phase,
the PUE, averaged across P sources, soils and placement methods, was significantly greater at
the 7.5 mg P kg-1
rate (47%) than at the 15 mg P kg-1
rate (39%) (Figure 9). By comparison, no
significant differences were detected between the rates in the second (mean PUE = 14%) and
third (4%) phases.

37
1 2 30
10
20
30
40
50
60
Can
ola
PU
E (
%)
Crop Phase
7.5 mg P kg-1
15 mg P kg-1
a
b
c
cd
edd
Figure 9. Phosphorus uptake efficiency of canola as affected by P rate and crop phase. Columns
with the same letter are not significantly different according to the Tukey-Kramer mean
comparison procedure (P > 0.05). Error bars represent standard errors of the least squares
means.
There was a significant soil × phase effect (P < 0.001) for PUE (Table 3). The PUE of
canola was significantly greater in the sand (46%) than in the clay loam (40%) in the first phase
(Figure 10). In contrast, the opposite was observed in subsequent phases, with significantly
greater PUE in the clay loam than in the sand (19% for the clay loam vs. 8% for the sand in
Phase 2 and 12% vs. -3% for Phase 3).

38
1 2 3-10
0
10
20
30
40
50
Can
ola
PU
E (
%)
Crop Phase
Clay loam
Sanda
b
c
dd
e
Figure 10. Phosphorus uptake efficiency of canola as affected by soil and crop phase. Columns
with the same letter are not significantly different according to the Tukey-Kramer mean
comparison procedure (P > 0.05). Error bars represent standard errors of the least squares
means.
Wheat Phosphorus Uptake Efficiency
There was a significant rate × soil × phase interaction (P = 0.01) for PUE of wheat (Table 3).
In the first phase, the PUE at the 7.5 mg kg -1
rate was significantly greater in the sand (27%)
than in the clay loam (9%) (Figure 11). By comparison, in the third phase, the PUE at the same
rate was significantly lower in the sand (-6%) than in the clay loam (20%). Phosphorus uptake
efficiency at both rates significantly declined from the first to the second phase in the sand, with
no significant changes thereafter. However, at both rates, PUE in the clay loam did not vary

39
significantly among phases. In both soils, PUE was not significantly different among the P
sources, in all crop phases.
Figure 11. Wheat PUE as affected by soil, P rate, and crop phase. Columns with the same letter
are not significantly different according to the Tukey-Kramer mean comparison procedure
(P > 0.05). Error bars represent standard errors of the least squares means.
Canola Agronomic Phosphorus Use Efficiency
Phosphorus source effects on canola AE were significant but varied with phase, as indicated
by the significant P source × phase interaction (P = 0.003) (Table 3). No significant differences
were detected between struvite and MAP or CMAP in all three phases (Figure 12). For all P

40
sources, AE significantly decreased from phase 1 to phase 2. However, only struvite and CMAP
produced subsequently lower AE in the third phase, with no significant change in AE for MAP.
There was a significant rate × soil × phase interaction (P = 0.03) (Table 3). In the clay loam, AE
was significantly greater at the 7.5 mg P kg-1
rate than at the 15 mg P kg-1
rate in the first and
second phases. In contrast, the 15 mg P kg-1
rate produced significantly greater AE than the 7.5
mg P kg-1
rate in the third phase. For the sand, the 7.5 mg P kg-1
rate produced significantly
greater AE than at the 15 mg P kg-1
rate in the first phase, with no significant differences
between the rates in subsequent phases (Figure 13).
1 2 30.00
0.04
0.08
0.12
0.16
Can
ola
AE
(g t
issu
e m
g-1
P)
Crop Phase
Struvite
CMAP
MAP
aaa
b
bcbcd
cde
ede
Figure 12. Phosphorus source and crop phase effects on canola AE. Columns with the same letter
are not significantly different according to the Tukey-Kramer mean comparison procedure
(P > 0.05). Error bars represent standard errors of the least squares means.

41
0.0
0.1
0.2
7.5 mg P kg-1
15 mg P kg-1
a
bbc
ccd
de
Clay loam
1 2 3
0.0
0.1
0.2
Can
ola
AE
(g
DM
mg
-1 P
)
Crop Phase
a
b
ef efg
fgg
Sand
Figure 13. Effects of P rate, soil, and crop phase on canola AE. Columns with the same letter are
not significantly different according to the Tukey-Kramer mean comparison procedure (P >
0.05). Error bars represent standard errors of the least squares means.
There was also a significant placement × phase interaction (P = 0.001) for AE (Table 3).
Seed-row placement produced significantly greater AE than side-banding in the first phase
(Figure 14). However, there were no significant differences between the placement methods in
the second and third phases. For both placement methods, AE decreased significantly with
subsequent phases.

42
Figure 14. Phosphorus placement and crop phase effects on canola AE. Columns with the same
letter are not significantly different according to the Tukey-Kramer mean comparison
procedure (P > 0.05). Error bars represent standard errors of the least squares means.
Wheat Agronomic Phosphorus Use Efficiency
There was a significant rate × phase effect on wheat AE (P = 0.049) (Table 3). The 7.5 mg P
kg-1
rate produced significantly greater AE (0.07 g DM mg-1
P) than the 15 mg P kg-1
rate (0.05 g
DM mg-1
P) in the first phase, but there were no significant differences between rates in
subsequent phases, which produced significantly lower AE values (0.004–0.03 g DM mg-1
P)
than the first phase (Figure 15).
1 2 30.00
0.04
0.08
0.12
0.16C
ano
la A
E (
g D
M m
g-1
P)
Crop Phase
Seedrow
Sidebanda
b
cc
d d

43
Figure 15. Phosphorus rate effects on wheat AE over 3 growth phases. Columns with the same
letter are not significantly different according to the Tukey-Kramer mean comparison
procedure (P > 0.05). Error bars represent standard errors of the least squares means.
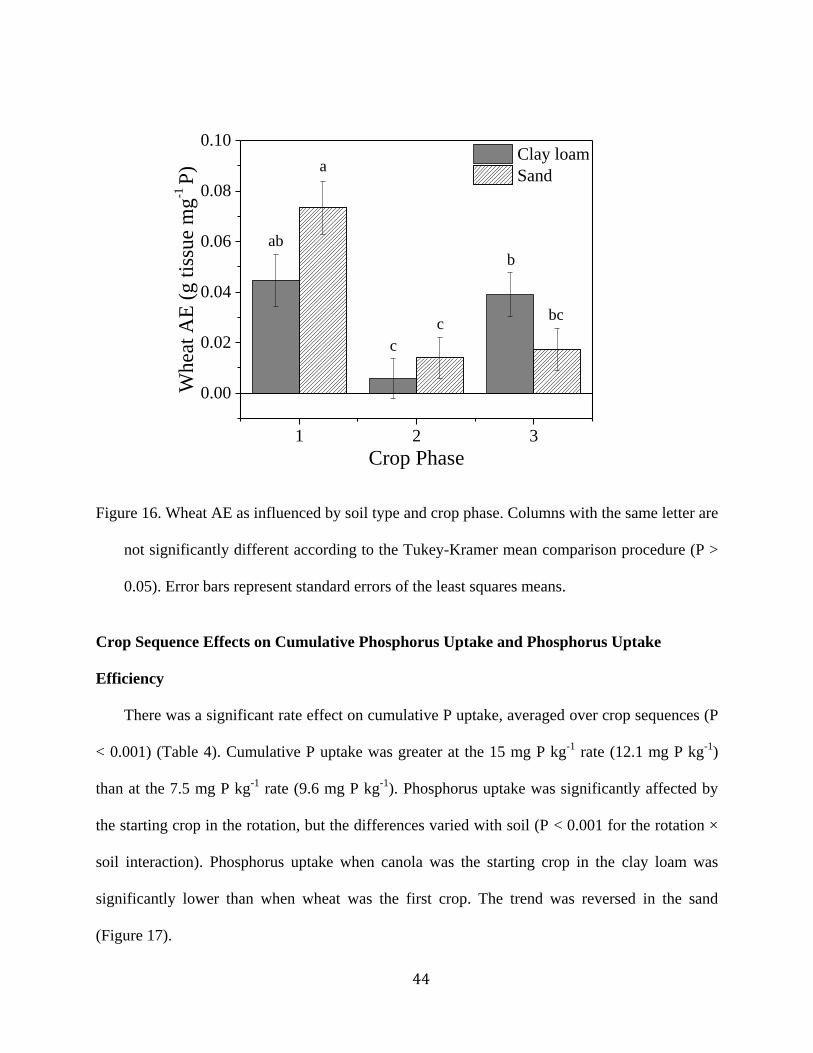
There was also a significant soil × phase interaction (P = 0.002), although mean comparison
did not indicate any significant differences between the soils in all phases (Figure 16). In both
soils, AE was significantly lower in phase 2 than in phase 1. However, AE in the clay loam was
significantly greater in phase 3 than in phase 2, but no significant difference between the two
phases was observed in the sand.
44
ab
c
b
a
cbc
1 2 3
0.00
0.02
0.04
0.06
0.08
0.10
Wh
eat
AE
(g
tis
sue
mg
-1 P
)
Crop Phase
Clay loam
Sand
Figure 16. Wheat AE as influenced by soil type and crop phase. Columns with the same letter are
not significantly different according to the Tukey-Kramer mean comparison procedure (P >
0.05). Error bars represent standard errors of the least squares means.
Crop Sequence Effects on Cumulative Phosphorus Uptake and Phosphorus Uptake
Efficiency
There was a significant rate effect on cumulative P uptake, averaged over crop sequences (P
< 0.001) (Table 4). Cumulative P uptake was greater at the 15 mg P kg-1
rate (12.1 mg P kg-1
)
than at the 7.5 mg P kg-1
rate (9.6 mg P kg-1
). Phosphorus uptake was significantly affected by
the starting crop in the rotation, but the differences varied with soil (P < 0.001 for the rotation ×
soil interaction). Phosphorus uptake when canola was the starting crop in the clay loam was
significantly lower than when wheat was the first crop. The trend was reversed in the sand
(Figure 17).

45
Table 4. Cumulative P uptake (PU) and P uptake efficiency (PUE) as affected by crop sequence,
P source, P rate, application method and soil.
Effect Cumulative PU Cumulative PUE
mg P kg-1
%
Crop sequence (Cs)
canola-wheat-canola 10.68 54.48
wheat-canola-wheat 11.02 37.91
P source (P)
CMAP 10.90 46.93
MAP 10.88 47.10
Struvite 10.78 44.56
Rate (R)
7.5 9.63 49.76
15 12.08 42.63
Application method (Ap)
Seed-row 10.94 45.88
Sideband 10.77 46.51
Soil (S)
Clay loam 11.50 51.07
Sand 10.20 41.32
P-value
P 0.92 0.58
Ap 0.51 0.78
Cs 0.19 < 0.001
R < 0.001 0.002
S < 0.001 < 0.001
P × Ap 0.97 0.96
P × R 0.88 0.51
P × S 0.06 0.02
Ap × S 0.21 0.86
Cs × P 0.65 0.92
Cs × Ap 0.58 0.91
Cs × R 0.16 0.70
Cs × S < 0.001 0.22
R × Ap 0.12 0.30
R × S 0.15 0.30
P × Ap × S 0.71 0.85
P × R × Ap 0.72 0.44
P × R × S 0.85 0.63
Cs × P × Ap 0.64 0.70
Cs × P × R 0.54 0.47
Cs × P × S 0.99 0.96
Cs × Ap × S 0.60 0.22

46
Cs × R × Ap 0.59 0.99
Cs × R × S 0.18 0.45
R × Ap × S 0.37 0.71
P × R × Ap × S 0.42 0.60
Cs × P × Ap × S 0.24 0.13
Cs × P × R × Ap 0.23 0.21
Cs × P × R × S 0.25 0.18
Cs × R × Ap × S 0.62 0.65
Cs × P × R × Ap × S 0.63 0.98
Figure 17. Effects of soil texture on the cumulative P uptake of three crop phases of canola-
wheat-canola (CWC) or wheat-canola-wheat (WCW). Columns with the same letter are not
significantly different according to the Tukey-Kramer mean comparison procedure (P >
0.05). Error bars represent standard errors of the least squares means.

47
Figure 18. Cumulative P uptake efficiency for 3 phases of canola-wheat crop sequences as
affected by P source and soil. Columns with the same letter are not significantly different
according to the Tukey-Kramer mean comparison procedure (P > 0.05). Error bars represent
standard errors of the least squares means.
Overall, PUE was significantly greater for the canola-wheat-canola crop sequence (overall
PUE = 55%) than for the wheat-canola-wheat sequence (overall PUE = 38%) (Table 4). Struvite
produced greater PUE at the 7.5 mg P kg-1
rate (35%) than at the 15 mg P kg-1
rate (54%), but
there were no significant P rate effects for MAP and CMAP (Figure 18).

48
Bicarbonate-Extractable Phosphorus
In the clay loam, soil test (Olsen) P concentrations after harvesting (residual P) the first
canola crop were significantly greater than the control (4.7 mg kg-1
) only when the 15 mg P kg-1
of MAP was applied regardless of placement method (7.3 mg kg-1
), and when the 15 mg P kg-1
of struvite was side-banded (7.1 mg kg-1
). Soil test P concentrations in all other treatments were
not significantly different from the control. In the sand, only the 15 mg P kg-1
rate of MAP gave
significantly greater residual P after the first (4.9 mg kg-1
vs. 2.7 for the control) and second (3.8
mg kg-1
vs. 1.9 mg kg-1
) phases of canola. No treatment significantly increased residual P after
the third phase relative to the control.
After wheat harvest in the first phase, only the 15 mg P kg-1
rate of struvite produced
significantly greater residual P (9.5 mg kg-1
) than the control (4.8 mg kg-1
) in the clay loam. No
significant differences were observed in the clay loam between P-fertilized soils and the controls
in the second (3.0 mg kg-1
) and third phases (2.4 mg kg-1
). Compared to the sand control in the
first phase (1.9 mg kg-1
), only the 15 mg P kg-1
rate of MAP (regardless of placement) (5.3 mg
kg-1
) and the seed-placed 15 mg P kg-1
rate of struvite (5.9 mg kg-1
) produced significant
increases in residual P. However, no treatments were significantly different from the controls in
the second (2.1 mg kg-1
) and third (1.7 mg kg-1
) phases.
Discussion
In spite of its low purity, the recovered struvite used in this study showed an overall
agronomic performance that equaled or exceeded that of MAP and CMAP for canola production.
For example, DMY, P uptake and PUE observed for canola in the first phase did not differ
significantly among sources. The same comparable competitiveness of struvite was observed in

49
both soils for wheat DMY, PUE, and AE in all phases. Although wheat P uptake from struvite
was significantly lower than MAP and CMAP in the first phase, DMY was not significantly
lowered. This was reflected by the similar AEs from the P sources, indicating that the differences
between the amounts of P taken up were not large enough to translate into significantly lower
yields. Moreover, in the clay loam, struvite produced greater canola DMY than MAP and both
MAP and CMAP in the second and third phases, respectively. This indicates the ability of
struvite to effectively supply P for longer durations than MAP and CMAP in this soil.
Figure 19. Residual soil P after harvesting wheat in the first phase. Columns with the same letter
are not significantly different according to the Tukey-Kramer mean comparison procedure
(P > 0.05). Error bars represent standard errors of least squares means.

50
The P forms (struvite-P, Ca-P, and organic-P) in the recovered struvite have low solubilities,
giving the product its slow-release properties. More than 80% of P in the recovered struvite was
in the MgNH4PO4∙6H2O (struvite) form, which therefore largely determined the availability of P
from the recovered stuvite. In pure water, the solubility of pure struvite at 25oC is in the range
160–200 mg L-1
(Aage et al., 1997; Barak and Stafford, 2006; Bhuiyan et al., 2007). The
solubility decreases with increasing pH and decreasing temperature. Therefore, given the
alkaline pHs of the clay loam (pH 7.6) and the sand (pH 7.95), and the temperature range (19-
26oC) of this study, P release from struvite in the soil solution was generally expected to be very
low (Barak and Stafford, 2006). The P in calcium phosphates and organic P forms (20%) was
also potentially slowly available due to low solubility and high dependence on mineralization
rates, respectively (Sharpley et al., 2003). Despite these factors, PUE of struvite was similar to
that of MAP and CMAP for canola.
The long-term (that is, beyond the initial crop after P application) superiority of recovered
struvite may be explained by the reduced exposure of P to soil fixing processes when it is
gradually released. Release from MAP is very rapid, as indicated by its 85% water-solubility and
100% citrate-solubility (Chien et al., 2011). This is particularly important in a relatively high P-
fixing soil such as the clam loam used in this study. Rapidly released P is quickly precipitated
into forms that are not readily available (Ige et al., 2005). The greater uptake of P from struvite
by canola, relative to wheat, may be due to the greater ability of canola to take up P (Föhse et al.,
1991). This greater PUE of canola may have offset the low P release from struvite, leading to
comparable P uptake for canola in the first phase.
The similar performance of struvite and the MAP fertilizers in the first canola crop after P
application corroborates findings from numerous other studies which demonstrated various

51
recovered struvite products to be of similar effectiveness to commercial P fertilizers for yields of
corn (Barak and Stafford, 2006; Gell et al., 2011), ryegrass (Antonini et al., 2012; Johnston and
Richards, 2003; Plaza et al., 2007), and spring wheat (Massey et al., 2009). In contrast,
Ackerman et al. (2013) reported lower canola DMY and P uptake for hog manure recovered
struvite compared with MAP and CMAP. However, unlike the P-deficient soils used in the
present study, Ackerman et al. (2013) used a sandy loam of medium STP concentration (12 mg
Olsen P kg-1
), which may explain the difference in results between their and the present study. It
is likely that P-release from recovered struvite was more rapid in our P-deficient soils. The
solubility of struvite depends on the speciation and concentrations of its ionic components (Mg2+
,
NH4+, and PO4
3-)
in the soil solution (Bhuiyan et al., 2007). As soil STP increases, the PO4
3-
activity is expected to increase, further slowing down the dissolution of, hence release of P from,
struvite.
Wheat showed no response to P application in all phases and produced high yields in the
clay loam in the second and third crops. Not all wheat varieties respond to P application in most
soils, regardless of STP (Korkmaz et al., 2009). In a P-deficient soil (8 mg Olsen P kg-1
), 10 out
of the 15 wheat genotypes tested showed little or no response to 52 kg P ha-1
, which was
broadcast and incorporated (Yaseen and Malhi, 2009). It is, therefore, highly likely that in these
P-deficient soils, wheat acquired most of its P requirement from native soil P through
mycorrhizal symbiosis without a need for additional fertilizer P. Canola has been reported to
increase phosphatase activity and the abundance and diversity of P solubilizing soil microbes in
the rhizosphere (Solaiman et al., 2007). This may have enhanced P supply for subsequent wheat
crops, leading to the consistently high wheat yields in all phases.

52
Increasing P application rate from 7.5 to 15 mg P kg-1
significantly increased P uptake by
both crops but did not significantly increase DMY and residual STP levels. However, the higher
P rate produced greater tissue P concentrations at flowering (data not presented), which were
within the recommended range (2.5 -5 g P kg-1
), whereas plants receiving the lower P rate had P
concentrations indicating P deficiency (Grant and Bailey, 1993). Studies have shown that in soils
with adequate P supply, sufficient P would have accumulated in canola tissue by early flowering
(Malhi et al., 2006; Rose et al., 2008). The suboptimal P levels in canola tissue observed at the
lower rate indicate that the 7.5 mg P kg-1
rate may not supply sufficient P throughout canola
growth, although the observed early flowering biomass was similar to that for the 15 mg P kg-1
rate.
Seedrow placement of high rates of P fertilizers is known to pose greater risks of seedling
injury than side-banding (Hocking et al., 2003; Nyborg, 1961), although it is the most efficient
method of P application (Grant and Bailey, 1993). In this study, there was a significant reduction
in seedling counts with seed-placed fertilizers (82% emergence) compared to side-banding (97%
emergence) at the 15 mg kg-1
rate in the sand soil in the first phase (results not shown). Toxicity
from seed-placed fertilizers is common under semi-arid conditions such as those in much of the
Canadian prairies where precipitation is highly variable and moisture stress can aggravate
seedling toxicity. In this study, soil moisture was maintained at close to optimal levels (61 – 65%
WFPS), a scenario not very common in reality, which may explain the absence of significant
injury from seed-placed fertilizers at the 7.5 mg P kg-1
rate in both soils and at the 15 mg P kg-1
rate in the clay loam.
The lack of a placement effect in the second and third phases was mainly due to the mixing
of the soil prior to planting in these phases. Despite the observed reduction in canola seedling

53
counts for the first phase in the sand with seed-placement (82%) relative to side-banding (97%),
overall, DMY in this study did not appear to have been adversely affected by toxicity due to
seed-row placement (Figure 4). In fact, canola DMY and AE in the first phase were significantly
greater for seedrow placement than for side-banding. This is because canola biomass can
compensate for low plant stands, while seed-placement improves accessibility of P during early
seedling development (Grant and Bailey, 1993). Hocking et al. (2003) reported up to 40%
reduction in canola DMY at flowering when P was applied at 26 kg P ha-1
, but the plants had
recovered by physiological maturity.
The responses to P fertilization and treatment effects in the two contrasting soils were
generally similar. However, the PUE of both canola and spring wheat in the first phase were
significantly greater in the sand than in the clay loam. Based on baseline soil properties (Error!
Reference source not found.), there may be greater short-term availability of P in the sand due
to relatively lower P retention capacity compared with the clay loam. The CEC, clay content,
OM concentration, and water holding capacity of a soil are important in influencing higher
nutrient and moisture retention, important characteristics which influence spatial and temporal
availability of immobile nutrients such as P. In alkaline Manitoba soils, soil clay content and Ca
and Mg concentrations greatly influence P retention (Ige et al., 2005). High Ca and Mg
concentrations indicate a high potential to precipitate P out of solution, making it less available
for plant uptake. However, P availability has been linked to the long term release of P from
precipitated phosphates that are formed when fertilizer P is fixed (Goh et al., 2013). Therefore,
despite the high P-fixing potential of the clay loam, DMY and P-uptake in the two contrasting
soils varied little among P sources.

54
Phosphorus uptake from the canola-wheat-canola crop sequence was nearly 20% greater
than that from the wheat-canola-wheat sequence. Our results show that the PUE of canola (43%)
was more than double that for wheat (17%) in the first crop after P application. This indicates the
greater ability of canola to take up fertilizer P compared to wheat. Our results corroborate those
from previous studies, which showed that canola required 50% less P than wheat because of its
higher PUE (Bolland, 1997; Brennan and Bolland, 2001). Unlike wheat, canola does not form
mycorrhizal symbiotic relationships or cluster roots (Shane and Lambers, 2005) to enhance P
uptake from soil reserves. However, it has an efficient root-hair system and can exude
carboxylates to acidify the rhizosphere (Pearse et al., 2006; Richardson et al., 2011), thereby
enhancing its ability to take up available P. Thus, despite its high P demand relative to wheat,
canola is more efficient in acquiring and utilizing fertilizer P to give higher DMY at low
available P concentrations (Brennan and Bolland, 2009).
The hog manure recovered struvite (6-23-0.4) used in this study contained about half as
much P and N as MAP and CMAP (11-52-0), consequently, twice as much struvite as MAP or
CMAP was required to achieve the same P rate. The lower nutrient composition of struvite
implies that higher transportation and application costs are likely to be incurred with struvite use
than with MAP or CMAP. This however, would be of little consequence if the struvite is being
sourced proximal to the land where the crop is being grown.
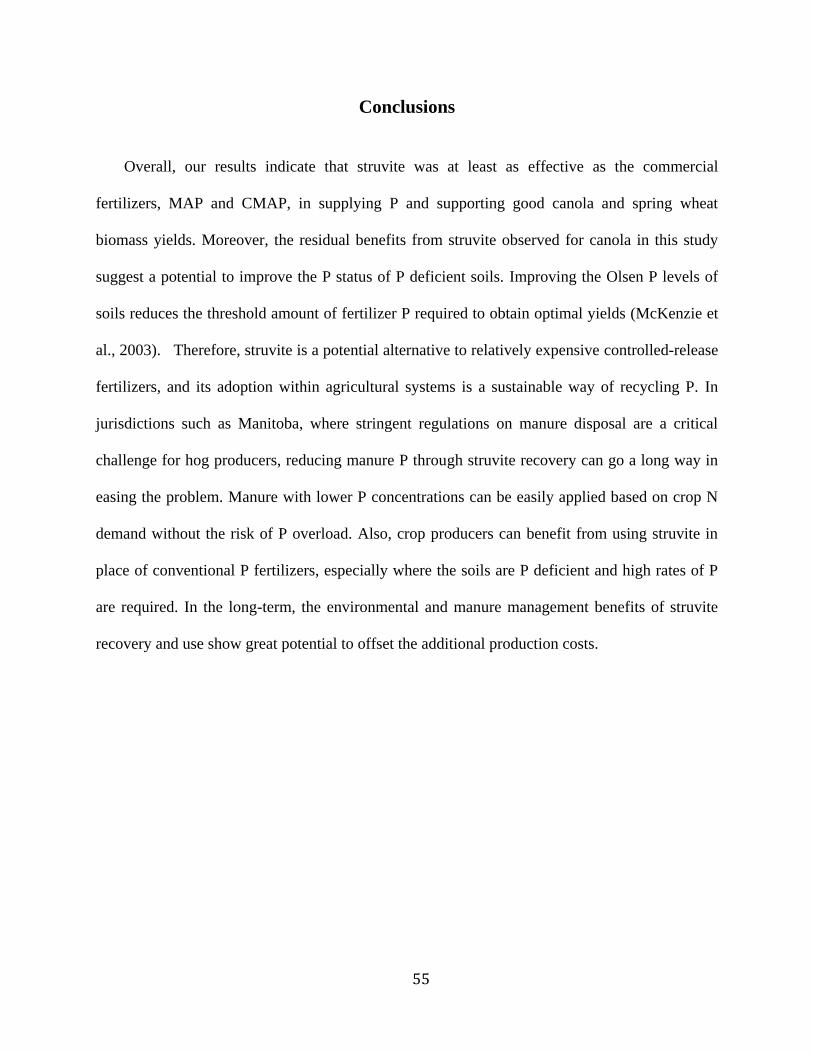
55
Conclusions
Overall, our results indicate that struvite was at least as effective as the commercial
fertilizers, MAP and CMAP, in supplying P and supporting good canola and spring wheat
biomass yields. Moreover, the residual benefits from struvite observed for canola in this study
suggest a potential to improve the P status of P deficient soils. Improving the Olsen P levels of
soils reduces the threshold amount of fertilizer P required to obtain optimal yields (McKenzie et
al., 2003). Therefore, struvite is a potential alternative to relatively expensive controlled-release
fertilizers, and its adoption within agricultural systems is a sustainable way of recycling P. In
jurisdictions such as Manitoba, where stringent regulations on manure disposal are a critical
challenge for hog producers, reducing manure P through struvite recovery can go a long way in
easing the problem. Manure with lower P concentrations can be easily applied based on crop N
demand without the risk of P overload. Also, crop producers can benefit from using struvite in
place of conventional P fertilizers, especially where the soils are P deficient and high rates of P
are required. In the long-term, the environmental and manure management benefits of struvite
recovery and use show great potential to offset the additional production costs.

56
SEEDLING TOXICITY STUDIES
Methods and Materials
Experiment setup
The bioassay was laid out in a completely randomized design with a 2 × 3 × 2 × 2 factorial +
2 controls treatment structure and three replicates. The 4 factors were (i) soil (loamy sand and
CL), (ii) P source (MAP, PCMAP, and struvite), (iii) P rate (7.5 and 15 mg P kg-1
), and (iv)
seedbed utilization (SBU) (10.9% and 5.5 %). Five kilograms (dry wt.) of field-moist soil were
weighed into 12.5-L (23.5 cm L × 23.5 cm W × 23.5 cm H) polyethylene pots and packed to
bulk densities of ~1.0 g cm-3
for the clay loam and 1.3 g cm-3
for the sand. Two rows of canola
were seeded 15 cm apart in each pot. Within each row, ten canola seeds were seeded 2 cm apart
at a seeding depth of 2 cm. Phosphorus sources were applied at rates of 7.5 and 15 mg P kg-1
soil
in 1.25- and 2.5-cm wide bands, representing SBUs of 10.9% and 5.5%, respectively.
Immediately after seeding and P source application, all pots received full-strength nutrient
solutions from which P was omitted (Zvomuya et al., 2006). Sufficient reverse-osmosis water
was added to each pot to bring the moisture content to approximately 260 g kg-1
(65% water-
filled pore space, WFPS) for the sand and 390 g kg-1
(61% WFPS) for the clay loam. Pots were
checked every day after planting (DAP) and seedlings were counted until there was no change in
seedling counts (16 DAP). The pots were weighed periodically and reverse-osmosis water was
added as required to restore moisture content to the initial WFPS levels. Moisture depletion was
not allowed to exceed 5% of the initial content (65 and 61% WPFS) before watering.

57
Statistical Analyses
Data was analyzed using the GLIMMIX procedure in SAS (SAS, 2011). A repeated
measures ANOVA was performed on the cumulative emergence data, consistent with the
factorial plus control design. The compound symmetry covariance structure was used based on
the Akaike Information Criterion (AIC) (Akaike, 1974). The ANOVA was carried out in two
steps: (i) comparison of fertilized treatments to the non-fertilized controls and (ii) comparison of
fertilized treatments excluding the controls (factorial component). Soil, P source, P rate, SBU,
and time (DAP) were fixed effects while the time effect was the repeated variable. Analysis of
variance for the seedling counts at 16 DAP was also performed using the GLIMMIX procedure
with soil, P source, P rate, and SBU as the fixed effects of the model.
Emergence from a batch of seeds is rarely synchronized as individual seeds may have
different rates at which they break dormancy, resume metabolism, or tolerate stress (Bewley,
1997; Forcella et al., 2000) due to varying biophysical characteristics, and the microenvironment
of soil surrounding each seed. Therefore, modelling emergence data provides more information
from the dataset than when a simple analysis of a single parameter such as cumulative
emergence or final seedling counts is done (Brown and Mayer, 1988a). Emergence data were
fitted to several sigmoidal growth functions and the most suitable function was selected based on
the criteria suggested by Brown and Mayer (1987), targeting practical relevance and simplicity
(Torres and Frutos, 1990).
The Akaike Information Criterion (AIC) (Akaike, 1974) was used to evaluate the goodness
of fit for each of the evaluated models, and the function with the lowest AIC values for the most
treatments was selected as the one best describing canola cumulative emergence data. Of the
models tested, the Richards, Morgan-Mercer-Flodin, and Weibull functions did not converge for

58
some treatments and were therefore not considered further. The three functions that converged
were:
(i) Mitscherlich: E M 1 exp k t z , [5]
(ii) Logistic: M
E 1 exp kt b
, and [6]
(iii) Gompertz: E M exp exp kt b [7]
where E is emergence at time t, t is time (DAP), M is the asymptotic (final) emergence
percentage, k represents the emergence rate, and z and b, respectively, are directly and indirectly
related to the lag (time to point of inflection) (Brown and Mayer, 1988b). The lag for the
Logistic and Gompertz functions is calculated as:
bLag
k [8]
The Mitscherlich function had the highest AIC values, while the Logistic and Gompertz
functions had lower and very similar AIC values for most treatments (Table 5). However, the
Gompertz function had consistently lower values than the Logistic function for all treatments;
therefore the Gompertz function was chosen to describe this data. Differences among treatments
were determined using the approximate 95% confidence intervals obtained from the model
fitting. For all parameters, treatments with overlapping confidence intervals were considered not
significantly different (Motulsky and Christopoulos, 2004).

59
Table 5. The AIC results from fitting the Mitscherlich, Gompertz, and Logistic functions to
canola emergence data, as affected by soil, P source, seedbed utilization (SBU), and P rate.
Treatment†
Nonlinear Function AIC value
Mitscherlich Gompertz Logistic
Clay loam
Control 52.7 33.9 33.9
MAP-narrow-7.5 55.9 54.5 54.6
MAP-wide-7.5 52.8 49.1 49.3
MAP-narrow-15 54.9 54.2 54.2
MAP-wide-15 58.2 57.7 57.7
CMAP-narrow-7.5 52.7 42.8 42.9
CMAP-wide-7.5 52.6 41.6 41.6
CMAP-narrow-15 51.1 40.6 41.6
CMAP-wide-15 51.6 43.5 44.0
Struvite-narrow-7.5 56.0 54.9 55.1
Struvite-wide-7.5 53.4 50.4 50.7
Struvite-narrow-15 56.7 55.1 55.3
Struvite-wide-15 57.4 55.7 55.8
Sand
Control 56.4 54.8 55.1
MAP-narrow-7.5 51.3 49.9 50.2
MAP-wide-7.5 54.3 53.2 53.5
MAP-narrow-15 55.5 54.5 54.7
MAP-wide-15 55.9 55.3 55.5
CMAP-narrow-7.5 56.4 55.7 55.9
CMAP-wide-7.5 57.3 56.7 56.9
CMAP-narrow-15 57.6 56.7 56.9
CMAP-wide-15 57.8 57.2 57.4
Struvite-narrow-7.5 53.4 50.4 50.8
Struvite-wide-7.5 52.5 50.0 50.3
Struvite-narrow-15 56.6 52.0 52.1
Struvite-wide-15 54.1 49.3 49.6
† Narrow and wide; 5.5% and 10.9% SBU, respectively; 7.5 and 15; P rate in mg P kg-1
‡ AIC, Akaike Information Criterion

60
Results
Cumulative Time-Course and Extent of Seedling Emergence
Analysis of variance
Treatment effects on cumulative emergence and final counts were assessed relative to the
control for each soil separately. Cumulative seedling emergence at 16 DAP was significantly
reduced, relative to the control, by MAP application at the 15 mg kg-1
rate (54%) in the clay
loam. By comparison, there was no significant decrease in seedling emergence due to any of the
treatments in the sand.
The full factorial ANOVA, in which the controls were excluded, showed a significant source
effect on cumulative emergence, which varied with rate and soil type, as indicated by the
significant (P = 0.01) P source × rate × soil interaction (Table 6). This interaction was further
explored using nonlinear regression analysis, as described below.
There was also a significant soil × DAP interaction, with significantly greater emergence in
the clay loam than in the sand during the first 13 DAP but no significant soil effect thereafter
(Table 7, Figure 20). Overall, there was no significant effect of SBU on cumulative emergence.
Final seedling counts in the controls were not significantly different between the sand (87%)
and the clay loam (100%). In the clay loam, MAP applied at the 15 mg kg-1
rate significantly
reduced final seedling counts to 60% and 48 % relative to the controls when applied at the 10.9%
and 5.5% SBUs, respectively. In contrast, application at the 7.5 mg kg-1
rate (85%) did not
significantly reduce the final counts in this soil regardless of SBU. Similarly, struvite (90%) and
CMAP (97%) did not significantly reduce final counts, regardless of P rate and SBU.
Conversely, no treatments significantly reduced final counts relative to the control in the sand.

61
The full factorial ANOVA showed a significant P source effect which varied with soil type and P
application rate, as indicated by the significant soil × P source × rate interaction (P = 0.007)
(Figure 21).
Table 6. Cumulative canola seedling counts as affected by P source, P rate, seedbed utilization
(SBU), days after planting (DAP), and soil.
Effect† Seedling counts‡
Soil (S)
Clay loam 8.17
Sand 5.60
P source (P)
CMAP 7.41
MAP 5.64
Struvite 7.59
P-rate (P)
7.5 mg P kg-1
7.05
15 mg P kg-1
6.72
Seedbed utilization (SBU)
5.5% 6.82
10.9% 6.04
P-value
P 0.01
R 0.29
SBU 0.65
S 0.02
DAP < 0.001
P × R 0.004
P × SBU 0.15
P × S 0.002
P × DAP 0.07
R × SBU 0.28
R × S 0.06
R × DAP 0.24
SBU × S 0.15
SBU × DAP 0.93
S × DAP < 0.001
P × R × SBU 0.58
P × R × S 0.01
P × SBU × S 0.26
P × R × DAP 0.97
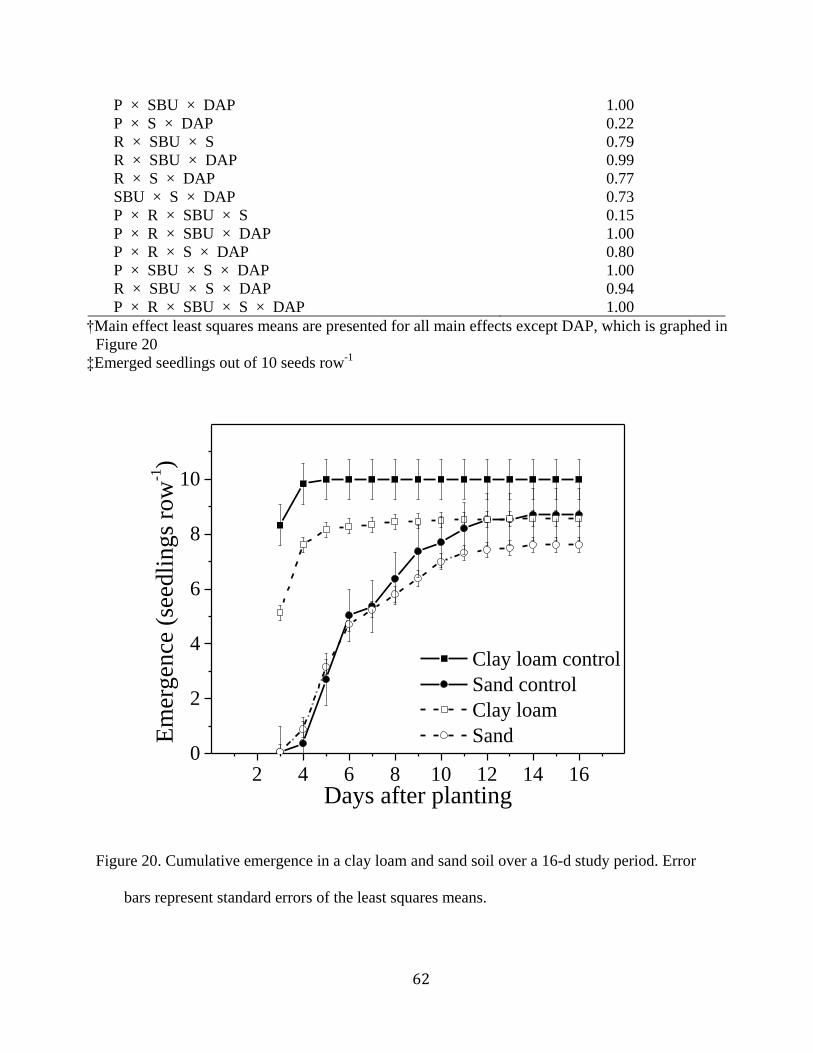
62
P × SBU × DAP 1.00
P × S × DAP 0.22
R × SBU × S 0.79
R × SBU × DAP 0.99
R × S × DAP 0.77
SBU × S × DAP 0.73
P × R × SBU × S 0.15
P × R × SBU × DAP 1.00
P × R × S × DAP 0.80
P × SBU × S × DAP 1.00
R × SBU × S × DAP 0.94
P × R × SBU × S × DAP 1.00
†Main effect least squares means are presented for all main effects except DAP, which is graphed in
Figure 20
‡Emerged seedlings out of 10 seeds row-1
2 4 6 8 10 12 14 160
2
4
6
8
10
Em
ergen
ce (
seed
lin
gs
row
-1)
Days after planting
Clay loam control
Sand control
Clay loam
Sand
Figure 20. Cumulative emergence in a clay loam and sand soil over a 16-d study period. Error
bars represent standard errors of the least squares means.

63
Table 7. Final seedling counts at 16 days after planting (DAP) as affected by P source, P rate,
seedbed-utilization (SBU), and soil.
Effect Seedling counts†
Soil (S)
Clay loam 8.57
Sand 7.61
P source (P)
CMAP 8.58
MAP 6.94
Struvite 8.75
Rate (R)
7.5 8.35
15 7.83
Seedbed utilization (SBU)
10.9% 8.21
5.5% 7.97
P-value‡
S < 0.0001
P 0.0005
R 0.30
SBU 0.55
S × P 0.0002
S × R 0.18
P × R 0.009
S × SBU 0.41
P × SBU 0.17
R × SBU 0.76
S × P × R 0.007
S × P × SBU 0.41
S × R × SBU 0.57
P × R × SBU 0.61
S × P × R × SBU 0.16
†Emerged seedlings out of 10 seeds row-1
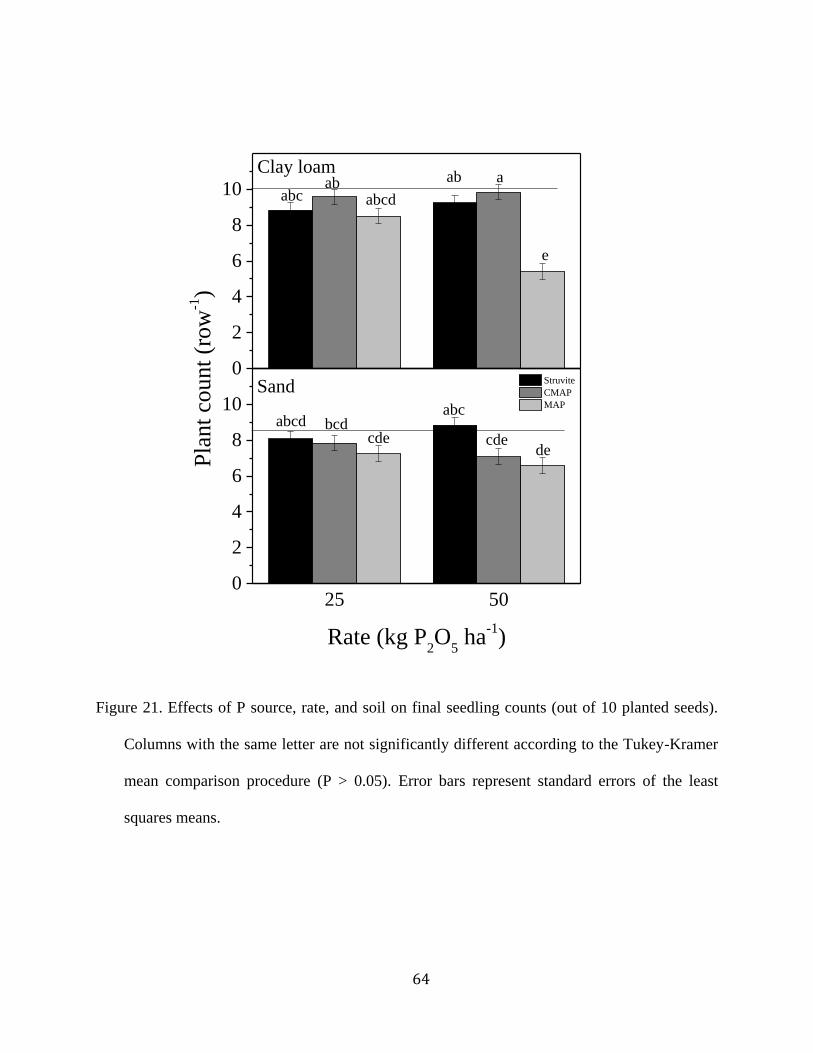
64
0
2
4
6
8
10ab
abc
e
abcdab
Struvite
CMAP
MAP
Clay loama
25 500
2
4
6
8
10 abcabcd
decde cde
bcd
Pla
nt
cou
nt
(row
-1)
Rate (kg P2O
5 ha
-1)
Sand
Figure 21. Effects of P source, rate, and soil on final seedling counts (out of 10 planted seeds).
Columns with the same letter are not significantly different according to the Tukey-Kramer
mean comparison procedure (P > 0.05). Error bars represent standard errors of the least
squares means.

65
Gompertz function
Final emergence percentage
Nonlinear regression analysis using the Gompertz function indicated that in the clay loam, there
was a significant SBU effect at both rates of MAP, the 15 mg kg-1
rate of CMAP, and the 7.5 mg
kg-1
rate of struvite (Table 8). All MAP treatments significantly reduced final emergence
percentage by up to 52% relative to the control (100%) when the fertilizer was applied at the 15
mg P kg-1
at the 5.5 % SBU (emergence = 48.3%). The side-banded 7.5 mg kg-1
rate resulted in
the smallest reduction (12%) for MAP.
Except for the narrow-banded (low SBU) 7.5 mg kg-1
rate (final count = 81%), all struvite
treatments significantly reduced final seedling count by less than 10%. For CMAP treatments,
application at the 7.5 mg kg-1
rate at either SBU, and at the 15 mg kg-1
at 11% SBU, significantly
lowered final emergence by, at most, 5% (Table 8).
Coated MAP, when applied at 15 mg P kg-1
at an SBU of 5.5% did not significantly reduce
final emergence (99.2 %) relative to the control. On the other hand, there were no significant
differences in final seedling counts between the control (86.1%) and any of the struvite
treatments in the sand (77 – 89%). Also, there were no significant struvite or CMAP rate and
SBU effects on final seedling counts. Relative to the control, only the low SBU 15 mg P kg-1
of
CMAP (66.5%) caused a significant (20%) decrease in final emergence percentage while the
other CMAP treatments had no significant effect. For MAP, only the wide-banded 7.5 mg kg-1
rate (82.6%) did not significantly lower final emergence percentage and its emergence was
significantly greater than for all other MAP treatments. The narrow-banded 7.5 mg kg-1
rate,
narrow-banded 15 mg kg-1
rate, and wide-banded 15 mg kg-1
rate of MAP reduced final
emergence percentage by 20, 22, and 18%, respectively.

66
Table 8. Phosphorus source, rate, and SBU effects on final canola seedling counts and Gompertz
function parameters for cumulative percentage emergence data.
Treatment† Emergence %‡ RMSE M§ k b lag (b/k)
Clay loam
Control 100.0 2.56 99.9 a 3. 5 a 8.7 a 2.5
MAP-narrow-7.5 81.7 14.31 79.8 d 1.7 ab 4.8 a 2.8
MAP-wide-7.5 88.3 9.11 87.5 c 1.9 ab 5.5 a 2.8
MAP-narrow-15 48.3 13.92 48.3 f 1.9 ab 5.5 a 3.0
MAP-wide-15 60.0 18.67 58.4 e 1.7 ab 5.2 a 3.0
CMAP-narrow-7.5 96.7 5.41 96.1 b 3.1 ab 7.8 a 2.5
CMAP-wide-7.5 95.0 4.89 94.9 b 3.3 ab 8.3 a 2.5
CMAP-narrow-15 100.0 4.51 99.2 a 2.1 ab 5.5 a 2.6
CMAP-wide-15 96.7 5.70 95.7 b 2.0 ab 5.3 a 2.7
Struvite-narrow-7.5 81.7 14.78 80.6 d 1.5 b 4.0 a 2.7
Struvite-wide-7.5 95.0 10.18 93.2 b 1.9 ab 4.9 a 2.6
Struvite-narrow-15 93.3 15.10 91.6 bc 1.8 ab 4.8 a 2.7
Struvite-wide-15 91.7 15.82 90.6 bc 2.0 ab 5.3 a 2.7
Sand
Control 86.7 14.71 86.1 a 0.5 b 2.9 bc 5.2
MAP-narrow-7.5 80.0 9.79 65.9 b 0.4 b 2.6 bc 6.3
MAP-wide-7.5 65.0 12.80 82.6 a 0.4 b 2.5 c 5.6
MAP-narrow-15 66.7 14.30 64.1 b 0.6 b 3.1 abc 5.1
MAP-wide-15 65.0 15.32 67.8 b 0.4 b 2.3 bc 5.6
CMAP-narrow-7.5 81.7 15.78 80.9 ab 0.5 b 2.5 bc 4.9
CMAP-wide-7.5 75.0 17.18 75.5 ab 0.5 b 2.4 bc 5.2
CMAP-narrow-15 73.3 17.25 66.5 b 0.8 ab 3.6 abc 4.8
CMAP-wide-15 68.3 17.97 75.3 ab 0.4 b 2.4 bc 5.8
Struvite-narrow-7.5 85.0 10.17 84.0 a 0.6 b 3.1 bc 4.9
Struvite-wide-7.5 76.7 9.79 76.9 a 0.5 b 2.9 bc 5.3
Struvite-narrow-15 90.0 11.66 89.3 a 1.6 a 6.7 a 4.2
Struvite-wide-15 86.7 9.26 86.1 a 0.9 ab 4.2 ab 4.6
†Narrow and wide; 5.5% and 10.9% SBU, respectively; 7.5 and 15; P rate in mg P kg-1
‡From ANOVA of final seedling emergence data (Table 7)
§Parameters M, k, and b represent final emergence (% of seeds planted), emergence rate (number
of seedlings d-1
) and, indirectly, the lag in emergence (b/k) [days after planting (DAP)],
respectively. Numbers in a column followed by the same letter are not significantly different
according to the 95% confidence intervals.
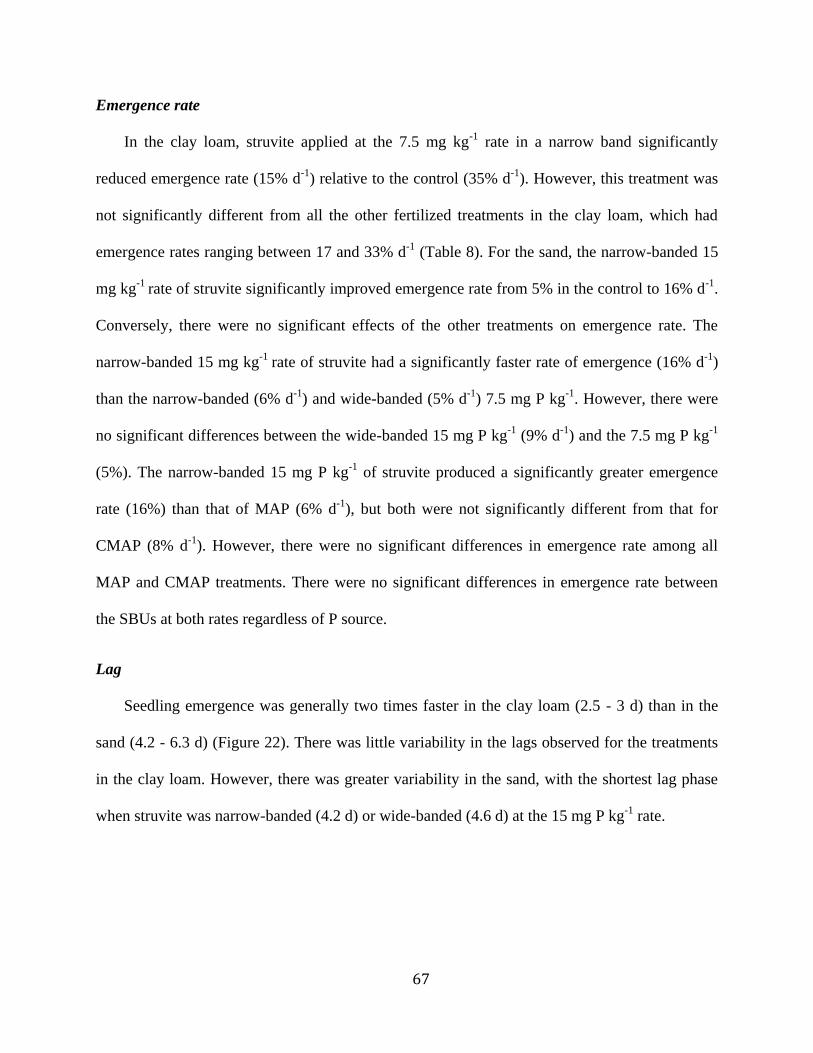
67
Emergence rate
In the clay loam, struvite applied at the 7.5 mg kg-1
rate in a narrow band significantly
reduced emergence rate (15% d-1
) relative to the control (35% d-1
). However, this treatment was
not significantly different from all the other fertilized treatments in the clay loam, which had
emergence rates ranging between 17 and 33% d-1
(Table 8). For the sand, the narrow-banded 15
mg kg-1
rate of struvite significantly improved emergence rate from 5% in the control to 16% d-1
.
Conversely, there were no significant effects of the other treatments on emergence rate. The
narrow-banded 15 mg kg-1
rate of struvite had a significantly faster rate of emergence (16% d-1
)
than the narrow-banded (6% d-1
) and wide-banded (5% d-1
) 7.5 mg P kg-1
. However, there were
no significant differences between the wide-banded 15 mg P kg-1
(9% d-1
) and the 7.5 mg P kg-1
(5%). The narrow-banded 15 mg P kg-1
of struvite produced a significantly greater emergence
rate (16%) than that of MAP (6% d-1
), but both were not significantly different from that for
CMAP (8% d-1
). However, there were no significant differences in emergence rate among all
MAP and CMAP treatments. There were no significant differences in emergence rate between
the SBUs at both rates regardless of P source.
Lag
Seedling emergence was generally two times faster in the clay loam (2.5 - 3 d) than in the
sand (4.2 - 6.3 d) (Figure 22). There was little variability in the lags observed for the treatments
in the clay loam. However, there was greater variability in the sand, with the shortest lag phase
when struvite was narrow-banded (4.2 d) or wide-banded (4.6 d) at the 15 mg P kg-1
rate.
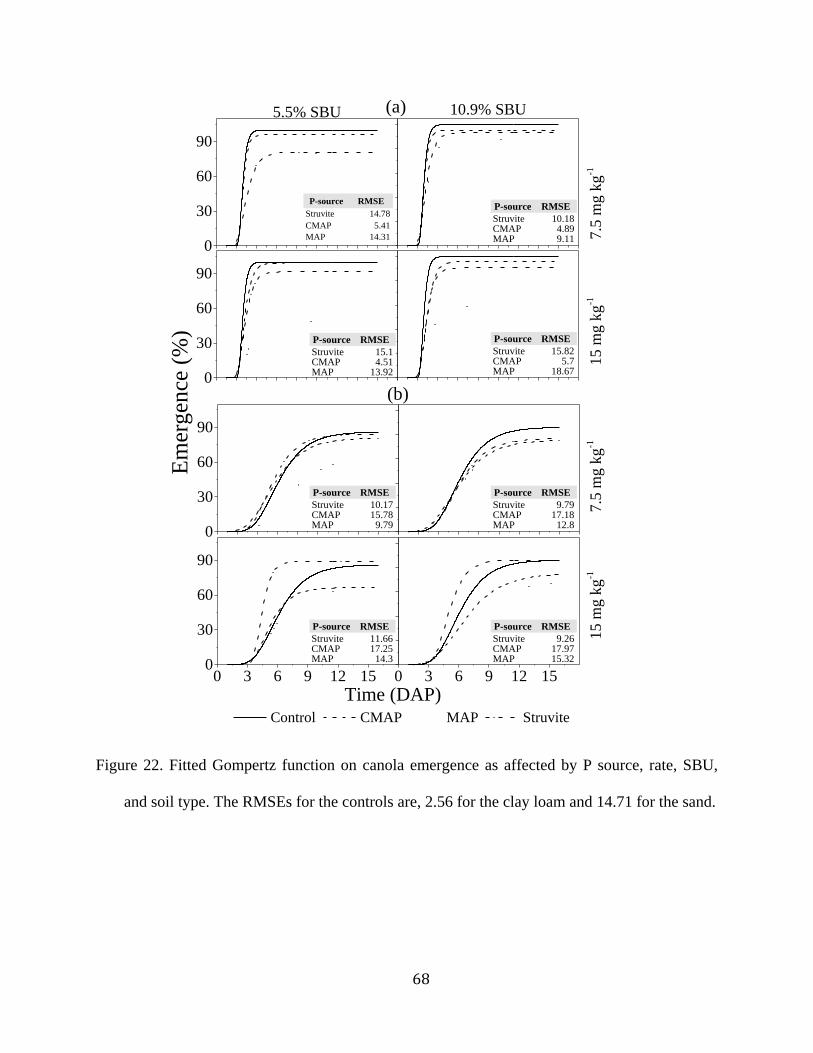
68
0
30
60
90
0
30
60
90
0
30
60
90
0 3 6 9 12 150
30
60
90
0 3 6 9 12 15
Control CMAP MAP Struvite
5.5% SBU
P-source RMSE
Struvite 14.78
CMAP 5.41
MAP 14.31
10.9% SBU
P-source RMSE
Struvite 10.18CMAP 4.89MAP 9.11 7
.5 m
g k
g-1
15
mg
kg
-17
.5 m
g k
g-1
15
mg
kg
-1
P-source RMSE
Struvite 15.1CMAP 4.51MAP 13.92
P-source RMSE
Struvite 15.82CMAP 5.7MAP 18.67
(b)
(a)
P-source RMSE
Struvite 10.17CMAP 15.78MAP 9.79
P-source RMSE
Struvite 9.79CMAP 17.18MAP 12.8
Em
erg
ence
(%
)
Time (DAP)
P-source RMSE
Struvite 11.66CMAP 17.25MAP 14.3
P-source RMSE
Struvite 9.26CMAP 17.97MAP 15.32
Figure 22. Fitted Gompertz function on canola emergence as affected by P source, rate, SBU,
and soil type. The RMSEs for the controls are, 2.56 for the clay loam and 14.71 for the sand.

69
Discussion
Nonlinear regression analysis using the Gompertz function showed that, on average,
seedling emergence in the sand started 2 d later than in the clay loam. This may be due to
differences in the texture, aggregation, and OM contents of the soils. These factors led to
differences in the container capacity water contents (390 g kg-1
for the clay loam vs 260 g kg-1
for the sand ). Also, the sand and clay loam had bulk densities of 1.3 and 0.9 g cm-3
, respectively.
The higher bulk density of the sand may have increased its penetration resistance relative to the
clay loam, thus leading to reduced seedling emergence. This is consistent with observations by
(Nasr and Selles, 1995), who found that bulk density was inversely correlated with emergence
speed and total emergence. They argued that the delay in emergence was primarily due to a
decrease in the volume of voids at high bulk density, which increased the interfacial stress to the
elongating coleoptile. Thus, the lower bulk density, higher water holding capacity, and
aggregated structure of the clay loam offered more favorable conditions for seedling
development than the sand.
In the clay loam, total seedling emergence decreased by at least 40% relative to the control
with application of MAP at 15 mg P kg-1
. In contrast, no significant reductions in seedling
emergence were observed with struvite and CMAP regardless of rate. The reduction in total
emergence at the higher rate of MAP was likely due primarily to the relatively high salt
concentrations in the soil solution around MAP granules. Monoammonium phosphate has very
high water solubility (~370 g L-1
) (Chien et al., 2011) and, when applied in a band, it rapidly
increases the osmotic pressure of the soil solution around the fertilizer band (Dubetz et al., 1959).
On the other hand, struvite does not rapidly increase soil salt concentrations due to its low
solubility (~0.2 g L-1
in water) (Bhuiyan et al., 2007), while P release from CMAP is normally

70
slow due to the polymer coating (Shaviv, 2001b). Consequently, MAP has a greater tendency to
delay or prevent seed hydration, damage developing embryo cells, and ultimately hinder
germination or emergence (Bliss et al., 1986).
Nonlinear regression analysis showed a significant SBU effect of MAP at both rates, CMAP
at the 15 mg kg-1
rate, and struvite at the 7.5 mg kg-1
rate in the clay loam. At the lower SBU, the
fertilizer is concentrated in a narrower band, which reduces fertilizer rates that can be safely
applied to canola (Thomas, 2003). Nonlinear regression analysis indicated that when fertilizer
was applied at the higher (15 mg kg-1
) rate and the lower (5.5%) SBU, salt toxicity effects were
substantial. Results for the 7.5 mg kg-1
rate of struvite are unusual considering the 15 mg kg-1
rate
for this P-source did not show much toxicity.
In the sand, all MAP treatments, except the wide-banded 7.5 mg P kg-1
rate, and the narrow-
banded 15 mg P kg-1
rate of CMAP significantly lowered final counts relative to the control.
However, no significant damage was observed from struvite. Moreover, struvite applied at 15 mg
P kg-1
significantly improved emergence rate. This may be due to the introduction of some
organic matter with the struvite. Organic matter improves the water holding capacity and the
aggregation of the soil. On the other hand, relative to other P sources, the damage from MAP in
the sand was not as distinct as that in the clay loam. The higher concentration of soluble salts in
the clay loam, as well as its higher CEC compared with the sand may have contributed to MAP
being more restrictive of seedling emergence in this soil. With high background solute potential,
it takes less fertilizer to reach the threshold at which seedlings are damaged (Lindstrom et al.,
1976).
The lower final emergence counts for some treatments in the clay loam, which were not
accompanied by a corresponding decrease in the emergence rate or an increased delay in

71
emergence, suggest that toxicity effects occurred either at germination or at early seedling
development. This is because all seeds that successfully germinated or survived in the earliest
seedling development stages seemingly established and emerged at similar rates. The processes
leading to emergence, germination and seedling development respond differently to high levels
of stress factors such as fertilizer salts (Ashraf and McNeilly, 2004; Bewley, 1997; Huang and
Redmann, 1995). Subsurface seedling elongation has relatively higher sensitivity to stress factors
than germination (imbibition and radicle emergence) (Lindstrom et al., 1976). Salts affect cell
physiological functions more than water uptake, especially under moisture conditions near
optimal (Bradford, 1990), such as those in this study. The most critical stage may be early
embryonic development, just after completion of germination (Pace and Benincasa, 2010).
Therefore, all seedlings surviving this critical phase may have successfully emerged and
survived as no seedling injury was observed after emergence for any of the treatments.
Our results are consistent with those from numerous other studies with canola and other
crops, which showed toxicity from high rates of MAP (Allred and Ohlrogge, 1964; Nyborg,
1961; Qian and Schoenau, 2010; Qian et al., 2012; Roberts and Harapiak, 1997). In laboratory
studies, Qian and Schoenau (2010) found significant canola seedling damage from rates of MAP
> 20 kg P2O5 ha-1
when fertilizer was applied at 15% SBU (3.8 cm spread). The authors reported
a > 50% decrease in canola emergence at rates greater than 60 kg P2O5 ha-1
while no significant
damage was observed from CMAP, even at rates greater than 80 kg P2O5 ha-1
. No previous
studies have reported the effects of struvite on canola plant stands.

72
Conclusions
The study has demonstrated the lower risk associated with seedrow application of slow-
release P sources, struvite and CMAP. For the most part, MAP lowered canola emergence more
than the SRFs. These results indicate that struvite may be a safe option when canola is grown in
P-deficient soils which require the application of large rates of P in the seedrow. This is of
particular importance in high P-fixing soils, where PUE is expected to be low, and seedrow
application is the best placement method. Supplying adequate P is very important for optimal
yield, and having a safer option that can minimize seedling damage, offering the flexibility to
apply high rates in contact with the seed, could be worthwhile. These results showed that high
rates of MAP could lead to more than 50% reduction in seedling emergence. Reducing seedling
damage by using a less toxic P source such as struvite could also help curb losses and costs
associated with replanting.

73
REFERENCES
Aage, H., B. Andersen, A. Blom, and I. Jensen. 1997. The solubility of struvite. J. Radioanal.
Nuclear Chem. 223:213-215.
Ackerman, J.N., and N. Cicek. 2011. Phosphorus removal and recovery from hog lagoon
supernatant using a gravity-settled batch reactor and increased pH. Biol. Eng. 4:1-14.
Akaike, H. 1974. A new look at the statistical model identification. IEEE Trans. Auto. Control
19:716-723.
Allred, S., and A. Ohlrogge. 1964. Principles of nutrient uptake from fertilizer bands. VI.
Germination and emergence of corn as affected by ammonia and ammonium phosphate.
Agron. J. 56:309-313.
Antonini, S., M.A. Arias, T. Eichert, and J. Clemens. 2012. Greenhouse evaluation and
environmental impact assessment of different urine-derived struvite fertilizers as
phosphorus sources for plants. Chemosphere 89:1202-1210.
Ashraf, M., and T. McNeilly. 2004. Salinity tolerance in Brassica oilseeds. Crit. Rev. Plant Sci.
23:157-174.
Barak, P., and A. Stafford. 2006. Struvite: a recovered and recycled phosphorus fertilizer. p. 199-
204 Proceedings of the 2006 Wisconsin Fertilizer, Aglime and Pest Management
Conference, Vol. 45. 17-19 January, Wisconsin.
Beal, L.J., R.T. Burns, and K.J. Stalder. 1999. Effect of anaerobic digestion on struvite
production for nutrient removal from swine waste prior to land application. Paper
presented at: ASAE Annual International Meeting. , Toronto, ON, Canada
Beaulieu, M.S. 2004. Manure management in Canada, pp. 1-52, In R. Koroluk, (ed.) Farm
Environmental Management in Canada, Vol. 1. Agricultural Division, Statistics Canada,
Ottawa.
Bewley, J.D. 1997. Seed germination and dormancy. Plant Cell 9:1055.
Bhuiyan, M.I.H., D.S. Mavinic, and R.D. Beckie. 2007. A solubility and thermodynamic study
of struvite. Environ. Technol. 28:1015-1026.
Bliss, R.D., K.A. Platt-Aloia, and W.W. Thomson. 1986. Osmotic sensitivity in relation to salt
sensitivity in germinating barley seeds. Plant Cell Environ. 9:721-725.
Bolland, M.D.A. 1997. Comparative phosphorus requirement of canola and wheat. J. Plant Nutr.
20:813-829.
Bradford, K.J. 1990. A water relations analysis of seed germination rates. Plant Physiol. 94:840-
849.
Brennan, R.F., and M.D.A. Bolland. 2001. Comparing fertilizer phosphorus requirements of
canola, lupin, and wheat. J. Plant Nutr. 24:1885-1900.
Brennan, R.F., and M.D.A. Bolland. 2009. Comparing the nitrogen and phosphorus requirements
of canola and wheat for grain yield and quality. Crop Pasture Sci. 60:566-577.
Brown, R., and D. Mayer. 1988a. Representing cumulative germination. 1. A critical analysis of
single-value germination indices. Ann. Bot. 61:117-125.
Brown, R.F., and D.G. Mayer. 1988b. Representing cumulative germination.: 2. The use of the
Weibull function and other empirically derived curves. Ann. Bot. 61:127-138.
Chien, S.H., L.I. Prochnow, S. Tu, and C.S. Snyder. 2011. Agronomic and environmental aspects
of phosphate fertilizers varying in source and solubility: an update review. Nutr. Cycl.
Agroecosys. 89:229-255.

74
Doyle, J.D., and S.A. Parsons. 2002. Struvite formation, control and recovery. Water Res.
36:3925-3940.
Dubetz, S., R. Smith, and G. Russell. 1959. The effect of fertilizers and osmotic pressure on
germination. Can. J. Soil Sci. 39:157-164.
Föhse, D., N. Claassen, and A. Jungk. 1991. Phosphorus efficiency of plants. Plant Soil 132:261-
272.
Forcella, F., R.L. Benech Arnold, R. Sanchez, and C.M. Ghersa. 2000. Modeling seedling
emergence. Field Crops Res. 67:123-139.
Gee, G.W., and D. Or. 2002. Particle-size analysis. p. 255-293, In J. H. Dane and G. C. Topp,
(eds). Methods of soil analysis. Part 4 - Physical methods., Madison, WI. USA.
Gell, K., F.J.d. Ruijter, P. Kuntke, M.d. Graaff, and A.L. Smit. 2011. Safety and effectiveness of
struvite from black water and urine as a phosphorus fertilizer. J. Agric. Sci. 3:67-80.
Goh, T., R. Karamanos, and J. Lee. 2013. Effects of phosphorus form on short-term solubility
and availability in soils. Commun. Soil Sci. Plant Anal. 44:136-144.
Grant, C.A., and L.D. Bailey. 1993. Fertility management in canola production. Can. J. Plant Sci.
73:651-670.
Henry, J., A. Slinkard, and T. Hogg. 1995. The effect of phosphorus fertilizer on establishment,
yield and quality of pea, lentil and faba bean. Can. J. Plant Sci. 75:395-398.
Hocking, P., J. Mead, A. Good, and S. Diffey. 2003. The response of canola (Brassica napus L.)
to tillage and fertiliser placement in contrasting environments in southern NSW. Animal
Production Science 43:1323-1335.
Hofmann, N. 2013. A geographical profile of livestock manure production in Canada, 2006
[Online] http://www.statcan.gc.ca/pub/16-002-x/2008004/article/10751-eng.htm (posted
14 February, 2013; verified 7 July, 2014).
Huang, J., and R.E. Redmann. 1995. Salt tolerance of Hordeum and Brassica species during
germination and early seedling growth. Can. J. Plant Sci. 75:815-819.
Ige, D.V., O.O. Akinremi, D.N. Flaten, B. Ajiboye, and M.A. Kashem. 2005. Phosphorus
sorption capacity of alkaline Manitoba soils and its relationship to soil properties. Can. J.
Soil Sci. 85:417-426.
Jaffer, Y., T.A. Clark, P. Pearce, and S.A. Parsons. 2002. Potential phosphorus recovery by
struvite formation. Water Res. 36:1834-1842.
Jasinski, S.M. 2006. Phosphate rock, statistics and information US Geological Survey, Minerals
Yearbook.
Johnston, A.E., and I.R. Richards. 2003. Effectiveness of different precipitated phosphates as
phosphorus sources for plants. Soil Use Manage. 19:45-49.
Jordaan, E.M., J. Ackerman, and N. Cicek. 2010. Phosphorus removal from anaerobically
digested swine wastewater through struvite precipitation. Water Sci. Technol. 61:3228-
3234.
Karamanos, R.E., J. Harapiak, and N.A. Flore. 2002. Fall and early spring seeding of canola
(Brassica napus L.) using different methods of seeding and phosphorus placement. Can.
J. Plant Sci. 82:21-26.
Korkmaz, K., H. Ibrikci, E. Karnez, G. Buyuk, J. Ryan, A. Ulger, and H. Oguz. 2009.
Phosphorus use efficiency of wheat genotypes grown in calcareous soils. J. Plant Nutr.
32:2094-2106.

75
Lancashire, P.D., H. Bleiholder, T.V.D. Boom, P. LangelÜDdeke, R. Stauss, E. Weber, and A.
Witzenberger. 1991. A uniform decimal code for growth stages of crops and weeds.
Annals of Applied Biology 119:561-601.
Lindstrom, M., R. Papendick, and F. Koehler. 1976. A model to predict winter wheat emergence
as affected by soil temperature, water potential, and depth of planting. Agron. J. 68:137-
141.
Lombi, E., M.J. McLaughlin, C. Johnston, R.D. Armstrong, and R.E. Holloway. 2004. Mobility
and lability of phosphorus from granular and fluid monoammonium phosphate differs in
a calcareous soil. Soil Sci. Soc. Am. J. 68:682-689.
Malhi, S.S., A.M. Johnston, J.J. Schoenau, Z.L. Wang, and C.L. Vera. 2006. Seasonal biomass
accumulation and nutrient uptake of wheat, barley and oat on a Black Chernozem Soil in
Saskatchewan. Can. J. Plant Sci. 86:1005-1014.
Massey, M.S., J.G. Davis, J.A. Ippolito, and R.E. Sheffield. 2009. Effectiveness of recovered
magnesium phosphates as fertilizers in neutral and slightly alkaline soils Agron. J.
101:323-329.
McKenzie, R.H., E. Bremer, L. Kryzanowski, A.B. Middleton, E.D. Solberg, D. Heaney, G.
Coy, and J. Harapiak. 2003. Yield benefit of phosphorus fertilizer for wheat, barley and
canola in Alberta. Can. J. Soil Sci. 83:431-441.
Motulsky, H., and A. Christopoulos. 2004. Fitting models to biological data using linear and
nonlinear regression: a practical guide to curve fitting Oxford University Press.
Mulvaney, R.L. 1996. Nitrogen - Inorganic forms. p. 1123 - 1184, In D. L. Sparks, et al., (eds).
Methods of soil analysis. Part 3 - Chemical methods. SSSA, Madison, WI. USA.
Nasr, H.M., and F. Selles. 1995. Seedling emergence as influenced by aggregate size, bulk
density, and penetration resistance of the seedbed. Soil Tillage Res. 34:61-76.
Nelson, D.W., and L.E. Sommers. 1996. Total carbon, organic carbon, and organic matter. p.
961-1005, In D. L. Sparks, et al., (eds). Methods of soil analysis. Part 3 - Chemical
methods. SSSA, Madison, WI.
Nelson, N.O., and R.R. Janke. 2007. Phosphorus sources and management in organic production
systems. HortTechnology 17:442-454.
Nelson, N.O., R.L. Mikkelsen, and D.L. Hesterberg. 2003. Struvite precipitation in anaerobic
swine lagoon liquid: effect of pH and Mg:P ratio and determination of rate constant.
Bioresour. Technol. 89:229-236.
Nyborg, M. 1961. The effect of fertilizers on emergence of cereal grains, flax and rape. Can. J.
Soil Sci. 41:89-98.
Olsen, S.R., C.V. Cole, and F.S. Watanabe. 1954. Estimation of available phosphorus in soils by
extraction with sodium bicarbonate USDA, Washington.
Pace, R., and P. Benincasa. 2010. Effect of salinity and low osmotic potential on the germination
and seedling growth of rapeseed cultivars with different stress tolerance. Italian Journal
of Agronomy 5:69-78.
Pearse, S.J., E.J. Veneklaas, G.R. Cawthray, M.D. Bolland, and H. Lambers. 2006. Carboxylate
release of wheat, canola and 11 grain legume species as affected by phosphorus status.
Plant Soil 288:127-139.
Plaza, C., R. Sanz, C. Clemente, J.M. Fernández, R. González, A. Polo, and M.F. Colmenarejo.
2007. Greenhouse evaluation of struvite and sludges from municipal wastewater
treatment works as phosphorus sources for plants. J. Agric. Food Chem 55:8206-8212.

76
Qian, P., and J. Schoenau. 2010. Effects of conventional and controlled release phosphorus
fertilizer on crop emergence and growth response under controlled environment
conditions. J. Plant Nutr. 33:1253-1263.
Qian, P., R. Urton, J. Schoenau, T. King, C. Fatteicher, and C. Grant. 2012. Effect of seed-placed
ammonium sulfate and monoammonium phosphate on germination, emergence and early
plant biomass production of Brassicae oilseed crops. p. 53-62, In U. G. Akpan, (ed.)
Oilseeds InTech, Rijeka.
Quintana, M., E. Sánchez, M.F. Colmenarejo, J. Barrera, G. García, and R. Borja. 2005. Kinetics
of phosphorus removal and struvite formation by the utilization of by-product of
magnesium oxide production. Chem. Eng. J. 111:45-52.
Rader, L.F.J., L.M. White, and C.W. Whittaker. 1943. The salt index-A measure of the effect of
fertilizers on the concentration of the soil solution. Soil Sci. 55:201-218.
Richardson, A., J. Lynch, P. Ryan, E. Delhaize, F. Smith, S. Smith, P. Harvey, M. Ryan, E.
Veneklaas, H. Lambers, A. Oberson, R. Culvenor, and R. Simpson. 2011. Plant and
microbial strategies to improve the phosphorus efficiency of agriculture. Plant Soil
349:121-156.
Roberts, T., and J. Harapiak. 1997. Fertilizer management in direct seeding systems, pp. 18-20
Better Crops, Vol. 81. IPNI.
Rose, T.J., Z. Rengel, Q. Ma, and J.W. Bowden. 2008. Post-flowering supply of P, but not K, is
required for maximum canola seed yields. Eur. J. Agron. 28:371-379.
Ryu, H.-D., and S.-I. Lee. 2010. Application of struvite precipitation as a pretreatment in treating
swine wastewater. Process Biochem. 45:563-572.
SAS. 2011. SAS User's Guide, Version 9.3. SAS Institute Cary, NC.
Shane, M., and H. Lambers. 2005. Cluster roots: A curiosity in context. Plant Soil 274:101-125.
Sharpley, A.N., J.L. Weld, D.B. Beegle, P.J.A. Kleinman, W.J. Gburek, P.A. Moore, and G.
Mullins. 2003. Development of phosphorus indices for nutrient management planning
strategies in the United States. J. Soil Water Conserv. 58:137-152.
Shaviv, A. 2001a. Advances in controlled-release fertilizers. Adv. Agron. 71:1-49.
Shaviv, A. 2001b. Advances in controlled-release fertilizers. p. 1-49 Advances in Agronomy,
Vol. Volume 71. Academic Press.
Shaviv, A., and R. Mikkelsen. 1993. Controlled-release fertilizers to increase efficiency of
nutrient use and minimize environmental degradation - A review. Nutr. Cycl.
Agroecosys. 35:1-12.
Shaviv, A., S. Raban, and E. Zaidel. 2003. Modeling controlled nutrient release from polymer
coated fertilizers: diffusion release from single granules. Environ. Sci. Technol. 37:2251-
2256.
Shen, Y., J.A. Ogejo, and K.E. Bowers. 2010. Reducing the effects of calcium on struvite
precipitation in liquid dairy manure. Presented at the 2010 ASABE Annual International
Meeting, David L. Lawrence Convention Center, Pittsburgh, Pennsylvania. Paper
Number: 1009212.
Shukla, A., A. Kumar, A. Jha, Ajit, and D.V.K.N. Rao. 2012. Phosphorus threshold for
arbuscular mycorrhizal colonization of crops and tree seedlings. Biol. Fertil. Soils
48:109-116.
Solaiman, Z., P. Marschner, D. Wang, and Z. Rengel. 2007. Growth, P uptake and rhizosphere
properties of wheat and canola genotypes in an alkaline soil with low P availability. Biol.
Fertil. Soils 44:143-153.

77
Statistics Canada. 2014. Hog inventories
[Online]. Available by Statistics Canada http://www.statcan.gc.ca/daily-
quotidien/140305/t140305a002-eng.htm (posted 5 March, 2014; verified 6 July, 2014).
Thomas, P. 2003. Canola Growers Manual - Soil fertility [Online]. Available by Canola Council
of Canada http://www.canolacouncil.org/crop-production/canola-grower's-manual-
contents/chapter-9-soil-fertility/chapter-9#phosphorus (verified 12 July, 2014).
Torres, M., and G. Frutos. 1990. Logistic function analysis of germination behaviour of aged
fennel seeds. Environ. Exp. Bot. 30:383-390.
Trenkel, M.E. 1997. Improving fertilizer use effeciency. Controlled-release and stabilized
fertilizers in agriculture. International Fertilizer Industry Association, Paris.
Yaseen, M., and S.S. Malhi. 2009. Differential growth performance of 15 wheat genotypes for
grain yield and phosphorus pptake on a low phosphorus soil without and with applied
phosphorus fertilizer. J. Plant Nutr. 32:1015-1043.
Zadoks, J.C., T.T. Chang, and C.F. Konzak. 1974. A decimal code for the growth stages of
cereals. Weed Res. 14:415-421.
Zvomuya, F., B.L. Helgason, F.J. Larney, H.H. Janzen, O.O. Akinremi, and B.M. Olson. 2006.
Predicting phosphorus availability from soil-applied composted and non-composted cattle
feedlot manure. J. Environ. Qual. 35:928-937.