can stormwater bmps remove bacterialshs.tamu.edu/docs/lshs/end-notes/can stormwater bmps...
TRANSCRIPT
At Press for Publication in Stormwater Magazine May/June 2008
Page 1
Can Stormwater BMPs Remove Bacteria?
New Findings from the International Stormwater BMP Database
By Jane Clary1, Jonathan Jones
2, P.E., D.WRE, Ben Urbonas
3, P.E., D.WRE,
Marcus Quigley4, P.E., Eric Strecker
5, P.E., and Todd Wagner
6, P.E.
Introduction
Many communities throughout the United States are faced with Total Maximum Daily
Loads (TMDLs) for bacteria, typically for either E. coli or fecal coliform. For local
governments responsible for National Pollutant Discharge Elimination System (NPDES)
Municipal Separate Stormwater (MS4) permits, this issue can be particularly challenging
and many questions arise with regard to whether stormwater best management practices
(BMPs) can reduce bacteria in stormwater runoff.
For over a decade, the International Stormwater BMP Database project has been steadily
collecting performance data for a broad array of BMPs, with over 340 BMPs now
included in the database. Although not all BMP studies in the Database are monitored for
bacteria, a data set now exists with approximately 600 pairs of influent and effluent
bacteria data. This paper provides a brief background regarding bacteria in urban runoff,
summarizes the bacteria data available in the BMP Database, provides analysis results
and suggests how these findings may affect the selection and design of BMPs to assist in
meeting TMDL goals. The underlying data set used in this analysis can be downloaded
from the BMP Database website at www.bmpdatabase.org.
Background
Elevated bacteria in stormwater runoff and during wet weather flow conditions in urban
streams is well documented by many researchers (Pitt 2004; Schueler and Holland 2000;
Bossong et al. 2005, as a few examples). Recent findings from monitoring programs
around the United States show that bacteria concentrations in stormwater runoff are
typically elevated well above primary contact recreation standards, regardless of the type
of land use in the watershed (e.g., open space, residential, commercial, industrial,
highway).
1Senior Water Resources Scientist, Wright Water Engineers, Inc.; 2490 W. 26th Ave., Suite 100A; Denver,
CO 80211; [email protected]. 2 Chief Executive Officer, Wright Water Engineers, Inc.; 2490 W. 26th Ave., Suite 100A; Denver, CO
80211; [email protected]. 3 Chief, Master Planning & South Platte River Programs, Urban Drainage and Flood Control District, 2480
West 26th Avenue, Suite 156-B; Denver, CO 80211, [email protected]. 4 Associate, Geosyntec Consultants; 289 Great Road, Suite 105; Acton, MA 01720;
[email protected]. 5 Principal, Geosyntec Consultants; 55 SW Yamhill Street, Suite 200; Portland, OR 97204;
[email protected]. 6 Principal Storm Water Engineer, City of Springfield Department of Public Works, Stormwater Services
Division; 840 Boonville Ave., P.O. Box 8368; Springfield, MO 65801-8368; [email protected].
At Press for Publication in Stormwater Magazine May/June 2008
Page 2
Many communities, researchers, industries and others have made efforts to identify the
sources of bacteria in urban runoff and many others are beginning in this process. In
some cases, human-induced problems exist due to illicit connections of sanitary sewers to
storm sewers, sanitary sewer overflows, improper disposal of pet waste, and leaking
sanitary sewers, as a few examples. Correction of these problems is of unquestionable
benefit to the environment and human health. In other cases, non-anthropogenic sources
of bacteria are suspected. Regardless of the sources, municipal MS4 permit holders can
find themselves with a wasteload allocation for indicator bacteria and be required to
make measurable progress in reducing it under TMDLs.
Obvious first steps in controlling bacteria discharges from storm sewers include dry
weather screening of stormwater outfalls to remove blatant sources of bacteria associated
with illicit connections and leaking sanitary sewers, but what next? If an MS4 permit
holder is subject to TMDL requirements, use of BMPs may be the next step. Intuitively,
nonstructural BMPs that include educating citizens about proper disposal of pet waste
and increasing containers for disposal of this waste may serve as one of the source
control BMPs. The question remains whether traditional structural and Low Impact
Development oriented stormwater BMPs such as detention basins, retention ponds, sand
filters, porous landscape detention (bioretention cells), grass swales and other practices
can also help and to what degree. This is where the International Stormwater BMP
Database provides some initial answers.
Data Summary and Analysis
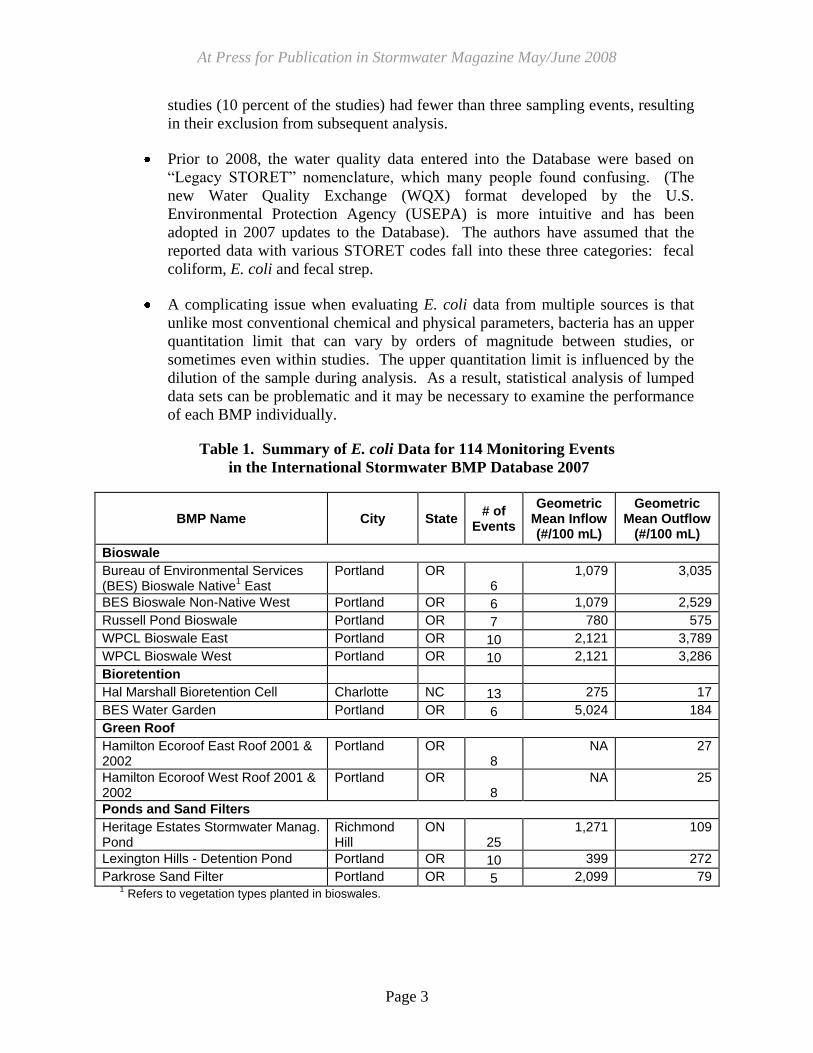
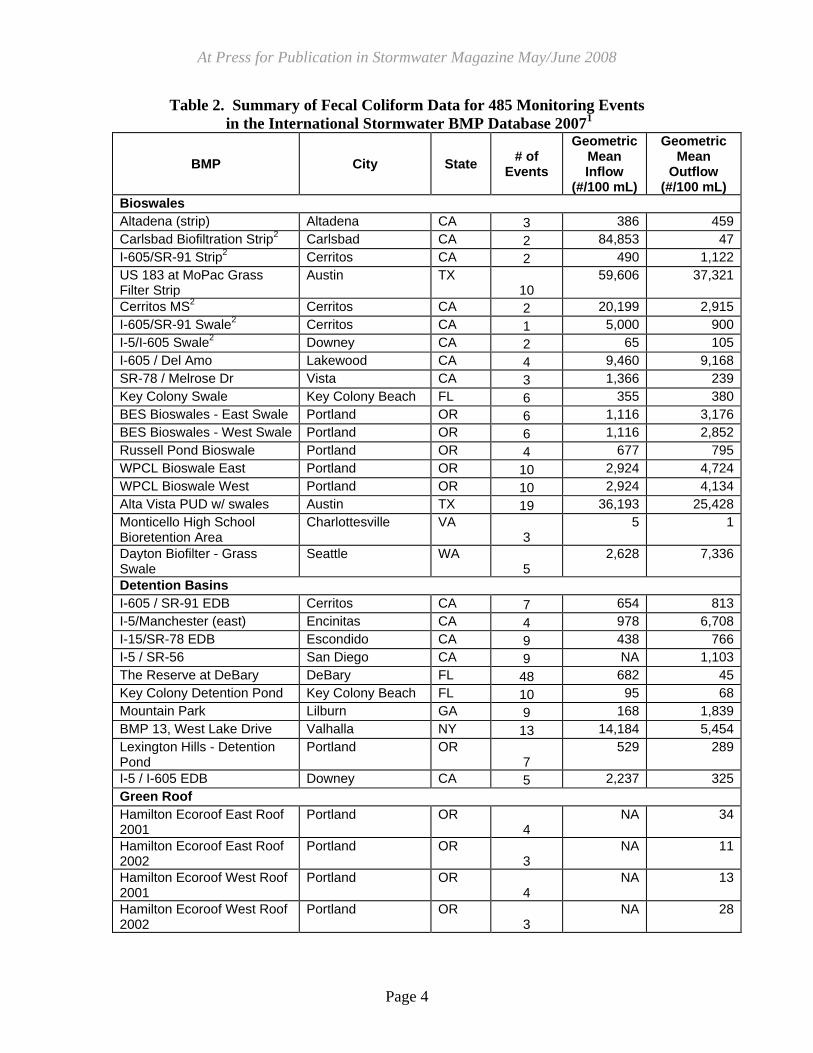
The International Stormwater BMP Database contains over 100 paired E. coli monitoring
events at 12 sites (Table 1), and nearly 500 paired fecal coliform monitoring events at 61
sites (Table 2). The majority of the E. coli data sets are in Portland, Oregon and are from
sites with Low Impact Development BMPs such as bioswales and green roofs. The fecal
coliform data set is more geographically diverse with studies in California, Florida,
Virginia, Ontario, New York, Texas, Georgia, North Carolina and Oregon. Also
available, but not discussed in this paper, are fecal strep data for 33 events at two
locations. A few caveats prior to analyzing the data set are appropriate, including:
Although a few event mean concentration (EMC) data sets for bacteria exist in the
Database, the majority of samples are grab samples, typically because a six hour
maximum holding time is specified for bacterial analysis, making it inconvenient
and difficult to collect samples for a representative hydrograph using automated
samplers and to deliver the samples to the laboratory within this timeframe. Thus,
the limitations of grab samples, which are well documented in the technical
literature, apply. Additionally, some monitored storm events in the database are
based on a single pair of grab samples of the influent and effluent, whereas others
are based on arithmetic averages of several grab samples, and some are flow-
weighted averages.
The number of events sampled for studies presented in Tables 1 and 2 varies. For
the E. coli data set, an average of ten storms per BMP was monitored. For fecal
coliform, an average of eight storms per BMP was monitored; however, six of the
At Press for Publication in Stormwater Magazine May/June 2008
Page 3
studies (10 percent of the studies) had fewer than three sampling events, resulting
in their exclusion from subsequent analysis.
Prior to 2008, the water quality data entered into the Database were based on
“Legacy STORET” nomenclature, which many people found confusing. (The
new Water Quality Exchange (WQX) format developed by the U.S.
Environmental Protection Agency (USEPA) is more intuitive and has been
adopted in 2007 updates to the Database). The authors have assumed that the
reported data with various STORET codes fall into these three categories: fecal
coliform, E. coli and fecal strep.
A complicating issue when evaluating E. coli data from multiple sources is that
unlike most conventional chemical and physical parameters, bacteria has an upper
quantitation limit that can vary by orders of magnitude between studies, or
sometimes even within studies. The upper quantitation limit is influenced by the
dilution of the sample during analysis. As a result, statistical analysis of lumped
data sets can be problematic and it may be necessary to examine the performance
of each BMP individually.
Table 1. Summary of E. coli Data for 114 Monitoring Events
in the International Stormwater BMP Database 2007
BMP Name City State # of
Events
Geometric Mean Inflow (#/100 mL)
Geometric Mean Outflow
(#/100 mL)
Bioswale
Bureau of Environmental Services (BES) Bioswale Native
1 East
Portland OR 6
1,079 3,035
BES Bioswale Non-Native West Portland OR 6 1,079 2,529
Russell Pond Bioswale Portland OR 7 780 575
WPCL Bioswale East Portland OR 10 2,121 3,789
WPCL Bioswale West Portland OR 10 2,121 3,286
Bioretention
Hal Marshall Bioretention Cell Charlotte NC 13 275 17
BES Water Garden Portland OR 6 5,024 184
Green Roof
Hamilton Ecoroof East Roof 2001 & 2002
Portland OR 8
NA 27
Hamilton Ecoroof West Roof 2001 & 2002
Portland OR 8
NA 25
Ponds and Sand Filters
Heritage Estates Stormwater Manag. Pond
Richmond Hill
ON 25
1,271 109
Lexington Hills - Detention Pond Portland OR 10 399 272
Parkrose Sand Filter Portland OR 5 2,099 79 1 Refers to vegetation types planted in bioswales.
At Press for Publication in Stormwater Magazine May/June 2008
Page 4
Table 2. Summary of Fecal Coliform Data for 485 Monitoring Events
in the International Stormwater BMP Database 20071
BMP City State # of
Events
Geometric Mean Inflow
(#/100 mL)
Geometric Mean
Outflow (#/100 mL)
Bioswales
Altadena (strip) Altadena CA 3 386 459
Carlsbad Biofiltration Strip2 Carlsbad CA 2 84,853 47
I-605/SR-91 Strip2 Cerritos CA 2 490 1,122
US 183 at MoPac Grass Filter Strip
Austin TX 10
59,606 37,321
Cerritos MS2 Cerritos CA 2 20,199 2,915
I-605/SR-91 Swale2 Cerritos CA 1 5,000 900
I-5/I-605 Swale2 Downey CA 2 65 105
I-605 / Del Amo Lakewood CA 4 9,460 9,168
SR-78 / Melrose Dr Vista CA 3 1,366 239
Key Colony Swale Key Colony Beach FL 6 355 380
BES Bioswales - East Swale Portland OR 6 1,116 3,176
BES Bioswales - West Swale Portland OR 6 1,116 2,852
Russell Pond Bioswale Portland OR 4 677 795
WPCL Bioswale East Portland OR 10 2,924 4,724
WPCL Bioswale West Portland OR 10 2,924 4,134
Alta Vista PUD w/ swales Austin TX 19 36,193 25,428
Monticello High School Bioretention Area
Charlottesville VA 3
5 1
Dayton Biofilter - Grass Swale
Seattle WA 5
2,628 7,336
Detention Basins
I-605 / SR-91 EDB Cerritos CA 7 654 813
I-5/Manchester (east) Encinitas CA 4 978 6,708
I-15/SR-78 EDB Escondido CA 9 438 766
I-5 / SR-56 San Diego CA 9 NA 1,103
The Reserve at DeBary DeBary FL 48 682 45
Key Colony Detention Pond Key Colony Beach FL 10 95 68
Mountain Park Lilburn GA 9 168 1,839
BMP 13, West Lake Drive Valhalla NY 13 14,184 5,454
Lexington Hills - Detention Pond
Portland OR 7
529 289
I-5 / I-605 EDB Downey CA 5 2,237 325
Green Roof
Hamilton Ecoroof East Roof 2001
Portland OR 4
NA 34
Hamilton Ecoroof East Roof 2002
Portland OR 3
NA 11
Hamilton Ecoroof West Roof 2001
Portland OR 4
NA 13
Hamilton Ecoroof West Roof 2002
Portland OR 3
NA 28
At Press for Publication in Stormwater Magazine May/June 2008
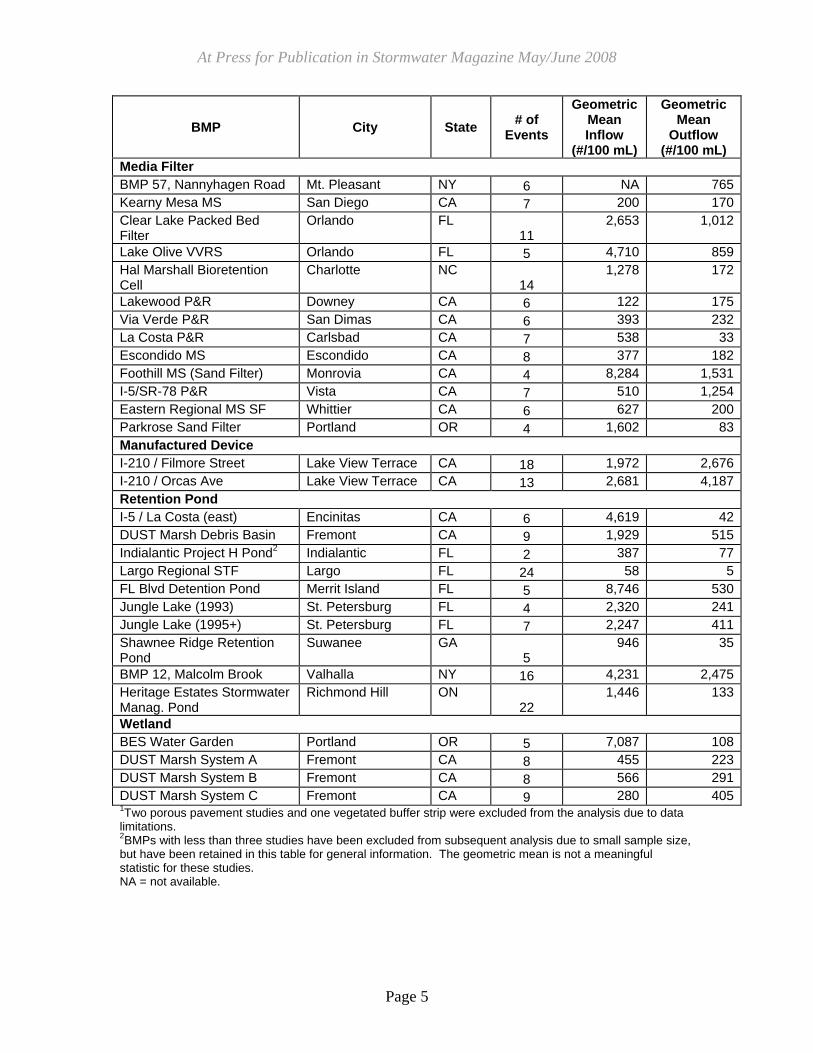
Page 5
BMP City State # of
Events
Geometric Mean Inflow
(#/100 mL)
Geometric Mean
Outflow (#/100 mL)
Media Filter
BMP 57, Nannyhagen Road Mt. Pleasant NY 6 NA 765
Kearny Mesa MS San Diego CA 7 200 170
Clear Lake Packed Bed Filter
Orlando FL 11
2,653 1,012
Lake Olive VVRS Orlando FL 5 4,710 859
Hal Marshall Bioretention Cell
Charlotte NC 14
1,278 172
Lakewood P&R Downey CA 6 122 175
Via Verde P&R San Dimas CA 6 393 232
La Costa P&R Carlsbad CA 7 538 33
Escondido MS Escondido CA 8 377 182
Foothill MS (Sand Filter) Monrovia CA 4 8,284 1,531
I-5/SR-78 P&R Vista CA 7 510 1,254
Eastern Regional MS SF Whittier CA 6 627 200
Parkrose Sand Filter Portland OR 4 1,602 83
Manufactured Device
I-210 / Filmore Street Lake View Terrace CA 18 1,972 2,676
I-210 / Orcas Ave Lake View Terrace CA 13 2,681 4,187
Retention Pond
I-5 / La Costa (east) Encinitas CA 6 4,619 42
DUST Marsh Debris Basin Fremont CA 9 1,929 515
Indialantic Project H Pond2 Indialantic FL 2 387 77
Largo Regional STF Largo FL 24 58 5
FL Blvd Detention Pond Merrit Island FL 5 8,746 530
Jungle Lake (1993) St. Petersburg FL 4 2,320 241
Jungle Lake (1995+) St. Petersburg FL 7 2,247 411
Shawnee Ridge Retention Pond
Suwanee GA 5
946 35
BMP 12, Malcolm Brook Valhalla NY 16 4,231 2,475
Heritage Estates Stormwater Manag. Pond
Richmond Hill ON 22
1,446 133
Wetland
BES Water Garden Portland OR 5 7,087 108
DUST Marsh System A Fremont CA 8 455 223
DUST Marsh System B Fremont CA 8 566 291
DUST Marsh System C Fremont CA 9 280 405 1Two porous pavement studies and one vegetated buffer strip were excluded from the analysis due to data
limitations. 2BMPs with less than three studies have been excluded from subsequent analysis due to small sample size,
but have been retained in this table for general information. The geometric mean is not a meaningful statistic for these studies.
NA = not available.
At Press for Publication in Stormwater Magazine May/June 2008
Page 6
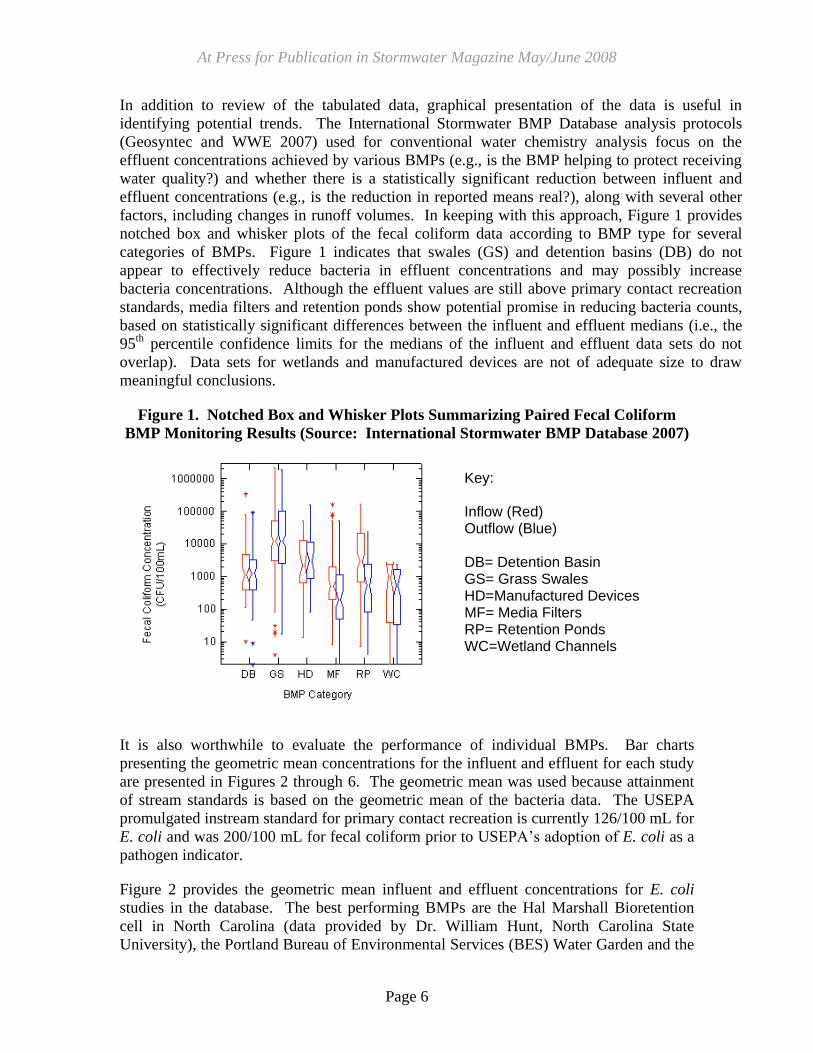
In addition to review of the tabulated data, graphical presentation of the data is useful in
identifying potential trends. The International Stormwater BMP Database analysis protocols
(Geosyntec and WWE 2007) used for conventional water chemistry analysis focus on the
effluent concentrations achieved by various BMPs (e.g., is the BMP helping to protect receiving
water quality?) and whether there is a statistically significant reduction between influent and
effluent concentrations (e.g., is the reduction in reported means real?), along with several other
factors, including changes in runoff volumes. In keeping with this approach, Figure 1 provides
notched box and whisker plots of the fecal coliform data according to BMP type for several
categories of BMPs. Figure 1 indicates that swales (GS) and detention basins (DB) do not
appear to effectively reduce bacteria in effluent concentrations and may possibly increase
bacteria concentrations. Although the effluent values are still above primary contact recreation
standards, media filters and retention ponds show potential promise in reducing bacteria counts,
based on statistically significant differences between the influent and effluent medians (i.e., the
95th
percentile confidence limits for the medians of the influent and effluent data sets do not
overlap). Data sets for wetlands and manufactured devices are not of adequate size to draw
meaningful conclusions.
Figure 1. Notched Box and Whisker Plots Summarizing Paired Fecal Coliform
BMP Monitoring Results (Source: International Stormwater BMP Database 2007)
It is also worthwhile to evaluate the performance of individual BMPs. Bar charts
presenting the geometric mean concentrations for the influent and effluent for each study
are presented in Figures 2 through 6. The geometric mean was used because attainment
of stream standards is based on the geometric mean of the bacteria data. The USEPA
promulgated instream standard for primary contact recreation is currently 126/100 mL for
E. coli and was 200/100 mL for fecal coliform prior to USEPA’s adoption of E. coli as a
pathogen indicator.
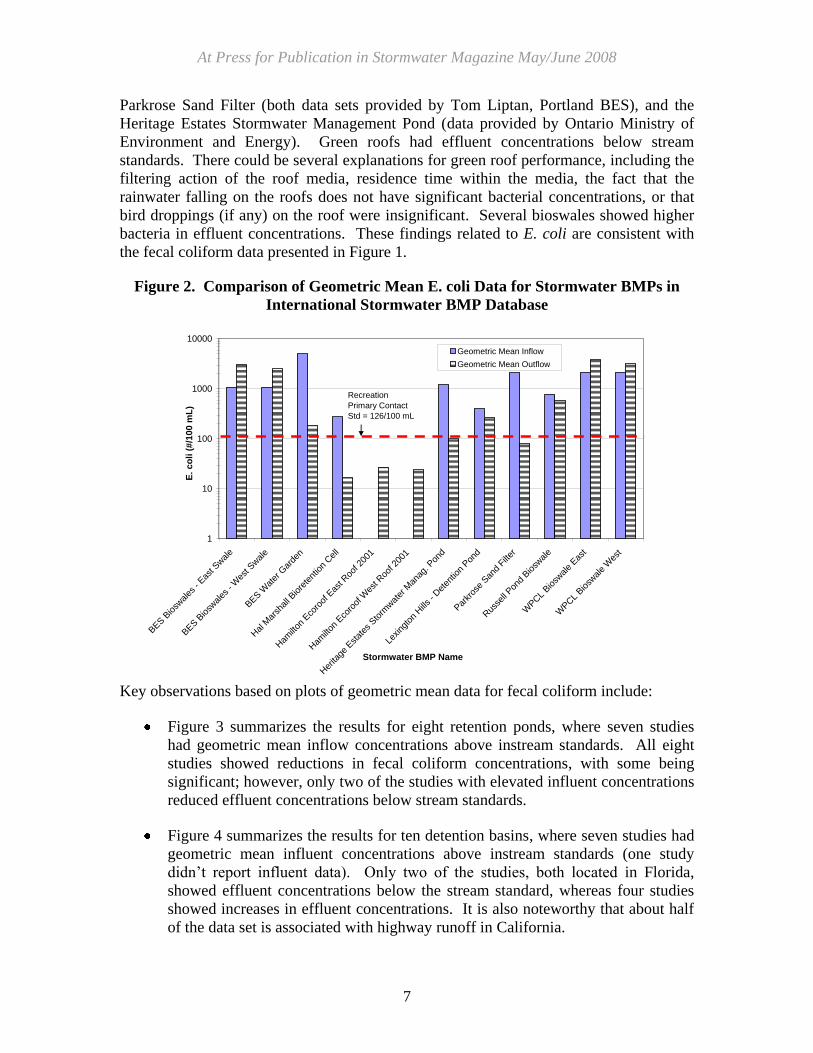
Figure 2 provides the geometric mean influent and effluent concentrations for E. coli
studies in the database. The best performing BMPs are the Hal Marshall Bioretention
cell in North Carolina (data provided by Dr. William Hunt, North Carolina State
University), the Portland Bureau of Environmental Services (BES) Water Garden and the
Key: Inflow (Red) Outflow (Blue) DB= Detention Basin GS= Grass Swales HD=Manufactured Devices MF= Media Filters RP= Retention Ponds WC=Wetland Channels
At Press for Publication in Stormwater Magazine May/June 2008
7
Parkrose Sand Filter (both data sets provided by Tom Liptan, Portland BES), and the
Heritage Estates Stormwater Management Pond (data provided by Ontario Ministry of
Environment and Energy). Green roofs had effluent concentrations below stream
standards. There could be several explanations for green roof performance, including the
filtering action of the roof media, residence time within the media, the fact that the
rainwater falling on the roofs does not have significant bacterial concentrations, or that
bird droppings (if any) on the roof were insignificant. Several bioswales showed higher
bacteria in effluent concentrations. These findings related to E. coli are consistent with
the fecal coliform data presented in Figure 1.
Figure 2. Comparison of Geometric Mean E. coli Data for Stormwater BMPs in
International Stormwater BMP Database
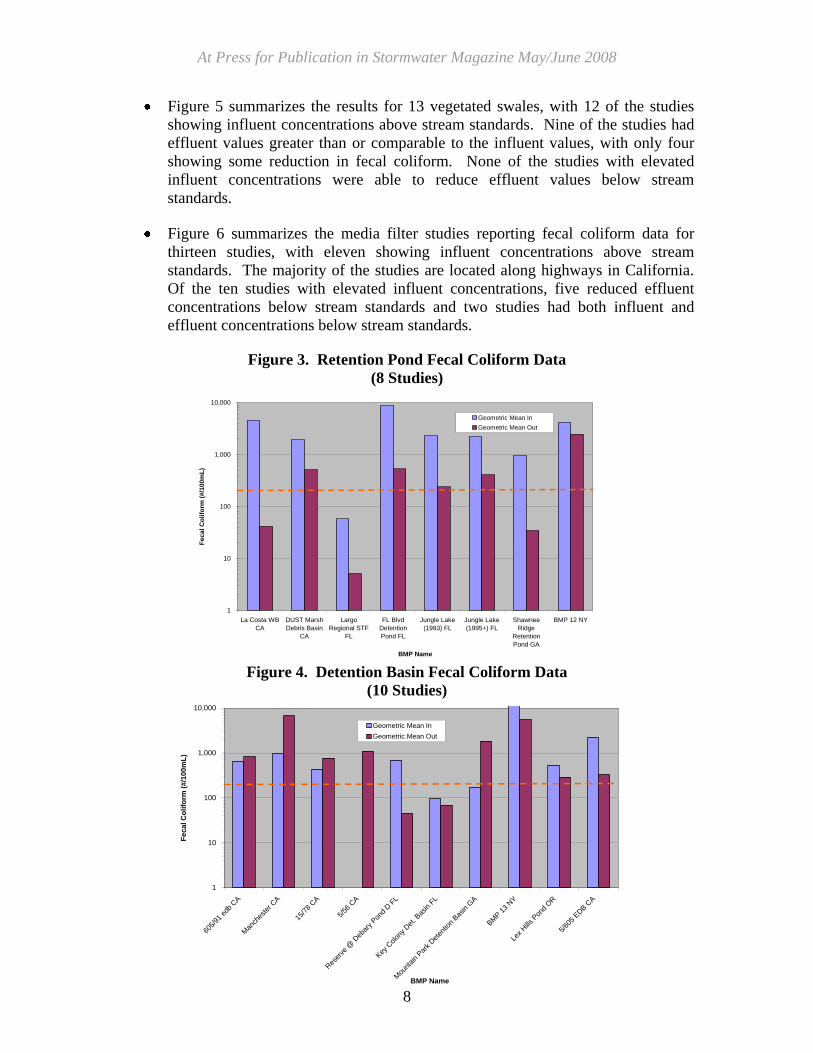
Key observations based on plots of geometric mean data for fecal coliform include:
Figure 3 summarizes the results for eight retention ponds, where seven studies
had geometric mean inflow concentrations above instream standards. All eight
studies showed reductions in fecal coliform concentrations, with some being
significant; however, only two of the studies with elevated influent concentrations
reduced effluent concentrations below stream standards.
Figure 4 summarizes the results for ten detention basins, where seven studies had
geometric mean influent concentrations above instream standards (one study
didn’t report influent data). Only two of the studies, both located in Florida,
showed effluent concentrations below the stream standard, whereas four studies
showed increases in effluent concentrations. It is also noteworthy that about half
of the data set is associated with highway runoff in California.
Figure 2. Comparison of Geometric Mean E. coli Data for Stormwater BMPs in
International Stormwater BMP Database
1
10
100
1000
10000
BES B
iosw
ales
- Eas
t Swale
BES B
iosw
ales
- W
est S
wale
BES W
ater
Gar
den
Hal M
arsh
all B
iore
tent
ion
Cell
Ham
ilton
Eco
roof
Eas
t Roo
f 200
1
Ham
ilton
Eco
roof
Wes
t Roo
f 200
1
Her
itage
Estat
es S
torm
wat
er M
anag
. Pon
d
Lexing
ton
Hills - D
eten
tion
Pon
d
Par
kros
e San
d Filt
er
Rus
sell Pon
d Biosw
ale
WPCL
Biosw
ale
Eas
t
WPCL
Biosw
ale
Wes
t
Stormwater BMP Name
E. co
li (
#/1
00 m
L)
Geometric Mean Inflow
Geometric Mean Outflow
Recreation
Primary Contact
Std = 126/100 mL
At Press for Publication in Stormwater Magazine May/June 2008
8
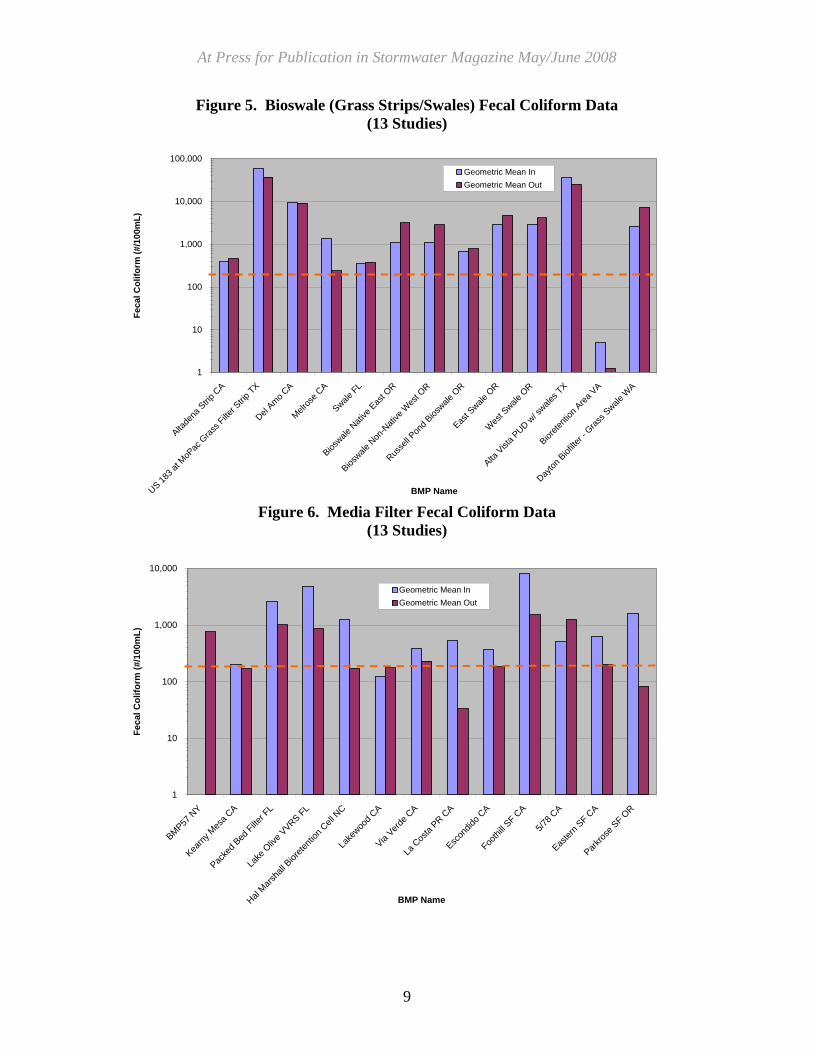
Figure 5 summarizes the results for 13 vegetated swales, with 12 of the studies
showing influent concentrations above stream standards. Nine of the studies had
effluent values greater than or comparable to the influent values, with only four
showing some reduction in fecal coliform. None of the studies with elevated
influent concentrations were able to reduce effluent values below stream
standards.
Figure 6 summarizes the media filter studies reporting fecal coliform data for
thirteen studies, with eleven showing influent concentrations above stream
standards. The majority of the studies are located along highways in California.
Of the ten studies with elevated influent concentrations, five reduced effluent
concentrations below stream standards and two studies had both influent and
effluent concentrations below stream standards.
Figure 3. Retention Pond Fecal Coliform Data
(8 Studies)
Figure 4. Detention Basin Fecal Coliform Data
(10 Studies)
Figure 3. Retention Pond Fecal Coliform Data
(8 studies)
1
10
100
1,000
10,000
La Costa WB
CA
DUST Marsh
Debris Basin
CA
Largo
Regional STF
FL
FL Blvd
Detention
Pond FL
Jungle Lake
(1993) FL
Jungle Lake
(1995+) FL
Shawnee
Ridge
Retention
Pond GA
BMP 12 NY
BMP Name
Fe
cal
Co
lifo
rm (
#/1
00m
L)
Geometric Mean In
Geometric Mean Out
Figure 4. Detention Basin Fecal Coliform Data
(10 studies)
1
10
100
1,000
10,000
605/
91 e
db C
A
Man
ches
ter C
A
15/7
8 CA
5/56
CA
Res
erve
@ D
ebar
y Pon
d D F
L
Key
Colon
y Det
. Bas
in F
L
Mou
ntain
Par
k Det
entio
n Bas
in G
A
BM
P 1
3 NY
Lex Hills Pon
d OR
5/60
5 ED
B C
A
BMP Name
Fe
ca
l C
olifo
rm (
#/1
00
mL
)
Geometric Mean In
Geometric Mean Out
At Press for Publication in Stormwater Magazine May/June 2008
9
Figure 5. Bioswale (Grass Strips/Swales) Fecal Coliform Data
(13 Studies)
Figure 6. Media Filter Fecal Coliform Data
(13 Studies)
Figure 5. Bioswale (Grass Strips/Swales) Fecal Coliform Data
(13 studies)
1
10
100
1,000
10,000
100,000
Alta
dena
Stri
p CA
US 1
83 a
t MoP
ac G
rass
Filter
Stri
p TX
Del A
mo
CA
Melro
se C
A
Swale
FL
Biosw
ale
Nat
ive
East O
R
Biosw
ale
Non
-Nat
ive
Wes
t OR
Rus
sell Pon
d Biosw
ale
OR
Eas
t Swale
OR
Wes
t Swale
OR
Alta
Vista
PUD w
/ swales
TX
Biore
tent
ion
Are
a VA
Day
ton
Biofilte
r - G
rass
Swale
WA
BMP Name
Fe
ca
l C
olifo
rm (
#/1
00
mL
)
Geometric Mean In
Geometric Mean Out
Figure 6. Media Filter Fecal Coliform Data
(13 studies)
1
10
100
1,000
10,000
BM
P57
NY
Kea
rny M
esa
CA
Pac
ked
Bed
Filter
FL
Lake
Oliv
e VVRS F
L
Hal M
arsh
all B
iore
tent
ion
Cell N
C
Lake
woo
d CA
Via V
erde
CA
La C
osta
PR C
A
Esc
ondido
CA
Footh
ill S
F CA
5/78
CA
Eas
tern
SF C
A
Par
kros
e SF O
R
BMP Name
Fe
ca
l C
oli
form
(#
/10
0m
L)
Geometric Mean In
Geometric Mean Out
At Press for Publication in Stormwater Magazine May/June 2008
10
Findings and Implications
Findings and implications for stormwater managers based on a review of the bacteria data
in the International Stormwater BMP Database include:
Bacteria concentrations in untreated runoff were consistently high for the majority
of the BMP study sites, with the influent concentrations varying substantially.
The variation may be due to both site-specific conditions as well as the upper
quantitation limit reported in the study.
The ability of structural BMPs to reduce bacteria counts varies widely within
BMP categories. No single BMP type appears to be able to consistently reduce
bacteria in surface effluent to levels below instream primary contact recreation
standards. As a result, stormwater managers, permit writers and TMDL
participants should not assume that structural BMPs can meet numeric effluent
limits for bacteria for all storms and under all conditions. This is consistent with
2006 findings from a Storm Water Panel Recommendations to the California
State Water Resources Control Board regarding the feasibility of numeric effluent
limits for stormwater in general (CSWRCB 2006).
Computer modeling of bacteria in stormwater should incorporate significant
variability in both untreated runoff (influent) and BMP effluent and should be
undertaken with caution. Feedback from some environmental engineers and
consultants who apply common models to pathogen and fecal indicator transport
suggests that the models provide highly uncertain predictions for pathogen and
indicator concentrations and fluxes (USEPA 2007, based on input from Ali
Boehm, Stanford University). Models should be kept simple, with results not
reported in unrealistically precise terms. TMDLs should acknowledge this
variability and incorporate terms of compliance based on real-world monitoring
data.
BMP categories that appear to have potential for bacteria reduction in effluent
include retention ponds and media filters (inclusive of bioretention cells).
Considerations related to these two BMP categories include:
Retention ponds may be well suited for development with significant land
area and adequate water rights (typically a challenge in semi-arid and arid
states such as Colorado) or abundant rainfall. In ultra-urban areas, infill
development, and arid/semi-arid climates, retention ponds are often
impractical. Another potential disadvantage with retention ponds is that
they can attract waterfowl and wildlife, which can increase bacterial
levels.
Media filters and bioretention cells show promise in removing bacteria at
the site-level. For new developments based on Low Impact Development
techniques, the use of bioretention cells or rain gardens is becoming more
common in some part of United States. The key unit treatment process

At Press for Publication in Stormwater Magazine May/June 2008
11
(filtration) associated with media filters is well proven in the drinking
water arena, so it is not surprising that these BMPs would reduce bacteria,
provided that the facilities are properly maintained. For existing
developments, some targeted retrofitting in bacteria “hot spot” areas could
be possible, but costs of watershed-wide retrofits with many media filters
will likely be cost prohibitive. One of the important aspects of long-term
functioning of distributed controls such as bioretention cells is ensuring
that these facilities are maintained and continue to function as designed in
perpetuity. In many cases, local governments are already stretched to
ensure maintenance of regional stormwater facilities, so although these
practices may hold promise, “ensuring” their continued function may be
administratively challenging.
Swale and detention pond BMPs appear to have low effectiveness in reducing
bacteria and in some cases have the potential for exporting bacteria. The authors
hypothesize that potential causes could include that fact that these types of BMPs
tend to attract ducks, geese, wildlife and domestic pets, which may contribute to
bacteria loading. Regardless, these BMPs can still be effective at reducing
pollutant concentrations such as total suspended solids (TSS), total metals, and
other constituents, as demonstrated in the 2007 analysis of the International
Stormwater BMP Database (Geosyntec and Wright Water Engineers 2007), and
are valuable components of stormwater management programs.
Several BMP categories have data sets too small to warrant interpretation; these
include the wetland, porous pavement and manufactured device categories.
However, one could anticipate how some of these BMPs may perform by
evaluating BMPs with similar unit processes. For example, properly designed
porous pavements, such as those with a sand layer above the sub-surface
underdrains, as recommended by some local criteria (UDFCD 1999), should
perform similarly to media filters.
In addition to the ability of a BMP to reduce concentrations of bacteria, it is also
important to consider whether the BMP reduces the volume of stormwater runoff
and the frequency of discharges. BMPs such as bioretention, vegetated biofilters,
and, in some cases, dry-extended detention basins have shown the ability to
reduce runoff volumes via infiltration and/or evapotranspiration losses. These
factors should also be considered in BMP selection.
As part of the data analysis, the authors also compared the conclusions based on
International Stormwater BMP Database to previous findings reported by others such as
Pitt (2004) and Schueler and Holland (2000). A few representative excerpts from
previous findings include:
A natural outcome of discussions after examining microorganism levels in urban
waters focuses on their potential control. Unfortunately, there does not appear to
be an easy (inexpensive) solution to reduce the often-times very high indicator
bacteria levels found in stormwater…The most basic control program would
At Press for Publication in Stormwater Magazine May/June 2008
12
incorporate the required inappropriate discharge detection and elimination
program…included in the NPDES stormwater permit program, and dog feces
controls. These can be highly effective and of low to moderate (or higher) cost…
Dog feces control programs are a basic public health and aesthetic benefit and
should also be implemented (including enforcement)…the remaining indicator
bacteria, although possibly still quite high in comparison to the current criteria,
would indicate minimal risks, as they should mostly originate from urban
wildlife…In order to reduce the bacteria levels to criteria levels, much more
costly control programs will be needed. These should only be implemented after a
local risk-assessment is conducted and actual human health impairments are
identified (Pitt 2004).
Typical concentrations of bacteria (whether measured as E. coli or fecal
coliform) in urban stormwater are often two orders of magnitude greater than
instream primary contact recreational standards. Even when urban stormwater
concentrations are significantly reduced through treatment by BMPs, the
concentrations in effluent typically remain an order of magnitude greater than the
instream standard during wet weather conditions (Schueler and Holland 2000).
Concentrations of bacteria in urban stormwater are notoriously variable on a
site-specific basis, even for similar land use types and even at the same sampling
location. Due to the wide variability of bacterial data, it is difficult to make
accurate estimates of expected pollutant loading and pollutant removal that are
transferable from site-to-site with any degree of confidence. Even with the
significant variability, all of the databases and literature sources agree that
bacteria concentrations in untreated urban stormwater are very high (estimates
range from 15,000/100 mL to over 50,000/100 mL for fecal coliform) and difficult
to reduce to instream standards (Schueler and Holland 2000).
Conclusions and Recommendations for Future Work
The International Stormwater BMP Database provides a relatively large and growing
bacterial data set that is useful in evaluating the effectiveness of various structural BMPs
with regard to bacteria removal. Media filters and retention ponds were most effective
based on the current data set; however, effluent concentrations for these BMPs remained
above primary contact recreation standards in many cases. Although several BMP types
such as extended detention basins and grass swales did not appear to be effective at
reducing bacteria concentrations, these BMPs can be effective at removing other
pollutants such as TSS and total metals and may help to reduce runoff volumes and
frequencies (thereby reducing bacteria loading). The bacteria-related findings reinforce
earlier research by investigators such as Pitt (2004) and Schueler and Holland (2000).
Recommendations for additional research include:
Analysis of site specific conditions at BMP studies may help to identify factors
such as exposure to sunlight, meteorological conditions, natural (non-human)
contributions of bacteria associated with the BMP, and other factors that help to
At Press for Publication in Stormwater Magazine May/June 2008
13
explain why some BMPs perform better than others. A more refined level of
statistical analysis may also be valuable (e.g., hypothesis testing to determine
statistically significant differences between influent and effluent concentrations,
along with other techniques).
Continued submittal of bacteria monitoring data for BMPs to the International
Stormwater BMP Database is needed to continue to refine these findings and
enable more statistically robust conclusions. Even though the overall number of
paired storm events is fairly large, the number of studies per BMP category
remains relatively small, as does the number of storm events monitored for some
BMP studies.
Continued national data-based dialogue regarding bacteria levels in stormwater
runoff relative to instream recreational water quality criteria is needed, in keeping
with USEPA’s Pellston-style workshop on revising recreational water quality
criteria (USEPA 2007) that acknowledges that many unanswered questions exist
regarding recreational standards for bacteria. Near-term “critical path” research
identified as part of the USEPA (2007) workshop includes addressing issues such
as the significance of natural versus human-induced sources of bacteria,
determination of acceptable risk levels, and other factors.
Development of cost-benefit data for stormwater BMPs relative to bacteria
reduction for municipal stormwater managers is important. Most local
governments need this type of information for decision-making when
determining how to best allocate limited resources.
References
American Water Works Association Research Foundation and U.S. Environmental
Protection Agency (AWWARF and USEPA). 2006. Development of Event-
Based Pathogen Monitoring Strategies for Watersheds. IWA Publishers.
Bossong, C., Stevens, M., Doerfer, J. and B. Glass. 2005. Summary and Evaluation of
the Quality of Stormwater in Denver, Colorado, Water Years 1998-2001 (U.S.
Geological Survey Scientific Investigations Report 2005-5150.
(http://pubs.usgs.gov/sir/2005/5150/).
California State Water Resources Control Board (CSWRCB). 2006. Storm Water Panel
Recommendations to the California State Water Resources Control Board: The
Feasibility of Numeric Effluent Limits Applicable to Discharges of Storm Water
Associated with Municipal, Industrial and Construction Activities. June 19.
(http://www.cacoastkeeper.org/stormwater-pollution.php)
Geosyntec Consultants and Wright Water Engineers. 2007. Analysis of Treatment
System Performance, International Stormwater BMP Database (1999-2006).
(www.bmpdatabase.org)
At Press for Publication in Stormwater Magazine May/June 2008
14
Pitt, R. 2004. Control of Microorganisms in Urban Waters.
(http://unix.eng.ua.edu/~rpitt/Class/ExperimentalDesignFieldSampling/MainEDF
S.html).
Pitt, R., Maestre, A. and R. Morquecho. 2008. National Stormwater Quality Database,
Version 3. February. (unix.eng.ua.edu/~rpitt/Research/ms4/Table%20NSQD%20v3%20Feb%2003,%202008.xls).
Schueler, T and H. Holland. 2000. “Microbes and Urban Watersheds: Concentrations,
Sources and Pathways,” The Practice of Watershed Protection. The Center for
Watershed Protection: Ellicott City, MD.
Schueler, T and H. Holland. 2000. “Microbes in Urban Watersheds: Implications for
Watershed Managers” in The Practice of Watershed Protection. The Center for
Watershed Protection: Ellicott City, MD.
Urban Drainage and Flood Control District (UDFCD). 1999. Volume 3 – Best
Management Practices, Urban Storm Drainage Criteria Manual (latest revision),
Urban Drainage and Flood Control District, Denver, Colorado.
(www.udfcd.org/downloads/down_critmanual.htm )
U.S. Environmental Protection Agency (USEPA). 2007. Report of the Experts Scientific
Workshop on Critical Research Needs for the Development of New or Revised
Recreational Water Criteria, March 26-30, 2007. EPA 823-R-07-006.
(http://www.epa.gov/waterscience/criteria/recreation/).