can urine glucose substitute for fingerstick glucose in diabetes care
DESCRIPTION
CAN URINE GLUCOSE SUBSTITUTE FOR FINGERSTICK GLUCOSE IN DIABETES CARE. By Anil K. Mandal, MB, BS, Fulbright Scholar Consultant in Nephrology Courtesy Clinical Professor of Medicine, University of Florida, Gainesville, Florida - PowerPoint PPT PresentationTRANSCRIPT
1
CAN URINE GLUCOSE SUBSTITUTE FOR FINGERSTICK GLUCOSE IN
DIABETES CAREBy Anil K. Mandal, MB, BS,Fulbright Scholar
Consultant in NephrologyCourtesy Clinical Professor of
Medicine, University of Florida, Gainesville, Florida
Adjunct Professor of Pathology and Laboratory Medicine,
University of North Carolina at Chapel Hill, USA
Mandal Diabetes Research Foundation
tax-exempt charitable organization
St. Augustine, Florida, USANEPHRO – 2014VALENCIA, SPAINJUNE 25-28, 2014[1]
BACKGROUND1. The usefulness of urinary glucose
measurements in the management of diabetes depends on its accuracy in reflecting the blood glucose concentration.
2. Overnight, changes in blood glucose concentration occur more slowly, but because of the longer time between bladder voiding they are not so accurately reflected by urinary glucose concentrations.
[2]
BACKGROUND (CONT.)
3. The urine glucose may be related to the height of the post prandial blood glucose the evening before or to the rising blood glucose in the later hours of the night in patients in whom insulin activity does not completely cover 24 hours
4. It is therefore difficult to interpret the urine glucose concentration on the first voided morning specimen unless it is 0%
[3]
BACKGROUND (CONT.)
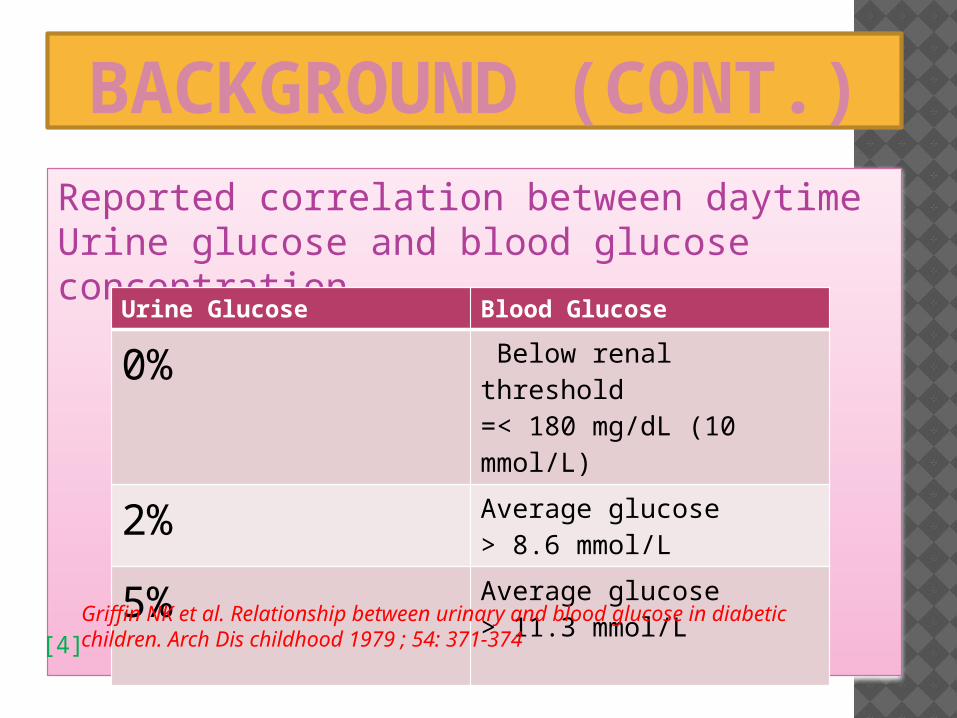
Reported correlation between daytime Urine glucose and blood glucose concentration
Urine Glucose Blood Glucose
0% Below renal threshold=< 180 mg/dL (10 mmol/L)
2% Average glucose > 8.6 mmol/L
5% Average glucose> 11.3 mmol/L
Griffin NK et al. Relationship between urinary and blood glucose in diabetic children. Arch Dis childhood 1979 ; 54: 371-374 [4]
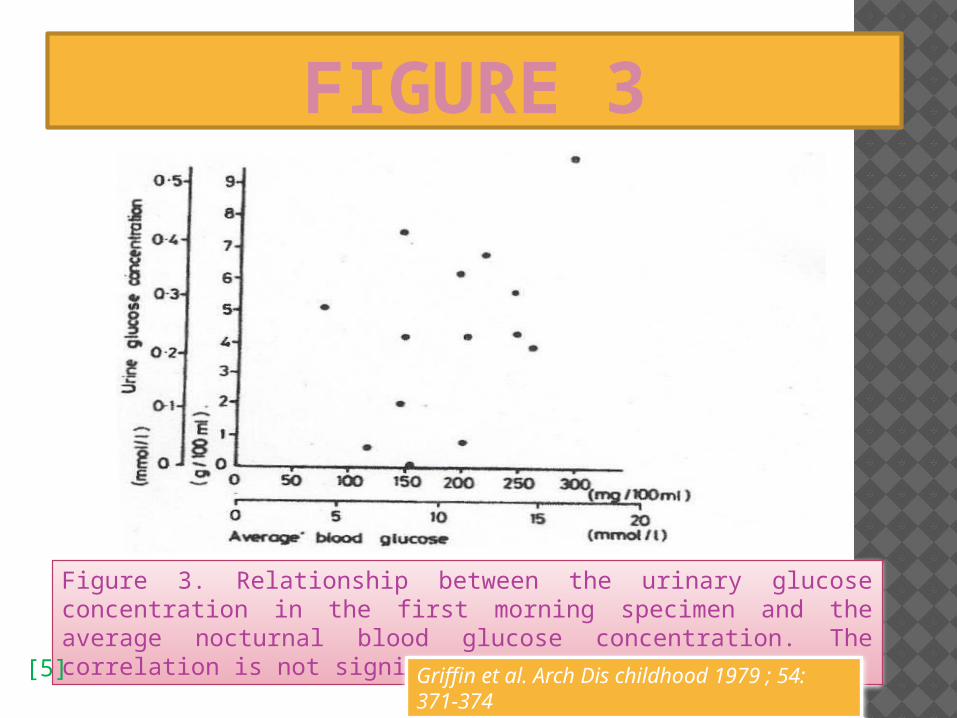
FIGURE 3
Figure 3. Relationship between the urinary glucose concentration in the first morning specimen and the average nocturnal blood glucose concentration. The correlation is not significant
Griffin et al. Arch Dis childhood 1979 ; 54: 371-374
[5]

FIGURE 4 & 5
Figure 4. Relationship between the urinary glucose concentration and the corresponding “average “ daytime blood glucose concentration ( P <0.001)
Griffin et al. Arch Dis childhood 1979 ; 54: 371-374
Figure 5: Relationship between the total urinary loss and the corresponding average daytime blood glucose concentration ( P < 0.001
[6]
RATIONALE OF URINE GLUCOSE STUDY
1. National Statistics indicate that only 17% of diabetes patients treated by insulin injection.
2. Thus, large number of diabetes live with uncontrolled fasting blood glucose (FBG) or 2h post prandial blood glucose (2-hPPG)
3. The result is unhealed foot ulcer or gangrene and amputation or end stage renal disease and dialysis.
4. It is important that we try hard to reduce diabetic complications.
[7]
RATIONALE OF URINE GLUCOSE STUDY (CONT
1. An essential component of glycemic control is to take insulin injection before each meal and sometimes at bedtime (Frederick Banting, Nobel Prize
Speech, Sept. 15, 1925, Stockholm) 2. Insulin dose to be adjusted upward or
downward by performing at home fingerstick to obtain blood glucose levels before and after each meal.
3. Performing fingersticks repeatedly are discomforting for patients.
[8]
PURPOSE OF THIS STUDY
1. Reduce the number of fingersticks to ameliorate patient discomfort.
2. Test Urine for glucose levels in lieu of fingerstick glucose to determine blood glucose level and adjust insulin dosage.
3. Hence to increase cooperation from more patients to take insulin injection.
[9]
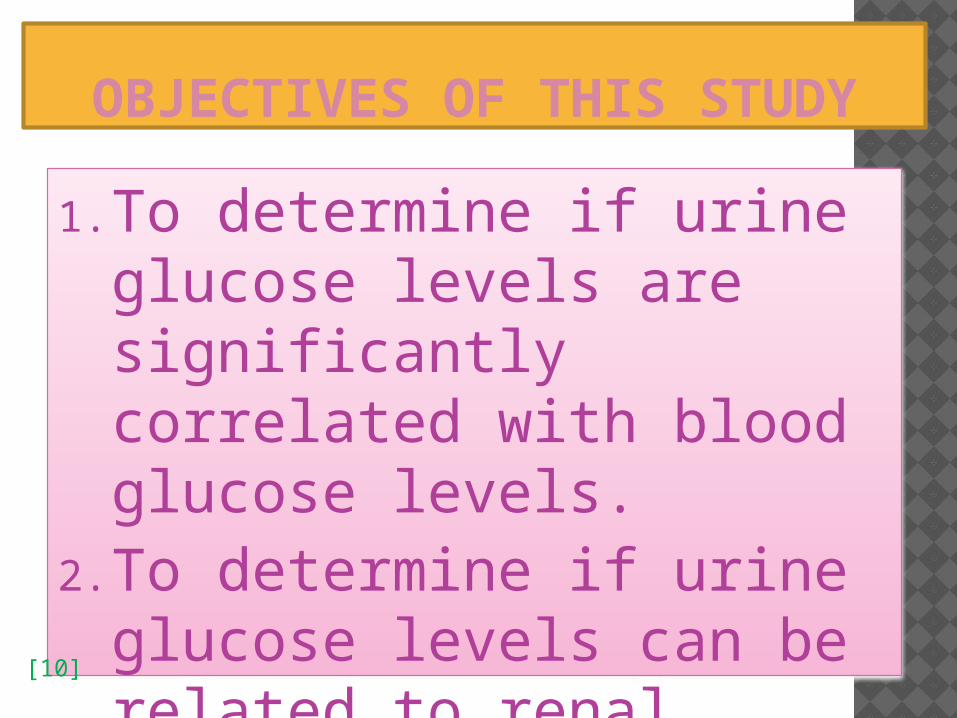
OBJECTIVES OF THIS STUDY
1. To determine if urine glucose levels are significantly correlated with blood glucose levels.
2. To determine if urine glucose levels can be related to renal function changes.
[10]
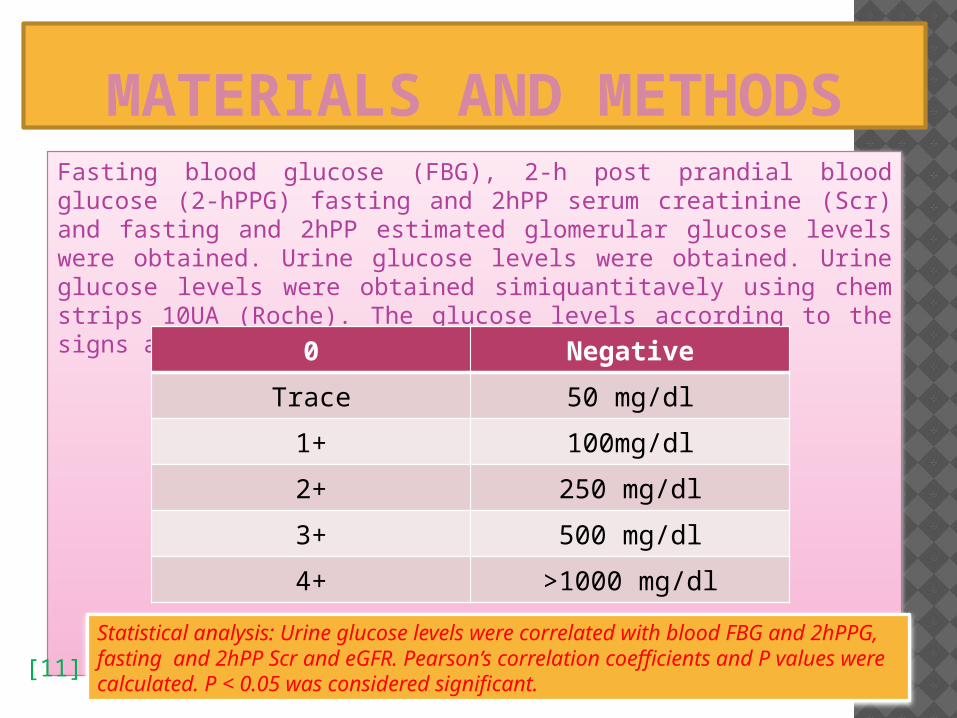
MATERIALS AND METHODSFasting blood glucose (FBG), 2-h post prandial blood glucose (2-hPPG) fasting and 2hPP serum creatinine (Scr) and fasting and 2hPP estimated glomerular glucose levels were obtained. Urine glucose levels were obtained. Urine glucose levels were obtained simiquantitavely using chem strips 10UA (Roche). The glucose levels according to the signs are as follows:
0 Negative
Trace 50 mg/dl
1+ 100mg/dl
2+ 250 mg/dl
3+ 500 mg/dl
4+ >1000 mg/dl
Statistical analysis: Urine glucose levels were correlated with blood FBG and 2hPPG, fasting and 2hPP Scr and eGFR. Pearson’s correlation coefficients and P values were calculated. P < 0.05 was considered significant.
[11]
RESULTS
• two-tailed paired test• Number of matched values
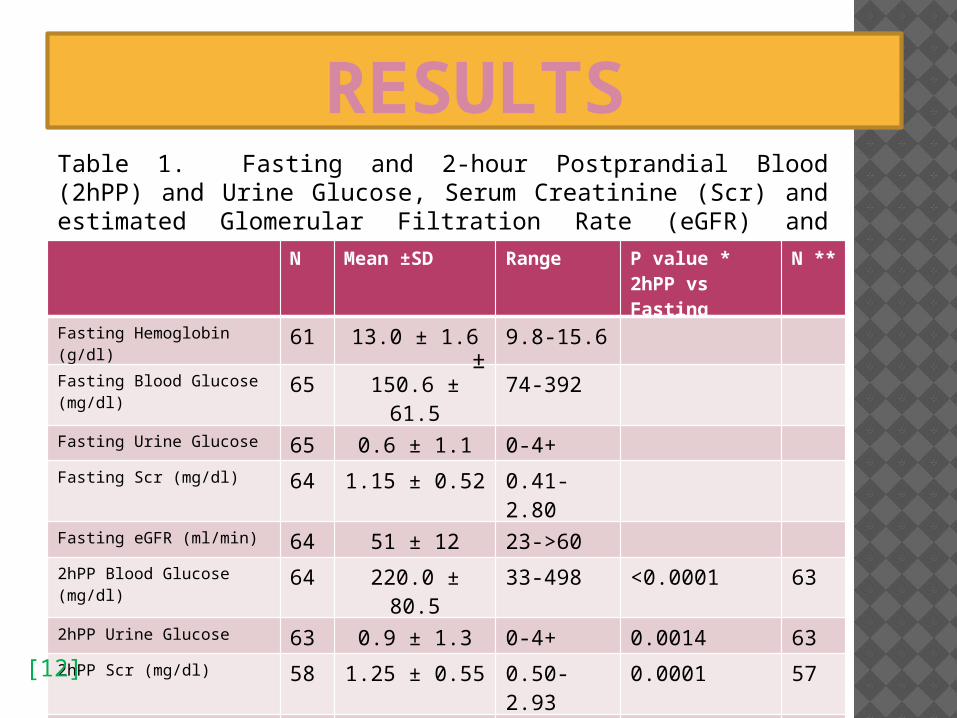
Table 1. Fasting and 2-hour Postprandial Blood (2hPP) and Urine Glucose, Serum Creatinine (Scr) and estimated Glomerular Filtration Rate (eGFR) and Hemoglobin Levels in Diabetic Patients in this studyN Mean ±SD Range P value *
2hPP vs Fasting
N **
Fasting Hemoglobin (g/dl) 61 13.0 ± 1.6 9.8-15.6
Fasting Blood Glucose (mg/dl)
65 150.6 ± 61.5 74-392
Fasting Urine Glucose 65 0.6 ± 1.1 0-4+
Fasting Scr (mg/dl) 64 1.15 ± 0.52 0.41-2.80
Fasting eGFR (ml/min) 64 51 ± 12 23->60
2hPP Blood Glucose (mg/dl)
64 220.0 ± 80.5 33-498 <0.0001 63
2hPP Urine Glucose 63 0.9 ± 1.3 0-4+ 0.0014 63
2hPP Scr (mg/dl) 58 1.25 ± 0.55 0.50-2.93 0.0001 57
2hPP eGFR 58 48 ± 13 22->60 0.0006 57
±
[12]
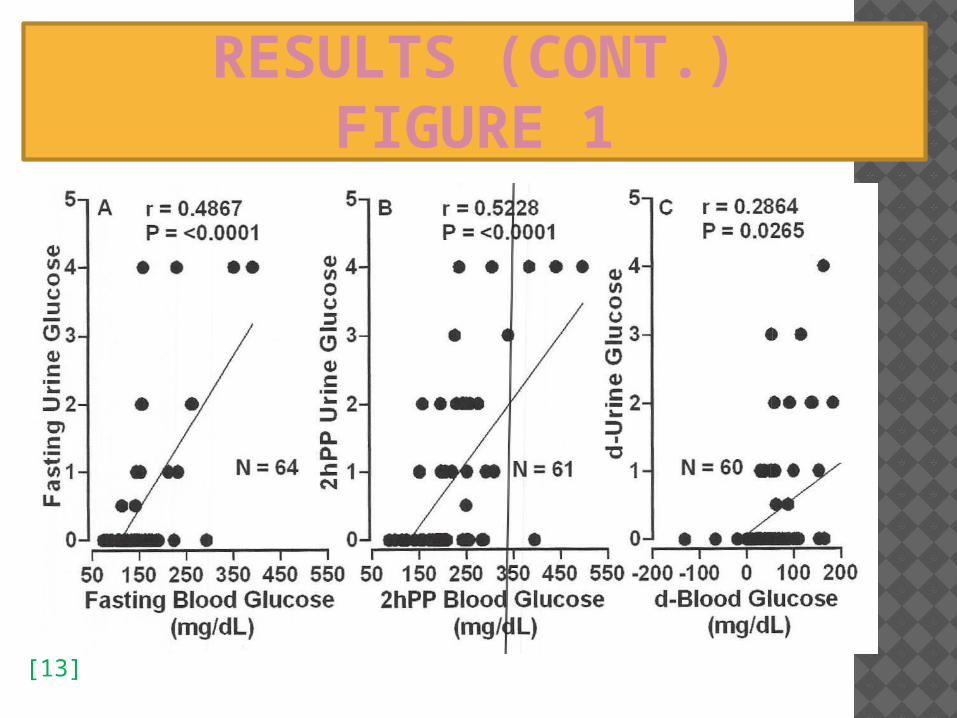
RESULTS (CONT.)FIGURE 1
[13]

FIGURE 2
[14]
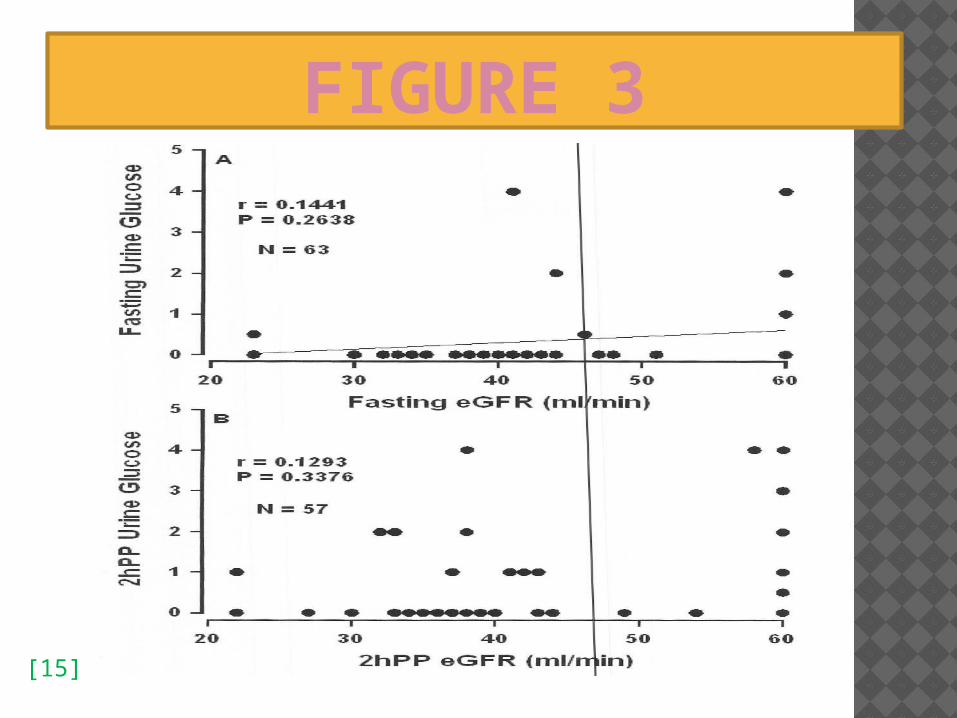
FIGURE 3
[15]
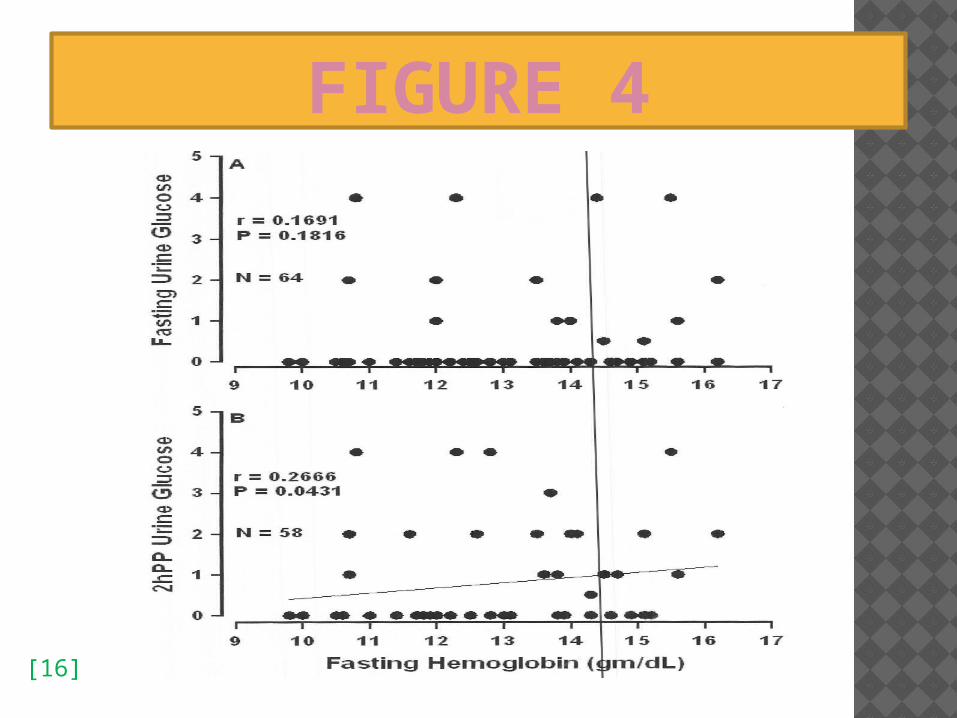
FIGURE 4
[16]
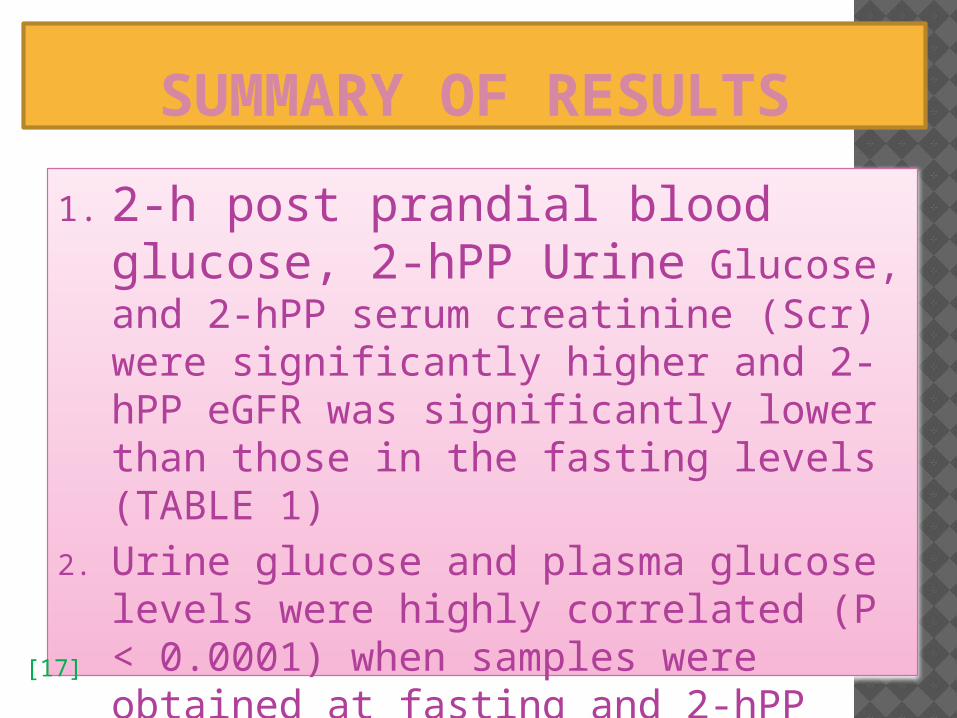
SUMMARY OF RESULTS
1. 2-h post prandial blood glucose, 2-hPP Urine Glucose, and 2-hPP serum creatinine (Scr) were significantly higher and 2-hPP eGFR was significantly lower than those in the fasting levels (TABLE 1)
2. Urine glucose and plasma glucose levels were highly correlated (P < 0.0001) when samples were obtained at fasting and 2-hPP periods (FIGURE 1)[17]
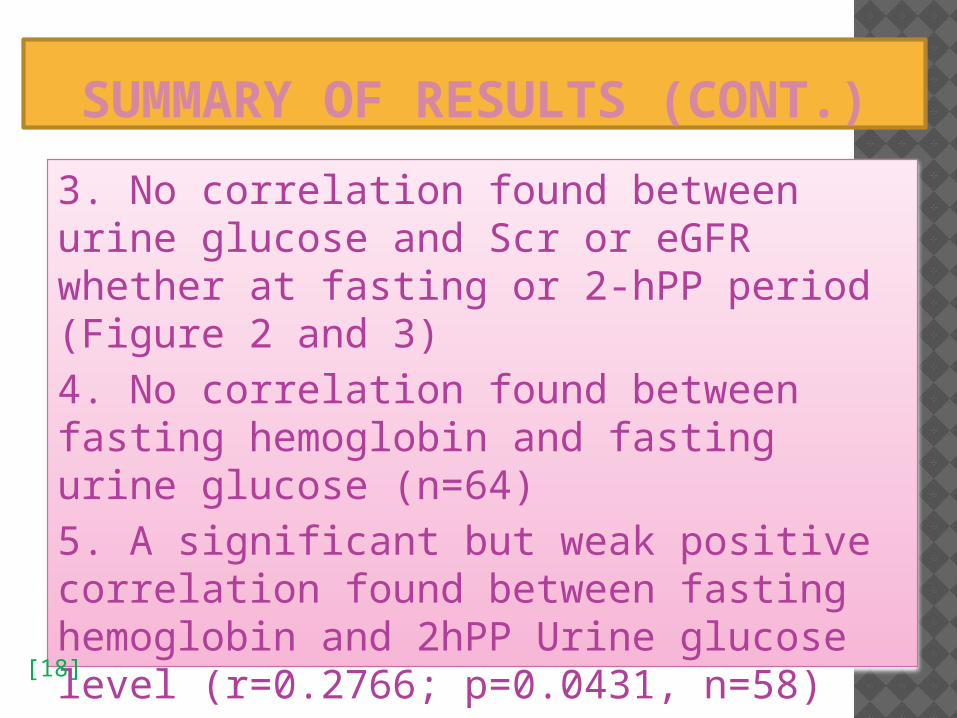
SUMMARY OF RESULTS (CONT.)
3. No correlation found between urine glucose and Scr or eGFR whether at fasting or 2-hPP period (Figure 2 and 3)4. No correlation found between fasting hemoglobin and fasting urine glucose (n=64)5. A significant but weak positive correlation found between fasting hemoglobin and 2hPP Urine glucose level (r=0.2766; p=0.0431, n=58)6. Renal function has no significant effect on urine glucose in the fasting or 2hPP period.
[18]

PEARL OF WISDOM1. Urine glucose is highly correlated to blood
glucose levels at fasting and 2-hPP periods. Dglucose (2hPP-FBG) is also related to D Urine Glucose (2hPP-F)
2. Thus, negative or 1+ urine glucose is associated with blood glucose of less than 150mg/dL ( < 8.3 mmol/L) hence not requiring adjustment of insulin dosage.
3. Urine glucose of 2+ to 4+ indicates uncontrolled hyperglycemia, with FBG or 2hPPG > 200mg/dl (> 11.1 mmol/L) hence requiring fingersticks blood glucose to adjust insulin dosage.
[19]
PEARL OF WISDOM (CONT)
4. Thus, our observation reinforces previous studies on Urine glucose.5. Urine glucose levels are independent of renal function changes. (New finding)6. Thus, our study can be considered as one step forward in reducing the number of fingersticks but not eliminating the practice of fingersticks.
[20]

21
THANK YOU
The practice of medicine is an art of observation and not all science.