canada’s marine coasts in a changing climate – chapter 2 ... · chapter 2 | dynamic coasts in a...
TRANSCRIPT

Chapter 2 | DYNAMIC COASTS IN A CHANGING CLIMATE 27
CHAPTER 2: DYNAMIC COASTS IN A CHANGING CLIMATE
Lead Authors: David E. Atkinson (University of Victoria), Donald L. Forbes (Natural Resources Canada) and Thomas S. James (Natural Resources Canada)
Contributing Authors:Nicole J. Couture (Natural Resources Canada) and Gavin K. Manson (Natural Resources Canada)
Recommended Citation:Atkinson, D.E., Forbes, D.L. and James, T.S. (2016): Dynamic coasts in a changing climate; in Canada’s Marine Coasts in a Changing Climate, (ed.) D.S. Lemmen, F.J. Warren, T.S. James and C.S.L. Mercer Clarke; Government of Canada, Ottawa, ON, p. 27-68.

CANADA’S MARINE COASTS in a CHANGING CLIMATE 28
TABLE OF CONTENTS
1 INTRODUCTION 29
2 COASTAL VARIABILITY 292.1 GEOLOGICAL SETTING 302.2 COASTAL PROCESSES 33
2.2.1 EROSION AND SHORELINE RETREAT 35
2.2.2 CONTROLS ON RATES OF COASTAL CHANGE 36
3 CHANGING CLIMATE 383.1 DRIVERS OF CHANGE 383.2 CLIMATE VARIABILITY AND CHANGE 403.3 CLIMATE DETERMINANTS 413.4 TRENDS AND PROJECTIONS 42
3.4.1 TRENDS 42
3.4.2 PROJECTIONS 43
3.5 STORMS AND SEA ICE 433.5.1 STORMS 43
3.5.2 SEA ICE 44
3.5.3 CHANGES IN STORM ACTIVITY 45
4 CHANGING SEA LEVEL 464.1 HISTORICAL SEA-LEVEL CHANGE 464.2 FUTURE SEA-LEVEL CHANGE 48
4.2.1 GLOBAL SEA-LEVEL RISE 48
4.2.2 VERTICAL LAND MOTION 50
4.2.3 EFFECTS OF PRESENT-DAY ICE-MASS CHANGE 51
4.2.4 REGIONAL OCEANOGRAPHIC EFFECTS 51
4.3 PROJECTIONS OF SEA-LEVEL CHANGE IN CANADA 514.3.1 PROJECTIONS OF RELATIVE
SEA-LEVEL CHANGE 51
4.3.2 EXTREME WATER LEVELS 52
4.3.3 SEA-LEVEL PROJECTIONS BEYOND 2100 54
5 COASTAL RESPONSE TO SEA-LEVEL RISE AND CLIMATE CHANGE 54
5.1 PHYSICAL RESPONSE 545.2 ECOLOGICAL RESPONSE 57
5.2.1 COASTAL SQUEEZE 57
5.2.2 COASTAL DUNES 57
5.2.3 COASTAL WETLANDS, TIDAL FLATS AND SHALLOW COASTAL WATERS 59
5.3 VISUALIZATION OF COASTAL FLOODING 60
6 SUMMARY AND SYNTHESIS 60
7 REFERENCES 62

Chapter 2 | DYNAMIC COASTS IN A CHANGING CLIMATE 29
1 INTRODUCTIONThis chapter focuses on the dynamic nature of Canada’s
marine coast and the environmental drivers of coastal change in a changing climate. An understanding of how changing climate affects coastal stability, and the nature of the coastal response, provides a basis for assessing potential changes in coastal hazards and the implications for human communities and infrastructure. Whereas the effects of climate change on sea level are widely understood (IPCC, 2013), the secondary effects of sea-level change on coasts continue to challenge our understanding and management practices (Davidson-Arnott, 2005; FitzGerald et al., 2008; Wolinsky, 2009; Wolinsky and Murray, 2009; Wong et al., 2014; Woodroffe et al., 2014). Other aspects of climate change have significant impact on coasts, including changes in storminess, storm surge and wave climate; changing seawater properties, including temperature and pH; and the changing nature, duration and dynamics of sea ice.
The chapter begins with an overview of the diversity and dynamic nature of Canada’s marine coasts (Figure 1). Following this is an overview of changing coastal climates, including past and projected future changes in temperature, precipitation, storminess and associated weather events that drive coastal change. It then provides a summary of past trends in sea level and the latest projections of future changes in mean sea level in Canada, and concludes with the implications of a changing climate, including changes in mean and extreme water levels, for the physical state and ecological integrity of the coast.
Although this chapter focuses on the physical environment of coasts, the effects of climate change are much broader in scope, touching ecosystem sustainability, renewable resources, food security, health and well-being, energy, economic prosperity, cultural integrity and other facets of these social-ecological systems. These topics are discussed in subsequent chapters of this report (see Chapters 3–6).
2 COASTAL VARIABILITYCanada has not only the world’s longest coastline (about
243 000 km; Taylor et al., 2014), but arguably one of the most diverse. All provinces and territories, except Alberta and Saskatchewan, have marine coasts. These range from high- energy rock headlands of southern Newfoundland to very low energy, ice-locked, sedimentary coasts in the northwestern Canadian Arctic Archipelago. They include deeply indented fiord topography, cliffs cut in bedrock or glacial/proglacial deposits, beaches, spits and barrier islands, dunes, salt marshes and tidal flats, ice-rich permafrost coasts, and large deltas such as those at the mouth of the Fraser River in British Columbia and the Mackenzie River in the western Arctic. Canada’s coasts are affected by tides that range from negligible to the world’s highest (in the Bay of Fundy and Ungava Bay). Exposure to wave energy ranges from very low, in well protected settings, to very high, in settings with full Atlantic or Pacific ocean exposure. Variability in coastal geomorphology and processes is high within and between all regions considered in this report (see Chapters 4–6).
Sea-level changes in Canada are driven only in part by trends in global mean sea level. Locally, significant variation from the global mean trend can arise from several factors. Among the most important of these is vertical crustal motion, which results in trends in relative sea level varying widely across Canada, from rapid fall in parts of the central Arctic to accelerating rise in the Maritimes. This and other factors influencing local sea-level change are discussed in detail in Section 4 of this chapter.
The importance of sea ice also varies significantly along Canada’s marine coasts. In the Arctic, sea ice effectively shuts down or severely constrains coastal dynamics for much of the year, and limits open-water fetch in the summer. Most parts of the east coast are exposed to sea ice on an annual basis, with effects that range from substantial to negligible. On the west coast, thin ice occurs only rarely in protected waters. In all areas where sea ice occurs, it can play an important role in sediment transport, shore-zone morphology and ice-related hazards (Forbes and Taylor, 1994). Climate warming has already affected mean dates of breakup and freeze-up of sea ice and the length of the open-water season (Stammerjohn et al., 2012; Stroeve et al., 2012), with important implications for coastal exposure to storm waves and surges (Vermaire et al., 2013). Reduction of sea ice is an important concern for ice- dependent ecological and human systems (e.g., Gaston et al., 2012; Laidre et al., 2012; Stirling and Derocher, 2012).
FIGURE 1: Canada’s marine coasts, broadly delineating the three regions discussed in this report.

CANADA’S MARINE COASTS in a CHANGING CLIMATE 30
Storm climatology (e.g., storm characteristics, severity, seasonal frequency, track mode and variance) varies between Atlantic, Arctic and Pacific coasts (e.g., Wang et al., 2006), and around the Arctic basin (Atkinson, 2005). The Atlantic coast experiences the full range of extra-tropical and tropical cyclonic storm systems, as well as rapidly evolving ‘tropical transition events’ (storms in the process of evolving from tropical to extra-tropical cyclones). All of these storm types have implications for coastal stability and hazards (Forbes et al., 2004; Parkes et al., 2006). The Pacific coast experiences large, mature extra-tropical storm systems that often stall when encountering the Coast Mountains, creating the potential for prolonged impact. Northern Canada experi-ences storms moving into the region, rather than forming in place. The most prominent track is from the southeast (Labrador Sea northward to Baffin Island, NU), with a major secondary track coming from the west through the Beaufort Sea (Maxwell, 1981, 1982).
2.1 GEOLOGICAL SETTINGThe legacy of past glaciation is apparent almost
everywhere in Canada, influencing the evolution and morphology of the coast (Forbes, 2011) and differentiating Canada’s coast from much of the coastline of the United States mainland to the south. Large fiords, the product of glacial erosion, dominate the coasts of British Columbia, parts of Newfoundland and Labrador, and the eastern islands of the Canadian Arctic Archipelago (Figure 2). Stiff glacial deposits such as clay-rich till are somewhat resistant to erosion and can form high bluffs, but are ultimately consumed through a combination of basal wave attack and subaerial slope erosion (erosion processes such as freeze-thaw, slope
wash and slumping; Manson, 2002; Forbes, 2011). Active glaciation in the Coast Mountains, BC, St. Elias Mountains, YT, and the eastern Arctic continues to feed outwash sedi-ments to the ocean (Forbes, 2011). The extent of floating ice shelves along the north coast of Ellesmere Island, NU, has decreased precipitously in recent years, but some portion of the ice front remains (see Chapter 5; Mueller et al., 2003; Copland et al., 2007).
The effects of the last continental glaciation are also paramount in determining the direction and rate of sea-level change in Canada, which is a primary control on coastal evolution. In regions such as Hudson Bay, where the greatest amount of isostatic depression of the Earth’s crust by conti-nental ice sheets occurred during the Last Glacial Maximum (20–25 thousand years ago), glacial isostatic uplift is ongoing, local sea level is falling and the coast is emerging. Where coastal emergence has been ongoing for thousands of years, abandoned shorelines are delineated by successions of uplifted beaches (Figure 3; St-Hilaire-Gravel et al., 2010) and coastal communities in these regions face progressive shallowing of their marine approaches (Forbes et al., 2014a), which can be as problematic as local sea-level rise.
In areas marginal to the former continental ice sheet, the postglacial response is regional subsidence, such that former shorelines are now submerged below sea level (Figure 4; Shaw et al., 2002). These submergent coasts can be recognized by bays and estuaries created through the gradual inundation of river valleys, and by spits and barrier beaches formed across the mouths of these bays (Figure 5). The past coastal response to rising sea level in these areas, often characterized by shoreline retreat, provides a guide to the implications of accelerated sea-level rise as a result of climate change (Orford
FIGURE 2: Tingin Fiord, Baffin Island, NU, showing a classic U-shaped cross profile with vertical rock walls, outwash sandur (delta) in the fiord head (head of right arm in centre top of image), ice fields persisting on plateaus and suspended sediment plume from local glacial runoff on far side of left arm. Photo courtesy of D.L. Forbes, Natural Resources Canada, July 2008.
FIGURE 3: Raised beaches on Lowther Island, Viscount Melville Sound, NU, record land emergence and variable wave and ice forcing over the past 6000 years (St-Hilaire-Gravel et al., 2010). Photo courtesy of D.L. Forbes, Natural Resources Canada, August 2009.

Chapter 2 | DYNAMIC COASTS IN A CHANGING CLIMATE 31
et al., 2001). On the west coast, vertical land motion results from a combination of glacial isostatic adjustment to the former Cordilleran ice sheet and tectonics (James et al., 2000; Clague and James, 2002; Shugar et al., 2014). Present-day ice mass changes in the Coast Mountains and Gulf of Alaska, and sediment compaction on the Fraser River delta (Mazzotti et al., 2009), also play a role.
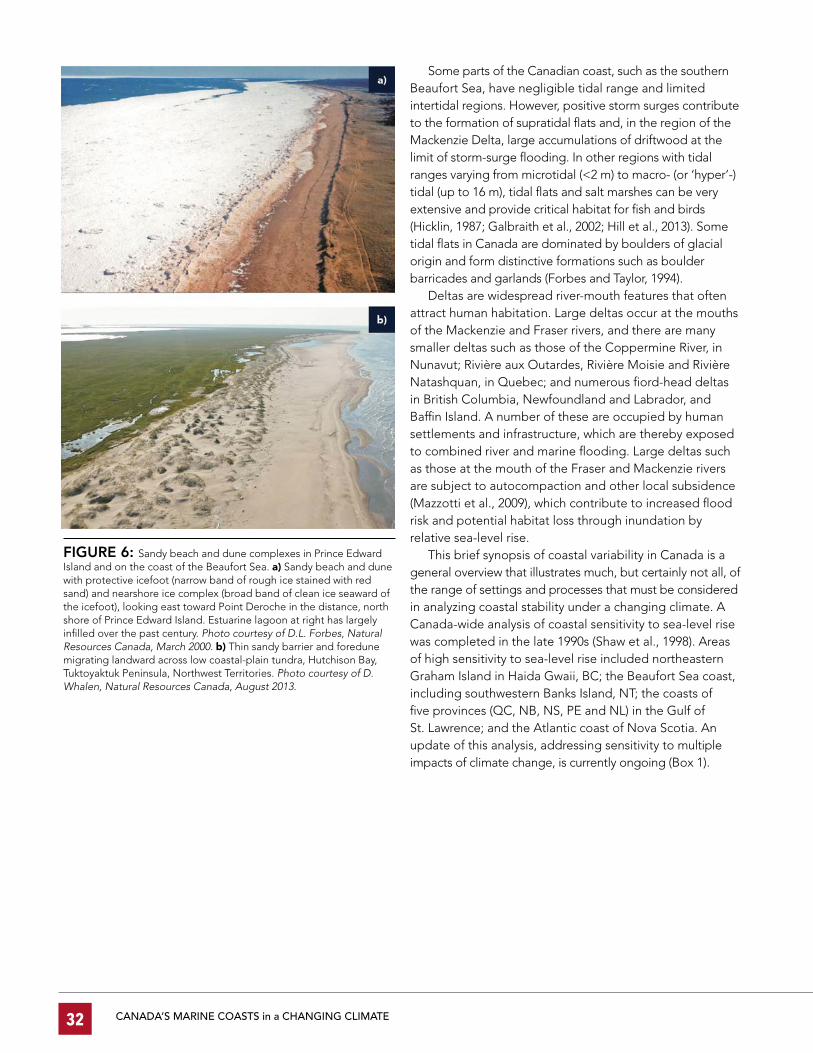
Coastal reworking of glacial sediments is widespread along much of the coast of Eastern Canada and the nature of the sediments influences the result of this reworking (Forbes, 2011). Gravel and mixed sand-gravel beaches and barriers predominate in this region, except in the southern Gulf of St. Lawrence, where sand-rich glacial deposits, derived from soft sedimentary rocks, support the development of exten-sive sandy barriers with large dunes (Figure 6a; McCann, 1980; Forbes et al., 2004, 2014b). The coast of the Tuktoyak-tuk Peninsula, in the western Canadian Arctic, is formed in a region with extensive Pleistocene sand deposits and charac-terized by widespread thin sandy barriers migrating landward across a low-relief coastal plain (Figure 6b; Hill et al., 1994; Forbes et al., 2014b). Apart from these regions, sand beaches and barriers, though not uncommon, are localized and associated with specific sources or sinks of sand.
In regions with more resistant bedrock, glacial deposits tend to be dominated by pebbles, cobbles and boulders, leading to the development of gravel-dominated beaches and barriers (Forbes and Syvitski, 1994); these are typically connected to local sediment sources of glacial or proglacial origin. Rising sea levels encountering glacial deposits typically result in the erosion of cliffs that serve as the sediment source for nearby gravel (or shingle) beaches, spits and short barriers (Forbes, 2011); these tend to exhibit high temporal variability in rates of retreat (Orford et al., 2001), posing a challenge for prediction of coastal changes and for sustaining nearshore land use.
North Rustico
BrackleyBeach
FIGURE 5: Inner shelf bathymetry (colour shaded relief) and coastal topography (grey-scale shaded relief) for the central north shore of Prince Edward Island, showing river valleys inundated by rising relative sea level over the past 8000 years (red outline shows present-day shoreline). Spits and barrier beaches with dunes (e.g., Brackley Beach, Blooming Point) extend across the seaward margins of the estuaries (e.g., Rustico Bay, Covehead Bay, Tracadie Bay) (Forbes et al., 2014b).
FIGURE 4: Paleogeography of Atlantic Canada 9000 years ago (from Figure 9 of Shaw et al., 2002). Note islands on Georges Bank (lower left), Sable Island Bank, Banquereau and Grand Bank (right), and the large island surrounding the present-day Îles-de-la-Made-leine. Neither Prince Edward Island nor Cape Breton Island was an island at the time.
CANADA’S MARINE COASTS in a CHANGING CLIMATE 32
Some parts of the Canadian coast, such as the southern Beaufort Sea, have negligible tidal range and limited intertidal regions. However, positive storm surges contribute to the formation of supratidal flats and, in the region of the Mackenzie Delta, large accumulations of driftwood at the limit of storm-surge flooding. In other regions with tidal ranges varying from microtidal (<2 m) to macro- (or ‘hyper’-) tidal (up to 16 m), tidal flats and salt marshes can be very extensive and provide critical habitat for fish and birds (Hicklin, 1987; Galbraith et al., 2002; Hill et al., 2013). Some tidal flats in Canada are dominated by boulders of glacial origin and form distinctive formations such as boulder barricades and garlands (Forbes and Taylor, 1994).
Deltas are widespread river-mouth features that often attract human habitation. Large deltas occur at the mouths of the Mackenzie and Fraser rivers, and there are many smaller deltas such as those of the Coppermine River, in Nunavut; Rivière aux Outardes, Rivière Moisie and Rivière Natashquan, in Quebec; and numerous fiord-head deltas in British Columbia, Newfoundland and Labrador, and Baffin Island. A number of these are occupied by human settlements and infrastructure, which are thereby exposed to combined river and marine flooding. Large deltas such as those at the mouth of the Fraser and Mackenzie rivers are subject to autocompaction and other local subsidence (Mazzotti et al., 2009), which contribute to increased flood risk and potential habitat loss through inundation by relative sea-level rise.
This brief synopsis of coastal variability in Canada is a general overview that illustrates much, but certainly not all, of the range of settings and processes that must be considered in analyzing coastal stability under a changing climate. A Canada-wide analysis of coastal sensitivity to sea-level rise was completed in the late 1990s (Shaw et al., 1998). Areas of high sensitivity to sea-level rise included northeastern Graham Island in Haida Gwaii, BC; the Beaufort Sea coast, including southwestern Banks Island, NT; the coasts of five provinces (QC, NB, NS, PE and NL) in the Gulf of St. Lawrence; and the Atlantic coast of Nova Scotia. An update of this analysis, addressing sensitivity to multiple impacts of climate change, is currently ongoing (Box 1).
FIGURE 6: Sandy beach and dune complexes in Prince Edward Island and on the coast of the Beaufort Sea. a) Sandy beach and dune with protective icefoot (narrow band of rough ice stained with red sand) and nearshore ice complex (broad band of clean ice seaward of the icefoot), looking east toward Point Deroche in the distance, north shore of Prince Edward Island. Estuarine lagoon at right has largely infilled over the past century. Photo courtesy of D.L. Forbes, Natural Resources Canada, March 2000. b) Thin sandy barrier and foredune migrating landward across low coastal-plain tundra, Hutchison Bay, Tuktoyaktuk Peninsula, Northwest Territories. Photo courtesy of D. Whalen, Natural Resources Canada, August 2013.

Chapter 2 | DYNAMIC COASTS IN A CHANGING CLIMATE 33
BOX 1 CANCOAST: A TOOL FOR ASSESSING CLIMATE CHANGE SENSITIVITYCanCoast is a tool designed to help facilitate adaptation planning in coastal areas. An initiative of the Geological Survey of Canada (part of Natural Resources Canada), CanCoast is an ArcGIS-based geospatial database that enables coastal data to be collated, archived and analyzed. The geodatabase consists of a high-resolution marine shoreline vector developed from CanVec9 (http://geogratis.gc.ca/api/en/nrcan-rncan/ess-sst/-/%28urn:iso:series%29canvec) that serves as a base for grouping coastal attribute layers of physical features, materials and processes (such as geology and sea-level change). Once these widely varying attributes have been grouped on a common shoreline, analysis of coastal sensitivity to climate change is possible at varying spatial and temporal scales.
To date, a number of datasets from the Shaw et al. (1998) study of coastal sensitivity to sea-level change have been mapped onto the CanCoast shoreline. These include landforms, tidal range and wave height. Several additional layers have been updated or added, for instance:
� topographic relief is now based on the Canadian Digital Elevation Data (a raster representation of elevation values over all of Canada at 1 km spatial resolution),
� sea-level rise is based on projections of regional sea-level rise for 2050 for representative concentra-tion pathway RCP8.5 from the Fifth Assessment Report of the Intergovernmental Panel on Climate Change (IPCC) and
� ground ice conditions for coastal permafrost regions have been added based on the Canadian permafrost map (Heginbottom et al., 1995).
Further details on the various layers in the CanCoast geodatabase are available in Couture and Manson (2016). Using these layers, a new index of sensitivity to climate change, incorporating both inundation and erosion data has been developed (Figure 7). Prospec-tive applications for CanCoast include hazard mapping and mitigation, adaptation planning impact assessment and analysis of knowledge gaps.
FIGURE 7: Preliminary map of coastal sensitivity to climate change in Canada developed using the CanCoast database. Sensitivity is based on present-day coastal materials, landforms, relief, ground ice, wave height and tidal range, as well as recent trends in total sea-ice concentration and projected changes in sea level to 2050 (Couture and Manson, 2016). Note that some quite sensitive areas (e.g., the Fraser River delta) are not clearly visible at the resolution shown here.
2.2 COASTAL PROCESSESAt the interface between land and sea, the detailed
configuration of the shore zone is constantly changing. Shoaling waves rework the bottom across the shore face and nearshore profile. Waves approaching the coast at an angle create longshore currents that carry sediment along the coast and the large-scale dynamics often create rhythmic features
at a variety of scales. These can range from beach cusps (with wavelengths from <10 m to >100 m) to large-scale variability in beach width, sometimes with shore-attached bars and ridges (wavelengths up to 10 km or more). This progressive reconfiguration of the shoreline is a natural system response to relatively steady conditions and is not related to a climate- driven trend in sea level, wind or waves (Box 2).

CANADA’S MARINE COASTS in a CHANGING CLIMATE 34
BOX 2 COASTAL SEDIMENT REWORKING, HAIDA GWAIIA spectacular example of progressive reconfiguration of the shoreline can be found on the northeastern coast of Graham Island, Haida Gwaii, BC. It is characterized by the presence of repetitive accretionary bulges (Inman, 1987), also known as large-scale longshore sand waves (Verhagen, 1989; Thevenot and Kraus, 1995) and associated shore -attached bars, with a wavelength of 6–9 km. These are superimposed on a retreating coast (1–3 m/year, up to 15 m or more in a single storm season), with sand reworked onshore, seaward onto the shore face and alongshore (Walker and Barrie, 2006). The longshore sand waves migrate alongshore to the northeast in response to dominant southeasterly storm winds and waves in Hecate Strait (Figure 8). The rhythmic morphology results from large-scale dynamics and feedback in the shore face circulation induced by southeasterly wave forcing at a high angle to the beach (Ashton et al., 2001). The beach waves store a large volume of sand and result from a systematic alongshore variation in the sediment transport rate. Sediment is deposited at the downstream terminus of each wave and a zone of enhanced erosion and re-entrainment exists at the start of the next expansion in beach width. In this way, Kumara Lake was breached and partially drained the last time the erosion zone (now 2 km down drift) passed through that location (Walker and Barrie, 2006).
FIGURE 8: a) Coastal progradation on northeastern Graham Island, Haida Gwaii, BC, over the past 3000 years (from Figure 8 of Wolfe et al., 2008). Purple circles outline advancing tips of longshore sand waves on the eroding eastern shore. Older dates are higher on the coast, indicating emergence due to glacial isostatic adjustment (Section 4.2). Black box shows location of image in part b. b) Large-scale sand waves with shore-attached bars migrating northward on East beach, with erosional hotspots at the distal ends (purple circles). Also visible are large parabolic dunes aligned parallel to the direction of the dominant winds from the southeast and the multiple beach ridges of North Beach, which record shoreline advance over the past 2000 years (Wolfe et al., 2008). Image source: Spot-3 multispectral and panchromatic imagery, 2007, from GeoBase®.
Chapter 2 | DYNAMIC COASTS IN A CHANGING CLIMATE 35
2.2.1 EROSION AND SHORELINE RETREATIt is a common misconception that the coast changes only
slowly. Although hard-rock coasts (such as the crystalline rocks of the Canadian Shield or the granite shores of Nova Scotia) are highly resistant to erosion and coastal retreat, sedimentary rocks are susceptible to erosion, particularly in areas such as Prince Edward Island, where the soft sandstone is quite friable (Forbes et al., 2004), or northern Foxe Basin, NU, where the flat-lying carbonate rocks are broken up by freeze-thaw processes (Hansom et al., 2014). Shore retreat on some parts of the Prince Edward Island coast has averaged 0.5 m/year over several thousand years (Forbes et al., 2004). Extreme rates of natural shoreline retreat (10–15 m/year or more) have been measured in a number of places, including the Atlantic coast of Nova Scotia (Forbes et al., 1997; Taylor et al., 2014), the Arctic coast in the Beaufort Sea (Solomon, 2005; Forbes et al., 2014b) and the Pacific coast at Haida Gwaii, BC (Walker and Barrie, 2006).
There have been few systematic compilations of shore-line erosion for extensive lengths of coast in Canada (e.g., Bernatchez and Dubois, 2004; Solomon, 2005; O’Carroll et al., 2006), but local studies and multitemporal surveys have been undertaken in hundreds of locations. Monitoring of representative sites by the Geological Survey of Canada has been ongoing for many years (Taylor et al., 2014). Solomon (2005) published an extensive compilation for the central Canadian Beaufort Sea coast, based on photogram-
metric analysis. Lantuit and Pollard (2008) have documented rates of coastal retreat for Herschel Island, on the Yukon coast, and recent work has extended the coverage (Couture et al., 2008; Couture, 2010; Konopczak et al., 2014). Analyses for more limited reaches of coast have been published for some areas in both southern and northern Canada (e.g., Covill et al., 1995; Forbes et al., 1995a, 1997; O’Carroll et al., 2006; Couture et al., 2014). Extensive site surveys have been undertaken over several years in the St. Lawrence Estuary, Gaspé Peninsula and Lower North Shore of Quebec (Bernatchez and Dubois, 2004). Comprehensive analyses of shoreline retreat and coastal geomorphology for all of Prince Edward Island (Davies, 2011; Webster, 2012), as well as other parts of the Maritimes, have been completed. In the Arctic, a circumpolar synthesis by Lantuit et al. (2012) provided a general analysis of shore-erosion rates for the entire Arctic Basin, including Canada’s coast facing directly onto the Arctic Ocean.
The data arising from such monitoring provides a baseline for assessing the impact of sea-level rise on coastal erosion. To date, evidence for accelerated shoreline retreat over the last few decades is generally absent. The highly dynamic nature of these coasts can make it challenging to differentiate impacts attributable to climate change from those that reflect natural coastal variability or coastal response to other drivers, including human interventions (Box 3).
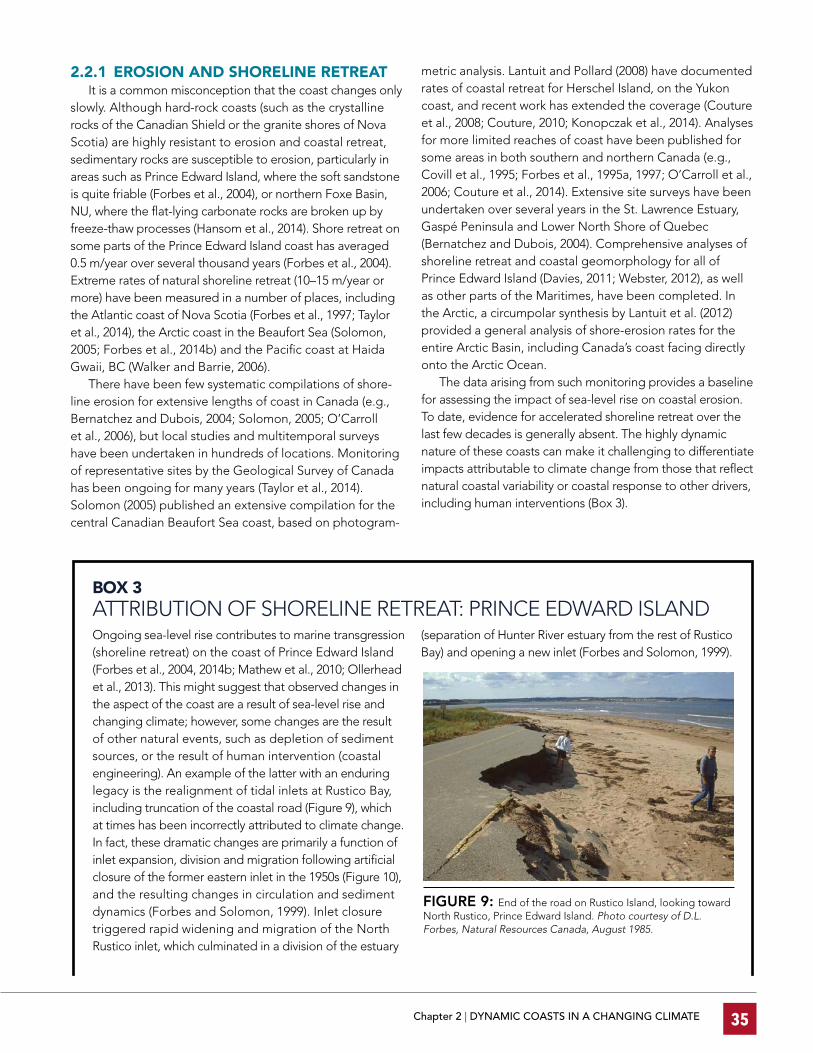
BOX 3 ATTRIBUTION OF SHORELINE RETREAT: PRINCE EDWARD ISLANDOngoing sea-level rise contributes to marine transgression (shoreline retreat) on the coast of Prince Edward Island (Forbes et al., 2004, 2014b; Mathew et al., 2010; Ollerhead et al., 2013). This might suggest that observed changes in the aspect of the coast are a result of sea-level rise and changing climate; however, some changes are the result of other natural events, such as depletion of sediment sources, or the result of human intervention (coastal engineering). An example of the latter with an enduring legacy is the realignment of tidal inlets at Rustico Bay, including truncation of the coastal road (Figure 9), which at times has been incorrectly attributed to climate change. In fact, these dramatic changes are primarily a function of inlet expansion, division and migration following artificial closure of the former eastern inlet in the 1950s (Figure 10), and the resulting changes in circulation and sediment dynamics (Forbes and Solomon, 1999). Inlet closure triggered rapid widening and migration of the North Rustico inlet, which culminated in a division of the estuary
(separation of Hunter River estuary from the rest of Rustico Bay) and opening a new inlet (Forbes and Solomon, 1999).
FIGURE 9: End of the road on Rustico Island, looking toward North Rustico, Prince Edward Island. Photo courtesy of D.L. Forbes, Natural Resources Canada, August 1985.

CANADA’S MARINE COASTS in a CHANGING CLIMATE 36
2.2.2 CONTROLS ON RATES OF COASTAL CHANGE
Storms – Storms with elevated water levels and wave action are the most effective agents of coastal change. This was driven home to many North Americans by the impacts of Hurricane Sandy on New York and the adjacent coasts of New Jersey and Long Island in late October 2012. Areas of the Canadian coast are similarly exposed to severe storms. The costs of such storms in Canada can be hundreds of millions of dollars. Hurricane Juan resulted in $100 million in damages and, in BC, a June 2011 coastal storm caused $85 million in damages (Pinna Sustainability, 2013). These values reflect damages only and do not include ‘passive’ costs associated with lost work time and reduced purchasing activity. For example, economic activity was strongly curtailed in Halifax and most of Nova Scotia and Prince Edward Island for a week or more during and following Hurricane Juan. An approxi-mate estimate of a one-week loss of activity is a further $80 million. In Newfoundland, Hurricane Igor has been estimated to have caused up to $200 million in damages (see Chapter 3). Less intense storm events that occur in rapid succession, without sufficient intervening time to rebuild sediment stores in smaller dunes, can have cumulative effects that also destabilize the coast (Forbes et al., 2004). The effects of a storm on the coast depend not only on the strength of the storm but also on the total water level (combined tide, surge and waves), the presence or absence of sea ice, local wind direction and fetch, and a range of other factors.
Major historical storms in Atlantic Canada include the Yankee Gale of 3–5 October 1851 (MacDonald, 2010), the Saxby Gale of 4–5 October 1869 and the August Gale of 24 August 1873 (Ruffman, 1999). Over the past 100 years, major storms included 2 October 1923, 21 January 1961 (the ‘Kennedy Inaugural’ storm), 21 January 2000, 29 October 2000, 8 November 2001, 27 December 2004 and others since (Parkes and Ketch, 2002; Forbes et al., 2004; Parkes et al., 2006). Many of the summer and autumn storms were tropical depressions or tropical transition events, whereas the winter events were extratropical but followed similar tracks northeastward along the United States eastern seaboard. The impacts of these storms on the physical environment of the coast have been dramatic. For example, Forbes et al. (2004) documented the transition from high dunes along the north shore of Prince Edward Island in 1765 to wide washover flats in 1880 (possibly a cumulative impact of the 1869 and 1873 storms), from which the dunes had not fully recovered before the storm of 1923. Mathew et al. (2010) described the impact of the latter event and the subsequent growth and onshore migration of high para-bolic dunes. Comparable effects of major storms are documented from many parts of the country, including the Nova Scotia Atlantic coast (Taylor et al., 2008), Newfound-land (Catto et al., 2006), the northern coasts of the Gulf of St. Lawrence and St. Lawrence estuary (Bernatchez and Dubois, 2004), the British Columbia coast (Walker and Barrie, 2006; Heathfield et al., 2013) and the Beaufort Sea (Solomon and Covill, 1995).
FIGURE 10: Colour shaded-relief LiDAR (light detection and ranging technique) digital surface model (including buildings and trees) for Rustico Bay and vicinity, Prince Edward Island, acquired in 2000 (Webster et al., 2002). Red-toned surface is shaded-relief bathymetry of the estuaries and inner shelf from single-beam, sweep and multibeam soundings (modified from Forbes et al., 1999). Sparse single-beam soundings are evident in the estuaries, which were too shallow to carry out a multibeam survey. Rough surfaces on the shore face are exposed bedrock or lag gravel over till. Red line is CanVec shoreline vector. Inset: Change in shore face profiles (broken white lines in main figure), caused predominantly by erosion, from 1955 soundings to 1997 sweep and multibeam surveys.

Chapter 2 | DYNAMIC COASTS IN A CHANGING CLIMATE 37
Sea ice – Sea ice can have both positive and negative effects on coastal stability. Although its presence can inhibit or preclude surface-wave development during storms, storm winds can also move ice onshore, scouring beaches and backshore surfaces including dunes, and damaging infrastructure (Forbes and Taylor, 1994; Forbes et al., 2002). The same onshore ice movement may move nearshore sediment landward, nourishing beaches (Reimnitz et al., 1990). Sea ice on Canadian coasts ranges from often heavy for many areas along the Atlantic coast (Figure 11) and almost absent on the Pacific coast to near-perennial in interisland channels of the northwestern Canadian Arctic Archipelago (Forbes and Taylor, 1994). Recent climate changes have had very significant impacts on the extent and duration of sea-ice cover (IPCC, 2013, Section 3).
In winter, sea ice can be largely immobile (as bottomfast or landfast ice) or highly mobile under tidal or wind forcing. In some situations, ice can ground and pile up on nearshore bars (Forbes et al., 2002, 2014b), protecting the shoreline from direct wave action if open-water storms occur. How-ever, if the seaward face of the ice complex is steep, it can function as a natural seawall, causing wave reflection and turbulence that may produce scour on the inner shore face (Bernatchez and Dubois, 2008).
Sea ice exerts a major control on the morphology of the Atlantic and Arctic coasts. During the major January 2000 storm in Atlantic Canada, the only coast exposed to waves in the southern Gulf of St. Lawrence was the eastern end of Prince Edward Island, as all other coasts of the island and the adjacent mainland were protected by sea ice. On the southwestern coast of Newfoundland, which was ice free, dynamic fetch in the same storm produced extreme waves that caused severe damage to areas as high as 18 m above mean sea level (Catto et al., 2006). In the southern Gulf, the dominant impacts of that storm were related to sea ice that was thrust onshore, overtopping dunes and damaging shorefront buildings and harbour infrastructure, including a lighthouse in Charlottetown Harbour that was knocked off its foundation (Forbes et al., 2004). Coastal flooding was also extensive, contributing to the high level of sea-ice impacts and setting record high-water levels in parts of Prince Edward Island and southeastern New Brunswick. In contrast, in the absence of sea ice, late autumn or early winter storms affecting Prince Edward Island, particularly those with winds from the northeast, can generate large waves that trim the dunes and cut back the beaches to erode underlying till (Forbes et al., 2004, 2014b). The latter represents a step retreat of the coastal substrate that is not recoverable.
Under some circumstances, frazil ice (ice crystals formed under turbulent supercooling conditions) and aggregated
frazil forming slush ice can entrain large volumes of sediment from the nearshore, which sediments can be carried offshore or great distances along the coast (Reimnitz and Maurer, 1979; Forbes and Taylor, 1994). It has been suggested that the recent reduction in multiyear ice and summer retreat of pack ice from the western Arctic coast may enhance offshore transport of ice-entrained sediments (Eicken et al., 2005). This, combined with seaward near-bed currents, can contribute to shoreline retreat through loss of sediment to the inner shelf. Direct or indirect scour over the shore face is caused by grounding ice floes or ice wallowing in shoaling waves.
Permafrost – In northern areas of permafrost terrain that have ice-rich sediments, the erodibility of coastal cliffs is constrained by ice bonding (Kobayashi et al., 1999), and is thus susceptible to warming air, sea and ground tempera-tures (Overeem et al., 2011; Barnhart et al., 2014a). Erosion on these coasts occurs in many ways, including by sloughing and active-layer detachment failures, by deep undercutting and collapse of blocks defined by polygonal ice wedges (Figure 12a; Hoque and Pollard, 2009), and by retrogressive thaw failure in soils with massive ground ice (Figure 12b; Lantuit and Pollard, 2008, Forbes et al., 2014b). Despite the important role of thermal abrasion and thermokarst processes on ice-bonded coasts, storms are likely still the dominant factor driving shoreline retreat in most places. Those occur-ring at times of open water with well-developed waves can effect rapid erosion and undercutting (Overeem et al., 2011; Barnhart et al., 2014a).
FIGURE 11: Extent of sea ice in the Atlantic region. Colour shading indicates the number of years in the 30 year period (1981–2010) for which sea ice was recorded at that location. The influence of the southward-flowing Labrador Current on moving ice down from Labrador can be seen. Figure compiled by the Canadian Ice Service of Environment Canada.

CANADA’S MARINE COASTS in a CHANGING CLIMATE 38
3 CHANGING CLIMATE
3.1 DRIVERS OF CHANGECivilization has evolved over the last 10 000 years,
during the most climatically stable era of the last million years (e.g., Rockström et al., 2009). The development of complex societies in the Middle East and the Americas appears to have closely followed the stabilization of sea level after 7000 years before present (Day et al., 2012). This relative stability of climate and sea level is changing. As documented in the assessment reports of the Intergovernmental Panel on Climate Change (IPCC, 1990, 1992, 1995, 2001, 2007, 2013) and a large volume of other scientific literature that has been compiled over the last three decades, human activities have led to fundamental changes in atmospheric chemistry, with major implications for the Earth’s climate system and human habitat. Indeed, the IPCC Fifth Assessment Report (IPCC, 2013, p. 4) concludes that:
Warming of the climate system is unequivocal, and since the 1950s, many of the observed changes are unprecedented over decades to millennia. The atmosphere and ocean have warmed, the amounts of snow and ice have diminished, sea level has risen, and the concentrations of greenhouse gases have increased.
The climate system (including the atmosphere, ocean and terrestrial surface) exists in thermal balance, meaning that energy coming in is roughly equal to energy going out. Changing the balance—even by a little—results in warming or cooling of the Earth. This balance is the sum total of several climate forcings that are both outside the atmosphere and within the Earth-atmosphere system. Forcings outside the atmosphere relate to astronomical parameters, and consist mostly of periodic variations in Earth’s orbit, which cause regular variations in the amount and distribution of solar radiation the Earth receives over periods of tens of thousands of years. Called Milankovitch cycles, these variations on the eccentricity, axial tilt and precession of the orbit are generally considered to be the primary triggers of major ice ages (Hays et al., 1976).
Forcings within the Earth-atmosphere system include changes to the chemical makeup of the atmosphere and changes to the surface of the Earth, particularly its reflectivity. Greenhouse gases in the atmosphere capture thermal energy (heat), causing some of the energy to be retained in the atmosphere when it otherwise would have radiated out to space. Although water vapour is the most effective greenhouse gas, carbon dioxide, methane and other gases are the primary focus of climate change discussions because human activity can change the abundance of these gases in the atmosphere. Their effect on the atmospheric thermal radiation balance (radiative forcing) is strong enough that even relatively small increases in their concentration have noticeable impacts on the climate system. New climate change scenarios presented in the most recent IPCC assess-ment report, and used in developing the projections of sea-level rise for Canada presented in this report (Section 4), are based on changes in net radiative forcing (Box 4).
Another important forcing within the Earth-atmosphere system relates to alterations of the Earth’s surface. These alterations include changes in land use and land cover brought about by human activities such as agriculture, urbanization, deforestation, desertification, and the drainage or creation of wetland areas (e.g., Pielke et al., 2011; Mah-mood et al., 2014). Alterations can also include changes in snow and land or sea ice cover in direct response to climate warming (e.g., Flanner et al., 2011). Together these changes alter the reflectivity of the Earth’s surface (the albedo), the amount of heat that can be stored and the amount of carbon
FIGURE 12: Erosion of permafrost coasts in the western Canadian Arctic: a) a deep thermoerosional niche undercutting cliff in ice-bonded sand and associated block failure following a major storm, Tuktoyaktuk Island, NT (Photo courtesy of S.M. Solomon, Natural Resources Canada, August 2000) and b) retrogressive thaw amphithe-atres in ice-rich deposits at King Point, YT (edge of lagoon at left). Note massive ice (indicated by white arrow) in lower part of the main headwall, which is ~5 m high. Photo courtesy of D.L. Forbes, Natural Resources Canada, July 1992.
a)
b)

Chapter 2 | DYNAMIC COASTS IN A CHANGING CLIMATE 39
FIGURE 13: Concentrations of greenhouse gases, a) carbon dioxide, b) methane, c) nitrous oxide and d) chlorofluorocarbon, determined using the four RCPs and their extensions (ECP) to 2300 (from Cubasch et al., 2013, Box 1.1, Figure 2).
BOX 4 IPCC PROJECTIONS OF ATMOSPHERIC COMPOSITION (Cubasch et al., 2013; p. 147–150 “Description of Future Scenarios”- IPCC Fifth Assessment Report)
The state of the future climate is very much dependent on people and their actions (e.g., population growth, technology development and use, fossil fuel consumption, agriculture, deforestation and other land use activities). Early efforts of the IPCC to project future climate changes focused on the quantity of carbon compounds emitted by human activity. Experts in sociology and economics developed assumptions and scenarios of future trends and patterns of human activity, which were translated into carbon emissions scenarios and provided to the climate system modellers. This process, described in the Special Report on Emissions Scenarios (IPCC, 2000), resulted in what are referred to as SRES scenarios.
This approach changed for development of the IPCC Fifth Assessment Report (IPCC, 2013). Recent peer-reviewed research has improved understanding of the range of likely future emission scenarios. A subset of four carbon- concentration pathways, termed Representative Concentration Pathways (RCP), were developed from the full range of possible emission scenarios. The RCPs are not directly based on changing socio-economic factors, but simply specify concentrations and corresponding emissions. The associated climate change scenarios deal with short-lived gases and land-use changes more directly than did the SRES. They provide one low-, two middle-of-the-road–, and one high-emission trajectories. The number in each scenario name corresponds to the net radiative forcing, which is the difference between the amount of radiant energy that enters the Earth’s atmosphere and the amount that is radiated back out into space, expressed in watts per square metre (W/m2) for the year 2100. For the highest emissions scenario, RCP8.5, the atmosphere will contain 1000 ppm carbon dioxide by the year 2100 (Figure 13), with an associ-ated radiative forcing surplus of 8.5 W/m2. For reference, the radiative forcing surplus under the current atmospheric concentration of carbon dioxide is ~2 W/m2, under which changes in the climate system are already being observed. The solar constant, the amount of solar radiation that hits the top of the atmosphere, is approximately 1365 W/m2. Thus, a radiative forcing change of less than one percent is enough to trigger a major response in the atmospheric thermal state.
1
Chapter 1 Introduction
148
RCP3-PD) which peaks at 3 W m–2 and then declines to approximately 2.6 W m–2 by 2100; the medium-low RCP4.5 and the medium-high RCP6 aiming for stabilization at 4.5 and 6 W m–2, respectively around 2100; and the highest one, RCP8.5, which implies a RF of 8.5 W m–2 by 2100, but implies rising RF beyond that date (Moss et al., 2010). In addition there is a supplementary extension SCP6to4.5 with an adjustment of emissions after 2100 to reach RCP 4.5 concentration levels in 2250 and thereafter. The RCPs span the full range of RF associated with emission scenarios published in the peer-reviewed literature at the time of the development of the RCPs, and the two middle scenarios where chosen to be roughly equally spaced between the two extremes (2.6 and 8.5 W m–2). These forcing values should be understood as comparative labels representative of the forcing associated with each scenario, which will vary somewhat from model to model. This is because concentrations or emissions (rather than the RF) are prescribed in the CMIP5 climate model runs.
Various steps were necessary to turn the selected ‘raw’ RCPs into emission scenarios from IAMs and to turn these into data sets usable by the climate modelling community, including the extension with historical emissions (Granier et al., 2011; Meinshausen et al., 2011), the harmonization (smoothly connected historical reconstruction) and gridding of land use data sets (Hurtt et al., 2011), the provision of atmospheric chemistry modelling studies, particularly for tropospheric ozone (Lamarque et al., 2011), analyses of 2000–2005 GHG emission levels, and extension of GHG concentrations with historical GHG concentrations and harmonization with analyses of 2000–2005 GHG concentrations levels (Meinshausen et al., 2011). The final RCP data sets comprise land use data, harmonized GHG emissions and concentrations, gridded reactive gas and aerosol emissions, as well as ozone and aerosol abundance fields ( Figures 2, 3, and 4 in Box 1.1). (continued on next page)
Box 1.1, Figure 2 | Concentrations of GHG following the 4 RCPs and their extensions (ECP) to 2300. (Reproduced from Figure 5 in Meinshausen et al., 2011.) Also see Annex II Table AII.4.1 for CO2, Table AII.4.2 for CH4, Table AII.4.3 for N2O.
1500
2000
ppm a) Carbon
Dioxide
History RCPs ECPs
RCP8.5
300
400
500
600
700
800
900
1000
RCP2.6
RCP4.5
RCP6
SCP6to4.5
1800 1900 2000 2100 2200 23000
100200300400500600700800900
1000ppt
d) CFC12−eq
1800 1900 2000 2100 2200 2300250
300
350
400
450
500
ppb c) Nitrous
Oxide RCP8.5
RCP2.6
RCP4.5
RCP6
SCP6to4.5
500
1000
1500
2000
2500
3000
3500
ppb
b) Methane
History RCPs ECPs
RCP8.5
RCP2.6
RCP4.5RCP6
Box 1.1 (continued)
a) b)
c)
d)

CANADA’S MARINE COASTS in a CHANGING CLIMATE 40
that can be stored. For example, ground reflectivity is greatly altered when the surface changes from snow covered to snow free. The growth of cities at the expense of vegetated areas increases the amount of energy released to the atmosphere as heat, rather than stored in evaporation of water. Forests and permanently frozen ground store large amounts of carbon; as they diminish in size, their stored carbon ends up in the atmosphere. The Industrial Revolution, which began about 250 years ago, with its rapid growth in coal combustion, triggered an acceleration in the rate of CO2 emissions into the atmosphere. Before the Industrial Revolution, land-use alterations associated with agricultural activity going back thousands of years may have initiated changes in atmospheric chemistry (Ruddiman et al., 2014), illustrating the capacity for land-use and land-cover changes to alter the atmosphere.
This section focuses primarily on the atmospheric component of the climate system as it influences coastal processes, including wave climate. For an overview of trends and projected changes in ocean climate for Canada, readers are directed to Bush et al. (2014). Ocean climate changes, acidification, and associated impacts are also addressed in the regional chapters of this report (see Chapters 4–6).
BOX 5 CLIMATE VARIABILITY AND ATMOSPHERIC TELECONNECTIONSThe Earth’s atmosphere, cryosphere (snow; glaciers; sea, river, and lake ice; and permafrost), ocean and land are internally interconnected through the exchange of heat, freshwater, energy and gases. The cryosphere and ocean, in particular, are able to store large amounts of heat and freshwater. Movements of large quantities of heat within the system can occur episodically and elicit strong feedbacks, resulting in natural variations or ‘oscillations’ and sometimes referred to as internal climate variability. These are manifested as ocean surface temperatures and atmospheric pressure patterns that vary with a roughly regular cycle. Two prominent oscillations, El Niño Southern Oscillation (ENSO) and the North Atlantic Oscillation (NAO), have been apparent for centuries, and since the 1980s climate researchers have identified several more. These oscillations have periods lasting from months to decades and tend to be confined to fairly specific areas, usually located over oceans. Other examples of impor-tance to Canada include the Arctic Oscillation in atmospheric pressure patterns and the Pacific Decadal and Atlantic Multidecadal Oscillations in ocean surface temperature.
The best known of the teleconnections affecting Canada is the ENSO. El Niño is a periodic change in sea surface temperatures that occurs in the tropical South Pacific, caused when the west-blowing trade winds weaken and allow warm water that is normally pushed to the west to flow back to the eastern side of the Pacific. This causes the waters off Peru and northern Chile to warm, and the waters of the western Pacific to cool. Changes in the surface water temperature in turn alter atmospheric temperature and pressure patterns, affecting winds and storms. For Canada, a positive ENSO (El Niño) means warmer temperatures across the country, whereas a negative ENSO (La Niña) brings cooler temperatures, typically more pronounced during the winter (Shabbar and Khandekar, 1996). During a La Niña phase, for example, the southwestern coast of British Columbia has colder winters (Abeysirigunawardena et al., 2009). Teleconnections also affect precipitation: a positive ENSO elevates the poten-tial for extreme precipitation events on the BC and eastern Maritime coasts, but decreases the potential in central BC, Alberta and northern Ontario (Zhang et al., 2001; Wang et al., 2006). Etkin et al. (2001) identified a link between ENSO and tornado activity in the Prairies and southern Ontario (slightly enhanced activity during a positive ENSO, suppressed during a negative event).
3.2 CLIMATE VARIABILITY AND CHANGEClimate and weather are inherently variable. Higher
latitudes exhibit more variability than the tropics. Climate variability is short term and not necessarily related to climate change, although there are established links (e.g., climate warming at high latitudes may enhance climate variability; Francis and Vavrus, 2012). Climate variability also involves spatial linkages (teleconnections), whereby a change in the climate system at one location causes a climatic response at another location some distance from the source of the original change. Teleconnections are best evidenced by regionalized, regular changes in the Earth-ocean system that repeat on a cycle of years to decades (Box 5).
High-profile weather events such as Hurricane Juan (in 2003) or Hurricane Sandy (in 2012) raise the question of whether the event is a product of climate change. There is no way to conclusively link a particular event to climate change. However, taking a probabilistic approach to questions of attribution provides a link to climate change via changing the likelihood envelope. Such changes can be manifest in three possible forms: ‘shifted mean’ is a shift

Chapter 2 | DYNAMIC COASTS IN A CHANGING CLIMATE 41
toward more extremes at one end (e.g., more hot days); ‘increased variability’ is a shift toward more frequent occur-rences of extremes of all types; and ‘changed symmetry’ is a shift in the shape of the distribution (e.g., more cooler but non-extreme days; IPCC, 2012). For example, a rise in sea surface temperatures driven by climate change sets the stage for an increased frequency in tropical cyclone (hurri-cane) formation. Thus, although we cannot directly connect climate change to a particular storm that may strike Atlantic Canada, we can conclude that there is an increased chance of hurricane formation due to increased sea surface tem-peratures, which are related to climate change.
3.3 CLIMATE DETERMINANTSCanada’s temperature regime is dominated by the
seasonal changes to radiation intensity. The large tempera-ture ranges that accompany this annual radiation progression are well observed at inland locations. Closer to the coast, the strong moderating influence of the ocean reduces the range of temperatures experienced. Seasonality is greater for the Atlantic coast (East Coast region) than for the Pacific coast (West Coast region) in Canada. These differences relate to prevailing west–east flow of air masses. The temperature of Pacific surface waters varies little over the year (Figure 14), and the West Coast region is dominated by Pacific maritime air masses possessing relatively consistent air temperatures. Air masses flowing over the Atlantic coast, by contrast, have largely come from the continent. This means warmer summer
temperatures and cooler winter temperatures. Sea surface temperature in the east is also strongly influenced by the Labrador Current, a cold current that flows down the Labrador coast, around Newfoundland and along the southeast-facing Atlantic coast of Nova Scotia. Both of these factors combine to give the East Coast region south of Labrador a relatively large annual sea-surface tempera-ture range (Figure 14).
Northern coastal weather stations show greater seasonal ranges than observed along the Pacific and Atlantic coasts, and much colder temperatures. Arctic coasts are generally situated north of the jet stream and cold air masses tend to reside over them during the winter. Winter cold can be punctuated by episodic warm air advection events from the south that can bring freezing precipitation, fog and melt conditions, all of which prove problematic for northern communities. These events are happening more frequently (Wang, 2006) as the jet stream appears to be exhibiting greater variability (Francis and Vavrus, 2012).
Precipitation patterns are controlled by prevailing atmospheric flow, storm tracks and patterns, and regional topography. The westerly flow that brings moderate temperatures to the West Coast region also entrains moist Pacific air and drives it into the steep topography of the Western Cordillera, resulting in the largest precipitation totals in Canada (>4000 mm annually at some sites) and large precipitation gradients. For example, the southwestern coast of Vancouver Island can receive more than 3000 mm of
FIGURE 14: Sea-surface temperature difference between the mean warmest monthly and the mean coldest month. Note the much greater amplitude of the range off of the North American eastern seaboard (figure plotted using data from Reynolds and Smith, 1995).

CANADA’S MARINE COASTS in a CHANGING CLIMATE 42
precipitation annually, whereas less than 100 km away in Victoria, the annual total averages about 400 mm. Most precipitation arrives in the fall-winter-spring timeframe. A phenomenon unique to the Pacific coast is the ‘atmospheric river’—a filamentary structure that draws out moisture from the tropical atmospheric moisture pool and directs it against the North American west coast. Atmospheric rivers result in heavy and persistent rain, and in many areas they represent the extreme weather events (Ralph and Dettinger, 2012). A major flooding event along the central BC coast in September 2010 was caused by an atmospheric river (Pinna Sustainability, 2013).
In the East Coast region, precipitation is largely controlled by storms moving up the eastern seaboard or across the continent. Mean annual total precipitation typically ranges from low values of 800 mm in eastern Quebec and southern Labrador, increasing eastward and exceeding 1600 mm for parts of northern Nova Scotia (Cape Breton) and southern Newfoundland (Natural Resources Canada, 2007). In the East, the majority of annual total precipitation arrives in winter (100–150 mm per month), with the summer months experi-encing about half to two-thirds of winter monthly totals.
The western and northern Arctic receive less than 300 mm of precipitation annually. The region sees fewer storms than the eastern Arctic and has much less access to moisture due to the annual covering of sea ice that restricts evaporation from the ocean. The eastern Arctic (Baffin Island, northern Quebec and Labrador) experiences more frequent storm incursions via the Labrador Sea and Davis Strait into Baffin Bay. As a result the region also experi-ences more precipitation, approaching 1000 mm annually for local areas such as the southeast coast of Baffin Island.
3.4 TRENDS AND PROJECTIONSHistorical trends and projections for temperature and
precipitation in Canada as a whole, summarized by Bush et al. (2014), provide important context for the following discussion of observed and projected changes in coastal climate.
3.4.1 TRENDSWhereas temperature and precipitation data for
Canada’s East and West Coast regions extend back more than 100 years, instrumental records for much of the Arctic only extend back to about 1950. Vincent et al. (2012) provide detailed information on trend analysis for Canada as a whole. For coastal areas there is an upward trend in both daily maximum and daily minimum temperatures, for both the East Coast and West Coast regions, for the period 1900–2010, with minimum temperatures showing greater warming than maximum temperatures (Figure 15). Avail-able data for northern coastal regions are not sufficient to determine long term trends.
For a recent 50 year period (1950–2003), daily tempera-ture maxima show weak to moderate increasing trends in all seasons on the Pacific coast (not statistically significant in fall). The pattern is similar along the Atlantic coast, although it is statistically significant only in summer. The Arctic exhibits strong warming trends in the western and south-central regions in winter that become statistically nonsignificant for the east. Fall trends are moderate but significant throughout the east and central north. Summer and spring show some areas that exhibit stronger trends (Vincent et al., 2012). Wang et al. (2014b) extracted infor-mation about occurrence of extreme (one in 20 year return) high and low temperatures from weather stations across Canada. Temperatures were averaged for the decades of the 2010s and the 1960s then compared. Results indicate weak increases (+2°C) or no difference at stations on all three coasts. The most coherent groupings are increases in both maximum temperature and minimum temperature for the central Nova Scotia region.
Annual precipitation trends for the 1950–2003 period (Vincent and Mekis, 2006; Mekis and Vincent, 2011) indicate significant increases for most stations in all three coastal regions. The snow-to-rain ratio has decreased (i.e., more precipitation coming as rain) at almost all locations on the Pacific and Atlantic coast, whereas in the North, the ratio has increased.
Indices provide another measure to consider changes in temperature and precipitation. Analysis of a series of indices, such as number of frost days, snow-to-rain ratio and others, by Vincent and Mekis (2006) reveals, amongst other things, that over the 1950–2003 period, the Pacific coast exhibited decreasing frequency of cold days and cold nights, and an increased frequency of warm nights. Small trends in the number of consecutive dry days are also noted, particularly for the Maritimes area of the East Coast region. Trends in heavy precipitation (>10 mm) and very wet (>95th percentile) days are not strong anywhere except at some stations in Newfound-land, the Maritimes and one in the Gaspé. An analysis by Zhang et al. (2001), focusing on heavy precipitation events,
FIGURE 15: Trends in annual mean of the daily maximum and minimum temperature for 1900–2010 (Vincent et al., 2012).

Chapter 2 | DYNAMIC COASTS IN A CHANGING CLIMATE 43
similarly found few long-term trends, although an indication of increasing frequency of heavy snowfall events was noted. Note that the study is now 15 years old, a period long enough for changes in the observed trends to have occurred.
3.4.2 PROJECTIONSGlobal projections of changes in surface (2 m) air
temperature for the period up to 20351 presented in IPCC (2013) indicate a mean increase of <1°C is projected for both winter (DJF) and summer (JJA) for the Pacific coast. The Atlantic coast also shows a small increase in summer and a slightly larger increase (1.0–1.5°C) in winter. The North is projected to continue experiencing dramatic change, with winter-time air temperatures in coastal regions increasing as much as 3°C in many places. Projected summer temperature increases are on the order of 1.0–1.5°C.
A more detailed study for North America by Šeparović et al. (2013) used a high-resolution regional climate model nested within the global model outputs for the period 2071–2100. Most models suggest temperature increases of 2–3°C for both the Atlantic and Pacific coasts at this time period. Similar increases are projected for the Arctic in summer; however, all models indicate a much larger tempera-ture increase in the Arctic winter, ranging from 6° to as high as 14°C. Analysis by Feng et al. (2012), focused on the Arctic, yielded similar findings, with projected summer temperature increases (1–3°C for coastal regions of northern Canada) and projected winter increases of 8–10°C for the period 2080–2099.
With respect to precipitation, the Šeparović et al. (2013) analysis for the period 2071–2100 shows increases of 10%–20% in winter precipitation for the Atlantic and Pacific coasts. The North shows much larger potential increases, particularly in the eastern Arctic, with increases up to 80% being projected. For the summer period several models suggest as much as a 20% reduction in precipitation for the Pacific coast. No particular trend is indicated for the Atlantic coast, while increases of up to 20% are indicated for many parts of the Arctic.
As many weather impacts in Canada relate to weather extremes (e.g., Warren and Lemmen, 2014), it is important to understand projected changes in extreme events. Casati and de Elia (2014) examined projected extreme temperature values (annual and seasonal maximum and minimum) to detect changing values or frequency of occurrence for extremes. Their results indicate increases in the value of temperature extremes, but not necessarily an increase in their frequency of occurrence. Projected changes to atmospheric river events for the United States Pacific coast have been analyzed by Dettinger (2011), with findings relevant for Canada’s West Coast region. Under a high-emissions scenario, significant changes were found in the extremes associated with atmospheric rivers. Years with multiple atmospheric river
1 Values are the average for the period 2016 to 2035. Note that projections for this near term period are virtually the same for all climate change scenarios.
events increased, as did water-vapour transport rates and associated storm temperatures. In addition, analysis found that the length of the season in which most atmospheric rivers occur is expected to increase.
3.5 STORMS AND SEA ICE
3.5.1 STORMSCanada and its coastal regions are subject to a wide
range of storm types and impacts (Stewart et al., 1995). Strong winds are generally of greatest importance in coastal regions, as these drive damaging wave states and storm surges. Distant storms can drive swells of longer period into the coastal environment, presenting a greater hazard for marine traffic. Precipitation events associated with storms can also prove problematic. In the North, the impact of a storm is determined by the extent and mobility of sea ice.
Storms in the Pacific region consist typically of occluded extra-tropical cyclones that have been spawned over the mid- or western Pacific and have moved under the influence of the jet stream into the BC coastal region. This area does not experience tropical cyclones (typhoons or hurricanes), and even under extreme climate change scenarios the broad circulation patterns of the North Pacific are projected to maintain sea-surface temperatures off the North American west coast that are too cool to support tropical cyclone activity. Frontal zone passages do occur on the Pacific coast, but are often relatively diffuse compared to frontal passages in central or eastern Canada. However, frontal zones in the West Coast region are important as they spawn secondary storm systems. A typical storm pathway involves a primary system moving up into the Gulf of Alaska and stalling there, bringing significant moisture to the northern BC coast. In some cases, a secondary storm system is spawned at the confluence of the warm and cold fronts, which moves around the primary system to the south, and can bring strong winds and heavy precipitation to Vancouver Island and the southern BC coast.
The summer is a relatively storm-free period on the Pacific coast, as the jet stream tends to produce a ridge of high pressure over BC, resulting in fair weather for much of southern coastal BC in summer. Moving north, this pattern is generally maintained, with increasing amounts of summer precipitation. The majority of precipitation is steady rain rather than showery precipitation associated with convective activity. Thunderstorms are rare in the West Coast region.
For the East Coast region, large-scale climatic controls include the prevailing upper-level winds, which move storm systems into the region from farther west. Storm systems formed over the plains of North America have often pro-gressed to a rapidly intensifying mature phase by the time they reach the east coast. Although storms moving through

CANADA’S MARINE COASTS in a CHANGING CLIMATE 44
this region tend to move fairly rapidly, they are nevertheless capable of generating significant precipitation and winds. These events occur primarily in winter and spring. The East Coast region has two other major storm tracks that do not affect other parts of Canada. The first are storms that form along the United States eastern seaboard, proceed along the coast to the northeast and enter eastern Canada 36–48 hours after initial formation. These storms can move and develop very rapidly, with the strongest systems termed ‘nor’easters’ (e.g., Davis et al., 1993). ‘White Juan’, which impacted much of the Atlantic provinces in February of 2004 with record snowfall amounts and strong winds, was a very strong nor’easter. Strong winds associated with the storm generated severe marine conditions including swell and storm surge. The second unique storm track affecting the East Coast region is the typical path followed by tropical cyclones (hurricanes) that strike the United States eastern seaboard and Gulf of Mexico. Typically, hurricanes do not directly strike eastern Canada, with Hurricane Juan in September 2003 being a notable exception. Instead, they encounter the mainland United States coast farther south, at which point the storm weakens fairly rapidly, losing its tropical-cyclone form. This begins the extra-tropical transition phase, altering the storm from a tropical cyclone to an extra-tropical cyclone. Despite this weakening, these remain strong storms and generally continue along a northeasterly trajectory into Canada’s East Coast region. Because of their greater diame-ter, some tropical and post-tropical storms can affect a wide swath and be almost as damaging as full hurricanes.
Maxwell (1981) identifies two main storm tracks in the Canadian Arctic. The most prominent of these is from the east, into Baffin Bay via the Labrador Sea and Davis Strait. This is an offshoot of two major North American storm tracks, one extending in the mid-latitudes from the Rockies to Eastern Canada and the other extending up the Atlantic seaboard. Storms on these tracks typically move into the Atlantic, where the track splits. Most storms continue south of Greenland and on across the Atlantic Ocean. However, some turn north toward Baffin Bay and some on this path stall over Hudson Bay. The second major storm track identified by Maxwell (1981) is from the west into the
Beaufort Sea and Amundsen Gulf, affecting the western archipelago and the mainland coast of the Yukon, Northwest Territories and western Nunavut.
Some storms on Baffin Island result in wind events and some are precipitation events producing snow, freezing rain or rain (Roberts et al., 2008; Hanesiak et al., 2010). Storm winds can drive wave and swell responses that propagate into and fracture sea ice (Asplin et al., 2012), enhancing ice decay and introducing additional moisture and heat into the atmosphere, which can set the stage for more frequent cloudiness or fog. The large expanses of open water now found in the Arctic Ocean and marginal seas can provide the thermal gradients necessary to drive powerful storms of great areal extent, as was observed in August 2012, in the western Arctic Ocean including the Chukchi and Beaufort seas (Simmonds and Rudeva, 2012).
Storms and storm winds exert a variety of impacts on northern coasts. Many areas of the eastern Beaufort Sea region feature shallow inner-shelf bathymetry. This is favourable for the development of storm surges that, when combined with the large expanse of low-relief area in the Mackenzie River delta, can result in flooding over large areas (Pisaric et al., 2011) and can drive water level anomalies as far as 100 km upriver from the coast (Marsh and Schmidt, 1993).
3.5.2 SEA ICEA dominant feature of Canada’s North Coast region is ice:
sea ice, permafrost and glaciers (Forbes and Hansom, 2011; see Chapter 5). The presence of sea ice promotes coastal cooling in summer and also facilitates cooler temperatures in winter, as the sea-ice cover reduces moisture and energy transfer with the atmosphere, thereby reducing the moderat-ing influence of the ocean. The east coast of Canada also experiences sea ice, but with a shorter season (Figure 16). The seasonal duration of sea ice is decreasing on almost all Canadian coasts, from the Gulf of St. Lawrence (Forbes et al., 2002) to the Arctic Archipelago (St-Hilaire-Gravel et al., 2012) and the Beaufort Sea (Manson and Solomon, 2007; Overeem et al., 2011). For the entire Arctic region, sea-ice area and thickness are decreasing, with summer ice-extent reductions on the order of 12% per decade for the past three decades

Chapter 2 | DYNAMIC COASTS IN A CHANGING CLIMATE 45
(Stroeve et al., 2012; see Chapter 5). At present, projections from climate models suggest that the Arctic Ocean may be ice free during summer by about 2040 (Wang and Overland, 2009). However, even a substantially reduced summer ice cover will have profound implications for Arctic coasts (Barnhart et al., 2014b).
3.5.3 CHANGES IN STORM ACTIVITYDetecting changes in storm frequency is difficult due to
a number of factors, including how a storm is identified and classified, and analytical methods. In the case of tropical cyclones, different monitoring agencies (United States, Japan, Hong Kong/China) define maximum windspeed differently. A common approach to storm analysis is to identify and track storms individually and develop summary statistics for different areas (Mesquita et al., 2009, 2010). Other approaches focus on developing statistics of meteorological parameters associated with storms, such as strong winds (Atkinson, 2005). In addition, it is important to consider the length of record to distinguish between trends and cyclical variability. For example, it is recognized that tropical cyclone (hurricane) frequency in the Atlantic Basin exhibits a rough cycle with periods of less or
more activity related to the Atlantic Multidecadal Oscillation (Enfield and Cid-Serrano, 2010).
Despite these challenges, it is evident that the mid-latitude storm track is shifting farther north (IPCC, 2013), bringing on average a greater frequency of storms to the Canadian North and a greater proportion of storms entering Canada from the west. The jet stream strength and position are the primary determinants of the strength and trajectory of extra-tropical cyclones. Alterations in the jet stream will be felt locally as a changed climate (e.g., more/less frequent storms, more frequent incursions of warm air). A station-based assessment of frequency and rates of pressure drops at stations across Canada—a surrogate for storm activity—found increased winter storm activity in the southern Arctic and a weak decrease along the southern Pacific and Atlantic coasts (Wang et al., 2006). More frequent, but less intense summer storm activity was noted for the Atlantic coast.
It is possible that there are links between reduced sea ice and the occurrence of extreme weather events to the south (Francis and Vavrus, 2012, 2015). Reduced sea ice provides a greater expanse of open water, warming the polar atmo-sphere and possibly weakening the east-west strength of the jet stream. This, in turn, alters the jet stream form, leaving it more able to meander to the north and south and to create ‘blocking’ patterns (Box 6), which can result in stalled weather systems (e.g., rainy weather stretching over two weeks). During such times, extreme events can occur in the form of prolonged periods of rain, drought, heat or cold. This idea is not without controversy (Barnes, 2013; Fischer and Knutti, 2014) but constitutes an area of active research, which reflects the complexity of many Earth systems.
It is more difficult to quantify future changes in storms and circulation than it is for changes in temperature and precipita-tion. For storms, climate change means not so much an increase in total hemispheric counts, but rather changes in storm tracks and the length of time that large-scale atmo-spheric-flow regimes favour particular weather patterns. Recent work using a high-emissions scenario (RCP8.5) projects a general decrease in storm activity over eastern and western Canada, but an increase in storm activity in the North during the fall (Chang, 2013).
FIGURE 16: Average maximum ice extent for the years 1969–1998. Note that March 12 is taken to be the date of maximum ice extent (Environment Canada, 2013).

CANADA’S MARINE COASTS in a CHANGING CLIMATE 46
FIGURE 17: a) Upper atmospheric flow pattern during a typical mid-Atlantic blocking event. Contour lines connect points of equal elevation of that pressure surface (250 hPa) above the surface. The large arrow depicts the general position of the jet stream for the period 12–23 February 1987. b) Regional temperature anomalies for the same period depicted in part (a). The presence of the blocking event resulted in a protracted period of cold temperatures for most of the East Coast region, as shown by the negative temperature anomalies, and also a strong warm anomaly over northern Labrador–Hudson Bay and Southern Baffin regions. Data and plot obtained using the National Oceanic and Atmospheric Administration, Earth System Research Laboratory, Physical Science Division’s retrieval and display tool for online climate data.
BOX 6 BLOCKING PATTERNSA blocking pattern is an excessively wavy flow pattern in the atmosphere that does not favour the usual movement of weather patterns from west to east. Instead, weather systems ‘stall’, remaining relatively stationary or moving slowly over a particular region (which can be quite large). A blocking pattern can remain in place for as long as three weeks, and during this time the areas affected by the block receive very persistent weather. Figure 17 illustrates a typical mid-Atlantic blocking event from February 1987, which resulted in an extended period of cold temperatures in Atlantic Canada. A west coast example occurred in September 2012 under the influence of a very persistent ridge pattern that provided for weeks of sun, extending into what should have been the beginning of fall. Likewise, the following year, a persistent trough pattern caused warm, moist air to be pumped into the Vancouver Island region from the southwest, bringing warm temperatures and moderate rain for several weeks. Recent research has suggested that warming in the Arctic has resulted in a weakening of the east-west strength of the jet stream (Francis and Vavrus, 2012), allowing it to meander more and increas-ing the frequency of blocking patterns.
4 CHANGING SEA LEVELOne of the most significant consequences of climate
change is sea-level rise (Stern, 2007; IPCC, 2013). Global, or absolute, mean sea level is projected to rise by tens of centimetres, and possibly more than a metre, by the year 2100, due primarily to thermal expansion of the oceans and increased melting of land ice (glaciers, ice caps and ice sheets; e.g., IPCC, 2013; Church et al., 2013a). Sea-level rise leads to increased frequency of coastal flooding and may lead to increased amounts of coastal erosion. Thus, projec-tions of sea-level change are important for forecasting risk to populations, for planning infrastructure maintenance and development, and for habitat management (e.g., Nicholls et al., 2011).
4.1 HISTORICAL SEA-LEVEL CHANGEGlobally, sea level rose at a mean rate of 1.7 ±0.2 mm/
year between 1901 and 2010, while between 1993 and 2010, sea level rose at a faster rate of 3.2 ±0.4 mm/year (Church et al., 2013a). However, there was considerable variability in the rate throughout the 20th century (Church and White, 2006). Sea-level change is observed at a global network of tide gauges, supplemented in recent decades by satellite observations. The long-term trends in sea level that are observed at tide gauges vary substantially from one location to another. Some of the variability is due to oceanographic effects affecting the elevation of the sea surface, but a predominant control on relative sea-level change is vertical land motion (Box 7).
Chapter 2 | DYNAMIC COASTS IN A CHANGING CLIMATE 47
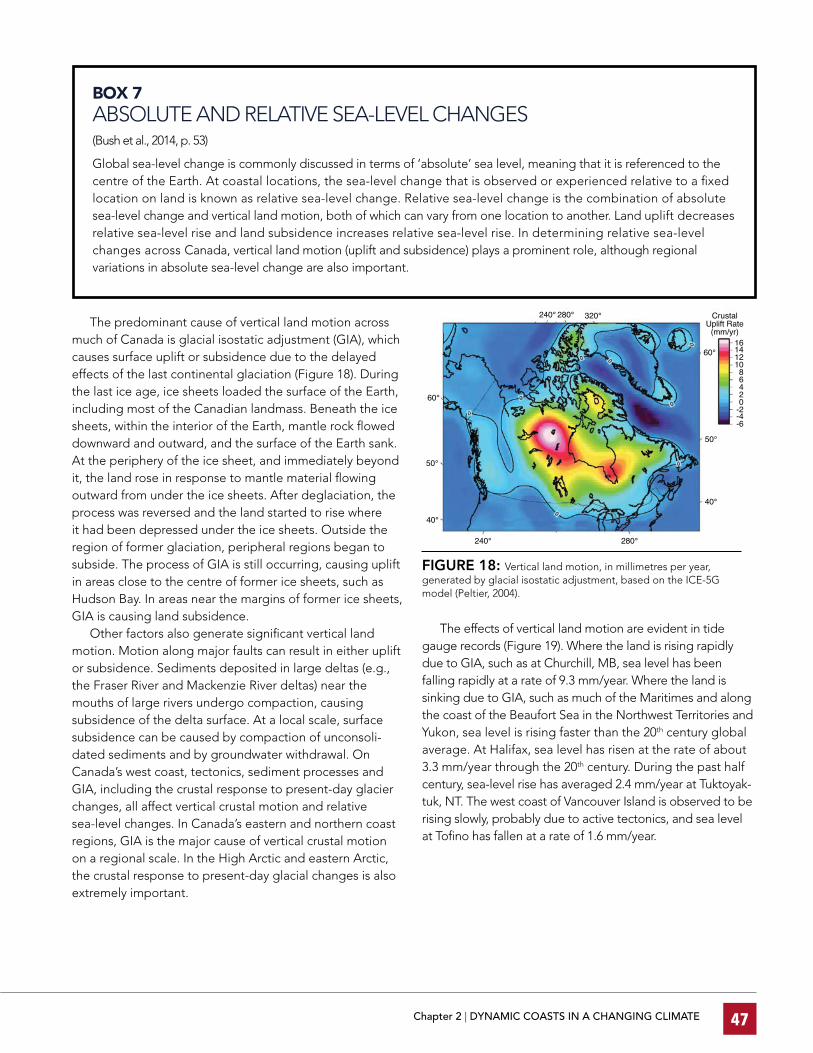
FIGURE 18: Vertical land motion, in millimetres per year, generated by glacial isostatic adjustment, based on the ICE-5G model (Peltier, 2004).
BOX 7 ABSOLUTE AND RELATIVE SEA-LEVEL CHANGES(Bush et al., 2014, p. 53)
Global sea-level change is commonly discussed in terms of ‘absolute’ sea level, meaning that it is referenced to the centre of the Earth. At coastal locations, the sea-level change that is observed or experienced relative to a fixed location on land is known as relative sea-level change. Relative sea-level change is the combination of absolute sea-level change and vertical land motion, both of which can vary from one location to another. Land uplift decreases relative sea-level rise and land subsidence increases relative sea-level rise. In determining relative sea-level changes across Canada, vertical land motion (uplift and subsidence) plays a prominent role, although regional variations in absolute sea-level change are also important.
The predominant cause of vertical land motion across much of Canada is glacial isostatic adjustment (GIA), which causes surface uplift or subsidence due to the delayed effects of the last continental glaciation (Figure 18). During the last ice age, ice sheets loaded the surface of the Earth, including most of the Canadian landmass. Beneath the ice sheets, within the interior of the Earth, mantle rock flowed downward and outward, and the surface of the Earth sank. At the periphery of the ice sheet, and immediately beyond it, the land rose in response to mantle material flowing outward from under the ice sheets. After deglaciation, the process was reversed and the land started to rise where it had been depressed under the ice sheets. Outside the region of former glaciation, peripheral regions began to subside. The process of GIA is still occurring, causing uplift in areas close to the centre of former ice sheets, such as Hudson Bay. In areas near the margins of former ice sheets, GIA is causing land subsidence.
Other factors also generate significant vertical land motion. Motion along major faults can result in either uplift or subsidence. Sediments deposited in large deltas (e.g., the Fraser River and Mackenzie River deltas) near the mouths of large rivers undergo compaction, causing subsidence of the delta surface. At a local scale, surface subsidence can be caused by compaction of unconsoli-dated sediments and by groundwater withdrawal. On Canada’s west coast, tectonics, sediment processes and GIA, including the crustal response to present-day glacier changes, all affect vertical crustal motion and relative sea-level changes. In Canada’s eastern and northern coast regions, GIA is the major cause of vertical crustal motion on a regional scale. In the High Arctic and eastern Arctic, the crustal response to present-day glacial changes is also extremely important.
The effects of vertical land motion are evident in tide gauge records (Figure 19). Where the land is rising rapidly due to GIA, such as at Churchill, MB, sea level has been falling rapidly at a rate of 9.3 mm/year. Where the land is sinking due to GIA, such as much of the Maritimes and along the coast of the Beaufort Sea in the Northwest Territories and Yukon, sea level is rising faster than the 20th century global average. At Halifax, sea level has risen at the rate of about 3.3 mm/year through the 20th century. During the past half century, sea-level rise has averaged 2.4 mm/year at Tuktoyak-tuk, NT. The west coast of Vancouver Island is observed to be rising slowly, probably due to active tectonics, and sea level at Tofino has fallen at a rate of 1.6 mm/year.

CANADA’S MARINE COASTS in a CHANGING CLIMATE 48
FIGURE 19: Long-term trends of relative sea-level change in Canada observed at representative tide gauges. Tide gauge data obtained from the Permanent Service for Mean Sea Level at http://www.psmsl.org/data/obtaining and accessed 19 September 2014.
4.2 FUTURE SEA-LEVEL CHANGEOf particular importance for adaptation planning are
projections of relative sea-level changes. Relative sea-level projections will differ from global sea-level change due to local vertical crustal motion caused by GIA, tectonics and other factors. Sea-level projections also require consider-ation of dynamic oceanographic changes and the Earth’s response to present-day ice-mass changes, including spatial variations in the redistribution of glacial meltwater in the oceans.
Projections of relative sea-level changes for coastal Canada, based on the scenarios and global projections of the IPCC Fifth Assessment Report (IPCC, 2013), have been published by James et al. (2014, 2015). The following section summarizes the methodology and results of that analysis.
4.2.1 GLOBAL SEA-LEVEL RISEThe global sea-level rise projections presented in the
IPCC Fifth Assessment Report and referred to here (Fig-ure 20) are based on the Representative Concentration Pathways (RCP) scenarios (Moss et al., 2010; Boxes 4 and 8). Several of the new RCP scenarios are roughly comparable (in terms of global increases in mean annual temperature by the year 2100) to SRES (Nakićenović et al., 2000, Box 4), which were the standard used for climate change analysis during the last decade (Table 1; further discussion of SRES and RCP scenarios can be found in IPCC (2013) or Bush et al. (2014)). The median projected sea-level rise of the highest emission RCP scenario (RCP8.5) is 1.7 times larger than that for the lowest emission RCP scenario (RCP2.6; Figure 20).

Chapter 2 | DYNAMIC COASTS IN A CHANGING CLIMATE 49
TABLE 1: Projections of changes in global mean temperature and sea level under Representative Concentration Pathways scenarios (RCP; IPCC, 2013) and most closely associated Special Report on Emissions Scenarios (SRES), with respect to median temperature increase by 2100 (Rogelj et al., 2012).
RCP ScenarioLikely global surface temperature increase for 2081–2100* (°)
Likely global sea-level rise for 2081–2100* (m)
Comparable SRES
RCP2.6 0.3–1.7 0.26–0.55 None
RCP4.5 1.1–2.6 0.32–0.63 SRES B1
RCP6 1.4–3.1 0.33–0.63 SRES B2
RCP8.5 2.6–4.8 0.45–0.82 SRES A1FI
* relative to 1986–2005
SPM
Summary for Policymakers
26
• The basis for higher projections of global mean sea level rise in the 21st century has been considered and it has been concluded that there is currently insufficient evidence to evaluate the probability of specific levels above the assessed likely range. Many semi-empirical model projections of global mean sea level rise are higher than process-based model projections (up to about twice as large), but there is no consensus in the scientific community about their reliability and there is thus low confidence in their projections. {13.5}
• Sea level rise will not be uniform. By the end of the 21st century, it is very likely that sea level will rise in more than about 95% of the ocean area. About 70% of the coastlines worldwide are projected to experience sea level change within 20% of the global mean sea level change. {13.1, 13.6}
E.7 Carbon and Other Biogeochemical Cycles
Climate change will a�ect carbon cycle processes in a way that will exacerbate the increase of CO 2 in the atmosphere ( high confidence ). Further uptake of carbon by the ocean will increase ocean acidification. {6.4}
• Ocean uptake of anthropogenic CO2 will continue under all four RCPs through to 2100, with higher uptake for higher concentration pathways (very high confidence). The future evolution of the land carbon uptake is less certain. A majority of models projects a continued land carbon uptake under all RCPs, but some models simulate a land carbon loss due to the combined e�ect of climate change and land use change. {6.4}
• Based on Earth System Models, there is high confidence that the feedback between climate and the carbon cycle is positive in the 21st century; that is, climate change will partially o�set increases in land and ocean carbon sinks caused by rising atmospheric CO2. As a result more of the emitted anthropogenic CO2 will remain in the atmosphere. A positive feedback between climate and the carbon cycle on century to millennial time scales is supported by paleoclimate observations and modelling. {6.2, 6.4}
0.0
0.2
0.4
0.6
0.8
1.0
(m)
2000 2020 2040 2060 2080 2100Year
RC
P2.
6
RC
P4.
5
RC
P6.
0
RC
P8.
5
Mean over2081–2100
Figure SPM.9 | Projections of global mean sea level rise over the 21st century relative to 1986–2005 from the combination of the CMIP5 ensemble with process-based models, for RCP2.6 and RCP8.5. The assessed likely range is shown as a shaded band. The assessed likely ranges for the mean over the period 2081–2100 for all RCP scenarios are given as coloured vertical bars, with the corresponding median value given as a horizontal line. For further technical details see the Technical Summary Supplementary Material {Table 13.5, Figures 13.10 and 13.11; Figures TS.21 and TS.22}
The possibility of global sea-level rise exceeding 1 m by 2100 cannot be rejected. Sea-level projections based on simple relationships between global atmospheric tempera-tures (or heat flux) and global sea-level rise, termed semi-empirical projections (Rahmstorf, 2007), estimate larger amounts of sea-level rise by 2100 (e.g., 75–190 cm, Vermeer and Rahmstorf, 2009; 60–160 cm, Jevrejeva et al., 2010). However, recent advances in understanding the processes of ice sheet stability, combined with the very large variability of the semi-empirical results, led the authors of the IPCC Fifth Assessment Report to assign low confidence to such predictions (Church et al., 2013a). The implications of larger amounts of projected global sea-level rise are considered further in Chapter 3 in the context of tolerance to risk.
As noted above, global sea-level rise has contributions from a variety of components. Church et al. (2013a) provide estimates of the contributions to global sea-level rise from thermal expansion of the upper layer of the ocean (referred to as the steric effect); mountain glaciers and ice caps, the Greenland and Antarctic ice sheets; and land-water storage (groundwater depletion and water reservoir impoundment). Contributions from the West Antarctic Ice Sheet are a particu-larly important factor, but are poorly constrained (Church et al., 2013a). Analyses of the additional amount of sea-level rise that might be produced from instability of the marine-based West Antarctic Ice Sheet at 2100 (Pfeffer et al., 2008; Katsman et al., 2011; National Research Council, 2012; Bindschadler et al., 2013) arrive at a mean upper-end estimate of 64.6 cm. The Summary for Policymakers, which is the contribution of Working Group I to the IPCC Fifth Assessment Report (IPCC, 2013, p. 25) states:
Based on current understanding, only the collapse of marine-based sectors of the Antarctic ice sheet, if initiated, could cause global mean sea level to rise substantially above the likely range during the 21st century. However, there is medium confidence that this additional contribution would not exceed several tenths of a meter of sea level rise during the 21st century.
To account for this possible additional contribution to global sea-level rise this century, the analysis in this report considers one additional scenario beyond those used in the IPCC Fifth Assessment Report (Box 8; Table 2). In all, this report focuses on the sea-level projections for four scenar-ios, summarized in Table 2. Discussion of the relevance of these scenarios for determination of risks to coastal man-agement is presented in Chapter 3, as well as the regional chapters of this report.
FIGURE 20: Projected sea-level rise during the 21st century relative to 1986–2005 for RCP2.6 (low-emissions scenario) and RCP8.5 (high-emissions scenario; Figure SPM.9, IPCC, 2013). The lines indicate the median projection and the shading indicates the assessed range (5th–95th percentile, or 90% confidence interval). The projected mean sea-level rise over 2081–2100 is given on the right for all four RCP scenarios.

CANADA’S MARINE COASTS in a CHANGING CLIMATE 50
FIGURE 21: Crustal-uplift and subsidence rates determined from GPS-derived data (in millimetres per year; Craymer et al., 2011).
BOX 8 GLOBAL SEA-LEVEL RISE SCENARIOS USED IN THIS REPORTProjections of sea-level rise presented in this chapter and used throughout this report focus on four scenarios of global sea-level rise. Three of the four, RCP2.6, 4.5 and 8.5, are identical to those presented in the IPCC Fifth Assessment Report (IPCC, 2013). The fourth RCP scenario considered by the IPCC, RCP6.0, is associated with projections of global sea-level rise very similar to, but slightly larger than, RCP4.5 (Figure 20). Both are considered intermediate-emissions scenarios and only RCP4.5 is presented here to simplify the visual presen-tation of sea-level rise projections.
In addition to the model-based RCP scenarios, this report also presents a scenario to evaluate the effect a partial collapse of the West Antarctic Ice Sheet would have on relative sea-level change in Canada. The high-emissions scenario RCP8.5, the most likely scenario to be associated with ice-sheet collapse, is augmented by an additional 65 cm of sea-level rise originating from West Antarctica. Here termed the ‘high-emissions plus Antarctic Ice-Sheet
reduction’ scenario, it provides the largest amount of global sea-level rise and represents a possible upper bound to global sea-level rise by 2100, based on infor-mation contained in the IPCC Fifth Assessment Report (Table 2; IPCC, 2013). For planning purposes, the scenar-ios may be considered in the context of tolerance to risk of sea-level rise (Chapter 3; Parris et al., 2012).
TABLE 2: Scenarios utilized in this report for generating relative sea-level rise projections.
Scenario Descriptive scenario name
RCP2.6 Low-emissions
RCP4.5 Intermediate-emissions
RCP8.5 High-emissions
RCP8.5 plus 65 cm from partial West Antarctic ice-sheet collapse
High-emissions plus Antarctic ice-sheet reduction
4.2.2 VERTICAL LAND MOTIONAs discussed previously, vertical land motion strongly
influences changes in relative sea level. Land uplift will reduce the amount of sea-level rise experienced at a site; conversely, land subsidence will add to the amount of relative sea-level rise. Present-day land uplift or subsidence is measured using Global Positioning System (GPS) technology, or more generally Global Navigation Satellite Systems. The position of an antenna, generally fixed to bedrock, is monitored on a continuous or repetitive basis over many years by tracking the navigation satellite constellation(s). The long-term uplift rate is obtained from the vertical position time series.
The density of GPS stations varies significantly across Canada (Figure 21), with most having data spanning 5–15 years. Uplift rates (the methodology is presented in James et al., 2014) are generally coherent across Canada. In the East Coast region, vertical motion ranges from uplift of ~1–4.5 mm/year for Quebec sites to subsidence of up to ~2 mm/year at some locations in Nova Scotia. On the west coast, uplift rates vary from subsidence of about 1 mm/year in Puget Sound to almost 4 mm/year in the middle part of Vancouver Island, and smaller amounts of uplift further north. The west coast of Vancouver Island is rising due to accumulating strain from the subduction of the Juan de Fuca plate beneath North America. The largest variation in vertical land motion is observed in the Arctic. Hudson Bay is
rising at a rate of 10 mm/year or more, resulting in falling relative sea level. Significant portions of the Canadian Arctic Archipelago are rising a few millimetres per year, whereas the isostatically subsiding Beaufort Sea coastline in the western Arctic is sinking at a rate of 1–2 mm/year. Sparse GPS observations from the eastern Arctic and High Arctic indicate uplift rates of a few millimetres per year arising from a combination of GIA and crustal response to present-day ice-mass change.

Chapter 2 | DYNAMIC COASTS IN A CHANGING CLIMATE 51
4.2.3 EFFECTS OF PRESENT-DAY ICE-MASS CHANGE
Meltwater from glaciers, ice caps and ice sheets is not distributed uniformly throughout the world’s oceans (Farrell and Clark, 1976; Mitrovica et al., 2001, 2011). As a glacier or ice sheet melts, the reduced mass of the remaining ice causes the land under and adjacent to a shrinking ice sheet to rise because the Earth’s crust reacts like an elastic object and springs back. Additionally, the shrinking ice mass exerts a reduced gravitational pull on the surrounding ocean water, causing the nearby ocean surface to fall (Figure 22). The effect can be very significant for sites close to meltwater sources. Canada hosts significant volumes of mountain glaciers and ice caps in the North and, on a global scale, is relatively close to the Greenland ice sheet. Western Canada
is also influenced by the rapidly wasting mountain glaciers and ice fields of the Coast Mountains and the Gulf of Alaska. Thus, for Canadian localities it is particularly important that sea-level projections incorporate the effects of present-day ice-mass change.
4.2.4 REGIONAL OCEANOGRAPHIC EFFECTSGlobal ocean currents generate ‘dynamic’ sea-surface
topography of more than 1 m in amplitude. Changes to ocean currents can lead to changes in the sea-surface topography and hence to changes in local relative sea level. A robust feature of such dynamic sea-level changes is that sea-level rise due to the weakening of the Gulf Stream is predicted for northeastern coastal North America in the coming century (Yin et al., 2010; Yin, 2012; Church et al., 2013a). For the western Arctic, dynamic oceanographic changes in sea level are projected to be nearly as large as in the East Coast region, while on the Pacific coast they are expected to be relatively small. In contrast, a large ENSO event can raise sea levels by several tens of centimetres in the West Coast region (Section 4.3; Thomson et al., 2008).
4.3 PROJECTIONS OF SEA-LEVEL CHANGE IN CANADA
4.3.1 PROJECTIONS OF RELATIVE SEA-LEVEL CHANGE
Relative sea-level projections were generated for 69 coastal communities and other locations in Canada and the northern United States by James et al. (2014; Figure 23) based on the IPCC Fifth Assessment Report (Church et al., 2013a, b). The projections incorporate contributions to global sea-level rise from the steric effect, land ice and anthropogenic influences such as groundwater pumping, as described above, and also include the spatially varying effects of dynamic oceanography and present-day ice-mass changes. Vertical land motion determined by GPS was utilized to determine projected relative sea-level change (Mazzotti et al., 2008; methodology presented in James et al., 2014).
Spatial differences in projected relative sea-level change are similar to historical sea-level changes and largely follow the pattern of vertical land movement. The largest amounts of projected sea-level rise, which exceed 75 cm for the median projection of the high-emissions scenario at 2100 (red dots on Figure 23), occur where the land is presently sinking due to GIA in the East Coast region. Large amounts of projected sea-level rise are also present in Puget Sound in northern Washington State. Other areas where the land is also sinking, or rising at low rates due to GIA, and that feature projected sea-level rise larger than 50 cm (orange dots) include the Beaufort Sea coastline, some regions of Newfoundland and Quebec, and, on the Pacific coast, the Fraser River lowland and northern British Columbia. Active
FIGURE 22: The amount of relative sea-level rise, in millimetresper year, for an assumed 1 mm/year contribution to global sea-level rise from a) Antarctica, b) Greenland, and c) mountain glaciers and ice caps (from Mitrovica et al., 2001). Close to a source of sea-level rise, relative sea level will fall. At greater distances the sea-level rise is smaller than the global average. At even larger distances, sea-level rise is slightly higher than the global average.

CANADA’S MARINE COASTS in a CHANGING CLIMATE 52
tectonics and, on the Fraser River delta, sediment consoli-dation (Mazzotti et al., 2009), contribute to vertical crustal motion in the west. Where the land is presently rising fastest, in Hudson Bay and the central Canadian Arctic Archipelago, sea level is projected to fall by more than 50 cm (dark blue and purple dots on Figure 23). In the High Arctic and eastern Arctic, the effects of present-day ice-mass changes (of Arctic glaciers and ice caps, and the Greenland ice sheet) contribute to reduced amounts of projected sea-level rise or small amounts of sea-level fall. This is especially pronounced at Alert, the northernmost location of this region, where proximity to the Greenland ice sheet contributes to large projected sea-level fall due to the elastic crustal uplift caused by the projected reduction of the Greenland ice sheet and Arctic ice caps.
Figure 24 summarizes the sea-level projections for all scenarios for Halifax, NS; Vancouver, BC; Nain, NL; and La Grande 1, QC. These scenarios span a range of vertical crustal motion from about –1 mm/year (Halifax, sinking) to 15 mm/year (La Grande 1, rising rapidly). The high-emissions plus Antarctic Ice-Sheet reduction scenario is notable in providing projections of relative sea-level change exceeding 150 cm at Halifax at 2100 and predicting only negligible sea-level fall at the fastest rising location of La Grande 1 (especially when contrasted with the low-emissions scenario, which anticipates about 50 cm of sea-level rise at Halifax and more than 100 cm of sea-level fall at La Grande 1). Further details on regional variability of projected sea-level changes are presented in Chapters 4 (East Coast region), 5 (North Coast region) and 6 (West Coast region) of this report.
4.3.2 EXTREME WATER LEVELSOne of the most serious consequences of sea-level rise
is its effect on extreme water levels. These are typically associated with storm surges superposed on high tides. Contributions from seasonal and annual variability and wind waves also play a role. In the Pacific, large ENSO events can lead to sea-level changes of several tens of centimetres (Thomson et al., 2008). A storm surge is defined as the difference between observed water level and the predicted astronomical tide, and results from variations in atmospheric pressure and wind. Storm surges in Canada have maximum heights of 1 m or more on all three coasts (Bernier and Thompson, 2006; Manson and Solomon, 2007; Thomson et al., 2008). Extreme water levels (combined tide and surge) will be even higher in future as a result of sea-level rise (Box 9). Extreme water levels are a critical consideration in coastal management and climate adaptation planning, as discussed in Chapter 3.
FIGURE 24: Projected relative sea-level change, based on the IPCC Fifth Assessment Report (Church et al., 2013a, b) and utilizing vertical (V) crustal motion (uplift rate, given to nearest 0.5 mm/year) derived from GPS observations indicated in each panel for a) Halifax, b) Vancouver, c) Nain and d) La Grande 1 (James et al., 2014, 2015). Projections are given through the current century for the low-emis-sions (RCP2.6), intermediate-emissions (RCP4.5) and high-emissions (RCP8.5) scenarios. The projected value at 2100 is also given for the high-emissions plus Antarctic Ice-Sheet reduction scenario (RCP8.5+W.Ant; green triangle). Rectangles show the 90% confidence interval (5th–95th percentile) of the average projection over the period 2081–2100 and also include the RCP6.0 scenario; the dashed red line shows the 95th percentile value for the high-emissions scenario.
FIGURE 23: Projected relative sea-level change at 2100 (in cm) for the median of the high-emissions scenario (RCP8.5) at 69 coastal locations in Canada and the northern United States (James et al., 2014, 2015). Values range from -84 to 93 cm, and refer to the average conditions in the period 1986–2005.
a) b)
c) d)
e)

Chapter 2 | DYNAMIC COASTS IN A CHANGING CLIMATE 53
BOX 9 HISTORICAL AND PROJECTED FUTURE EXTREME WATER LEVELS – EXAMPLE FROM HALIFAX, NOVA SCOTIAThe historical frequency distribution for the annual maximum hourly water level (largest hourly water level during each calendar year) arising from the combined effects of tide and surge at Halifax in metres above the mean is shown in Figure 25 for the period 1920–2007 (Forbes et al., 2009). The record extreme water level of 1.87 m was associated with Hurricane Juan in 2003. The previous record water level in Halifax Harbour was about 4 cm lower and occurred during a winter storm in 1967. Assuming that storm frequency, intensity and storm tracks do not change (i.e., assuming the shape of the extreme water-level distribution expressed by the red line in Figure 25 remains the same), the peak water level for a 1 in 50 year storm can be obtained by adding 1.74 m to any future mean water level. For example, assuming a rise in sea level from 2010 to 2050 of 40 cm, or roughly the upper limit of the high-emissions scenarios (RCP8.5) from James et al. (2014), the distribution curve will be shifted upward by that amount (broken brown line following the same curve) and the 1 in 50 year water level in 2050 will be 40 cm higher (far exceeding the current record water level). The 2050 curve is located much further to the left, showing that the current 1 in 50 year extreme water level would have a return period (average recurrence interval) of less than 2 years in 40 years time, and that today’s maximum recorded water level (the level associated with Hurricane Juan) would occur on average more than once every 5 years. Extrapolating to the end of the century, these levels would occur even more frequently. Where
climate change brings about a change in the storm climatology, this would also alter the shape of the extreme water-level distribution. However, in almost all cases sea-level rise will remain the dominant factor (Bernier and Thompson, 2006; Bernier et al., 2007).
FIGURE 25: Annual maximum hourly water levels (WL; metres above mean) in Halifax Harbour, NS, 1920–2007, and associated return periods in years. The red line is the best fit to the observations achieved with a mathematical model (general-ized extreme values distribution) with a 95% confidence interval (shaded envelope; figure courtesy of K. Thompson, Dalhousie University). This plot indicates the average recurrence interval for any given annual maximum water level today and the change in return period that results from a rise in mean sea level (modified from Forbes et al., 2009).
With more thermal energy in a warmer atmosphere, there is an expectation of increasing storminess on a global scale. However, at any one location, storminess may or may not increase, depending on the position relative to storm-source regions and tracks. There is high confidence that increases in extreme water levels will primarily be the result of increases in mean relative sea level and reductions in sea ice, but low confidence is attached to region-specific projections of storminess and associated storm surges (IPCC, 2013).
Interannual and seasonal variability, harbour seiches, wind waves, setup and runup are all factors contributing to extreme water levels. Ocean-surface heights vary on time scales from hours to years due to atmospheric and ocean circulation, and variability. The latter may arise from ENSO, PDO and NAO events (Box 5), seasonal warming and runoff, storms, and changes to ocean circulation. On the Pacific
coast, sea level generally rises during a positive phase of the PDO in the summer and a warm (positive) phase of El Niño in the winter (Abeysirigunawardena and Walker, 2008). Extreme ENSO events can result in coastal sea-level changes of a few tens of centimetres, as indicated in Figure 19 (e.g., the large positive excursion in sea levels at the West Coast region sites at the end of 1997 and beginning of 1998). Together these factors produce short-term, large-amplitude variability that causes peak water levels to vary substantially throughout the year and from year to year. Its strong variability is superimposed on the slow rise in mean sea level, which leads to incrementally higher water levels over time where relative sea level is rising.
Globally, wind speed and wave height have increased in recent decades (Young et al., 2011). Ocean waves are a combination of swell travelling from large distances and

CANADA’S MARINE COASTS in a CHANGING CLIMATE 54
locally generated wind waves. Over most of the world’s oceans, ocean-wave energy is dominated by swell (Fan et al., 2014), although the swell contribution drops to around 50% for most seasons in the North Atlantic. Long-term (decadal) changes in wave height in the northern hemisphere (wave heights are closely associated with ENSO and PDO events in the Pacific and with the NAO event in the Atlantic) show increases in both ocean basins over the past 50 years (Gulev and Grigorieva, 2004, 2006; Wang et al., 2012). Projections of wave heights as yet give mixed results (Hemer et al., 2012, 2013; Fan et al., 2014; Wang et al., 2014a; Vose et al., 2014), although in much of the Arctic, including the Beaufort Sea, the combined effects of winds and projected reduced sea-ice concentrations give projected increases in wave heights (Khon et al., 2014). Modest swell has been observed in recent years in the Beaufort Sea and has been linked to sea-ice reductions (Thomson and Rogers, 2014). Increased wave heights contrib-ute to increased wave setup and runup and larger waves may have greater erosive power.
Changes in sea-ice cover have important implications for wind waves reaching the coast and, therefore, an effect on extreme water levels in the North and East Coast regions. Nearshore sea ice prevents waves from breaking directly onshore and reduces wave run-up (Forbes and Taylor, 1994; Allard et al., 1998). Ice further offshore reflects waves and reduces the amplitude of waves before they reach the shoreline (Wadhams et al., 1988; Squire, 2007). More open water will lead to larger waves even if the winds are unchanged. Thus, in areas where there are projected reductions in sea ice, such as Atlantic Canada and the Arctic, there is the potential for increased extreme water levels due to wave run-up.
4.3.3 SEA-LEVEL PROJECTIONS BEYOND 2100
Global sea level will continue to rise beyond 2100. Projec-tions presented in Figure 26 are based on carbon dioxide concentrations at 2100 (Church et al., 2013a). Estimates of projected global sea-level rise to 2500 range from less than 1 m for low-emissions scenarios2 (including RCP2.6) to 1–2 m for intermediate-emissions scenarios (including RCP4.5) and several metres for high-emissions scenarios (including RCP8.5, Figure 26). Medium confidence is attached to the projections to 2300 and low confidence beyond that year (IPCC, 2013).
The general patterns of projected relative sea-level change in Canada beyond 2100 will be similar to the patterns of historical sea level and projections noted during the current century. The amount of sea-level rise is highly dependent on future atmospheric concentrations of carbon dioxide.
2 Low-, intermediate- and high-emissions scenarios defined in this section are based on CO2 concentrations and with reference to Figure 13.13 of Church et al. (2013a), and do not correspond exactly to definitions used elsewhere in this report.
Locations where the land is rising quickly will experience reduced sea-level rise, or sea-level fall, depending on the rate of land uplift and on the amount of global sea-level rise. In contrast, locations that are presently sinking will experience relative sea-level rise larger than the global value. Portions of the Maritime provinces, the Beaufort Sea coastline and the Fraser River lowland are most susceptible to relative sea-level rise larger than the global mean.
5 COASTAL RESPONSE TO SEA-LEVEL RISE AND CLIMATE CHANGE
5.1 PHYSICAL RESPONSEIn this section, we consider the implications of sea-level
rise and climate change for coastal erosion and shoreline retreat, for short-term storm flooding and long-term inunda-tion of natural and developed coasts. The importance of these impacts for coastal management is discussed in subsequent chapters (see Chapters 3–6).
The rise of mean sea level projected for coming decades (Section 4) will have little effect on many natural coasts, which will adjust naturally to the changing range of water levels and wave conditions. However, in some low-lying areas the impacts of mean sea-level rise will be more evident, pushing salt marshes landward up valleys (assuming available accom-modation space), driving the landward migration of spits and barrier beaches with associated dune systems, killing trees
FIGURE 26: Projected global sea-level change from 2100 to 2500, based on carbon dioxide concentrations at 2100 (based on Figure 13.13 of Church et al., 2013a; see footnote 2).

Chapter 2 | DYNAMIC COASTS IN A CHANGING CLIMATE 55
through saltwater intrusion and converting subaerial tundra to saline marshland. The specific response of these dynamic components of the coastal system will depend in part on a wide range of factors such as changing sea-ice extent, wave conditions, biological productivity and sediment budgets. Evidence for slow inundation of low-lying tundra along the Beaufort Sea coast and in the outer Mackenzie Delta is clear from flooded ice-wedge polygons that are typical features of this landscape, but cannot form under water (Figure 27).
Changes in mean sea level and shoreline erodibility (which depends on geology, wave energy and other factors) are the two dominant controls over long-term stability or migration of marine shorelines because they influence sediment supply. In the absence of other factors, rising sea level eventually inun-dates backshore topography, with the rate of shoreline retreat depending on the change in sea level and the land surface slope, as reflected in the long-term evolution of coasts in Atlantic Canada (Figure 4). However, if the sediment supply is sufficient to counteract the landward migration associated with sea-level rise, then the shoreline may remain stable or advance seaward as it aggrades to keep pace with the rising sea level (Curray, 1964). Examples of this can be seen in areas of local sediment abundance in various regions undergoing submer-gence in Canada. Small-scale barrier beaches on the west coast of Banks Island (Figure 28), a large foreland at the northern end of Baffin Island, Nunavut (St-Hilaire-Gravel et al., 2015), and many small, bayhead, prograded paraglacial barriers in Atlantic Canada attest to the importance of sediment supply (Forbes et al., 1995b; Orford et al., 2001; Forbes, 2011).
Shallow sloping shores subject to wave action are dynamic systems involving complex wave transformation and nearshore circulation. Rising sea level will induce a redistribution of sediment along such coasts—in its simplest form, sediment will be eroded and may be deposited offshore until a new equilibrium shore face is established. This is the premise behind a simple geometric model proposed by Bruun (1954, 1962). Although several underlying assumptions of the model are rarely satisfied, it is nevertheless widely, and often inappropriately, used owing to its simplicity (Cooper and Pilkey, 2004; New Zealand Ministry for the Environment, 2008). Some of the factors that can alter the shoreline response include complexities in the nearshore profile (outcropping bedrock, varying rock types), alongshore wind trends and variability in longshore transport, sand losses landward into coastal dunes or barrier washover.
Forecasting coastal retreat is not simple and requires analysis of the impacts of storm events and changes in historical erosion rates in conjunction with sea-level rise (Cambers, 2009; Daniel and Abkowitz, 2005; Gibbs and Hill, 2011; Government of Western Australia, 2006; New Zealand Ministry for the Environment, 2008). Additional factors include storm sequencing (Phillips, 1999; Forbes et al., 2004), changes in rates of freeze-thaw and winter slope degradation (Bernat-chez and Dubois, 2008), changes in rates of thermal abrasion in ice-rich permafrost (related to rising air, sea and ground temperatures; e.g., Aré [1988], Wobus et al. [2011], Barnhart et al. [2014a]) and in wave energy (related to changing sea-ice distribution; e.g., Overeem et al. [2011], St-Hilaire-Gravel et al. [2012], Barnhart et al. [2014b]). Some data necessary for such
FIGURE 27: Ice-wedge polygons inundated by rising sea level, Beaufort Sea coast near Hutchison Bay on the Tuktoyaktuk Peninsula, Northwest Territories. Photo courtesy of D. Whalen, Natural Resources Canada, August 2013.
FIGURE 28: View looking north of a prograded barrier beach at Lennie Harbour, west coast of Banks Island, Northwest Territories, showing how excess sediment supply to this embayment has counteracted the effects of rising sea level. Older beach ridges on the inner part of the barrier (at the right) formed at lower sea level and have lower crest elevation than the active storm ridge at the left. Photo courtesy of D.L. Forbes, Natural Resources Canada, July 2002.
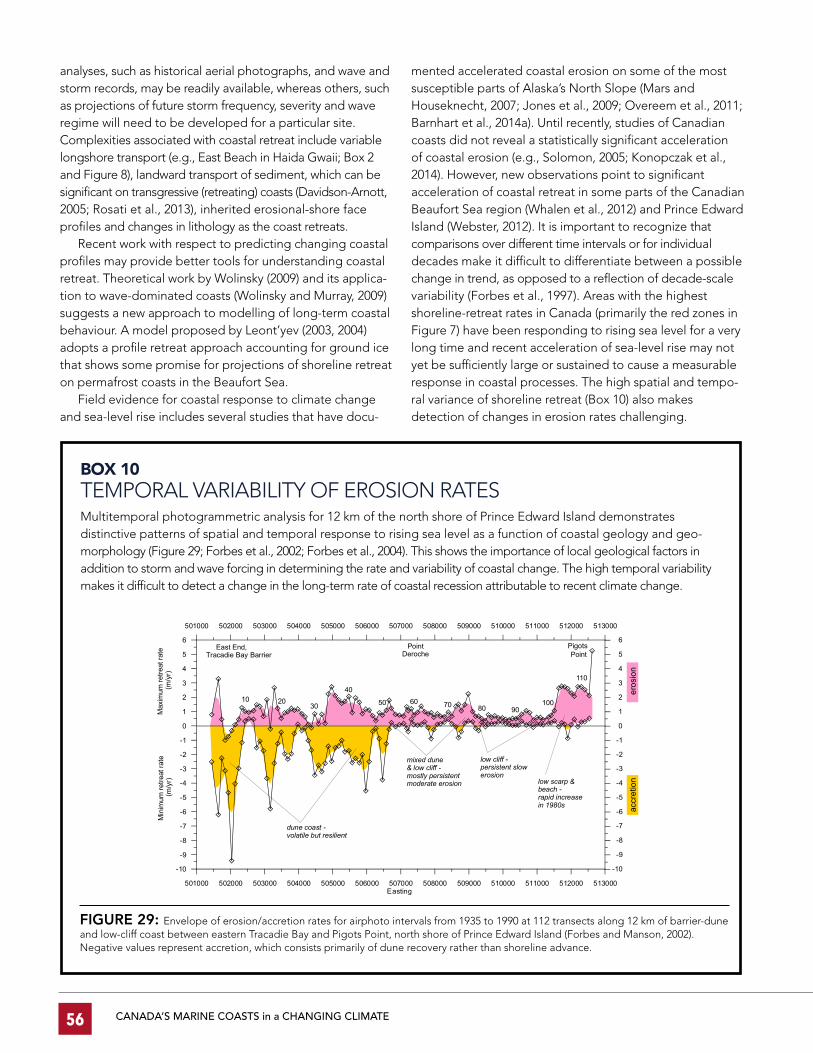
CANADA’S MARINE COASTS in a CHANGING CLIMATE 56
FIGURE 29: Envelope of erosion/accretion rates for airphoto intervals from 1935 to 1990 at 112 transects along 12 km of barrier-dune and low-cliff coast between eastern Tracadie Bay and Pigots Point, north shore of Prince Edward Island (Forbes and Manson, 2002). Negative values represent accretion, which consists primarily of dune recovery rather than shoreline advance.
analyses, such as historical aerial photographs, and wave and storm records, may be readily available, whereas others, such as projections of future storm frequency, severity and wave regime will need to be developed for a particular site. Complexities associated with coastal retreat include variable longshore transport (e.g., East Beach in Haida Gwaii; Box 2 and Figure 8), landward transport of sediment, which can be significant on transgressive (retreating) coasts (Davidson-Arnott, 2005; Rosati et al., 2013), inherited erosional-shore face profiles and changes in lithology as the coast retreats.
Recent work with respect to predicting changing coastal profiles may provide better tools for understanding coastal retreat. Theoretical work by Wolinsky (2009) and its applica-tion to wave-dominated coasts (Wolinsky and Murray, 2009) suggests a new approach to modelling of long-term coastal behaviour. A model proposed by Leont’yev (2003, 2004) adopts a profile retreat approach accounting for ground ice that shows some promise for projections of shoreline retreat on permafrost coasts in the Beaufort Sea.
Field evidence for coastal response to climate change and sea-level rise includes several studies that have docu-
mented accelerated coastal erosion on some of the most susceptible parts of Alaska’s North Slope (Mars and Houseknecht, 2007; Jones et al., 2009; Overeem et al., 2011; Barnhart et al., 2014a). Until recently, studies of Canadian coasts did not reveal a statistically significant acceleration of coastal erosion (e.g., Solomon, 2005; Konopczak et al., 2014). However, new observations point to significant acceleration of coastal retreat in some parts of the Canadian Beaufort Sea region (Whalen et al., 2012) and Prince Edward Island (Webster, 2012). It is important to recognize that comparisons over different time intervals or for individual decades make it difficult to differentiate between a possible change in trend, as opposed to a reflection of decade-scale variability (Forbes et al., 1997). Areas with the highest shoreline-retreat rates in Canada (primarily the red zones in Figure 7) have been responding to rising sea level for a very long time and recent acceleration of sea-level rise may not yet be sufficiently large or sustained to cause a measurable response in coastal processes. The high spatial and tempo-ral variance of shoreline retreat (Box 10) also makes detection of changes in erosion rates challenging.
BOX 10 TEMPORAL VARIABILITY OF EROSION RATESMultitemporal photogrammetric analysis for 12 km of the north shore of Prince Edward Island demonstrates distinctive patterns of spatial and temporal response to rising sea level as a function of coastal geology and geo-morphology (Figure 29; Forbes et al., 2002; Forbes et al., 2004). This shows the importance of local geological factors in addition to storm and wave forcing in determining the rate and variability of coastal change. The high temporal variability makes it difficult to detect a change in the long-term rate of coastal recession attributable to recent climate change.
501000 502000 503000 504000 505000 506000 507000 508000 509000 510000 511000 512000 513000Easting
-10
-9
-8
-7
-6
-5
-4
-3
-2
-1
0
1
2
3
4
5
6
-10
-9
-8
-7
-6
-5
-4
-3
-2
-1
0
1
2
3
4
5
6
501000 502000 503000 504000 505000 506000 507000 508000 509000 510000 511000 512000 513000
PointDeroche
East End,Tracadie BarBay rier
Pigots Point
Max
imum
retre
at ra
te
(m/y
r)M
inim
um re
treat
rate
(m/y
r)
eros
ion
accr
etio
n
110
1009080706050
40
302010
dune coast -volatile but resilient
mixed dune & low cliff -mostly persistent moderate erosion
low cliff -persistent slowerosion
low scarp &beach -rapid increasein 1980s

Chapter 2 | DYNAMIC COASTS IN A CHANGING CLIMATE 57
5.2 ECOLOGICAL RESPONSE
5.2.1 COASTAL SQUEEZEAn important consideration in the response of coastal
systems to sea-level rise is the potential loss of important habitat through a phenomenon known as ‘coastal squeeze’. Coastal components such as estuaries, mud flats, and tidal marshes, which provide valuable ecosystem services, occupy the transition zone between the land and the sea. Under conditions of rising sea level, intertidal flats and marshes can maintain area by accreting vertically to keep pace with the rise in sea level or by migrating landward as rising water levels gradually expand upslope.
Tidal marshes have the potential to accrete vertically through increased biological productivity and feedback between the growth of salt marsh vegetation and sediment accumulation, but the response can be complex (McKee et al., 2012) and there may be a substantial lag in the marsh response (Kirwan and Murray, 2008a). Establishment of new marsh area upslope (or upvalley) can compensate for flooding of the original marsh platform by conversion of previous land or freshwater wetland areas to salt marsh in the new range of appropriate tide levels. The introduction of tidal flooding in previously nontidal wetlands can also enhance sedimentation rates (e.g., Orson et al., 1990). The extent of the new marsh system is dependent on the landward slope providing room for migration of the coastal system. Although high backshore relief can limit landward migration of flats and marshes, artificial barriers such as roads, causeways, seawalls, dikes and foundation fill are the dominant causes of coastal squeeze. The upper limits of various intertidal vegetation zones associated with particular frequencies of tidal flooding (such as mud flat, low marsh, transitional marsh and high marsh) shift landward as sea level rises (Box 11). If the high marsh biome is prevented from moving inland by natural or artificial barriers, but the transitional marsh shifts landward into the high-marsh zone, this will result in loss of high marsh and an overall loss of marsh area (Kirwan and Murray, 2008b; Hill et al., 2013).
In Nova Scotia, more than half of the 33 000 ha of salt marsh is diked (Roberts and Robertson, 1986). This sug-gests that, although rates of natural marsh accretion in the outer Bay of Fundy may be keeping pace with historical sea-level rise (Chmura et al., 2001), accelerated sea-level rise may pose a risk of marsh loss through coastal squeeze (Chmura, 2013). To address this concern, Torio and Chmura (2013) have developed a ‘coastal squeeze index’ to rank the threat of squeeze to specific marshes or groups of marshes under various sea-level rise scenarios and physio-graphic settings. In many cases, a combination of sea-level rise and coastal squeeze with other factors leading to marsh degradation may result in rapid marsh zone loss over a few decades (Hartig et al., 2002).
Coastal squeeze is not limited to marsh environments but can affect other components of the coastal system, from estuaries and eelgrass beds to beaches. Coastal protection structures that attempt to fix the shoreline in place can be threatened over time as the beach in front becomes narrower or disappears. In this way, the negative impacts of coastal squeeze can increase the exposure and possibly the stability of the barrier structures themselves, or critical infrastructure they may be protecting, as the natural sedimentary buffer provided by a beach is diminished (Jolicoeur and O’Carroll, 2007; Bernatchez and Fraser, 2012).
5.2.2 COASTAL DUNESDunes develop on coasts with excess sediment supply and
winds capable of moving sand onshore to be stored in a dune system. Dune development and maintenance requires a sand supply, a positive sediment budget and, typically, vegetation to trap and hold the sand in the dunes. Carter (1991) distin-guished between sand-fixing vegetation such as Atriplex spp. and sand-building grasses such as Ammophila spp. or Elymus arenarius. Established dunes may be colonized by a wide variety of other herbaceous and woody plants, which progres-sively diminish the mobility of the dunes (McCann and Byrne, 1989). In some cases, dunes also invade or overwhelm forest or woodland behind the beach (Heathfield et al., 2013).
Dunes provide valuable ecosystem services in the form of coastal protection, as both natural seawalls and erosional buffers, storing sand which is mobilized in storms and may be subsequently returned to the dunes (Ollerhead et al., 2013), thus forming “self-compensating coastal systems” (Carter, 1991). Permeable dune systems may also help to impede saline intrusion by supporting a lens of fresh groundwater that is readily recharged by precipitation and discharges into the beach or nearshore. Coastal sandy beach-dune complexes host a range of distinctive habitats and plant communities, and provide important nesting habitat for species such as piping plover (Charadrius melodus) and some songbirds. Small freshwater wetlands in dune slacks represent another distinctive dune-related habitat.
The sensitivity of dunes to climate change may relate to sea-level rise and erosion, possible changes in the wind regime and the response of dune vegetation to changes in seasonality, temperature, precipitation, CO2 and other factors such as disturbance and management strategies. Canadian dune systems, at least in the east and north, are affected by winter freezing and snow cover, which can limit sand mobility (when the beach and dune faces are frozen) and retard the growth of dune grass (McCann, 1990). Under a warmer climate, the season of active sand mobility and biological productivity may be longer, and productivity may increase. The northern range of Ammophila spp. may also expand.

CANADA’S MARINE COASTS in a CHANGING CLIMATE 58
BOX 11 COASTAL SQUEEZEThe intertidal zone of the Fraser River delta, in British Columbia, is an area of high ecological value. Eelgrass (Zostera marina and Zostera japonica) meadows, mud flats and associated diatom biofilms, and various zones of the vegetated tidal marshes provide spawning habitat and sustain invertebrates, fish, and birds of various species in large numbers. The sedimentary and biological response of these components of the intertidal system to sea-level rise is not only complicated by additional factors such as reduced sediment supply (from channel dredging) and grazing of the dominant low-marsh grass Scirpus americanus by geese (Kirwan et al., 2008; Hill et al., 2013), but also moderated by biomass productivity, sediment trapping and vertical accretion. The landward transgression of the marsh vegetation zones is blocked by dikes across most of the Fraser Delta front, leading to substantial marsh loss over the coming century under a range of sea-level rise scenarios. Using ‘median’ and high rates from older projections of sea-level rise (IPCC, 2001), Kirwan and Murray (2008b) computed marsh losses of 15%–35% on Westham Island (central Fraser River delta front), of which they estimated 70% was attributable to the presence of the dike (Figure 30). The dominant high-marsh grass, Scirpus maritimus, is more productive than S. americanus, so preferential loss of high marsh zones also prejudices overall growth and sediment trapping capacity (Hill et al., 2013). The same study concluded that a 55 cm rise in mean sea level would result in a 41% loss of high marsh, 15% expansion of the transitional marsh zone, 22% loss of low marsh (to open water) and an overall marsh loss of 20%, with a biomass productivity reduction of 21%.
Wes
tham
Islan
d De
lta B
C
Robe
rts B
ank
Fras
er D
elta
N
0 1km
FIGURE 30: LiDAR-derived digital elevation model and projected marsh vegetation zones, Westham Island, Fraser River delta, British Columbia, under ‘median sea-level rise scenario adjusted for local subsidence’ (modified from Kirwan and Murray, 2008b). Note loss of both high and low marsh zones, where much of the high-marsh loss is due to the presence of dikes and coastal squeeze.

Chapter 2 | DYNAMIC COASTS IN A CHANGING CLIMATE 59
Even under the present climate regime, coastal dunes in parts of Canada are vulnerable to widespread degrada-tion in response to major storms and storm sequences (Forbes et al., 2004; Mathew et al., 2010), although former livestock grazing may have played a part in the breakdown of dunes in the 19th and early 20th centuries. The modern dunes along parts of the north shore of Prince Edward Island have redeveloped over the past 90 years since the last major episode of breakdown but some areas, such as the barrier across Tracadie Bay, are still breached by extensive washover channels (Figure 5). With accelerated sea-level rise and a reduction of winter sea ice in the Gulf of St. Lawrence, combined with a less well-developed or long-lived nearshore ice complex and icefoot, the probability of storm surges with major waves and dune scarping is increased (Forbes et al., 2002, 2004). On the Pacific coast, foredune erosion on the west coast of Vancouver Island is driven by climate variability, including elevated water levels, storms and surges associated with ENSO and PDO events. With positive PDO, ENSO episodes and associated impacts on the beach-dune system have been more frequent and intense, with a recurrence interval for local dune erosion of 1.53 years (Heathfield et al., 2013). However, with falling relative sea level and a high onshore sand supply, there is rapid shoreline progradation, enhanced by the sediment trapping capacity of large woody debris (Eamer and Walker, 2010).
5.2.3 COASTAL WETLANDS, TIDAL FLATS AND SHALLOW COASTAL WATERS
Tidal saline, brackish and freshwater wetlands provide major ecosystem services: coastal protection; provision of spawning and nursery habitat for aquatic species, including commercial fish; critical nesting and feeding habitat for many types of birds; nutrient absorption; and sediment retention. Furthermore, coastal salt marshes may represent important sinks for carbon, storing more carbon per unit area than freshwater peatlands and releasing little in the way of greenhouse gases (Chmura et al., 2003).
Salt marsh stability under climate change is affected by changes in sea level and flooding frequency; changing salinity, temperature, pH and freshwater inputs; nutrient and pollutant loads; sediment supply, plant productivity and accretion rates; coastal squeeze; frontal erosion; direct and indirect effects of sea ice; and disturbance from avian grazing, drainage, excavation, infilling, diking, and other
development in land use. Where sediment supply and biological productivity are sufficient, salt marshes can accrete at rates sufficient to keep pace with sea-level rise, developing thick sequences of organic-rich sediment or peat (e.g., Shaw and Ceman, 1999). However, where the supply of mineral sediment is limited, organic accumulation may not be able to keep pace with the rate of sea-level rise and a gradual drowning of coastal wetlands may occur.
The implications of rising temperatures, changes in precipitation, salinity and CO2 for salt marsh productivity are equivocal (McKee et al., 2012). Outcomes may vary with species composition, antecedent conditions, specific combinations of salinity and CO2 and proximity to limiting conditions for individual species (Erwin, 2009). The timing and quantity of freshwater delivery to marshes may also have an important influence on marsh growth and this may depend not only on regional precipitation and water balance, but also on development and other changes in land use within adjacent drainage basins (Scavia et al., 2002). Some coastal wetlands located in the vicinity of large deltas or in areas of regional glacial isostatic subsid-ence, such as Nova Scotia, are competing with rates of local relative sea-level rise significantly higher than the global mean (Adam, 2002). Even if they have been keeping pace in vertical growth with past rates of sea-level rise, this is no guarantee that they will continue to do so with accelerated sea-level rise over coming decades. Rising sea levels also increase the probability of extreme surge and flooding events that may introduce saltwater into previ-ously freshwater systems (e.g., Pisaric et al., 2011).
Because ice rafting is believed to enhance rates of sediment delivery to salt marshes (Wood et al., 1989; van Proosdij et al., 2006), a future reduction of sea ice with warmer climate may also result in lower sediment supply. The role of ice in the redistribution of, and colonization by, salt marsh cordgrass (Spartina alterniflora; van Proosdij and Townsend, 2006) and in the dispersal of macro-invertebrates in tidal flats (Drolet et al., 2012) may also be affected by its diminished occurrence (see Chapter 4). At the same time, reduced ice cover may increase rates of edge erosion by waves in winter.
Tidal flats, particularly in the Bay of Fundy and Fraser River delta, provide critical feeding habitat for migratory birds (Hicklin, 1987; Hill et al., 2013). Globally, there is concern about projected losses of intertidal habitat for birds (Box 12; Galbraith et al., 2002).

CANADA’S MARINE COASTS in a CHANGING CLIMATE 60
BOX 12 ECOLOGICAL IMPACTS IN THE FRASER RIVER DELTAThe presence of dikes and rising relative sea level over the tidal flats and salt marshes of Roberts Bank (Fraser River delta, British Columbia) suggest that coastal squeeze may lead to significant loss of surface area available to migratory and overwintering birds (Hill et al., 2013). Furthermore there is a potential conflict between the need for land backing the intertidal flats to conserve avian habitat and the high value of the land in demand for other uses. Hill et al. (2013) summarized projections of key impacts on major components of the intertidal system as follows:
� Marsh – negative impacts (low–moderate confidence): erosion of marsh due to coastal squeeze and increased wave attack, mitigated by natural marsh accretion up to a threshold rate.
� Mud flat – negative impacts (low confidence): projected 45%–63% reduction in area due to coastal squeeze, may be mitigated by sedimentation over present marsh area, but exacerbated by increased storminess and storm-wave action.
� Eelgrass – no impact (moderate–high confidence): high rates of eelgrass expansion suggest that eelgrass would migrate landward to keep pace with changes in depth.
� Biofilm – negative impacts (low confidence): area likely to decrease with reduction in area of mud flat; however, higher wave energy may lead to coarsening of the sediment and reduced biofilm productivity.
� Predation on birds – negative impacts (low confidence): likely to increase due to landward migration of optimum feeding grounds.
The low level of confidence reported for most of these impacts suggests the need for more work on the direct biophysical and secondary ecological impacts of climate change in coastal intertidal and subtidal systems.
5.3 VISUALIZATION OF COASTAL FLOODING
Interest in extreme water levels relates to questions not only about how high or how frequently flooding will occur, but also to what will be flooded. Extensive work has been undertaken over the past 15 years to simulate present and future flood events in communities or other settings where valued assets, including important habitat, may be affected (Box 13; see Chapter 3; Webster and Forbes, 2006; Bernier et al., 2007; Forbes et al., 2009; Bernatchez et al., 2011).
6 SUMMARY AND SYNTHESISCanadian marine coasts are highly variable and naturally
dynamic systems. The impacts of climate change, currently manifested primarily in terms of changes in sea-ice cover, will become more pronounced over coming decades. Increased extreme water levels are expected to drive increased rates of coastal erosion. Diked areas, coastal regions with little relief and coastlines composed of unlithified sediments are more susceptible to erosion than high, rocky coastlines. In the Arctic, increased air and water temperatures will further degrade and thaw permafrost, loosening ice-bonded sediments and also contributing to erosion (Forbes, 2011). In the near term, climate variability, expressed seasonally and through various interannual oscillations, will continue to play a dominant role in determining air and water temperatures, storm strength, wave heights, sea level and other factors pertinent to coastal regions in Canada.
Long-term changes in the frequency and intensity of extreme coastal water levels and flooding in Canada will be primarily driven by changes in mean sea level, although tides, sea ice, storm surges and waves will continue to play promi-nent roles. Significant rates of historical changes in relative sea level, largely related to glacial isostatic adjustments, are highly variable across Canada (e.g., >3 mm/year of sea-level rise at Halifax, Nova Scotia and >9 mm/year of sea-level fall at Churchill, Manitoba over the past century), making it a challenge to identify the effects of accelerated sea-level rise associated with climate change. These impacts will be more evident in subsequent decades, as rates of global sea-level rise increase further. Regions experiencing increases in mean sea level will see increasingly more frequent water levels that cause flooding today and higher extreme water levels.
In the near term, climate change impacts on Canada’s coasts will continue to be most evident in terms of extreme weather events and, in the East and North Coast regions, decreasing sea-ice cover. There are important linkages between the two: when present, sea ice serves to protect coasts from potential wave impacts associated with severe storms and conversely the absence of sea ice can lead to enhanced coastal erosion. Impacts of extreme weather events are not limited to wave erosion and storm-surge flooding, but also include strong winds and heavy precipita-tion that can damage infrastructure and cause flooding of coastal communities and assets.

Chapter 2 | DYNAMIC COASTS IN A CHANGING CLIMATE 61
BOX 13 FLOOD SIMULATIONA light detection and ranging (LiDAR) technique is used to create high-resolution digital models of terrain sur-faces, including buildings and trees where present; from these, digital elevation models can be derived as a basis for flood simulation (Figure 31). This technique, now widespread, was pioneered in Canada about 15 years ago (e.g., Webster et al., 2002; Webster and Forbes, 2006).
In the output produced for public communication, a digital image can be substituted to allow stakeholders to relate to historical and/or projected flood levels through recognition of buildings or other features. In the case of historical flooding in Tuktoyaktuk (Figure 32), the visualization also illustrates the high rates of historical coastal erosion. Mean retreat at the northwestern point from 1935 to 1971, prior to several phases of shore protection, was 3.8 m/year (Rampton and Bouchard, 1975). During a single major storm in September 1970, the same point retreated by more than 13 m in a few hours (Public Works and Government Services Canada, 1971; Rampton and Bouchard, 1975).
It should be noted that most flood simulations utilize still-water models that account for openings through culverts or bridges but do not include the dynamics of flow. In some situations with rough or complex flow patterns, it may be desirable to incorporate a dynamic model and the still-water simulation may overestimate flood extent (Webster et al., 2014).
FIGURE 31: LiDAR-derived digital elevation model for Tuktoyaktuk, Northwest Territories. Bare-earth model with vegetation and buildings removed forms the basis for flood simulation (Forbes et al. 2014b).
FIGURE 32: Long-term coastal erosion (1947–2010) and visualization of storm flooding in 2000 at Tuktoyaktuk, Northwest Territories. Flood simulation conducted on LiDAR-derived digital elevation model. A high-resolution satellite image taken in 2010 by GeoEye Inc. is inserted as backdrop to facilitate public interpretation (Forbes et al. 2013). Contains material from Digital Globe Inc. Abbreviation: WL, water level.
CANADA’S MARINE COASTS in a CHANGING CLIMATE 62
Ecosystem services provided by coastal systems will also be affected by rising sea levels, reduced sea ice and other climate effects such as changes in temperature and precipita-tion, storminess and wind regimes, teleconnections with regional sea-level anomalies, CO2 enhancement or acidifica-tion of coastal waters. The loss or degradation under climate change of coastal ecosystems (beach-dune complexes, tidal flats, coastal wetlands, seagrass meadows and estuaries) leads to direct and indirect impacts (Carter, 1991). First-order biophysical impacts affect the delivery of ecosystem services; second-order impacts affect coastal protection, water supply, recreation, agriculture and aesthetics; and third-order impacts influence policy and governance, with implications for conservation, habitat protection, protection of property and critical infrastructure, food security and other contributors to sustainable development.
7 REFERENCESAbeysirigunawardena, D.S. and Walker, I.J. (2008): Sea level responses to climatic
variability and change in northern British Columbia; Atmosphere-Ocean, v. 46, no. 3, p. 277–296. doi:10.3137/ao.460301
Abeysirigunawardena, D.S., Gilleland, E., Bronaugh, D. and Wong, P. (2009): Extreme wind regime responses to climate variability and change in the inner south coast of British Columbia,Canada; Atmosphere-Ocean, v. 47, no. 1, p. 41–62. doi:10.3137/AO1003.2009
Adam, P. (2002): Salt marshes in a time of change; Environmental Conservation, v. 29, p. 39–61. doi:10.1017/S0376892902000048
Allard, M., Michaud, Y., Ruz, M.H. and Héquette, A. (1998): Ice foot, freeze-thaw of sediments, and platform erosion in a subarctic microtidal environment, Manitounuk Strait, northern Quebec, Canada; Canadian Journal of Earth Sciences, v. 35, no. 9, p. 965–979.
Aré, F. (1988): Thermal abrasion of sea coasts (Part 1); Polar Geography, v. 12, no. 2, p. 87–111. doi:10.1080/10889378809377343
Ashton, A., Murray, A.B. and Arnoult, O. (2001): Formation of coastline features by large-scale instabilities induced by high-angle waves; Nature, v. 414, no. 6861, p. 296–300. doi:10.1038/35104541 (+erratum: Nature, v. 415, no. 6872, p. 666).
Asplin, M.G., Galley, R., Barber, D.G. and Prinsenberg, S. (2012): Fracture of summer perennial sea ice by ocean swell as a result of Arctic storms; Journal of Geophysical Research: Oceans, v. 117, art. C06025. doi:10.1029/2011JC007221
Atkinson, D.E. (2005): Observed storminess patterns and trends in the circum-Arctic coastal regime; Geo-Marine Letters, v. 25, no. 2–3, p. 98–109.
Barnes, E.A. (2013): Revisiting the evidence linking Arctic amplification to extreme weather in midlatitudes; Geophysical Research Letters, v. 40, no. 17, p. 4734–4739.
Barnhart, K.R., Anderson, R.S., Overeem, I., Wobus, C., Clow, G.D. and Urban, F.E. (2014a): Modeling erosion of ice-rich permafrost bluff along the Alaskan Beaufort Sea coast; Journal of Geophysical Research: Earth Surface, v. 119, no. 5, p. 1155–1179. doi:10.1002/2013JF002485
Barnhart, K.R., Overeem, I. and Anderson, R.S. (2014b): The effect of changing sea ice on the physical vulnerability of Arctic coasts; The Cryosphere, v. 8, no. 5, p. 1777–1799. doi:10.5194/tc-8-1777-2014
Bernatchez, P. and Dubois, J.-M.M. (2004): Bilan des connaissances de la dynamique de l’érosion des côtes du Québec maritime laurentien; Géographie physique et Quaternaire, v. 58, no. 1, p. 45–71.
Bernatchez, P. and Dubois, J.-M.M. (2008): Seasonal quantification of coastal processes and cliff erosion on fine sediment shorelines in a cold temperate climate, north shore of the St. Lawrence maritime estuary, Quebec; Journal of Coastal Research, v. 24, no. 1A, p. 169–180. doi:10.2112/04-0419.1
Bernatchez, P. and Fraser, C. (2012): Evolution of coastal defence structures and consequences for beach width trends, Québec, Canada; Journal of Coastal Research, v. 28, no. 6, p. 1550–1566. doi:10.2112/JCOASTRES-D-10-00189
Bernatchez, P., Fraser, C., Lefaivre, D. and Dugas, S. (2011): Integrating anthropogenic factors, geomorphological indicators and local knowledge in the analysis of coastal flooding and erosion hazards; Ocean & Coastal Management, v. 54, no. 8, p. 621–632.
Bernier, N.B. and Thompson, K.R. (2006): Predicting the frequency of storm surges and extreme sea levels in the northwest Atlantic; Journal of Geophysical Research: Oceans, v. 111, art. C10009. doi:10.1029/2005JC003168
Bernier, N.B., Thompson, K.R., Ou, J. and Ritchie, H. (2007): Mapping the return periods of extreme sea levels: allowing for short sea level records, seasonality, and climate change; Global and Planetary Change, v. 57, no. 1–2, p. 139–150.
Bindschadler, R.A., Nowicki, S., Abe-Ouchi, A., Aschwanden, A., Choi, H., Fastook, J., Granzow, G., Greve, R., Gutowski, G., Herzfeld, U., Jackson, C., Johnson, J., Khroulev, C., Levermann, A., Lipscomb, W.H., Martin, M.A., Morlighem, M., Parizek, B.R., Pollard, D., Price, S.F., Ren, D., Saito, F., Sato, T., Seddik, H., Seroussi, H., Takahashi, K., Walker, R. and Wang, W.L. (2013): Ice-sheet model sensitivities to environmental forcing and their use in projecting future sea level (the SeaRISE Project); Journal of Glaciology, v. 59, no. 214, p. 195–224.
Bruun, P. (1954): Coastal erosion and development of beach profiles; United States Army Corps of Engineers, Beach Erosion Board, Vicksburg, Mississippi, Technical Memorandum 44, 79 p.
Bruun, P. (1962): Sea-level rise as a cause of shore erosion; Journal of the Waterways and Harbors Division, Proceedings American Society of Civil Engineers, v. 88, no. 1–2, p. 117–130.
Bush, E.J., Loder, J.W., James, T.S., Mortsch, L.D. and Cohen, S.J. (2014): An overview of Canada’s changing climate; in Canada in a Changing Climate: Sector Perspectives on Impacts and Adaptation, (ed.) F.J. Warren and D.S. Lemmen; Government of Canada, Ottawa, p. 23–64, <http://www.nrcan.gc.ca/sites/www.nrcan.gc.ca/files/earthsciences/pdf/assess/2014/pdf/Chapter2-Overview_Eng.pdf>.
Cambers, G. (2009): Caribbean beach changes and climate change adaptation; Aquatic Ecosystem Health & Management, v. 12, no. 2, p. 168–176.
Carter, R.W.G. (1991): Near-future sea level impacts on coastal dune landscapes; Landscape Ecology, v. 6, no. 1–2, p. 29–31.
Casati, B. and de Elia, R. (2014): Temperature extremes from Canadian Regional Climate Model (CRCM) climate change projections; Atmosphere-Ocean, v. 52, no. 3, p. 191–210.
Catto, N., Ingram, D. and Edinger, E. (2006): Geomorphic impacts of waves and storms on the southwestern coastline of Newfoundland, including Port-aux-Basques harbour; in Impacts of Storms & Winds on Transporta-tion in Southwestern Newfoundland, (ed.) N. Catto, D. Foote, D. Kearney, W. Locke, B. DeYoung, E. Edinger, D. Ingram, J. Karn and J. Straatman; Natural Resources Canada, Climate Change Impacts & Adaptation Program (CCIAP), Project A-804, p. 12–27, <http://s3.amazonaws.com/zanran_storage/adaptation.nrcan.gc.ca/ContentPages/8936426.pdf>.
Chang, E. K. (2013): CMIP5 projection of significant reduction in extratropical cyclone activity over North America; Journal of Climate, v. 26, no. 24, p. 9903–9922.
Chmura, G.L. (2013): What do we need to assess the sustainability of the tidal salt marsh carbon sink?; Ocean & Coastal Management, v. 83, p. 25–31. doi:10.1016/j.ocecoaman.2011.09.006
Chmura, G.L., Anisfeld, S.C., Cahoon, D.R. and Lynch, J.C. (2003): Global carbon sequestration in tidal, saline wetland soils; Global Biogeochemical Cycles, v. 17, no. 4, art. 1111. doi:10.1029/2002GB001917
Chmura, G.L., Helmer, L.L., Beecher, C.B. and Sunderland, E.M. (2001): Historical rates of salt marsh accretion on the outer Bay of Fundy; Canadian Journal of Earth Sciences, v. 38, no. 7, p. 1081–1092. doi:10.1139/cjes-38-7-1081
Church, J.A. and White, N.J. (2006): A 20th century acceleration in global sea-level rise; Geophysical Research Letters, v. 33, no. 1, art. L01602. doi:10.1029/2005GL024826
Church, J.A., Clark, P.U., Cazenave, A., Gregory, J.M., Jevrejeva, S., Levermann, A., Merrifield, M.A., Milne, G.A., Nerem, R.S., Nunn, P.D., Payne, A.J., Pfeffer, W.T., Stammer, D. and Unnikrishnan, A.S. (2013a): Sea level change; in Climate Change 2013: The Physical Science Basis; Contribution of Working Group I to the Fifth Assessment Report of the Intergovernmental Panel on Climate Change (IPCC), (ed.) T.F. Stocker, D. Quin, G.K. Plattner, M. Tignor, S.K. Allen, J. Boschung, A. Nauels, Y. Xia, V. Bex and P.M. Migdley; Cambridge University Press, Cambridge, United Kingdom and New York, New York, p. 1137–1216, <http://www.ipcc.ch/pdf/assess-ment-report/ar5/wg1/WG1AR5_Chapter13_FINAL.pdf>.

Chapter 2 | DYNAMIC COASTS IN A CHANGING CLIMATE 63
Church, J.A., Clark, P.U., Cazenave, A., Gregory, J.M., Jevrejeva, S., Levermann, A., Merrifield, M.A., Milne, G.A., Nerem, R.S., Nunn, P.D., Payne, A.J., Pfeffer, W.T., Stammer, D. and Unnikrishnan, A.S. (2013b): Sea level change supplementary material; in Climate Change 2013: The Physical Science Basis; Contribution of Working Group I to the Fifth Assessment Report of the Intergovernmental Panel on Climate Change (IPCC), (ed.) T.F. Stocker, D. Quin, G.K. Plattner, M. Tignor, S.K. Allen, J. Boschung, A. Nauels, Y. Xia, V. Bex and P.M. Migdley; Cambridge University Press, Cambridge, United Kingdom and New York, New York, p. 13SM-1–13SM-8, <http://www.ipcc.ch/pdf/assessment-report/ar5/wg1/supplementary/WG1AR5_Ch13SM_FINAL.pdf>.
Clague, J.J. and James, T.S. (2002): History and isostatic effects of the last ice sheet in southern British Columbia; Quaternary Science Reviews, v. 21, p. 71–87.
Cooper, J.A.G. and Pilkey, O.H. (2004): Sea-level rise and shoreline retreat: time to abandon the Bruun Rule; Global and Planetary Change, v. 43, no. 3–4, p. 157–171.
Copland, L., Mueller, D.R. and Weir, L. (2007): Rapid loss of the Ayles Ice Shelf, Ellesmere Island, Canada; Geophysical Research Letters, v. 34, no. 21, art. L21501. doi:10.1029/2007GL031809
Couture, N.J. (2010): Fluxes of soil organic carbon from eroding permafrost coasts, Canadian Beaufort Sea; Ph.D. thesis, McGill University, Montréal, Quebec, 136 p., <http://digitool.library.mcgill.ca:8881/R/ ?func=dbin-jump-full&object_id=92229>.
Couture, N.J. and Manson, G.K. (2016): CanCoast: a tool for helping to assess climate change vulnerability; Natural Resources Canada, Geological Survey of Canada, Open File.
Couture, N.J., Craymer, M.R., Forbes, D.L., Fraser, P.R., Henton, J.A., James, T.S., Jenner, K.A., Manson, G.K., Simon, K.M., Silliker, R.J. and Whalen, D.J.R. (2014): Coastal geoscience for sustainable development in Nunavut: 2013 activities; in Summary of Activities 2013; Canada-Nunavut Geoscience Office, Iqaluit, Nunavut, p. 139–148, <http://cngo.ca/app/uploads/Summary-of-Activities-2013.pdf>.
Couture, N.J., Hoque, A.M. and Pollard, W.H. (2008): Modelling the erosion of ice-rich deposits along the Yukon Coastal Plain; in Proceedings of the Ninth International Conference on Permafrost, (ed.) D.L. Kane and K.M. Hinkel; 29 June–3 July 2008, University of Alaska Fairbanks, Fairbanks, Alaska, v. 1, p. 303–308, <http://research.iarc.uaf.edu/NICOP/DVD/1st%20to%209th%20Conference%20PDF%20files/09th%20International%20 Conference%20on%20Permafrost%20Vol%201.pdf>.
Covill, B., Forbes, D.L., Taylor, R.B. and Shaw, J. (1995): Photogrammetric analysis of coastal erosion and barrier migration near Chezzetcook Inlet, eastern shore of Nova Scotia; Geological Survey of Canada, Open File 3027, 1 p.
Craymer, M.R., Henton, J.A., Piraszewski, M. and Lapelle, E. (2011): An updated GPS velocity field for Canada; Eos, Transactions American Geophysical Union, v. 92, no. 51, Fall Meeting Supplement, Abstract G21A-0793, poster, <http://adsabs.harvard.edu/abs/2011AGUFM.G21A0793C>.
Cubasch, U., Wuebbles, D., Chen, D., Facchini, M.C., Frame, D., Mahowald, N. and Winther, J.-G. (2013): Introduction; in Climate Change 2013: The Physical Science Basis; Contribution of Working Group I to the Fifth Assessment Report of the Intergovernmental Panel on Climate Change (IPCC), (ed.) T.F. Stocker, D. Quin, G.K. Plattner, M. Tignor, S.K. Allen, J. Boschung, A. Nauels, Y. Xia, V. Bex and P.M. Migdley; Cambridge University Press, Cambridge, United Kingdom and New York, New York, p. 119–158, <http://www.ipcc.ch/pdf/assessment-report/ar5/wg1/WG1AR5_Chapter01_FINAL.pdf>.
Curray, J.R. (1964): Transgression and regression; in Papers in Marine Geology, (ed.) R.L. Miller; Macmillan Company, New York, New York, p. 175–203.
Daniel, E.B. and Abkowitz, M.D. (2005): Improving the design and implementation of beach setbacks in Caribbean small islands; Journal of the Urban and Regional Information Systems Association (URISA Journal), v. 17, no. 1, p. 53–65.
Davidson-Arnott, R.G.D. (2005): Conceptual model of the effects of sea level rise on sandy coasts; Journal of Coastal Research, v. 21, no. 6, p. 1166–1172.
Davies, M. (2011): Geomorphic shoreline classification of Prince Edward Island; report prepared by Coldwater Consulting Ltd. for the Atlantic Climate Adaptation Solutions Association (ACASA), 66 p., <http://www.gov.pe.ca/photos/original/shoreline_pei.pdf>.
Davis, R.E., Demme, G. and Dolan, R. (1993): Synoptic climatology of Atlantic coast north-easters; International Journal of Climatology, v. 13, no. 2, p. 171–189. doi:10.1002/joc.3370130204
Day, J.W. Jr., Gunn, J.D., Folan, W.J., Yáñez-Arancibia, A. and Horton, B.P. (2012): The influence of enhanced post-glacial coastal margin productivity on the emergence of complex societies; Journal of Island and Coastal Archaeology, v. 7, no. 1, p. 23–52.
Dettinger, M. (2011): Climate change, atmospheric rivers, and floods in California – a multimodel analysis of storm frequency and magnitude changes; Journal of the American Water Resources Association (JAWRA), v. 47, no. 3, p. 514–523. doi:10.1111/j.1752-1688.2011.00546.x
Drolet, D., Bringloe, T.T., Coffin, M.R.S., Barbeau, M.A. and Hamilton, D.J. (2012): Potential for between-mudflat movement and metapopulation dynamics in an intertidal burrowing amphipod; Marine Ecology Progress Series, v. 449, p. 197–209.
Eamer, J.B.R. and Walker, I.J. (2010): Quantifying sand storage capacity of large woody debris on beaches using LiDAR; Geomorphology, v. 118, no. 1–2, p. 33–47. doi:10.1016/j.geomorph.2009.12.006
Eicken, H., Gradinger, R., Graves, A., Mahoney, A., Rigor, I. and Melling, H. (2005): Sediment transport by sea ice in the Chukchi and Beaufort seas: increasing importance due to changing ice conditions?; Deep Sea Research Part II: Topical Studies in Oceanography, v. 52, no. 24–26, p. 3281–3302.
Enfield, D.B. and Cid-Serrano, L. (2010): Secular and multidecadal warmings in the North Atlantic and their relationships with major hurricane activity; Interna-tional Journal of Climatology, v. 30, no. 2, p. 174–184. doi:10.1002/joc.1881
Environment Canada (2013): Maximum sea ice extent for a normal winter ice season in Canadian Waters; Environment Canada, Canadian Ice Service, <https://ec.gc.ca/glaces-ice/default.asp?Lang=En&n=E79B8B66-1>.
Erwin, K.L. (2009): Wetlands and global climate change: the role of wetland restoration in a changing world; Wetlands Ecology and Management, v. 17, no. 1, p. 71–84. doi:10.1007/s11273-008-9119-1
Etkin, D., Brun, S.E., Shabbar, A. and Joe, P. (2001): Tornado climatology of Canada revisited: tornado activity during different phases of ENSO; International Journal of Climatology, v. 21, no. 8, p. 915–938. doi:10.1002/joc.654
Fan, Y., Lin, S., Griffies, S. M. and Hemer, M.A. (2014): Simulated global swell and wind-sea climate and their responses to anthropogenic climate change at the end of the twenty-first century; Journal of Climate, v. 27, no. 10, p. 3516–3536. doi:10.1175/JCLI-D-13-00198.1
Farrell, W.E. and Clark, J.A. (1976): On postglacial sea level; Geophysical Journal International, v. 46, no. 3, p. 647–667.
Feng, S., Ho, C.H., Hu, Q., Oglesby, R.J., Jeong, S.J. and Kim, B.M. (2012): Evaluating observed and projected future climate changes for the Arctic using the Köppen-Trewartha climate classification; Climate Dynamics, v. 38, no. 7–8, p. 1359–1373. doi:10.1007/s00382-011-1020-6
Fischer, E.M. and Knutti, R. (2014): Heated debate on cold weather; Nature Climate Change, v. 4, p. 537–538.
FitzGerald, D.M., Fenster, M.S., Argow, B.A. and Buynevich, I.V. (2008): Coastal impacts due to sea-level rise; Annual Reviews of Earth and Planetary Sciences, v. 36, p. 601–647.
Flanner, M.G., Shell, K.M., Barlage, M., Perovich, D.K. and Tschudi, M.A. (2011): Radiative forcing and albedo feedback from the northern hemisphere cryosphere between 1979 and 2008; Nature Geoscience, v. 4, no. 3, p. 151–155. doi:10.1038/ngeo1062
Forbes, D.L. (2011): Glaciated coasts; in Treatise on Estuarine and Coastal Science, (ed.) E. Wolanski and D.S. McLusky; Academic Press, Waltham, Massachusetts, v. 3, p. 223–243.
Forbes, D.L. and Hansom, J.D. (2011): Polar coasts; in Treatise on Estuarine and Coastal Science, (ed.) E. Wolanski and D.S. McLusky; Academic Press, Waltham, Massachusetts, v. 3, p. 245–283.
Forbes, D.L. and Manson, G.K. (2002): Coastal geology and shore-zone processes; in Coastal Impacts of Climate Change and Sea-Level Rise on Prince Edward Island, (ed.) D.L. Forbes and R.W. Shaw; Geological Survey of Canada, Open File 4261, Supporting Document 9, 85 p.
Forbes, D.L. and Solomon, S.M. (1999): Inlet division and coastal instability following tidal prism diversion; in Proceedings, Coastal Sediments 99, Long Island, American Society of Civil Engineers, Reston, Virginia, p.1418–1433.
Forbes, D.L. and Syvitski, J.P.M. (1994): Paraglacial coasts; in Coastal Evolution: Late Quaternary Shoreline Morphodynamics, (ed.) R.W.G. Carter and C.D. Woodroffe; Cambridge University Press, Cambridge, United Kingdom, p. 373–424.

CANADA’S MARINE COASTS in a CHANGING CLIMATE 64
Forbes, D.L. and Taylor, R.B. (1994): Ice in the shore zone and the geomorphol-ogy of cold coasts; Progress in Physical Geography, v. 18, no. 1, p. 59–89.
Forbes, D.L., Bell, T., James, T.S. and Simon, K.M. (2014a): Reconnaissance assessment of landscape hazards and potential impacts of future climate change in Arviat, southern Nunavut; in Summary of Activities 2013; Canada-Nunavut Geoscience Office, Iqaluit, Nunavut, p. 183–192, <http://cngo.ca/app/uploads/Summary-of-Activities-2013-P19.pdf>.
Forbes, D.L., Covill, R.A., Feindel, R.D. and Batterson, M.J. (1995a): Preliminary assessment of coastal erosion between Port au Port and Stephenville, St. George’s Bay, west Newfoundland; Geological Survey of Canada, Open File 3082, 10 p., <http://ftp2.cits.rncan.gc.ca/pub/geott/ess_pubs/203/203644/of_3082.pdf>.
Forbes, D.L., Manson, G.K., Chagnon, R., Solomon, S.M., van der Sanden, J.J. and Lynds, T.L. (2002): Nearshore ice and climate change in the southern Gulf of St. Lawrence; in Ice in the Environment: Proceedings of the 16th IAHR International Symposium on Ice, 2–6 December 2002, Dunedin, New Zealand, (ed.) V.A. Squire and P.J. Langhorne; International Association for Hydro-Environment Engineering and Research (IAHR), v. 1, p. 344–351, <http://riverice.civil.ualberta.ca/IAHR%20Proc/16th%20Ice%20Symp%20Dunedin%202002/Volume%201/78.pdf>.
Forbes, D.L., Manson, G.K., Charles, J., Thompson, K.R. and Taylor, R.B. (2009): Halifax harbour extreme water levels in the context of climate change: scenarios for a 100-year planning horizon; Geological Survey of Canada, Open File 6346, 22 p., <http://ftp2.cits.rncan.gc.ca/pub/geott/ess_pubs/248/248196/of_6346.pdf>.
Forbes, D.L., Manson, G.K., Whalen, D.J.R., Couture, N.J. and Hill, P.R. (2014b): Coastal products of marine transgression in cold-temperate and high-latitude coastal-plain settings: Gulf of St. Lawrence and Beaufort Sea; in Sedimentary Coastal Zones from High to Low Latitudes: Similarities and Differences, (ed.) I.P. Martini and H.R. Wanless; Geological Society of London, Lyell Collection, Special Publication 388, p. 131–163. doi:10.1144/SP388.18
Forbes, D.L., Orford, J.D., Carter, R.W.G., Shaw, J. and Jennings, S.C. (1995b): Morphodynamic evolution, self-organisation, and instability of coarse-clas-tic barriers on paraglacial coasts; Marine Geology, v. 126, no. 1–4, p. 63–85.
Forbes, D.L., Orford, J.D., Taylor, R.B. and Shaw, J. (1997): Interdecadal variation in shoreline recession on the Atlantic coast of Nova Scotia; in Proceedings of the 1997 Canadian Coastal Conference, 21–24 May 1997, Guelph, Ontario, (ed.) M.G. Skafel; Canadian Coastal Science and Engineering Association, p. 360–374. <https://www.researchgate.net/publication/ 279448557_Interdecadal_variation_in_shoreline_recession_on_the_ Atlantic_coast_of_Nova_Scotia>.
Forbes, D.L., Parkes, G.S., Manson, G.K. and Ketch, L.A. (2004): Storms and shoreline retreat in the southern Gulf of St. Lawrence; Marine Geology, v. 210, no. 1–4, p. 169–204.
Forbes, D. L., Solomon, S. M., Frobel, D., Goguen, M., Sherin, A.G., Parrott, R. and Covill, R. (1999): Bathymetry, bottom conditions, and tidal inlet stability, Rustico Bay and vicinity, Prince Edward Island; Geological Survey of Canada, Open File 3766, 38 p. doi:10.4095/210829
Forbes, D.L., Whalen, D.J.R., Jacobson, B., Fraser, P., Manson J.K., Couture, N.J and Simpson, R. (2013): Co-design of coastal risk assessment for subsistence infrastructure in the Inuvialuit Settlement Region, western Arctic Canada; ArcticNet Annual Scientific Meeting, 9–13 December 2013, Halifax, Nova Scotia, p. 141–142, abstract and poster, <http://www.arcticnetmeetings.ca/asm2013/docs/full_program.pdf>.
Francis, J.A. and Vavrus, S.J. (2012): Evidence linking Arctic amplification to extreme weather in mid-latitudes; Geophysical Research Letters, v. 39, no. 6, art. L06801. doi:10.1029/2012GL051000
Francis, J.A. and Vavrus, S.J. (2015): Evidence for a wavier jet stream in response to rapid Arctic warming; Environmental Research Letters. doi:10.1088/1748-9326/10/1/014005
Galbraith, H., Jones, R., Park, R., Clough, J., Herrod-Julius, S., Harrington, B. and Page, G. (2002): Global climate change and sea level rise: potential losses of intertidal habitat for shorebirds; Waterbirds, v. 25, no. 2, p. 173–183. doi:10.1675/1524-4695(2002)925[0173:GCCASK]2.0;2
Gaston, A.J., Smith, P.A. and Provencher, J.F. (2012): Discontinuous change in ice cover in Hudson Bay in the 1990s and some consequences for marine birds and their prey; ICES Journal of Marine Science, v. 69, no. 7, p. 1218–1225.
Gibbs, M. and Hill, T. (2011): Coastal climate change risk – legal and policy responses in Australia; Australia Department of Climate Change and Energy Efficiency, Canberra, Australia, 89 p., <http://www.environment.gov.au/system/files/resources/68cbcb67-bd6c-41ee-b214-02a5143d90d9/files/coastal-cc-legal-responses.pdf>.
Government of Western Australia (2006): State coastal planning policy; prepared under Section 5aa of the Town Planning and Development Act 1928, Western Australian Planning Commission, Perth, Australia, 12 p.
Gulev, S.K. and Grigorieva, V. (2004): Last century changes in ocean wind wave height from global visual wave data; Geophysical Research Letters, v. 31, v. 24, art. L24302. doi:10.1029/2004GL021040
Gulev, S.K. and Grigorieva, V. (2006): Variability of the winter wind waves and swell in the North Atlantic and North Pacific as revealed by the voluntary observing ship data; Bulletin of the American Meteorological Society, v. 19, no. 21, p. 5667–5685.
Hanesiak, J., Stewart, R., Taylor, P., Moore, K., Barber, D., McBean, G., Strapp, W., Wolde, M., Goodson, R., Hudson, E., Hudak, D., Scott, J., Liu, G., Gilligan, J., Biswas, S., Desjardins, D., Dyck, R., Fargey, S., Field, R., Gascon, G., Gordon, M., Greene, H., Hay, C., Henson, W., Hochheim, K., Laplante, A., Martin, R., Melzer, M. and Zhang, S. (2010): Storm Studies in the Arctic (STAR); Bulletin of the American Meteorological Society, v. 91, no. 1, p. 47–68. doi:10.1175/2009BAMS2693
Hansom, J.D., Forbes, D.L. and Etienne, S. (2014): The rock coasts of polar and sub-polar regions; in Rock Coasts of the World, (ed.) D.M. Kennedy, W.J. Stephenson and L.A. Naylor; Geological Society of London, Lyell Collection, Memoirs, v. 40, p. 263–281. doi:10.1144/M40.16
Hartig, E.K., Gornitz, V., Kolker, A., Mushacke, F. and Fallon, D. (2002): Anthropo-genic and climate-change impacts on salt marshes of Jamaica Bay, New York City; Wetlands, v. 22, no. 1, p. 71–89. doi:10.1672/0277-5212(2002)022
Hays, J.D., Imbrie, J. and Shackleton, N.J. (1976): Variations in the earth’s orbit: pacemaker of the ice ages; Science, v. 194, no. 4270, p. 1121–1132. doi:10.1002/esp.3350
Heathfield, D.K., Walker, I.J. and Atkinson, D.E. (2013): Erosive water level regime and climatic variability forcing of beach-dune systems on south-western Vancouver Island, British Columbia, Canada: Earth Surface Processes and Landforms, v. 38, p. 751–762. doi: 10.1002/esp.3350
Heginbottom, J.A., Dubreuil, M.-A. and Harker, P.A. (1995): Permafrost; National Atlas of Canada, 5th edition, Government of Canada, Ottawa, <http://geogratis.gc.ca/api/en/nrcan-rncan/ess-sst/d1e2048b-ccff-5852-aaa5-b861bd55c367>.
Hemer, M. A., Fan, Y., Mori, N., Semedo, A. and Wang, X. L. (2013): Projected changes in wave climate from a multi-model ensemble; Nature Climate Change, v. 3, p. 471–476. doi:10.1038/NCLIMATE1791
Hemer, M.A., Wang, X.L., Weisse, R. and Swail, V.R. (2012): Advancing wind-waves climate science: the COWCLIP project; Bulletin of the American Meteorological Society, v. 93, no. 6, p. 791–796. doi:10.1175/BAMS-D-11-00184.1
Hicklin, P.W. (1987): The migration of shorebirds in the Bay of Fundy; Wilson Bulletin, v. 99, no. 4, p. 540–570.
Hill, P.R., Barnes, P.W., Hequette, A. and Ruz, M.-H. (1994): Arctic coastal plain shorelines; in Coastal Evolution: Late Quaternary Shoreline Morphodynam-ics, (ed.) R.W.G. Carter and C.D. Woodroffe; Cambridge University Press, Cambridge, United Kingdom, p. 341–372.
Hill, P.R., Butler, R.W., Elner, R.W., Houser, C., Kirwan, M.L., Lambert, A., Lintern, D.G., Mazzotti, S., Shaw, A., Sutherland, T., Levings, C., Morrison, S., Petersen, S. and Solomon, S. (2013): Impacts of sea level rise on Roberts Bank (Fraser Delta, British Columbia); Natural Resources Canada, Geological Survey of Canada, Open File 7259, 71 p., <http://geogratis.gc.ca/api/en/nrcan-rncan/ess-sst/c4813e59-f100-599f-8899-685fd6a34369.html>.
Hoque, M.A. and Pollard, W.H. (2009): Arctic coastal retreat through block failure; Canadian Geotechnical Journal, v. 46, no. 10, p. 1103–1115.
Inman, D.L. (1987): Accretion and erosion waves on beaches; Shore and Beach, v. 55, p. 61–66.
IPCC [Intergovernmental Panel on Climate Change] (1990): Climate Change: The IPCC Scientific Assessment; Working Group I, (ed.) J.T. Houghton, G.J. Jenkins and J.J. Ephraums; Cambridge University Press, Cambridge, United Kingdom, New York, New York and Melbourne, Australia, 365 p., <http://www.ipcc.ch/publications_and_data/publications_ipcc_first_assessment_1990_wg1.shtml>.
IPCC [Intergovernmental Panel on Climate Change] (1992): Climate Change 1992: The Supplementary Report to the IPCC Scientific Assessment; Working Group I, (ed.) J.T. Houghton, B.A. Callander and S.K. Varney; Cambridge University Press, Cambridge, United Kingdom, New York, New York and Victoria, Australia, 200 p., <http://www.ipcc.ch/publications_and_data/publications_ipcc_supplementary_report_1992_wg1.shtml>.
Chapter 2 | DYNAMIC COASTS IN A CHANGING CLIMATE 65
IPCC [Intergovernmental Panel on Climate Change] (1995): Climate Change 1995: The Science of Climate Change; Contribution of Working Group I to the Second Assessment Report of the Intergovernmental Panel on Climate Change, (ed.) J.T. Houghton, L.G. Meira Filho, B.A. Callander, N. Harris, A. Kattenberg and K. Maskell; Cambridge University Press, Cambridge, United Kingdom and New York, New York, 572 p., <http://www.ipcc.ch/ipccreports/sar/wg_I/ipcc_sar_wg_I_full_report.pdf>.
IPCC [Intergovernmental Panel on Climate Change] (2000): Special Report on Emissions Scenarios; Working Group III, (ed.) N. Nakicenovic and R. Swart; Cambridge University Press, Cambridge, United Kingdom, 599 p., <http://www.ipcc.ch/ipccreports/sres/emission/emissions_scenarios.pdf>.
IPCC [Intergovernmental Panel on Climate Change] (2001): Climate Change 2001: The Scientific Basis; Contribution of Working Group I to the Third Assessment Report of the Intergovernmental Panel on Climate Change, (ed.) J.T. Houghton, Y. Ding, D.J. Griggs, M. Noguer, P.J. van der Linden, X. Dai, K. Maskell and C.A. Johnson; Cambridge University Press, Cambridge, United Kingdom and New York, New York, 881 p., <http://www.grida.no/publications/other/ipcc_tar/>.
IPCC [Intergovernmental Panel on Climate Change] (2007): Climate Change 2007: The Physical Science Basis; Contribution of Working Group I to the Fourth Assessment Report of the Intergovernmental Panel on Climate Change, (ed.) S. Solomon, D. Qin, M. Manning, Z. Chen, M. Marquis, K.B. Averyt, M. Tignor and H.L. Miller; Cambridge University Press, Cambridge, United Kingdom and New York, New York, 996 p., <http://www.ipcc.ch/publications_and_data/publications_ipcc_fourth_assessment_report_wg1_report_the_physical_science_basis.htm>.
IPCC [Intergovernmental Panel on Climate Change] (2012): Managing the Risks of Extreme Events and Disasters to Advance Climate Change Adaptation; Special report of the Intergovernmental Panel on Climate Change, Working Groups I and II, (ed.) C.B. Field, V. Barros, T.F. Stocker, D. Qin, D.J. Dokken, K.L. Ebi, M.D. Mastrandrea, K.J. Mach, G.-K. Plattner, S.K. Allen, M. Tignor and P.M. Midgley; Cambridge University Press, Cambridge, United Kingdom and New York, New York, 582 p., <http://www.ipcc.ch/pdf/special-reports/srex/SREX_Full_Report.pdf>.
IPCC [Intergovernmental Panel on Climate Change] (2013): Summary for policymakers; in Climate Change 2013: The Physical Science Basis; Contribution of Working Group I to the Fifth Assessment Report of the Intergovernmental Panel on Climate Change, (ed.) T.F. Stocker, D. Qin, G.-K. Plattner, M. Tignor, S.K. Allen, J. Boschung, A. Nauels, Y. Xia, V. Bex and P.M. Midgley; Cambridge University Press, Cambridge, United Kingdom and New York, New York, p. 3–29, <http://www.ipcc.ch/pdf/assessment-report/ar5/wg1/WG1AR5_SPM_FINAL.pdf>.
James, T.S., Clague, J.J., Wang, K. and Hutchinson, I. (2000): Postglacial rebound at the northern Cascadia subduction zone; Quaternary Science Reviews, v. 19, p. 1527–1541.
James, T.S., Henton, J.A., Leonard, L.J., Darlington, A., Forbes, D.L. and Craymer, M. (2014): Relative sea level rise projections for Canada and the adjacent mainland United States; Geological Survey of Canada, Open File 7737, 67 p., <http://ftp2.cits.rncan.gc.ca/pub/geott/ess_pubs/295/295574/of_7737.pdf>.
James, T.S., Henton, J.A., Leonard, L.J., Darlington, A., Forbes, D.L., and Craymer, M., (2015): Tabulated values of relative sea-level projections in Canada and the adjacent mainland United States; Geological Survey of Canada, Open File 7942, 81 p. <http://ftp2.cits.rncan.gc.ca/pub/geott/ess_pubs/297/297048/of_7942.pdf>doi:10.4095/297048
Jevrejeva, S., Moore, J.C. and Grinsted, A. (2010): How will sea level respond to changes in natural and anthropogenic forcings by 2100?; Geophysical Research Letters, v. 37, no. 7, art. L07703. doi:10.1029/2010GL042947
Jolicoeur, S. and O’Carroll, S. (2007): Sandy barriers, climate change and long-term planning of strategic coastal infrastructures, Îles-de-la-Made-leine, Gulf of St. Lawrence (Québec, Canada); Landscape and Urban Planning, v. 81, no. 4, p. 287–298. doi:10.1016/j.landurbplan.2007.01.011
Jones, B.M., Arp, C.D., Jorgenson, M.T., Hinkel, K.M., Schmutz, J.A. and Flint, P.L. (2009): Increase in the rate and uniformity of coastline erosion in Arctic Alaska; Geophysical Research Letters, v. 36, no. 3, art. L03503. doi:10.1029/2008GL036205
Katsman, C.A., Sterl, A., Beersma, J.J., van den Brink, H.W., Church, J.A., Hazeleger, W., Kopp, R.E., Kroon, D., Kwadijk, J., Lammersen, R., Lowe, J., Oppenheimer, M., Plag, H.-P., Ridley, J., von Storch, H., Vaughan, D.G., Vellinga, P., Vermeersen, L.L.A., van de Wal, R.S.W. and Weisse, R. (2011): Exploring high-end scenarios for local sea level rise to develop flood protection strategies for a low-lying delta – the Netherlands as an example; Climatic Change, v. 109, no. 3–4, p. 617–645.
Khon, V.C., Mokhov, I.I., Pogarskiy, F.A., Babanin, A., Dethloff, K., Rinke, A. and Matthes, H. (2014): Wave heights in the 21st century Arctic Ocean simulated with a regional climate model; Geophysical Research Letters, v. 41, no. 8, p. 2956–2961. doi:10.1002/2014GL059847
Kirwan, M.L. and Murray, A.B. (2008a): Tidal marshes as disequilibrium landscapes? Lags between morphology and Holocene sea level change; Geophysical Research Letters, v. 35, no. 24, art. L24401. doi:10.1029/2008GL036050
Kirwan, M.L. and Murray, A.B. (2008b): Ecological and morphological response of brackish tidal marshland to the next century of sea level rise: Westham Island, British Columbia; Global and Planetary Change, v. 60, no. 3–4, p. 471–486. doi:10.1016/j.gloplacha.2007.05.005
Kirwan, M.L., Murray, A.B. and Boyd, W.S. (2008): Temporary vegetation disturbance as an explanation for permanent loss of tidal wetlands; Geophysical Research Letters, v. 35, no. 5, art. L05403. doi:10.1029/2007GL032681
Kobayashi, N., Vidrine, J.C., Nairn, R.B. and Solomon, S.M. (1999): Erosion of frozen cliffs due to storm surge on Beaufort Sea coast; Journal of Coastal Research, v. 15, no. 2, p. 332–344.
Konopczak, A.M., Manson, G.K. and Couture, N.J. (2014): Variability of coastal change along the western Yukon coast; Geological Survey of Canada, Open File 7516, 73 p., <http://ftp2.cits.rncan.gc.ca/pub/geott/ess_pubs/293/293788/of_7516.pdf>.
Laidre, K., Heide-Jørgensen, M.P., Stern, H. and Richard, P. (2012): Unusual narwhal sea ice entrapments and delayed autumn freeze-up trends; Polar Biology, v. 35, no. 1, p. 149–154.
Lantuit, H. and Pollard, W.H. (2008): Fifty years of coastal erosion and retrogressive thaw slump activity on Herschel Island, southern Beaufort Sea, Yukon Territory, Canada; Geomorphology, v. 95, no. 1–2, p. 84–102.
Lantuit, H., Overduin, P.P., Couture, N., Wetterich, S., Aré, F., Atkinson, D., Brown, J., Cherkashov, G., Drozdov, D., Forbes, D.L., Graves-Gaylord, A., Grigoriev, M., Hubberten, H.-W., Jordan, J., Jorgenson, T., Ødegård, R.S., Ogorodov, S., Pollard, W.H., Rachold, V., Sedenko, S., Solomon, S., Steenhuisen, F., Streletskaya, I. and Vasiliev, A. (2012): The Arctic coastal dynamics database: a new classification scheme and statistics on Arctic permafrost coastlines; Estuaries and Coasts, v. 35, no. 2, p. 383–400. doi:10.1007/s12237-010-9362-6
Leont’yev, I.O. (2003): Modeling erosion of sedimentary coasts in the western Russian Arctic; Coastal Engineering, v. 47, no. 4, p. 413–429.
Leont’yev, I.O. (2004): Coastal profile modeling along the Russian Arctic coast; Coastal Engineering, v. 51, no. 8–9, p. 779–794.
MacDonald, E. (2010): The Yankee gale, the August gale and popular culture on Prince Edward Island; The Dalhousie Review, Dalhousie University, Halifax, Nova Scotia, v. 90, no. 1, p. 95–110, <https://ojs.library.dal.ca/dalhousieree-view/article/view/dr901macdonald/1415>.
Mahmood, R., Pielke, R.A. Sr., Hubbard, K.G., Niyogi, D., Dirmeyer, P.A., McAlpine, C., Carleton, A.M., Hale, R., Gameda, S., Beltrán-Przekurat, A., Baker, B., McNider, R., Legates, D.R., Shepherd, M., Du, J., Blanken, P.D., Frauenfeld, O.W., Nair, U.S. and Fall, S. (2014): Land cover changes and their biogeophysical effects on climate; International Journal of Climatol-ogy, v. 34, no. 4, p. 929–953.
Manson, G.K. (2002): Subannual erosion and retreat of cohesive till bluffs, McNab’s Island, Nova Scotia; Journal of Coastal Research, v. 18, no. 3, p. 421–432.
Manson, G.K. and Solomon, S.M. (2007): Past and future forcing of Beaufort Sea coastal change; Atmosphere-Ocean, v. 45, no. 2, p. 107–122.
Mars, J.C. and Houseknecht, D.W. (2007): Quantitative remote sensing study indicates doubling of coastal erosion rate in past 50 yr along a segment of the Arctic coast of Alaska; Geology, v. 35, no. 7, p. 583–586.
Marsh, P. and Schmidt, T. (1993): Influence of a Beaufort Sea storm surge on channel levels in the Mackenzie Delta; Arctic, v. 46, no. 1, p. 35–41.
Mathew, S., Davidson-Arnott, R.G.D. and Ollerhead, J. (2010): Evolution of a beach-dune system following a catastrophic storm overwash event: Greenwich Dunes, Prince Edward Island, 1936–2005; Canadian Journal of Earth Sciences, v. 47, no. 3, p. 273–290.
Maxwell, J.B. (1981): Climatic regions of the Canadian Arctic islands; Arctic, v. 34, no. 3, p. 225–240.
Maxwell, J. B. (1982): The climate of the Canadian Arctic islands and adjacent waters (volume 2); in Climatological Studies; Environment Canada, Atmospheric Environment Service, no. 30, 589 p

CANADA’S MARINE COASTS in a CHANGING CLIMATE 66
.Mazzotti, S., Jones, C. and Thomson, R.E. (2008): Relative and absolute sea level rise in western Canada and northwestern United States from a combined tide gauge–GPS analysis; Journal of Geophysical Research: Oceans, v. 113, art. C11019. doi:10.1029/2008JC004835
Mazzotti, S., Lambert, A., van der Kooij, M. and Mainville, A. (2009): Impact of anthropogenic subsidence on relative sea-level rise in the Fraser River delta; Geology, v. 37, no. 9, p. 771–774. doi: 10.1130/G25640A.1
McCann, S.B., editor (1980): The coastline of Canada: littoral processes and shore morphology; Geological Survey of Canada, Paper 80-10, 439 p., <http://ftp2.cits.rncan.gc.ca/pub/geott/ess_pubs/102/102212/pa_80_10.pdf>.
McCann, S.B. (1990): An introduction to the coastal dunes of Atlantic Canada; in Proceedings of the Canadian Symposium on Coastal Dunes, (ed.) R.G.D. Davidson-Arnott; National Research Council Canada, Associate Committee on Shoreline Erosion and Sedimentation, Ottawa, Ontario, p. 89–107.
McCann, S.B. and Byrne, M.-L. (1989): Stratification models for vegetated coastal dunes in Atlantic Canada; in Proceedings Royal Society of Edinburgh, v. 96B, p. 203–215.
McKee, K., Rogers, K. and Saintilan, N. (2012): Response of salt marsh and mangrove wetlands to changes in atmospheric CO2, climate, and sea level; in Global Change and the Function and Distribution of Wetlands, (ed.) B.A. Middleton; Global Change Ecology and Wetlands, v. 1, p. 63–96. doi:101007/978-94-007-4494-3_2
Mekis, É. and Vincent, L.A. (2011): An overview of the second generation adjusted daily precipitation dataset for trend analysis in Canada; Atmosphere-Ocean, v. 49, no. 2, p. 163–177.
Mesquita, M.S., Atkinson, D.E. and Hodges, K.I. (2010): Characteristics and variability of storm tracks in the North Pacific, Bering Sea, and Alaska; Journal of Climate, v. 23, no. 2, p. 294–311.
Mesquita, M.S., Atkinson, D.E., Simmonds, I., Keay, K. and Gottschalck, J. (2009): New perspectives on the synoptic development of the severe October 1992 Nome storm; Geophysical Research Letters, v. 36, no. 13, art. L13808. doi:10.1029/2009GL038824
Mitrovica, J.X., Gomez, N., Morrow, E., Hay, C. and Tamisiea, M.E. (2011): On the robustness of predictions of sea level fingerprints; Geophysical Journal International, v. 187, p. 729–742. doi: 10.1111/j.1365-246X.2011.05090.x
Mitrovica, J.X., Tamisiea, M.E., Davis, J.L. and Milne, G.A. (2001): Recent mass balance of polar ice sheets inferred from patterns of global sea-level change; Nature, v. 409, no. 6823, p. 1026–1029.
Moss, R.H., Edmonds, J.A., Hibbard, K.A., Manning, M.R., Rose, S.K., van Vuuren, D.P., Carter, T.R., Emori, S., Kainuma, M., Kram, T., Meehl, G.A., Mitchell, J.F.B., Nakicenovic, N., Riahi, K., Smith, S.J., Stouffer, R.J., Thomson, A.M., Weyant, J.P. and Wilbanks, T.J. (2010): The next generation of scenarios for climate change research and assessment; Nature, v. 463, no. 7282, p. 747–756.
Mueller, D.R., Vincent, W.F. and Jeffries, M.O. (2003): Break-up of the largest Arctic ice shelf and associated loss of an epishelf lake; Geophysical Research Letters, v. 30, no. 20, art. 2031. doi:10.1029/2003GL017931
Nakićenović, N., Davidson, O., Davis, G., Grübler, A., Kram, T., Lebre La Rovere, E., Metz, B., Morita, T., Pepper, W., Pitcher, H., Sankovski, A., Shukla, P. Swart, R., Watson, R. and Dadi, Z. (2000): Special Report on Emissions Scenarios; a special report of Working Group III of the Intergovernmental Panel on Climate Change, Cambridge University Press, Cambridge, United Kingdom, 599 p.
National Research Council (2012): Sea-Level Rise for the Coasts of California, Oregon, and Washington: Past, Present, and Future; The National Academy Press, Washington, District of Columbia, 201 p.
Natural Resources Canada (2007): Annual mean total precipitation; National Atlas of Canada, Natural Resources Canada, Earth Sciences Sector, <http://geogratis.gc.ca/api/en/nrcan-rncan/ess-sst/d8fb41f0-8893-11e0-92bb-6cf049291510>.
New Zealand Ministry for the Environment (2008): Coastal hazards and climate change: a guidance manual for local government in New Zealand (2nd edition); New Zealand Ministry for the Environment, Wellington, New Zealand, 129 p., <http://www.mfe.govt.nz/sites/default/files/coastal-hazards-climate -change-guidance-manual.pdf>.
Nicholls, R.J., Hanson, S.E., Lowe, J.A., Warrick, R.A., Lu, X., Long, A.J. and Carter, T.A. (2011): Constructing sea-level scenarios for impact and adaptation assessment of coastal areas: a guidance document; Intergovernmental Panel on Climate Change (IPCC), Task Group on Data and Scenario Support for Impact and Climate Analysis, Geneva, Switzerland, 47 p., <http://www.ipcc-data.org/docs/Sea_Level_Scenario_Guidance_Oct2011.pdf>.
O’Carroll, S., Bérubé, D., Forbes, D.L., Hanson, A., Jolicoeur, S. and Fréchette, A. (2006): Coastal erosion; in Impacts of Sea-Level Rise and Climate Change on the Coastal Zone of Southeastern New Brunswick, (ed.) R. Daigle; Environ-ment Canada, p. 324–401, <http://publications.gc.ca/collections/Collection/En84-45-2006E.pdf>.
Ollerhead, J., Davidson-Arnott, R.G.D., Walker, I.J. and Mathew, S. (2013): Annual to decadal morphodynamics of the foredune system at Greenwich Dunes, Prince Edward Island, Canada; Earth Surface Processes and Landforms, v. 38, no. 3, p. 284–298.
Orford, J.D., Jennings, S.C. and Forbes, D.L. (2001): Origin, development, reworking and breakdown of gravel-dominated coastal barriers in Atlantic Canada: future scenarios for the British coast; in Ecology and Geomorphology of Coastal Shingle, (ed.) J.R. Packham, R.E. Randall, R.S.K. Barnes and A. Neal; Westbury Academic and Scientific Publishing, Otley, United Kingdom, p. 23–55.
Orson, R.A., Simpson, R.L. and Good, R.E. (1990): Rates of sediment accumulation in a tidal freshwater marsh; Journal of Sedimentary Petrology, v. 60, no. 6, p. 859–869.
Overeem, I., Anderson, R.S., Wobus, C.W., Clow, G.D., Urban, F.E. and Matell, N. (2011): Sea ice loss enhances wave action at the Arctic coast; Geophysical Research Letters, v. 38, no. 17, art. L17503. doi:10.1029/2011GL048681
Parkes, G.S. and Ketch, L.A. (2002): Storm-surge climatology; in Coastal Impacts of Climate Change and Sea-Level Rise on Prince Edward Island, (ed.) D.L. Forbes and R.W. Shaw; Geological Survey of Canada, Open File 4261, Supporting Document 2, 86 p., <http://geogratis.gc.ca/api/en/nrcan -rncan/ess-sst/b127e3eb-9238-50ef-a5d5-1a4b62601e82.html>.
Parkes, G.S., Manson, G.K., Chagnon, R. and Ketch, L.A. (2006): Storm-surge, wind, wave and ice climatology; in Impacts of Sea-Level Rise and Climate Change on the Coastal Zone of Southeastern New Brunswick, (ed.) R. Daigle; Environment Canada, p. 95–262, <http://publications.gc.ca/collections/Collection/En84-45-2006E.pdf>.
Parris, A., Bromirski, P. Burkett, V., Cayan, D., Culver, M., Hall, J., Horton, R., Knuuti, K., Moss, R., Obeysekera, J., Sallenger, A. and Weiss, J. (2012): Global sea level rise scenarios for the US National Climate Assessment; NOAA Technical Memo OAR CPO-1, 37 p.
Peltier, W.R. (2004): Global glacial isostasy and the surface of the ice-age Earth: the ICE-5G (VM2) model and GRACE; Annual Review of Earth and Planetary Sciences, v. 32, p. 111–149.
Pfeffer, W.T., Harper, J.T. and O’Neel, S. (2008): Kinematic constraints on glacier contributions to 21st-century sea-level rise; Science, v. 321, no. 5894, p. 1340–1343.
Phillips, J.D. (1999): Event timing and sequence in coastal shoreline erosion: Hurricanes Bertha and Fran and the Neuse Estuary; Journal of Coastal Research, v. 15, no. 3, p. 616–623.
Pielke, R.A. Sr., Pitman, A., Niyogi, D., Mahmood, R., McAlpine, C., Hossain, F., Goldewijk, K.K., Nair, U., Betts, R., Fall, S., Reichstein, M., Kabat, P. and de Noblet, N. (2011): Land use/land cover changes and climate: modeling analysis and observational evidence; Wiley Interdisciplinary Reviews: Climate Change, v. 2, no. 6, p. 828–850. doi:10.1002/wcc.144
Pinna Sustainability (2013): Atmospheric Rivers State of Knowledge Report; unpublished contract report to Pacific Climate Impacts Consortium, Pacific Institute for Climate Solutions and BC Ministry of Environment, 10 p., <http://www.pacificclimate.org/sites/default/files/publications/Atmo-spheric%20Report%20Final%20Revised.pdf>.
Pisaric, M.F., Thienpont, J.R., Kokelj, S.V., Nesbitt, H., Lantz, T.C., Solomon, S. and Smol, J.P. (2011): Impacts of a recent storm surge on an Arctic delta ecosystem examined in the context of the last millennium; Proceedings of the National Academy of Sciences of the United States of America, v. 108, no. 22, p. 8960–8965.
Public Works and Government Services Canada (1971): Beaufort Sea storm: investigation of effects in the Mackenzie Delta Region; unpublished report, Government of Canada, Ottawa, Ontario, 23 p.
Rahmstorf, S. (2007): A semi-empirical approach to projecting future sea-level rise; Science, v. 315, no. 5810, p. 368–370.
Ralph, F.M. and Dettinger, M.D. (2012): Historical and national perspectives on extreme west coast precipitation associated with atmospheric rivers during December 2010; Bulletin of the American Meteorological Society, v. 93, no. 6, p. 783–790.
Rampton, V.N. and Bouchard, M. (1975): Surficial geology of Tuktoyaktuk, District of Mackenzie; Geological Survey of Canada, Paper 74–53, 17 p. and Map 5–1974, <http://geoscan.nrcan.gc.ca/starweb/geoscan/servlet.starweb ?path=geoscan/fulle.web&search1=R=102560>.

Chapter 2 | DYNAMIC COASTS IN A CHANGING CLIMATE 67
Reimnitz, E. and Maurer, D.K. (1979): Effects of storm surges on the Beaufort Sea coast, northern Alaska; Arctic, v. 32, no. 4, p. 329–344.
Reimnitz, E., Barnes, P.W. and Harper, J.R. (1990): A review of beach nourishment from ice transport of shoreface materials, Beaufort Sea, Alaska; Journal of Coastal Research, v. 6, no. 2, p. 439–470.
Reynolds, R.W. and Smith, T.M. (1995): A high-resolution global sea surface temperature climatology; Journal of Climate, v. 8, p. 1571–1583, <http://dx.doi.org/10.1175/1520-0442(1995)008<1571:AHRGSS>2.0.CO;2>.
Roberts, B.A. and Robertson, A. (1986): Salt marshes of Atlantic Canada: their ecology and distribution; Canadian Journal of Botany, v. 64, no. 2, p. 455–467.
Roberts, E., Nawri, N. and Stewart, R.E. (2008): On the storms passing over southern Baffin Island during autumn 2005; Arctic, v. 61, no. 3, p. 309–321.
Rockström, J., Steffen, W., Noone, K., Persson, Å., Chapin, F.S., III, Lambin, E., Lenton, T.M., Scheffer, M., Folke, C., Schellnhuber, H.J., Nykvist, B., de Wit, C.A., Hughes, T., van der Leeuw, S., Rodhe, H., Sörlin, S., Snyder, P.K., Costanza, R., Svedin, U., Falkenmark, M., Karlberg, L., Corell, R.W., Fabry, V.J., Hansen, J., Walker, B., Liverman, D., Richardson, K., Crutzen, P. and Foley, J.A. (2009): A safe operating space for humanity; Nature, v. 461, no. 7263, p. 472–475.
Rogelj, J., Meinshausen, M. and Knutti, R. (2012): Global warming under old and new scenarios using IPCC climate sensitivity range estimates; Nature Climate Change, v. 2, p. 248–253. doi: 10.1038/NCLIMATE1385
Rosati, J.D., Dean, R.G. and Walton, T.L. (2013): The modified Bruun Rule extended for landward transport; Marine Geology, v. 340, p. 71–81.
Ruddiman, W., Vavrus, S., Kutzbach, J. and He, F. (2014): Does pre-industrial warming double the anthropogenic total?; The Anthropocene Review, v. 1, no. 2, p. 147–153.
Ruffman, A. (1999): A multidisciplinary and interscientific study of the Saxby Gale: an October 4–5, 1869 hybrid hurricane and record storm surge; Canadian Meteorological and Oceanographic Society (CMOS) Bulletin, v. 27, no. 3, p. 67–73.
Scavia, D., Field, J.C., Boesch, D.F., Buddemeier, R.W., Burkett, V., Cayan, D.R., Fogarty, M., Harwell, M.A., Howarth, R.W., Mason, C., Reed, D.J., Royer, T.C., Sallenger, A.H. and Titus, J.G. (2002): Climate change impacts on U.S. coastal and marine ecosystems; Estuaries, v. 25, no. 2, p. 149–164.
Šeparović, L., Alexandru, A., Laprise, R., Martynov, A., Sushama, L., Winger, K., Tete, K. and Valin, M. (2013): Present climate and climate change over North America as simulated by the fifth-generation Canadian regional climate model; Climate Dynamics, v. 41, no. 11–12, p. 3167–3201.
Shabbar, A. and Khandekar, M. (1996): The impact of El Niño-Southern oscillation on the temperature field over Canada: research note; Atmosphere-Ocean, v. 34, no. 2, p. 401–416.
Shaw, J. and Ceman, J. (1999): Salt-marsh aggradation in response to late-Holocene sea-level rise at Amherst Point, Nova Scotia, Canada; The Holocene, v. 9, no. 4, p. 439–451. doi:0.1191/ 095968399668027869
Shaw, J., Gareau, P. and Courtney, R.C. (2002): Palaeogeography of Atlantic Canada 13-0 kyr; Quaternary Science Reviews, v. 21, no. 16–17, p. 1861–1878.
Shaw, J., Taylor, R.B., Forbes, D.L., Ruz, M.-H. and Solomon, S. (1998): Sensitivity of the coasts of Canada to sea level rise; Geological Survey of Canada Bulletin 505, 79 p., <http://open.canada.ca/data/en/dataset/b321c920-4f4e-50c5-bfea-103b961b6ebc>.
Shugar, D.H., Walker, I.J., Lian, O.B., Eamer, J.B.R., Neudorf, C., McLaren, D. and Fedje, D. (2014): Post-glacial sea-level change along the Pacific coast of North America, Quaternary Science Review, v. 97, p. 170–192. doi: 10.1016/j.quascirev.2014.05.022
Simmonds, I. and I. Rudeva, I. (2012): The great Arctic cyclone of August 2012; Geophysical Research Letters, v. 39, no. 23, art. L23709. doi:10.1029/2012GL054259
Solomon, S.M. (2005): Spatial and temporal variability of shoreline change in the Beaufort-Mackenzie region, Northwest Territories, Canada; Geo-Marine Letters, v. 25, no. 2–3, p. 127–137.
Solomon, S.M. and Covill, R. (1995): Impacts of the September 1993 storm on the Beaufort Sea; in Proceedings of the 1995 Canadian Coastal Conference, 18–21 October 1995, Dartmouth, Nova Scotia; Canadian Coastal Science and Engineering Association, v. 2, p. 779–795.
Squire, V.A. (2007): Of ocean waves and sea-ice revisited; Cold Regions Science and Technology, v. 49, no. 2, p. 110–133.
Stammerjohn, S., Massom, R., Rind, D. and Martinson, D. (2012): Regions of rapid sea ice change: an inter-hemispheric seasonal comparison; Geophysical Research Letters, v. 39, no. 6, art. L06501. doi:10.1029/2012GL050874
Stern, N. (2007): The Economics of Climate Change: the Stern Review; Cambridge University Press, Cambridge, United Kingdom, 712 p.
Stewart, R.E., Bachand, D., Dunkley, R.R., Giles, A.C., Lawson, B., Legal, L., Miller, S.T., Murphy, B.P., Parker, M.N., Paruk, B.J. and Yau, M.K. (1995): Winter storms over Canada; Atmosphere-Ocean, v. 33, no. 2, p. 223–247. doi:10.1080/07055900.1995.9649533
St-Hilaire-Gravel, D., Bell, T. and Forbes, D.L. (2010): Raised gravel beaches as proxy indicators of past sea-ice and wave conditions, Lowther Island, Canadian Arctic Archipelago; Arctic, v. 63, no. 2, p. 213–226.
St-Hilaire-Gravel, D., Forbes, D.L. and Bell, T. (2012): Multitemporal analysis of a gravel-dominated coastline in the central Canadian Arctic Archipelago; Journal of Coastal Research, v. 28, no. 2, p. 421–441.
St-Hilaire-Gravel, D., Forbes, D.L. and Bell, T. (2015): Evolution and morphodynam-ics of a prograded beach-ridge foreland, northern Baffin Island, Canadian Arctic Archipelago; Geografiska Annaler: Series A, Physical Geography, p. 1–21. doi:10.1111/geoa.12103
Stirling, I. and Derocher, A.E. (2012): Effects of climate warming on polar bears: a review of the evidence; Global Change Biology, v. 18, no. 9, p. 2694–2706.
Stroeve, J.C., Serreze, M.C., Holland, M.M., Kay, J.E., Malanik, J. and Barrett, A.P. (2012): The Arctic’s rapidly shrinking sea ice cover: a research synthesis; Climatic Change, v. 110, no. 3–4, p. 1005–1027.
Taylor, R.B., Forbes, D.L., Frobel, D., Manson, G.K. and Shaw, J. (2014): Coastal geoscience studies at the Bedford Institute of Oceanography, 1962–2012; in Voyage of Discovery: Fifty Years of Marine Research at Canada’s Bedford Institute of Oceanography, (ed.) D.N. Nettleship, D.C. Gordon, C.F.M. Lewis, and M.P. Latremouille; Bedford Institute of Oceanography–Oceans Association, Dartmouth, Nova Scotia, p. 197-204.
Taylor, R.B., Frobel, D., Forbes, D.L. and Mercer, D. (2008): Impacts of post-tropi-cal storm Noel (November, 2007) on the Atlantic coastline of Nova Scotia; Geological Survey of Canada, Open File 5802, 86 p., <http://ftp2.cits.rncan.gc.ca/pub/geott/ess_pubs/225/225116/of_5802.pdf>.
Thevenot, M.M. and Kraus, N.C. (1995): Longshore sand waves at Southampton Beach, New York: observation and numerical simulation of their movement; Marine Geology, v. 126, no. 1–4, p. 249–269. doi:10.1016/0025-3227(95)00081-9
Thomson, J. and Rogers, W.E. (2014): Swell and sea in the emerging Arctic Ocean; Geophysical Research Letters, v. 41, no. 9, p. 3136–3140. doi:10.1002/2014GL059983
Thomson, R.E., Bornhold, B.D. and Mazzotti, S. (2008): An examination of the factors affecting relative and absolute sea level in coastal British Columbia; Canadian Technical Report of Hydrography and Ocean Sciences 260, 49 p., <http://www.dfo-mpo.gc.ca/Library/335209.pdf>.
Torio, D.D. and Chmura, G.L. (2013): Assessing coastal squeeze of tidal wetlands; Journal of Coastal Research, v. 29, no. 5, p. 1049–1061. doi:10.2112/JCOASTRES-D-12-00162
van Proosdij, D. and Townsend, S. (2006): Spatial and temporal patterns of salt marsh colonization following causeway construction in the Bay of Fundy; Journal of Coastal Research, Special Issue 39, p. 1858–1862.
van Proosdij, D., Ollerhead, J. and Davidson-Arnott, R.G.D. (2006): Seasonal and annual variations in the volumetric sediment balance of a macro-tidal salt marsh; Marine Geology, v. 225, no. 1–4, p. 103-127.
Verhagen, H.J. (1989): Sand waves along the Dutch coast; Coastal Engineering, v. 13, no. 2, p. 129–147. doi:10.1016/0378-3839(89)90020-3
Vermaire, J.C., Pisaric, M.F., Thienpont, J.R., Courtney Mustaphi, C.J., Kokelj, S.V. and Smol, J.P. (2013): Arctic climate warming and sea ice declines lead to increased storm surge activity; Geophysical Research Letters, v. 40, no. 7, p. 1386–1390.
Vermeer, M. and Rahmstorf, S. (2009): Global sea level linked to global temperature; Proceedings of the National Academy of Sciences of the United States of America, v. 106, no. 51, p. 21527–21532.
Vincent, L.A. and Mekis, É. (2006): Changes in daily and extreme temperature and precipitation indices for Canada over the twentieth century; Atmosphere-Ocean, v. 4, no. 2, p. 177–193. doi:10.3137/ao.440205
Vincent, L.A., Wang, X.L., Milewska, E.J., Wan, H., Yang, F. and Swail, V. (2012): A second generation of homogenized Canadian monthly surface air temperature for climate trend analysis; Journal of Geophysical Research: Atmospheres, v. 117, art. D18110. doi:10.1029/2012JD017859
CANADA’S MARINE COASTS in a CHANGING CLIMATE 68
Vose, R.S., Applequist, S., Bourassa, M.A., Pryor, S.C., Barthelmie, R.J., Blanton, B., Bromirski, P.D., Brooks, H.E., DeGaetano, A.T., Dole, R.M., Easterling, D.R., Jensen, R.E., Karl, T.R., Katz, R.W., Klink, K., Kruk, M.C., Kunkel, K.E., MacCracken, M.C., Peterson, T.C., Shein, K., Thomas, B.R., Walsh, J.E., Wang, X.L., Wehner, M.F., Wuebbles, D.J. and Young, R.S. (2014): Monitoring and understanding changes in extremes: extratropical storms, winds, and waves; Bulletin of the American Meteorological Society, v. 95, no. 3, p. 377–386. doi:10.1175/BAMS-D-12-00162.1
Wadhams, P., Squire, V.A., Goodman, D.J., Cowan, A.M. and Moore, S.C. (1988): The attenuation rates of ocean waves in the marginal ice zone; Journal of Geophysical Research: Oceans, v. 93, no. C6, p. 6799–6818.
Walker, I.J. and Barrie, J.V. (2006): Geomorphology and sea-level rise on one of Canada’s most ‘sensitive’ coasts: northeast Graham Island, British Columbia; Journal of Coastal Research, Special Issue 39, p. 220–226.
Wang, M. and Overland, J.E. (2009): A sea ice free summer Arctic within 30 years?; Geophysical Research Letters, v. 36, art. L07502. doi:10.1029/2009GL037820
Wang, X.L. (2006): Climatology and trends in some adverse and fair weather conditions in Canada, 1953–2004; Journal of Geophysical Research: Atmospheres, v. 111, no. D9. doi:10.1029/2005JD006155
Wang, X.L., Feng, Y. and Swail, V.R. (2012): North Atlantic wave height trends as reconstructed from the 20th century reanalysis; Geophysical Research Letters, v. 39, no. 18, art. L18705. doi:10.1029/2012GL053381
Wang, X.L., Feng, Y. and Swail, V.R. (2014a): Changes in global ocean wave heights as projected using multimodel CMIP5 simulations; Geophysical Research Letters, v. 41, p. 1026–1034. doi:10.1002/2013GL058650
Wang, X.L., Feng, Y. and Vincent, L.A. (2014b): Observed changes in one-in-20 year extremes of Canadian surface air temperatures; Atmosphere-Ocean, v. 52, no. 3, p. 222–231.
Wang, X.L., Wan, H. and Swail, V.R. (2006): Observed changes in cyclone activity in Canada and their relationships to major circulation regimes; Journal of Climate, v. 19, no. 6, p. 896–915.
Warren, F.J. and Lemmen, D.S. (2014): Synthesis; in Canada in a Changing Climate: Sector Perspectives on Impacts and Adaptation, (ed.) F.J. Warren and D.S. Lemmen; Government of Canada, Ottawa, p. 1–18, <http://www.nrcan.gc.ca/sites/www.nrcan.gc.ca/files/earthsciences/pdf/assess/2014/pdf/Synthesis_Eng.pdf>.
Webster, T. (2012): Coastline change in Prince Edward Island, 1968–2010 and 2000–2010; Atlantic Climate Adaptation Solutions Association (ACASA), 36 p., <http://atlanticadaptation.ca/sites/discoveryspace.upei.ca.acasa/files/ACASA%20PEI%20Coastal%20Change%20from%201968-2010%20and%202000-2010_2.pdf>.
Webster, T.L. and Forbes, D.L. (2006): Airborne laser altimetry for predictive modeling of coastal storm-surge flooding; in Remote Sensing of Aquatic Coastal Ecosystem Processes, (ed.) L.L. Richardson and E.F. LeDrew; Springer, Dordrecht, Netherlands, p. 157–182.
Webster, T., Forbes, D.L., Dickie, S., Covill, R.A. and Parkes, G.S. (2002): Airborne imaging, digital elevation models and flood maps; in Coastal Impacts of Climate Change and Sea-Level Rise in Prince Edward Island, (ed.) D.L. Forbes and R.W. Shaw, Geological Survey of Canada, Open File 4261, 31 p.
Webster, T., McGuigan, K., Collins, K. and MacDonald, C. (2014): Integrated river and coastal hydrodynamic flood risk mapping of the LaHave River estuary and town of Bridgewater, Nova Scotia, Canada; Water, v. 6, no. 3, p. 517–546.
Whalen, D., Fraser, P., Forbes, D.L., Manson, G.K., Hynes, S., James, T.S., Szlavko, B. and Couture, N.J. (2012): Coastal change in the Canadian Beaufort Sea – findings and observations based on the synthesis of coastal geoscience data to support BREA; Oral presentation abstracts, Arctic Change 2014, Ottawa, p. 197–198, <http://www.arcticnetmeetings.ca/ac2014/docs/web-oral-presentation.pdf>.
Wobus, C., Anderson, R.S., Overeem, I., Matell, N., Clow, G. and Urban, F. (2011): Thermal erosion of a permafrost coastline: improving process-based models using time-lapse photography; Arctic, Antarctic and Alpine Research, v. 43, no. 3, p. 474–484. doi:10.1657/1938-4246-43.3.474
Wolfe, S.A., Walker, I.J. and Huntley, D.J. (2008): Holocene coastal reconstruction, Naikoon peninsula, Queen Charlotte Islands, British Columbia; Geological Survey of Canada, Current Research 2008–12, 16 p., <http://ftp2.cits.rncan.gc.ca/pub/geott/ess_pubs/225/225498/cr_2008_12.pdf>.
Wolinsky, M.A. (2009): A unifying framework for shoreline migration: 1. Multiscale shoreline evolution on sedimentary coasts; Journal of Geophysical Research: Earth Surface, v. 114, art. F01008. doi:10.1029/2007JF000855
Wolinsky, M.A. and Murray, A.B. (2009): A unifying framework for shoreline migration: 2. Application to wave-dominated coasts; Journal of Geophysi-cal Research: Earth Surface, v. 114, art. F01009. doi:10.1029/2007JF000856
Wong, P.P., Losada, I.J., Gattuso, J.-P., Hinkel, J., Khattabi, A., McInnes, K.L., Saito, Y. and Sallenger, A. (2014): Coastal systems and low-lying areas; in Climate Change 2014: Impacts, Adaptation, and Vulnerability; Part A: Global and Sectoral Aspects; Contribution of Working Group II to the Fifth Assessment Report of the Intergovernmental Panel on Climate Change (IPCC), (ed.) C.B. Field, V.R. Barros, D.J. Dokken, K.J. Mach, M.D. Mastrandrea, T.E. Bilir, M. Chatterjee, K.L. Ebi, Y.O. Estrada, R.C. Genova, B. Girma, E.S. Kissel, A.N. Levy, S. MacCracken, P.R. Mastrandrea and L.L. White; Cambridge University Press, Cambridge, United Kingdom and New York, New York, p. 361–409, <http://www.ipcc.ch/pdf/assessment-report/ar5/wg2/WGIIAR5-Chap5_FINAL.pdf>.
Wood, M.E., Kelley, J.T. and Belknap, D.F. (1989): Patterns of sediment accumula-tion in the tidal marshes of Maine; Estuaries, v. 12, n. 4, p. 237–246.
Woodroffe, C.D., Nicholls, R.J., Burkett, V. and Forbes, D.L. (2014): The impact of climate change on coastal ecosystems; in Oceans and Human Health: Implications for Society and Well-Being, (ed.) R.E. Bowen, M.H. Depledge, C.P. Carlarne and L.E. Fleming; Wiley-Blackwell, Chichester, United Kingdom, p. 141–176.
Yin, J. (2012): Century to multi-century sea level rise projections from CMIP5 models; Geophysical Research Letters, v. 39, art. L17709. doi:10.1029/2012GL052947
Yin, J., Griffies, S.M. and Stouffer, R.J. (2010): Spatial variability of sea level rise in twenty-first century projections; Journal of Climate, v. 23, no. 17, p. 4585–4607.
Young, I.R., Zieger, S., Babanin, A.V. (2011): Global trends in wind speed and wave height; Science, v. 332, p. 451–455. doi:10.1126/science.1197219
Zhang, X., Hogg, W.D. and Mekis, É. (2001): Spatial and temporal characteristics of heavy precipitation events over Canada; Journal of Climate, v. 14, no. 9, p. 1923–1936.