canadian drowning report - lifesaving society · change in number of unintentional water-related...
TRANSCRIPT

Canadian Drowning Report
2016 Edition
Prepared for the Lifesaving Society Canada by the Drowning Prevention Research Centre Canada
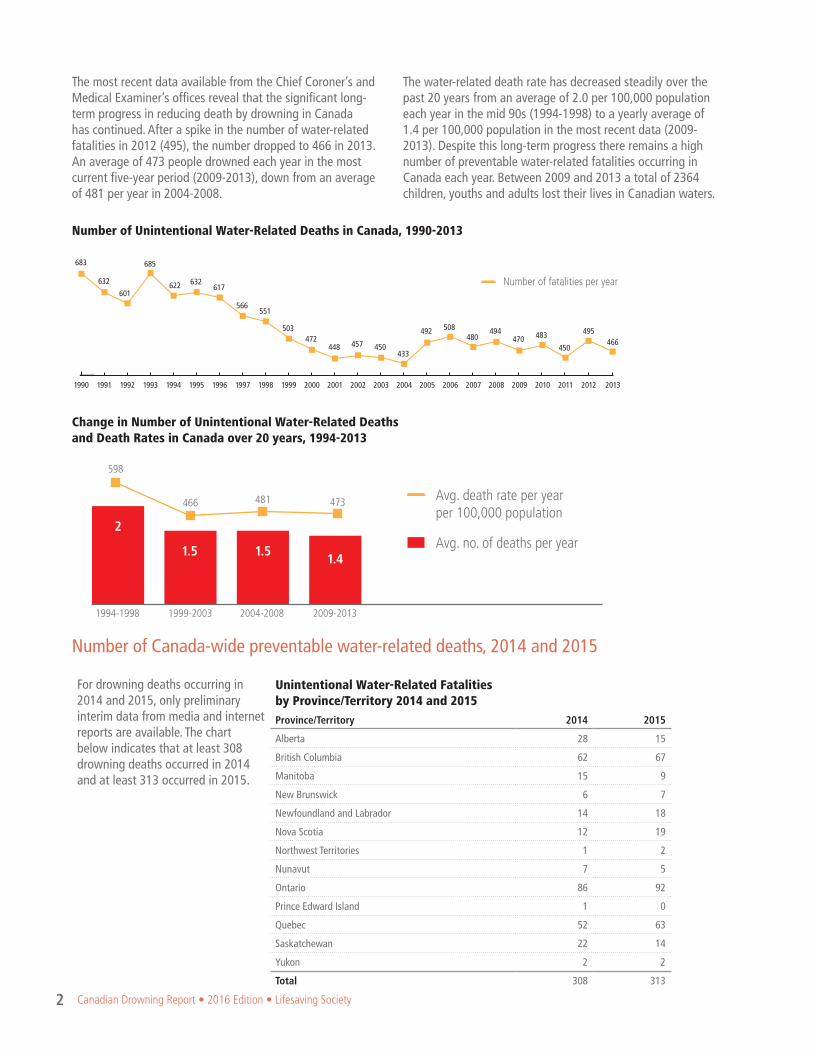
The most recent data available from the Chief Coroner’s and Medical Examiner’s offices reveal that the significant long-term progress in reducing death by drowning in Canada has continued. After a spike in the number of water-related fatalities in 2012 (495), the number dropped to 466 in 2013. An average of 473 people drowned each year in the most current five-year period (2009-2013), down from an average of 481 per year in 2004-2008.
The water-related death rate has decreased steadily over the past 20 years from an average of 2.0 per 100,000 population each year in the mid 90s (1994-1998) to a yearly average of 1.4 per 100,000 population in the most recent data (2009-2013). Despite this long-term progress there remains a high number of preventable water-related fatalities occurring in Canada each year. Between 2009 and 2013 a total of 2364 children, youths and adults lost their lives in Canadian waters.
Number of Canada-wide preventable water-related deaths, 2014 and 2015
For drowning deaths occurring in 2014 and 2015, only preliminary interim data from media and internet reports are available. The chart below indicates that at least 308 drowning deaths occurred in 2014 and at least 313 occurred in 2015.
Unintentional Water-Related Fatalities by Province/Territory 2014 and 2015Province/Territory 2014 2015
Alberta 28 15
British Columbia 62 67
Manitoba 15 9
New Brunswick 6 7
Newfoundland and Labrador 14 18
Nova Scotia 12 19
Northwest Territories 1 2
Nunavut 7 5
Ontario 86 92
Prince Edward Island 1 0
Quebec 52 63
Saskatchewan 22 14
Yukon 2 2
Total 308 313
1990 1991 1992 1993 1994 1995 1996 1997 1998 1999 2000 2001 2002 2003 2004 2005 2006 2007 2008 2009 2010 2011 2012 2013
683
632
601
685
622 632617
566551
503472
448 457 450433
492 508480
494 495466
450470 483
Number of fatalities per year
Number of Unintentional Water-Related Deaths in Canada, 1990-2013
Change in Number of Unintentional Water-Related Deaths and Death Rates in Canada over 20 years, 1994-2013
1994-1998
Avg. death rate per yearper 100,000 population
Avg. no. of deaths per year
1999-2003 2004-2008 2009-2013
598
466 481 473
2
1.5 1.51.4
2 Canadian Drowning Report • 2016 Edition • Lifesaving Society

Age
The age groups with the highest risk of drowning in Canada have remained consistent over the past ten years. The highest water-related fatality rates in 2009-2013 were once again found among young adults aged 20-34 and seniors 65 and older (1.6 and 1.8 per 100,000 respectively). Within these age groups, 20-24 year-olds and 85-89 year-olds had the highest death rate (1.9 and 2.0 per 100,000 population, respectively). Moreover, 20-24 year-olds had the highest number of drowning deaths of all age groups with an average of 44 drowning fatalities each year.
High rates were also found among baby boomers 50-64 years of age (1.5 per 100,000), and middle-aged adults 35-49 years of age (1.3 per 100,000). Encouragingly, both of these rates have decreased modestly from the previous five-year period (down from 1.6 and 1.4 respectively).
The lowest drowning rates were found among young people. Youth 5-14 years of age had the lowest water-related fatality rate of all ages (0.4 per 100,000)
and children under the age of 5 had the next lowest rate (1.1 per 100,000). There has been a long-term trend towards decreasing death rates among children less than 5 years of age in Canada. This trend continues in 2009-2013 as the death rate in this age group is down 8% from 1.2 in 2004-2008. Drowning prevention education efforts directed at parents with young children appear to be having an impact.
Sex
Over 80% of drowning fatalities once again occurred among men. Between 2009 and 2013 an average of 385 males drowned each year, this translates to a water-related fatality rate of 2.3 per 100,000 population. Comparatively, an average of 88 females drowned each year, a rate of 0.5 per 100,000 population.
The skew towards males was evident in all provinces and territories, but was most pronounced in the Eastern Provinces. In Atlantic Canada, 9 out of 10 drowning victims were male. By age, the greatest proportion of male drowning deaths once again occurred
among young adults 20 to 34 years of age, and the lowest proportions among children under the age of 5, and elderly adults.
While the vast majority of drowning victims continue to be male, the proportion of female drowning fatalities has increased in recent years. In 2010, 15% of all drowning victims were female, this proportion has increased each subsequent year to 23% in 2013 with an accompanying increase in the drowning rate among females from 0.4 per 100,000 to 0.6 per 100,000.
Ethnicity
In an effort to confirm previous studies that suggested that newcomers to Canada are at a higher risk of drowning, the Drowning Prevention Research Centre began collecting data on the country of birth of drowning victims, as well as how long they had been living in Canada prior to drowning. Unfortunately, obtaining this information continues to be difficult; on average country of birth could not be determined in approximately 60% of cases. However, this proportion has decreased each year since the start of data collection in 2010. In 2013, the most recent year for which data was available, country of birth was identified for almost half (49%) of cases. However, more work is needed to improve the reporting of information regarding birth place of drowning victims. From cases where the information was available, we know that since 2010, 79 drowning victims have been reported as being born outside of Canada, in North America, Africa, Asia or Europe.
Aboriginal peoples continue to be at a higher risk for drowning than non-Aboriginal Canadian residents. In the 2009-2013 period, an average of 46 drowning victims per year (10% of all drowning fatalities) were reported to be Aboriginal. Comparatively, approximately 4% of the Canadian population identifies as an Aboriginal person.
WHO IS DROWNING?
0-4
21
9 8
30
4437 33
24
35 36 38 4031
25 2216 13
93
1.1
0.5 0.4
1.3
1.9
1.61.4
1.1
1.4 1.31.4
1.71.5 1.6
1.91.7
1.92.0
1.3
5-9 10-14 15-19 20-24 25-29 30-34 35-39 40-44 45-49 50-54 55-59 60-64 65-69 70-74 75-79 80-84 85-89 90+
Avg. death rate per yearper 100,000 population
Avg. no. of deaths per year
Age GroupNumber of Unintentional Water-Related Deaths and Death Rates by Age in Canada, 2009-2013
3Canadian Drowning Report • 2016 Edition • Lifesaving Society

By time of year
The time of year when drowning deaths most commonly occur in Canada has remained consistent year to year. Although drowning deaths occur in all months of the year, the largest number occur during the warmer months, particularly in the summer. In the 2009-2013 period, the majority (66%) of drownings occurred in May through September, peaking in July and August (34%). In 2013, more drowning deaths occurred in June (79, 17%), than August (69, 15%), but July was still the most common month in which drowning deaths occurred (81, 17%).
By day of week
Over half (54%) of 2009-2013 drownings occurred on the weekend (Friday to Sunday), and just under half (46%) during the week (Monday to Thursday). When compared to the previous five-year period, the frequency and proportion of weekend versus weekday drowning fatalities did not change substantially. In 2013, one quarter (26%) of all water-related fatalities occurred on a Saturday, and another 20% occurred on a Sunday. During the week, drownings were more likely to occur on a Monday (13%) than a Friday (11%).
WHEN ARE THEY DROWNING?Time of YearAverage Number of Deaths per Year and Percentage of Unintentional Water-Related Deaths in Canada, 2004-2013
Jan.
Feb.
Mar.
Apr.
May
June
July
Aug.
Sept.
Oct.
Nov.
Dec.
Unknown
20 (4%)17 (4%)
15 (3%)14 (3%)
20 (4%)26 (5%)
30 (6%)27 (6%)
50 (10%)47 (10%)
63 (13%)68 (14%)
88 (18%)88 (19%)
67 (14%)
36 (8%)40 (9%)
30 (6%)29 (6%)
24 (5%)19 (4%)
19 (4%)14 (3%)
9 (2%)
20 (4%)
74 (16%)
2004-2008
2009-2013
4 Canadian Drowning Report • 2016 Edition • Lifesaving Society

Body of water
Consistent with previous years, natural bodies of water such as lakes and ponds (37%), rivers and streams (28%), and oceans (9%) accounted for the majority (74%) of Canadian drownings in 2009-2013. In 2013 alone, 326 people drowned in a natural body of water. The proportion of drowning deaths in natural bodies of water varies somewhat based on geographical location. The Territories and Atlantic Canada had the highest percentages of drowning deaths in natural bodies of water (86-100%) in the 2009-2013 period.
Drowning fatalities in man-made settings are more common in the central provinces, the Prairies, and British Columbia. Consistent with previous years, bathtubs were the number one man-made setting where drownings occurred in Canada (9%). By province, the greatest number of bathing fatalities occur in Ontario (102), Quebec (37), British Columbia, (26) and Alberta (21), contributing to 12%, 9%, 7%, and 11% of each of these province’s total drowning deaths respectively. In 2013, 43 Canadian drowning deaths occurred in a bathtub.
Infants less than one and seniors over 65 years of age are vulnerable groups for bathtub drownings; two thirds of all infant drowning deaths occurred in a bathtub and 50% of all bathtub drownings occurred among seniors 65 and older.
Pools accounted for 7% of all drowning deaths in Canada in 2009-2013, remaining consistent with previous years. The majority of pool drownings occurred in private pools (86%), and this continues to be the primary setting where children under the age of 5 most often drown (43%).
One of the ten actions to prevent drowning outlined by the World Health Organization in the Global Report on Drowning is to install barriers controlling access to water. The report reinforces the importance of fencing swimming pools with four-sided,
child-resistant fences and self-closing gates with safety latches. It remains difficult to obtain detailed fence and gate information from backyard pool drowning cases. In instances where this information was available, 38% of the pools had no fence present or a non-compliant fence, and 78% had either no gate, or the gate was neither self-closing nor self-latching.
Drowning deaths in lifeguard supervised settings such as public pools and waterfronts continue to be few. In 2009-2013 less than 2% of all water-related fatalities occurred in a lifeguard supervised setting.
WHERE ARE THEY DROWNING?
Body of WaterAverage Number of Deaths per Year and Percentage of Unintentional Water-Related Deaths in Canada, 2004-2013
Lake or Pond
River/Creek/Stream
Ocean
Bathtub
Private Pool
Ditch/Culvert
Hot tub/Whirlpool
Public Pool
Canal
Quarry
Other/Unknown
179 (37%)176 (37%)
135 (28%)131 (28%)
49 (10%)45 (9%)
44 (9%)41 (9%)
27 (6%)30 (6%)
15 (3%)16 (3%)
8 (2%)9 (2%)
4 (1%)5 (1%)
4 (1%)3 (1%)
2 (1%)3 (1%)
14 (3%)14 (3%)
2004-2008
2009-2013
5Canadian Drowning Report • 2016 Edition • Lifesaving Society

Provinces and Territories
The water-related fatality rate decreased in most provinces and territories in 2009-2013, consistent with the overall decrease in the national drowning rate from the previous five-year period.
Some of the largest decreases were found in the Territories. In the 2009-2013 period, the drowning rate in Northern Canada decreased by 33% to 9.6 per 100,000 population (down from 14.4 per 100,000 in 2004-2008). The greatest change was seen in the Northwest Territories (-60% from 17.1 to 6.9 per 100,000), followed by Nunavut (-24% from 16.2 to 12.3 per 100,000), and the Yukon (-13% from 11.8 to 10.2 per 100,000). Despite these substantial decreases, the drowning death rate in the Territories continues to be significantly higher than anywhere else in Canada, at nearly seven times the national average.
Other provinces that experienced a decrease in water-related fatality rate were Prince Edward Island (-63 %), Alberta (-19%), New Brunswick (-17%), Nova Scotia (-12%), British Columbia (-9%), and Quebec (-7%).
Despite the overall decline in the national drowning death rate, the number of water-related fatalities increased in some provinces. Drowning rates increased in Saskatchewan (+13% in 2009-2013 vs. 2004-2008), Newfoundland (+12%), and Manitoba (+9%).
Urban versus rural location
Despite the fact that less than 20% of the Canadian population lives in a rural area, 40% of all drowning fatalities in 2009-2013 occurred in a rural environment. The areas of Canada with the highest proportion of rural drownings were Saskatchewan (82%), Manitoba (69%), and the Territories (65%). While these areas do have a higher proportion of residents living in rural areas than other provinces, with the exception of Nunavut, they all still have a greater proportion of their population living in urban areas than rural areas. In Canada between 2009-2013 almost half (49%) of victims who drowned in a rural location were reported as permanently residing in an urban area.
Province and TerritoryAverage Number of Unintentional Water-Related Deaths per Year and Death Rates in Canada, 2004-2013
Newfoundland and Labrador
Prince Edward Island
Nova Scotia
New Brunswick
Quebec
Ontario
Manitoba
Saskatchewan
Alberta
British Columbia
Northwest Territories
Nunavut
Yukon
19 (3.7)22 (4.2)
3 (1.9)1 (0.7)
17 (1.8)15 (1.6)14 (1.9)
12 (1.6)86 (1.1)
84 (4.2)164 (1.3)
167 (1.3)23 (1.9)
26 (2.1)18 (1.8)
21 (2.0)40 (1.2)
37 (1.0)81 (1.9)
78 (1.7)7 (17.1)4 (6.9)
5 (16.2)4 (12.3)4 (11.8)4 (10.2)
2004-2008
2009-2013
6 Canadian Drowning Report • 2016 Edition • Lifesaving Society

Purpose of activity
There have been no major changes in the most common purpose of activity people engaged in prior to drowning in 2009-2013. Recreational activities continue to account for almost two-thirds of all water-related fatalities (61%). An average of 289 people drowned in Canada each year while recreating in, on or near the water. The most common recreational activities were swimming (26%), and walking, running, or playing near water or on ice (16%). Powerboating (11%) and fishing from a boat (9%) were also common recreational activities engaged in by drowning victims. In 2013 alone, 179 people (38%) drowned while engaged in one of these four activities.
After recreational activities, daily living accounted for the next highest proportion of drowning incidents in Canada (25%). Between 2009 and 2013, an average of 119 people drowned in Canada each year while engaged in an activity of daily living. This was down slightly (-5%) from 2004-2008. The most common daily living activities engaged in prior to drowning were bathing (33%) and motor vehicle travel (32%). In 2013, 42 people drowned while bathing and 36 drowned as the result of a motor vehicle collision into water.
Occupational activities account for fewer Canadian drowning fatalities (6%), however an average of 26 occupational drowning deaths occurred each year between 2009 and 2013, and this was slightly higher (+4%) than the average number per year in 2004-2008. The most vulnerable sector for occupational drowning deaths continues to be commercial fishing (37% in 2009-2013). Driving is another common occupational activity engaged in prior to drowning. In 2013, more people drowned as the result of occupational driving (32%) than commercial fishing (29%).
For an average of 29 drowning victims per year (6%), the activity immediately prior to drowning was unknown, indicating that there continue to be a number of people who are undertaking aquatic activities alone, or that the activity immediately prior to the drowning was not witnessed.
WHAT WERE THEY DOING?
Most Common Primary Recreational ActivitiesAverage Number of Deaths per Year and Percentage of Unintentional Water-Related Death Rates in Canada, 2009-2013
Swim
min
g
Wal
king
/Run
ning
/Pla
ying
Near
Wat
er
Pow
erbo
atin
g
Fishi
ng fr
om a
Boa
t
Cano
eing
Divin
g/Ju
mpi
ng
Snow
mob
iling
Othe
r Non
-pow
er B
oatin
g
Ridi
ng A
TV
Fishi
ng fr
om L
and
Kaya
king
76(26%)
46(16%)
31(11%) 27
(9%) 19(7%)
14(5%) 9
(3%)9
(3%)8
(3%)7
(2%)6
(2%)
2009-2013
7Canadian Drowning Report • 2016 Edition • Lifesaving Society

Type of activity
The most common types of activities engaged in prior to drowning in 2009-2013 remain consistent with the previous five-year period. Boating (26%) was once again the most common, an average of 124 people drowned each year while engaged in some type of boating. Aquatic activities (25%), where the victim intended to be in the water at the time of the incident, accounted for almost as many drowning fatalities in 2009-2013 as boating. An average of 120 people drowned each year during aquatic activities like swimming and wading.
After boating and aquatic activities, an unexpected fall into water during a non-aquatic activity accounted for the next greatest proportion of incidents (20%). An average of 96 people drowned each year as the result of an unintentional entry into water. Land, ice and air transportation (15%) and bathing (9%) accounted for a lesser proportion of water-related fatalities – an average 73 people drowned each year as the result of a transportation incident and an additional 40 people per year drowned while bathing.
Purpose of ActivityAverage Number of Deaths per Year and Percentage of Unintentional Water-Related Deaths in Canada, 2004-2013
Type of ActivityAverage Number of Deaths per Year and Percentage of Unintentional Water-Related Deaths in Canada, 2004-2013
Recreational
Daily Living
Occupational
Attempted Rescue
Unknown
287 (60%)
289 (61%)
126 (26%)
119 (25%)
25 (5%)
26 (6%)
9 (2%)
9 (2%)
36 (7%)
29 (6%)
2004-2008
2009-2013
Boating
Aquatic Activity
Non-aquatic Activity
Land, Ice or Air Transportation
Bathing
Unknown
125 (26%)
124 (26%)
117 (24%)
120 (25%)
90 (19%)
96 (20%)
83 (17%)
73 (15%)
44 (9%)
40 (9%)
23 (5%)
19 (4%)
2004-2008
2009-2013
8 Canadian Drowning Report • 2016 Edition • Lifesaving Society

Boating
The characteristics of boating-related drowning deaths in Canada remain consistent with those reported in the past. Over half (54%) of boating deaths once again occurred during powerboat use. Among these, small powerboats less than 5.5 meters in length (26%) were more commonly used than large powerboats (13%) or personal watercraft (2%). After powerboats, canoes were the next most common type of vessel (21%) involved in boating incidents.
In boating-related deaths for which personal flotation device (PFD) information was available, 82% of victims were not wearing a PFD/lifejacket at the time of the incident. Of those who were known not to be wearing a PFD/lifejacket (443), at least 150 (34%) had a lifejacket present in the boat but were unable to put it on during the incident. Alcohol consumption was a factor in 39% of boating-related fatalities. The most common types of boating incidents that led to drowning were capsizing (38%) and falling or being thrown overboard (28%).
Boating Incidents by Type of VesselAverage Number of Deaths per Year and Percentage of Unintentional Water-Related Deaths in Canada, 2004-2013
Powerboat <5.5 m
Canoe
Powerboat >5.5m
Powerboat, size unknown
Kayak
Inflatable craft
Sailboat
Rowboat
Personal watercraft
Other/unknown
2004-2008
2009-2013
35 (28%)
32 (26%)
28 (22%)
26 (21%)
14 (11%)
16 (13%)
14 (11%)
16 (13%)
6 (5%)
7 (5%)
4 (4%)
5 (4%)
4 (4%)
3 (2%)
3 (2%)
4 (3%)
3 (2%)
3 (2%)
14 (11%)
12 (10%)
9Canadian Drowning Report • 2016 Edition • Lifesaving Society
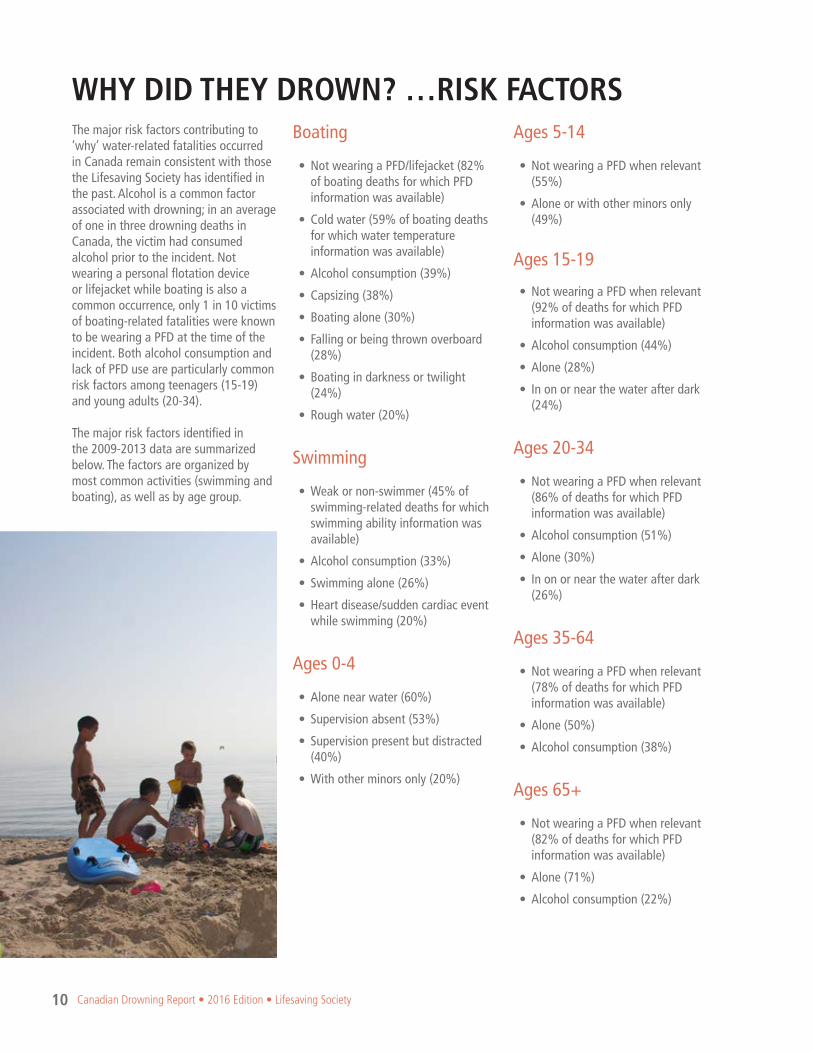
The major risk factors contributing to ‘why’ water-related fatalities occurred in Canada remain consistent with those the Lifesaving Society has identified in the past. Alcohol is a common factor associated with drowning; in an average of one in three drowning deaths in Canada, the victim had consumed alcohol prior to the incident. Not wearing a personal flotation device or lifejacket while boating is also a common occurrence, only 1 in 10 victims of boating-related fatalities were known to be wearing a PFD at the time of the incident. Both alcohol consumption and lack of PFD use are particularly common risk factors among teenagers (15-19) and young adults (20-34).
The major risk factors identified in the 2009-2013 data are summarized below. The factors are organized by most common activities (swimming and boating), as well as by age group.
Boating
• Not wearing a PFD/lifejacket (82% of boating deaths for which PFD information was available)
• Cold water (59% of boating deaths for which water temperature information was available)
• Alcohol consumption (39%)
• Capsizing (38%)
• Boating alone (30%)
• Falling or being thrown overboard (28%)
• Boating in darkness or twilight (24%)
• Rough water (20%)
Swimming
• Weak or non-swimmer (45% of swimming-related deaths for which swimming ability information was available)
• Alcohol consumption (33%)
• Swimming alone (26%)
• Heart disease/sudden cardiac event while swimming (20%)
Ages 0-4
• Alone near water (60%)
• Supervision absent (53%)
• Supervision present but distracted (40%)
• With other minors only (20%)
Ages 5-14
• Not wearing a PFD when relevant (55%)
• Alone or with other minors only (49%)
Ages 15-19
• Not wearing a PFD when relevant (92% of deaths for which PFD information was available)
• Alcohol consumption (44%)
• Alone (28%)
• In on or near the water after dark (24%)
Ages 20-34
• Not wearing a PFD when relevant (86% of deaths for which PFD information was available)
• Alcohol consumption (51%)
• Alone (30%)
• In on or near the water after dark (26%)
Ages 35-64
• Not wearing a PFD when relevant (78% of deaths for which PFD information was available)
• Alone (50%)
• Alcohol consumption (38%)
Ages 65+
• Not wearing a PFD when relevant (82% of deaths for which PFD information was available)
• Alone (71%)
• Alcohol consumption (22%)
WHY DID THEY DROWN? …RISK FACTORS
10 Canadian Drowning Report • 2016 Edition • Lifesaving Society

In summary
The latest coroner’s data demonstrates that the trend of a decreasing drowning death rate in Canada is continuing. In 2013, the number of unintentional water-related fatalities decreased to 466.
The highest drowning rates were found among men, young adults 20-34 years of age and seniors 65 and older.
Drowning fatalities were most likely to occur during the summer, on weekends, and in natural bodies of water such as lakes and rivers. Fewer drownings occurred in man-made settings such as private backyard pools but this setting is still a hazard for children under the age of 5.
Despite substantial decreases from the previous five-year period, the highest drowning rates in 2013 were still found in the Territories. Water-related fatality rates increased in Saskatchewan, Newfoundland and Labrador, and Manitoba.
By purpose of activity, the largest proportion of incidents occurred during a recreational activity. The most common of these were swimming, or walking, running or playing near water. By type of activity, boating and aquatic activities were the most common.
The significant long-term progress that has been made in reducing death by drowning in Canada is encouraging, but there are still close to 500 preventable, unintentional water-related fatalities occurring each year. This reinforces the need for continued drowning prevention efforts.
Research methodology
Complete data from 1990-2013
The drowning research process involves data collection; research tabulation and analysis. The water-related death data is extracted from the offices of the Chief Coroners and Medical Examiners in each province/territory. The scope of this research:
• collects the data needed to profile victims of aquatic incidents, including the circumstances and contributing factors under which these incidents occurred.
• includes all deaths in each province/territory and Canada overall resulting from incidents “in, on or near” water; “near-water” incidents were included if the incident was closely related to water-based recreational, vocational or daily living activity, or if the presence of water appeared to be an attraction contributing to the incident.
• includes only unintentional deaths. It does not include deaths due to natural causes, suicide, or homicide.
Interim data
Complete final data on more recent drownings and other water-related deaths are not yet available from the offices of the provincial/territorial Chief Coroners and Medical Examiners. The interim, preliminary data are derived from media releases, media clippings, news reports and internet searches.
Acknowledgements
We gratefully acknowledge the support, co-operation and efforts of:
• The Chief Coroner’s Office and the Chief Medical Examiners in each province/territory, who permitted and facilitated confidential access to coroners’ reports on unintentional water-related deaths. This provided the base data for this research and report.
• The volunteers who contributed their time and energy including data extraction on unintentional water-related deaths from coroners’ files.
• Tessa Clemens who was primary author and data analyst for this report and Lucie Simoes who provided data input and verification.
Drowning Prevention Research Centre Canada
The Drowning Prevention Research Centre is the lead agency for drowning and water-incident research in Canada. The Centre conducts research into fatal and non-fatal drowning, significant aquatic injury and rescue interventions. Contact: Barbara Byers, Research Director
Email: [email protected] Telephone: 416-490-8844
CANADIAN DROWNING REPORT
11Canadian Drowning Report • 2016 Edition • Lifesaving Society

Contact us
National OfficeTel: 613-746-5694Email: [email protected]
British Columbia & YukonTel: 604-299-5450Email: [email protected]
Alberta and Northwest TerritoriesTel: 780-415-1755Email: [email protected]
SaskatchewanTel: 306-780-9255Email: [email protected]
ManitobaTel: 204-956-2124Email: [email protected]
OntarioTel: 416-490-8844Email: [email protected]
QuebecTel: 514-252-3100Email: [email protected]
New BrunswickTel: 506-455-5762Email: [email protected]
Nova ScotiaTel: 902-425-5450Email: [email protected]
Prince Edward IslandTel: 902-368-7757Email: [email protected]
Newfoundland and LabradorTel: 709-576-1953Email: [email protected]
The Lifesaving Society
The Lifesaving Society – Canada’s lifeguarding experts – works to prevent drowning and water-related injury through its training programs, Water Smart® public education, aquatic safety management, drowning research and lifesaving sport. Annually, over 1,000,000 Canadians participate in the Society’s swimming, lifesaving, lifeguard and leadership training programs. The Society sets the standard for aquatic safety in Canada and certifies Canada’s National Lifeguards.
12 Canadian Drowning Report • 2016 Edition • Lifesaving Society