canadian economic and emissions model for agriculture (ceema ): model description and applications
DESCRIPTION
Canadian Economic and Emissions Model for Agriculture (CEEMA ): Model Description and Applications. Bruce Junkins, Suren Kulshreshtha & Marie Boehm Forestry and Agriculture Greenhouse Gas Modeling Forum Sheperdstown, WV, October 2, 2001. Objectives. - PowerPoint PPT PresentationTRANSCRIPT
Canadian Economic and Emissions Model for Agriculture (CEEMA):
Model Description and Applications
Canadian Economic and Emissions Model for Agriculture (CEEMA):
Model Description and Applications
Bruce Junkins, Suren Kulshreshtha & Marie Boehm
Forestry and Agriculture Greenhouse Gas Modeling Forum
Sheperdstown, WV, October 2, 2001
Develop a model to assess impacts of mitigation strategies on GHG emissions from the agriculture and agri-food sector economic indicators
Estimate 1990 GHG emission levels
Forecast 2010 GHG emission levels based on business as usual scenario
Estimate impact of selected options on GHG emission levels and economic indicators for the sector
ObjectivesObjectives

Based on an existing policy analysis model (Canadian Regional Agricultural Model - CRAM)
Greenhouse Gas Emissions module links levels of agricultural activities to emission coefficients
Integrated model (Canadian Economic Emissions Model for Agriculture - CEEMA) incorporates science with policy analysis
CEEMA goes beyond primary agriculture and IPCC accounting to include forward and backward linkages (farm inputs, off-farm transportation, food processing)
Modeling FrameworkModeling Framework

Land BaseLand Base
Cultivated LandCultivated LandUncultivated
Land
Uncultivated Land
Non-land resources
Non-land resources
Economic Optimization Model(Canadian Regional Agricultural Model)
Economic Optimization Model(Canadian Regional Agricultural Model)
Technology of Production
Technology of Production
Product and Input Markets
Product and Input Markets
Level of Crop and Livestock Productio
n
Level of Crop and Livestock Productio
n
Farm Input
Demand
Farm Input
Demand
Shipments and Trade
Shipments and Trade
Greenhouse Gas Emissions ModelGreenhouse Gas Emissions ModelScience of
Greenhouse Gas Emissions:
Estimation of coefficients
Science of Greenhouse
Gas Emissions:Estimation of coefficients
Producer and Consumer
Surplus
Producer and Consumer
Surplus
Greenhouse Gas Emissions from the Agriculture and Agri-Food Sector
Greenhouse Gas Emissions from the Agriculture and Agri-Food Sector
Schematic of the Components of CEEMA Schematic of the Components of CEEMA

Policy Model – CRAMPolicy Model – CRAM
Static, non-linear optimization model
Maximizes producer + consumer surplus
Integrates all sectors of primary agriculture
Regional supply/demand
Inter-provincial and international trade
Government policies/subsidies
Transportation and handling
Land is the only resource constraint
Crop supply response determined by relative profitability of alternative crops
Regional Coverage 29 crop production regions
22 in the Prairie region 1 each in other provinces
Provincial level for livestock, dairy and poultry
Land types Cropland Hayland Improved Pasture Unimproved Land
CRAMCRAM

Crop Production Regions in CRAMCrop Production Regions in CRAM
AlbertaSaskatchewan
Manitoba

WestWheat (4 grades)Durum WheatFeed BarleyMalting barleyCanolaFlaxOatsLentilsField peasPotatoesHayPastureOther crops
EastWheatSoybeansFeed barleyCorn grainCorn silagePotatoesHayPastureOther crops
Fallow/Stubble Split (West)WheatDurumCanolaLentils
Tillage Practices(West)IntensiveModerateNo-till
CRAM - Field CropsCRAM - Field Crops

Cattle basic herdCows
Heifers
Calves
Bulls
Cattle feedlot operationsSteers
Heifers
HogsSows
Growers
DairyCows
Heifers
Calves
Fluid milk
Industrial milk
PoultryChickens
Layers
Turkeys
CRAM - LivestockCRAM - Livestock
CRAM - Economic CoverageCRAM - Economic Coverage
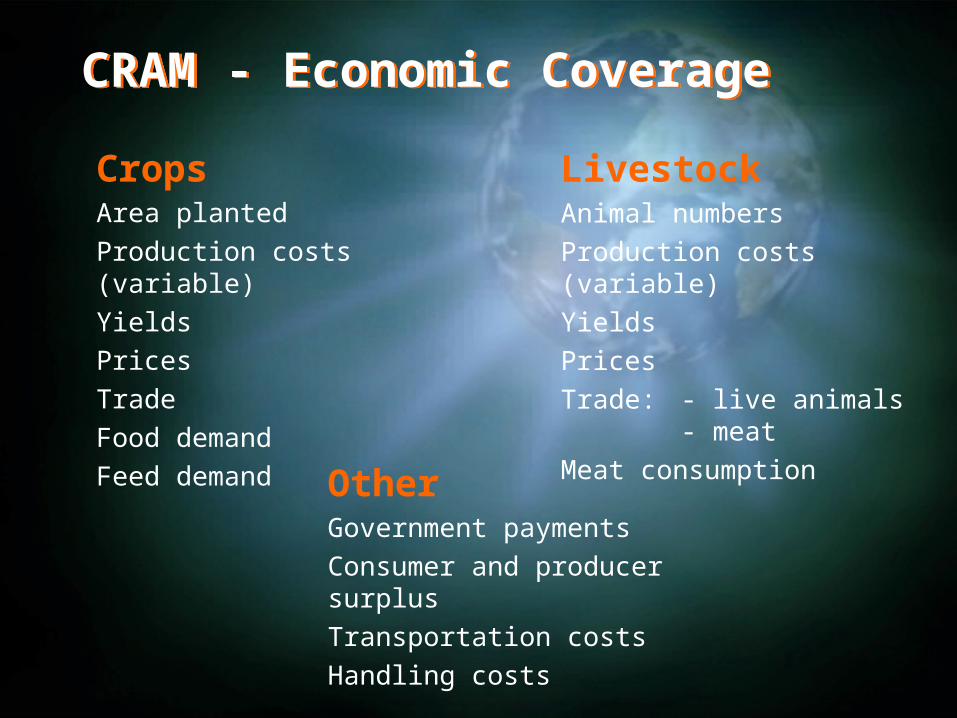
CropsArea planted
Production costs (variable)
Yields
Prices
Trade
Food demand
Feed demand
LivestockAnimal numbers
Production costs (variable)
Yields
Prices
Trade: - live animals- meat
Meat consumption
OtherGovernment payments
Consumer and producer surplus
Transportation costs
Handling costs

100 year Global Warming Equivalent estimates of CO2, CH4 and N2O emissions
Emission coefficients based on latest scientific information biophysical models (CENTURY) expert opinion (AAFC Research Branch, IPCC and
Environment Canada) Disaggregate approach - emissions of each GHG are
estimated for each region, crop and livestock production activities, and source of GHG emissions
Estimated emissions = emissions coefficient * production activity level
Flexibility in method of summation (e.g. total agriculture and agri-food sector vs. IPCC/Inventory methodology)
Greenhouse Gas Emissions ModuleGreenhouse Gas Emissions Module

CEEMA Accounting of the Agriculture and Agri-Food SectorCEEMA Accounting of the Agriculture and Agri-Food Sector
Activity IPCC Agr. IPCC — EnergyIPCC
Land UseChanges
Energy UseTrans-
portationManu-
facturing Sinks
Farm — Direct Production Emissions — Crops
Crop Residues N2O
Fertilizer Use N2O
Fuel Use CO2 CH4 N2O
Manure Application N2O CH4
Nitrogen Fixing Crops N2O
Soil Organic Matter CO2 CO2
Farm — Direct Production Emissions — Livestock
Animals CH4
Stationary Combustion CO2 CH4 N2O
Manure Handling N2O CH4

Activity IPCC Agr. IPCC — EnergyIPCC
Land UseChanges
Energy UseTrans-
portationManu-
facturing Sinks
Other Sub-Sectors
Indirect Emissions N2O
Transportation/Storage CO2 CH4 N2O
Food Processing CO2 CH4 N2O
Prod. Related Services CO2 CH4 N2O
Farm Inputs CO2 CH4 N2O
Other AgroecosystemComponents
N2O CO2 CH4 CO2
CEEMA Accounting of the Agricultureand Agri-Food Sector (cont’d)CEEMA Accounting of the Agricultureand Agri-Food Sector (cont’d)

Source 1990 2010 Diff. (%)
Soil Organic Matter (source) 6.0 0.6 -5.4 (-90%)
Crop Production (excl. SOM) 16.1 22.6 6.5 (40%)
Livestock Production 34.3 40.5 6.2 (18%)
Other 1.2 1.3 0.1 (8.3%)
IPCC/Inventory 57.6 65.0 7.4 (13%)
Soil Organic Matter (sink) -0.01 -5.8 -5.8
On-Farm Fuel Use 8.1 8.1 0.0 (0.4%)
Total Primary Agriculture 65.7 67.3 1.6 (2.4%)
Farm Inputs, Off-Farm Transportationand Food Processing
24.8 30.7 5.9 (24%)
Total Agriculture/Agri-Food 90.5 98.0 7.5 (8.3%)
(million tonnes CO2 equivalents)
GHG Emissions from AgricultureGHG Emissions from Agriculture

Soil nutrient management Better matching of N to crop requirements
Soil Management* Increase use of no-till Decrease use of summerfallow Increase use of permanent cover
Grazing Management* Decrease cattle stocking rates + complimentary grazing
+ rotational grazing
Change Animal Diets Reduce protein intake, additives (hogs. poultry, dairy)
Agroforestry Shelterbelts
* Soil Sinks
Agriculture and Agri-Food Table Options ReportAgriculture and Agri-Food Table Options Report

Percent Change in CO2-Eq EmissionsRelative to 2010 Baseline (CENTURY)Percent Change in CO2-Eq EmissionsRelative to 2010 Baseline (CENTURY)
-20
-15
-10
-5
0
5
10
15
20
IPCC Agriculture Total Primary Agriculture
2010Target
Nut. Mgt.
Summerfallow Grazing Shelterbelts
No-Till PCP AnimalDiets
TotalReductions
% change

-20
-15
-10
-5
0
5
10
15
20
IPCC Agriculture Total Primary Agriculture
TotalReductions
% change
Percent Change in CO2-Eq EmissionsRelative to 2010 Baseline (Expert Opinion)Percent Change in CO2-Eq EmissionsRelative to 2010 Baseline (Expert Opinion)
2010Target
Nut. Mgt.
Summerfallow Grazing Shelterbelts
No-TillPCP Animal
Diets

Estimate scale of sink potential for 1st commitment period Land based accounting Improvements to Table analysis Low, medium and high adoption rates of BMP related to change
in soil carbon Cropland management
frequency of no-till frequency of summerfallow
Grazing land management conversion of cropland to permanent cover intensity of pasture and grazing land management
Shelterbelts
Canadian Submission to the UNFCC (proposals related to Kyoto Protocol Article 3.3)Canadian Submission to the UNFCC (proposals related to Kyoto Protocol Article 3.3)
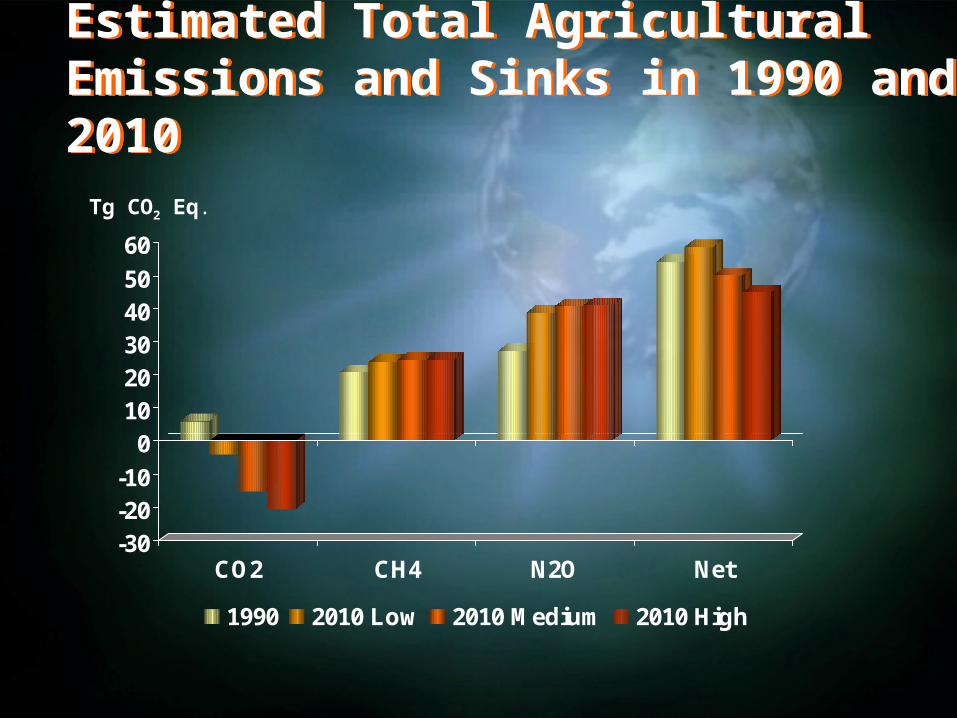
-30-20-10
01020304050
60
CO2 CH4 N2O Net
1990 2010 Low 2010 Medium 2010 High
Tg CO2 Eq.
Estimated Total Agricultural Emissions and Sinks in 1990 and 2010Estimated Total Agricultural Emissions and Sinks in 1990 and 2010

Tg CO2-Eq.Increased carbon sequestration on grazing land.
Decreased N2O emissions from fertilizer due to less land under annual crops.
Increased CH4 and N2O emissions due to expanded livestock herd.
Net emission reductions of 0.6 million tonnes per year.
If no livestock increase, then could be an additional 1 Mt reduction.
Example: Estimated Impacts of 1 m ha Permanent Cover and Cattle Increase on GHG Emissions (2010)
Importance of Net GHG AccountingImportance of Net GHG Accounting
-1.4
-1.2
-1.0
-0.8
-0.6
-0.4
-0.2
0.0
0.2
0.4
0.6
CO2 CH4 N2O Net
Cropland Grazing & Livestock Total

Impacts of agriculture on GHG emissions go beyond the primary sector
Importance of soil sinks
GHG reduction targets may be achievable through a series of actions based on existing technology
Trade-off between GHG reduction and increased agricultural production (especially livestock)
Measures to promote adoption of mitigation practices
Uncertainty of GHG coefficients
Environmental co-benefits
Key MessagesKey Messages

Collaboration with broad research community
Analyze additional mitigation scenarios as input to National Business Plan
Targeted Measures and Domestic Emissions Trading Working Groups
Improve economic component of CEEMA (better regional disaggregation and farm level production data)
Incorporate price of carbon for analysis of emissions trading options
Improve GHG coefficients based on scientific research reflective of Canadian conditions
Improve links to agri-food sector and transportation of bulk commodities
Analysis of non-food markets (biofuels, strawboard)
Investigate the dynamics of climate change, potential impacts and possible adaptation
Future ActivitiesFuture Activities