canadian environmental sustainability indicators household ... · canadian environmental...
TRANSCRIPT

Canadian Environmental Sustainability Indicators
Household Use of
Chemical Pesticides
and Fertilizers

Household Use of Chemical Pesticides and Fertilizers Page 2 of 13
Suggested citation for this document: Environment and Climate Change Canada (2016)
Canadian Environmental Sustainability Indicators: Household Use of Chemical Pesticides and
Fertilizers. Consulted on day Month, year. Available at: www.ec.gc.ca/indicateurs-indicators/default.asp?lang=En&n=258BC62B-1.
Cat. No.: En4-144/6-2015E-PDF
ISBN: 978-0-660-03722-6
Unless otherwise specified, you may not reproduce materials in this publication, in whole or
in part, for the purposes of commercial redistribution without prior written permission from
Environment and Climate Change Canada's copyright administrator. To obtain permission to
reproduce Government of Canada materials for commercial purposes, apply for Crown Copyright Clearance by contacting:
Environment and Climate Change Canada
Public Inquiries Centre
7th floor, Fontaine Building
200 Sacré-Coeur boul.
Gatineau, QC K1A 0H3
Telephone: 819-938-3860
Toll Free: 1-800-668-6767 (in Canada only)
Fax: 819-994-1412
TTY: 819-994-0736
Email: [email protected]
Photos: © Thinkstockphotos.ca; © Environment and Climate Change Canada
© Her Majesty the Queen in Right of Canada, represented by the Minister of Environment and Climate Change, 2016
Aussi disponible en français

Canadian Environmental Sustainability Indicators Page 3 of 13
Canadian Environmental Sustainability Indicators
Household Use of Chemical Pesticides and
Fertilizers
March 2016
Table of Contents
Part 1. Household Use of Chemical Pesticides and Fertilizers Indicator ................... 5
Part 2. Data Sources and Methods for the Household Use of Chemical Pesticides and Fertilizers Indicator .......................................................................................... 7
Introduction ........................................................................................................... 7
Description and rationale of the Household Use of Chemical Pesticides and Fertilizers indicator................................................................................................................ 7
Data ..................................................................................................................... 7
Methods ................................................................................................................ 8
Caveats and limitations ........................................................................................... 9
Part 3. Annexes .................................................................................................... 10
Annex A. Data tables for the figures presented in this document ................................. 10
Annex B. References and additional information ........................................................ 12
List of Figures
Figure 1. Percentage of households in Canada with a lawn or garden using chemical
pesticides and fertilizers, 1994, 2005, 2007, 2009, 2011 and 2013 ............................... 5
Figure 2. Percentage of households with a lawn or garden using chemical pesticides and fertilizers by province, Canada, 1994 and 2013 .................................................... 6

Household Use of Chemical Pesticides and Fertilizers Page 4 of 13
List of Tables
Table A.1. Data for Figure 1. Percentage of households in Canada with a lawn or garden
using chemical pesticides and fertilizers, 1994, 2005, 2007, 2009, 2011 and 2013 ........ 10
Table A.2. Data for Figure 2. Percentage of households with a lawn or garden using
chemical pesticides and fertilizers by province, Canada, 1994 and 2013 ....................... 10

Canadian Environmental Sustainability Indicators Page 5 of 13
Part 1. Household Use of Chemical Pesticides and
Fertilizers Indicator
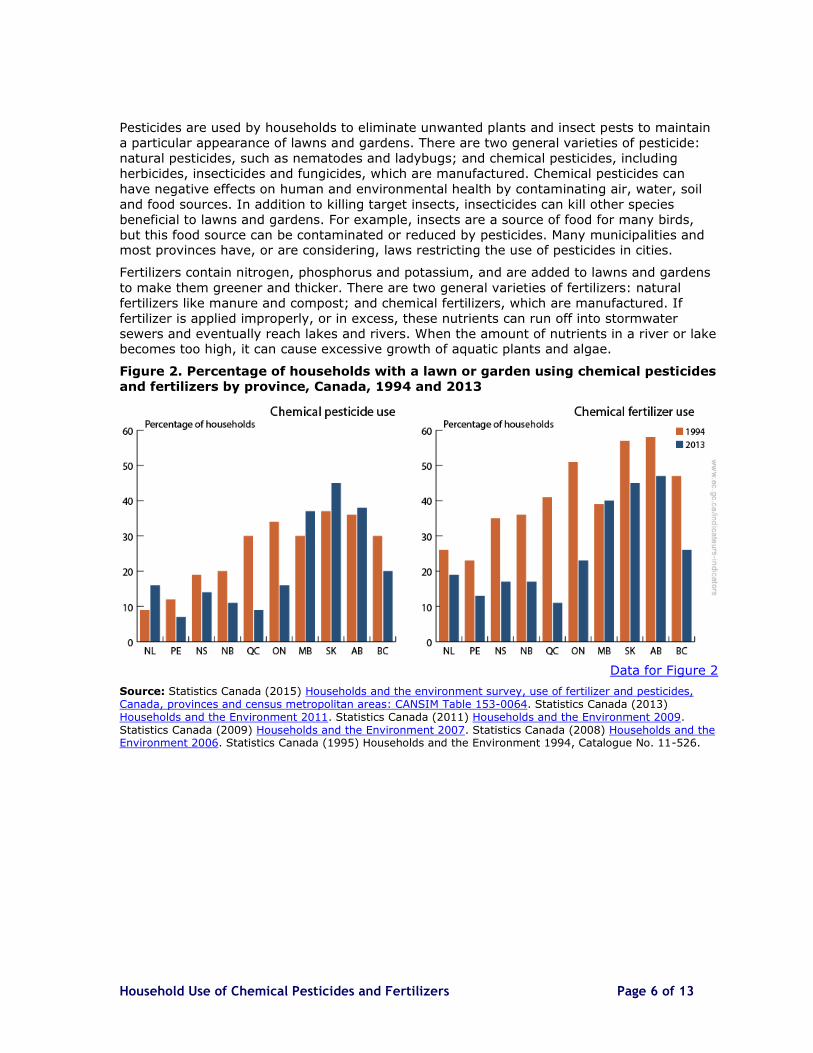
Chemical pesticide and fertilizer use by Canadian households has declined since 1994.
In 2013, 19% of Canadian households with a lawn or garden used chemical pesticides
compared to 31% in 1994. The largest decrease has occurred in Quebec, where household
chemical pesticide use fell from 30% to 9%. The Prairie Provinces, led by Saskatchewan, remain the region where household use of chemical pesticides was the most widespread.
Cosmetic pesticide bans in the majority of provinces have contributed to the drop in pesticide
use between 1994 and 2013. In general, provinces with bans used below the national
average in 2013 (e.g., Newfoundland and Labrador [16%], Ontario [16%], Nova Scotia [14%], New Brunswick [11%], Quebec [9%], and Prince Edward Island [7%]).
In 2013, 25% of Canadian households with a lawn or garden used chemical fertilizers,
compared to 47% in 1994. The largest decreases occurred in Quebec and Ontario. Quebec
households were the lowest users of chemical fertilizers in 2013. Households in the Prairie Provinces, led by Alberta, were most likely to have used chemical fertilizer.
A number of factors, such as weather, have an impact on the use of chemical pesticides and
fertilizers. Changes in those contributing factors may explain the yearly variation observed in
the indicators.
Figure 1. Percentage of households in Canada with a lawn or garden using chemical pesticides and fertilizers, 1994, 2005, 2007, 2009, 2011 and 2013
Data for Figure 1
Source: Statistics Canada (2015) Households and the environment survey, use of fertilizer and pesticides, Canada, provinces and census metropolitan areas: CANSIM Table 153-0064. Statistics Canada (2013) Households and the Environment 2011. Statistics Canada (2011) Households and the Environment 2009. Statistics Canada (2009) Households and the Environment 2007. Statistics Canada (2008) Households and the Environment 2006. Statistics Canada (1995) Households and the Environment 1994, Catalogue No. 11-526.
Household Use of Chemical Pesticides and Fertilizers Page 6 of 13
Pesticides are used by households to eliminate unwanted plants and insect pests to maintain
a particular appearance of lawns and gardens. There are two general varieties of pesticide:
natural pesticides, such as nematodes and ladybugs; and chemical pesticides, including
herbicides, insecticides and fungicides, which are manufactured. Chemical pesticides can
have negative effects on human and environmental health by contaminating air, water, soil
and food sources. In addition to killing target insects, insecticides can kill other species
beneficial to lawns and gardens. For example, insects are a source of food for many birds,
but this food source can be contaminated or reduced by pesticides. Many municipalities and most provinces have, or are considering, laws restricting the use of pesticides in cities.
Fertilizers contain nitrogen, phosphorus and potassium, and are added to lawns and gardens
to make them greener and thicker. There are two general varieties of fertilizers: natural
fertilizers like manure and compost; and chemical fertilizers, which are manufactured. If
fertilizer is applied improperly, or in excess, these nutrients can run off into stormwater
sewers and eventually reach lakes and rivers. When the amount of nutrients in a river or lake becomes too high, it can cause excessive growth of aquatic plants and algae.
Figure 2. Percentage of households with a lawn or garden using chemical pesticides
and fertilizers by province, Canada, 1994 and 2013
Data for Figure 2
Source: Statistics Canada (2015) Households and the environment survey, use of fertilizer and pesticides, Canada, provinces and census metropolitan areas: CANSIM Table 153-0064. Statistics Canada (2013) Households and the Environment 2011. Statistics Canada (2011) Households and the Environment 2009. Statistics Canada (2009) Households and the Environment 2007. Statistics Canada (2008) Households and the Environment 2006. Statistics Canada (1995) Households and the Environment 1994, Catalogue No. 11-526.
Canadian Environmental Sustainability Indicators Page 7 of 13
Part 2. Data Sources and Methods for the
Household Use of Chemical Pesticides and
Fertilizers Indicator
Introduction
The Household Use of Chemical Pesticides and Fertilizers indicator is part of the Canadian
Environmental Sustainability Indicators (CESI) program, which provides data and information to track Canada's performance on key environmental sustainability issues.
Description and rationale of the Household Use of Chemical Pesticides and Fertilizers indicator
Description
The Household Use of Chemical Pesticides and Fertilizers indicator reports on the percentage
of Canadian households with lawns or gardens that reported using chemical fertilizers and
pesticides in 1994 and every two years from 2005 to 2013. The data are broken down by province showing the comparison between data collected in 1994 and 2013.
Rationale
Chemical pesticides, including herbicides, insecticides and fungicides, are used to maintain
the appearance of lawns and gardens by eliminating pests. However, chemical pesticides can
have negative effects on human and environmental health by contaminating air, water, soil
and food sources. For example, in addition to killing target insects, insecticides can also harm
or kill other, non-target insects, soil microbes and insect-eating birds, thus disrupting the
natural balance of the lawn or garden's ecosystem.
Chemical fertilizers are added to lawns and gardens to help them grow greener and thicker.
However, if fertilizer is applied improperly or in excess, soluble nutrients can pollute drainage
and storm waters, which eventually reach lakes and rivers. Run off of nutrient-laden water
readily occurs in urban environments because there are many hard surfaces. In addition,
water in storm sewers is frequently not treated before it reaches lakes or rivers, thus
contributing to excessive growth of aquatic plants and algae.
Recent changes to the indicator
No methodological change has been made to the indicator since its last update in 2014.
Data
Data source
Data for this measure come from Statistics Canada's 1994,1 2006,2 2007,3 2009,4 20115 and
20136 Households and the Environment Survey (HES).
1 Statistics Canada (1995) Households and the Environment 1994. Catalogue no. 11-526-XPB.
2 Statistics Canada (2008) Households and the Environment 2006. Retrieved on 13 May, 2015.
3 Statistics Canada (2009) Households and the Environment 2007. Retrieved on 13 May, 2015.
Household Use of Chemical Pesticides and Fertilizers Page 8 of 13
Spatial coverage
The target population of the HES consists of Canadian households, excluding those in Yukon,
Northwest Territories and Nunavut, households located on First Nations reserves or Crown
lands, and households consisting entirely of full-time members of the Canadian Armed Forces.
Temporal coverage
Data for 1994 as compiled in the HES 2006 report are used in this indicator. The 1994 HES
was conducted as a supplement to the May 1994 Labour Force Survey.
The HES 2006 was conducted as a supplement to the Labour Force Survey from February 15
to April 15, 2006. The HES 2007, 2009, 2011 and 2013 were conducted from October to
December of their respective years as a follow-up survey to the Canadian Community Health Survey.
Data completeness
A representative sample of Canadian households from each province is surveyed in the HES.
The 1994 HES surveyed 38 080 households and yielded an 83.1% response rate. The HES
2006 surveyed 36 431 households and yielded a 77.8% response rate. The HES 2007
surveyed 29 980 households and yielded a 72.3% response rate. Both the 2009 and 2011
HES surveyed 20 000 households and yielded response rates of 73.8% and 74.3%. The sample size for HES 2013 was 31 962 households and yielded a final response rate of 75.4%.
Household estimates in the HES are produced using weights attached to each sampled
household. The weight indicates the number of households in the population represented by
the sampled unit.7
Data timeliness
The most recent data available at the time this indicator was produced are for 2013.
Methods
In 1994 and 2006, the Households and the Environment Survey (HES) did not make the
distinction between natural and chemical fertilizers and pesticides. It is reasonable, however,
to assume people were only talking about chemical fertilizers and pesticides because there were not many natural remedies available. There should be no impact on the trend.
The HES 1994 data collected for this measure were based on the following question:
In the last 12 months, did anyone, including commercial operators, apply the
following chemicals to the yard, lawn or garden: pesticides or fertilizers? (Yes, No, Don't know)
4 Statistics Canada (2011) Households and the Environment 2009. Retrieved on 13 May, 2015.
5 Statistics Canada (2013) Households and the Environment 2011. Retrieved on 13 May, 2015.
6 Statistics Canada (2015) Households and the environment survey, use of fertilizer and pesticides, Canada, provinces and census metropolitan areas: CANSIM Table 153-0064. Retrieved on 26 May, 2015.
7 Statistics Canada (2015) Households and Environment Survey: Data sources and methodology. Retrieved on 13 May, 2015.
Canadian Environmental Sustainability Indicators Page 9 of 13
The data collected for this measure from the HES 2006 were based on the following questions:
In 2005, were any chemical fertilizers applied to your lawn/garden? (Yes, No, Don't know/Refused)
In 2005, were any weed killers, pesticides, or fungicides applied to your lawn/garden?
Include fertilizer and pesticide mixes like "Weed and Feed." (Yes, No, Don't know/Refused)
The HES 2007 and 2009 data collected for this measure were based on the following questions:
In the last 12 months, were any chemical fertilizers applied to your lawn/garden/lawn
or garden? (Yes, No, Don't know/Refused)
In the last 12 months, were any chemical pesticides such as weed killers (herbicides),
bug killers (insecticides), or fungicides applied to your lawn/garden/lawn or garden?
Please include fertilizer and herbicide mixes such as "Weed and Feed." (Yes, No, Don't know/Refused)
The HES 2011 and 2013 data collected for this measure were based on the following questions:
In the past 12 months, were any chemical fertilizers applied to your lawn/garden/lawn or garden? (Yes, No, Don't know/Refused)
In the past 12 months, were any chemical pesticides such as weed killers
(herbicides), bug killers (insecticides), or fungicides applied to your lawn/garden/lawn
or garden? (Yes, No, Don't know/Refused)
Caveats and limitations
The coverage error for the Households and the Environment Survey (HES) is based on the
survey of which it is a sub-sample (i.e., the Labour Force Survey in 2006 and the Canadian
Community Health Survey starting in 2007). In all cases, the coverage error is estimated at less than 2%.
Households located in the Yukon, Northwest Territories and Nunavut, households located on
First Nations reserves and military bases, and households consisting entirely of full-time members of the Canadian Armed Forces are excluded from this study.
Estimates not meeting an acceptable level of quality were either flagged for caution or suppressed.8
8 Statistics Canada (2015) Households and Environment Survey: Data sources and methodology. Retrieved on 13 May, 2015.

Household Use of Chemical Pesticides and Fertilizers Page 10 of 13
Part 3. Annexes
Annex A. Data tables for the figures presented in this document
Table A.1. Data for Figure 1. Percentage of households in Canada with a lawn or
garden using chemical pesticides and fertilizers, 1994, 2005, 2007, 2009, 2011 and 2013
Year Chemical pesticides
(percentage of households with a lawn or garden)
Chemical fertilizers (percentage of households with
a lawn or garden)
1994 31 47
2005 29 32
2007 25 27
2009 15 22
2011 15 21
2013 19 25
Source: Statistics Canada (2015) Households and the environment survey, use of fertilizer and pesticides, Canada, provinces and census metropolitan areas: CANSIM Table 153-0064. Statistics Canada (2013)
Households and the Environment 2011. Statistics Canada (2011) Households and the Environment 2009. Statistics Canada (2009) Households and the Environment 2007. Statistics Canada (2008) Households and the Environment 2006. Statistics Canada (1995) Households and the Environment 1994, Catalogue No. 11-526.
Table A.2. Data for Figure 2. Percentage of households with a lawn or garden using chemical pesticides and fertilizers by province, Canada, 1994 and 2013
Region
Chemical
pesticide use
1994
(percentage of households with
a lawn or garden)
Chemical
pesticide use
2013
(percentage of households with
a lawn or garden)
Chemical
fertilizer use
1994
(percentage of households with
a lawn or garden)
Chemical
fertilizer use
2013
(percentage of households with
a lawn or garden)
Newfoundland
and Labrador 9 16 26 19
Prince Edward
Island 12 7E 23 13E
Nova Scotia 19 14 35 17
New Brunswick 20 11 36 17

Canadian Environmental Sustainability Indicators Page 11 of 13
Region
Chemical
pesticide use
1994
(percentage of households with
a lawn or garden)
Chemical
pesticide use
2013
(percentage of households with
a lawn or garden)
Chemical
fertilizer use
1994
(percentage of households with
a lawn or garden)
Chemical
fertilizer use
2013
(percentage of households with
a lawn or garden)
Quebec 30 9 41 11
Ontario 34 16 51 23
Manitoba 30 37 39 40
Saskatchewan 37 45 57 45
Alberta 36 38 58 47
British Columbia 30 20 47 26
Note: Values marked with an "E" should be used with caution.
Source: Statistics Canada (2015) Households and the environment survey, use of fertilizer and pesticides, Canada, provinces and census metropolitan areas: CANSIM Table 153-0064. Statistics Canada (2013) Households and the Environment 2011. Statistics Canada (2011) Households and the Environment 2009. Statistics Canada (2009) Households and the Environment 2007. Statistics Canada (2008) Households and the Environment 2006. Statistics Canada (1995) Households and the Environment 1994, Catalogue No. 11-526.

Household Use of Chemical Pesticides and Fertilizers Page 12 of 13
Annex B. References and additional information
References and further reading
Statistics Canada (1995) Households and the Environment 1994. Catalogue no. 11-526-XPB.
Statistics Canada (2008) Households and the Environment 2006. Retrieved on 13 May, 2015.
Statistics Canada (2009) Households and the Environment 2007. Retrieved on 13 May, 2015.
Statistics Canada (2011) Households and the Environment 2009. Retrieved on 13 May, 2015.
Statistics Canada (2013) Households and the Environment 2011. Retrieved on 13 May, 2015.
Statistics Canada (2015) Canadians and Nature: Fertilizers and Pesticides, 2013. Retrieved on 26 May, 2015.
Statistics Canada (2015) Households and Environment Survey: Data sources and methodology. Retrieved on 13 May, 2015.
Related information
Government of Canada – How to have a healthy lawn
Land Use Impacts on Freshwater Quality
Nutrients in Lake Winnipeg
Phosphorus and Nitrogen Levels in the St. Lawrence River
Phosphorus Levels in the Great Lakes
Risk to Soil and Water Quality from Agriculture

Canadian Environmental Sustainability Indicators Page 13 of 13
www.ec.gc.ca
Additional information can be obtained at:
Environment and Climate Change Canada
Public Inquiries Centre
7th Floor, Fontaine Building
200 Sacré-Coeur boul.
Gatineau, QC K1A 0H3
Telephone: 1-800-668-6767 (in Canada only) or 819-938-3860
Fax: 819-994-1412
TTY: 819-994-0736
Email: [email protected]