canadian oil & gas sector - credit suisse
TRANSCRIPT
DISCLOSURE APPENDIX AT THE BACK OF THIS REPORT CONTAINS IMPORTANT DISCLOSURES, ANALYST CERTIFICATIONS, LEGAL ENTITY DISCLOSURE AND THE STATUS OF NON-US ANALYSTS. US Disclosure: Credit Suisse does and seeks to do business with companies covered in its research reports. As a result, investors should be aware that the Firm may have a conflict of interest that could affect the objectivity of this report. Investors should consider this report as only a single factor in making their investment decision.
13 April 2017 Americas/Canada Equity Research
Oil & Gas
Canadian Oil & Gas Sector The Credit Suisse Connections Series leverages our
exceptional breadth of macro and micro research to deliver
incisive cross-sector and cross-border thematic insights for
our clients.
Research Analysts
David Hewitt
416 352 4583
Jason Frew
403 476 6022
Brian Ho
403 476 6009
David Phung
403 476 6023
Robert Loebach
403 476 6021
Andrew M. Kuske
416 352 4561
Paul Tan
416 352 4593
Edward Westlake
212 325 6751
Mark Lear, CFA
212 538 0239
Thomas Adolff
44 20 7888 9114
STRATEGY
Canadian Energy in North America
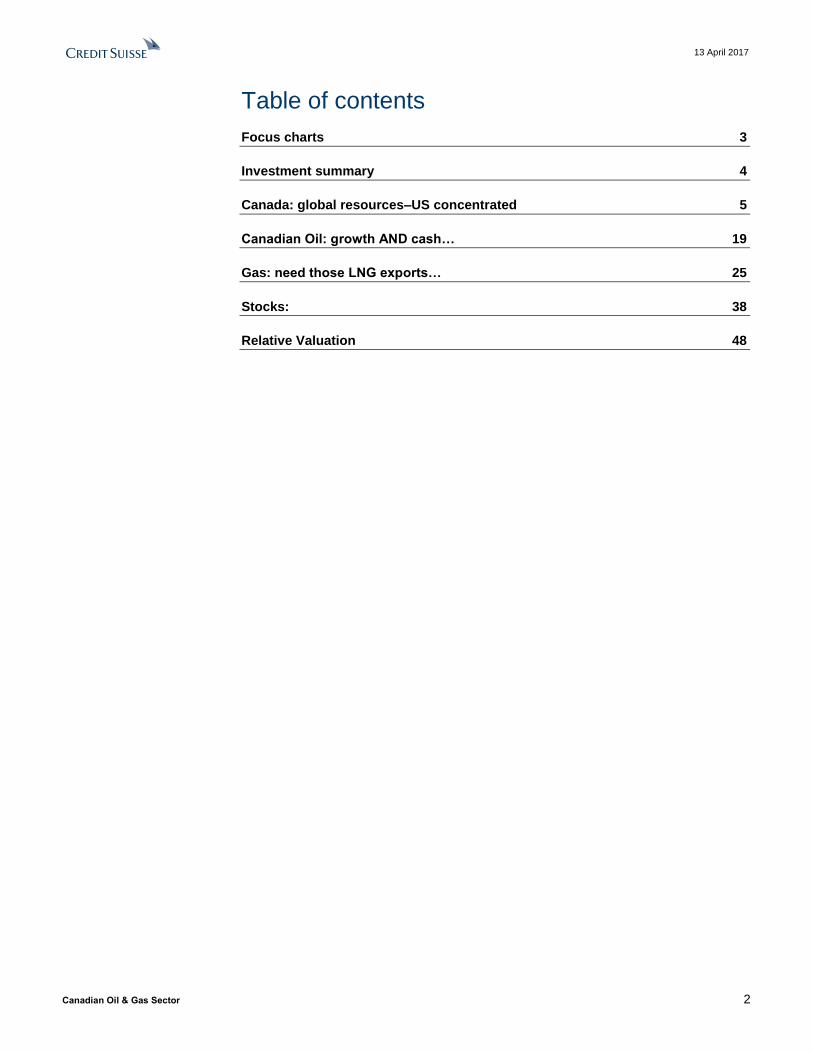
Figure 1: N America SMID 18 over 17 Prod’n growth
Source: Credit Suisse estimates
■ Canada on the world stage – ‘concentrated’ on the US: Canada has
world class oil and gas resources, and an abundant market on its doorstep,
but an overconcentration of exports to the US, in our opinion. We would
suggest the Government target should be ‘Resource to markets’.
■ Canadian oil patch – growth AND cash: Coming to the end of a major
capex cycle Canadian oil players are set to book both production growth
and see material increases in free cash-flow. We expect the next phase of
growth to be brownfield focused, with break-evens in the US$45 – 60/bbl
range. BAT is still a question, i.e., will there be one at all, and in what form.
■ Canadian gas – needed those LNG imports: The Montney & Deep
basins hold some of the most economic gas resources in North America;
however, the US is materially increasing gas production. Large scale
Canadian LNG exports would have helped, but these now seem unlikely
near term. We see continued pressure on the AECO differential and prefer
the liquids rich gas producers.
■ Seeking out superstars: both in Canada and within North America: We
use 4 metrics to score both SMID and large cap North America universes,
then use the score to try and identify possible valuation gaps. In the SMID
space in Canada we prefer VII and NVA and in the US PE and EGN. For
the North America large cap universe we prefer SU and ECA in Canada
and PXD, CXO and DVN in the US. Finally looking at global majors SU
again stands out as does RDS and BP in Europe.
13 April 2017
Canadian Oil & Gas Sector 2
Table of contents
Focus charts 3
Investment summary 4
Canada: global resources–US concentrated 5
Canadian Oil: growth AND cash… 19
Gas: need those LNG exports… 25
Stocks: 38
Relative Valuation 48
13 April 2017
Canadian Oil & Gas Sector 3
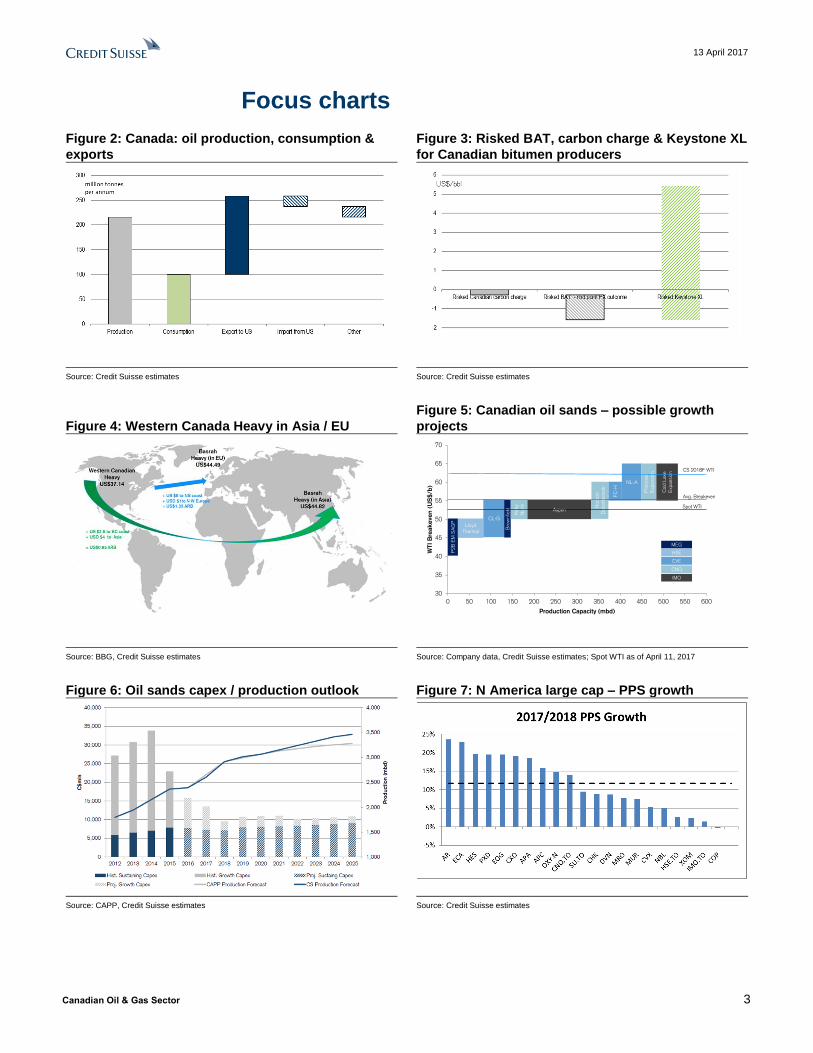
Focus charts
Figure 2: Canada: oil production, consumption &
exports
Figure 3: Risked BAT, carbon charge & Keystone XL
for Canadian bitumen producers
Source: Credit Suisse estimates Source: Credit Suisse estimates
Figure 4: Western Canada Heavy in Asia / EU
Figure 5: Canadian oil sands – possible growth
projects
Source: BBG, Credit Suisse estimates Source: Company data, Credit Suisse estimates; Spot WTI as of April 11, 2017
Figure 6: Oil sands capex / production outlook Figure 7: N America large cap – PPS growth
Source: CAPP, Credit Suisse estimates Source: Credit Suisse estimates
30
35
40
45
50
55
60
65
70
0 50 100 150 200 250 300 350 400 450 500 550 600
WTI
Bre
akeven (
US
$/b
)
Production Capacity (mbd)
P2B
EM
SA
GP
LloydThermal
CL-G
Bro
wnfield
Kirby
Nort
h
Aspen
Horizo
n
Debott
leneck
FC
-H
NL-A
Prim
rose
E
xpansi
on
Cold
Lake
Exp
ansi
on
MEG
HSE
CVE
CNQ
IMO
Spot WTI
CS 2018F WTI
Avg. Breakeven

13 April 2017
Canadian Oil & Gas Sector 4
Investment summary World class resources – largest global market on your doorstep: In a way Canada is
twice blessed – world scale resources in both oil and gas and the world’s largest economy
right next door. In reality Canada has under-performed the US in terms of resource to
reserve conversion and production growth. The degree of supply concentration is
staggering, with Canada exporting 73% of its oil production – 99% of which goes to the
US, with a similar story with gas. All of which might have seemed satisfactory until the US
selected a new type of President, the antithesis of Canada’s liberal Prime Minister, who
immediately introduced the idea of a new tax regime with a Border Adjustment Tax at its
core – suddenly concentration looks a little less good. We see the calculation as nuanced
– BAT alone could penalize, but the same President approved the Keystone XL pipeline,
which will help alleviate rail export economics. The Canadian government's catchphrase
is ‘Resource to Market’ – we would politely suggest an ‘s’ is added to the final world.
Canadian oil: at the end of a growth spurt it’s time to collect the cash: Canada is at
the end of a greenfield oil sands build-out that started before crude 2014 capitulation, with
production and material cash flow to follow. With a carbon cap in Alberta and abundant
shale oil growth in the US we expect the sector to shift away from major greenfield
developments to more accretive and selective brownfield growth. A common mis-
conception seems to be that oil sands projects need US$70/bbl+ to ‘work’; CS estimates a
range of US$45 to US$60 (WTI) for the likely next set of projects to breakeven. As with the
US costs have fallen in Canada, but with less capex intensity in the next cycle we expect
less cost reflation pressure than in the US shale ‘hotspots’. On the technology front the
application of solvent technology will significantly lower water requirements, with Imperial
Oils Aspen project leading the way. With increased production and lower capex comes
greater free cash-flow, and we expect dividend growth and buybacks going forward.
Canadian Gas – some great rocks, unfortunate timing: CS views the Montney and
Deep basins to hold some of the most economic gas resources in North America, which
along with attractive fiscal terms positions them well. The challenge is the wall of
competitive gas being developed in Canada’s core market – the US. The big hope was for
LNG exports, but the major projects have not eventuated, and the next market window is
two years away, in our opinion. With abundant low cost gas we assume the AECO
differential remains at a similar level (-US$1/mcf vs NYMEX) going forward, but watch for
wildcard outcomes like major LNG project sanctions, more oil sands growth (than
forecast), or other demand growth for example petrochemical additions and the eventual
phase out of coal fired generation in Alberta. Given these dynamics we prefer liquids rich
gas producers. With challenged gas economics we would expect further consolidation in
the space.
Stocks: new metric to look for potential outliers, both in Canada and across North
America: We segregate into two universes – SMID and large cap, focus on Canada
initially and then NA as a whole. We use 4 metrics (production growth, operating
margin/boe, D/CF and yield) to ‘score’ each stock and then use that score to compare an
implied 2018 EBITDA multiple for that universe to our current forecast – seeking outliers.
In the SMID space in Canada we prefer VII and NVA and in the US PE and EGN. For the
North America large cap universe we prefer SU and ECA in Canada and PXD, CXO and
DVN in the US. Finally looking at global majors SU again stands out as does RDS and BP
in Europe.
13 April 2017
Canadian Oil & Gas Sector 5
Canada: global resources–US concentrated
World class resources – largest global market on your doorstep: In a way Canada is
twice blessed – world scale resources in both oil and gas and the world’s largest economy
right next door. In reality Canada has under-performed the US in terms of resource to
reserve conversion and production growth. The degree of supply concentration is
staggering, with Canada exporting 73% of its oil production – 99% of which goes to the
US, with a similar story with gas. All of which might have seemed satisfactory until the US
selected a new type of President, the antithesis of Canada’s liberal Prime Minister, who
immediately introduced the idea of a new tax regime with a Border Adjustment Tax at its
core – suddenly concentration looks a little less good. We see the calculation as nuanced
– BAT alone could penalize, but the same President approved the Keystone XL pipeline,
which will help alleviate rail export economics. The Canadian government's catchphrase
is ‘Resource to Market’ – we would politely suggest an ‘s’ is added to the final world.
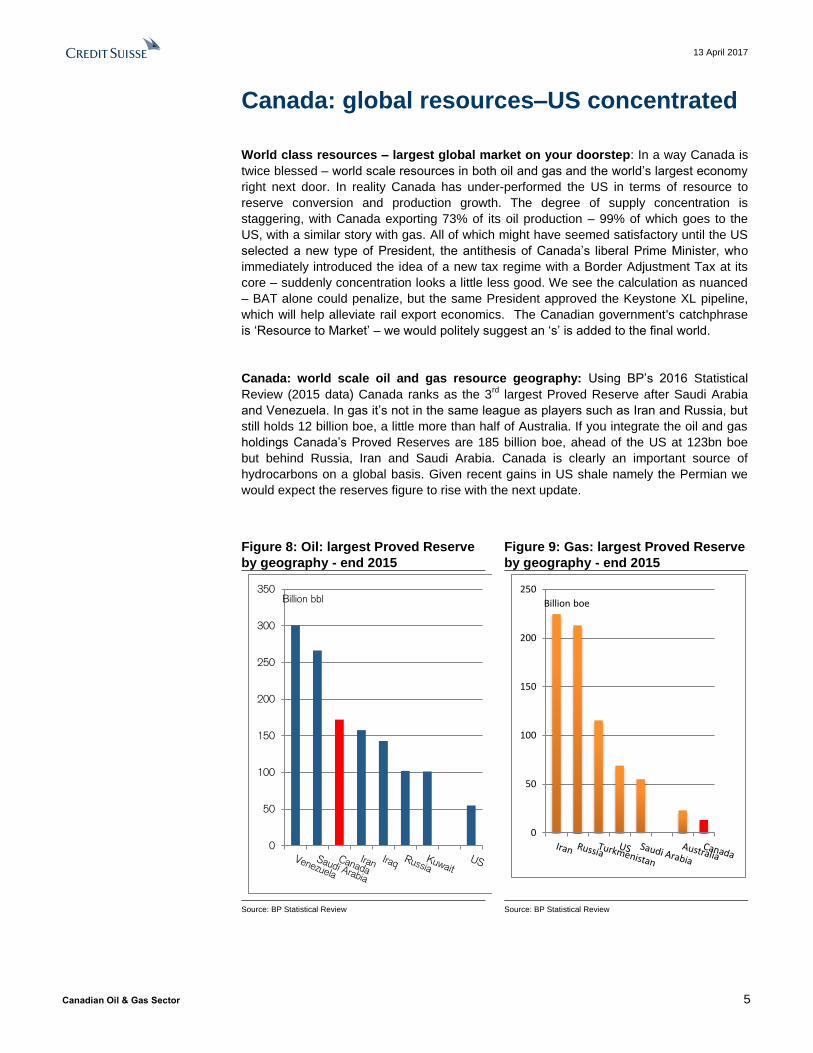
Canada: world scale oil and gas resource geography: Using BP’s 2016 Statistical
Review (2015 data) Canada ranks as the 3rd
largest Proved Reserve after Saudi Arabia
and Venezuela. In gas it’s not in the same league as players such as Iran and Russia, but
still holds 12 billion boe, a little more than half of Australia. If you integrate the oil and gas
holdings Canada’s Proved Reserves are 185 billion boe, ahead of the US at 123bn boe
but behind Russia, Iran and Saudi Arabia. Canada is clearly an important source of
hydrocarbons on a global basis. Given recent gains in US shale namely the Permian we
would expect the reserves figure to rise with the next update.
Figure 8: Oil: largest Proved Reserve
by geography - end 2015
Figure 9: Gas: largest Proved Reserve
by geography - end 2015
Source: BP Statistical Review Source: BP Statistical Review
0
50
100
150
200
250
300
350Billion bbl
0
50
100
150
200
250
Billion boe
13 April 2017
Canadian Oil & Gas Sector 6
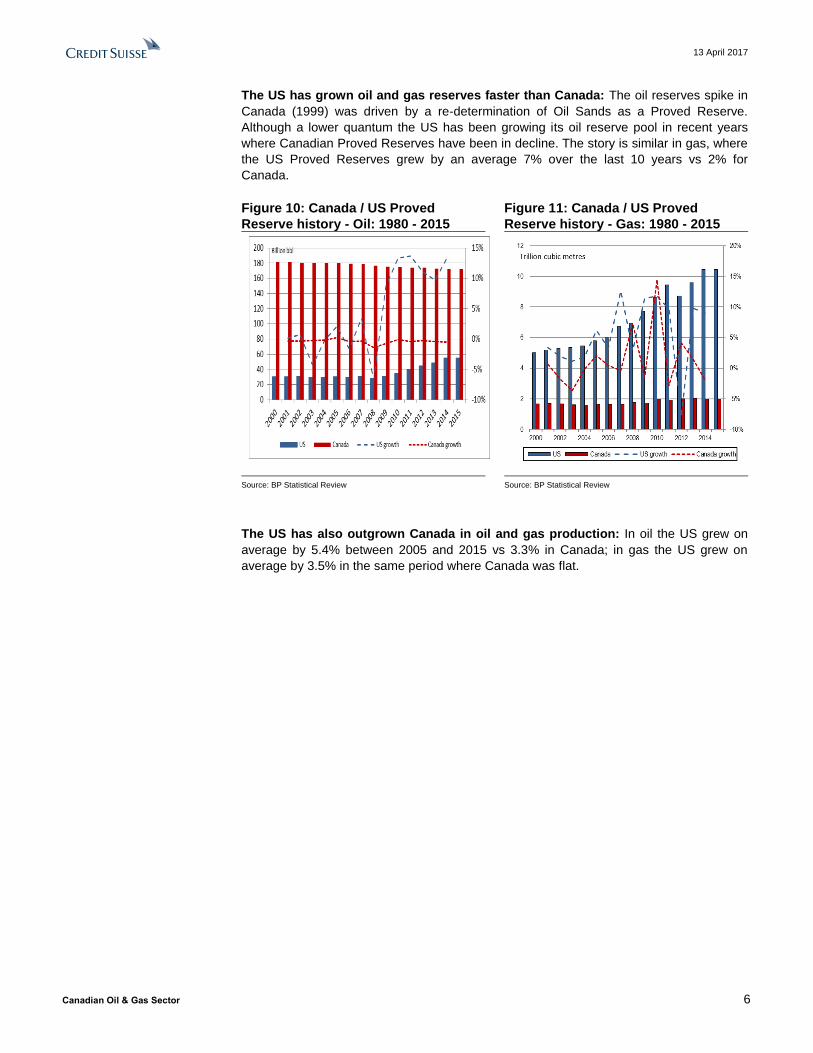
The US has grown oil and gas reserves faster than Canada: The oil reserves spike in
Canada (1999) was driven by a re-determination of Oil Sands as a Proved Reserve.
Although a lower quantum the US has been growing its oil reserve pool in recent years
where Canadian Proved Reserves have been in decline. The story is similar in gas, where
the US Proved Reserves grew by an average 7% over the last 10 years vs 2% for
Canada.
Figure 10: Canada / US Proved
Reserve history - Oil: 1980 - 2015
Figure 11: Canada / US Proved
Reserve history - Gas: 1980 - 2015
Source: BP Statistical Review Source: BP Statistical Review
The US has also outgrown Canada in oil and gas production: In oil the US grew on
average by 5.4% between 2005 and 2015 vs 3.3% in Canada; in gas the US grew on
average by 3.5% in the same period where Canada was flat.

13 April 2017
Canadian Oil & Gas Sector 7
Figure 12: Oil production 2000-2015
US vs Canada
Figure 13: Gas production 2000-2015
US vs Canada
Source: BP Statistical Review Source: BP Statistical Review
Gas export concentration…very: The US absolutely dominates the export position for
Canadian gas, whilst its indigenous gas production has been ramping following the shale
revolutions (gas and then oil).
Figure 14: Canada: gas production / consumption and export position (2015)
Source: BP Statistical Review
0
2,000
4,000
6,000
8,000
10,000
12,000
14,000
20002002200420062008201020122014
US Canada
Thousand b/d
0
10
20
30
40
50
60
70
80
1980 1985 1990 1995 2000 2005 2010 2015
US Canada
Billion cubic feet / day
13 April 2017
Canadian Oil & Gas Sector 8
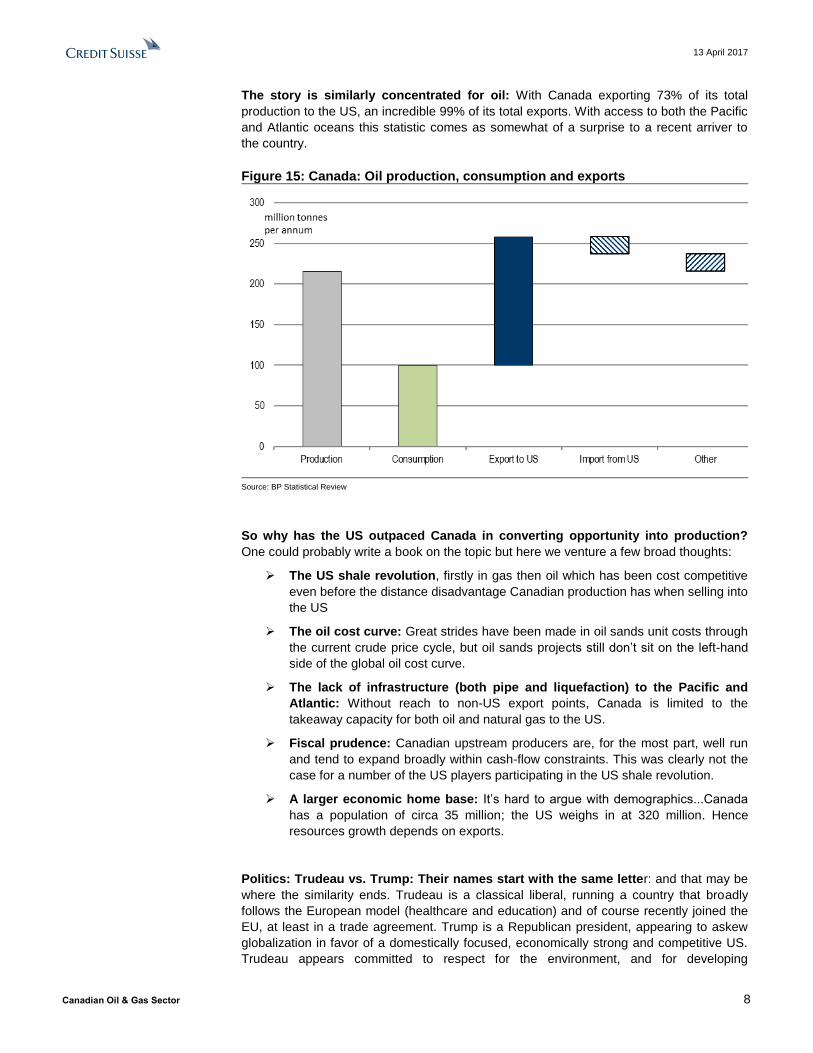
The story is similarly concentrated for oil: With Canada exporting 73% of its total
production to the US, an incredible 99% of its total exports. With access to both the Pacific
and Atlantic oceans this statistic comes as somewhat of a surprise to a recent arriver to
the country.
Figure 15: Canada: Oil production, consumption and exports
Source: BP Statistical Review
So why has the US outpaced Canada in converting opportunity into production?
One could probably write a book on the topic but here we venture a few broad thoughts:
The US shale revolution, firstly in gas then oil which has been cost competitive
even before the distance disadvantage Canadian production has when selling into
the US
The oil cost curve: Great strides have been made in oil sands unit costs through
the current crude price cycle, but oil sands projects still don’t sit on the left-hand
side of the global oil cost curve.
The lack of infrastructure (both pipe and liquefaction) to the Pacific and
Atlantic: Without reach to non-US export points, Canada is limited to the
takeaway capacity for both oil and natural gas to the US.
Fiscal prudence: Canadian upstream producers are, for the most part, well run
and tend to expand broadly within cash-flow constraints. This was clearly not the
case for a number of the US players participating in the US shale revolution.
A larger economic home base: It’s hard to argue with demographics...Canada
has a population of circa 35 million; the US weighs in at 320 million. Hence
resources growth depends on exports.
Politics: Trudeau vs. Trump: Their names start with the same letter: and that may be
where the similarity ends. Trudeau is a classical liberal, running a country that broadly
follows the European model (healthcare and education) and of course recently joined the
EU, at least in a trade agreement. Trump is a Republican president, appearing to askew
globalization in favor of a domestically focused, economically strong and competitive US.
Trudeau appears committed to respect for the environment, and for developing
13 April 2017
Canadian Oil & Gas Sector 9
hydrocarbons in a way that takes both that and human issues into consideration. President
Trump seems less concerned about climate change and is set to focus on reducing
regulatory controls for oil and gas development / production, and developing indigenous oil
and gas, creating jobs in America.
Trudeau: ‘resource to market’ – or should it be marketS: Mr. Trudeau has repeatedly
used the expression ‘resource to market’. Figure 14 and Figure 15 above suggest his
predecessors and the Canadian industry have been following the advice literally, i.e.,
supplying the single market of the US. We would respectfully suggest that, given the over
concentration of supply into the US and the discussion around the border tax (more later),
a better slogan would be ‘resource to marketS’, i.e., a deliberate and co-ordinated effort to
increase take-away capacity for oil and gas production to ports in the East and West coast
to facilitate the sale of Canadian oil and gas to markets other than (or in addition to) the
US.
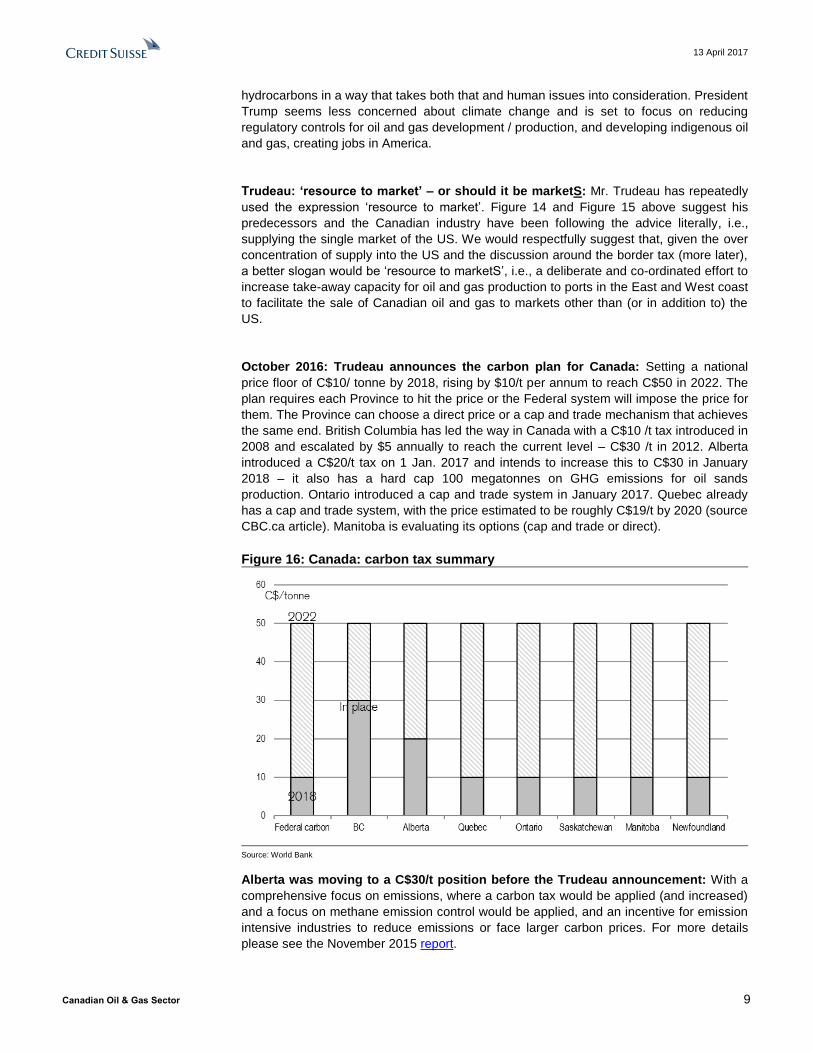
October 2016: Trudeau announces the carbon plan for Canada: Setting a national
price floor of C$10/ tonne by 2018, rising by $10/t per annum to reach C$50 in 2022. The
plan requires each Province to hit the price or the Federal system will impose the price for
them. The Province can choose a direct price or a cap and trade mechanism that achieves
the same end. British Columbia has led the way in Canada with a C$10 /t tax introduced in
2008 and escalated by $5 annually to reach the current level – C$30 /t in 2012. Alberta
introduced a C$20/t tax on 1 Jan. 2017 and intends to increase this to C$30 in January
2018 – it also has a hard cap 100 megatonnes on GHG emissions for oil sands
production. Ontario introduced a cap and trade system in January 2017. Quebec already
has a cap and trade system, with the price estimated to be roughly C$19/t by 2020 (source
CBC.ca article). Manitoba is evaluating its options (cap and trade or direct).
Figure 16: Canada: carbon tax summary
Source: World Bank
Alberta was moving to a C$30/t position before the Trudeau announcement: With a
comprehensive focus on emissions, where a carbon tax would be applied (and increased)
and a focus on methane emission control would be applied, and an incentive for emission
intensive industries to reduce emissions or face larger carbon prices. For more details
please see the November 2015 report.

13 April 2017
Canadian Oil & Gas Sector 10
North America is not at the leading edge re carbon pricing: Figure 17 shows global
carbon tax rates, with Sweden leading the way, and all of the major current carbon tax
geographies being in Europe.
Figure 17: Global carbon tax rates
Source: World Bank pricing watch
So Canada making a start – the new US administration (ex-California) not so
inclined: The Canadian government is working on implementing a graduated carbon tax –
to reach a country wide C$50/t (US$38/t) by 2022. The new US administration appears to
be taking a different approach to the issue of carbon charging, with no immediate plans for
the application of a national carbon tax. California is the largest exception, where a cap
and trade mechanism is in place, but is being challenged with businesses trying to
invalidate the State’s fee for carbon pollution via a case filed at the State appeals court.
There is also an initiative titled the Regional Greenhouse Gas Initiative ‘RGGI’, known as
Reggie – involving the states of Connecticut, Delaware, Maine, Maryland, Massachusetts,
New Hampshire, New York, Rhode island and Vermont, which is targeted at power sector
emissions only, and for those plants that are 25MW and larger.
Indicatory cost for Canadian producers vs US re carbon charging: Using the Alberta
analysis in the above report we concluded that a typically emission intensive SAGD
producer would pay C$0.17 /bbl when the carbon tax was C$10/t – hence the initial cost
next year in Canada (if the State was not exceeding the $10/t minimum) would be
US$0.12 / bbl, but that would rise to US$0.60/bbl once the carbon tax rose to C$50/t, i.e.
in 2022.

13 April 2017
Canadian Oil & Gas Sector 11
Figure 18: US vs Canada - cost of carbon charging
Source: Credit Suisse estimates
For context, a typical SAGD netback is in the range of ~C$30/b at our long term oil price of
US$62.50WTI (see Figure 23 below).
US Border Adjustment Tax (BAT)
Border Adjustment Tax = wake-up call for export diversification: While it’s clear that
nobody could have forecast the sea change in the US’s trade strategy, and in reality
nobody can accurately forecast the eventual outcome of the Border Tax Adjustment
proposal, it does serve to remind Canada’s energy planners that export concentration
carries fiscal risk. Whatever the BAT outcome one would expect a shift in long term
planning for hydrocarbon export pathways in Canada.
Take Russia’s lead…the ESPO pipeline was all about energy security: Russia set a
target to increase exports to Asia from 6% to 20% with the development of the East
Siberia Pacific Ocean (ESPO) pipeline. It also provides supply flexibility for Russia,
reducing its dependence on Europe as the dominant sump for its oil exports (sound
familiar…). At the time of project sanction then Prime Minister Putin was quoted as saying
“this is not just a pipe” but rather “a geopolitical project”. Transneft, the pipeline operator,
set a tariff of US$55/ton, despite estimated costs of US$130/tonne (source euractiv.com).

13 April 2017
Canadian Oil & Gas Sector 12
Figure 19: ESPO pipeline route
Source: oil and Gas Journal
Let’s talk trade balances I: US / Canada trade is almost in balance: 2008 saw a steep
reduction in Canada’s trade excess with the US, likely driven by lower import prices for oil
and gas, and then the surge in US gas and latterly oil production as a result of the shale
revolution. By 2016 the total trade imbalance has fallen to circa US$10bn, on overall trade
of circa US$250bn.
Figure 20: US / Canada overall trade balance 2000 - 2016
Source: US census data
Let’s talk trade balances II: oil & gas circa 20% of total exports to the US: In 2016
‘mineral’ exports (ignoring re-exports) to the US were CAD$70bn, or US$53bn, around
20% of the total, and the second highest sector – after Vehicles (including aircraft) which

13 April 2017
Canadian Oil & Gas Sector 13
account for just shy of 25%. Of Canada’s imports from the US Vehicles also represents
the largest sector (again just shy of 25%), followed by machinery (20%).
Figure 21: Canadian exports to the US - by sector Figure 22: Canadian imports from the US - by sector
Source: Statistics Canada Source: Statistics Canada
BAT – the story so far: Our colleagues in Washington published an excellent summary of
the basic design and aim of the BAT (Link here). In summary:
A 20% tax on imported goods and services – no tax on goods and services
exports.
Estimated to raise an estimated US$1 trillion over 10 years.
Also known as “cash-flow tax” – If implemented the US would be the only OECD
member to use this; all of the others using Value Added Tax (VAT) in relation to
border adjustment.
World Trade organization classification unclear: the question being whether BAT
would be classified as a direct or indirect tax (which VAT is).
The Republican Party developed blueprint does NOT currently envisage
exceptions.
CS expects action to commence in the house in the spring, with an aim to place
the bill on the President’s desk by August.
CS believes that tax reform is a top priority for the Republican Congress and
Administration.
While it’s far too early to forecast the outcome of the proposal through the US political
process it seems clear that the desire for an adjustment tax is a broad Republican
leadership project, rather than a twinkle in a tweet…
If implemented, and without FX adjustment, BAT would penalize a bitumen producer
by circa US$8.5/bbl: In our report on the possible BAT effect in Canada (Link here) we
considered a series of factors that could affect a theoretical Canadian bitumen producer.
The application of the 20% tax would reduce the realized price from C$45 to C$34 /bbl,
and reduce the producers' netback by 40%.

13 April 2017
Canadian Oil & Gas Sector 14
What about the off-setting FX theory: One theory is that the increase in import tax
would be immediately reflected in FX rates between affected nations, with the importer
currency weakening. Both the Mexican Peso and CAD weakened on the day of the US
election – but from the point of inauguration and recent focus on BAT neither has
weakened further, possibly suggesting that the currency markets are not yet ready to price
in the BAT. Clearly a complete translation of the tax effect into a stronger importer
currency would offset the tax from an exporter's perspective, as long as COGS is local
currency denominated.
Figure 23: Illustrative Canadian Bitumen Producer Netbacks and % Change
Source: Credit Suisse estimates
Figure 24: Key Assumptions for Netback Calculation
Source: Credit Suisse estimates
If the CAD fell from 0.78 to 0.65 the effect would reduce from US$8 to US$3 / bbl: So
if the US / Canadian exchange rates adjust, with the greenback strengthening vs the
Loonie this ameliorates the negative effect of the tax. Clearly it is not possible to forecast
the actual FX movements if BAT is applied.
13 April 2017
Canadian Oil & Gas Sector 15
Big swinging assumption (well somebody’s got to do it) – BAT would punish
Canadian producers US$4/bbl NET of FX: We take the mid-point of a zero FX effect and
complete amelioration, which would suggest that, if implemented, BAT would punish
Canadian oil producers by US$4/bbl. To re-iterate there is no science to the assumption,
simply a mid-point.
Keystone XL – 58 days from executive order to approval: One of President Trump’s
first acts was to announce interest in re-negotiating the terms of the long discussed
Keystone XL pipe, proposed to run from Hardisty, Alberta to Steele City Nebraska, with a
capacity of 830,000 b/d. TransCanada, the developer, responded rapidly and applied for
the project Presidential Permit on January 26th 2017. This improvement in pipeline take-
away capacity from oil sands production in Alberta will reduce the requirement to use rail
transport. In Figure 34 we show our forecast that the effect of Keystone to a bitumen
producer's margin could potentially improve by US$7/bbl.
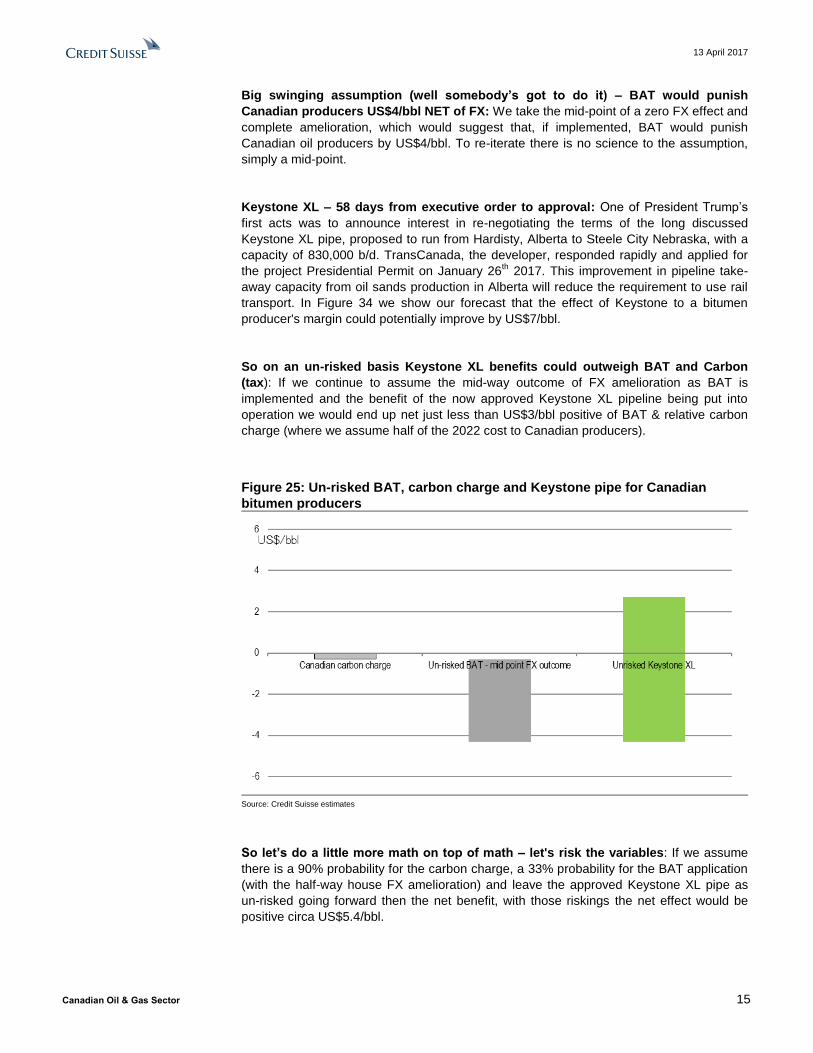
So on an un-risked basis Keystone XL benefits could outweigh BAT and Carbon
(tax): If we continue to assume the mid-way outcome of FX amelioration as BAT is
implemented and the benefit of the now approved Keystone XL pipeline being put into
operation we would end up net just less than US$3/bbl positive of BAT & relative carbon
charge (where we assume half of the 2022 cost to Canadian producers).
Figure 25: Un-risked BAT, carbon charge and Keystone pipe for Canadian
bitumen producers
Source: Credit Suisse estimates
So let’s do a little more math on top of math – let's risk the variables: If we assume
there is a 90% probability for the carbon charge, a 33% probability for the BAT application
(with the half-way house FX amelioration) and leave the approved Keystone XL pipe as
un-risked going forward then the net benefit, with those riskings the net effect would be
positive circa US$5.4/bbl.

13 April 2017
Canadian Oil & Gas Sector 16
Figure 26: Risked BAT, carbon charge and Keystone pipe for Canadian bitumen
producers
Source: Credit Suisse estimates
Canada has ‘spoken’ about border tariffs – saying ‘je n’aime pas le tariff’: Foreign
Minister Freeland met with officials in Washington, including US Secretary of State
Tillerson, and informed the media that “we would be strongly opposed to any imposition of
new tariffs between Canada and the United States…and that if such an idea were ever to
come into being, Canada would respond accordingly”. It would appear the velvet glove
was partially removed to reveal a steelier fist…
Is Tax reform next after Obamacare? Looks like it… President Trump was quoted thus
“I would say that we probably start going very, very strongly for the big tax cuts and tax
reform. That will be next.” The target for the bill is to attain congressional approval by
August, failing that by the Fall. A New York Times media article (here) suggests that the
Border Tax component is not universally agreed to by some of the President's senior
advisors, with Stephen Bannon a proponent, however with Wilbur Ross, Gary Cohn and
Steven Mnuchin less so. With the savings from the Obamacare reform now missing from
the equation, the question becomes is there a yet greater focus on BAT as a funds raising
exercise, or is it seen as ‘difficult’ and at risk from a lack of support from certain
Republican factions.
Canadian Resources Minister in Washington: “very little support” for BAT: Minister
Jim Carr visited Washington on the 30th March, visiting Senators, members of Congress,
lobby groups and business leaders. He told media that “There was very little support for it”
and that “It’s not just that people here are expressing an agreement in principal with free
trade, it’s that they are specifically saying that a border adjustment tax would not move
along the interests of Canada and the United States.”
The Trans Mountain pipeline is set to increase capacity to 890kb/d: the pipe has a
current capacity of 300kb/d most of which is used to carry crude to configured refineries in
Washington state. The expansion was approved by the Trudeau government and the pipe
owners (Kinder Morgan) expect about 450kb/d to target exports to North East Asia,
presumably to complex refiners in South Korea and China. The pipe ends at the Westridge
marine terminal in BC.

13 April 2017
Canadian Oil & Gas Sector 17
Figure 27: Trans Mountain pipeline route
Source: transmountain.com

13 April 2017
Canadian Oil & Gas Sector 18
Better global reach for Canadian crude could pay: We looked at Iraqi Basrah Heavy
priced in both Asia and Europe, both (as at 29 March 2017) circa US$45/bbl. We used
Basrah as a reasonably similar assayed crude (WCS 20 API, Basrah 23.5). For the Asia
route we assume it costs US$2.5/bbl to reach the BC coast (via the Transmountain pipe)
and a further US$4/bbl for Aframax shipping to an Asian port. Aframax because the Port of
Vancouver cannot accept VLCC’s – there being 3 bridges in the access route to the port).
Certain countries in Asia have complex refinery systems (including the ability to deal with
high TAN crudes), including South Korea, certain Chinese refineries and Reliance in India.
These assumptions suggest an arb value for WCS in Asia of circa US$0.85/bbl. To reach
North West Europe we assume a Canadian pipeline cost of US$5/bbl to the Nova Scotia
coast and a further US$1/bbl for VLCC transportation to the refining centre in NWE -
suggesting an arb value of US$1.35/bbl. From both a current economics (although price
differentials can of course be volatile) and from an energy security perspective, a greater
capacity to export crude would seem logical.
Figure 28: Western Canadian Heavy in Asia / EU vs Basrah Heavy
Source: BBG, Credit Suisse estimates – as at 29 March 2017.

13 April 2017
Canadian Oil & Gas Sector 19
Canadian Oil: growth AND cash…
Canadian oil: at the end of a growth spurt it’s time to collect the cash: Canada is at
the end of a greenfield oil sands build-out that started before crude 2014 capitulation, with
production and material cash flow to follow. With a carbon cap in Alberta and abundant
shale oil growth in the US, we expect the sector to shift away from major greenfield
developments to more accretive and selective brownfield growth. A common mis-
conception seems to be that oil sands projects need US$70/bbl+ to ‘work’; CS estimates a
range of US$45 to US$60 (WTI) for the likely next set of projects to break even. As with
the US, costs have fallen in Canada, but with less capex intensity in the next cycle we
expect less cost reflation pressure than in the US shale ‘hotspots’. On the technology front
the application of solvent technology will significantly lower water requirements, with
Imperial Oils Aspen project leading the way. With increased production and lower capex
comes greater free cash-flow, and we expect dividend growth and buybacks going
forward.
Canadian Oil Sector:
Oil I: Carbon emission limit of 100MT/pa in Alberta: As part of its emissions planning
Alberta has imposed a 100MTpa CO2 emissions limit for oil sands production in the State.
As Figure 29 shows production (and hence emissions) has grown rapidly since the start of
the decade, as a result of a major capex cycle. That cycle is largely complete, and as we
will argue below, we believe the Canadian oil sands sector is moving from higher growth to
more of a harvest mode. In order to prolong post-2020 growth (i.e., beyond committed
projects), oil sands producers will likely need to accelerate the evaluation and
implementation of new technologies that offer both incremental and step-change
improvements in project economics and emission profiles.
Figure 29: Alberta - carbon cap
Source: Wood Mackenzie

13 April 2017
Canadian Oil & Gas Sector 20
Oil II: Misconception I ‘oil sands sanctions needs $75/bbl’: As we move away from
capital intensive (in oil and gas terms) greenfield oils sands projects, future growth can be
leveraged with brownfield expansions. Figure 30 shows the CS view of the more likely (but
not certain) additions to oil sands capacity. All but Imperials Aspen greenfield project are
brownfield expansions, some using new technology like solvent assisted SAGD, and CO2
management technology.
Figure 30: Canadian oil sands: possible future growth projects
Source: Credit Suisse estimates; Spot WTI as of April 11, 2017
Oil II (II): 500kb/d of possible production additions–balanced not breakneck growth:
Across the unsanctioned cost curve the total production associated with these projects is
just north of 500kb/d. While new sanction likelihood will increase with higher crude prices
the next phase of oil sands growth in Canada is likely to be balanced, without inciting a
significant unit cost cycle.
Oil III: Break-evens have reduced in this price cycle – less reflationary risk vs US
shale? Figure 31 shows that thus far through the current oil price cycle typical full (i.e.
inclusive of sustaining capex) breakeven for Canadian oil sands have fallen from circa
US$60 to US$40/bbl (WTI). Going forward the highly labor intensive projects like Fort Hills
& Horizon (2B + 3) are coming off construction peak, and without another major capex
cycle (please see Figure 38) we expect sedentary wage growth for oil sands labour. In
terms of energy costs our view is that Western Canada gas prices will continue to be
challenged going forward (see the gas section of the report) and hence do not model an
energy input cost escalating with crude oil price improvements. This clearly contrasts with,
for example, the Permian which is rapidly ramping up for another capital intensive growth
spurt.
30
35
40
45
50
55
60
65
70
0 50 100 150 200 250 300 350 400 450 500 550 600
WTI
Bre
ake
ve
n (
US
$/b
)
Production Capacity (mbd)
P2B
EM
SA
GP
LloydThermal
CL-G
Bro
wnfie
ld
Kirb
y N
ort
h
Aspen
Horiz
on
Debott
leneck
FC
-H
NL-A
Prim
rose
E
xpan
sion
Cold
Lak
e
Exp
ansi
on
MEG
HSE
CVE
CNQ
IMO
Spot WTI
CS 2018F WTI
Avg. Breakeven

13 April 2017
Canadian Oil & Gas Sector 21
Figure 31: Oil sands operating & sustaining WTI breakeven
Source: CAPP, Credit Suisse estimates
We expect oil sands costs to stay low: For illustration, we show CVE's Christina Lake
operating costs per barrel forward estimates below. With an abundance of gas production
in Western Canada, oil sands producers will continue to benefit from lower gas prices as
an input. For non-energy cash costs, we understand a large portion of cost savings could
be retained given a number of factors including work practices, better reliability, and that
facilities design have structurally improved. For Christina Lake, production ramp up is
expected to continue through 2017-18, bringing the per barrel non-energy op cost down
further with higher productivity and utilization of facilities. Unlike the Permian we don’t
expect another major capex cycle in the Canadian oil sands sector, hence less cost
reflation.
Figure 32: Cenovus - Christina Lake Operating Costs (C$/b)
Source: Company data, Credit Suisse estimates
$0
$20
$40
$60
$80
$100
$120
Q314 Q414 Q115 Q215 Q315 Q415 Q116 Q216 Q316 Q416
US
$/b
SU CVE IMO CNQ WTI
0.00
2.00
4.00
6.00
8.00
10.00
12.00
2014 2015 2016 2017e 2018e
Non-energy ($/boe) Energy ($/boe)

13 April 2017
Canadian Oil & Gas Sector 22
Oil IV: Take-away capacity would move to excess if Keystone happens: The
requirement to use rail to export oil clearly diminishes returns vs pipeline take-away
capacity. Figure 33 shows our supply forecast and the various components of take-away
capacity. The potential sanction of Keystone XL in 2017 and its capacity coming online in
2019 would move the total take-away capacity to excess until the middle of next decade.
Beyond Keystone XL, Enbridges L3R and the TMX pipeline could further extend the
pipeline capacity, keeping take-away in excess through the 2020’s (basis our forecast for
Alberta oil supply growth).
Figure 33: Illustrative Western Canada supply outlook and take-away capacity
Source: Credit Suisse estimates / CAPP
Hence netbacks are set to materially improve post the Keystone XL decision: Figure
34 shows the degree of uplift to the heavy differential should the takeaway capacity move
to excess as a result of the Keystone XL pipeline, adding US$7/bbl in our illustrative
scenario. Compared to our current model of US$14/15 heavy oil differential for 2017/18+,
some widening could occur if more Canadian heavy oil is transported through rail between
now until new pipes come on stream which should then improve the heavy differential.
Figure 34: Illustrative heavy oil differentials scenario
Source: Credit Suisse estimates and CAPP
$0.00
$5.00
$10.00
$15.00
$20.00
$25.00
-1,600
-1,400
-1,200
-1,000
-800
-600
-400
-200
0
200
400
20
16
20
17
20
18
20
19
20
20
20
21
20
22
20
23
20
24
20
25
20
26
20
27
20
28
20
29
20
30
He
avy
Dif
fere
nti
als
(US$
/b)
Ne
t Su
pp
ly/D
em
and
(m
bd
)
Net Supply/Demand
Heavy Differentials
Heavy Differentials(ex. New Pipe)
Full Pipe Economics to USGC
Full Rail Economics to USGC

13 April 2017
Canadian Oil & Gas Sector 23
Oil V: The exception to the (brownfield) rule: solvent technology: Imperial Oil has
been investing in R&D to develop solvent technology for SAGD production (SA-SAGD).
The use of the solvent reduces the amount of water required in the extraction process, a
major component of the cost. Imperial may sanction its greenfield Aspen project in 2017-
2018 timeframe, subject to regulatory approvals, to develop a 1.3 billion bbl bitumen
resource in two production phases (both with a capacity of 75kb/d).
Figure 35: SA - SAGD image
Figure 36: SA-SAGD and SAGD
comparison
Source: Credit Suisse estimates Source: Credit Suisse estimates
Oil VI: oil sands = long life cash generators: While capital intensive vs conventional oil
production oil sands projects have much longer production profiles vs conventional and
certainly unconventional oil production, as Figure 37 (source Suncor) illustrates.
Figure 37: Oil sands entering the long life free cash flow generating phase
Source: Suncor
13 April 2017
Canadian Oil & Gas Sector 24
Oil 3 key themes:
Keystone XL + other pipes moving to take-away excess: We note that, a year
ago, when we had no clarity on new pipelines, marginal barrels would have to
clear on rail to the U.S. Gulf Coast, pushing heavy differentials wider to
accommodate for more rail economics. Some widening could still occur in 2017-
19 as committed supply continues to ramp up. However, an alternate future is
beginning to shape out wherein heavy oil differentials could narrow meaningfully
toward full pipe economics, with progress now evident on pipelines, especially
with the Keystone Xl approval in the US.
BAT: As a stand-alone proposition BAT would challenge Canadian oil growth, but
we think the potential amelioration of FX shifts and margin benefits from Keystone
XL should also be considered.
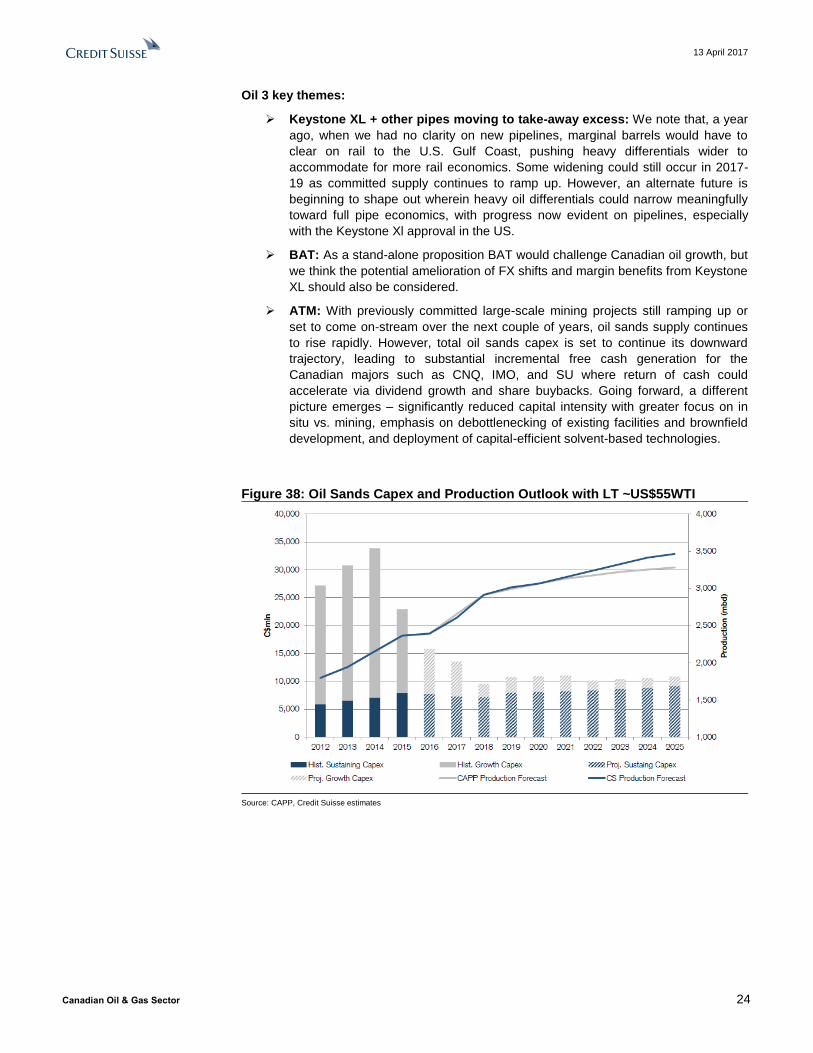
ATM: With previously committed large-scale mining projects still ramping up or
set to come on-stream over the next couple of years, oil sands supply continues
to rise rapidly. However, total oil sands capex is set to continue its downward
trajectory, leading to substantial incremental free cash generation for the
Canadian majors such as CNQ, IMO, and SU where return of cash could
accelerate via dividend growth and share buybacks. Going forward, a different
picture emerges – significantly reduced capital intensity with greater focus on in
situ vs. mining, emphasis on debottlenecking of existing facilities and brownfield
development, and deployment of capital-efficient solvent-based technologies.
Figure 38: Oil Sands Capex and Production Outlook with LT ~US$55WTI
Source: CAPP, Credit Suisse estimates
13 April 2017
Canadian Oil & Gas Sector 25
Gas: need those LNG exports…
Canadian Gas – some great rocks, unfortunate timing: CS views the Montney and
Deep basins to hold some of the most economic gas resources in North America, which
along with attractive fiscal terms positions them well. The challenge is the wall of
competitive gas being developed in Canada’s core market – the US. The big hope was for
LNG exports, but the major projects have not eventuated, and the next market window is
two years away, in our opinion. With abundant low cost gas we assume the AECO
differential remains at a similar level (-US$1/mcf vs NYMEX) going forward, but watch for
wildcard outcomes like major LNG project sanctions, more oil sands growth (than
forecast), or other demand growth for example petrochemical additions and the eventual
phase out of coal fired generation in Alberta. Given these dynamics, we prefer liquids rich
gas producers. With challenged gas economics we would expect further consolidation in
the space.
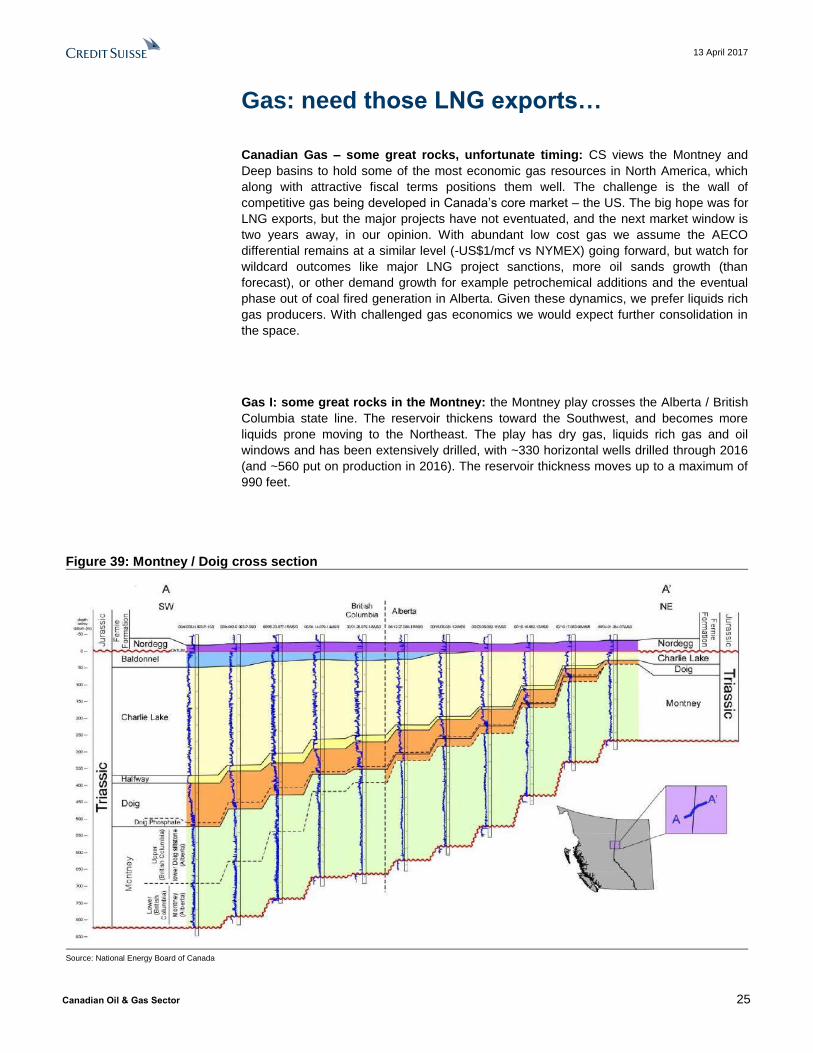
Gas I: some great rocks in the Montney: the Montney play crosses the Alberta / British
Columbia state line. The reservoir thickens toward the Southwest, and becomes more
liquids prone moving to the Northeast. The play has dry gas, liquids rich gas and oil
windows and has been extensively drilled, with ~330 horizontal wells drilled through 2016
(and ~560 put on production in 2016). The reservoir thickness moves up to a maximum of
990 feet.
Figure 39: Montney / Doig cross section
Source: National Energy Board of Canada
13 April 2017
Canadian Oil & Gas Sector 26
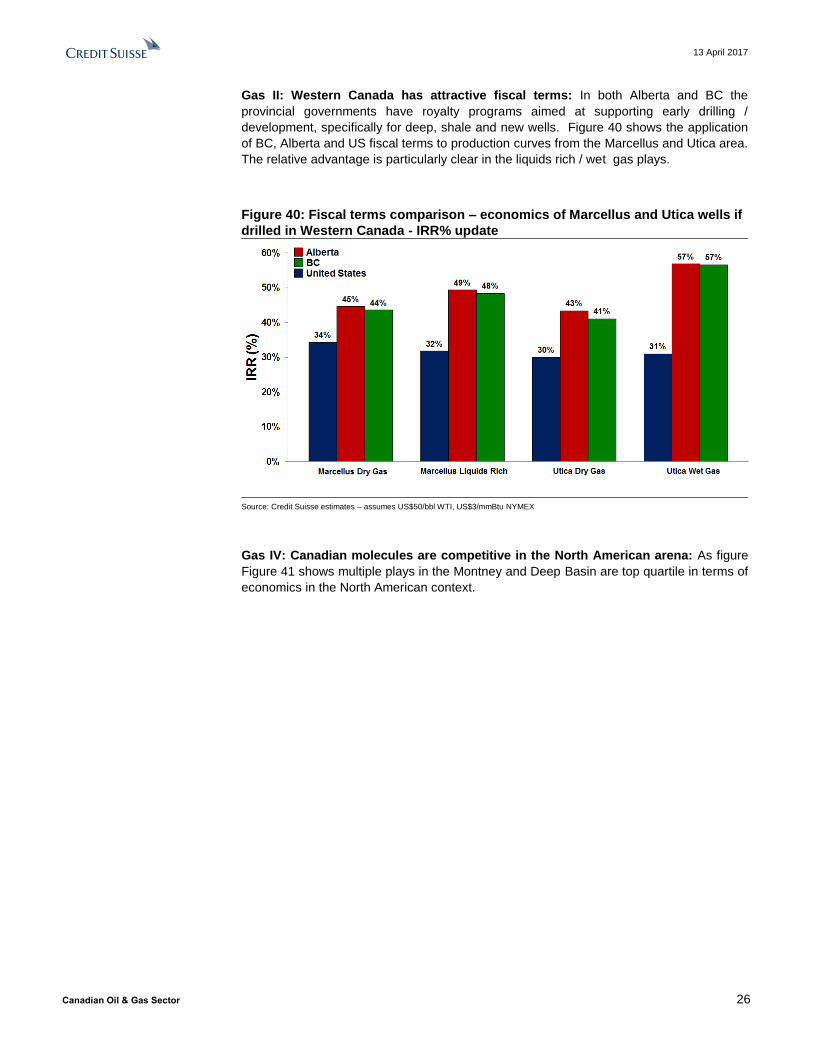
Gas II: Western Canada has attractive fiscal terms: In both Alberta and BC the
provincial governments have royalty programs aimed at supporting early drilling /
development, specifically for deep, shale and new wells. Figure 40 shows the application
of BC, Alberta and US fiscal terms to production curves from the Marcellus and Utica area.
The relative advantage is particularly clear in the liquids rich / wet gas plays.
Figure 40: Fiscal terms comparison – economics of Marcellus and Utica wells if
drilled in Western Canada - IRR% update
Source: Credit Suisse estimates – assumes US$50/bbl WTI, US$3/mmBtu NYMEX
Gas IV: Canadian molecules are competitive in the North American arena: As figure
Figure 41 shows multiple plays in the Montney and Deep Basin are top quartile in terms of
economics in the North American context.

13 April 2017
Canadian Oil & Gas Sector 27
Figure 41: Breakeven NYMEX (US$/mmBtu) - N American gas basin economics
at US$60/bbl WTI (to attain a 15% IRR)
Source: Credit Suisse estimates *Assumes US$5/bbl Edmonton Par differential, US$0.75/mmBTU differential to NYMEX, US$/C$ of 0.85
Gas II: Exports set to (continue to) fall as US ramps further production: The US shale
revolution has driven US gas production and consequently reduced Canadian exports
there.

13 April 2017
Canadian Oil & Gas Sector 28
Figure 42: Supply and Demand Balance, Natural Gas, Reference Case
Source: Canadian National Energy Board
Gas IV: Canadian LNG will likely not save this day: Next demand window 2024: CS
models the next demand window opening in 2024, a consequence of nearly 120MTpa of
new capacity being added in Australia and the US in the latter part of this decade. If our
timing forecast is broadly correct then the next project sanctions are only required in the
2019 window (assuming it takes 5 years to construct new liquefaction capacity – and later
if we assume less time to construct). One of the current discussion points in the LNG
space is the idea that multiple new LNG geographies will augment demand and accelerate
the sanction window. An issue with new LNG geographies is that they will likely require
more of holistic LNG offering, including regas and possibly power being provided as part of
a turnkey solution. Clearly not all LNG developers would have the balance sheet strength,
risk appetite or skill set to develop those new markets.
Figure 43: CS: Global LNG supply / demand balance forecast
Source: Credit Suisse estimates
-30
-20
-10
0
10
20
30
2016 2017 2018 2019 2020 2021 2022 2023 2024 2025
Excess (shortfall)
MTpa
Construction lag (FID to 1st LNG)
You are here

13 April 2017
Canadian Oil & Gas Sector 29
Canadian LNG – Are all of the major project promoters in the West strongly
engaged?: The Government (Provincial and Federal) appear supportive of LNG exports
becoming a reality for Canada, if the recent approval (albeit with multiple conditions) of the
Pacific NorthWest project is an indication. The reality is that for the 3 large proposals the
project developers may not be fully engaged in sanctioning the projects in the next 12 – 18
month period. Chevron, the Kitimat operator, is likely fully engaged bringing Gorgon,
Angola and Wheatstone to operational stability rather than sanctioning another project
(with no announced sales this far). Shell has said it will sanction 0 – 2 LNG projects at
some point in the future – we would expect a focus on cost reduction rather than a drive
toward sanction will be the focus this year, however the CEO did say at CERA week that a
project sanction may come ‘in a few quarters’. The Pacific Northwest project developers,
led by Petronas as the Operator, are reviewing the cost effect of the additional conditions
applied as a condition for approval. We still wonder if Petronas, holder of 62% of the
project is ready to commit to another major capex requirement when it works to complete
its US$27bn RAPID refining and petrochemical project in Johor Bahru, Malaysia. Our
current working assumption is that the Woodfibre LNG project in Squamish has the
greatest likelihood of sanctioning in the near / mid-term in Canada. This is a 2.1MTpa
facility (circa 0.27bcf/d).
Figure 44: Canada - major LNG export proposals vs current gas exports
Source: Credit Suisse estimates
Canadian LNG – Asia likely still attracted to Canadian supply; it’s all about timing:
We continue to expect that there is a place for Western Canadian molecules in Asia,
bringing a low risk relatively proximal source from a resource focused country – the
question is whether the project pool will be ready to compete in the next market and
sanction window.
The end of the pipe I: Let’s think about US gas supply / demand dynamics: On the
demand side growth continues to come from gas to power switching along with
petrochemical and increasingly going forward LNG international exports along with
increased pipe exports to Mexico. Figure 45 shows our US supply / demand balance to
2018, with LNG ramping to 3.4bcf/d next year and Mexico exports increasing to 5.1bcf/d
that year. On the supply side we forecast the Northeast growing by circa 3bcf/d in both
0
1
2
3
4
5
6
kitimat LNG Shell CanadaLNG
PacificNorthWest
LNG
Jordan CoveLNG
WoodfibreLNG
WesternCanada gas
export
WoodfibreLNG
Bcf/d

13 April 2017
Canadian Oil & Gas Sector 30
2017 and 2018. We also see growth in the gas Permian (1bcf/d both in 17 and 18) as well
as in associated gas production. On the demand side we expect actual demand (i.e. not
exports) to rise circa 2bcf/d in 2018 over 2017. Please see our recent North American gas
price report (report).
Figure 45: US natural gas supply and demand
Source: Company data, Credit Suisse estimates
We also see significantly more take-away capacity in the US: Figure 46 shows our
forecast of a ~19bcf/d take-away increase in the 2017 – 2018 timeframe in the NorthEast
US, where we forecast the Northeast take-away capacity to move into excess from Q3
2017, including an increase in access to the Eastern Ontario market from the US
NorthEast.

13 April 2017
Canadian Oil & Gas Sector 31
Figure 46: 2017-2018 NE Pipeline Projects
Source: http://id-maps.com, company data, Credit Suisse estimates
The current US LNG ramp-up maxes out at circa 8Bcf/d: Once all US projects under
construction are complete and operating we have a regular operational capacity of
59.7MTpa or just shy of 8bcf/d (note we run the plants at 92% for modelling purposes to
reflect maintenance requirements). While there may be some further project sanctions in
the US we do not expect a major ‘second wave’ of further capacity to be added in the early
part of the next decade.
Gas V: Hence the AECO differential likely faces ongoing pressure: With significant
additions to US gas infrastructure carrying US production from the NE US, and without the
hope of near term material growth in Canadian LNG exports, our conclusion is that there
will be ongoing pressure on the AECO differential. With our recent commodity update, CS
models a US$1.00/mcf differential going forward, which remains relatively accommodating
when compared to the current strip.
Wildcard: what if two of the ‘leading’ LNG projects merge (and sanction)? Given cost
risk we wonder if two of the leading projects could choose to develop jointly, with a phased
project. For example if LNG Canada and the Pacific NorthWest project chose to develop
an initial 10MTpa (two train) project using the LNG Canada facility in Kitimat and use the
Coastal GasLink pipeline, with an expansion phase at some point in the future. Should that
happen and such a merged project sanctioned at the end of 2017 it would suggest 1st LNG
in 2022 / 23, at which point circa 1.3bcf/d of gas would be exported. In the near term we
would presume that the source for that gas would be ramping up equity production which
would, all other things equal, worsen the regional gas balance prior to the start-up of such
a project.
Wildcard II: What if one of the major LNG projects sanction? We come back to the
Shell CEO’s recent comments about LNG Canada not being currently ready for sanction,
but that it could be ‘in a few quarters’ (his comments being made in March 2017). We
continue to expect that the global LNG industry learnt a (very expensive) lesson in
Australia with parallel multiple project build outs, namely not to do so in a high cost
geography. Hence with such logic there is a clearly a first mover advantage for the three
major Canadian projects. It would be good to understand the level of cohesion between
Shell and its partners (Mitsubishi, PetroChina and Kogas) about sanctioning this project in
2017, and the readiness of each partner to supply equity upstream gas. If the project were
Northeast Pipeline ProjectsStart End Incremental Estimated
Company Project Point Point Capacity (MMcf/d) In-service Date FERC status
UGI Sunbury Lycoming, PA Snyder County, PA 200 1Q 2017 Approved
ETP Rover Cadiz, OH Defiance, OH 3,250 4Q 2017 Approved
SEP Nexus Gas Transmission Stark, OH SE Michigan 1,500 4Q 2017 Filed
WPZ Atlantic Sunrise Stage 1 Leidy, PA Station 85, Alabama 430 4Q 2017 Approved
KMI TGP Northeast Upgrade Bradford County, PA New Jersey 600 4Q 2017 Filed
SEP Adair Southwest Fairfield, OH Adair, KY 200 4Q 2017 Approved
SEP Access South Uniontown, PA Kosciusko, MS 320 4Q 2017 Approved
SEP Lebanon Extension Project Uniontown, PA Lebanon, OH 622 4Q 2017 Approved
KMI Susquehanna West Project Tioga County Tioga County 145 4Q 2017 Approved
Columbia/TRP Leach Xpress / Rayne Xpress Majorsville, WV ML Pool, Rayne, LA 1,500 4Q 2017 Approved
Incremental Capacity 8,767
WPZ Constitution Susquehana County, PA Schoharie County, NY 650 4Q 2017 Filed
WPZ Atlantic Sunrise Stage 2 Leidy, PA Station 85, Alabama 1,270 2Q 2018 Approved
National Fuel Gas Northern Access 2016 Sergeant Township, PA Wales, NY 350 2Q 2018 Approved
EQM Mountain Valley Bradshaw, WV Pittsylvania County, VA 2,500 4Q 2018 Filed
Columbia/TRP Mountaineer Xpress Marshall County, WV Wayne County, WV 2,700 4Q 2018 Pre filing
Columbia/TRP WB Xpress West Virginia Virginia 1,300 4Q 2018 Filed
D Atlantic coast Lewis County, WV Northhampton, NC 1,500 4Q 2018 Filed
Incremental Capacity 10,270
Total 19,037
20
17
20
18

13 April 2017
Canadian Oil & Gas Sector 32
to sanction it would, once completed, require 12MTpa or 1.6bcf/d of gas which we would
expect to have a positive effect on the AECO differential.
Wildcard III – further pipeline take-away capacity added: We assume that the recent
1.5bcf/d mainline open bid is largely a roll-over of existing use on the line, but with a lot of
spare capacity (mainline has run at circa 8bcf/d, but is now running at circa 4bcf/d) there is
further take-away capacity opportunity on mainline – the question is at what price. A
significant proportion of the spare capacity is earmarked for the Energy East oil pipeline
project, as yet unsanctioned, but with a plan to convert the second pipe to an oil pipeline.
The North Montney mainline has now been re-proposed as a 1.5bcf/d pipe linking to
AECO, and thence beyond, with off-takers already lined up. One scenario is that the line
capacity is increased (it was originally designed as a 3.5bcf/d pipe). The Alliance pipeline,
carrying to the Chicago hub has proposed an additional 0.5bcf/d, currently seeking
expressions of interest with a potential start date (for the additional capacity) of Q4 2020.
Given our view that certain plays in the WCSB can compete with US gas additional reach
could have a positive effect on the AECO differential.
Wildcard IV: Western gas for Eastern LNG? Quebec LNG are working on an 11MTpa
facility at Saguenay Port in Quebec. The project would require a 650 km pipeline to link to
the mainline pipe in Ontario, looking to source Western Canadian gas molecules (priced
off AECO and Dawn) as feedstock gas for the liquefaction process. Should that project
eventuate it would represent circa 1.4bcf/d of additional call on Western Canadian gas.
Wildcard V: stimulate petrochemical investments in Western Canada: At a recent
conference the new XOM CEO stated they intend to spend US$20 bn in 11 projects in the
Gulf of Mexico, including refineries and petrochemical plants – seeking new outlets for US
low cost gas production. With low cost gas, a relatively mature transportation
infrastructure and deep-water access (in BC) with proximity to Asia one wonders if there is
not an opportunity to expand demand in Western Canada with a focus on petrochemical
opportunities. Both Pembina Pipeline and Inter Pipeline are evaluating PDH / PP projects,
and there may be the opportunity for further petrochemical projects, especially in the Fort
Saskatchewan area.
Wildcard VI – oil sands growth surprises to the upside: CS forecast a growth in
Canadian oil sands production of ~450kb/d by the end of the decade. Part of this growth is
front end loaded with the start-up of Fort Hills and Horizon Phase 3. We estimate that this
production growth may add ~0.40 bcf/d of gas demand in the near to mid-term, and have
already factored this when forecasting the AECO differential going forward. The degree to
which expansion plans surprise to the upside could add some incremental demand for
Western Canadian gas.
Wildcard VII – the demise of coal fired power in Alberta: The Province is working to
close coal fired electricity plants by 2030, announcing an agreement in November 2016 to
pay three major power producers C$97 million a year going forward to help with the
transition costs of shuttering the coal fired capacity. Timing of the phase out is uncertain at
this point – however we would estimate the removal of coal generation if replaced by
natural gas would be circa 1.6bcf/d.
Gas VI: we prefer the liquids rich plays: in our recent report ‘returns like a Permian,
trades at a discount and benefits from a border tax’ we highlighted that certain condensate
rich plays in the Montney could provide competitive economics with Permian plays, even

13 April 2017
Canadian Oil & Gas Sector 33
taking into consideration a wide AECO differential (US$1/ mmBtu), with for example Seven
Generations Nest 2 play making a 15% IRR at circa US$30/bbl, and NuVista’s Bilbo play
in the Montney at less than US$40/bbl. Condensate will likely continue to be a premium
product in Canada, given its use as a diluent in the oil sands. Additionally, both companies
continue to reduce their cost structure while improving their well performance, which
should continue to drive improving economic returns moving forward.
Gas VII: Hard times drive consolidation: We have argued before that a combination of
factors may drive consolidation in Western Canada that favors larger companies,
including:
- The Montney is a large resource, and therefore it should generally gravitate to
companies with a large balance sheet over time
- Widening basis differentials, coupled with limited infrastructure, may place greater
pressure on lesser capitalized companies
- Pipeline companies are increasingly asking for longer term contracts, and less
capitalized companies may not have the necessary credit profile to commit to longer term
contracts
- Larger scale companies with existing infrastructure may have a competitive
advantage over time
Gas 3 key themes:
Great rocks
But excess gas supply which LNG won’t fix in the short term
Favour liquids rich players, watch for consolidation
Infrastructure / Pipeline:
Canadian Mainline: As one may expect, the Canadian Mainline's ongoing rate base
erosion reflects several factors, including pipeline age along with original capital cost,
changing natural gas flows, competitive pipelines, and capital allocation decisions
reflecting available returns. In light of these factors, there should be no surprise about the
System's declining throughput appearing in Figure 47. It is important to note that the
mainline has run at 8bcf/d transmission – there is certainly capacity that could be used
going forward, although the second pipe could be converted to an oil pipeline as part of
the Energy East pipeline proposal.

13 April 2017
Canadian Oil & Gas Sector 34
Figure 47: Selected Historical Natural Gas Volume Throughputs
Note Before 2007, Canadian Mainline’s throughput volumes in the above table reflect physical deliveries to domestic and export markets. Throughput volumes reported in previous years reflected contract deliveries. However, customer contracting patterns have changed in recent years making physical deliveries a better measure of system utilization. Source: Company data.
In relation to pipeline access options, TransCanada recently announced and concluded an
open season for the Canadian Mainline. This revised open season followed an originally
failed attempt to secure longer-term shippers in late 2016. The new binding open season
for the Dawn Long Term Fixed Price Service (LTFP) was centered around a changed
tolling structure. Very simply, the tolling structure was changed with the toll being set at
C$0.77/GJ/d on a ten-year term with a sliding schedule of tolls for more reduced service
terms as appears in Figure 48.
Figure 48: TRP's Mainline Fixed Price Service Open Season
Source: Company data.
TransCanada sought and secured interest for 1.5 PJ/d of commitments from the open
season. Versus other offerings, TRP's newly proposed tolls are extremely competitive.
Yet, that toll competitiveness is only one factor to consider for producers, purchasers, and
shippers. On a fundamental basis, TRP's Mainline should best be considered as a multi-
region system with a Western leg, the Northern Ontario system, and the Eastern Triangle
portion as appears in Figure 49.
0
2
4
6
8
10
12
14
Do
me
sti
c &
Ex
po
rt V
olu
me
(b
cf/
d)
NGTL System Canadian Mainline ANR
13 April 2017
Canadian Oil & Gas Sector 35
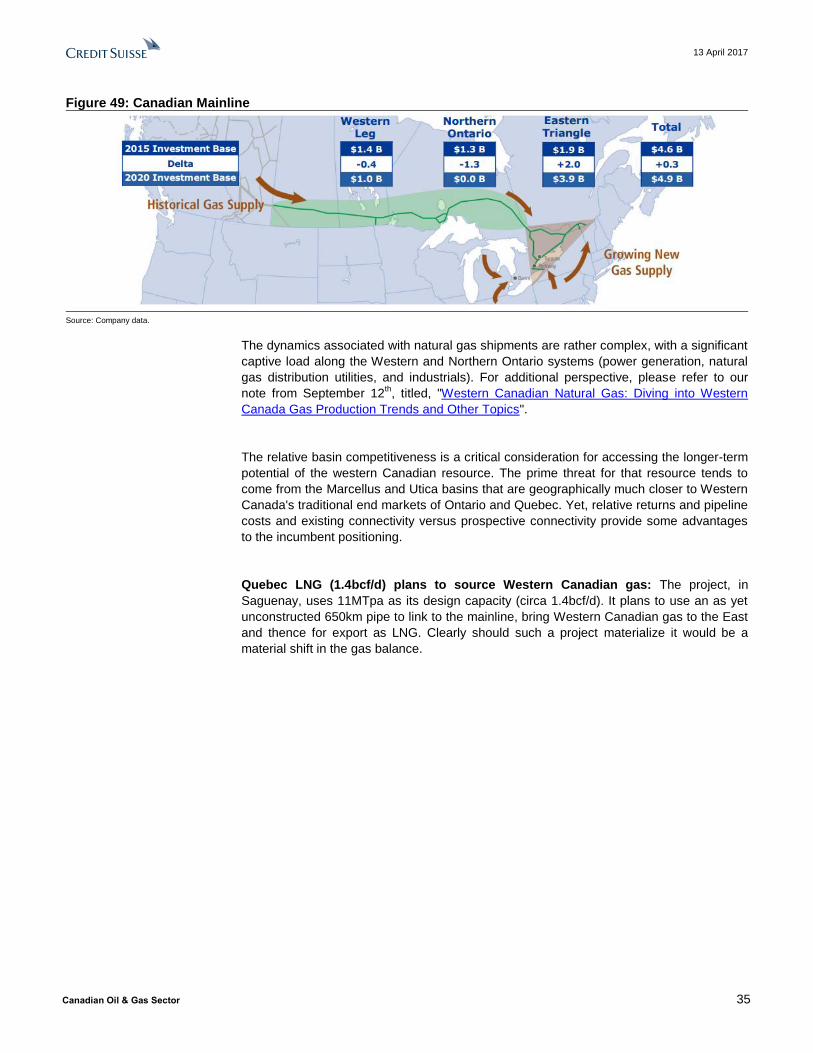
Figure 49: Canadian Mainline
Source: Company data.
The dynamics associated with natural gas shipments are rather complex, with a significant
captive load along the Western and Northern Ontario systems (power generation, natural
gas distribution utilities, and industrials). For additional perspective, please refer to our
note from September 12th, titled, "Western Canadian Natural Gas: Diving into Western
Canada Gas Production Trends and Other Topics".
The relative basin competitiveness is a critical consideration for accessing the longer-term
potential of the western Canadian resource. The prime threat for that resource tends to
come from the Marcellus and Utica basins that are geographically much closer to Western
Canada's traditional end markets of Ontario and Quebec. Yet, relative returns and pipeline
costs and existing connectivity versus prospective connectivity provide some advantages
to the incumbent positioning.
Quebec LNG (1.4bcf/d) plans to source Western Canadian gas: The project, in
Saguenay, uses 11MTpa as its design capacity (circa 1.4bcf/d). It plans to use an as yet
unconstructed 650km pipe to link to the mainline, bring Western Canadian gas to the East
and thence for export as LNG. Clearly should such a project materialize it would be a
material shift in the gas balance.

13 April 2017
Canadian Oil & Gas Sector 36
Figure 50: Quebec LNG plans on using Western Canadian gas
Source: Quebec LNG project presentation May 2015
Regardless of the connectivity options and associated costs, Ontario's natural gas supply
mix is becoming more diverse. A recent ENB presentation highlights part of this dynamic
in Figure 51.
Figure 51: Gas Supply
Source: Company data.
13 April 2017
Canadian Oil & Gas Sector 37
North Montney Mainline Project: Originally designed as a 3.5bcf/d pipeline that would
partially serve the proposed Petronas operated PacificNorthWest LNG project in Prince
Rupert. As part of the original application a clause required that LNG project to take FID as
a condition precedent to developing the North Montney mainline pipeline. In March
TransCanada announced it has secured approximately 1.5bcf/d of long term (20 year)
contracts – half of which with Progress Energy (owned by Petronas). As part of the project
redesign TransCanada filed a variance application with the National Energy Board to
remove the LNG FID requirement. The line will increase the reach of the producers to the
AECO hub and beyond. We would not be surprised that the capacity could be uprated
should the PNW LNG project sanction at some point in the future.

13 April 2017
Canadian Oil & Gas Sector 38
Stocks: Stocks: new metric to look for potential outliers, both in Canada and across North
America: We segregate into two universes – SMID and large cap, focus on Canada
initially and then NA as a whole. We use 4 metrics (production growth, operating
margin/boe, D/CF and yield) to ‘score’ each stock and then use that score to compare an
implied 2018 EBITDA multiple for that universe to our current forecast – seeking outliers.
In the SMID space in Canada we prefer VII and NVA and in the US PE and EGN. For the
North America large cap universe we prefer SU and ECA in Canada and PXD, CXO and
DVN in the US. Finally looking at global majors SU again stands out as does RDS and BP
in Europe.
Let’s start in Canada with the SMID universe: We have four screens on our dashboard
for the Canadian universe, namely 2018 over 2017 production growth, 2018 operating
margin / BoE (CSE), 2018 D/CF (CSE) and 2018 dividend yield (CSE). With a
conservative view on AECO differentials we prefer the condensate rich plays, or those that
have flat out superior production costs to defend netback per boe.
Figure 52: Canadian SMID – 18 over 17 Prod’n
growth Figure 53: Canadian SMID – Operating margin- BoE
Source: Credit Suisse estimates Source: Credit Suisse estimates
Figure 54:Canadian SMID 2018 D/CF Figure 55: Canadian SMID – 2018 Dividend yield
Source: Credit Suisse estimates Source: Credit Suisse estimates
13 April 2017
Canadian Oil & Gas Sector 39
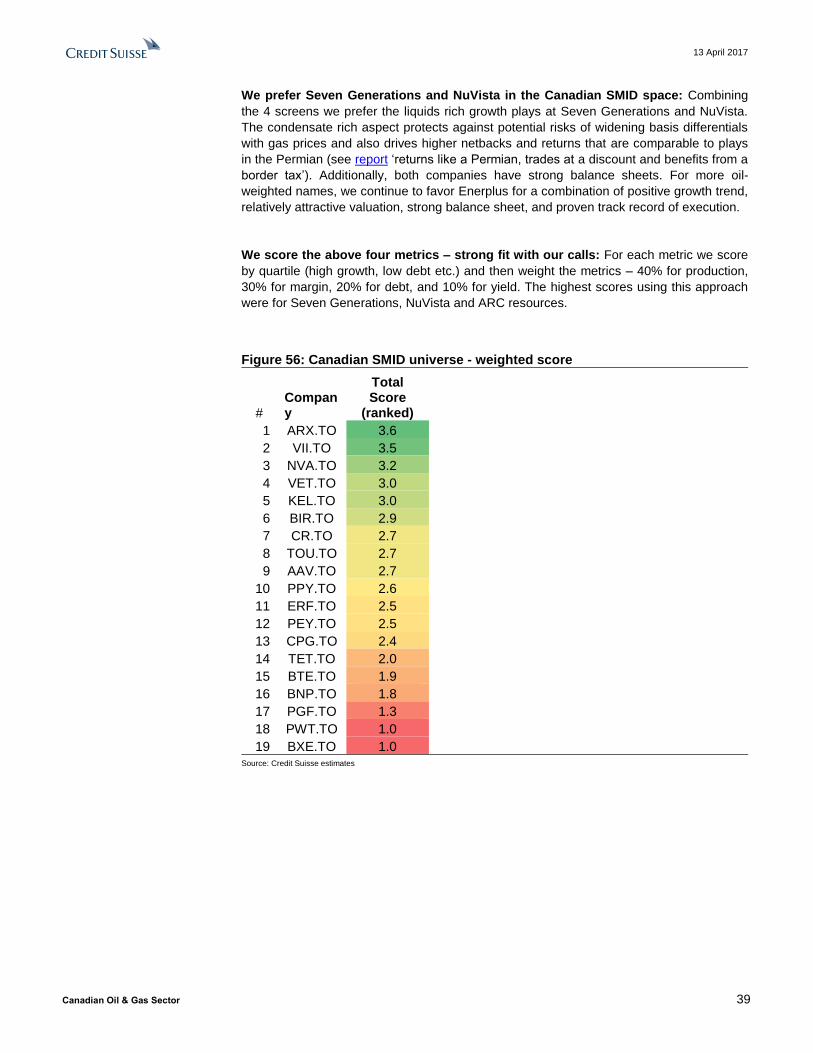
We prefer Seven Generations and NuVista in the Canadian SMID space: Combining
the 4 screens we prefer the liquids rich growth plays at Seven Generations and NuVista.
The condensate rich aspect protects against potential risks of widening basis differentials
with gas prices and also drives higher netbacks and returns that are comparable to plays
in the Permian (see report ‘returns like a Permian, trades at a discount and benefits from a
border tax’). Additionally, both companies have strong balance sheets. For more oil-
weighted names, we continue to favor Enerplus for a combination of positive growth trend,
relatively attractive valuation, strong balance sheet, and proven track record of execution.
We score the above four metrics – strong fit with our calls: For each metric we score
by quartile (high growth, low debt etc.) and then weight the metrics – 40% for production,
30% for margin, 20% for debt, and 10% for yield. The highest scores using this approach
were for Seven Generations, NuVista and ARC resources.
Figure 56: Canadian SMID universe - weighted score
# Company
Total Score
(ranked)
1 ARX.TO 3.6
2 VII.TO 3.5
3 NVA.TO 3.2
4 VET.TO 3.0
5 KEL.TO 3.0
6 BIR.TO 2.9
7 CR.TO 2.7
8 TOU.TO 2.7
9 AAV.TO 2.7
10 PPY.TO 2.6
11 ERF.TO 2.5
12 PEY.TO 2.5
13 CPG.TO 2.4
14 TET.TO 2.0
15 BTE.TO 1.9
16 BNP.TO 1.8
17 PGF.TO 1.3
18 PWT.TO 1.0
19 BXE.TO 1.0
Source: Credit Suisse estimates

13 April 2017
Canadian Oil & Gas Sector 40
Figure 57: Canadian SMID E&P upside / downside at CS deck and strip
Source: Credit Suisse estimates
Moving to Canadian oil sands / majors: We use the same screens as the SMID
universe, however we change the weightings, namely 20% for production growth, 30% for
margin, 30% for debt, and 20% for yield.
AAV.TO
BXE.TO
BIR.TO
BNP.TO
CR.TO
KEL.TO
NVA.TO
PPY.TO
POU.TO
PEY.TO
VII.TO
TOU.TO
TET.TO
-100%
-90%
-80%
-70%
-60%
-50%
-40%
-30%
-20%
-10%
0%
10%
-20% -10% 0% 10% 20% 30% 40%
% U
psid
e / D
ow
nsid
e a
t S
trip
% Upside / Downside at CS Deck
OUTPERFORMNEUTRAL UNDERPERFORM
13 April 2017
Canadian Oil & Gas Sector 41
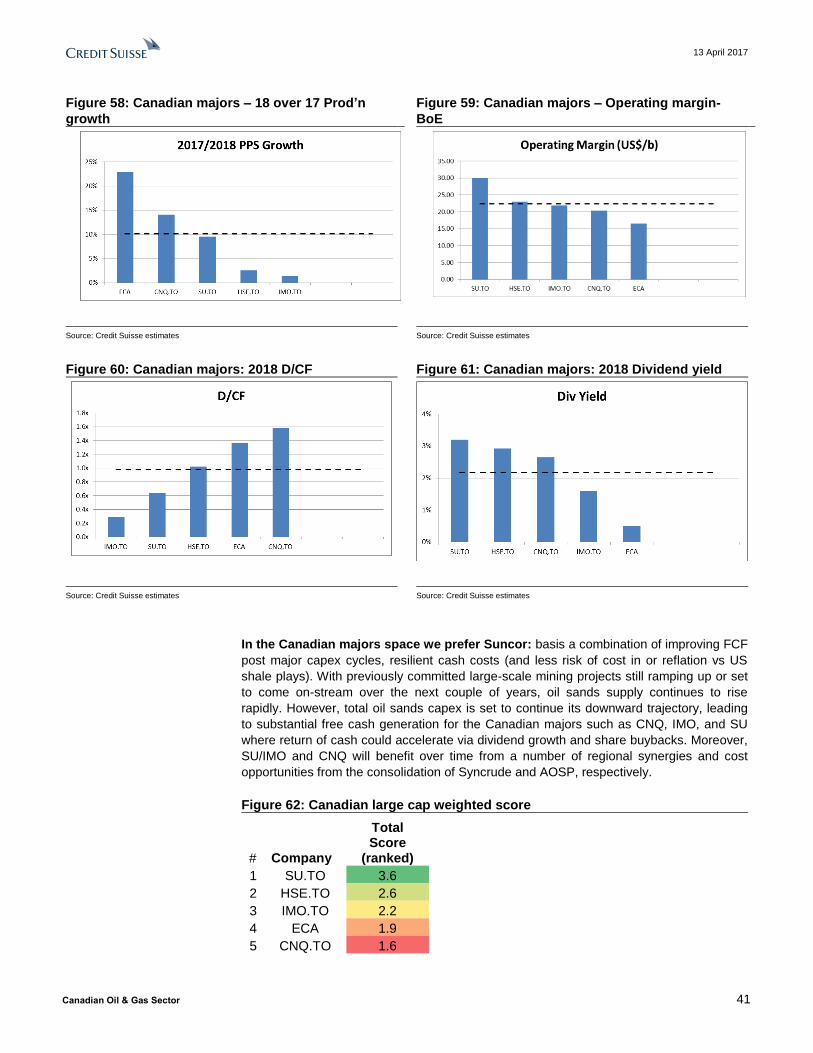
Figure 58: Canadian majors – 18 over 17 Prod’n
growth
Figure 59: Canadian majors – Operating margin-
BoE
Source: Credit Suisse estimates Source: Credit Suisse estimates
Figure 60: Canadian majors: 2018 D/CF Figure 61: Canadian majors: 2018 Dividend yield
Source: Credit Suisse estimates Source: Credit Suisse estimates
In the Canadian majors space we prefer Suncor: basis a combination of improving FCF
post major capex cycles, resilient cash costs (and less risk of cost in or reflation vs US
shale plays). With previously committed large-scale mining projects still ramping up or set
to come on-stream over the next couple of years, oil sands supply continues to rise
rapidly. However, total oil sands capex is set to continue its downward trajectory, leading
to substantial free cash generation for the Canadian majors such as CNQ, IMO, and SU
where return of cash could accelerate via dividend growth and share buybacks. Moreover,
SU/IMO and CNQ will benefit over time from a number of regional synergies and cost
opportunities from the consolidation of Syncrude and AOSP, respectively.
Figure 62: Canadian large cap weighted score
# Company
Total Score
(ranked)
1 SU.TO 3.6
2 HSE.TO 2.6
3 IMO.TO 2.2
4 ECA 1.9
5 CNQ.TO 1.6
13 April 2017
Canadian Oil & Gas Sector 42
Source: Credit Suisse estimates
So on a Canada wide basis we prefer Suncor, 7 Gen’s and Encana: Seven
Generations and Encana are our preferred names in the E&P space. Additionally, we
believe Canadian majors continue to screen well relative to the multinationals, including
Imperial Oil and CNRL. We remain concerned on Pengrowth and Penn West due to
relatively weaker fundamentals.
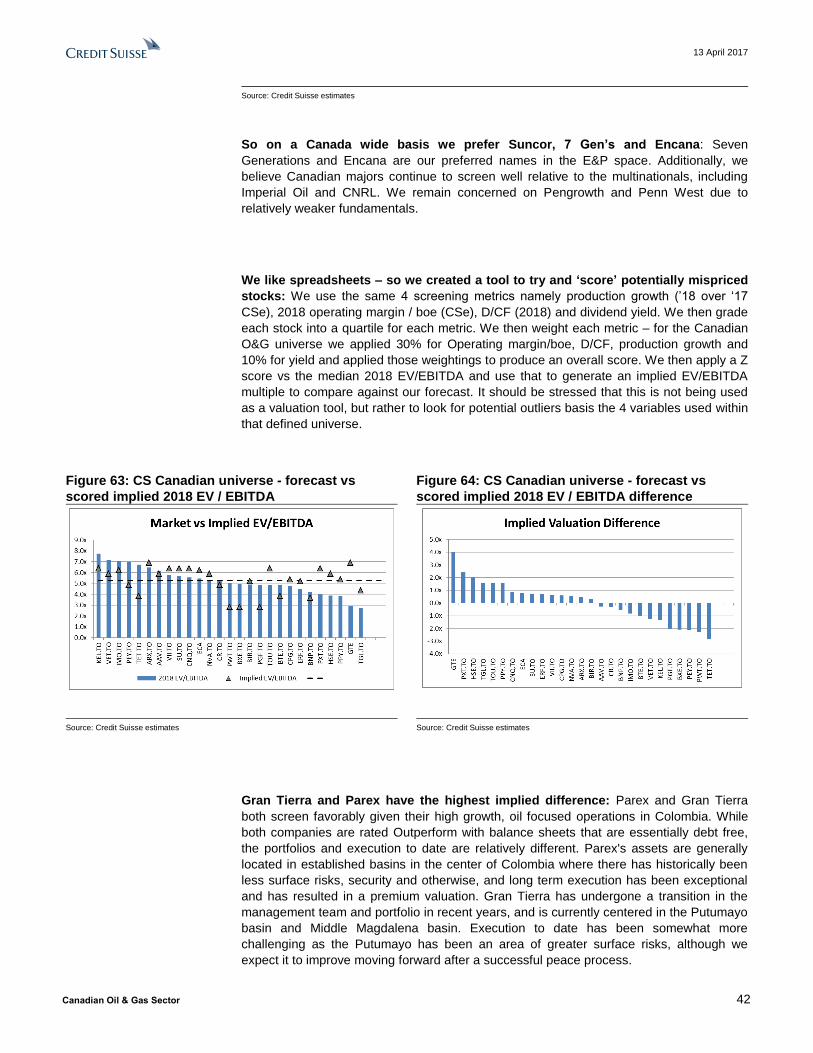
We like spreadsheets – so we created a tool to try and ‘score’ potentially mispriced
stocks: We use the same 4 screening metrics namely production growth (’18 over ‘17
CSe), 2018 operating margin / boe (CSe), D/CF (2018) and dividend yield. We then grade
each stock into a quartile for each metric. We then weight each metric – for the Canadian
O&G universe we applied 30% for Operating margin/boe, D/CF, production growth and
10% for yield and applied those weightings to produce an overall score. We then apply a Z
score vs the median 2018 EV/EBITDA and use that to generate an implied EV/EBITDA
multiple to compare against our forecast. It should be stressed that this is not being used
as a valuation tool, but rather to look for potential outliers basis the 4 variables used within
that defined universe.
Figure 63: CS Canadian universe - forecast vs
scored implied 2018 EV / EBITDA
Figure 64: CS Canadian universe - forecast vs
scored implied 2018 EV / EBITDA difference
Source: Credit Suisse estimates Source: Credit Suisse estimates
Gran Tierra and Parex have the highest implied difference: Parex and Gran Tierra
both screen favorably given their high growth, oil focused operations in Colombia. While
both companies are rated Outperform with balance sheets that are essentially debt free,
the portfolios and execution to date are relatively different. Parex's assets are generally
located in established basins in the center of Colombia where there has historically been
less surface risks, security and otherwise, and long term execution has been exceptional
and has resulted in a premium valuation. Gran Tierra has undergone a transition in the
management team and portfolio in recent years, and is currently centered in the Putumayo
basin and Middle Magdalena basin. Execution to date has been somewhat more
challenging as the Putumayo has been an area of greater surface risks, although we
expect it to improve moving forward after a successful peace process.
13 April 2017
Canadian Oil & Gas Sector 43
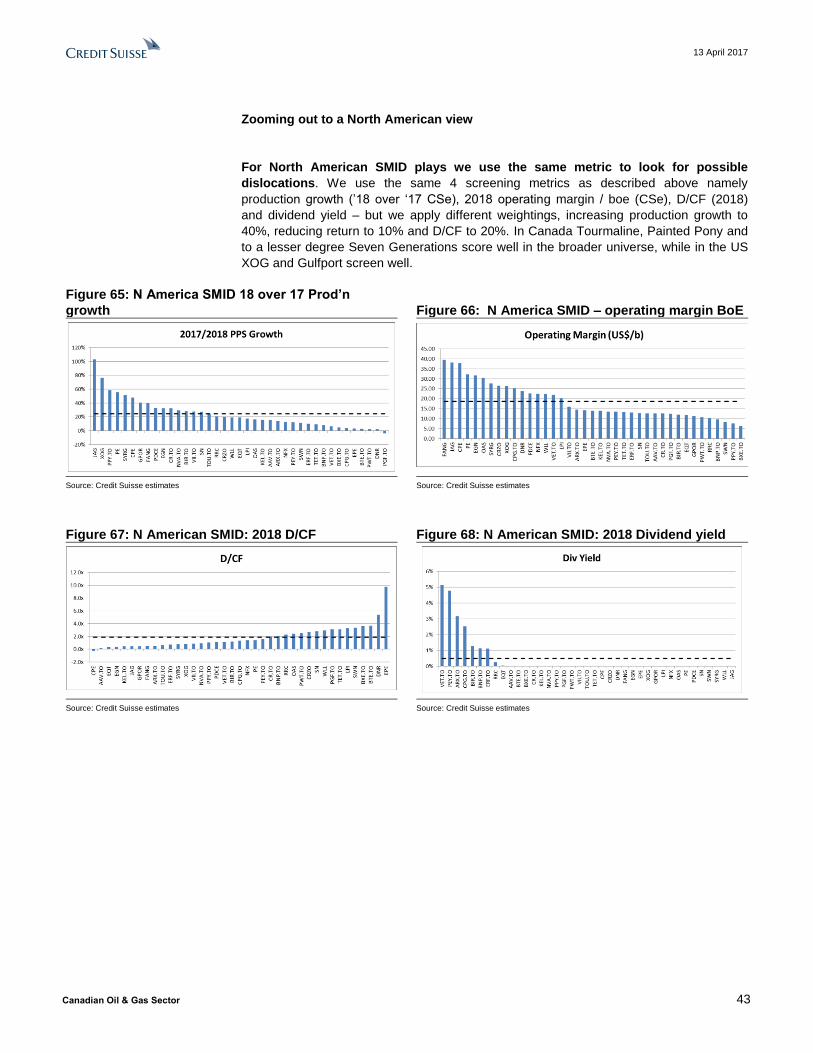
Zooming out to a North American view
For North American SMID plays we use the same metric to look for possible
dislocations. We use the same 4 screening metrics as described above namely
production growth (’18 over ‘17 CSe), 2018 operating margin / boe (CSe), D/CF (2018)
and dividend yield – but we apply different weightings, increasing production growth to
40%, reducing return to 10% and D/CF to 20%. In Canada Tourmaline, Painted Pony and
to a lesser degree Seven Generations score well in the broader universe, while in the US
XOG and Gulfport screen well.
Figure 65: N America SMID 18 over 17 Prod’n
growth Figure 66: N America SMID – operating margin BoE
Source: Credit Suisse estimates Source: Credit Suisse estimates
Figure 67: N American SMID: 2018 D/CF Figure 68: N American SMID: 2018 Dividend yield
Source: Credit Suisse estimates Source: Credit Suisse estimates

13 April 2017
Canadian Oil & Gas Sector 44
Figure 69: N America SMID universe screening
metric
Figure 70: N America SMID universe screening
metric - difference
Source: Credit Suisse estimates Source: Company data, Credit Suisse estimates
We did the same for Canadian majors with large cap US corps: Again the same
metric, i.e., 4 variables and the same weightings i.e. 40% for production growth, 10% for
yield, 20% for D/CF and 30% for operating margin / boe. Suncor continues to screen well
in the wider North America universe, as does Encana. For US stocks we would highlight
APC and MUR. While COP’s production growth in 2018 is low it reflects the disposals
program, whilst the longer term PPS growth is positive. For DVN it is at the lower end of
the margin universe and with less growth than some of the shale focused plays, but there
is upside NAV which will emerge over time with one of the deepest shale inventories in the
large cap space.
Figure 71: N America large cap – PPS growth
Figure 72: N America large cap – Operating margin /
BoE
Source: Credit Suisse estimates Source: Credit Suisse estimates

13 April 2017
Canadian Oil & Gas Sector 45
Figure 73: N America large cap D/CF Figure 74: N America large cap: 2018 dividend yield
Source: Credit Suisse estimates Source: Credit Suisse estimates
Figure 75: N America large cap universe screening
metric
Figure 76: N America large cap universe screening
metric - difference
Source: Credit Suisse estimates Source: Credit Suisse estimates
And then finally, and for the sake of completeness we looked at global majors: again
the same metric and variables but in this case we reduced the growth component to 20%
and increased the yield to 20% (with 30% each for operating margin /boe and D/CF).
Suncor again scores strongly in this universe along with OMV, ENI, and TOT in Europe.

13 April 2017
Canadian Oil & Gas Sector 46
Figure 77: Global majors: 18 over 17 Prod’n Figure 78: Global majors: operating margin / BoE
Source: Credit Suisse estimates Source: Credit Suisse estimates
Figure 79: Global majors: 2018 D/CF Figure 80: Global majors: 2018 Dividend yield
Source: Credit Suisse estimates Source: Credit Suisse estimates
Figure 81: Global majors screening metric
Figure 82: Global majors screening metric -
difference
Source: Credit Suisse estimates Source: Credit Suisse estimates

13 April 2017
Canadian Oil & Gas Sector 47
Foreign Exchange – CAD Considerations and the US Perspective: In the Canadian
energy space, producers generally report in CAD. A strengthening CAD could be a
headwind to producers as commodity revenues are derived in USD, while costs are based
in CAD. Given the strong historical correlation, a strengthening CAD is typically associated
with improving crude prices, which remain the primary fundamental driver for the industry.
We review some of the nuances below.
Most larger operators have a portion of long term debt denominated in USD, which
decreases debt servicing costs as the CAD strengthens. Some FX hedge this debt
repayment exposure. There is also mark-to-market, non-cash earnings gains when the
CAD rises, as debt balances for CAD reporters are recalculated lower.
Canadian companies reporting in CAD but with a high proportion of capital targeting U.S.
operations, such as BTE (Eagle Ford) and ERF (Marcellus, Bakken), can have partially
offsetting costs owing to lower reported capital expenditures.
ECA is unique among Canadian companies focused on North America as it reports in
USD. Therefore it lacks the revenue sensitivity of other Canadian domestic producers. The
company can still have significant cost sensitivity, however, with material Canadian based
capex, opex and G&A expenses.
Notwithstanding the existing structural headwinds on the natural gas front, the
strengthening of the Canadian dollar could represent a material risk to natural gas
weighted producers in Western Canada. Realized CAD gas pricing could be lower as the
AECO gas differential may remain constant and/or widen in USD terms. Companies that
send their gas to the US would also experience lower realized pricing in CAD terms.
Further, if the strengthening of the CAD is driven by a rebound in oil prices, industry cost
inflation, greater natural gas supply from liquids rich and oil plays could further challenge
Canadian gas weighted producers. These FX and cyclical risks are in addition to the
structural risks, which is why we reaffirm our preference for condensate-rich assets in
Western Canada, and/or low-cost gas assets with some degree of liquids optionality,
accompanied by strong balance sheets.
In the Canadian international energy space, producers report in USD and are largely
insensitive to CAD/USD volatility, other than stock prices which are denominated in CAD.
Overall, the challenge for investors in the space is that while a stronger CAD could be a
headwind to current cash flows, all else is not usually equal. Given the strong historical
correlation, a strengthening CAD is typically associated with increased crude prices which
remain the primary fundamental driver for the industry.

13 A
pril 2
01
7
Can
ad
ian
Oil &
Gas
Sec
tor
48
Relative Valuation
Figure 83: Canadian SMID E&P Relative Valuation
Source: Company data, Credit Suisse estimates
Price MC EV
Canadian SMID E&P Rating 04/11/17 Target Upside C$BN C$BN 17E 18E 17E 18E 2016/17 2017/18 17E 18E
Advantage Oil & Gas O $9.04 $11.50 27% $1.7 $1.8 8.4x 7.1x 0.5x 0.2x 14% 15% 4% 4%
ARC Resources O $18.81 $28.00 49% $6.7 $7.6 8.3x 6.7x 1.0x 0.5x 2% 14% 34% 35%
Baytex Energy N $4.70 $5.50 17% $1.1 $2.8 6.3x 5.0x 5.0x 3.6x (8)% 3% 79% 78%
Bellatrix Exploration N $1.11 $1.00 (10)% $0.3 $0.6 5.3x 5.0x 3.9x 3.6x (18)% 5% 24% 24%
Birchcliff Energy N $7.86 $7.75 (1)% $2.1 $2.7 6.1x 4.9x 1.4x 1.2x 9% 28% 23% 21%
Bonavista Energy N $3.49 $3.75 7% $0.9 $1.8 4.8x 4.3x 2.4x 2.0x 1% 8% 34% 34%
Crescent Point Energy N $14.91 $20.00 34% $8.1 $11.8 5.9x 4.8x 1.9x 1.3x (3)% 4% 89% 89%
Crew Energy N $5.14 $6.50 26% $0.8 $1.0 6.5x 5.2x 2.0x 2.0x 11% 32% 27% 27%
Enerplus O $10.88 $16.00 47% $2.6 $3.0 6.2x 4.6x 0.9x 0.7x (10)% 10% 47% 52%
Kelt Exploration N $7.43 $7.00 (6)% $1.3 $1.5 9.6x 7.8x 0.6x 0.4x 8% 16% 40% 40%
NuVista Energy O $6.66 $8.50 28% $1.2 $1.2 6.9x 5.2x 0.9x 0.9x 4% 29% 36% 36%
Painted Pony Petroleum U $5.44 $5.00 (8)% $0.9 $1.1 7.1x 3.8x 2.0x 1.0x 45% 58% 8% 7%
Paramount Resources N $18.44 $17.00 (8)% $2.0 $1.3 14.2x 7.7x 0.0x 0.0x (37)% 65% 32% 32%
Pengrowth Energy U $1.54 $2.00 30% $0.8 $2.1 7.9x 5.0x 6.3x 3.1x (11)% (4)% 64% 67%
Penn West Petroleum U $2.22 $1.75 (21)% $1.1 $1.7 6.6x 5.1x 3.9x 2.5x (26)% 2% 59% 62%
Peyto Exploration N $27.53 $28.00 2% $4.5 $5.6 8.3x 7.0x 1.8x 1.6x 10% 12% 9% 9%
Seven Generations O $25.53 $32.00 25% $8.9 $10.4 7.2x 5.4x 1.3x 0.9x 23% 28% 58% 58%
Tourmaline Oil O $29.40 $40.00 36% $7.9 $9.3 6.3x 4.8x 0.9x 0.6x 15% 24% 16% 17%
Trilogy Energy N $5.34 $5.75 8% $0.7 $1.3 7.9x 6.8x 3.7x 3.1x 10% 9% 35% 34%
Vermilion Energy N $50.69 $52.00 3% $6.0 $7.3 10.6x 8.1x 1.9x 1.1x 5% 7% 46% 46%
Median 12% 7.0x 5.2x 1.8x 1.1x 4% 13% 35% 35%
Average 14% 7.5x 5.7x 2.1x 1.5x 2% 18% 38% 39%
EV/EBIDAX D/CF Production Per Share Growth Liquids Weight

13 A
pril 2
01
7
Can
ad
ian
Oil &
Gas
Sec
tor
49
Figure 84: US SMID E&P Relative Valuation
Source: Company data, Credit Suisse estimates
Price MC EV
US SMID E&P Rating 04/11/17 Target Upside C$BN C$BN 17E 18E 17E 18E 2016/17 2017/18 15A 17E 18E
Callon Petroleum O $13.61 $20.00 47% $2.7 $2.5 8.8x 6.5x 0.0x 0.0x 0% 48% 77% 78%
Carrizo Oil & Gas N $28.90 $40.00 38% $1.9 $3.2 7.8x 6.1x 3.7x 2.7x 8% 20% 76% 79%
Denbury Resources U $2.50 $2.00 (20)% $1.0 $4.2 10.0x 7.5x 8.7x 5.3x (9)% 2% 96% 96%
Diamondback Energy O $105.96 $132.00 25% $9.6 $9.0 14.2x 8.6x 1.2x 0.5x 38% 40% 89% 89%
Energen O $55.74 $77.00 38% $5.4 $5.6 10.2x 6.6x 0.7x 0.4x 16% 32% 82% 82%
EP Energy N $5.04 $4.00 (21)% $1.3 $6.1 7.3x 7.0x 10.2x 9.8x (7)% 3% 75% 76%
EQT Corporation O $63.60 $84.00 32% $11.0 $11.7 6.9x 5.2x 0.6x 0.3x 9% 19% 10% 9%
Extraction Oil & Gas O $18.61 $25.00 34% $3.2 $3.1 9.4x 4.5x 1.7x 0.8x 61% 76% 67% 68%
Gulfport Energy O $17.23 $28.00 63% $2.7 $2.7 4.6x 3.3x 0.5x 0.4x 5% 41% 14% 11%
Laredo Petroleum U $14.83 $13.00 (12)% $3.6 $4.9 11.8x 9.7x 4.0x 3.3x 9% 18% 73% 73%
Newfield Exploration O $37.01 $49.00 32% $7.4 $9.2 8.7x 7.7x 2.1x 1.4x (10)% 13% 64% 67%
Oasis Petroleum N $14.29 $16.00 12% $3.4 $5.7 7.8x 5.9x 3.1x 2.4x 7% 16% 79% 78%
Parsley Energy O $31.72 $45.00 42% $8.9 $9.9 16.8x 9.5x 2.5x 1.4x 14% 56% 85% 85%
PDC Energy O $64.78 $79.00 22% $4.3 $5.1 8.2x 5.7x 1.7x 1.1x 6% 33% 64% 65%
Range Resources O $29.40 $39.00 33% $7.3 $11.1 9.9x 7.1x 3.8x 2.3x 7% 21% 33% 34%
Sanchez Energy N $9.57 $11.00 15% $0.8 $2.0 4.9x 3.3x 5.7x 2.8x 27% 27% 67% 68%
Southwestern Energy N $8.10 $13.00 60% $4.0 $8.6 8.5x 6.9x 4.4x 3.3x (8)% 11% 10% 11%
Synergy Resources O $8.79 $12.00 37% $1.8 $1.8 11.1x 6.8x 1.0x 0.8x 61% 52% 58% 56%
Whiting Petroleum O $9.60 $15.00 56% $3.5 $7.0 6.2x 4.9x 4.0x 2.9x (31)% 19% 85% 85%
Median 33% 8.7x 6.6x 2.5x 1.4x 7% 21% 73% 73%
Average 28% 9.1x 6.5x 3.1x 2.2x 11% 29% 63% 64%
EV/EBIDAX D/CF Production Per Share Growth Liquids Weight

13 A
pril 2
01
7
Can
ad
ian
Oil &
Gas
Sec
tor
50
Figure 85: North American Large Cap Relative Valuation
Source: Company data, Credit Suisse estimates
Price MC EV
North American Large Cap Rating 04/11/17 Target Upside US$BN US$BN 17E 18E 17E 18E 2016/17 2017/18
Anadarko Petroleum O $62.90 $85.00 35% $35.1 $47.3 7.5x 6.1x 2.0x 1.7x (22)% 16%
Antero Resources O $23.12 $36.00 56% $7.3 $12.0 9.1x 6.6x 4.1x 2.8x 15% 24%
Apache N $53.87 $70.00 30% $21.3 $28.5 8.2x 7.0x 2.4x 1.9x (9)% 19%
Canadian Natural Resources O $45.26 $52.00 15% $50.4 $67.1 8.6x 5.7x 2.9x 1.6x 13% 14%
Chesapeake Energy N $6.18 $6.00 -3% $5.6 $14.7 6.2x 4.8x 5.2x 3.1x (25)% 9%
Cenovus Energy R $14.71 R R R R R R R R R R
Concho Resources O $132.00 $158.00 20% $19.6 $22.2 12.5x 9.8x 1.6x 1.1x 12% 19%
Continental Resources N $46.96 $57.00 21% $17.6 $24.2 9.7x 7.1x 2.5x 1.6x 9% 19%
Devon Energy O $42.52 $59.00 39% $22.8 $31.0 8.6x 7.1x 2.6x 1.9x (12)% 9%
Encana O $12.06 $14.00 16% $11.7 $15.1 10.5x 5.7x 3.2x 1.4x (17)% 23%
EOG Resources N $97.88 $96.00 -2% $56.5 $61.9 12.1x 9.0x 0.9x 0.4x 4% 19%
Hess N $51.11 $67.00 31% $16.2 $20.3 8.7x 7.5x 2.6x 2.3x (7)% 20%
Husky Energy N $15.45 $17.00 10% $15.5 $20.2 5.2x 4.3x 1.4x 1.0x 5% 3%
Imperial Oil O $41.15 $50.00 22% $34.9 $40.2 9.8x 7.9x 0.9x 0.3x 10% 1%
Marathon Oil N $16.60 $20.00 20% $14.1 $18.8 6.9x 5.6x 2.0x 1.5x (6)% 8%
Murphy Oil U $28.38 $35.00 23% $4.9 $7.0 5.0x 4.2x 1.7x 1.5x (6)% 7%
Noble Energy O $35.24 $43.00 22% $15.1 $20.1 7.2x 6.1x 2.3x 1.8x (9)% 5%
Pioneer Natural Resources O $189.95 $220.00 16% $32.3 $33.4 13.7x 10.1x 0.6x 0.4x 16% 20%
Suncor Energy O $41.47 $48.00 16% $69.2 $84.1 7.4x 6.2x 1.1x 0.6x 9% 10%
Median 21% 8.6x 6.4x 2.1x 1.6x (1)% 15%
Average 21% 8.7x 6.7x 2.2x 1.5x (1)% 13%
EV/EBIDAX D/CF Production Per Share Growth

13 A
pril 2
01
7
Can
ad
ian
Oil &
Gas
Sec
tor
51
Figure 86: Global Majors Relative Valuation
Source: Company data, Credit Suisse estimates
Price MC EV
Global Integrated Rating 04/11/17 Target Upside US$BN US$BN 17E 18E 17E 18E 2016/17 2017/18
BP O 470.70 520.00 10% 115.7 150.3 6.4x 5.3x 2.2x 1.5x 2% 3%
Canadian Natural Resources O $45.26 $52.00 15% $50.4 $67.1 8.6x 5.7x 2.9x 1.6x 13% 14%
Chevron N $108.97 $120.00 10% $206.5 $245.5 8.6x 6.6x 1.3x 0.8x 6% 5%
Cenovus Energy R $14.71 R R R R R R R R R R
ConocoPhillips N $50.15 $60.00 20% $62.0 $85.7 8.1x 6.4x 1.9x 1.1x (16)% (0)%
ENI O 15.24 15.90 4% 58.7 75.4 6.1x 5.2x 1.3x 1.0x 5% 7%
ExxonMobil N $82.84 $83.00 0% $343.5 $382.6 9.8x 7.9x 0.9x 0.5x 0% 2%
Imperial Oil O $41.15 $50.00 22% $34.9 $40.2 9.8x 7.9x 0.9x 0.3x 10% 1%
OMV U 39.60 26.50 (33)% 13.7 16.8 4.0x 3.7x 0.6x 0.3x 3% 4%
Occidental Petroleum O $64.98 $79.00 22% $49.8 $57.4 11.0x 8.4x 1.4x 1.5x 1% 15%
Repsol N 14.86 13.60 (8)% 23.6 32.5 5.5x 4.8x 1.7x 1.4x (5)% 3%
Royal Dutch Shell O 2,142.00 2450.00 14% 184.4 257.7 5.6x 4.6x 1.9x 1.4x (3)% 0%
Statoil U 148.60 120.00 (19)% 56.5 75.9 4.8x 4.5x 1.3x 1.1x (1)% 4%
Suncor Energy O 41.47 48.00 16% 69.2 84.1 7.4x 6.2x 1.1x 0.6x 9% 10%
Total N 48.73 47.50 (3)% 127.8 155.6 7.3x 6.3x 1.0x 0.9x 4% 5%
Median 10% 7.4x 6.0x 1.3x 1.0x 2% 4%
Average 5% 7.4x 6.0x 1.5x 1.0x 2% 5%
EV/EBIDAX D/CF Production Per Share Growth

13 A
pril 2
01
7
Can
ad
ian
Oil &
Gas
Sec
tor
52
Figure 87: CDN Int'l and European E&P Relative Valuation
Source: Company data, Credit Suisse estimates
Figure 88: Credit Suisse Commodity Forecast Summary
Source: Company data, Credit Suisse estimates
Price MC EV
CDN Int'l and European E&P Rating 04/11/17 Target Upside $BN $BN 17E 18E 17E 18E 2016/17 2017/18
Africa Oil O $14.93 $18.50 24% $0.8 $0.3 N/A N/A 57.9x 46.6x 0% 0%
Aker BP O $141.20 $170.00 20% $5.5 $8.0 4.7x 4.6x 0.7x 0.5x 0% 0%
Cairn Energy O $206.40 $285.00 38% $1.5 $1.2 N/A 4.5x 0.5x 0.1x 0% 0%
Gran Tierra Energy O $2.81 $3.75 33% $1.1 $1.3 4.6x 3.5x 0.5x 0.3x 20% 17%
Lundin Petroleum U $187.70 $130.00 (31)% $7.1 $11.0 6.6x 5.6x 3.0x 2.2x 0% 0%
Nostrum Oil and Gas O $472.00 $535.00 13% $1.1 $2.0 8.6x 4.4x 4.2x 2.0x 0% 0%
Ophir Energy O $89.00 $110.00 24% $0.8 $0.6 6.5x 11.1x 0.0x 0.0x 0% 0%
Parex Resources O $17.89 $23.00 29% $2.1 $1.9 6.4x 5.0x 0.0x 0.0x 18% 20%
Premier Oil U $66.50 $60.00 (10)% $0.4 $3.2 4.6x 2.4x 3.9x 2.0x 0% 0%
TransGlobe Energy N $2.16 $2.75 27% $0.1 $0.2 3.7x 2.9x 1.2x 1.0x 51% 10%
Tullow Oil N $229.10 $205.00 (11)% $4.0 $8.7 6.9x 5.4x 3.3x 2.3x 0% 0%
Median 24% 6.4x 4.5x 1.2x 1.0x 0% 0%
Average 14% 5.9x 4.9x 6.8x 5.2x 8% 4%
EV/EBIDAX D/CF Production Per Share Growth
2017 2018 2019 LT
WTI (US$/bbl) $57 $63 $63 $63
NYMEX (US$/mmBTU) $3.44 $3.50 $3.25 $3.25
AECO minus NYMEX (US$/mmBTU) ($1.00) ($1.00) ($1.00) ($1.00)
FX (US$/C$) 0.75 0.78 0.78 0.78

13 April 2017
Canadian Oil & Gas Sector 53
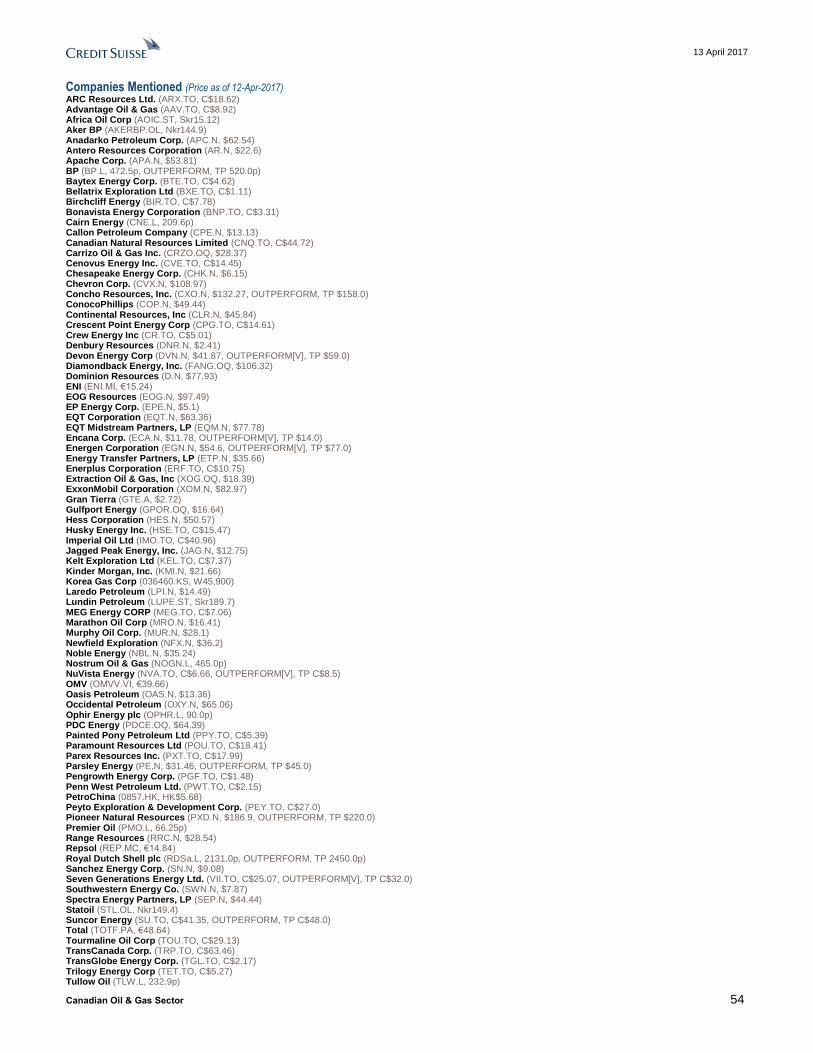
13 April 2017
Canadian Oil & Gas Sector 54
Companies Mentioned (Price as of 12-Apr-2017) ARC Resources Ltd. (ARX.TO, C$18.62) Advantage Oil & Gas (AAV.TO, C$8.92) Africa Oil Corp (AOIC.ST, Skr15.12) Aker BP (AKERBP.OL, Nkr144.9) Anadarko Petroleum Corp. (APC.N, $62.54) Antero Resources Corporation (AR.N, $22.6) Apache Corp. (APA.N, $53.81) BP (BP.L, 472.5p, OUTPERFORM, TP 520.0p) Baytex Energy Corp. (BTE.TO, C$4.62) Bellatrix Exploration Ltd (BXE.TO, C$1.11) Birchcliff Energy (BIR.TO, C$7.78) Bonavista Energy Corporation (BNP.TO, C$3.31) Cairn Energy (CNE.L, 209.6p) Callon Petroleum Company (CPE.N, $13.13) Canadian Natural Resources Limited (CNQ.TO, C$44.72) Carrizo Oil & Gas Inc. (CRZO.OQ, $28.37) Cenovus Energy Inc. (CVE.TO, C$14.45) Chesapeake Energy Corp. (CHK.N, $6.15) Chevron Corp. (CVX.N, $108.97) Concho Resources, Inc. (CXO.N, $132.27, OUTPERFORM, TP $158.0) ConocoPhillips (COP.N, $49.44) Continental Resources, Inc (CLR.N, $45.84) Crescent Point Energy Corp (CPG.TO, C$14.61) Crew Energy Inc (CR.TO, C$5.01) Denbury Resources (DNR.N, $2.41) Devon Energy Corp (DVN.N, $41.87, OUTPERFORM[V], TP $59.0) Diamondback Energy, Inc. (FANG.OQ, $106.32) Dominion Resources (D.N, $77.93) ENI (ENI.MI, €15.24) EOG Resources (EOG.N, $97.49) EP Energy Corp. (EPE.N, $5.1) EQT Corporation (EQT.N, $63.36) EQT Midstream Partners, LP (EQM.N, $77.78) Encana Corp. (ECA.N, $11.78, OUTPERFORM[V], TP $14.0) Energen Corporation (EGN.N, $54.6, OUTPERFORM[V], TP $77.0) Energy Transfer Partners, LP (ETP.N, $35.66) Enerplus Corporation (ERF.TO, C$10.75) Extraction Oil & Gas, Inc (XOG.OQ, $18.39) ExxonMobil Corporation (XOM.N, $82.97) Gran Tierra (GTE.A, $2.72) Gulfport Energy (GPOR.OQ, $16.64) Hess Corporation (HES.N, $50.57) Husky Energy Inc. (HSE.TO, C$15.47) Imperial Oil Ltd (IMO.TO, C$40.96) Jagged Peak Energy, Inc. (JAG.N, $12.75) Kelt Exploration Ltd (KEL.TO, C$7.37) Kinder Morgan, Inc. (KMI.N, $21.66) Korea Gas Corp (036460.KS, W45,900) Laredo Petroleum (LPI.N, $14.49) Lundin Petroleum (LUPE.ST, Skr189.7) MEG Energy CORP (MEG.TO, C$7.06) Marathon Oil Corp (MRO.N, $16.41) Murphy Oil Corp. (MUR.N, $28.1) Newfield Exploration (NFX.N, $36.2) Noble Energy (NBL.N, $35.24) Nostrum Oil & Gas (NOGN.L, 465.0p) NuVista Energy (NVA.TO, C$6.66, OUTPERFORM[V], TP C$8.5) OMV (OMVV.VI, €39.66) Oasis Petroleum (OAS.N, $13.36) Occidental Petroleum (OXY.N, $65.06) Ophir Energy plc (OPHR.L, 90.0p) PDC Energy (PDCE.OQ, $64.39) Painted Pony Petroleum Ltd (PPY.TO, C$5.39) Paramount Resources Ltd (POU.TO, C$18.41) Parex Resources Inc. (PXT.TO, C$17.99) Parsley Energy (PE.N, $31.46, OUTPERFORM, TP $45.0) Pengrowth Energy Corp. (PGF.TO, C$1.48) Penn West Petroleum Ltd. (PWT.TO, C$2.15) PetroChina (0857.HK, HK$5.68) Peyto Exploration & Development Corp. (PEY.TO, C$27.0) Pioneer Natural Resources (PXD.N, $186.9, OUTPERFORM, TP $220.0) Premier Oil (PMO.L, 66.25p) Range Resources (RRC.N, $28.54) Repsol (REP.MC, €14.84) Royal Dutch Shell plc (RDSa.L, 2131.0p, OUTPERFORM, TP 2450.0p) Sanchez Energy Corp. (SN.N, $9.08) Seven Generations Energy Ltd. (VII.TO, C$25.07, OUTPERFORM[V], TP C$32.0) Southwestern Energy Co. (SWN.N, $7.87) Spectra Energy Partners, LP (SEP.N, $44.44) Statoil (STL.OL, Nkr149.4) Suncor Energy (SU.TO, C$41.35, OUTPERFORM, TP C$48.0) Total (TOTF.PA, €48.64) Tourmaline Oil Corp (TOU.TO, C$29.13) TransCanada Corp. (TRP.TO, C$63.46) TransGlobe Energy Corp. (TGL.TO, C$2.17) Trilogy Energy Corp (TET.TO, C$5.27) Tullow Oil (TLW.L, 232.9p)

13 April 2017
Canadian Oil & Gas Sector 55
Vermilion Energy Inc. (VET.TO, C$50.5) Whiting Petroleum Corp. (WLL.N, $8.93) Williams Partners, LP (WPZ.N, $41.13)
Disclosure Appendix
Analyst Certification Jason Frew, David Phung, Andrew M. Kuske, Paul Tan, Edward Westlake, Mark Lear, CFA and Thomas Adolff each certify, with respect to the companies or securities that the individual analyzes, that (1) the views expressed in this report accurately reflect his or her personal views about all of the subject companies and securities and (2) no part of his or her compensation was, is or will be directly or indirectly related to the specific recommendations or views expressed in this report.
3-Year Price and Rating History for BP (BP.L)
BP.L Closing Price Target Price
Date (p) (p) Rating
23-Apr-14 485.85 495.00 N
11-Jul-14 503.80 505.00
22-Oct-14 434.25 470.00
05-Dec-14 424.50 440.00
27-Jan-15 440.60 415.00 U
05-Feb-15 450.10 420.00
28-Jul-15 392.65 410.00
08-Sep-15 340.20 350.00
27-Oct-15 380.00 365.00
26-Jan-16 356.50 340.00
02-Feb-16 335.10 330.00
19-May-16 356.00 R
04-Jul-16 446.80 430.00 N
01-Nov-16 462.05 480.00
30-Nov-16 459.45 500.00 O
22-Dec-16 503.00 530.00
07-Feb-17 457.10 510.00
01-Mar-17 464.60 520.00
* Asterisk signifies initiation or assumption of coverage.
N EU T RA L
U N D ERPERFO RM
REST RICT ED
O U T PERFO RM
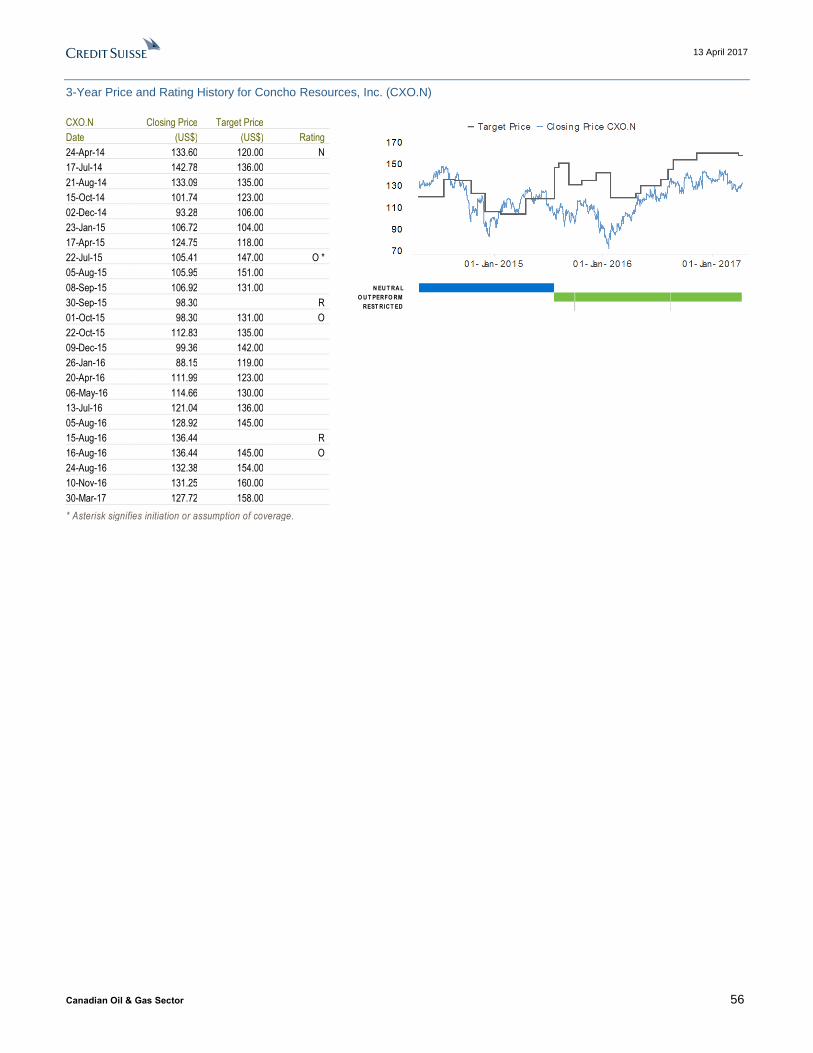
13 April 2017
Canadian Oil & Gas Sector 56
3-Year Price and Rating History for Concho Resources, Inc. (CXO.N)
CXO.N Closing Price Target Price
Date (US$) (US$) Rating
24-Apr-14 133.60 120.00 N
17-Jul-14 142.78 136.00
21-Aug-14 133.09 135.00
15-Oct-14 101.74 123.00
02-Dec-14 93.28 106.00
23-Jan-15 106.72 104.00
17-Apr-15 124.75 118.00
22-Jul-15 105.41 147.00 O *
05-Aug-15 105.95 151.00
08-Sep-15 106.92 131.00
30-Sep-15 98.30 R
01-Oct-15 98.30 131.00 O
22-Oct-15 112.83 135.00
09-Dec-15 99.36 142.00
26-Jan-16 88.15 119.00
20-Apr-16 111.99 123.00
06-May-16 114.66 130.00
13-Jul-16 121.04 136.00
05-Aug-16 128.92 145.00
15-Aug-16 136.44 R
16-Aug-16 136.44 145.00 O
24-Aug-16 132.38 154.00
10-Nov-16 131.25 160.00
30-Mar-17 127.72 158.00
* Asterisk signifies initiation or assumption of coverage.
N EU T RA L
O U T PERFO RM
REST RICT ED
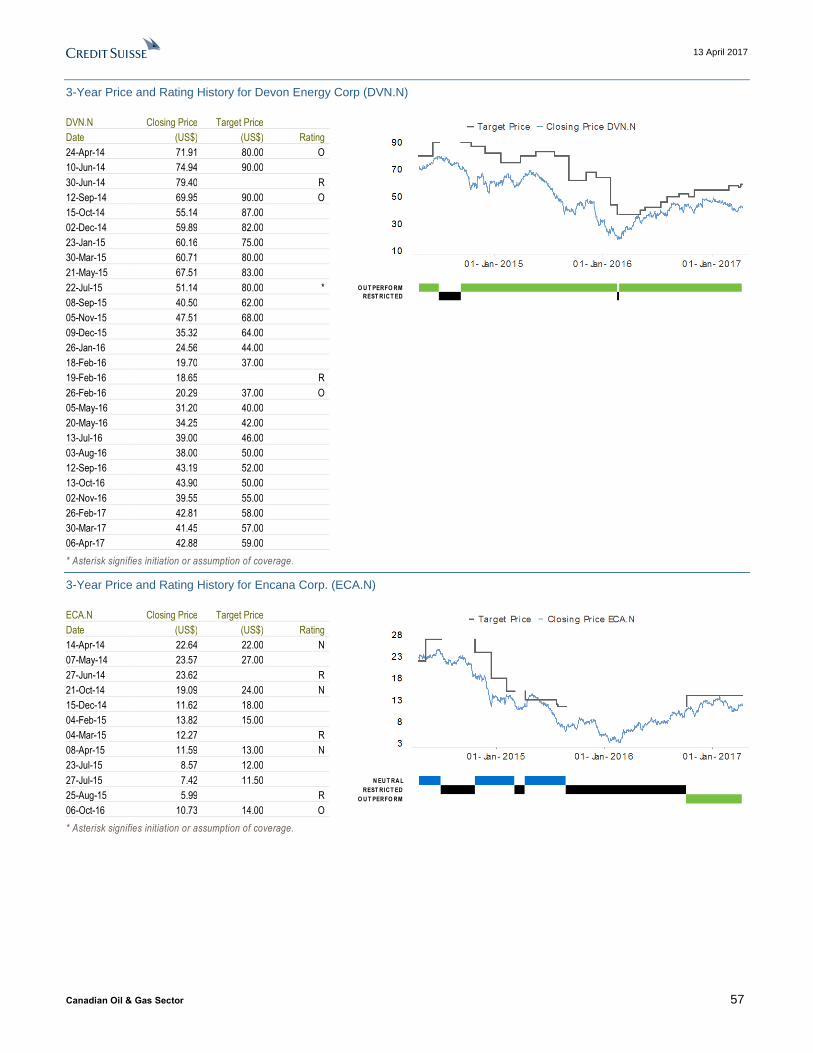
13 April 2017
Canadian Oil & Gas Sector 57
3-Year Price and Rating History for Devon Energy Corp (DVN.N)
DVN.N Closing Price Target Price
Date (US$) (US$) Rating
24-Apr-14 71.91 80.00 O
10-Jun-14 74.94 90.00
30-Jun-14 79.40 R
12-Sep-14 69.95 90.00 O
15-Oct-14 55.14 87.00
02-Dec-14 59.89 82.00
23-Jan-15 60.16 75.00
30-Mar-15 60.71 80.00
21-May-15 67.51 83.00
22-Jul-15 51.14 80.00 *
08-Sep-15 40.50 62.00
05-Nov-15 47.51 68.00
09-Dec-15 35.32 64.00
26-Jan-16 24.56 44.00
18-Feb-16 19.70 37.00
19-Feb-16 18.65 R
26-Feb-16 20.29 37.00 O
05-May-16 31.20 40.00
20-May-16 34.25 42.00
13-Jul-16 39.00 46.00
03-Aug-16 38.00 50.00
12-Sep-16 43.19 52.00
13-Oct-16 43.90 50.00
02-Nov-16 39.55 55.00
26-Feb-17 42.81 58.00
30-Mar-17 41.45 57.00
06-Apr-17 42.88 59.00
* Asterisk signifies initiation or assumption of coverage.
O U T PERFO RM
REST RICT ED
3-Year Price and Rating History for Encana Corp. (ECA.N)
ECA.N Closing Price Target Price
Date (US$) (US$) Rating
14-Apr-14 22.64 22.00 N
07-May-14 23.57 27.00
27-Jun-14 23.62 R
21-Oct-14 19.09 24.00 N
15-Dec-14 11.62 18.00
04-Feb-15 13.82 15.00
04-Mar-15 12.27 R
08-Apr-15 11.59 13.00 N
23-Jul-15 8.57 12.00
27-Jul-15 7.42 11.50
25-Aug-15 5.99 R
06-Oct-16 10.73 14.00 O
* Asterisk signifies initiation or assumption of coverage.
N EU T RA L
REST RICT ED
O U T PERFO RM

13 April 2017
Canadian Oil & Gas Sector 58
3-Year Price and Rating History for Energen Corporation (EGN.N)
EGN.N Closing Price Target Price
Date (US$) (US$) Rating
17-Feb-16 24.03 R
01-Apr-16 37.23 43.00 O
20-Apr-16 40.81 45.00
06-May-16 40.19 48.00
21-Jun-16 49.24 57.00
13-Jul-16 48.50 59.00
10-Aug-16 51.86 65.00
13-Oct-16 58.24 67.00
08-Nov-16 53.80 70.00
21-Nov-16 58.54 75.00
31-Jan-17 53.89 76.00
24-Feb-17 51.75 78.00
30-Mar-17 53.83 77.00
* Asterisk signifies initiation or assumption of coverage.
REST RICT ED
O U T PERFO RM
3-Year Price and Rating History for NuVista Energy (NVA.TO)
NVA.TO Closing Price Target Price
Date (C$) (C$) Rating
16-Apr-15 8.56 11.00 O *
23-Jul-15 5.67 8.75
09-Sep-15 5.02 7.00
10-Nov-15 4.52 6.75
09-Dec-15 3.75 5.50
28-Jan-16 4.30 5.25
09-Mar-16 4.82 5.75
12-May-16 6.29 6.25
14-Jul-16 6.69 8.50
10-Aug-16 6.67 9.00
11-Oct-16 7.10 R
31-Oct-16 6.82 9.50 O
31-Mar-17 6.15 8.50
* Asterisk signifies initiation or assumption of coverage.
O U T PERFO RM
REST RICT ED

13 April 2017
Canadian Oil & Gas Sector 59
3-Year Price and Rating History for Parsley Energy (PE.N)
PE.N Closing Price Target Price
Date (US$) (US$) Rating
17-Jun-14 22.59 31.00 O *
17-Jul-14 23.35 32.00
21-Aug-14 20.08 31.00
15-Oct-14 17.18 29.00
02-Dec-14 12.96 20.00
23-Jan-15 16.83 19.00
17-Apr-15 16.43 20.00
22-Jul-15 15.39 21.00 *
20-Aug-15 15.11 23.00
17-Sep-15 16.54 R
18-Sep-15 15.79 21.00 O
06-Nov-15 18.13 22.00
09-Dec-15 18.86 R
10-Dec-15 18.86 23.00 O
26-Jan-16 17.57 22.00
01-Mar-16 18.93 25.00
20-Apr-16 23.60 27.00
06-May-16 23.81 28.00
23-May-16 25.07 R
24-May-16 25.35 28.00 O
13-Jul-16 28.04 31.00
05-Aug-16 32.50 42.00
13-Oct-16 36.26 41.00
04-Nov-16 33.17 42.00
10-Jan-17 36.67 R
11-Jan-17 36.67 42.00 O
12-Jan-17 36.48 45.00
07-Feb-17 33.33 R
08-Feb-17 31.04 46.00 O
30-Mar-17 31.90 45.00
* Asterisk signifies initiation or assumption of coverage.
O U T PERFO RM
REST RICT ED

13 April 2017
Canadian Oil & Gas Sector 60
3-Year Price and Rating History for Pioneer Natural Resources (PXD.N)
PXD.N Closing Price Target Price
Date (US$) (US$) Rating
24-Apr-14 197.32 215.00 O
17-Jul-14 222.58 251.00
21-Aug-14 205.95 250.00
15-Oct-14 171.58 230.00
02-Dec-14 146.37 190.00
23-Jan-15 152.86 170.00
17-Apr-15 177.93 187.00
22-Jul-15 125.00 186.00 *
06-Aug-15 128.27 189.00
08-Sep-15 121.70 150.00
22-Oct-15 136.89 157.00
04-Nov-15 144.92 170.00
09-Dec-15 143.10 179.00
26-Jan-16 113.54 143.00
20-Apr-16 154.73 168.00
26-Apr-16 165.36 183.00
15-Jun-16 162.50 R
16-Jun-16 162.50 183.00 O
21-Jun-16 157.03 199.00
13-Jul-16 154.16 202.00
29-Jul-16 162.57 212.00
03-Nov-16 173.17 216.00
24-Jan-17 180.75 217.00
09-Feb-17 191.59 221.00
30-Mar-17 182.48 220.00
* Asterisk signifies initiation or assumption of coverage.
O U T PERFO RM
REST RICT ED
3-Year Price and Rating History for Royal Dutch Shell plc (RDSa.L)
RDSa.L Closing Price Target Price
Date (p) (p) Rating
23-Apr-14 2247.00 2450.00 O
02-May-14 2354.00 2550.00
11-Jul-14 2389.50 2600.00
04-Aug-14 2414.00 2700.00
22-Oct-14 2185.50 2625.00
07-Nov-14 2230.50 2660.00
05-Dec-14 2149.00 2500.00
27-Jan-15 2191.00 2380.00
30-Jan-15 2018.00 2350.00
09-Apr-15 2004.00 2250.00
21-Apr-15 2100.00 2310.00
30-Apr-15 2059.50 2325.00
31-Jul-15 1840.00 2400.00
08-Sep-15 1629.50 2175.00
29-Oct-15 1711.50 2125.00
26-Jan-16 1422.50 1970.00
08-Jun-16 1800.00 2070.00
28-Jul-16 1984.50 2150.00
01-Nov-16 2115.00 2325.00
03-Feb-17 2193.00 2450.00
* Asterisk signifies initiation or assumption of coverage.
O U T PERFO RM

13 April 2017
Canadian Oil & Gas Sector 61
3-Year Price and Rating History for Seven Generations Energy Ltd. (VII.TO)
VII.TO Closing Price Target Price
Date (C$) (C$) Rating
09-Dec-14 17.94 23.50 O *
04-Feb-15 18.41 21.00
22-Apr-15 19.66 R
24-Apr-15 20.65 21.00 O
22-Jul-15 14.85 21.00 *
10-Aug-15 14.45 23.00 *
09-Sep-15 12.65 19.50
09-Nov-15 13.76 20.00
09-Dec-15 14.18 19.50
09-Feb-16 14.38 R
03-Mar-16 17.00 19.50 O
09-Mar-16 18.00 22.00
04-May-16 22.69 26.00
06-Jul-16 25.10 R
22-Aug-16 29.05 35.00 O
31-Mar-17 24.30 32.00
* Asterisk signifies initiation or assumption of coverage.
O U T PERFO RM
REST RICT ED
3-Year Price and Rating History for Suncor Energy (SU.TO)
SU.TO Closing Price Target Price
Date (C$) (C$) Rating
21-Apr-14 40.41 48.00 O
14-Jul-14 44.99 52.00
30-Sep-14 40.53 50.00
21-Oct-14 38.86 45.00
04-Feb-15 37.49 44.00
08-Apr-15 38.84 46.00
23-Jul-15 33.65 45.00
09-Sep-15 34.77 43.00
31-Jan-16 33.18 38.00
21-Apr-16 36.06 41.00
18-Jul-16 36.19 42.00
24-Oct-16 39.33 44.00
05-Dec-16 43.09 48.00
* Asterisk signifies initiation or assumption of coverage.
O U T PERFO RM
The analyst(s) responsible for preparing this research report received Compensation that is based upon various factors including Credit Suisse's total revenues, a portion of which are generated by Credit Suisse's investment banking activities
As of December 10, 2012 Analysts’ stock rating are defined as follows: Outperform (O) : The stock’s total return is expected to outperform the relevant benchmark* over the next 12 months. Neutral (N) : The stock’s total return is expected to be in line with the relevant benchmark* over the next 12 months. Underperform (U) : The stock’s total return is expected to underperform the relevant benchmark* over the next 12 months. *Relevant benchmark by region: As of 10th December 2012, Japanese ratings are based on a stock’s total return relative to the analyst's coverage universe which consists of all companies covered by the analyst within the relevant sector, with Outperforms representing the most attractive, Neutrals the less att ractive, and Underperforms the least attractive investment opportunities. As of 2nd October 2012, U.S. and Canadian as well as Euro pean ratings are based on a stock’s total return relative to the analyst's coverage universe which consists of all companies covered by the analyst within the relevant sector, with Outperforms representing the most attractive, Neutrals the less attractive, and Underperforms the least attractive investment opportunities. For Latin American and non-Japan Asia stocks, ratings are based on a stock’s total return relative to the average total return of the relevant country or regional benchmark; prior to 2nd October 2012 U.S. and Canadian ratings were based on (1) a stock’s absolute total return potential to its current share price and (2) the relative attractiv eness of a stock’s total return potential within an analyst’s coverage universe. For Australian and New Zealand stocks, the expected total return (ETR) calculation includes 12-month rolling dividend yield. An Outperform rating is assigned where an ETR is greater than or equal to 7.5%; Underperform where an ETR less than or equal to 5%. A Neutral may be assigned where the ETR is between -5% and 15%. The overlapping rating range allows analysts to assign a rating that puts ETR in the context of associated risks. Prior to 18 May 2015, ETR ranges for Outperform and Underperform ratings did not overlap with Neutral thresholds between 15% and 7.5%, which was in operation from 7 July 2011. Restricted (R) : In certain circumstances, Credit Suisse policy and/or applicable law and regulations preclude certain types of communications, including an investment recommendation, during the course of Credit Suisse's engagement in an investment banking transaction and in certain other circumstances. Not Rated (NR) : Credit Suisse Equity Research does not have an investment rating or view on the stock or any other securities related to the company at this time.

13 April 2017
Canadian Oil & Gas Sector 62
Not Covered (NC) : Credit Suisse Equity Research does not provide ongoing coverage of the company or offer an investment rating or investment view on the equity security of the company or related products.
Volatility Indicator [V] : A stock is defined as volatile if the stock price has moved up or down by 20% or more in a month in at least 8 of the past 24 months or the analyst expects significant volatility going forward.
Analysts’ sector weightings are distinct from analysts’ stock ratings and are based on the analyst’s expectations for the fundamentals and/or valuation of the sector* relative to the group’s historic fundamentals and/or valuation: Overweight : The analyst’s expectation for the sector’s fundamentals and/or valuation is favorable over the next 12 months. Market Weight : The analyst’s expectation for the sector’s fundamentals and/or valuation is neutral over the next 12 months. Underweight : The analyst’s expectation for the sector’s fundamentals and/or valuation is cautious over the next 12 months. *An analyst’s coverage sector consists of all companies covered by the analyst within the relevant sector. An analyst may cover multiple sectors.
Credit Suisse's distribution of stock ratings (and banking clients) is:
Global Ratings Distribution
Rating Versus universe (%) Of which banking clients (%) Outperform/Buy* 45% (64% banking clients) Neutral/Hold* 39% (61% banking clients) Underperform/Sell* 14% (54% banking clients) Restricted 2% *For purposes of the NYSE and FINRA ratings distribution disclosure requirements, our stock ratings of Outperform, Neutral, and Underperform most closely correspond to Buy, Hold, and Sell, respectively; however, the meanings are not the same, as our stock ratings are determin ed on a relative basis. (Please refer to definitions above.) An investor's decision to buy or sell a security should be based on investment objectives, current holdin gs, and other individual factors.
Important Global Disclosures Credit Suisse’s research reports are made available to clients through our proprietary research portal on CS PLUS. Credit Suisse research products may also be made available through third-party vendors or alternate electronic means as a convenience. Certain research products are only made available through CS PLUS. The services provided by Credit Suisse’s analysts to clients may depend on a specific client’s preferences regarding the frequency and manner of receiving communications, the client’s risk profile and investment, the size and scope of the overall client relationship with the Firm, as well as legal and regulatory constraints. To access all of Credit Suisse’s research that you are entitled to receive in the most timely manner, please contact your sales representative or go to https://plus.credit-suisse.com . Credit Suisse’s policy is to update research reports as it deems appropriate, based on developments with the subject company, the sector or the market that may have a material impact on the research views or opinions stated herein. Credit Suisse's policy is only to publish investment research that is impartial, independent, clear, fair and not misleading. For more detail please refer to Credit Suisse's Policies for Managing Conflicts of Interest in connection with Investment Research: https://www.credit-suisse.com/sites/disclaimers-ib/en/managing-conflicts.html . Credit Suisse does not provide any tax advice. Any statement herein regarding any US federal tax is not intended or written to be used, and cannot be used, by any taxpayer for the purposes of avoiding any penalties.
Target Price and Rating Valuation Methodology and Risks: (12 months) for BP (BP.L)
Method: We set our TP based on our DCF valuation and comparative multiples. It is a 50/50 weighted valuation approach. Our DCF valuation derives a value of ~520p/share, which is based on a nominal WACC of 7.5%. Our preferred comparative multiple is EV/DACF, which gives us a value of ~515p/share. Combining the two we get to a rounded value of ~520p/share, which implies an EV/DACF of 6.5x on mid-cycle earnings. Our Outperform rating is because it has relatively more upside than peers.
Risk: Key risks to our 520p target price and Outperform rating include commodity prices, refining margins, delays and cost overruns on development projects.
Target Price and Rating Valuation Methodology and Risks: (12 months) for Concho Resources, Inc. (CXO.N)
Method: Our $158 price target for CXO is based on our proved developed plus projects net asset value (NAV) estimate, which is based on long-term prices of $62.50 per barrel oil and $3.25 per million Btu (MMBtu). Our NAV is derived from our discounted cash flow model, which values total proved developed reserves (395 million barrels of oil equivalent or MMBoe) at $18 per barrel of oil equivalent (Boe) to which we assign an NAV of $40 per share net of debt. To this estimate we add another $118 per share for undeveloped and unbooked reserves totalling 3,405 MMBoe. Our Outperform Rating is a function of total shareholder return over the next twelve months and the relative risk/reward versus our coverage universe.
Risk: Risks to achievement of our $158 target price and Outperform rating for CXO are (1) a protracted downturn in oil and gas prices would impact the company's ability to grow within cash flow and deliver the current long-term growth plan, (2) higher than expected decline rates in producing wells, (3) rising well costs.
Target Price and Rating Valuation Methodology and Risks: (12 months) for Devon Energy Corp (DVN.N)
Method: Our 12-month Target Price for Devon Energy is $59 per share, which assumes the stock trades at parity with our net asset value (NAV) estimate. Our NAV is based on the company's proved developed reserves and our estimate of undeveloped reserves that the company
13 April 2017
Canadian Oil & Gas Sector 63
will exploit over the next 5 years. Our OUTPERFORM rating is a function of total shareholder return over the next twelve months and the relative risk/reward versus our coverage universe.
Risk: DVN faces a number of risks that could prevent the stock from reaching our $59 target price and Outperform rating including; DVN has oil sands operations in Canada, that could be adversely affected with changes in Canadian Royalty and/or environmental regulations. In general, DVN and oil and gas companies are subject to changes in global commodity supply/demand, accidents, equipment malfunctions, as well as a number of geological related issues that could adversely affect the company's ability to conduct its operations as planned.
Target Price and Rating Valuation Methodology and Risks: (12 months) for Encana Corp. (ECA.N)
Method: Our rating and valuation for Canadian oil and gas producers reflect our fundamental analysis of potential cash flows, balance sheet strength and growth potential. Our Outperform rating for ECA aligns with our view of the company's competitive position within the sector. More specifically, our 12-month target of US$14 is in line with our PD Plus NAV and equates to 6.4x 2018e EBIDAX.
Risk: The risk factors that could cause us to review our Outperform rating and 12-month target price of US$14 for ECA include: (1) financial performance is dependent on oil and gas prices and the value of the Canadian dollar, all of which are volatile; (2) operating and capital costs could reflect market conditions that are different than currently forecast; (3) the uncertain nature of regulatory requirements, fiscal terms, and weather conditions (4) availability of capital, and; (5) changes to strategy and management.
Target Price and Rating Valuation Methodology and Risks: (12 months) for Energen Corporation (EGN.N)
Method: Our $77 price target and Outperform rating for EGN is based on our proved developed plus projects net asset value (NAV) estimate, which is based on long-term prices of $62.50 per barrel oil and $3.25 per million Btu (MMBtu). Our NAV is derived from our discounted cash flow model, which values total proved developed reserves (161 million barrels of oil equivalent or MMBoe) at $17 per barrel of oil equivalent (Boe) to which we assign an NAV of $24 per share net of debt. To this estimate we add another $53 per share for undeveloped and unbooked reserves totaling 1,069 MMBoe. Our Outperform Rating is a function of total shareholder return over the next twelve months and the relative risk/reward versus our coverage universe.
Risk: Risks to achievement of our $77 target price and Outperform rating for EGN include: (1) a protracted downturn in oil and gas prices, (2) higher than expected decline rates in producing wells, (3) rising well costs, and (4) infrastructure constraints that would impede EGN from getting its production to market.
Target Price and Rating Valuation Methodology and Risks: (12 months) for NuVista Energy (NVA.TO)
Method: For North American E&P companies, Credit Suisse utilizes a PD Plus NAV methodology that combines proved developed reserves, balance sheet and our expectation of value that may be converted over a six year drilling program, after taking into consideration funding and infrastructure requirements, balance sheet quality and anticipated cash flows, as well as non-E&P and other assets. Our PD Plus NAV methodology yields a target price of C$8.50 for NuVista. Our Outperform rating reflects an asset portfolio that is at the low end of the cost curve in the Montney, despite low commodity prices, and a reasonably strong balance sheet that provides for flexibility, among other considerations.
Risk: Risks to our C$8.50 target price and Outperform rating for NuVista include, but are not limited to: (1) operations risk - financial performance is dependent on oil and gas production, which is dependent on operations execution; (2) exploration risk - there is no guarantee of exploration success should the company decide to conduct step-out drilling or appraise new discoveries; (3) commodity pricing risk - underlying asset values are dependent on commodity prices, which can be volatile.
Target Price and Rating Valuation Methodology and Risks: (12 months) for Parsley Energy (PE.N)
Method: Our $45 price target for PE and our rating are based on our proved developed plus projects net asset value (NAV) estimate, which is based on long-term prices of $62.50 per barrel oil and $3.25 per million Btu (MMBtu). Our NAV is derived from our discounted cash flow model, which values total proved developed reserves (106 million barrels of oil equivalent or MMBoe) at $22 per barrel of oil equivalent (Boe) to which we assign an NAV of $3 per share net of debt. To this estimate we add another $42 per share for undeveloped and unbooked reserves totalling 2,141 MMBoe. Our Outperform Rating is a function of total shareholder return over the next twelve months and the relative risk/reward versus our coverage universe.
Risk: Risks to achievement of our $45 target price and Outperform rating for PE are (1) a protracted downturn in oil and gas prices, (2) delays and lower recovery factors than projected in PE's heavy oil recovery projects, (3) higher than expected decline rates in producing wells, (4) rising well costs, and (5) infrastructure constraints that would impede PE from getting its production to market.
Target Price and Rating Valuation Methodology and Risks: (12 months) for Pioneer Natural Resources (PXD.N)
Method: Our $220 price target and Outperform rating for PXD is based on our proved developed plus projects net asset value (NAV) estimate, which is based on long-term prices of $62.5 per barrel oil and $3.25 per million Btu (MMBtu). Our NAV is derived from our discounted

13 April 2017
Canadian Oil & Gas Sector 64
cash flow model, which values total proved developed reserves (675 million barrels of oil equivalent or MMBoe) at $17 per barrel of oil equivalent (Boe) to which we assign an NAV of $61 per share net of debt. To this estimate we add another $159 per share for undeveloped and unbooked reserves totalling 4,881 MMBoe. Our Outperform Rating is a function of total shareholder return over the next twelve months and the relative risk/reward versus our coverage universe.
Risk: Risks to achievement of our $220 target price and Outperform rating for PXD are (1) a protracted downturn in oil and gas prices, (2) delays and lower recovery factors than projected in PXD's heavy oil recovery projects, (3) higher than expected decline rates in producing wells, (4) rising well costs, and (5) infrastructure constraints that would impede PXD from getting its production to market.
Target Price and Rating Valuation Methodology and Risks: (12 months) for Royal Dutch Shell plc (RDSa.L)
Method: We set our TP based on our DCF valuation and comparative multiples. We weight these two metrics 50/50. Our DCF using a nominal WACC of ~7.5% derives a value of ~2450p/share. Our preferred comparative multiple is EV/DACF. Our TP of 2450p/share implies a 2017-2019E EV/DACF of ~7.5x. We are Outperform on the stock because we see one of the biggest upside in the sector; we think the stock is misunderstood and believe the dividend is affordable and sustainable.
Risk: Key risks to our 2450p/share target price and Outperform rating are commodity prices, refining margins, delays and cost overruns on development projects. RDS may see a worsening in the cash flow leak (eg Nigeria onshore, higher maintenance activities, LNG marketing uncertainty).
Target Price and Rating Valuation Methodology and Risks: (12 months) for Seven Generations Energy Ltd. (VII.TO)
Method: For North American E&P companies, Credit Suisse utilizes a PD Plus NAV methodology that combines proved developed reserves, balance sheet and our expectation of value that may be converted over an eight year drilling program, after taking into consideration funding and infrastructure requirements, balance sheet quality and anticipated cash flows, as well as non-E&P and other assets. Our PD Plus NAV methodology yields a target price of C$32 for Seven Generations. Our Outperform rating reflects the company's condensate rich Montney assets that are at the low end of the cost curve in North America, improving well results that lead to higher capital efficiency and good execution to date, among other considerations.
Risk: Risks to our C$32 target price and Outperform rating for Seven Generations include, but are not limited to: (1) operations risk - financial performance is dependent on oil and gas production, which is dependent on operations execution; (2) exploration risk - there is no guarantee of exploration success should the company decide to conduct step-out drilling or appraise new discoveries; (3) commodity pricing risk - underlying asset values are dependent on commodity prices, which can be volatile.
Target Price and Rating Valuation Methodology and Risks: (12 months) for Suncor Energy (SU.TO)
Method: Our rating and valuation for Canadian oil and gas producers reflect our fundamental analysis of potential cash flows, balance sheet strength and growth potential. Our Outperform rating for SU.TO aligns with our view of the company's competitive position within the sector. More specifically, our 12-month target of C$48 equates to 7.3x 2018e EBIDAX, in line with peers.
Risk: The risk factors that could cause us to review our Outperform rating and 12-month target price of C$48 for SU.TO include: (1) financial performance is dependent on oil and gas prices and the value of the Canadian dollar, all of which are volatile; (2) operating and capital costs could reflect market conditions that are different than currently forecast; (3) the uncertain nature of regulatory requirements, fiscal terms, and weather conditions; (4) availability of capital, and; (5) changes to strategy and management.
Please refer to the firm's disclosure website at https://rave.credit-suisse.com/disclosures/view/selectArchive for the definitions of abbreviations typically used in the target price method and risk sections.
See the Companies Mentioned section for full company names The subject company (BP.L, ECA.N, SU.TO, VII.TO, RDSa.L, PE.N, PXD.N, CXO.N, DVN.N, NVA.TO, EGN.N, XOG.OQ, VET.TO, CPG.TO, POU.TO, KEL.TO, CRZO.OQ, PWT.TO, CR.TO, NFX.N, BXE.TO, PDCE.OQ, MEG.TO, HSE.TO, IMO.TO, CVE.TO, OPHR.L, TLW.L, PMO.L, NOGN.L, HES.N, MUR.N, APA.N, AR.N, CHK.N, CLR.N, CPE.N, DNR.N, EOG.N, EPE.N, EQT.N, FANG.OQ, GPOR.OQ, LPI.N, MRO.N, SN.N, NBL.N, OAS.N, RRC.N, SWN.N, OMVV.VI, OXY.N, TOTF.PA, REP.MC, STL.OL, ENI.MI, COP.N, CVX.N, XOM.N, TRP.TO, 0857.HK, D.N, EQM.N, ETP.N, SEP.N, WPZ.N, JAG.N, KMI.N, APC.N, ERF.TO, GTE.A, TOU.TO) currently is, or was during the 12-month period preceding the date of distribution of this report, a client of Credit Suisse. Credit Suisse provided investment banking services to the subject company (BP.L, ECA.N, VII.TO, RDSa.L, PE.N, PXD.N, CXO.N, DVN.N, NVA.TO, EGN.N, XOG.OQ, NFX.N, PDCE.OQ, MEG.TO, IMO.TO, CVE.TO, AR.N, CHK.N, CPE.N, DNR.N, EPE.N, EQT.N, FANG.OQ, GPOR.OQ, LPI.N, OAS.N, RRC.N, SWN.N, OXY.N, TOTF.PA, STL.OL, ENI.MI, COP.N, XOM.N, TRP.TO, D.N, EQM.N, ETP.N, SEP.N, WPZ.N, JAG.N, KMI.N, APC.N, TOU.TO) within the past 12 months. Credit Suisse provided non-investment banking services to the subject company (BP.L, RDSa.L, VET.TO, CHK.N, EPE.N, EQT.N, MRO.N, TOTF.PA, REP.MC, STL.OL, ENI.MI, XOM.N, TRP.TO, 0857.HK, D.N, EQM.N, ETP.N, WPZ.N, APC.N) within the past 12 months Credit Suisse has managed or co-managed a public offering of securities for the subject company (BP.L, ECA.N, VII.TO, PE.N, PXD.N, CXO.N, NVA.TO, XOG.OQ, MEG.TO, IMO.TO, CVE.TO, AR.N, CPE.N, EQT.N, FANG.OQ, GPOR.OQ, LPI.N, OAS.N, SWN.N, TOTF.PA, XOM.N, TRP.TO, D.N, ETP.N, WPZ.N) within the past 12 months.

13 April 2017
Canadian Oil & Gas Sector 65
Credit Suisse has received investment banking related compensation from the subject company (BP.L, ECA.N, VII.TO, RDSa.L, PE.N, PXD.N, CXO.N, DVN.N, NVA.TO, EGN.N, XOG.OQ, NFX.N, PDCE.OQ, MEG.TO, IMO.TO, CVE.TO, AR.N, CHK.N, CPE.N, DNR.N, EPE.N, EQT.N, FANG.OQ, GPOR.OQ, LPI.N, OAS.N, RRC.N, SWN.N, OXY.N, TOTF.PA, STL.OL, ENI.MI, COP.N, XOM.N, TRP.TO, D.N, EQM.N, ETP.N, SEP.N, WPZ.N, JAG.N, KMI.N, APC.N, TOU.TO) within the past 12 months Credit Suisse expects to receive or intends to seek investment banking related compensation from the subject company (BP.L, ECA.N, SU.TO, VII.TO, RDSa.L, PE.N, PXD.N, CXO.N, DVN.N, NVA.TO, EGN.N, AAV.TO, PPY.TO, PEY.TO, XOG.OQ, TET.TO, CPG.TO, POU.TO, KEL.TO, CRZO.OQ, PGF.TO, PWT.TO, BNP.TO, BIR.TO, CR.TO, NFX.N, BXE.TO, PDCE.OQ, MEG.TO, HSE.TO, CNQ.TO, IMO.TO, CVE.TO, OPHR.L, CNE.L, TLW.L, PMO.L, TGL.TO, NOGN.L, HES.N, MUR.N, APA.N, AR.N, CHK.N, CLR.N, CPE.N, DNR.N, EOG.N, EPE.N, EQT.N, FANG.OQ, GPOR.OQ, LPI.N, MRO.N, SN.N, NBL.N, OAS.N, RRC.N, SWN.N, WLL.N, OMVV.VI, OXY.N, TOTF.PA, REP.MC, STL.OL, ENI.MI, COP.N, CVX.N, XOM.N, TRP.TO, 0857.HK, D.N, EQM.N, ETP.N, SEP.N, WPZ.N, JAG.N, KMI.N, APC.N, ERF.TO, GTE.A, PXT.TO, TOU.TO) within the next 3 months. Credit Suisse has received compensation for products and services other than investment banking services from the subject company (BP.L, RDSa.L, VET.TO, CHK.N, EPE.N, EQT.N, MRO.N, TOTF.PA, REP.MC, STL.OL, ENI.MI, XOM.N, TRP.TO, 0857.HK, D.N, EQM.N, ETP.N, WPZ.N, APC.N) within the past 12 months As of the date of this report, Credit Suisse makes a market in the following subject companies (XOM.N, 0857.HK). A member of the Credit Suisse Group is party to an agreement with, or may have provided services set out in sections A and B of Annex I of Directive 2014/65/EU of the European Parliament and Council ("MiFID Services") to, the subject issuer (BP.L, ECA.N, SU.TO, VII.TO, RDSa.L, PE.N, PXD.N, CXO.N, DVN.N, NVA.TO, PPY.TO, PEY.TO, XOG.OQ, VET.TO, CPG.TO, POU.TO, KEL.TO, CRZO.OQ, PGF.TO, PWT.TO, BNP.TO, BIR.TO, CR.TO, NFX.N, PDCE.OQ, BTE.TO, MEG.TO, HSE.TO, CNQ.TO, IMO.TO, CVE.TO, OPHR.L, LUPE.ST, CNE.L, TLW.L, PMO.L, TGL.TO, NOGN.L, AOIC.ST, HES.N, MUR.N, AR.N, CHK.N, CLR.N, CPE.N, DNR.N, EOG.N, EPE.N, EQT.N, FANG.OQ, GPOR.OQ, LPI.N, SN.N, NBL.N, OAS.N, RRC.N, SWN.N, WLL.N, OMVV.VI, TOTF.PA, REP.MC, STL.OL, ENI.MI, XOM.N, TRP.TO, 0857.HK, ARX.TO, D.N, EQM.N, ETP.N, SEP.N, WPZ.N, JAG.N, KMI.N, APC.N, ERF.TO, GTE.A, PXT.TO, TOU.TO) within the past 12 months. As of the end of the preceding month, Credit Suisse beneficially own 1% or more of a class of common equity securities of (EGN.N, TET.TO, TLW.L, 0857.HK, EQM.N). Credit Suisse beneficially holds >0.5% long position of the total issued share capital of the subject company (TET.TO, PDCE.OQ, EQM.N). Credit Suisse has a material conflict of interest with the subject company (POU.TO) . Credit Suisse is acting as a strategic advisor on Seven Generations' acquisition of Paramount Resources Ltd's Montney Nest assets. Credit Suisse has a material conflict of interest with the subject company (RRC.N) . Credit Suisse Securities (USA) LLC acted as exclusive financial advisor to Range Resources Corporation in its acquisition of Memorial Resource Development Corporation. Credit Suisse has a material conflict of interest with the subject company (CVX.N) . Credit Suisse is engaged as the Sole Financial Advisor and Joint Financier to the Consortium (consists of AC Energy, Star Energy Group Holdings Pte. Ltd., Star Energy Geothermal Pte. Ltd., and Electricity Generating Public Company Ltd.) for the purchase of Chevron’s geothermal operations in Indonesia and the Philippines. Credit Suisse has a material conflict of interest with the subject company (XOM.N) . Kofi Adjepong-Boateng, a Senior Advisor of Credit Suisse, is a Senior Advisor to Exxon Mobil (XOM) Credit Suisse has a material conflict of interest with the subject company (0857.HK) . Any Nielsen Media Research material contained in this report represents Nielsen Media Research's estimates and does not represent facts. NMR has neither reviewed nor approved this report and/or any of the statements made herein. Credit Suisse has a material conflict of interest with the subject company (SEP.N) . Credit Suisse is acting as lead financial advisor to Enbridge Inc. (ENB) as it relates to its potential merger with Spectra Energy Corp. (SE).
For other important disclosures concerning companies featured in this report, including price charts, please visit the website at https://rave.credit-suisse.com/disclosures or call +1 (877) 291-2683. For date and time of production, dissemination and history of recommendation for the subject company(ies) featured in this report, disseminated within the past 12 months, please refer to the link: https://rave.credit-suisse.com/disclosures/view/report?i=294205&v=-n8e4zzvkgyav6crnf6ru7as8 .
Important Regional Disclosures Singapore recipients should contact Credit Suisse AG, Singapore Branch for any matters arising from this research report. The analyst(s) involved in the preparation of this report may participate in events hosted by the subject company, including site visits. Credit Suisse does not accept or permit analysts to accept payment or reimbursement for travel expenses associated with these events. Restrictions on certain Canadian securities are indicated by the following abbreviations: NVS--Non-Voting shares; RVS--Restricted Voting Shares; SVS--Subordinate Voting Shares. Individuals receiving this report from a Canadian investment dealer that is not affiliated with Credit Suisse should be advised that this report may not contain regulatory disclosures the non-affiliated Canadian investment dealer would be required to make if this were its own report. For Credit Suisse Securities (Canada), Inc.'s policies and procedures regarding the dissemination of equity research, please visit https://www.credit-suisse.com/sites/disclaimers-ib/en/canada-research-policy.html. The following disclosed European company/ies have estimates that comply with IFRS: (BP.L, RDSa.L, CNE.L, TLW.L, PMO.L, OMVV.VI, REP.MC, STL.OL, ENI.MI, XOM.N). Credit Suisse has acted as lead manager or syndicate member in a public offering of securities for the subject company (BP.L, ECA.N, VII.TO, RDSa.L, PE.N, PXD.N, CXO.N, DVN.N, NVA.TO, EGN.N, AAV.TO, XOG.OQ, KEL.TO, CRZO.OQ, NFX.N, PDCE.OQ, MEG.TO, IMO.TO, CVE.TO, HES.N, AR.N, CHK.N, CPE.N, DNR.N, EQT.N, FANG.OQ, GPOR.OQ, LPI.N, SN.N, OAS.N, RRC.N, SWN.N, TOTF.PA, COP.N, XOM.N, TRP.TO, 0857.HK, D.N, EQM.N, ETP.N, WPZ.N, KMI.N, APC.N) within the past 3 years. Principal is not guaranteed in the case of equities because equity prices are variable. Commission is the commission rate or the amount agreed with a customer when setting up an account or at any time after that. This research report is authored by: Credit Suisse Securities (USA) LLC ..................................................................................................................Edward Westlake ; Mark Lear, CFA Credit Suisse International .................................................................................................................................................................. Thomas Adolff

13 April 2017
Canadian Oil & Gas Sector 66
Credit Suisse Securities (Canada), Inc. ..... David Hewitt ; Jason Frew ; Brian Ho ; David Phung ; Robert Loebach ; Andrew M. Kuske ; Paul Tan To the extent this is a report authored in whole or in part by a non-U.S. analyst and is made available in the U.S., the following are important disclosures regarding any non-U.S. analyst contributors: The non-U.S. research analysts listed below (if any) are not registered/qualified as research analysts with FINRA. The non-U.S. research analysts listed below may not be associated persons of CSSU and therefore may not be subject to the FINRA 2241 and NYSE Rule 472 restrictions on communications with a subject company, public appearances and trading securities held by a research analyst account. Credit Suisse International .................................................................................................................................................................. Thomas Adolff Credit Suisse Securities (Canada), Inc. ..... David Hewitt ; Jason Frew ; Brian Ho ; David Phung ; Robert Loebach ; Andrew M. Kuske ; Paul Tan
Important disclosures regarding companies or other issuers that are the subject of this report are available on Credit Suisse ’s disclosure website at https://rave.credit-suisse.com/disclosures or by calling +1 (877) 291-2683.

13 April 2017
Canadian Oil & Gas Sector 67
This report is produced by subsidiaries and affiliates of Credit Suisse operating under its Global Markets Division. For more information on our structure, please use the following link: https://www.credit-suisse.com/who-we-are This report may contain material that is not directed to, or intended for distribution to or use by, any person or entity who is a citizen or resident of or located in any locality, state, country or other jurisdiction where such distribution, publication, availability or use would be contrary to law or regulation or which would subject Credit Suisse or its affiliates ("CS") to any registration or licensing requirement within such jurisdiction. All material presented in this report, unless specifically indicated otherwise, is under copyright to CS. None of the material, nor its content, nor any copy of it, may be altered in any way, transmitted to, copied or distributed to any other party, without the prior express written permission of CS. All trademarks, service marks and logos used in this report are trademarks or service marks or registered trademarks or service marks of CS or its affiliates.The information, tools and material presented in this report are provided to you for information purposes only and are not to be used or considered as an offer or the solicitation of an offer to sell or to buy or subscribe for securities or other financial instruments. CS may not have taken any steps to ensure that the securities referred to in this report are suitable for any particular investor. CS will not treat recipients of this report as its customers by virtue of their receiving this report. The investments and services contained or referred to in this report may not be suitable for you and it is recommended that you consult an independent investment advisor if you are in doubt about such investments or investment services. Nothing in this report constitutes investment, legal, accounting or tax advice, or a representation that any investment or strategy is suitable or appropriate to your individual circumstances, or otherwise constitutes a personal recommendation to you. CS does not advise on the tax consequences of investments and you are advised to contact an independent tax adviser. Please note in particular that the bases and levels of taxation may change. Information and opinions presented in this report have been obtained or derived from sources believed by CS to be reliable, but CS makes no representation as to their accuracy or completeness. CS accepts no liability for loss arising from the use of the material presented in this report, except that this exclusion of liability does not apply to the extent that such liability arises under specific statutes or regulations applicable to CS. This report is not to be relied upon in substitution for the exercise of independent judgment. CS may have issued, and may in the future issue, other communications that are inconsistent with, and reach different conclusions from, the information presented in this report. Those communications reflect the different assumptions, views and analytical methods of the analysts who prepared them and CS is under no obligation to ensure that such other communications are brought to the attention of any recipient of this report. Some investments referred to in this report will be offered solely by a single entity and in the case of some investments solely by CS, or an associate of CS or CS may be the only market maker in such investments. Past performance should not be taken as an indication or guarantee of future performance, and no representation or warranty, express or implied, is made regarding future performance. Information, opinions and estimates contained in this report reflect a judgment at its original date of publication by CS and are subject to change without notice. The price, value of and income from any of the securities or financial instruments mentioned in this report can fall as well as rise. The value of securities and financial instruments is subject to exchange rate fluctuation that may have a positive or adverse effect on the price or income of such securities or financial instruments. Investors in securities such as ADR's, the values of which are influenced by currency volatility, effectively assume this risk. Structured securities are complex instruments, typically involve a high degree of risk and are intended for sale only to sophisticated investors who are capable of understanding and assuming the risks involved. The market value of any structured security may be affected by changes in economic, financial and political factors (including, but not limited to, spot and forward interest and exchange rates), time to maturity, market conditions and volatility, and the credit quality of any issuer or reference issuer. Any investor interested in purchasing a structured product should conduct their own investigation and analysis of the product and consult with their own professional advisers as to the risks involved in making such a purchase. Some investments discussed in this report may have a high level of volatility. High volatility investments may experience sudden and large falls in their value causing losses when that investment is realised. Those losses may equal your original investment. Indeed, in the case of some investments the potential losses may exceed the amount of initial investment and, in such circumstances, you may be required to pay more money to support those losses. Income yields from investments may fluctuate and, in consequence, initial capital paid to make the investment may be used as part of that income yield. Some investments may not be readily realisable and it may be difficult to sell or realise those investments, similarly it may prove difficult for you to obtain reliable information about the value, or risks, to which such an investment is exposed. This report may provide the addresses of, or contain hyperlinks to, websites. Except to the extent to which the report refers to website material of CS, CS has not reviewed any such site and takes no responsibility for the content contained therein. Such address or hyperlink (including addresses or hyperlinks to CS's own website material) is provided solely for your convenience and information and the content of any such website does not in any way form part of this document. Accessing such website or following such link through this report or CS's website shall be at your own risk.
This report is issued and distributed in European Union (except Switzerland): by Credit Suisse Securities (Europe) Limited, One Cabot Square, London E14 4QJ, England, which is authorised by the Prudential Regulation Authority and regulated by the Financial Conduct Authority and the Prudential Regulation Authority. Germany: Credit Suisse Securities (Europe) Limited Niederlassung Frankfurt am Main regulated by the Bundesanstalt fuer Finanzdienstleistungsaufsicht ("BaFin"). United States and Canada: Credit Suisse Securities (USA) LLC; Switzerland: Credit Suisse AG; Brazil: Banco de Investimentos Credit Suisse (Brasil) S.A or its affiliates; Mexico: Banco Credit Suisse (México), S.A. (transactions related to the securities mentioned in this report will only be effected in compliance with applicable regulation); Japan: by Credit Suisse Securities (Japan) Limited, Financial Instruments Firm, Director-General of Kanto Local Finance Bureau ( Kinsho) No. 66, a member of Japan Securities Dealers Association, The Financial Futures Association of Japan, Japan Investment Advisers Association, Type II Financial Instruments Firms Association; Hong Kong: Credit Suisse (Hong Kong) Limited; Australia: Credit Suisse Equities (Australia) Limited; Thailand: Credit Suisse Securities (Thailand) Limited, regulated by the Office of the Securities and Exchange Commission, Thailand, having registered address at 990 Abdulrahim Place, 27th Floor, Unit 2701, Rama IV Road, Silom, Bangrak, Bangkok10500, Thailand, Tel. +66 2614 6000; Malaysia: Credit Suisse Securities (Malaysia) Sdn Bhd; Singapore: Credit Suisse AG, Singapore Branch; India: Credit Suisse Securities (India) Private Limited (CIN no.U67120MH1996PTC104392) regulated by the Securities and Exchange Board of India as Research Analyst (registration no. INH 000001030) and as Stock Broker (registration no. INB230970637; INF230970637; INB010970631; INF010970631), having registered address at 9th Floor, Ceejay House, Dr.A.B. Road, Worli, Mumbai - 18, India, T- +91-22 6777 3777; South Korea: Credit Suisse Securities (Europe) Limited,
Seoul Branch; Taiwan: Credit Suisse AG Taipei Securities Branch; Indonesia: PT Credit Suisse Securities Indonesia; Philippines:Credit Suisse Securities (Philippines ) Inc., and elsewhere in the world by the relevant authorised affiliate of the above. Additional Regional Disclaimers Hong Kong: Credit Suisse (Hong Kong) Limited ("CSHK") is licensed and regulated by the Securities and Futures Commission of Hong Kong under the laws of Hong Kong, which differ from Australian laws. CSHKL does not hold an Australian financial services licence (AFSL) and is exempt from the requirement to hold an AFSL under the Corporations Act 2001 (the Act) under Class Order 03/1103 published by the ASIC in respect of financial services provided to Australian wholesale clients (within the meaning of section 761G of the Act). Research on Taiwanese securities produced by Credit Suisse AG, Taipei Securities Branch has been prepared by a registered Senior Business Person. Australia (to the extent services are offered in Australia): Credit Suisse Securities (Europe) Limited (“CSSEL”) and Credit Suisse International (“CSI”) are authorised by the Prudential Regulation Authority and regulated by the Financial Conduct Authority (“FCA”) and the Prudential Regulation Authority under UK laws, which differ from Australian Laws. CSSEL and CSI do not hold an Australian Financial Services Licence (“AFSL”) and are exempt from the requirement to hold an AFSL under the Corporations Act (Cth) 2001 (“Corporations Act”) under Class Order 03/1099 published by the Australian Securities and Investments Commission (“ASIC”), in respect of the financial services provided to Australian wholesale clients (within the meaning of section 761G of the Corporations Act). This material is not for distribution to retail clients and is directed exclusively at Credit Suisse's professional clients and eligible counterparties as defined by the FCA, and wholesale clients as defined under section 761G of the Corporations Act. Credit Suisse (Hong Kong) Limited (“CSHK”) is licensed and regulated by the Securities and Futures Commission of Hong Kong under the laws of Hong Kong, which differ from Australian laws. CSHKL does not hold an AFSL and is exempt from the requirement to hold an AFSL under the Corporations Act under Class Order 03/1103 published by the ASIC in respect of financial services provided to Australian wholesale clients (within the meaning of section 761G of the Corporations Act). Credit Suisse Securities (USA) LLC (CSSU) and Credit Suisse Asset Management LLC (CSAM LLC) are licensed and regulated by the Securities Exchange Commission of the United States under the laws of the United States, which differ from Australian laws. CSSU and CSAM LLC do not hold an AFSL and is exempt from the requirement to hold an AFSL under the Corporations Act under Class Order 03/1100 published by the ASIC in respect of financial services provided to Australian wholesale clients (within the meaning of section 761G of the Corporations Act). Malaysia: Research provided to residents of Malaysia is authorised by the Head of Research for Credit Suisse Securities (Malaysia) Sdn Bhd, to whom they should direct any queries on +603 2723 2020. Singapore: This report has been prepared and issued for distribution in Singapore to institutional investors, accredited investors and expert investors (each as defined under the Financial Advisers Regulations) only, and is also distributed by Credit Suisse AG, Singapore Branch to overseas investors (as defined under the Financial Advisers Regulations). Credit Suisse AG, Singapore Branch may distribute reports produced by its foreign entities or affiliates pursuant to an arrangement under Regulation 32C of the Financial Advisers Regulations. Singapore recipients should contact Credit Suisse AG, Singapore Branch at +65-6212-2000 for matters arising from, or in connection with, this report. By virtue of your status as an institutional investor, accredited investor, expert investor or overseas investor, Credit Suisse AG, Singapore Branch is exempted from complying with certain compliance requirements under the Financial Advisers Act, Chapter 110 of Singapore (the “FAA”), the Financial Advisers Regulations and the relevant Notices and Guidelines issued thereunder, in respect of any financial advisory service which Credit Suisse AG, Singapore Branch may provide to you. UAE: This information is being distributed by Credit Suisse AG (DIFC Branch), duly licensed and regulated by the Dubai Financial Services Authority (“DFSA”). Related financial services or products are only made available to Professional Clients or Market Counterparties, as defined by the DFSA, and are not intended for any other persons. Credit Suisse AG (DIFC Branch) is located on Level 9 East, The Gate Building, DIFC, Dubai, United Arab Emirates. EU: This report has been produced by subsidiaries and affiliates of Credit Suisse operating under its Global Markets Division In jurisdictions where CS is not already registered or licensed to trade in securities, transactions will only be effected in accordance with applicable securities legislation, which will vary from jurisdiction to jurisdiction and may require that the trade be made in accordance with applicable exemptions from registration or licensing requirements. Non-US customers wishing to effect a transaction should contact a CS entity in their local jurisdiction unless governing law permits otherwise. US customers wishing to effect a transaction should do so only by contacting a representative at Credit Suisse Securities (USA) LLC in the US. Please note that this research was originally prepared and issued by CS for distribution to their market professional and institutional investor customers. Recipients who are not market professional or institutional investor customers of CS should seek the advice of their independent financial advisor prior to taking any investment decision based on this report or for any necessary explanation of its contents. This research may relate to investments or services of a person outside of the UK or to other matters which are not authorised by the Prudential Regulation Authority and regulated by the Financial Conduct Authority and the Prudential Regulation Authority or in respect of which the protections of the Prudential Regulation Authority and Financial Conduct Authority for private customers and/or the UK compensation scheme may not be available, and further details as to where this may be the case are available upon request in respect of this report. CS may provide various services to US municipal entities or obligated persons ("municipalities"), including suggesting individual transactions or trades and entering into such transactions. Any services CS provides to municipalities are not viewed as "advice" within the meaning of Section 975 of the Dodd-Frank Wall Street Reform and Consumer Protection Act. CS is providing any such services and related information solely on an arm's length basis and not as an advisor or fiduciary to the municipality. In connection with the provision of the any such services, there is no agreement, direct or indirect, between any municipality (including the officials,management, employees or agents thereof) and CS for CS to provide advice to the municipality. Municipalities should consult with their financial, accounting and legal advisors regarding any such services provided by CS. In addition, CS is not acting for direct or indirect compensation to solicit the municipality on behalf of an unaffiliated broker, dealer, municipal securities dealer, municipal advisor, or investment adviser for the purpose of obtaining or retaining an engagement by the municipality for or in connection with Municipal Financial Products, the issuance of municipal securities, or of an investment adviser to provide investment advisory services to or on behalf of the municipality. If this report is being distributed by a financial institution other than Credit Suisse AG, or its affiliates, that financial institution is solely responsible for distribution. Clients of that institution should contact that institution to effect a transaction in the securities mentioned in this report or require further information. This report does not constitute investment advice by Credit Suisse to the clients of the distributing financial institution, and neither Credit Suisse AG, its affiliates, and their respective officers, directors and employees accept any liability whatsoever for any direct or consequential loss arising from their use of this report or its content. Principal is not guaranteed. Commission is the commission rate or the amount agreed with a customer when setting up an account or at any time after that. Copyright © 2017 CREDIT SUISSE AG and/or its affiliates. All rights reserved.
Investment principal on bonds can be eroded depending on sale price or market price. In addition, there are bonds on which investment principal can be eroded due to changes in redemption amounts. Care is required when investing in such instruments. When you purchase non-listed Japanese fixed income securities (Japanese government bonds, Japanese municipal bonds, Japanese government guaranteed bonds, Japanese corporate bonds) from CS as a seller, you will be requested to pay the purchase price only.