canadian tire corporation (ctc) - smith school of … tire corporation| october 2016 canadian tire...
TRANSCRIPT
Canadian Tire Corporation| October 2016
Canadian Tire Corporation (TSX: CTC/A) Margin improvement amid a challenging environment Business Description Canadian Tire Corporation “CTC” operates in three segments: Retail (Canadian Tire, Mark's apparel & footwear, FGL Sports and Gas Bar), Financial Services and CT REIT. The retail business provides products for life in Canada across its living, playing, fixing, automotive and seasonal categories. The CTR stores and Petroleum stations are operated by independent dealers whereas Mark’s and FGL Sports are operated through corporate-run and franchise stores. Overview: Our target price for CTC is C$150.27 based on four different pricing methods. The result is excellent despite our conservative approach to projections. We believe that the company will seek new opportunities to grow as the acquisition of FGL and sports goods sales have set a precedent and introduced robust growth since 2005.
Angel Tso, CPA Andy Guo [email protected] [email protected] 647.992.1479 226.808.3060 Grace Dong Janice Lin [email protected] [email protected] 647.928.6266 647.909.4967
Key Statistics* GICS Sector Consumer Discretionary Sub-Industry General Merchandise Stores Stock Overview Price as at 10/03/16 $132.27 12-mo Target Price $150.27 52-wk Price Range $101.50 – 147.00 Beta 0.64 Market Cap $9.73B Shares O/S 68.46M Profitability & Yield ROE 13.38% ROA 4.23% Profit Margin 34.25% Diluted EPS (ttm) $2.44 Payout Ratio 23.29% Dividend per Share $2.44 Dividend Yield 1.84% Valuation Price/Earnings (ttm) 15.30 Price/Sales (ttm) 0.73 Price/Book (mrq) 1.97 *data retrieved from Bloomberg Terminal
Canadian Tire Corporation| October 2016
012345
Threat ofNew Entry
Power ofSuppliers
Power ofBuyers
Threat ofSubstitution
CompetitiveRivalry
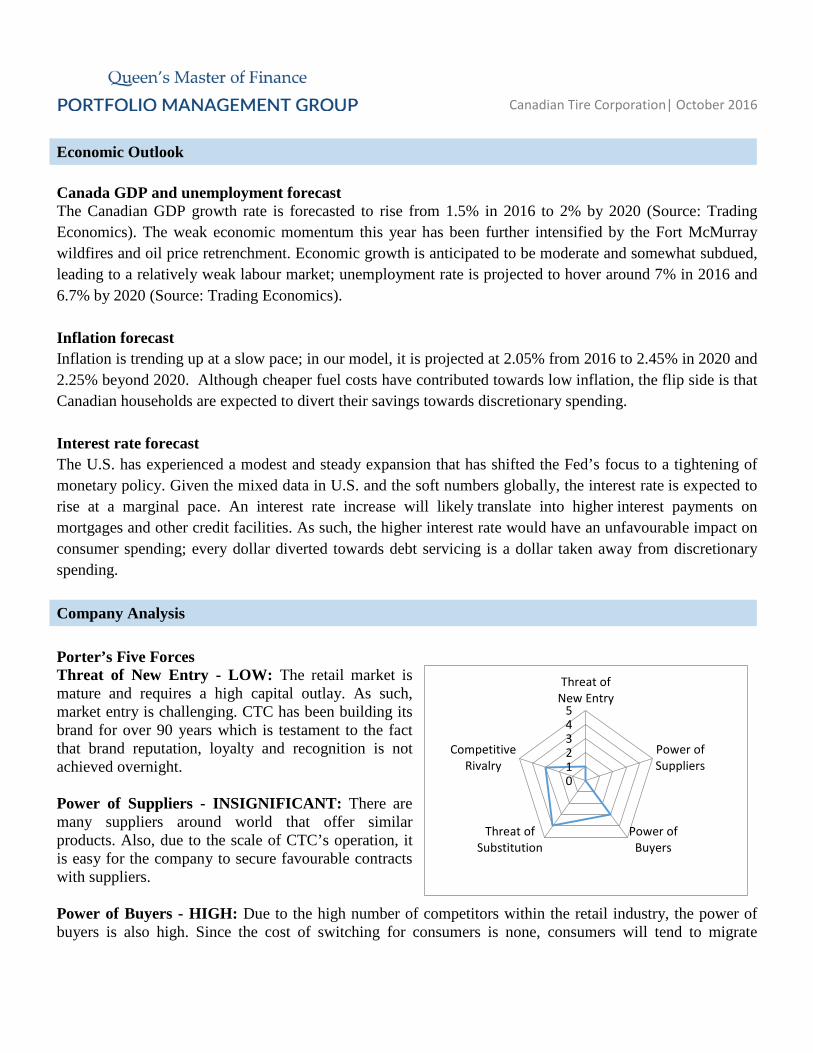
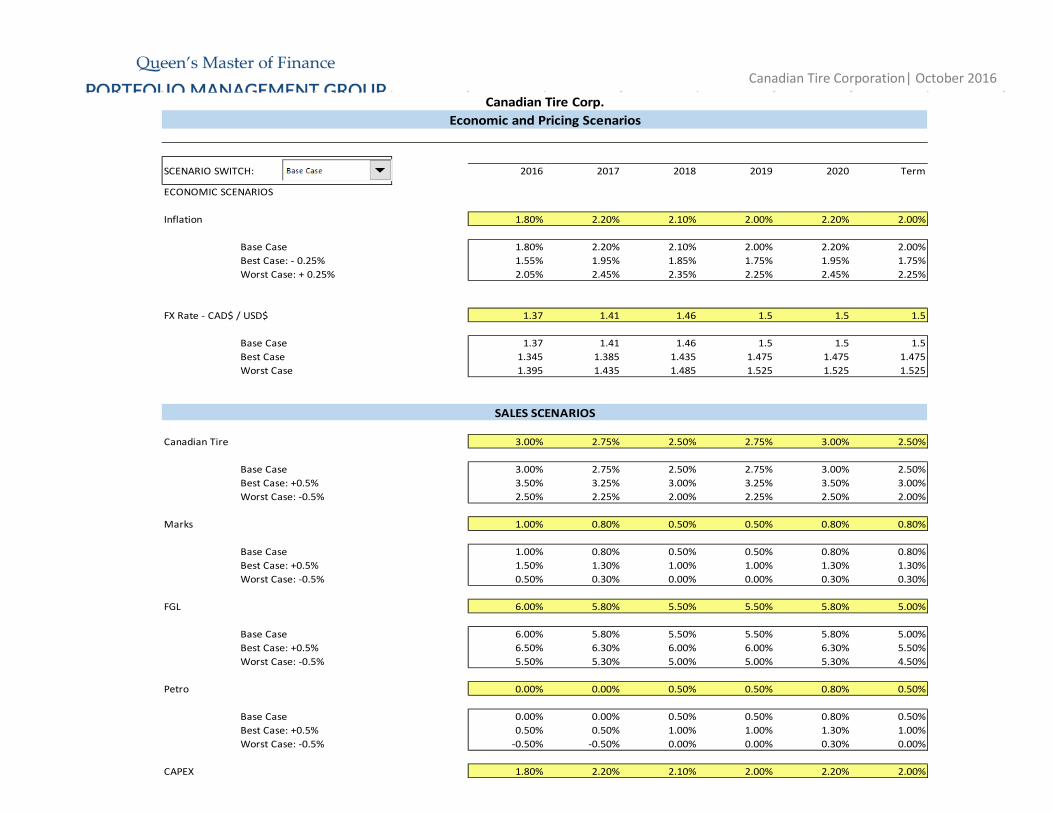
Economic Outlook Canada GDP and unemployment forecast The Canadian GDP growth rate is forecasted to rise from 1.5% in 2016 to 2% by 2020 (Source: Trading Economics). The weak economic momentum this year has been further intensified by the Fort McMurray wildfires and oil price retrenchment. Economic growth is anticipated to be moderate and somewhat subdued, leading to a relatively weak labour market; unemployment rate is projected to hover around 7% in 2016 and 6.7% by 2020 (Source: Trading Economics). Inflation forecast Inflation is trending up at a slow pace; in our model, it is projected at 2.05% from 2016 to 2.45% in 2020 and 2.25% beyond 2020. Although cheaper fuel costs have contributed towards low inflation, the flip side is that Canadian households are expected to divert their savings towards discretionary spending. Interest rate forecast The U.S. has experienced a modest and steady expansion that has shifted the Fed’s focus to a tightening of monetary policy. Given the mixed data in U.S. and the soft numbers globally, the interest rate is expected to rise at a marginal pace. An interest rate increase will likely translate into higher interest payments on mortgages and other credit facilities. As such, the higher interest rate would have an unfavourable impact on consumer spending; every dollar diverted towards debt servicing is a dollar taken away from discretionary spending. Company Analysis Porter’s Five Forces Threat of New Entry - LOW: The retail market is mature and requires a high capital outlay. As such, market entry is challenging. CTC has been building its brand for over 90 years which is testament to the fact that brand reputation, loyalty and recognition is not achieved overnight. Power of Suppliers - INSIGNIFICANT: There are many suppliers around world that offer similar products. Also, due to the scale of CTC’s operation, it is easy for the company to secure favourable contracts with suppliers. Power of Buyers - HIGH: Due to the high number of competitors within the retail industry, the power of buyers is also high. Since the cost of switching for consumers is none, consumers will tend to migrate
Canadian Tire Corporation| October 2016
towards brands which meet their evolving needs. However, due to the product range offered by, there’s no specific consumer target for CTC. Threat of Substitution - SIGNIFICANT: The products offered by CTC are very similar to those offered by competitors. Thus consumers are always picking the products that offer the best price and quality. Furthermore, consumers are also free to switch between retailers, so they are always open to a better shopping experience (both online and in-person). Competitive Rivalry - HIGH: No other retailer can compete directly with CTC due to its diversity. FGL Sports, for instance, has dominated the sporting goods market in Canada despite an abundant presence of specialty sporting goods stores. However, CTC faces strong competition for its Canadian Tire Retail and Mark’s segments. Canadian Tire Retail faces both domestic and international competitors such as Rona, Lowe’s, Home Depot and Wal-Mart. Mark’s is also facing significant competition in the specialty retail sector. Strengths A highly trusted brand in Canada Canadian Tire Corporation was founded in 1922 and has been serving Canadians for more than 90 years with more than 498 stores across Canada. The company continues to strengthen the store brand and is committed to be a “brand-led” organization as part of their overall strategy. CTC continues to build on its reputation by growing their customer-loyalty programs, creating private labels and investing in Olympic and other sports partnerships. Canadian Tire is also one of top 10 trusted brands in 2016. Different retail segments within the same company Canadian Tire Corporation has a unique business structure that offers a wide range of products and services that no other retailers can compete directly with. CTC offers products from automotive parts, kitchen appliances, toys, clothing, sporting goods and gasoline. CTC also offers financial services including Canadian Tire Options MasterCard and Gas Advantage MasterCard. The retail segment of CTC are Mark’s, FGL Sports, Petroleum and Canadian Tire Retail. The company is focused on differentiating its banners to ensure Canadian consumers have the products they want to meet their lifestyle needs. Unique “Associate Dealer” structure CTC has a unique structure of independent dealers who operate Canadian Tire retail stores. Entrepreneurial dealers own the fixture, equipment, and inventory of the store and are responsible for their store’s performance and subsequently earn profits after licensing fees. The new dealership contract provides a guideline for margins, cost sharing and processes to achieve cost efficiencies, which creates mutual benefits to dealers and CTC. The dealership structure generates CTC’s greatest strength and helps it to remain competitive in a mature retail market. REIT CTC owns an effective 85.2% interest in CT REIT and is continuing to develop its existing portfolio in REIT. In 2015 alone, CT REIT added 1.2 million square feet of leasable area and its earnings increased almost 8%; this contributed a total of 26.6M in other income. In terms of financial flexibility and liquidity, CT REIT
Canadian Tire Corporation| October 2016
successfully issued debentures in 2015 via debt issuance, demonstrating its worthy credit rating and an ability to raise financing independently. Increase in retail sales Despite the strong competition in the retail industry, CTC’s retail sales have increased 2% (excluding Petroleum) in 2015. This was contributed by the higher sales at Canadian Tire with 2.4% increase and FGL Sports with 2.7% increase. Many store locations CTC has over 498 (as of 2015) retail stores across Canada. The store network is regularly refreshed to showcase the latest assortments and merchandise in order to enhance the in-store shopping experience. Comparing to its closest competitors, Lowe’s has 42 stores and Home Depot has 182 stores across Canada (as of 2015 also). As such, CTC holds a distinct advantage in terms of absolute square footage. Risks Intensive competition from traditional brick-and-mortar to omni-channel retailing Competition in retail sector remains intense due to the expansion of domestic and international retailers. Domestic and international retailers, including but not limited to, Walmart, Home Depot, Rona, Lowe’s, HBC and Nordstrom, continue to penetrate the market throughout Canada. In addition, the trend on “omni-channel” and “channel blur-ring”, has further accelerated the competition, leading CTC to offer products that are typically outside the scope of their traditional product categories. This could result in a higher inventory cost. Finally, in our view, we believe consumer buying behaviour is mainly driven by price and convenience. To remain competitive on pricing, CTC has been offering weekly promotions, which may put further pressure on operating margins. CTC also needs to keep up on the footprint and increase investments on its digital platform. Nonetheless, we expect net profit margin to remain at a steady rate of approximately 5.5% over the next five years as we believe CTC could differentiate their banners through improving the in-store experience. Weak economy overshadows consumer confidence and expenditure The Canadian economy is looking bleaker as a result of the decreasing oil price, lackluster growth in GDP, and an elevated unemployment rate of 7%. In particular, the unemployment rate in Alberta edged up to 8.4% as of August 2016 (Source: Alberta Government). The increase was attributed to the Fort McMurray wildfires, which led to a lower output for of the province. As such, consumer confidence on job security has been weak, which could make consumers less inclined to cut back on household spending. Weaker Lonnie squeezes profit margin With a moderate portion of products (44% for CT, 42% for FGL, 6% for Mark’s) being purchased in U.S. dollars, CTC faces headwinds from foreign currency volatility. In our model, we anticipated the exchange rate of USD would be inflated from 9-13%. However, CTC has been working on improving productivity and cost reduction initiatives which should at least partially offset exchange rate woes.

Canadian Tire Corporation| October 2016
0.00%
1.00%
2.00%
3.00%
4.00%
2014A 2015A 2016E 2017F 2018F 2019F 2020F
Total Same Store Sales Growth
Operational risks CTC renewed its contracts with dealers to create synergy on a collaborative approach to further improve store performance where the dealer is responsible for the store staff and operating expenses. However, this could contribute to an inconsistent in-store experience across several locations. Furthermore, CTC is expanding its digital channels to improve its online shopping experience as online retail continues to grow. The success of such implementation depends largely upon CTC’s ability to manage inventory, orders, and fulfillment across multiple warehouse locations. Other operational risks associated with expanding the online channel include, but are not limited to, order fulfillment accuracy, shipping costs, and return logistics. CTC’s ability to launch the new distribution center in the Town of Calidon and execute associated process and logistics smoothly remains to be seen. Unseasonable weather CTC offers seasonal merchandise such as patio furniture and barbecue grills for summer, and winter sports and snow-clearing equipment for winter. Extreme or unseasonable weather condition would cause a material and adverse impact on the retail businesses by declining customer traffic to stores. Unseasonable weather would also affect their business strategy and cause an inventory backlog; as such margins may become pressured when inventory needs to be marked down. Mediocre-to-low quality on proprietary brands Canadian Tire and Mark’s sell their own private label brands such as Noma, Motomaster®, MasterCraft®, Denver Hayes®, WindRiver®, Diadora®, Firefly, McKINLEY®, and Nakamura®. Unfortunately, some of the proprietary goods are just a plain, low-quality offering at the lowest price point. To narrow this quality gap between private-label and brand-name products, CTC should improve their procurement processes and be more careful about monitoring quality. We believe, in the long run, the proprietary brands strategy could help combat retail competition.
Financial Analysis Same Store Sales Growth In the last 5 years, CTC had 1.1% to 3.2% increase in SSS growth. We forecasted strong revenue growth at FGL and CTR (6% & 3% in 2016), attributed to the diversification of product and improved in-store experience. We are more conservative on other retail banners as Mark’s is heavily influenced by the economy in Alberta; Petroleum is pressured by the low oil price; CT Financial Service & CT REIT are more exposed to economic conditions and the interest rate environment. We forecasted 1% growth for

Canadian Tire Corporation| October 2016
Marks & 1.8% growth for CTFS and CTREIT. (data from S&P IQ as of Oct 3, 2016) The total same store sales growth in our model was improved at a marginal pace, 2.27% to 2.3%, from 2016 to 2020. Forecasted Income Statement
Canadian Tire Corp. Consolidated Income Statement
Projected
2015A 2016E 2017F 2018F 2019F 2020F Term
Revenue 12,280 12,795 13,135 13,401 13,693 14,071 14,341 COGS 8,144 8,437 8,625 8,808 9,007 9,237
Gross Margin 4,135 4,358 4,509 4,594 4,686 4,833 Other Income (54.9) 0.0 0.0 0.0 0.0 0.0 SG&A 2,792.2 2,942.9 3,021.0 3,082.3 3,149.3 3,236.2
EBITDA 1,398.0 1,415.1 1,488.2 1,511.6 1,536.2 1,596.9 1,616.3 Depreciation 303.9 318.6 343.4 368.8 394.7 421.3 430.8
EBIT 1,094.1 1,096.5 1,144.9 1,142.9 1,141.5 1,175.6 1,185.5 Net Finance Cost 92.8 159.6 139.5 131.8 122.9 112.8 0.0
EBT 1,001.3 936.9 1,005.4 1,011.0 1,018.6 1,062.9 1,185.5 Income Tax 265.4 248.3 266.4 267.9 269.9 281.7 314.2
Net Income 735.9 688.6 738.9 743.1 748.7 781.2 871.4
NI Contribute to: Shareholders of CTC 659.4 617.1 662.1 665.9 670.8 700.0 780.8 Non-Controlling Interest 76.5 71.6 76.8 77.3 77.8 81.2 90.6 Average Diluted Shares O/S 76.6 73.2 73.2 73.2 73.2 73.2 73.2
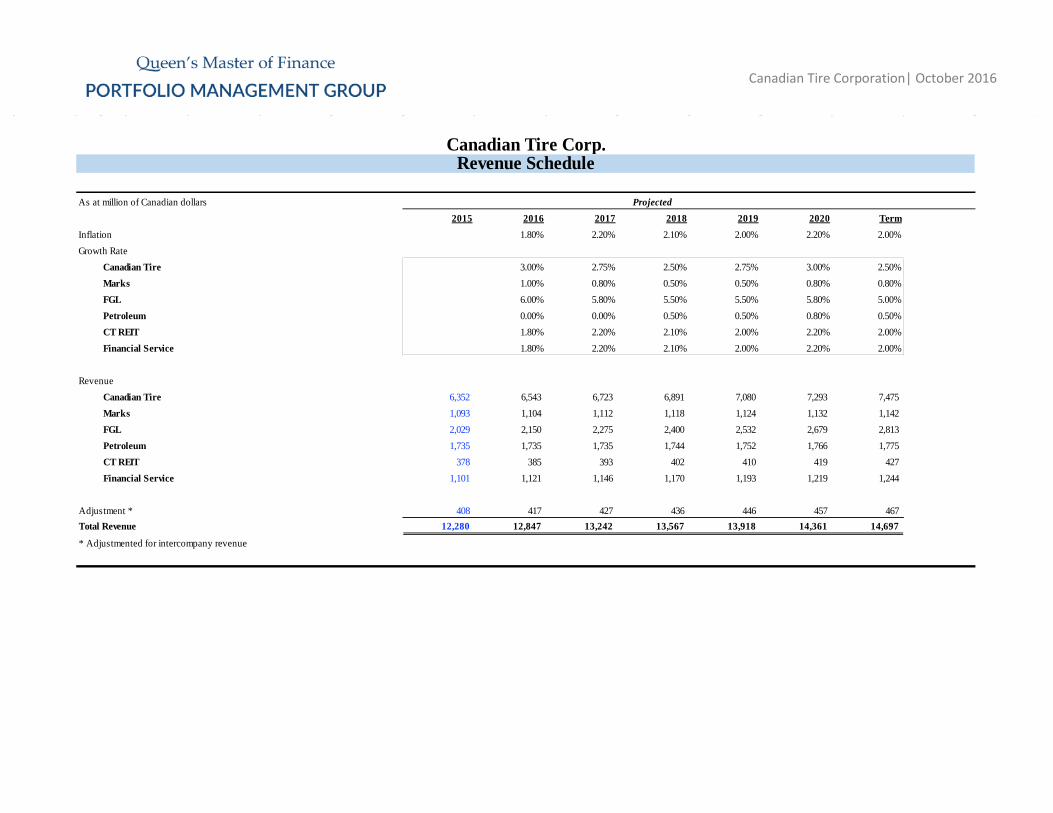
Diluted EPS 8.6 8.4 9.0 9.1 9.2 9.6 10.7 Improvement of Revenue and Net Income We believe CTC has performed well in terms of growing its revenue across all banners. In our model, we projected the overall revenue raised from 12.7B in 2016 to 14B in 2020, which represented 9.9% revenue growth. In term of EBITDA growth, we projected it increased 12.8% from 2016 to 2020. Finally, the net income continued to improve, increased 13.4% from 2016 to 2020. In our view, the improvement of revenue and net income were mainly due to a focus on product mix and optimizing assortments.

Canadian Tire Corporation| October 2016
0.000.501.001.502.002.503.003.504.00
0.0%2.0%4.0%6.0%8.0%
10.0%12.0%14.0%16.0%
2015 2016 2017 2018 2019 2020
DuPont Analysis
NPM ROA ROE Leverage (right)
Stable Profitability margins All the profitability margins for the firm are very stable in our five-year forecast period. As discussed in the risks section, a moderate portion of CTC’s inventory (44% for CT, 42% for FGL, 6% for Mark’s) comes from the U.S.; in our model, we have projected that the US dollar will keep rising over the next five years, USD to CAD, 1.37 to 1.5. Balance Sheet Highlights
Canadian Tire Corp. Balance Sheet Highlight
Projection 2015A 2016E 2017F 2018F 2019F 2020F Net Working Capital
5,039
5,187
5,454
5,644
5,667
5,705
Net PP&E 3,978
4,390
4,796
5,193
5,434
5,664
Total Asset
14,988
14,785
15,528
16,174
16,502
16,839
S-T Debt 969
652
705
706
434
120
L-T Debt 4,344
4,275
4,359
4,410
4,411
4,438
Total Equity
5,790
5,859
6,416
6,976
7,540
8,128
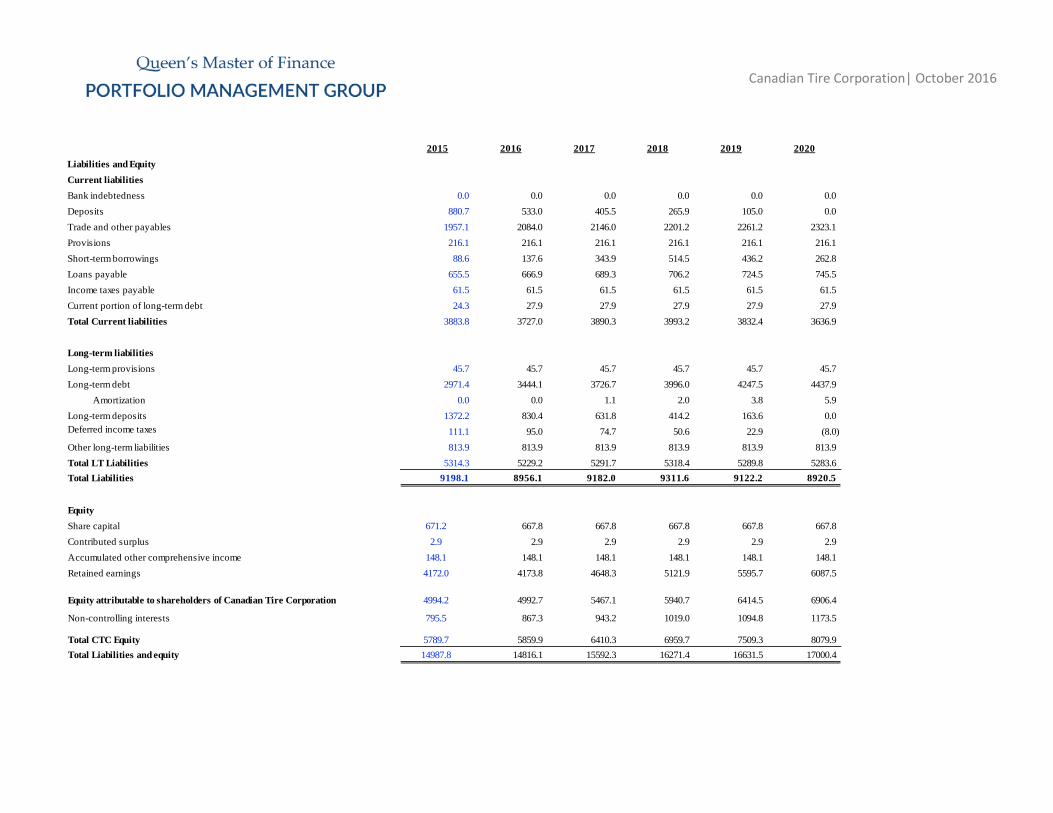
ROE declined slowly CTC has maintained a steady net profit margin in the previous five years, from 4.5% to 5.4%. In our model, we forecasted net profit margin and ROA remained steady while the leverage ratio declined gradually. This is because the firm has a large portion of long-term liabilities due in the next five years and we have been conservative on projecting new issuance of long-term debt. As a result of an increase in retained earnings YoY, the ROE is expected to decrease over time and this is aligned with the fact that the firm is in a mature stage where the growth rate is slowing down. Financial engineering vs. real return As of July 2, 2016, CTC had repurchased 330MM worth of shares. In fact, CTC has been constantly buying back shares from the market in the past five years. We are more conservative in our model, we forecasted 450MM buyback in 2015 and do not anticipate this trend would continue over our forecast period since the common share outstanding has been decreased 10% over the last five years. With lower floating shares, this is simply a temporary method to
68.00
70.00
72.00
74.00
76.00
78.00
80.00
82.00
84.00
2011A 2012A 2013A 2014A 2015A 2016E
Share outstanding YoY

Canadian Tire Corporation| October 2016
improve various financial metrics. While not a negative point in its entirety by any means, we believe that a sustainable and more favorable method of returning cash to shareholders would be via steady dividend increase.
Valuation
Canadian Tire Corp. Unlevered Free Cash Flow Schedule
(C$ Millions) Projected
2016 2017 2018 2019 2020 Term.
Unlevered Free Cash Flow EBITDA 1,417.4 1,493.2 1,519.2 1,546.5 1,610.5 1,646.5 Current Taxes (307.3) (325.1) (329.1) (333.0) (346.3) (322.7) Changes in working capital (170.0) (290.0) (214.7) (46.5) (63.0) 0.0 CAPEX (729.0) (745.0) (760.7) (629.5) (643.4) (656.2)
Unlevered Free Cash Flow (DCF Valuation) $211.1 $133.1 $214.7 $537.5 $557.9 $667.6 Lower UFCF due to weaker loonie and economic conditions in the next few years Based on our five years’ financial projection, CTC appears to be able to generate more free cash flow in the last two years than it has in the first three years. This is mainly due to lower expectation in the growth of the Canadian economy and weaker foreign exchange rate for Canadian dollars. The growth rate for the company will decrease as a result of a lower economic growth, which will also diminish the ability for CTC to manage its working capital. We expect that economic conditions will turn around from 2019, and the firm will then need fewer investments in working capital. The construction of a new warehouse and distribution center in Town of Calidon is expected to finish by the year 2018, and as a result, CAPEX is expected to decrease. Recommendation - Buy We find CTC’s valuation compelling compared to other Canadian retailer and consumer stocks; our target price is C$150.27, based on a weighted average calculation from DCF, Single and Two-Stage DDM and Forward P/E Multiple estimates (50%, 10%, 10% and 30% respectively). We take a more conservative perspective in revenue growth prospect compared to management’s guidance from 2014-2017. However, we also believe the company will seek new opportunities to grow as the acquisition of FGL and sport’s good sales have set a precedent and introduced robust growth since 2005.

Canadian Tire Corporation| October 2016
Competitor Analysis
(data from Bloomberg as of Oct 3, 2016)

Canadian Tire Corporation| October 2016
APPENDIX

Canadian Tire Corporation| October 2016
GENERAL INFLATION- First year of forecast in financial model: 2016 - As Described in Scenario Tab- 5-year cash flow model discounted to July 1st, 2016
SHAREHOLDER'S EQUITYREVENUE & COST - Common Dividend Payout Rate 27.5%
- Revenue & Cost Growth Rates are Listed in Scenario Tab - Cost of Equity Remain The Same Through Out The Forecasting 7.92%- Percentage of Total COGS is Subjected to Exchange Risks - Fully Diluted Shares O/S ($MM) -July 1st, 2016 77
Canadian Tire 44% - Average Stock Price $124.00FGL 41%Mark's 6% TAXES
- COGS as a Percentage of Revenue Retail Sector 70.0% - Tax rate assumed in the model: 26.5%- COGS as a Percentage of Revenue for Financial Sector 41.0% - Blended CCA Rate assumed in the model: 12%- SG&A as a Percentage of Revenue 23.0% - Opening TLCF balance (C$MM): 0
- Opening UCC balance (C$MM): 1989INTEREST RATES AND DEBT COVENANTS
Interest Rates VALUATION- Interest rate earned on cash balances: 0.55% - Cost of Equity - Interest rate on the Bank Revolver (Average of Midterm Load +50 5.50% - Low end of the discount rate (WACC) range: 6.23%- Interest rate on the Senior Secured Term Debt: 3.38% - Low end of the terminal value growth rate: 1.5%- Minimum Cash Balance 10 - The terminal value growth rate range is 1.8% to 2.1%
CAPEX & DEPRECIATION WORKING CAPITAL DAYS- Depreciation Methodology Used: Straight Line - Days in- Depreciation Year Used in Accounts Receiv 27 28.5 29 28 27
Land Does not Depreciate Inventories 79 80 81 80 79Building 30 Accounts Payab 90 90 90 90 90Fixture 12 Perpaid Expense 4 4 4 4 4Leasehold Improvement 15 Loans Receivabl 145 146 147 146 145Asset Under Financial Lease 15 Loans Payable 19 19 19 19 19Construction Does not Depreciate
- CAPEX is assumed to grow with inflation
Canadian Tire Corp.Input & Assumptions

Canadian Tire Corporation| October 2016
CHANGE IN L-T Liabilities TERMINAL YEAR2016 2017 2018 2019 2020 - This EBITDA Margin is used to calculate EBITDA
- Deposite Payment Schedule 889.50 326.10 357.20 411.50 277.40 - Full cash taxes are paid (ie. no deferred taxes)- Financial Lease Obligations 19.60 17.30 14.50 12.70 11.60 - Preferred stock dividends is zero in terminal year- Mortgages 4.10 1.20 17.10 37.60 0.10 - Depreciation is equal to Capex
- No changes in working capital- Current Portion of LT Debt is assumed to be 1% of total LT Debt - Non-controlling interest in subsidiaries- Interest rate on - Operating , maintenance and general stays the same
min max avgMortgage 2.50% 3.60% 3.05%Financial Lease 0.81% 11.35% 6.08%Deposit 1.52% 2.84% 2.18%
New Debt and Common Share Issurance2016 2017 2018 2019 2020
Debt Issuance 500.00 300.00 300.00 300.00 200.00Common Share Issuance # (3.36) 0.00 0.00 0.00 0.00Common Share Issuance $ (450.00) 0.00 0.00 0.00 0.00
Common Equity Buy Back2016 2017 2018 2019 2020
Par Value (671M/70M Shares) 9.50$ 9.50$ 9.50$ 9.50$ 9.50$ Shares Outstanding Beg. 70,637,987 67,279,778 67,279,778 67,279,778 67,279,778 Buy Back (Shares) 3,358,209 - - - - Shares Outstanding End. 67,279,778 67,279,778 67,279,778 67,279,778 67,279,778 Outstanding Share Value 639,157,891 639,157,891 639,157,891 639,157,891 639,157,891
Canadian Tire Corp.Input & Assumptions
Canadian Tire Corporation| October 2016
1 2016 2017 2018 2019 2020 Term
1.80% 2.20% 2.10% 2.00% 2.20% 2.00%
Base Case 1.80% 2.20% 2.10% 2.00% 2.20% 2.00%Best Case: - 0.25% 1.55% 1.95% 1.85% 1.75% 1.95% 1.75%Worst Case: + 0.25% 2.05% 2.45% 2.35% 2.25% 2.45% 2.25%
1.32 1.37 1.41 1.46 1.5 1.5 1.5
Base Case 1.37 1.41 1.46 1.5 1.5 1.5Best Case 1.345 1.385 1.435 1.475 1.475 1.475Worst Case 1.395 1.435 1.485 1.525 1.525 1.525
SALES SCENARIOS
3.00% 2.75% 2.50% 2.75% 3.00% 2.50%
Base Case 3.00% 2.75% 2.50% 2.75% 3.00% 2.50%Best Case: +0.5% 3.50% 3.25% 3.00% 3.25% 3.50% 3.00%Worst Case: -0.5% 2.50% 2.25% 2.00% 2.25% 2.50% 2.00%
1.00% 0.80% 0.50% 0.50% 0.80% 0.80%
Base Case 1.00% 0.80% 0.50% 0.50% 0.80% 0.80%Best Case: +0.5% 1.50% 1.30% 1.00% 1.00% 1.30% 1.30%Worst Case: -0.5% 0.50% 0.30% 0.00% 0.00% 0.30% 0.30%
6.00% 5.80% 5.50% 5.50% 5.80% 5.00%
Base Case 6.00% 5.80% 5.50% 5.50% 5.80% 5.00%Best Case: +0.5% 6.50% 6.30% 6.00% 6.00% 6.30% 5.50%Worst Case: -0.5% 5.50% 5.30% 5.00% 5.00% 5.30% 4.50%
0.00% 0.00% 0.50% 0.50% 0.80% 0.50%
Base Case 0.00% 0.00% 0.50% 0.50% 0.80% 0.50%Best Case: +0.5% 0.50% 0.50% 1.00% 1.00% 1.30% 1.00%Worst Case: -0.5% -0.50% -0.50% 0.00% 0.00% 0.30% 0.00%
CAPEX 1.80% 2.20% 2.10% 2.00% 2.20% 2.00%
Canadian Tire
Marks
FGL
Petro
ECONOMIC SCENARIOS
SCENARIO SWITCH:
Canadian Tire Corp.Economic and Pricing Scenarios
FX Rate - CAD$ / USD$
Inflation
Canadian Tire Corporation| October 2016
As at million of Canadian dollars2015 2016 2017 2018 2019 2020 Term
Inflation 1.80% 2.20% 2.10% 2.00% 2.20% 2.00%Growth Rate
Canadian Tire 3.00% 2.75% 2.50% 2.75% 3.00% 2.50%Marks 1.00% 0.80% 0.50% 0.50% 0.80% 0.80%FGL 6.00% 5.80% 5.50% 5.50% 5.80% 5.00%Petroleum 0.00% 0.00% 0.50% 0.50% 0.80% 0.50%CT REIT 1.80% 2.20% 2.10% 2.00% 2.20% 2.00%Financial Service 1.80% 2.20% 2.10% 2.00% 2.20% 2.00%
RevenueCanadian Tire 6,352 6,543 6,723 6,891 7,080 7,293 7,475Marks 1,093 1,104 1,112 1,118 1,124 1,132 1,142FGL 2,029 2,150 2,275 2,400 2,532 2,679 2,813Petroleum 1,735 1,735 1,735 1,744 1,752 1,766 1,775CT REIT 378 385 393 402 410 419 427Financial Service 1,101 1,121 1,146 1,170 1,193 1,219 1,244
Adjustment * 408 417 427 436 446 457 467Total Revenue 12,280 12,847 13,242 13,567 13,918 14,361 14,697
* Adjustmented for intercompany revenue
Revenue ScheduleCanadian Tire Corp.
Projected

Canadian Tire Corporation| October 2016
2015 2016 2017 2018 2019 2020 Term
Exchange Rate Impact 4% 7% 11% 14% 14% 14%Canadian Tire
of Merchandse Sold 70% of Revenue 4,391 4,580 4,706 4,824 4,956 5,105 5,233Adjusted 44% of CoGS Purchased in UND After FX Impact 4,391 4,656 4,847 5,049 5,254 5,411 5,547
Marksof Merchandse Sold 70% of Revenue 755 772 779 783 786 793 799Adjusted 41% of CoGS Purchased in UND After FX Impact 755 784 800 817 830 837 844
FGLof Merchandse Sold 70% of Revenue 1,402 1,505 1,592 1,680 1,772 1,875 1,969Adjusted 6% of CoGS Purchased in UND After FX Impact 1,402 1,529 1,637 1,753 1,872 1,980 2,079
Petroleumof Merchandse Sold 70% of Revenue 1,199 1,215 1,215 1,221 1,227 1,236 1,243
CT REITof Merchandse Sold 70% of Revenue 0 0 0 0 0 0 0
Financial Serviceof Merchandse Sold 41% of Revenue 452 460 470 480 489 500 510
Adjustmented for intercompany revenue 55 57 58 59 61 62 63Total Costs 8,144 8,475 8,703 8,927 9,170 9,447 9,690
As Percentage of Revenue 66.32% 65.97% 65.72% 65.80% 65.89% 65.79% 65.93%
Projected
Canadian Tire Corp.Cost Schedule

Canadian Tire Corporation| October 2016
2015A 2016E 2017F 2018F 2019F 2020F TermOperation
Revenue 12,280 12,847 13,242 13,567 13,918 14,361 14,697COGS 8,144 8,475 8,703 8,927 9,170 9,447Gross Margin 4,135 4,372 4,539 4,639 4,748 4,914Other Income (54.9) 0.0 0.0 0.0 0.0 0.0SG&A 2,792.2 2,954.9 3,045.7 3,120.3 3,201.2 3,303.0
EBITDA 1,398.0 1,417.4 1,493.2 1,519.2 1,546.5 1,610.5 1,646.5Depreciation 303.9 318.5 343.2 368.4 394.1 420.4 428.8
EBIT 1,094.1 1,098.9 1,150.0 1,150.8 1,152.4 1,190.2 1,217.7
Net Finance Cost 92.8 159.6 156.4 158.9 160.1 160.1 0.0EBT 1,001.3 939.2 993.6 991.9 992.3 1,030.1 1,217.7
Income Tax 265.4 248.9 263.3 262.9 262.9 273.0 322.7Net Income 735.9 690.3 730.3 729.1 729.3 757.1 895.0
NI Contribute to:to CTC 659.4 618.6 654.4 653.3 653.5 678.4 802.0Non Controlling Interest 76.5 71.8 75.9 75.8 75.8 78.7 93.0
Avg Diluted Shares O/S 76.6 73.2 73.2 73.2 73.2 73.2 73.2
Dilluted EPS 8.6 8.4 8.9 8.9 8.9 9.3 11.0
MarginsEBITDA Margin 11.38% 11.03% 11.28% 11.20% 11.11% 11.21% 11.20%EBIT Margin 8.91% 8.55% 8.68% 8.48% 8.28% 8.29% 8.53%ROE 13.20% 12.39% 11.97% 11.00% 10.19% 9.82%
Consolidated Income Statement
Projected
Canadian Tire Corp.

Canadian Tire Corporation| October 2016
As at million of Canadian dollars
2015 2016 2017 2018 2019 2020
Operating Activities
Net Income 690.3 730.3 729.1 729.3 757.1
Depreciation & Amortization 318.5 343.2 368.4 394.1 420.4
Deferred Income Taxes (16.1) (20.3) (24.1) (27.7) (30.9)
Changes in working capital (170.0) (290.0) (214.7) (46.5) (63.0)
Operating Cash Flow 822.7 763.2 858.6 1,049.3 1,083.6
Investing Activities
CAPEX 729.0 745.0 760.7 629.5 643.4
Other 0.0 0.0 0.0 0.0 0.0
Investing Cash Flow (729.0) (745.0) (760.7) (629.5) (643.4)
Financing Activities
Revolver Issuance / (Repayment) 49.0 206.4 170.5 (78.3) (173.4)
Term Debt Issuance / (Repayment) (913.2) (344.6) (388.8) (461.8) (280.3)
New long debt / (Repayment) 500.0 300.0 300.0 300.0 200.0
Common Shares Issuance/ (Buy-Back) (450.0) 0.0 0.0 0.0 0.0
Common Dividends (170.1) (180.0) (179.7) (179.7) (186.6)
Financing Cash Flow (984.4) (18.2) (97.9) (419.8) (440.3)
Change in the Cash Position (890.6) 0.0 0.0 0.0 0.0
Beginning Cash 900.6 10.0 10.0 10.0 10.0
Ending Cash 900.6 10.0 10.0 10.0 10.0 10.0
Consolidated Cash Flow StatementCanadian Tire Corp.
Projected

Canadian Tire Corporation| October 2016
As at million of Canadian dollars2015 2016 2017 2018 2019 2020
AssetsCurrent assetsCash and cash equivalents 900.6 10.0 10.0 10.0 10.0 10.0 Short-term investments 96.1 96.1 96.1 96.1 96.1 96.1 Trade and other receivables 915.0 947.8 1,034.0 1,077.9 1,067.7 1,059.4 Loans receivable 4,875.5 5,089.8 5,296.9 5,463.8 5,567.2 5,689.4 Merchandise inventories 1,764.5 1,829.3 1,907.6 1,981.1 2,010.0 2,039.2 Income taxes recoverable 42.2 42.2 42.2 42.2 42.2 42.2 Prepaid expenses and deposits 96.1 92.6 95.4 97.8 100.5 103.2 Assets classified as held for sale 2.3 2.3 2.3 2.3 2.3 2.3 Total current assets 8,692.3 8,110.1 8,484.5 8,771.2 8,896.0 9,041.8
Property, Plant and Equipment 6,769.8 7,276.1 8,016.2 8,772.1 9,396.9 10,035.1 Accumulated depreciation 2,791.6 (3,110.1) (3,453.3) (3,821.7) (4,215.8) (4,636.1) Net PP&E 3,978.2 4,388.7 4,790.5 5,182.8 5,418.2 5,641.2
Other assetsLong-term receivables and other assets 731.2 731.2 731.2 731.2 731.2 731.2 Long-term investments 153.4 153.4 153.4 153.4 153.4 153.4 Goodwill and intangible assets 1,246.8 1,246.8 1,246.8 1,246.8 1,246.8 1,246.8 Investment property 137.8 137.8 137.8 137.8 137.8 137.8 Deferred income taxes 48.1 48.1 48.1 48.1 48.1 48.1 Total other assets 2,317.3 2,317.3 2,317.3 2,317.3 2,317.3 2,317.3
Total assets 14,987.8 14,816.1 15,592.3 16,271.4 16,631.5 17,000.4
Canadian Tire Corp.Consolidated Balance Sheet
Projected
Canadian Tire Corporation| October 2016
2015 2016 2017 2018 2019 2020Liabilities and EquityCurrent liabilitiesBank indebtedness 0.0 0.0 0.0 0.0 0.0 0.0Deposits 880.7 533.0 405.5 265.9 105.0 0.0Trade and other payables 1957.1 2084.0 2146.0 2201.2 2261.2 2323.1Provisions 216.1 216.1 216.1 216.1 216.1 216.1Short-term borrowings 88.6 137.6 343.9 514.5 436.2 262.8Loans payable 655.5 666.9 689.3 706.2 724.5 745.5Income taxes payable 61.5 61.5 61.5 61.5 61.5 61.5Current portion of long-term debt 24.3 27.9 27.9 27.9 27.9 27.9Total Current liabilities 3883.8 3727.0 3890.3 3993.2 3832.4 3636.9
Long-term liabilitiesLong-term provisions 45.7 45.7 45.7 45.7 45.7 45.7Long-term debt 2971.4 3444.1 3726.7 3996.0 4247.5 4437.9
Amortization 0.0 0.0 1.1 2.0 3.8 5.9Long-term deposits 1372.2 830.4 631.8 414.2 163.6 0.0Deferred income taxes 111.1 95.0 74.7 50.6 22.9 (8.0)Other long-term liabilities 813.9 813.9 813.9 813.9 813.9 813.9Total LT Liabilities 5314.3 5229.2 5291.7 5318.4 5289.8 5283.6Total Liabilities 9198.1 8956.1 9182.0 9311.6 9122.2 8920.5
EquityShare capital 671.2 667.8 667.8 667.8 667.8 667.8Contributed surplus 2.9 2.9 2.9 2.9 2.9 2.9Accumulated other comprehensive income 148.1 148.1 148.1 148.1 148.1 148.1Retained earnings 4172.0 4173.8 4648.3 5121.9 5595.7 6087.5
Equity attributable to shareholders of Canadian Tire Corporation 4994.2 4992.7 5467.1 5940.7 6414.5 6906.4
Non-controlling interests 795.5 867.3 943.2 1019.0 1094.8 1173.5
Total CTC Equity 5789.7 5859.9 6410.3 6959.7 7509.3 8079.9Total Liabilities and equity 14987.8 14816.1 15592.3 16271.4 16631.5 17000.4

Canadian Tire Corporation| October 2016
(C$ Millions)As of July 1st,
2015 2016 2017 2018 2019 2020 #REF!
Days per Year (days) 365 366 365 365 365 366
Income Statement ItemsNet Revenue (C$ MM) 12,279.6 12,847.3 13,242.3 13,566.6 13,918.1 14,360.8Cost of Sales (C$ MM) 8,144.3 8,475.1 8,703.3 8,927.1 9,170.5 9,447.3
Days InAccounts Receivable (days) 27.2 27.0 28.5 29.0 28.0 27.0Inventories (days) 79.1 79.0 80.0 81.0 80.0 79.0Accounts Payable (days) 87.7 90.0 90.0 90.0 90.0 90.0Prepaid Expenses (days) 4.3 4.0 4.0 4.0 4.0 4.0Loans Receivable (days) 144.9 145.0 146.0 147.0 146.0 145.0Loans Payable (days) 19.5 19.0 19.0 19.0 19.0 19.0
Account BalancesAccounts Receivable (C$ MM) 915.0 947.8 1,034.0 1,077.9 1,067.7 1,059.4Inventories (C$ MM) 1,764.5 1,829.3 1,907.6 1,981.1 2,010.0 2,039.2Accounts Payable (C$ MM) 1,957.1 2,084.0 2,146.0 2,201.2 2,261.2 2,323.1Prepaid Expenses (C$ MM) 96.1 92.6 95.4 97.8 100.5 103.2Loans Receivable (C$ MM) 4,875.5 5,089.8 5,296.9 5,463.8 5,567.2 5,689.4Loans Payable (C$ MM) 655.5 666.9 689.3 706.2 724.5 745.5Net Working Capital (C$ MM) 5,038.5 5,208.5 5,498.5 5,713.2 5,759.7 5,822.6
Change in Working Capital (C$ MM) (170.0) (290.0) (214.7) (46.5) (63.0)
Canadian Tire Corp.Working Capital Schedule
Projected

Canadian Tire Corporation| October 2016
As at million of Canadian dollars
2016 2017 2018 2019 2020Common Shares
Amount Outstanding - Beginning 671.2 667.8 667.8 667.8 667.8New Issuance / (Buy-Back) (3.4) 0.0 0.0 0.0 0.0Amount Outstanding - Ending 671.2 667.8 667.8 667.8 667.8 667.8
Dividend Payout Rate 27.5% 27.5% 27.5% 27.5% 27.5%Net Income 618.6 654.4 653.3 653.5 678.4Common Dividend 170.1 180.0 179.7 179.7 186.6Dividend Per Share 2.3 2.5 2.5 2.5 2.5
Retained EarningsAmount Outstanding - Beginning 4,172.0 4,173.8 4,648.3 5,121.9 5,595.7Net Income 618.6 654.4 653.3 653.5 678.4Common Dividend 170.1 180.0 179.7 179.7 186.6paid-in capital (result from buyback) (446.6) 0.0 0.0 0.0 0.0Amount Outstanding - Ending 4,172.0 4,173.8 4,648.3 5,121.9 5,595.7 6,087.5
Shares OutstandingCost of Equity 7.92% 7.92% 7.92% 7.92% 7.92%Average Stock Price 124.0 133.8 144.4 155.9 168.2 181.5
Fully Diluted Shares O/S (MM) - Beginning 76.6 73.2 73.2 73.2 73.2New Issuance / (Buy-Back) (3.4) 0.0 0.0 0.0 0.0Fully Diluted Shares O/S (MM) - Ending 76.6 73.2 73.2 73.2 73.2 73.2
Canadian Tire Corp.Shareholder's Equity Schedule
Projected

Canadian Tire Corporation| October 2016
As at million of Canadian dollars
2016 2017 2018 2019 2020Cash
Amount Outstanding - Beginning 900.6 10.0 10.0 10.0 10.0Change in Cash -890.6 0.0 0.0 0.0 0.0Amount Outstanding - Ending 900.6 10.0 10.0 10.0 10.0 10.0
Interest Rate 0.55% 0.55% 0.55% 0.55% 0.55%Annual Interest Income 0.1 0.1 0.1 0.1 0.1
RevolverOperating Cash Flow 822.7 763.2 858.6 1,049.3 1,083.6Investing Cash Flow (729.0) (745.0) (760.7) (629.5) (643.4)Mandatory Debt Repayments (413.2) (44.6) (88.8) (161.8) (80.3)Common Dividends (170.1) (180.0) (179.7) (179.7) (186.6)Repurchase of CS (450.0) 0.0 0.0 0.0 0.0FCF After Mandatory Debt Repayment and Dividend (939.6) (206.4) (170.5) 78.3 173.4
Revolver Outstanding - Beginning 88.6 137.6 343.9 514.5 436.2Additions / (Repayments) 49.0 206.4 170.5 (78.3) (173.4)Revolver Outstanding - Ending 88.6 137.6 343.9 514.5 436.2 262.8
Interest Rate 5.50% 5.50% 5.50% 5.50% 5.50%Annual Interest Expense 6.2 13.2 23.6 26.1 19.2
Senior Secured Term Debt
Amount Outstanding Beg 2,944.1 3,426.7 3,696.0 3,947.5 4,237.9Additions/(Repayment) 500.0 300.0 300.0 300.0 200.0Amount Outstanding End 2,971.4 3,444.1 3,726.7 3,996.0 4,247.5 4,437.9
Annual Interest Expense 159.6 156.4 158.9 160.1 160.1
Net Interest Expense 165.8 169.6 182.4 186.2 179.2
Canadian Tire Corp.Debt & Inerest Schedule
Projected
Canadian Tire Corporation| October 2016
As at million of Canadian dollars
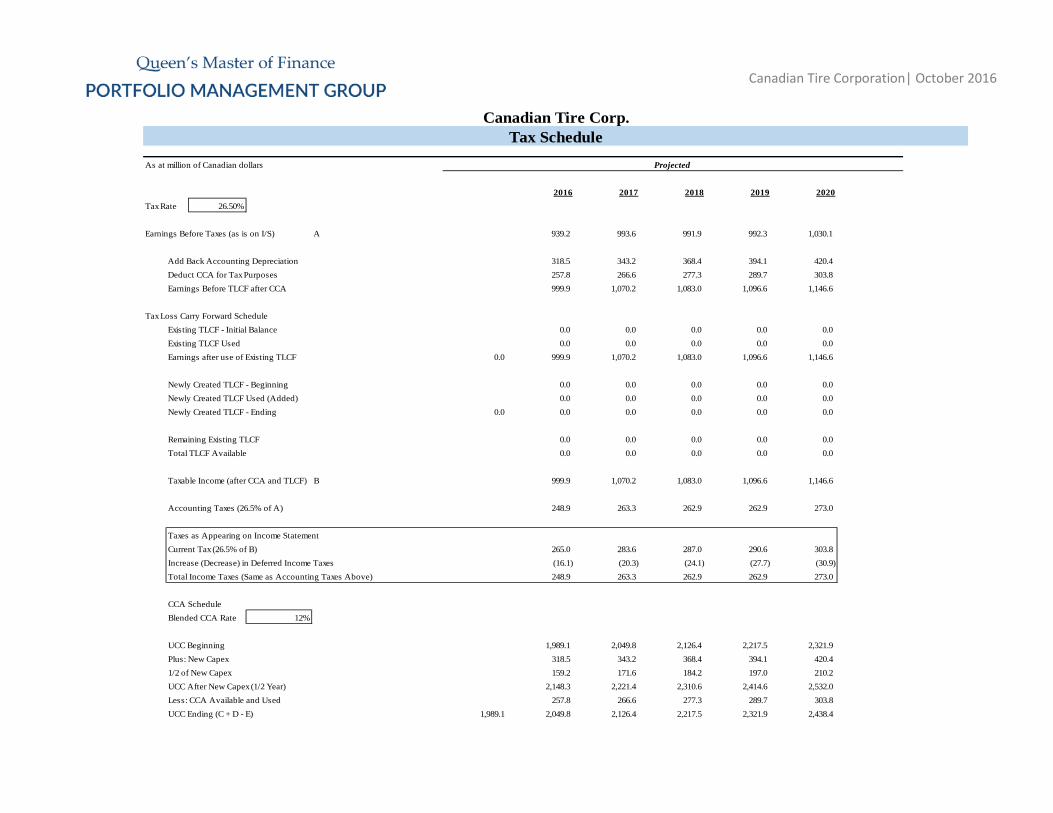
2016 2017 2018 2019 2020Tax Rate 26.50%
Earnings Before Taxes (as is on I/S) A 939.2 993.6 991.9 992.3 1,030.1
Add Back Accounting Depreciation 318.5 343.2 368.4 394.1 420.4Deduct CCA for Tax Purposes 257.8 266.6 277.3 289.7 303.8Earnings Before TLCF after CCA 999.9 1,070.2 1,083.0 1,096.6 1,146.6
Tax Loss Carry Forward ScheduleExisting TLCF - Initial Balance 0.0 0.0 0.0 0.0 0.0Existing TLCF Used 0.0 0.0 0.0 0.0 0.0Earnings after use of Existing TLCF 0.0 999.9 1,070.2 1,083.0 1,096.6 1,146.6
Newly Created TLCF - Beginning 0.0 0.0 0.0 0.0 0.0Newly Created TLCF Used (Added) 0.0 0.0 0.0 0.0 0.0Newly Created TLCF - Ending 0.0 0.0 0.0 0.0 0.0 0.0
Remaining Existing TLCF 0.0 0.0 0.0 0.0 0.0Total TLCF Available 0.0 0.0 0.0 0.0 0.0
Taxable Income (after CCA and TLCF) B 999.9 1,070.2 1,083.0 1,096.6 1,146.6
Accounting Taxes (26.5% of A) 248.9 263.3 262.9 262.9 273.0
Taxes as Appearing on Income StatementCurrent Tax (26.5% of B) 265.0 283.6 287.0 290.6 303.8Increase (Decrease) in Deferred Income Taxes (16.1) (20.3) (24.1) (27.7) (30.9)Total Income Taxes (Same as Accounting Taxes Above) 248.9 263.3 262.9 262.9 273.0
CCA ScheduleBlended CCA Rate 12%
UCC Beginning 1,989.1 2,049.8 2,126.4 2,217.5 2,321.9Plus: New Capex 318.5 343.2 368.4 394.1 420.41/2 of New Capex 159.2 171.6 184.2 197.0 210.2UCC After New Capex (1/2 Year) 2,148.3 2,221.4 2,310.6 2,414.6 2,532.0Less: CCA Available and Used 257.8 266.6 277.3 289.7 303.8UCC Ending (C + D - E) 1,989.1 2,049.8 2,126.4 2,217.5 2,321.9 2,438.4
Projected
Tax ScheduleCanadian Tire Corp.
Canadian Tire Corporation| October 2016
As at million of Canadian dollars
2015 2016 2017 2018 2019 2020
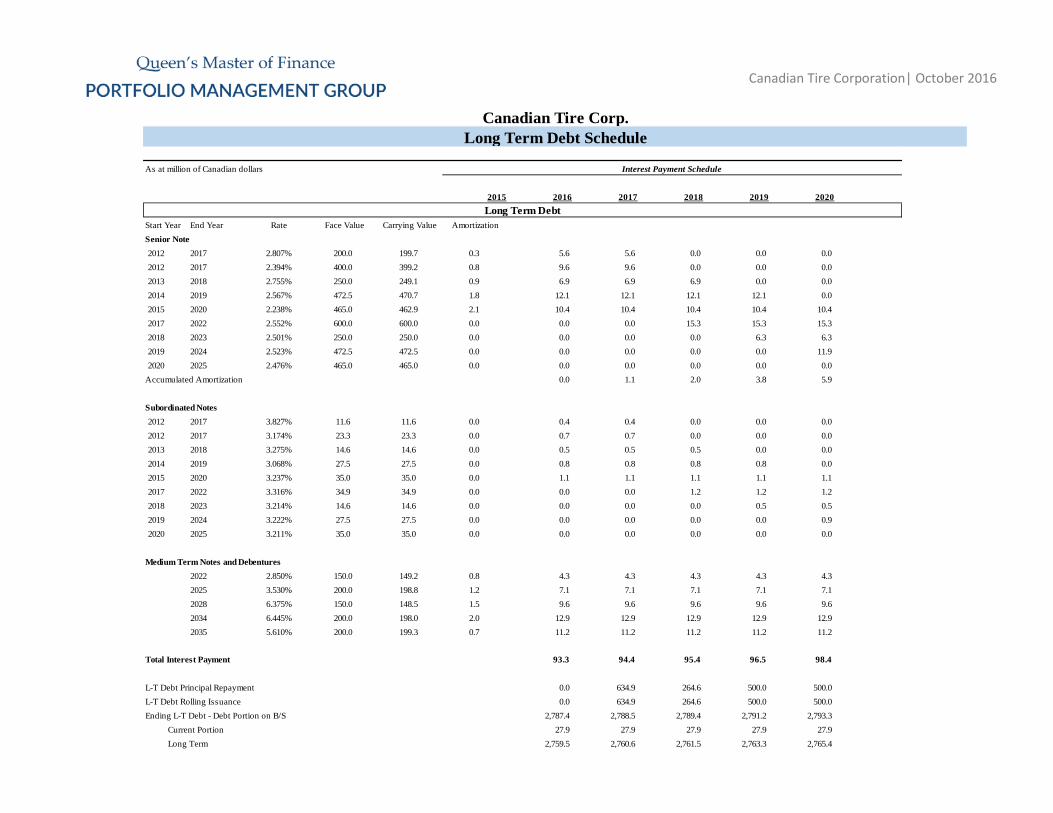
Start Year End Year Rate Face Value Carrying Value AmortizationSenior Note2012 2017 2.807% 200.0 199.7 0.3 5.6 5.6 0.0 0.0 0.02012 2017 2.394% 400.0 399.2 0.8 9.6 9.6 0.0 0.0 0.02013 2018 2.755% 250.0 249.1 0.9 6.9 6.9 6.9 0.0 0.02014 2019 2.567% 472.5 470.7 1.8 12.1 12.1 12.1 12.1 0.02015 2020 2.238% 465.0 462.9 2.1 10.4 10.4 10.4 10.4 10.42017 2022 2.552% 600.0 600.0 0.0 0.0 0.0 15.3 15.3 15.32018 2023 2.501% 250.0 250.0 0.0 0.0 0.0 0.0 6.3 6.32019 2024 2.523% 472.5 472.5 0.0 0.0 0.0 0.0 0.0 11.92020 2025 2.476% 465.0 465.0 0.0 0.0 0.0 0.0 0.0 0.0
Accumulated Amortization 0.0 1.1 2.0 3.8 5.9
Subordinated Notes2012 2017 3.827% 11.6 11.6 0.0 0.4 0.4 0.0 0.0 0.02012 2017 3.174% 23.3 23.3 0.0 0.7 0.7 0.0 0.0 0.02013 2018 3.275% 14.6 14.6 0.0 0.5 0.5 0.5 0.0 0.02014 2019 3.068% 27.5 27.5 0.0 0.8 0.8 0.8 0.8 0.02015 2020 3.237% 35.0 35.0 0.0 1.1 1.1 1.1 1.1 1.12017 2022 3.316% 34.9 34.9 0.0 0.0 0.0 1.2 1.2 1.22018 2023 3.214% 14.6 14.6 0.0 0.0 0.0 0.0 0.5 0.52019 2024 3.222% 27.5 27.5 0.0 0.0 0.0 0.0 0.0 0.92020 2025 3.211% 35.0 35.0 0.0 0.0 0.0 0.0 0.0 0.0
Medium Term Notes and Debentures2022 2.850% 150.0 149.2 0.8 4.3 4.3 4.3 4.3 4.32025 3.530% 200.0 198.8 1.2 7.1 7.1 7.1 7.1 7.12028 6.375% 150.0 148.5 1.5 9.6 9.6 9.6 9.6 9.62034 6.445% 200.0 198.0 2.0 12.9 12.9 12.9 12.9 12.92035 5.610% 200.0 199.3 0.7 11.2 11.2 11.2 11.2 11.2
Total Interest Payment 93.3 94.4 95.4 96.5 98.4
L-T Debt Principal Repayment 0.0 634.9 264.6 500.0 500.0L-T Debt Rolling Issuance 0.0 634.9 264.6 500.0 500.0Ending L-T Debt - Debt Portion on B/S 2,787.4 2,788.5 2,789.4 2,791.2 2,793.3
Current Portion 27.9 27.9 27.9 27.9 27.9Long Term 2,759.5 2,760.6 2,761.5 2,763.3 2,765.4
Canadian Tire Corp.Long Term Debt Schedule
Interest Payment Schedule
Long Term Debt

Canadian Tire Corporation| October 2016
As at million of Canadian dollars
2015 2016 2017 2018 2019 2020
Total Deposit Repayment 889.5 326.1 357.2 411.5 277.4Interest Rate 2.18%S-T Deposit
Beginning Balance 880.7 533.0 405.5 265.9 105.0Repayment 347.7 127.5 139.6 160.9 105.0Ending Balance 880.7 533.0 405.5 265.9 105.0 0.0
L-T DepositBeginning Balance 1,372.2 830.4 631.8 414.2 163.6Repayment 541.8 198.6 217.6 250.6 163.6Ending Balance 1,372.2 830.4 631.8 414.2 163.6 0.0
Interest Payment 39.4 26.2 18.7 10.3 2.9
Interest Rate 6.08%Financial Lease Obligations
Beginning Balance 145.9 126.3 109.0 94.5 81.8Repayment 19.6 17.3 14.5 12.7 11.6Ending Balance 145.9 126.3 109.0 94.5 81.8 70.2
Interest Payment 8.3 7.2 6.2 5.4 4.6
Interest Rate 3.050%Mortgages
Beginning Balance 60.1 56.0 54.8 37.7 0.1Repayment 4.1 1.2 17.1 37.6 0.1Ending Balance 60.1 56.0 54.8 37.7 0.1 0.0
Interest Payment 1.8 1.7 1.4 0.6 0.0
Deposits
Canadian Tire Corp.Long Term Debt Schedule
Interest Payment Schedule
Financial Lease Obligations
Mortgages

Canadian Tire Corporation| October 2016
As at million of Canadian dollars
2015 2016 2017 2018 2019 2020
Interest Rate 0%Promissory Note
Beginning Balance 2.3 2.3 2.3 2.3 2.3Repayment 0.0 0.0 0.0 0.0 0.0Ending Balance 2.3 2.3 2.3 2.3 2.3 2.3
Interest Payment 0.0 0.0 0.0 0.0 0.0
On Balance SheetCurrent Portion of L-T Debt 27.9 27.9 27.9 27.9 27.9Long Term Debt 2,944.1 2,926.7 2,896.0 2,847.5 2,837.9ST Deposit 533.0 405.5 265.9 105.0 0.0LT Deposit 830.4 631.8 414.2 163.6 0.0
Interest Payment Associated with Long Term Liabilities 142.7 129.4 121.7 112.8 106.0
On Cash Flow StatementCash Repayment for Long Term Liabilities 913.2 344.6 388.8 461.8 280.3
Promissory Note
Canadian Tire Corp.Long Term Debt Schedule
Interest Payment Schedule

Canadian Tire Corporation| October 2016
As at million of Canadian dollars
2015 2016 2017 2018 2019 2020Inflation Rate 1.80% 2.20% 2.10% 2.00% 2.20%
LandCost Balance Beg. 861.0 874.4 888.0 902.0 916.2 930.7Addition 13.4 13.6 13.9 14.2 14.5 14.8Cost Balance End. 874.4 888.0 902.0 916.2 930.7 945.6
Acc. Dep. Beg. (4.4) (6.6) (8.8) (11.0) (13.2) (15.4)Addition (2.2) (2.2) (2.2) (2.2) (2.2) (2.2)Acc. Dep. End. (6.6) (8.8) (11.0) (13.2) (15.4) (17.6)
BuildingsCost Balance Beg. 2857.7 2915.9 2975.1 3035.7 3097.5 3160.6Addition 58.2 59.2 60.6 61.8 63.1 64.4Cost Balance End. 2915.9 2975.1 3035.7 3097.5 3160.6 3225.0
Acc. Dep. Beg. (1289.8) (1385.8) (1485.0) (1586.2) (1689.4) (1794.8)Addition (96.0) (99.2) (101.2) (103.3) (105.4) (107.5)Acc. Dep. End. (1385.8) (1485.0) (1586.2) (1689.4) (1794.8) (1902.3)
FixtureCost Balance Beg. 1071.9 1216.6 1363.9 1514.4 1668.2 1824.9Addition 144.7 147.3 150.5 153.7 156.8 160.2Cost Balance End. 1216.6 1363.9 1514.4 1668.2 1824.9 1985.2
Acc. Dep. Beg. (712.0) (794.8) (908.5) (1034.7) (1173.7) (1325.8)Addition (82.8) (113.7) (126.2) (139.0) (152.1) (165.4)Acc. Dep. End. (794.8) (908.5) (1034.7) (1173.7) (1325.8) (1491.2)
Leasehold ImprovementCost Balance Beg. 1001.1 1140.7 1282.8 1428.1 1576.3 1727.6Addition 139.6 142.1 145.2 148.3 151.3 154.6Cost Balance End. 1140.7 1282.8 1428.1 1576.3 1727.6 1882.2
Acc. Dep. Beg. (365.7) (436.2) (521.7) (616.9) (722.0) (837.2)Addition (70.5) (85.5) (95.2) (105.1) (115.2) (125.5)Acc. Dep. End. (436.2) (521.7) (616.9) (722.0) (837.2) (962.7)
Projected
Canadian Tire Corp.Depreciation Schedule

Canadian Tire Corporation| October 2016
As at million of Canadian dollars
2015 2016 2017 2018 2019 2020
Asset Under Finance LeaseCost Balance Beg. 256.5 262.8 269.2 275.8 282.5 289.3Addition 6.3 6.4 6.6 6.7 6.8 7.0Cost Balance End. 262.8 269.2 275.8 282.5 289.3 296.3
Acc. Dep. Beg. (157.5) (168.2) (186.1) (204.5) (223.4) (242.6)Addition (10.7) (17.9) (18.4) (18.8) (19.3) (19.8)Acc. Dep. End. (168.2) (186.1) (204.5) (223.4) (242.6) (262.4)
Construction In ProcessCost Balance Beg. 224.3 359.4 496.9 637.5 781.0 781.0Addition 135.1 137.5 140.6 143.5 0.0 0.0Cost Balance End. 359.4 496.9 637.5 781.0 781.0 781.0
Acc. Dep. Beg. 0.0 0.0 0.0 0.0 0.0 0.0Addition 0.0 0.0 0.0 0.0 0.0 0.0Acc. Dep. End. 0.0 0.0 0.0 0.0 0.0 0.0
Total Gross PP&E 6769.8 7276.1 8016.2 8772.1 9396.9 10035.1Total Accumulated Depreciation (2791.6) (3110.1) (3453.3) (3821.7) (4215.8) (4636.1)Total Net PP&E 3978.2 4388.7 4790.5 5182.8 5418.2 5641.2
CAPEX For Operating 497.3 506.3 517.4 528.3 392.4 401.1Other CAPEX 218.8 222.7 227.6 232.4 237.1 242.3Total CAPEX 716.1 729.0 745.0 760.7 629.5 643.4
318.5 343.2 368.4 394.1 420.4Total Depreciation 318.5 343.2 368.4 394.1 420.4
Canadian Tire Corp.Depreciation Schedule
Projected
Canadian Tire Corporation| October 2016
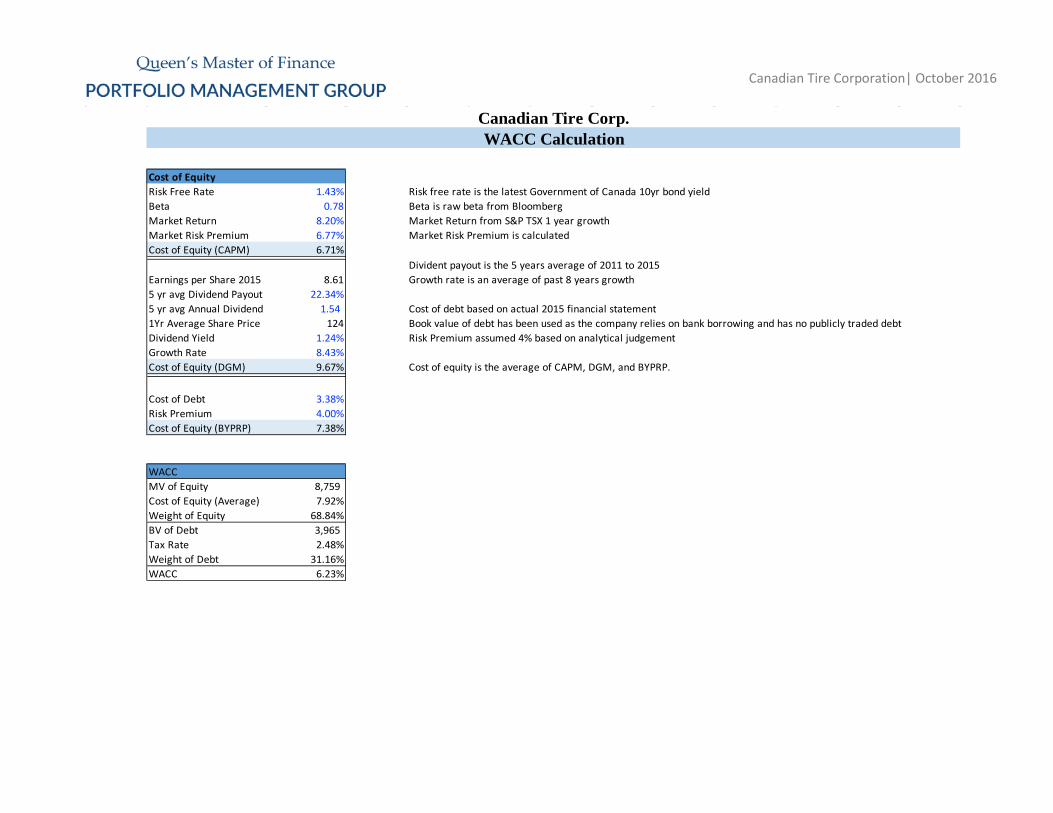
Cost of EquityRisk Free Rate 1.43% Risk free rate is the latest Government of Canada 10yr bond yieldBeta 0.78 Beta is raw beta from BloombergMarket Return 8.20% Market Return from S&P TSX 1 year growthMarket Risk Premium 6.77% Market Risk Premium is calculatedCost of Equity (CAPM) 6.71%
Divident payout is the 5 years average of 2011 to 2015Earnings per Share 2015 8.61 Growth rate is an average of past 8 years growth5 yr avg Dividend Payout 22.34%5 yr avg Annual Dividend 1.54 Cost of debt based on actual 2015 financial statement1Yr Average Share Price 124 Book value of debt has been used as the company relies on bank borrowing and has no publicly traded debtDividend Yield 1.24% Risk Premium assumed 4% based on analytical judgementGrowth Rate 8.43%Cost of Equity (DGM) 9.67% Cost of equity is the average of CAPM, DGM, and BYPRP.
Cost of Debt 3.38%Risk Premium 4.00%Cost of Equity (BYPRP) 7.38%
WACCMV of Equity 8,759 Cost of Equity (Average) 7.92%Weight of Equity 68.84%BV of Debt 3,965 Tax Rate 2.48%Weight of Debt 31.16%WACC 6.23%
WACC CalculationCanadian Tire Corp.

Canadian Tire Corporation| October 2016
Canadian Tire Corp.
Income Tax Schedule for Calculating UFCF
(C$ Millions)Projected
Tax Rate 26.5% 2016 2017 2018 2019 2020
Earnings Before INTEREST and Taxes A $1,098.9 $1,150.0 $1,150.8 $1,152.4 $1,190.2
Add Back Accounting Depreciation 318.5 343.2 368.4 394.1 420.4Deduct CCA for Tax Purposes 257.8 266.6 277.3 289.7 303.8Earnings Before TLCF after CCA 1,159.6 1,226.7 1,241.9 1,256.7 1,306.7
Tax Loss Carry Forward ScheduleExisting TLCF - Initial Balance 0.0 0.0 0.0 0.0 0.0Existing TLCF Used 0.0 0.0 0.0 0.0 0.0Earnings after use of Existing TLCF 0 0.0 0.0 0.0 0.0 0.0
Newly Created TLCF - Beginning 0.0 0.0 0.0 0.0 0.0Newly Created TLCF Used (Added) 0.0 0.0 0.0 0.0 0.0Newly Created TLCF - Ending 0 0.0 0.0 0.0 0.0 0.0
Remaining Existing TLCF 0.0 0.0 0.0 0.0 0.0Total TLCF Available 0.0 0.0 0.0 0.0 0.0
Taxable Income (after CCA and TLCF) B $1,159.6 $1,226.7 $1,241.9 $1,256.7 $1,306.7
Accounting Taxes (26.5% of A) 291.2 304.8 305.0 305.4 315.4
Taxes as Appearing on Income StatementCurrent Tax (26.5% of B) 307.3 325.1 329.1 333.0 346.3Increase (Decrease) in Deferred Income Taxes (16.1) (20.3) (24.1) (27.7) (30.9)Total Income Taxes (Same as Accounting Taxes Above) 291.2 304.8 305.0 305.4 315.4
CCA ScheduleBlended CCA Rate 12.0% 2016 2017 2018 2019 2020
UCC Beginning C 1,989.1 2,049.8 2,126.4 2,217.5 2,321.9Plus: New Capex D 318.5 343.2 368.4 394.1 420.41/2 of New Capex 159.2 171.6 184.2 197.0 210.2UCC After New Capex (1/2 Year) 2,148.3 2,221.4 2,310.6 2,414.6 2,532.0Less: CCA Available and Used E 257.8 266.6 277.3 289.7 303.8UCC Ending (C + D - E) 1989 $2,049.8 $2,126.4 $2,217.5 $2,321.9 $2,438.4

Canadian Tire Corporation| October 2016
(C$ Millions) Projected2016 2017 2018 2019 2020 Term.
Unlevered Free Cash FlowEBITDA 1,417.4 1,493.2 1,519.2 1,546.5 1,610.5 1,646.5Current Taxes (307.3) (325.1) (329.1) (333.0) (346.3) (322.7)Changes in working capital (170.0) (290.0) (214.7) (46.5) (63.0) 0.0CAPEX (729.0) (745.0) (760.7) (629.5) (643.4) (656.2)Unlevered Free Cash Flow (DCF Valuation) $211.1 $133.1 $214.7 $537.5 $557.9 $667.6
CHECK CALCULATION ON UFCF
Unlevered Free Cash FlowNet Income 690.3 730.3 729.1 729.3 757.1 895.0Depreciation 318.5 343.2 368.4 394.1 420.4 428.8Deferred Income Taxes (16.1) (20.3) (24.1) (27.7) (30.9) 0.0Interest Expense 159.6 156.4 158.9 160.1 160.1 0.0Tax Shelter on Interest Expense (42.3) (41.4) (42.1) (42.4) (42.4) 0.0Changes in working capital (170.0) (290.0) (214.7) (46.5) (63.0) 0.0CAPEX (729.0) (745.0) (760.7) (629.5) (643.4) (656.2)Unlevered Free Cash Flow 211.1 133.1 214.7 537.5 557.9 667.6
Check 0.000 0.000 0.000 0.000 0.000 0.000
Unlevered Free Cash Flow ScheduleCanadian Tire Corp.

Canadian Tire Corporation| October 2016
Canadian Tire Corp.DCF Valuation Schedule
(C$ Millions, except per share amounts)
WACC Terminal Value Growth Rate1.80% 1.90% 2.00% 2.10%
6.2% PV of Cash Flows 1,371 1,371 1,371 1,371PV of Terminal Year 11,491 11,757 12,035 12,326Enterprise Value $12,862 $13,128 $13,406 $13,698
Less Net Debt (12/31/16) 2,971 2,971 2,971 2,971Equity Value $9,891 $10,156 $10,435 $10,726
Shares O/S (MM) - (12/31/16) 77 77 77 77Equity Value per Share $167.95 $171.42 $175.05 $178.86
6.5% PV of Cash Flows 1,361 1,361 1,361 1,361PV of Terminal Year 10,762 10,997 11,243 11,500Enterprise Value $12,124 $12,359 $12,605 $12,861
Less Net Debt (12/31/16) 2,971 2,971 2,971 2,971Equity Value $9,152 $9,387 $9,633 $9,890
Shares O/S (MM) - (12/31/16) 77 77 77 77Equity Value per Share $158.31 $161.38 $164.59 $167.94
6.7% PV of Cash Flows 1,352 1,352 1,352 1,352PV of Terminal Year 10,109 10,318 10,537 10,764Enterprise Value $11,461 $11,670 $11,888 $12,116
Less Net Debt (12/31/16) 2,971 2,971 2,971 2,971Equity Value $8,489 $8,699 $8,917 $9,145
Shares O/S (MM) - (12/31/16) 77 77 77 77Equity Value per Share $149.65 $152.39 $155.24 $158.21
7.0% PV of Cash Flows 1,342 1,342 1,342 1,342PV of Terminal Year 9,520 9,708 9,903 10,106Enterprise Value $10,862 $11,050 $11,245 $11,448
Less Net Debt (12/31/16) 2,971 2,971 2,971 2,971Equity Value $7,891 $8,078 $8,273 $8,476
Shares O/S (MM) - (12/31/16) 77 77 77 77Equity Value per Share $141.84 $144.29 $146.83 $149.48
Canadian Tire Corporation| October 2016
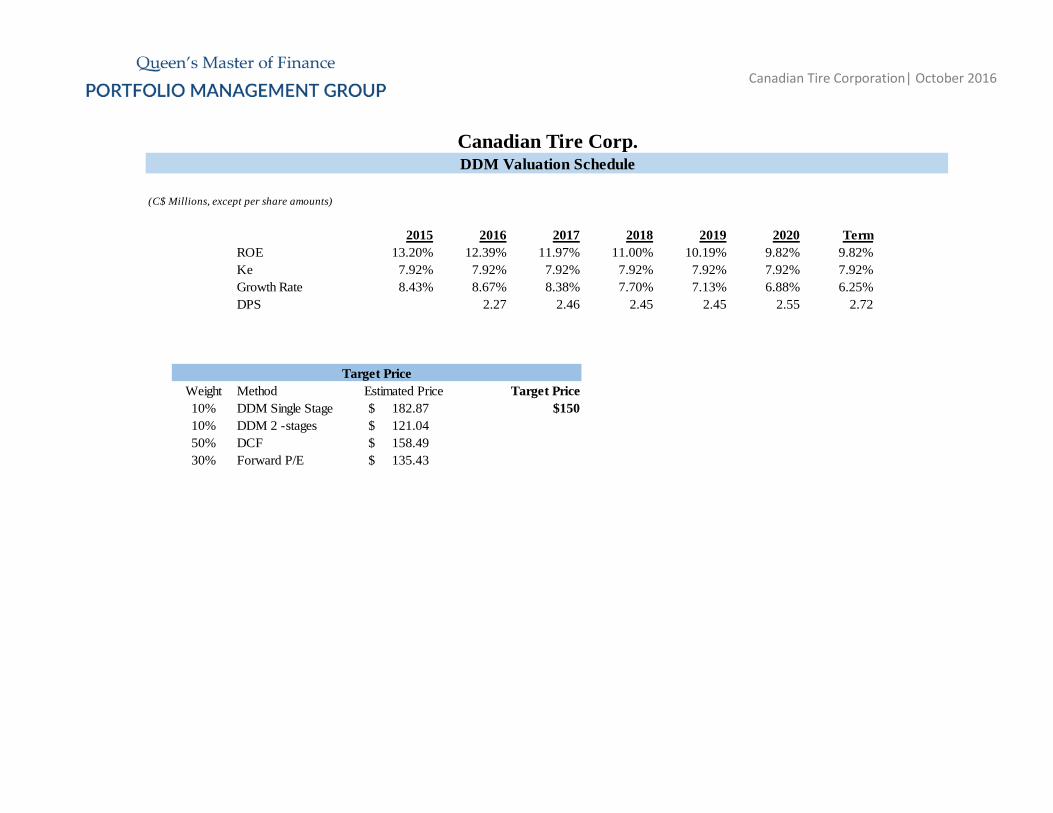
(C$ Millions, except per share amounts)
2015 2016 2017 2018 2019 2020 TermROE 13.20% 12.39% 11.97% 11.00% 10.19% 9.82% 9.82%Ke 7.92% 7.92% 7.92% 7.92% 7.92% 7.92% 7.92%Growth Rate 8.43% 8.67% 8.38% 7.70% 7.13% 6.88% 6.25%DPS 2.27 2.46 2.45 2.45 2.55 2.72
Weight Method Estimated Price Target Price10% DDM Single Stage 182.87$ $15010% DDM 2 -stages 121.04$ 50% DCF 158.49$ 30% Forward P/E 135.43$
Target Price
Canadian Tire Corp.DDM Valuation Schedule

Canadian Tire Corporation| October 2016
Disclosures About Queen’s MFin Portfolio Management Group
Queen’s Master of Finance Portfolio Management Group (PMG) seeks to invest a portion of the Queen’s endowment. We aim to reinvest our investment proceeds to benefit the Queen’s MFin program and PMG. Furthermore, a large part of the program is relevant to investment management and we believe PMG offers an excellent platform for transition to real-life application.
The purpose of our fund is to not only bridge the gap between the classroom and practical application, but we also seek to cultivate investment intuition and entrepreneurial instincts in our members while refining leadership and collaboration skills as well. The fund is directed by students and recent graduates in its entirety.
While our long-term investments follow a value-oriented selection process, we may also employ a macro-tactical framework to capitalize on short-term opportunities. Our Annual Investment Outlook helps provide direction for the latter approach, whereas the former is driven partly via fundamental analysis, sector-specific focus and the Annual Investment Outlook.
Queen’s MFin Portfolio Management Group Disclaimer
Queen’s MFin PMG is an independent investment research student-run organization. Queen’s MFin PMG is not a registered broker dealer and does
not have investment banking operations. This report is not an offer to sell or a solicitation of an offer to buy any security. Nothing in this report constitutes individual investment, legal or tax advice. Queen’s MFin PMG shall accept no liability for any loss arising from the use of this report, nor shall Queen’s MFin PMG treat all recipients of this report as customers simply by virtue of their receipt of this material. Investments involve risk and an investor may incur either profits or losses. Past performance should not be taken as an indication or guarantee of future performance. Queen’s MFin PMG executives, analysts, and/or members may from time to time have long or short positions in, act as principal in, and buy or sell, the securities or derivatives, if any, referred to in this research. The information contained in this research report is produced and copyrighted by Queen’s MFin PMG. No part of this material may be (i) copied, photocopied or duplicated in any form by any means or (ii) redistributed without the prior written consent of Queen’s MFin PMG.