canary: a scheduling architecture for high …hci.stanford.edu/cstr/reports/2016-01.pdfcanary: a...
TRANSCRIPT
Canary: A Scheduling Architecture for High Performance CloudComputing
Hang Qu, Omid Mashayekhi, David Terei, Philip LevisStanford University
{quhang, omidm}@stanford.edu, {dterei, pal}@cs.stanford.edu
AbstractWe present Canary, a scheduling architecture that allowshigh performance analytics workloads to scale out to runon thousands of cores. Canary is motivated by the ob-servation that a central scheduler is a bottleneck for highperformance codes: a handful of multicore workers canexecute tasks faster than a controller can schedule them.
The key insight in Canary is to reverse the responsi-bilities between controllers and workers. Rather thandispatch tasks to workers, which then fetch data as nec-essary, in Canary the controller assigns data partitions toworkers, which then spawn and schedule tasks locally.
We evaluate three benchmark applications in Canaryon up to 64 servers and 1,152 cores on Amazon EC2.Canary achieves up to 9−90× speedup over Spark andup to 4× speedup over GraphX, a highly optimized graphanalytics engine. While current centralized schedulerscan schedule 2,500 tasks/second, each Canary worker canschedule 136,000 tasks/second per core and experimentsshow this scales out linearly, with 64 workers schedulingover 120 million tasks per second, allowing Canary tosupport optimized jobs running on thousands of cores.
1 Introduction
Data analytics frameworks such as Spark [36] and Na-iad [24] provide high-level programming abstractions thatoperate on datasets far too large for a single server’s mem-ory. These frameworks parallelize an application (calleda job) across tens or hundreds of servers by breaking itinto many small tasks. Many data analytics applicationsare CPU-bound [27]; breaking them into small tasks letsthem use more cores, and parallelizing across more coresreduces completion time.
Micropartitioning each computational step (a stage)into multiple tasks per core can reduce completion timefurther. Cloud analytics applications have highly variabletask execution times: some tasks can run twice or ten
times as long as others, due to data skew or variations innode performance. [4] If each stage is micropartitionedinto multiple tasks per core, busy cores can shed tasksto idle ones. Furthermore, the runtime can interleavecomputation and communication, sending the results ofone task while computing the results of a second. [31]
But increasing the number of tasks has a cost. Althoughan analytics job is parallelized across many servers (calledworkers), a single server, the controller, is responsible forscheduling tasks for many jobs to a shared cluster of work-ers. A modern analytics controller can schedule 1,500-2,500 tasks per second. As the number of workers andtasks increases, the scheduler becomes a bottleneck. [28]
Systems such as Sparrow [28], Omega [32], Apollo [6],and Mercury [19] try to sidestep the scheduler bottle-neck by allowing each job to have its own private sched-uler. Through a variety of mechanisms (monitoringworker load, batching, power of two choices, central loaddatabases), these systems allow each scheduler to find anduse idle cores in a shared cluster while preventing flashmobs or other synchronized behaviors.
But even a single optimized job can easily saturate ascheduler. In Section 2, we show a C++ implementationof a standard analytics benchmark that executes threetasks per core every 470ms. Tasks take on average 150msto complete, so each core can run 6 tasks/second. ModernAmazon EC2 instances (m4.10xlarge) have 40 cores: asingle job running on 8 workers (320 cores) can execute2,000 tasks/second, close to the limit of a modern con-troller. As CPU-bound analytics workloads increasinglycall into GPUs or native C libraries to improve perfor-mance and the number of cores per processor increases,scheduling and controllers are emerging as a bottleneck.
MPI-based high performance computing applicationscan scale to run on tens of thousands of cores with tasksthat are as short as tens or hundreds of microseconds byhaving no controller at all. Without a controller, however,no node knows the overall network and application state.Accordingly, MPI applications are notoriously difficult
1
to load balance, and so use one task per core and arecarefully designed so that each stage’s tasks have near-uniform execution times, in some cases even by runningempty loops. Furthermore, the lack of a central controllermakes MPI applications brittle to faults and failures.
This paper proposes a new scheduling architecture,called Canary, that can support orders of magnitude moretasks per second than existing approaches. The key insightbehind Canary is to reverse the responsibilities betweencontrollers and workers. Rather than have a controllerschedule tasks to workers, which are then responsiblefor fetching data, in Canary the controller only decideshow data are distributed on workers. Each worker locallyspawns its own tasks based on the current program posi-tion and the data partitions the controller has assigned toit. The controller remains responsible for load balancingand fault tolerance, while workers take on the responsi-bility of scheduling and executing the job in a distributedway.
Canary is implemented in a C-based data analyticsframework written from scratch because the performanceof existing open-source frameworks falls far behind a fullyoptimized implementation [23]. The inefficiency of theseframeworks prevents understanding realistic workloadcharacteristics because their tasks run so slowly. In Sec-tion 2 we show how simple C++ re-implementations ofanalytics benchmarks in this framework can speed themup by factors of 4-90 over Spark [36] and GraphX [14].
This paper evaluates Canary’s scalability using threeapplications, logistic regression, k-means clustering andPageRank. Our results show that using Canary, a singlecore can schedule 136,000 tasks/second, and a 64-node,1152-core cluster can schedule 120 million tasks per sec-ond. This allows Canary to run benchmarks orders ofmagnitude faster as the scheduler is no longer a bottle-neck. This paper makes three research contributions:
• an analysis that shows centralized scheduling cannotscale because scheduler load grows quadratically withthe number of cores,
• a novel scheduling architecture which scales to supportorders of magnitude more tasks per second by decou-pling data placement management and task executionscheduling, and
• optimized implementations of three data analytics ap-plications that demonstrate the benefits of a highly scal-able scheduler.
Section 2 gives an overview of the performance bot-tlenecks of existing analytics frameworks and why theirscheduling architecture limits the scale at which theirapplications can run. Section 3 presents the Canary sys-tem architecture, Section 4 presents the design of Canaryworkers, and Section 5 evaluates its performance and scal-ability. Section 6 describes the related work that Canary
extends and builds on, and Section 7 concludes.
2 Motivation: Scalable Scheduling
This section gives an overview of analytics frameworksand their current bottlenecks. It shows how numerousoptimizations to analytics have a corresponding cost: thetask rate, or number of tasks per second the job executes,goes up, increasing load on the scheduler. Optimizinganalytics codes (e.g., using C rather than functional Scalacode) can improve performance and increase the task rateby a factor of 90. Scaling out a CPU-bound workload tomore cores causes the task rate to increase quadraticallywith the number of cores used. Finally, breaking a job intosmaller tasks reduces job completion time by allowingmore flexible load balancing, but also increases the taskrate. Together, these results mean that existing schedulerscan barely keep up with a handful of well-tuned workers.This motivates the need for a new scheduling architecturethat can handle orders of magnitude more tasks per secondthan current schedulers do.
2.1 The Cost of Fast Analytics
The power of MapReduce [9], Pregel [22], Spark [36] andother distributed computation frameworks is in great partdue to their ability to scale out to run on many nodes inparallel. For I/O-centric workloads, which MapReducetargets, individual tasks can take tens or hundreds of sec-onds [7] and so even when scaled out to large numbers ofmachines the aggregate number of tasks per second thesystem must schedule is low. Furthermore, because theseworkloads are I/O bound, rather than compute bound,the increasing number of cores per CPU does not greatlyincrease task rate.
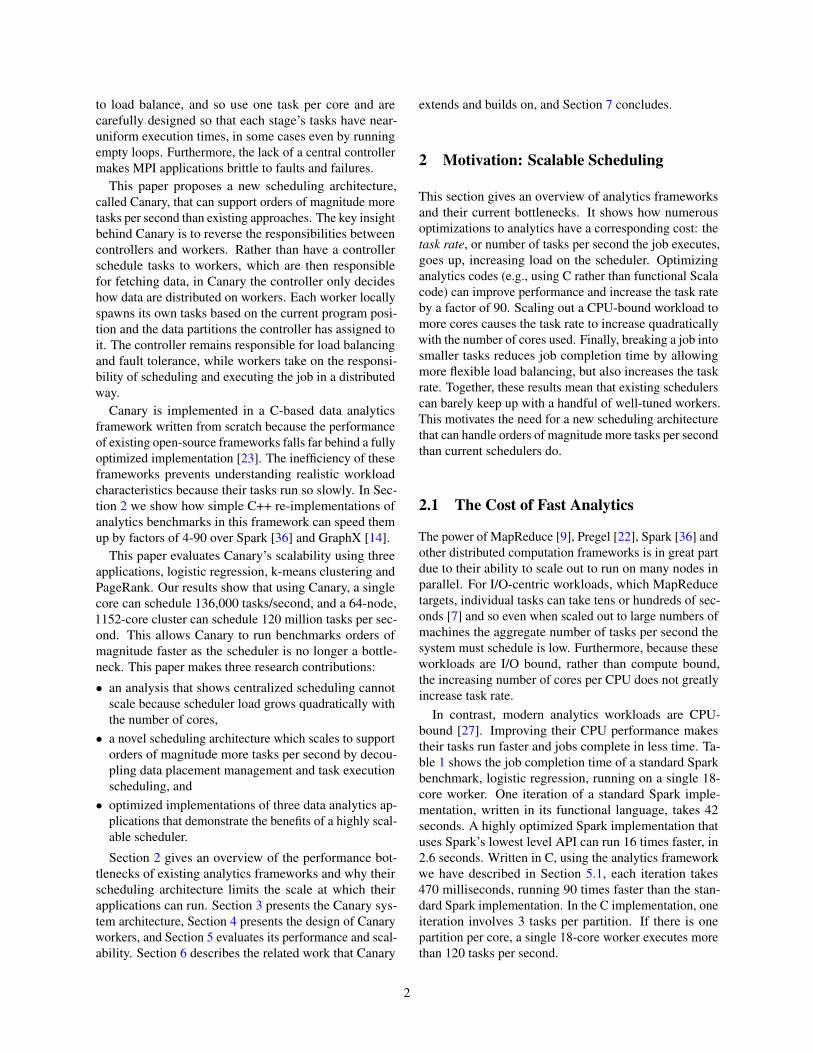
In contrast, modern analytics workloads are CPU-bound [27]. Improving their CPU performance makestheir tasks run faster and jobs complete in less time. Ta-ble 1 shows the job completion time of a standard Sparkbenchmark, logistic regression, running on a single 18-core worker. One iteration of a standard Spark imple-mentation, written in its functional language, takes 42seconds. A highly optimized Spark implementation thatuses Spark’s lowest level API can run 16 times faster, in2.6 seconds. Written in C, using the analytics frameworkwe have described in Section 5.1, each iteration takes470 milliseconds, running 90 times faster than the stan-dard Spark implementation. In the C implementation, oneiteration involves 3 tasks per partition. If there is onepartition per core, a single 18-core worker executes morethan 120 tasks per second.
2
Time (s) Tasks/sec
Spark (functional) 42.36 0.4Spark (imperative) 6.52 2.8Spark (low level API) 2.59 7.0Canary 0.47 123.4
Table 1: Execution time and task rate of one itera-tion of a logistic regression job that processes 20GBof training data on a server with 18 physical cores.Each Spark iteration is 18 tasks (1 per core) whileeach Canary iteration is 58 tasks (3 tasks per coreplus 4 global tasks). Spark (functional) is the standardimplementation which uses functional operators likemap and zip. Imperative replaces the functional oper-ators with loops. Low level API uses mapPartitionsto manually iterate over data. Canary is a C++ imple-mentation.
2.2 The Cost of Scaling Out
Scaling out to more workers both increases the numberof tasks that must be scheduled and decreases how longeach of those tasks takes. As a result, the number of tasksper second that must be scheduled increases quadraticallywith the number of worker cores.
Suppose we have a CPU-bound analytics job which,if all data are in memory, takes C cycles to compute. IfC is evenly distributed across W worker cores, then ascheduler will need to schedule one task per stage percore, or W tasks. If the job is CPU-bound and scaleswell, then parallelizing it across W cores will cause it torun W times faster; the computation will take C
W time. Ascheduler’s load is therefore
Θ
(WCW
)= Θ
(W 2
C
)(1)
tasks per second. As long as C does not change muchwith greater parallelism, the task rate a job generates fora scheduler scales with Θ(W 2).
2.3 The Cost of Utilization
Recent research [26] as well as experiences of core mem-bers of Google’s datacenter software [8] have shown thatmicropartitioning a computational stage more finely thanone partition per core has significant benefits. Microparti-tioning enables better load balancing and faster comple-tion times. If some tasks take longer than others (e.g., dueto data skew), then workers with longer tasks can shedsome of their other tasks to less heavily loaded workers.Prior work shows that micropartitioning a stage into 10-20tasks/core has significant performance benefits, reducing
completion time by a factor of 2-10 by keeping cores athigh utilization.
Suppose each stage in a job is split into P tasks per core.Following the analysis above, this means the number oftasks that must be scheduled grows with Θ(P ·W 2).
2.4 The Need for a New Scheduling Archi-tecture
Applying these analyses to the performance numbers pre-sented above, a single worker running the logistic re-gression benchmark in Table 1 with P = 10 (a commonsetting), can execute 1,200 tasks per second. If the jobwere parallelized to run on two workers, completion timewould be halved, but there would be twice as many tasksto execute, so the task rate would increase by a factorof 4, to 4,800 tasks per second. Scaling out the job to8 workers would increase the task rate to 16 · 4,800, ornearly 80,000, tasks per second.
Modern analytics controllers can schedule 2,000 -3,000 tasks per second.1 If jobs run CPU-optimized codeand try to parallelize to many modern multi-core ma-chines, the scheduler quickly becomes a bottleneck; wedefer a detailed presentation of our experimental resultsto Section 5, but for basic benchmarks written in Spark,the Spark scheduler is already a bottleneck for 32 18-coreworkers when P = 1, and setting P = 10 limits Spark to 3workers.
If next generation frameworks are to scale out for highperformance analytics workloads, they will need a newscheduling architecture. The next section describes suchan architecture, whose scheduler’s load is independent ofthe number of workers and instead only acts when load isrebalanced across workers.
3 System Overview
Canary is a distributed scheduler architecture for clouddata processing systems. The key insight behind Canary isthat a worker can determine which tasks it should executebased on what data partitions it has in memory. By placingthe data partitions a task uses onto a worker, the controllerimplicitly assigns that task to that worker. In the extremecase, if every worker knows the placement of every datapartition and partitions never move, workers can run andcomplete an entire job without any controller coordination.This section describes the system architecture, executionmodel, and central controller. The next section providesdetails on how workers locally spawn and schedule tasksas well as how they exchange data and migrate partitions.
1Ousterhout et al. report the Spark scheduler can handle 1,500 tasksper second. Our measurements in Section 5 show that a recent Sparkrelease (1.5.2, November 2015) improves the throughput to 2,600 tasksper second.
3
RDDlineage DriverProgram
Par//onManagerMaster
P1 P3 W2 W2
P2 W1
T1 T2
T4
T3
Scheduler
TaskGraph
Par//onManagerSlave
P1 W2
P2 W1 T1
T2
TaskQueue
Reportdat
a
placement
Slavesreportlocalpar//ons
Par//onManagerSlave
P1 W2
P3 W2 T3
TaskQueue
SparkController
SparkWorker1 SparkWorker2
(a) Existing centralized scheduling architecture.
Par$$onManager
P1 P3 W2 W2
P2 W1
Snapshot
Scheduler Decidedataplacement
Broadcastdataplacement
CanaryController
CanaryWorker1 CanaryWorker2
Par$$onManagerReplica
P1 P3 W2 W2
P2 W1
T3
Scheduler
Par$$onManagerReplica
P1 P3 W2 W2
P2 W1
T1 Taskgraph
Specifyastagetosnapshotat
T1
T3 Taskqueue
Driverprogram
T4
Scheduler
T2 Taskgraph T2
Taskqueue
Driverprogram
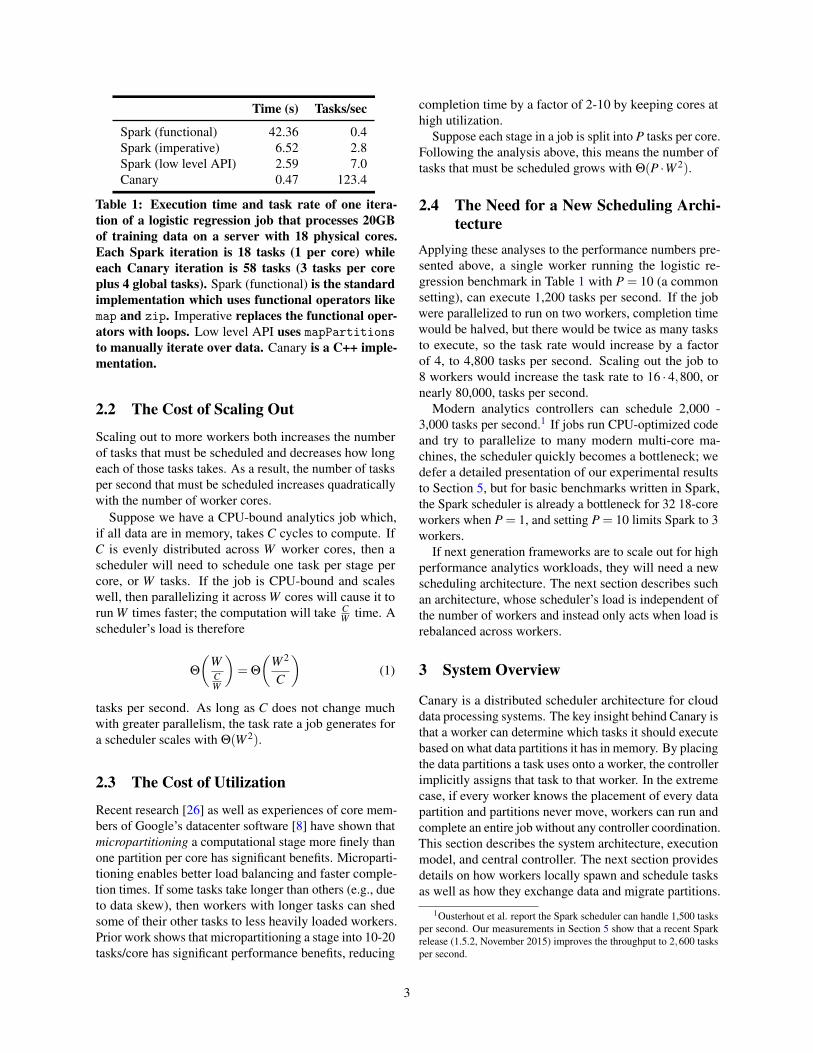
(b) Canary scheduling architecture.Figure 1: The Canary controller distributes task generation, and task dependency analysis to workers. Canaryworkers infer what tasks to run based on what data partitions are local, reason about task dependency from alocal driver program copy, and decide what tasks to run and when, all without the controller’s help.
3.1 Architecture
A Canary controller is responsible for deciding how datapartitions are distributed across workers, deciding whenpartitions should migrate between workers, and coordinat-ing partition migrations to maintain program correctness.Each Canary worker has a copy of the driver program,which it uses to locally spawn and schedule tasks. It de-cides which tasks to spawn based on what data partitionsare resident in its local memory, as determined by the con-troller. Controllers today decide task placement and leaveit to workers to move partitions so they can execute thosetasks. Canary inverts this model, as its controller decidespartition placement and leaves it to workers to generatethe tasks to compute on their data. Figure 1 shows theCanary architecture in comparison to existing schedulerarchitectures.
Canary’s model makes two assumptions about how datapartitions behave. First, it assumes that the set of datapartitions changes slowly. For analytics workloads, whichtypically involve many iterations over in-memory data(e.g., graph algorithms, regression, signal processing),this assumption is valid. If workers are continually gener-ating many new, short-lived partitions, then this activitycould lead to significant load at the controller. Second,it assumes there are far fewer data partition migrationevents than tasks executions, that is, a worker will executemany tasks on a partition before possibly migrating it.This assumption is valid for any CPU-bound workload,as migrating a partition generally takes much more thanthan computing tasks on it; if there are many migrationevents, the workload is I/O, rather than compute, bound.
3.2 Execution Model
Canary’s execution model is very similar to other cloudcomputing frameworks. A job is written as a driver, a se-quential program whose variables are large datasets. Eachvariable has an associated partitioning function, whichdefines how many partitions the variable is split into. Theprogram can apply parallel operations on these datasets,which perform the computation on the partitions in par-allel. Just as in Spark, if an operator takes multiple vari-ables as input, each of those variables must have the samepartitioning. Otherwise, it is not possible to properlyparallelize the computation. Moving data from one par-titioning to another is a shuffle operation, just as in theMapReduce programming model.
Canary’s execution and programming model differsfrom centralized schedulers in one important way: allvariables are datasets. Because there is no single, cen-tralized copy of the driver program, there is no notionof a scalar variable such as a loop counter or a parame-ter passed through a closure (as is common with Spark).Since the driver executes on every worker, such a variablewould be replicated across them. Instead, a program candefine a dataset that has a single partition; it is then up tothe controller to decide where this partition resides.
The execution model allows loops or conditionalbranches based on runtime results, with one constraint.Every worker must make the same runtime control flowdecision, i.e., running the same number of iterations andtaking the same conditional branch. As explained in Sec-tion 4.4, this is so that workers have a consistent enoughview of program execution that they can correctly migratepartitions and exchange data. Since there are no global
4

variables, this implicitly means that any conditional exe-cution requires a barrier operation.
3.3 ControllerThe Canary controller has four major responsibilities:
• compute and update the partition map, which speci-fies how partitions are distributed across workers,• distribute the partition map to workers,• coordinate worker execution so they migrate parti-
tions safely when it changes the partition map, and• decide when workers should store a snapshot of their
partitions to durable storage for failure recovery.
A data partition is named by a (name,index) tuple. Nameis the variable name in the program, and index is an in-teger in the range of [0,n−1], where n is the number ofpartitions. The partition map is a table that specifies, foreach partition, which worker has that partition in memory.In-memory partitions are not replicated. If a worker fails,the controller instructs other workers to reload the lostpartitions from the last snapshot to durable storage, whichis replicated. If the snapshot is old enough that it is notpossible to recover the current state of a partition, thecontroller asks other workers to restore their partitions aswell, rolling the entire computation back to the snapshot.
The controller periodically queries workers for loadinformation, including how much time their CPU is idleand how much CPU time they have spent computingtasks on each partition. When a worker is completingstages significantly slower than the average, the controllerchooses another (lightly loaded) worker and moves someof the slow worker’s partitions to the lightly loaded one.It does this by updating the partition map, sending thoseupdates to every worker, and sending control messages tothe workers to perform the transfer. Section 4.4 describeshow the workers independently coordinate when to safelyperform the transfer among themselves.
The partition map is a table, so updates involve simplechanges to the worker field of the rows for migrating par-titions. One important property of distributing partitionmap updates is that they do not need to be strongly consis-tent: sequential consistency is sufficient. This is becausemigrations, since they rely on explicit commands from thecontroller, do not directly use the partition map. Instead,the principal role the partition map plays on a worker isto inform it whom it needs to exchange data with. Incases where a worker’s partition map is stale or incorrect,the data exchange protocol described in Section 4.2 candetect this and update the stale partition map.
Workers autonomously generate tasks based on whichpartitions they have. It is therefore possible to distributepartitions in a way that will prevent a program from exe-cuting. For example, consider a stage S that has two inputs
A and B, each of which has two partitions, for a total of 4partitions: A1,A2,B1, and B2. If the controller places A1on one worker and A2,B1, and B2 on the other, then noworker can compute S(A1,B1). The controller thereforeuses the driver program to compute a set of constraints onwhat partition placements are valid and always updatesthe partition map in a way that meets these constraints.In the example above, if one worker had all four parti-tions and was overloaded, the controller would decide tomigrate either A1 and B1 or A2 and B2 simultaneously.
Tasks can compute on in-memory data much faster thanit can be written to durable storage or replicated acrossworkers. Therefore, rather than relying on replicatingin-memory data partitions, Canary borrows techniquesfrom high performance computing for durability and faulttolerance. This has the added benefit that it reduces mem-ory use and so allows a cluster to process larger datasets.A controller periodically sends workers a snapshot com-mand. The command specifies which stage the workersshould snapshot at. The selected stage must be a stagethat acts as a barrier, which all workers must completebefore continuing. A shuffle stage, for example, whichremaps data from one partitioning to another, is a barrierbecause all of the input partitions must be processed intooutput partitions before computation may continue. Whenthe workers complete execution of this stage, they stopexecution and store their partitions to durable storage.
3.4 DiscussionIf a job is executing smoothly and is well balanced, acontroller does little more than periodically collect perfor-mance information. This idleness is intentional, in orderto prevent the controller from becoming a bottleneck. Asa result, each worker core has much more responsibility:it must spawn and schedule tasks, coordinate partitionmigration, and transfer data with other workers. But be-cause this work is parallelized across every worker core, ittakes up at most a few percent of worker CPU cycles. Thenext section describes the abstractions and mechanismsworkers use to achieve this behavior.
4 Workers
The key challenge in Canary is enabling workers, in acompletely distributed way, to• correctly spawn tasks and compute their scheduling
dependencies,• exchange data with other workers,• maintain a consistent view of execution, and• migrate partitions.
The rest of this section explains how they do so. Toground these explanations in a concrete example, we use
5

write
read
sca*erW0
sum0
gatherG0
again?0
GW0
GG0
gatherW0
gradient0
sca*erG0
LW0
TD0
LG0
LW1
TD1
LG1
gatherW1
gradient1
sca*erG1
Figure 2: A logistic regression application imple-mented in Canary. Grey ovals are compute tasks,white ovals are communication tasks, and boxes arepartitions. LW is the local weight, TD is training data,LG is the local gradient, GW is the global weight andGG is the global gradient.
a standard data analytics benchmark, logistic regression.Logistic regression iteratively computes a gradient valuefor each data partition, combines the gradient values toderive a global weight value, then uses the global weightvalue as a parameter for the next iteration.
Figure 2 shows the structure of this application in termsof stages and datasets. To calculate a gradient value foreach training data partition, the gradient stage readsthe training data dataset and local weight datasetand writes the local gradient dataset. To sum up localgradient values to the global gradient value, a scatter stagepacks local gradient values as intermediate chunks, and agather stage sums up values in those intermediate chunksand writes to global gradient dataset.
4.1 Program Representation and Execu-tion
Each Canary worker has a full copy of the job’s driverprogram. The worker enumerates the stages in the pro-gram and uses these as identifiers to specify programposition. For each partition, the worker maintains whichwas the last stage that read from or wrote to that partition.Figure 3 shows the metadata a worker maintains for thelogistic regression application.
A Canary worker borrows the concept of a “softwareprocessor” from the Legion framework [5]. In this ap-proach, programs appear to run sequentially, but under-neath the runtime may execute stages out of order toimprove parallelism, just as a modern CPU does withinstructions. The worker is therefore responsible fordetermining stage dependencies, for example, that thescatterG communication stage in Figure 3 cannot run
sca$erW
gatherG
GG0
GW0
gatherW
gradient
sca$erG
LW0
TD0
LG0
:
:
:
:
: sum
again?
StageId Stage Par++on :Metadata
Programposi;on
sca$erW
71
72
73
74
75
76
77
78
66
72
67
70
71
...Figure 3: Metadata a worker keeps on the logistic re-gression application. Each stage has an identifier, anda worker keeps track of which was the last stage to ac-cess each partition.
until the gradient computational stage has completed.Given a driver program, the worker generates a depen-dency graph of its stages based on the datasets they readand write.
4.2 Data CommunicationCanary provides two communication abstractions. Thefirst is for data transfer. It is a scatter-gather operation,similar to MapReduce, Spark, and other frameworks. Theoperation takes two functions. The first, the scatter func-tion, takes one or more datasets and produces one or moredatasets as output. The key property of the scatter op-eration is that, while all of its input datasets must havethe same partitioning and all of its output datasets musthave the same partitioning, the input partitioning doesnot have to be the same as the output partitioning. Fur-thermore, unlike computational tasks, which only accessone partition of a dataset when they execute, a scatterfunction accesses any partition (hence “scatter”). Whenthe scatter completes, the worker uses the partition mapto determine where it should send any non-empty scatterpartitions. The gather function takes many partitions (themany pieces generated by different scatterers) and mergesthem into one.
Because a partition map can be stale, it is possible thata worker executing a scatter task will try to deliver inter-mediate results to the wrong worker. It is also possiblefor a worker to start receiving data for a partition it doesnot yet know it is responsible for. To handle these incon-sistencies, each entry in the partition map has a versionnumber associated with it. When the controller sends apartition map update, it increments the version numberof any changed entries. Whenever a worker sends datato another worker, it includes the version number in itsassociated partition map entry. If a worker receives a datatransfer for a partition it does not have and the sender hasa newer version of the partition map entry, it concludes
6
that it will soon own the partition and so holds the scatterdata. If the sender has an older version of the partitionmap entry, the receiver forwards the data to the correctdestination and assumes the sender will be updated soon.
The second communication abstraction is for control.It is a reliable broadcast of a replicated boolean variablecalled a signal. Signal functions are used for conditionsand loops. A signal function takes a dataset as input. Thisdataset must have a single partition (any other partitioningis a runtime error). It produces a boolean value as output.After the worker which has the input partition executesthe function, it broadcasts the result to every other workerin the system. Other workers, when they reach a signalfunction, wait to hear the broadcast.
4.3 Spawning Local TasksThe metadata that workers maintain is sufficient for themto quickly infer and spawn tasks locally. As a workerkeeps track of the last stage to access each of its localpartitions, it can, from its dependency graph, determinewhat are the next stages that will access it. For exam-ple, in Figure 3, the worker knows that the next stage toaccess local gradient will be the scatterG function.Whenever the worker updates which stage last accessed apartition, it checks each of the next task(s) to access thatdataset for whether all of their inputs are ready. If so, itspawns the task and adds it to a local run queue.
The key property of Canary’s execution model thatmakes this possible is its communication primitives. Be-cause any looping construct goes through a signal func-tion, this acts as a barrier across the workers. Similarly,any results which escape a worker and can affect compu-tations elsewhere must go through a scatter-gather, andso are a barrier. As a result, all of the workers agree onwhich iteration of a loop they are on, and correspondinglythe position in the sequential program can be defined pre-cisely enough to ensure that workers remain in sync withone another.
4.4 Partition MigrationSection 3.3 described how a controller tells two workersto migrate one or more data partitions. Because the con-troller does not know exactly where the workers are intheir execution, it cannot tightly coordinate this exchange.Canary makes the assumption that a slight delay in mi-grating the partition is acceptable, since the worst that canhappen is the job will run an additional iteration with aload imbalance.
When a worker receives a command to migrate a parti-tion, it marks that partition with a flag. When the workerconsiders whether it can spawn a task, it always considersa flagged partition as not ready, and so will not spawn
0 10 20 30 40 50 60 70
Average task length (µs)
40
60
80
100
CP
Uut
iliza
tion
(6.6µs, 90%)
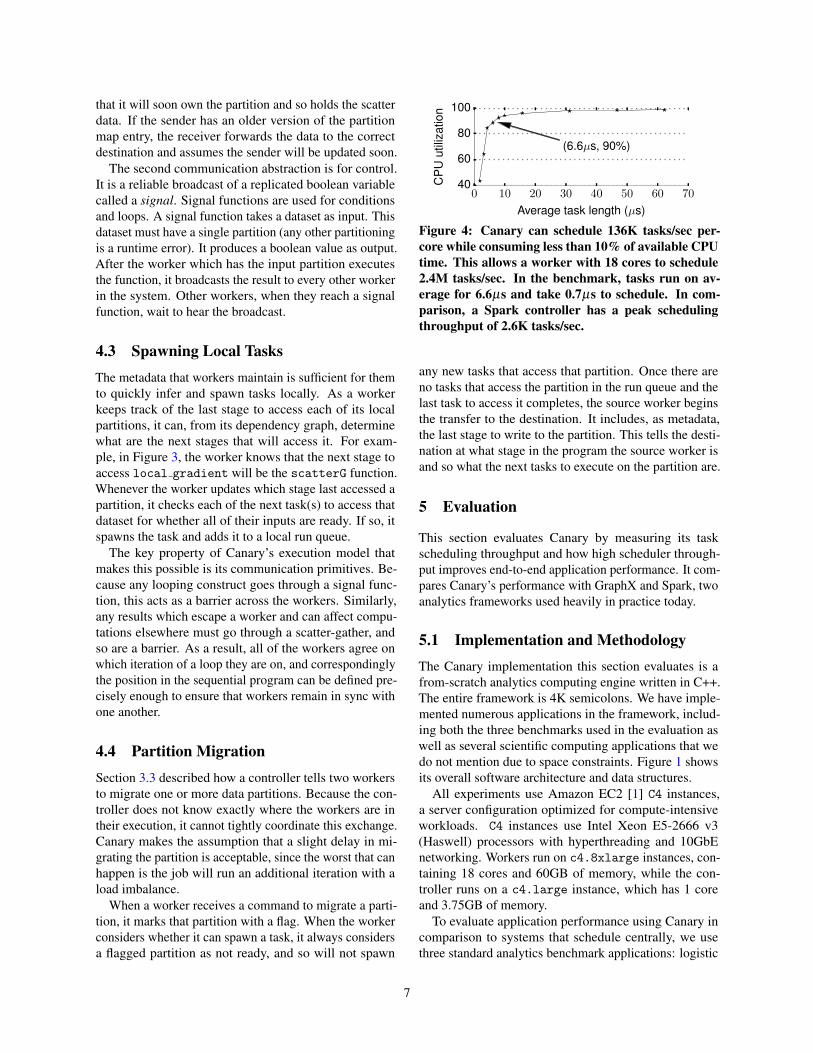
Figure 4: Canary can schedule 136K tasks/sec per-core while consuming less than 10% of available CPUtime. This allows a worker with 18 cores to schedule2.4M tasks/sec. In the benchmark, tasks run on av-erage for 6.6µs and take 0.7µs to schedule. In com-parison, a Spark controller has a peak schedulingthroughput of 2.6K tasks/sec.
any new tasks that access that partition. Once there areno tasks that access the partition in the run queue and thelast task to access it completes, the source worker beginsthe transfer to the destination. It includes, as metadata,the last stage to write to the partition. This tells the desti-nation at what stage in the program the source worker isand so what the next tasks to execute on the partition are.
5 Evaluation
This section evaluates Canary by measuring its taskscheduling throughput and how high scheduler through-put improves end-to-end application performance. It com-pares Canary’s performance with GraphX and Spark, twoanalytics frameworks used heavily in practice today.
5.1 Implementation and MethodologyThe Canary implementation this section evaluates is afrom-scratch analytics computing engine written in C++.The entire framework is 4K semicolons. We have imple-mented numerous applications in the framework, includ-ing both the three benchmarks used in the evaluation aswell as several scientific computing applications that wedo not mention due to space constraints. Figure 1 showsits overall software architecture and data structures.
All experiments use Amazon EC2 [1] C4 instances,a server configuration optimized for compute-intensiveworkloads. C4 instances use Intel Xeon E5-2666 v3(Haswell) processors with hyperthreading and 10GbEnetworking. Workers run on c4.8xlarge instances, con-taining 18 cores and 60GB of memory, while the con-troller runs on a c4.large instance, which has 1 coreand 3.75GB of memory.
To evaluate application performance using Canary incomparison to systems that schedule centrally, we usethree standard analytics benchmark applications: logistic
7

1(18)
8(144)
16(288)
32(576)
48(864)
64(1152)
# of workers (# of cores)
0
40M
80M
120MTask
sch
edulin
gth
roughput
Figure 5: Canary scheduling throughput grows al-most linearly with the number of workers, reaching127M tasks/sec with 64 workers (1,152 cores). Thehigh throughput allows jobs to be split into as manytasks as needed without concern for the scheduleroverhead.
regression, k-means clustering and PageRank. For logisticregression and k-means clustering we compare Canaryagainst hand-optimized Spark implementations (the lowlevel API row in Table 1). For PageRank, we compareCanary against GraphX, an API built on top of Spark thatis optimized for graph applications. Both the GraphX andCanary PageRank implementations use the same vertexcut partitioning algorithm, which uses a 2D partitioning ofthe sparse edge adjacency matrix and guarantees that eachvertex has at most 2×
√numPartitions mirror vertices.
We tuned each application’s input data size so thatSpark or GraphX uses about 80% of worker memorywhen running on a cluster with 8 workers. For logisticregression and k-means clustering, this means the trainingdata is 1 billion vectors of 20 64-bit floating point numbers(160GB on disk). For PageRank, the graph has 5 millionvertices and 635 million edges generated using the samegraph parameters used to evaluate Pregel [22].
For Canary we report the iteration time as the averageof all iteration times except the first and last iterations.For Spark and GraphX we instead use the median of alliterations to filter out the overhead of the JVM warm up,just-in-time compilation, and garbage collection. Themedian therefore more accurately reports the executiontime of only the tasks themselves. Because Spark andGraphX have a long tail in their iteration times, using theaverage for Canary and the median for Spark and GraphXmeans the reported speedups are lower than what wouldbe seen in production. Logistic regression and k-meansclustering run for 50 iterations, while PageRank runs for20 iterations.
5.2 Task Scheduling Throughput
We first measure the scheduling throughput of Canary byrunning a micro-benchmark that runs one billion stages.Each stage consists of tasks that busy loop on their datapartition. The job assigns 10 data partitions to each core.
Because each Canary worker core runs its own scheduler,having that scheduler completely utilize the core wouldprevent any forward progress on the job. We thereforemeasure scheduling throughput as the task rate that acore can schedule while using at most 10% of the core’sCPU cycles, leaving > 90% of CPU cycles for applicationcode.
Figure 4 shows the results. Canary takes 700ns toschedule a task. Therefore, when requiring the scheduleruse at most 10% of CPU cycles, Canary can supporttasks as short as 6.6µs. This allows a single worker coreto schedule 136,000 tasks per second, and one 18-coreworker node to schedule 2.4 million tasks per second. For1ms tasks, the Canary scheduler uses only 0.07% of CPUcycles, leaving 99.93% for application code.
Canary is able to schedule tasks so quickly because allof the scheduling logic executes on not only the samenode, but even the same process as application code.Therefore, generating, scheduling, and executing tasksrequires neither network I/O nor even inter-process com-munication. Scheduling involves traversing the task datastructure for runnable tasks and inserting them into aqueue, while dispatch removes the next task from thequeue.
Figure 5 shows the same micro-benchmark runningacross multiple workers. Canary’s scheduling throughputscales linearly with the number of workers for up to 64workers (1,152 cores). Task scheduling is completelylocal and requires no communication with the controlleror other workers. With 64 workers, Canary can schedule127 million tasks per second while using at most 10% ofCPU cycles. This 127 million is less than the schedulingthroughput of 64 independent workers, which would be154 million (2.4 million per worker from Figure 4 times64 workers). The difference comes from the differencein task execution time on the workers. When runningon multiple nodes, the application sends data over thenetwork for scatter-gather operations to compute whetherto execute another iteration.
5.3 Application Performance
Running CPU-bound applications on more cores shouldreduce completion time until the task durations shrinkenough that I/O time becomes significant. To evaluate theperformance benefit of scaling jobs out to run on morecores, we examine the performance of Spark, GraphXand Canary as a job with a fixed input data size runningon an increasing number of worker nodes. As noted inSection 5.1, the input sizes are such that they can fit inRAM on 8 workers.
Figure 6 shows the results for running the jobs on 8, 16,32, and 64 workers (144, 288, 576 and 1152 cores). Atlow scale-outs, e.g., with 8 workers, Canary runs logistic
8
8 16 32 64 8 16 32 64Spark Canary
# of workers(18 cores)
0
1
2
Itera
tion t
ime(s
)
2.32
2.65
1.18
1.63
0.62
1.02
0.38
0.81
0.38
0.59
0.19
0.31
0.100.160.09
0.05
Idle
Busy
(a) Logistic regression.
8 16 32 64 8 16 32 64Spark Canary
# of workers(18 cores)
0
2
4
6
Itera
tion t
ime(s
)
5.51
6.31
2.84
3.48
1.44
2.00
0.80
1.29
1.73
1.94
0.86
0.99
0.43
0.510.27
0.22
Idle
Busy
(b) K-means clustering.
8 16 32 64 8 16 32 64GraphX Canary
# of workers(18 cores)
0
1
2
3
4
Itera
tion t
ime(s
)
1.76
2.44
1.18
1.92
1.09
2.43
1.82
4.17
1.42
2.12
0.84
1.34
0.37
0.86
0.26
0.49
Idle
Busy
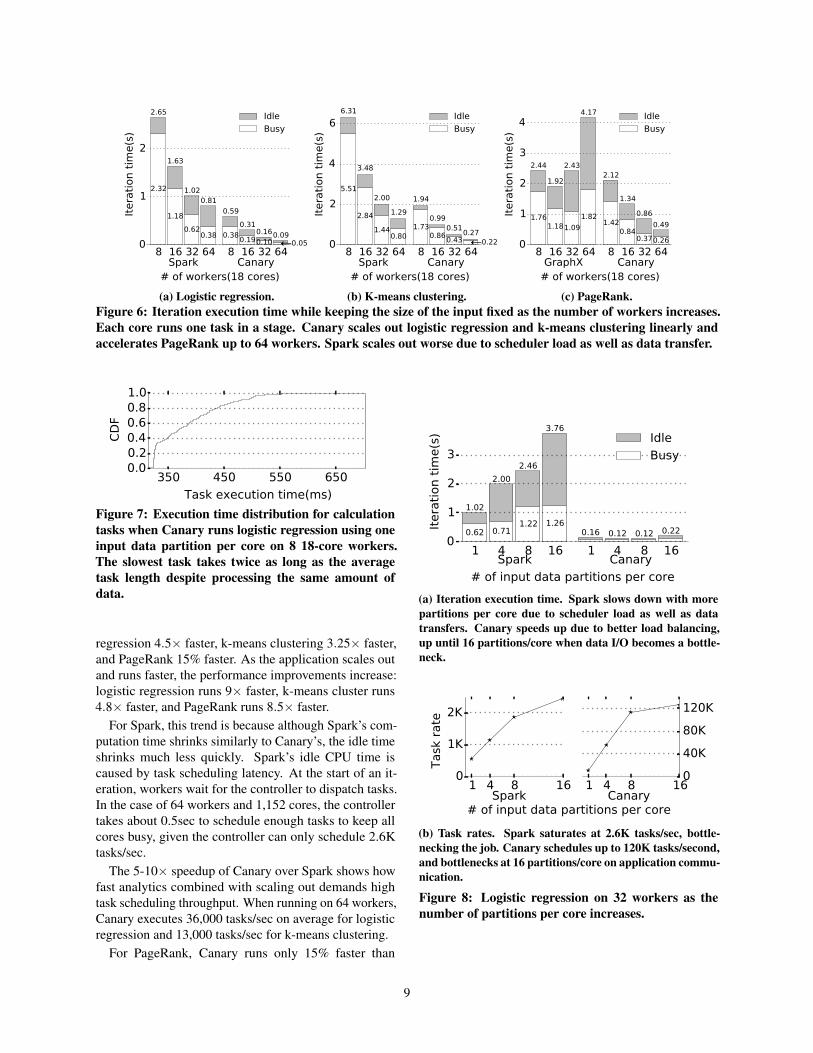
(c) PageRank.Figure 6: Iteration execution time while keeping the size of the input fixed as the number of workers increases.Each core runs one task in a stage. Canary scales out logistic regression and k-means clustering linearly andaccelerates PageRank up to 64 workers. Spark scales out worse due to scheduler load as well as data transfer.
350 450 550 650
Task execution time(ms)
0.00.20.40.60.81.0
CD
F
Figure 7: Execution time distribution for calculationtasks when Canary runs logistic regression using oneinput data partition per core on 8 18-core workers.The slowest task takes twice as long as the averagetask length despite processing the same amount ofdata.
regression 4.5× faster, k-means clustering 3.25× faster,and PageRank 15% faster. As the application scales outand runs faster, the performance improvements increase:logistic regression runs 9× faster, k-means cluster runs4.8× faster, and PageRank runs 8.5× faster.
For Spark, this trend is because although Spark’s com-putation time shrinks similarly to Canary’s, the idle timeshrinks much less quickly. Spark’s idle CPU time iscaused by task scheduling latency. At the start of an it-eration, workers wait for the controller to dispatch tasks.In the case of 64 workers and 1,152 cores, the controllertakes about 0.5sec to schedule enough tasks to keep allcores busy, given the controller can only schedule 2.6Ktasks/sec.
The 5-10× speedup of Canary over Spark shows howfast analytics combined with scaling out demands hightask scheduling throughput. When running on 64 workers,Canary executes 36,000 tasks/sec on average for logisticregression and 13,000 tasks/sec for k-means clustering.
For PageRank, Canary runs only 15% faster than
1 4 8 16 1 4 8 16Spark Canary
# of input data partitions per core
0
1
2
3
Itera
tion t
ime(s
)
0.62
1.02
0.71
2.00
1.22
2.46
1.26
3.76
0.16 0.12 0.12 0.22
Idle
Busy
(a) Iteration execution time. Spark slows down with morepartitions per core due to scheduler load as well as datatransfers. Canary speeds up due to better load balancing,up until 16 partitions/core when data I/O becomes a bottle-neck.
1 4 8 160
1K
2K
1 4 8 160
40K
80K
120K
# of input data partitions per coreSpark Canary
Task
rate
(b) Task rates. Spark saturates at 2.6K tasks/sec, bottle-necking the job. Canary schedules up to 120K tasks/second,and bottlenecks at 16 partitions/core on application commu-nication.
Figure 8: Logistic regression on 32 workers as thenumber of partitions per core increases.
9

1 2 4 6 1 2 4 6GraphX Canary
# of edge partitions per core
0
5
10
Itera
tion t
ime(s
)
1.15
2.62
2.47
4.49
5.85
10.93
13.30
19.82
0.39
0.86
0.420.60
0.310.58 1.73
2.47
19.82
Idle
Busy
Figure 9: PageRank execution on 32 workers as parti-tions per core increases. GraphX is unable to handleadditional partitions per core due to scheduling anddata transfer bottlenecks. Canary speeds up by 32%due to better load balancing and because smaller par-titions have better cache behavior.
GraphX on 8 workers; GraphX is an optimized sys-tem whose task execution speeds are close to C++ code.PageRank is a harder application to scale out because asthe number of partitions goes up, the number of graphvertices that must be communicated increases (the vertex-cut algorithm creates more mirror vertices) and so I/Obecomes an increasing portion of execution time. GraphXruns fastest with 16 workers, which have a total task rateof 450 tasks/sec. Canary, in contrast, continues to runfaster as it scales out. With 64 workers, Canary runs 3.9×faster than GraphX with 16 workers, and 8.5× as fast asGraphX with 64 workers. At this speed, Canary executes12,000 tasks/sec.
5.4 MicropartitioningThe experimental results in Figure 6 shows that Canarydoes not fully utilize its cores. Logistic regression andk-means cores spend 18-44% of their time idle despitehaving very little network I/O. Task execution time vari-ance causes this CPU idle time. These experiments haveone partition per core, and so slowest task determinesexecution time. Figure 7 shows the CDF of task execu-tion time for logistic regression. The fastest core is twiceas fast as the slowest one. This variance is caused bynon-uniform memory access (NUMA). Each worker hastwo sockets, and on-socket memory throughput is twicethat of off-socket memory. Because Linux’s allocationpolicy maps physical pages across the two sockets, taskexecution time can vary by a factor of 2: the fastest taskshave all local pages and the slowest have all remote pages.
The variance in task execution time suggests that mi-cropartitioning a stage and load balancing across cores
will reduce completion time as this variance will aver-age out. Figure 8a shows how long it takes to completeone iteration of logistic regression on 32 workers withmicropartitioning.
Spark slows down with more micropartitions. Fig-ure 8b shows the task rates for Spark and Canary in thisexperiment. At 16 partitions/core, the Spark controller isat its maximum scheduling capacity of 2,500 tasks/second.The controller occupies a larger and larger fraction of exe-cution time, as cores fall idle. With 16 partitions per core,CPUs are idle 67% of the time as they wait to receivetasks to execute. In contrast, Canary schedules 120,000tasks/second and the scheduler is not the bottleneck.
When there is one task per core (576 tasks), Canaryruns over six times faster than Spark, and microparti-tioning improves Canary’s performance. Running with16 partitions per core slows down the application as theamount of communication needed for the scatter/gatherstage begins to dominate, but 4 or 8 partitions per corecut job completion time by 25%.
Micropartitioning has an additional benefit: smallerpartitions can be transferred faster and pipelined withexecution. For example, P = 8, each partition is approx-imately 135MB, takes 80ms to transfer, and a k-meanscomputation takes 50ms. A slow worker can transferpartitions while it computes on others, overlapping theseoperations and reducing idle time.
Finally, micropartitions also improve performancethrough better cache locality, especially for workloadsthat are not simple scans of data, such as PageRank. Fig-ure 9 shows how increasing the number of partitions percore affects completion time for GraphX and Canary. ForGraphX, micropartitioning quickly overwhelms the sched-uler and forces it to use inefficient marshalling proceduresfor larger amounts of data, such that its completion timegoes up nearly linearly. For Canary, PageRank’s perfor-mance is dominated by the step that scans over a list ofedges and fills mirror vertex values into a hash table. Mi-cropartitioning shrinks this hash table and reduces cachepressure, cutting completion time by 33% with 4 parti-tions per core. At 6 partitions per core, performance be-gins to degrade as the number of mirror vertices increasesand so requires much more I/O and data replication.
6 Related Work
Scheduling jobs to share a cluster is a broad research topic,with prior work examining how to mitigate stragglers [34,30], how to optimize networking use [3, 11, 17], or howto isolate performance between tenants [21].
This paper focuses on improving scheduling through-put. Earlier work like YARN [33] and Mesos [15] takesa centralized approach, and suffers from scalability chal-lenges when serving large-scale clusters. To increase
10
scheduling throughput, distributed scheduling systems[28, 32, 6, 19] use multiple servers to schedule jobs inparallel by coordinating how these distributed servers al-locate shared resources. Recent work [10, 12] proposes ahybrid approach, e.g., Hawk [10] schedules long-runningbatch processing jobs centrally to improve schedulingdecisions, but uses distributed scheduling for short jobsto improve scheduling throughput. All of these priorapproaches, however, assume that any single job is sched-uled by a single controller. In contrast, Canary examinesthe case when even a single job’s scheduling load is toogreat for a central controller.
State-of-art data analytics frameworks are designedwithout the awareness that a job ever needs such a hightask rate as this paper explains, and their system designsperform poorly when significantly increasing the taskrate within a job. Dryad [16, 35] and Spark [36] use acentralized controller to schedule tasks in a same job,and the controller can become a performance bottleneck.GraphX [14] is built on top of Spark and shares the sameproblem. Naiad [24] does not have the controller bottle-neck, but uses a distributed progress tracking mechanismthat decides when a notification can be delivered to a ver-tex to trigger its execution. The mechanism is requiredto execute the programming model (timely dataflow) cor-rectly, and incurs significant overhead when the task rateis high enough due to more progress updates being ex-changed.
The idea that the controller places data and then work-ers generate tasks locally is similar with how graph ana-lytics frameworks, e.g. GraphLab [20], PowerGraph [13],and Galois [25], schedule distributed graph computations.These systems place vertices and edges on workers, andrun a vertex program on each vertex, which performscomputation, exchanges data between other vertex pro-grams, and synchronizes through global data structures.Both the execution model and the scheduling design aretightly coupled with iterative graph algorithms, and can-not extend to general analytics workloads. For example,GraphLab [20] and PowerGraph [13] use distributed lock-ing to schedule distributed graph computations, and lockneighboring vertices when the state of a vertex is beingaccessed, so as to avoid conflicting data access.
The idea of giving each worker a driver program copysuch that workers understand application workflow issimilar to the SIMD (single instruction, multiple data)programming paradigm, such as used in MPI (messagepassing interface). [2] MPI is widely used in supercomput-ing to scale scientific computations to tens of thousandsof cores. In MPI, execution is described as processes run-ning the same driver program as a continuous workflow.Those processes coordinate execution through exchangingmessages, and block when waiting for messages. MPI’slack of a central controller or any scheduling at all means
it scales out very well, but at the cost of poor load bal-ancing and fault tolerance. Unlike MPI, Canary is anexample of a MTC (many-task computing) system [29],which breaks execution into tasks that do not have to runin sequential order (as long as they respect data depen-dencies). Charm++ [18] and Legion [5] are other MTCsystems, designed for supercomputers. Canary representsa midpoint in this design space, borrowing its distributedcontrol flow from supercomputing but its centralized loadbalancing from cloud computing.
7 Discussion and Conclusion
In the past few years, led by systems such as Spark,GraphX, Galois, and Naiad, cloud computing systemshave transitioned from being disk and I/O-centric to be-ing CPU-bound computations on in-memory data. Highperformance computing (HPC) has spent decades explor-ing how to run massively parallel CPU-bound workloadson in-memory data, but has done so on supercomputers,which have different performance and reliability tradeoffsthan cloud computing systems. For example, while float-ing point workloads dominate HPC, cloud systems havea mix of floating point and fixed point computations.
Canary is a first attempt to borrow key techniques fromeach field. From high performance computing it borrowsdistributed scheduling to support fast codes, while it bor-rows central control for fault tolerance from cloud com-puting. A Canary controller is responsible for decidinghow data partitions are distributed across workers. Eachworker core locally spawns and schedules tasks to exe-cute based what partitions it has. Evaluations show thatCanary can schedule up to 2.4M tasks/sec per worker, andthe task scheduling throughput increases linearly up to64 workers, with 1,152 cores scheduling 120M tasks/sec.This scheduling performance allows Canary to run highperformance codes that are up to 90 times faster thanstandard Spark implementations and 9 times faster thanhighly optimized Spark implementations. High perfor-mance scheduling also allows Canary to further reducejob completion time by micropartitioning datasets.
Spark showed it was possible to achieve orders of mag-nitude improvements over disk-centric frameworks suchas Hadoop. Canary shows that further orders of magni-tude improvements are possible, but doing so requiresnew architectures and further research.
References[1] Amazon Elastic Compute Cloud. http://aws.amazon.com/
ec2.
[2] Open MPI: Open Source High Performance Computing. http://www.open-mpi.org.
[3] AHMAD, F., CHAKRADHAR, S. T., RAGHUNATHAN, A., ANDVIJAYKUMAR, T. N. ShuffleWatcher: Shuffle-aware Scheduling
11
in Multi-tenant MapReduce Clusters. In Proceedings of the 2014USENIX Conference on USENIX Annual Technical Conference(2014), USENIX ATC’14, USENIX Association, pp. 1–12.
[4] ANANTHANARAYANAN, G., KANDULA, S., GREENBERG, A.,STOICA, I., LU, Y., SAHA, B., AND HARRIS, E. Reining in theOutliers in Map-reduce Clusters Using Mantri. In Proceedingsof the 9th USENIX Conference on Operating Systems Design andImplementation (2010), OSDI’10, USENIX Association, pp. 1–16.
[5] BAUER, M., TREICHLER, S., SLAUGHTER, E., AND AIKEN,A. Legion: Expressing Locality and Independence with Logi-cal Regions. In Proceedings of the International Conference onHigh Performance Computing, Networking, Storage and Analysis(2012), SC ’12, IEEE Computer Society Press, pp. 66:1–66:11.
[6] BOUTIN, E., EKANAYAKE, J., LIN, W., SHI, B., ZHOU, J.,QIAN, Z., WU, M., AND ZHOU, L. Apollo: Scalable and Coordi-nated Scheduling for Cloud-scale Computing. In Proceedings ofthe 11th USENIX Conference on Operating Systems Design andImplementation (2014), OSDI’14, USENIX Association, pp. 285–300.
[7] CHEN, Y., ALSPAUGH, S., AND KATZ, R. Interactive Analyti-cal Processing in Big Data Systems: A Cross-industry Study ofMapReduce Workloads. Proc. VLDB Endow. 5, 12 (Aug. 2012),1802–1813.
[8] DEAN, J. Building Software Systems at Google and LessonsLearned, Slide 99. http://research.google.com/people/jeff/Stanford-DL-Nov-2010.pdf.
[9] DEAN, J., AND GHEMAWAT, S. MapReduce: Simplified Data Pro-cessing on Large Clusters. In Proceedings of the 6th Conferenceon Symposium on Opearting Systems Design & Implementation -Volume 6 (2004), OSDI’04, USENIX Association, pp. 10–10.
[10] DELGADO, P., DINU, F., KERMARREC, A.-M., ANDZWAENEPOEL, W. Hawk: Hybrid Datacenter Scheduling. InProceedings of the 2015 USENIX Conference on Usenix AnnualTechnical Conference (2015), USENIX ATC ’15, USENIX Asso-ciation, pp. 499–510.
[11] GANDHI, R., HU, Y. C., KOH, C.-K., LIU, H., AND ZHANG,M. Rubik: Unlocking the Power of Locality and End-point Flex-ibility in Cloud Scale Load Balancing. In Proceedings of the2015 USENIX Conference on Usenix Annual Technical Conference(2015), USENIX ATC ’15, USENIX Association, pp. 473–484.
[12] GODER, A., SPIRIDONOV, A., AND WANG, Y. Bistro: Schedul-ing Data-parallel Jobs Against Live Production Systems. In Pro-ceedings of the 2015 USENIX Conference on Usenix Annual Tech-nical Conference (2015), USENIX ATC ’15, USENIX Associa-tion, pp. 459–471.
[13] GONZALEZ, J. E., LOW, Y., GU, H., BICKSON, D., ANDGUESTRIN, C. PowerGraph: Distributed Graph-parallel Com-putation on Natural Graphs. In Proceedings of the 10th USENIXConference on Operating Systems Design and Implementation(2012), OSDI’12, USENIX Association, pp. 17–30.
[14] GONZALEZ, J. E., XIN, R. S., DAVE, A., CRANKSHAW, D.,FRANKLIN, M. J., AND STOICA, I. GraphX: Graph Processingin a Distributed Dataflow Framework. In Proceedings of the 11thUSENIX Conference on Operating Systems Design and Implemen-tation (2014), OSDI’14, USENIX Association, pp. 599–613.
[15] HINDMAN, B., KONWINSKI, A., ZAHARIA, M., GHODSI, A.,JOSEPH, A. D., KATZ, R., SHENKER, S., AND STOICA, I.Mesos: A Platform for Fine-grained Resource Sharing in theData Center. In Proceedings of the 8th USENIX Conference onNetworked Systems Design and Implementation (2011), NSDI’11,USENIX Association, pp. 295–308.
[16] ISARD, M., BUDIU, M., YU, Y., BIRRELL, A., AND FETTERLY,D. Dryad: Distributed Data-parallel Programs from Sequential
Building Blocks. In Proceedings of the 2Nd ACM SIGOPS/Eu-roSys European Conference on Computer Systems 2007 (2007),EuroSys ’07, ACM, pp. 59–72.
[17] JALAPARTI, V., BODIK, P., MENACHE, I., RAO, S.,MAKARYCHEV, K., AND CAESAR, M. Network-Aware Schedul-ing for Data-Parallel Jobs: Plan When You Can. In Proceedingsof the 2015 ACM Conference on Special Interest Group on DataCommunication (2015), SIGCOMM ’15, ACM, pp. 407–420.
[18] KALE, L. V., AND KRISHNAN, S. CHARM++: A PortableConcurrent Object Oriented System Based on C++, vol. 28. ACM,1993.
[19] KARANASOS, K., RAO, S., CURINO, C., DOUGLAS, C., CHALI-PARAMBIL, K., FUMAROLA, G. M., HEDDAYA, S., RAMAKR-ISHNAN, R., AND SAKALANAGA, S. Mercury: Hybrid Cen-tralized and Distributed Scheduling in Large Shared Clusters. InProceedings of the 2015 USENIX Conference on Usenix AnnualTechnical Conference (2015), USENIX ATC ’15, USENIX Asso-ciation, pp. 485–497.
[20] LOW, Y., BICKSON, D., GONZALEZ, J., GUESTRIN, C., KY-ROLA, A., AND HELLERSTEIN, J. M. Distributed GraphLab: AFramework for Machine Learning and Data Mining in the Cloud.Proc. VLDB Endow. 5, 8 (Apr. 2012), 716–727.
[21] MACE, J., BODIK, P., FONSECA, R., AND MUSUVATHI, M.Retro: Targeted Resource Management in Multi-tenant DistributedSystems. In Proceedings of the 12th USENIX Conference onNetworked Systems Design and Implementation (2015), NSDI’15,USENIX Association, pp. 589–603.
[22] MALEWICZ, G., AUSTERN, M. H., BIK, A. J., DEHNERT, J. C.,HORN, I., LEISER, N., AND CZAJKOWSKI, G. Pregel: A Systemfor Large-scale Graph Processing. In Proceedings of the 2010ACM SIGMOD International Conference on Management of Data(2010), SIGMOD ’10, ACM, pp. 135–146.
[23] MCSHERRY, F., ISARD, M., AND MURRAY, D. G. Scalability!But at What Cost? In Proceedings of the 15th USENIX Conferenceon Hot Topics in Operating Systems (2015), HOTOS’15, USENIXAssociation, pp. 14–14.
[24] MURRAY, D. G., MCSHERRY, F., ISAACS, R., ISARD, M.,BARHAM, P., AND ABADI, M. Naiad: A Timely Dataflow Sys-tem. In Proceedings of the Twenty-Fourth ACM Symposium onOperating Systems Principles (2013), SOSP ’13, ACM, pp. 439–455.
[25] NGUYEN, D., LENHARTH, A., AND PINGALI, K. A LightweightInfrastructure for Graph Analytics. In Proceedings of the Twenty-Fourth ACM Symposium on Operating Systems Principles (2013),SOSP ’13, ACM, pp. 456–471.
[26] OUSTERHOUT, K., PANDA, A., ROSEN, J., VENKATARAMAN,S., XIN, R., RATNASAMY, S., SHENKER, S., AND STOICA, I.The Case for Tiny Tasks in Compute Clusters. In Proceedings ofthe 14th USENIX Conference on Hot Topics in Operating Systems(2013), HotOS’13, USENIX Association, pp. 14–14.
[27] OUSTERHOUT, K., RASTI, R., RATNASAMY, S., SHENKER,S., AND CHUN, B.-G. Making Sense of Performance in DataAnalytics Frameworks. In Proceedings of the 12th USENIX Con-ference on Networked Systems Design and Implementation (2015),NSDI’15, USENIX Association, pp. 293–307.
[28] OUSTERHOUT, K., WENDELL, P., ZAHARIA, M., AND STOICA,I. Sparrow: Distributed, Low Latency Scheduling. In Proceedingsof the Twenty-Fourth ACM Symposium on Operating SystemsPrinciples (2013), SOSP ’13, ACM, pp. 69–84.
[29] RAICU, I., FOSTER, I., AND ZHAO, Y. Many-task Computingfor Grids and Supercomputers. In Many-Task Computing on Gridsand Supercomputers, 2008. MTAGS 2008. Workshop on (Nov2008), pp. 1–11.
12
[30] REN, X., ANANTHANARAYANAN, G., WIERMAN, A., AND YU,M. Hopper: Decentralized Speculation-aware Cluster Schedulingat Scale. In Proceedings of the 2015 ACM Conference on SpecialInterest Group on Data Communication (2015), SIGCOMM ’15,ACM, pp. 379–392.
[31] SANCHO, J., BARKER, K., KERBYSON, D., AND DAVIS, K.Quantifying the Potential Benefit of Overlapping Communicationand Computation in Large-Scale Scientific Applications. In SC2006 Conference, Proceedings of the ACM/IEEE (Nov 2006),pp. 17–17.
[32] SCHWARZKOPF, M., KONWINSKI, A., ABD-EL-MALEK, M.,AND WILKES, J. Omega: Flexible, Scalable Schedulers for LargeCompute Clusters. In Proceedings of the 8th ACM EuropeanConference on Computer Systems (2013), EuroSys ’13, ACM,pp. 351–364.
[33] VAVILAPALLI, V. K., MURTHY, A. C., DOUGLAS, C., AGAR-WAL, S., KONAR, M., EVANS, R., GRAVES, T., LOWE, J.,SHAH, H., SETH, S., SAHA, B., CURINO, C., O’MALLEY, O.,RADIA, S., REED, B., AND BALDESCHWIELER, E. ApacheHadoop YARN: Yet Another Resource Negotiator. In Proceedingsof the 4th Annual Symposium on Cloud Computing (2013), SOCC’13, ACM, pp. 5:1–5:16.
[34] XU, Y., MUSGRAVE, Z., NOBLE, B., AND BAILEY, M. Bobtail:Avoiding Long Tails in the Cloud. In Proceedings of the 10thUSENIX Conference on Networked Systems Design and Imple-mentation (2013), nsdi’13, USENIX Association, pp. 329–342.
[35] YU, Y., ISARD, M., FETTERLY, D., BUDIU, M., ERLINGSSON,U., GUNDA, P. K., AND CURREY, J. DryadLINQ: A Systemfor General-purpose Distributed Data-parallel Computing Usinga High-level Language. In Proceedings of the 8th USENIX Con-ference on Operating Systems Design and Implementation (2008),OSDI’08, USENIX Association, pp. 1–14.
[36] ZAHARIA, M., CHOWDHURY, M., DAS, T., DAVE, A., MA,J., MCCAULEY, M., FRANKLIN, M. J., SHENKER, S., ANDSTOICA, I. Resilient Distributed Datasets: A Fault-tolerant Ab-straction for In-memory Cluster Computing. In Proceedings ofthe 9th USENIX Conference on Networked Systems Design andImplementation (2012), NSDI’12, USENIX Association, pp. 2–2.
13