cancer therapy related complications in the liver
TRANSCRIPT

PICTORIAL REVIEW
Cancer therapy related complications in the liver, pancreas,and biliary system: an imaging perspective
Danny Ngo1 & Jemianne Bautista Jia2& Christopher S. Green2
&
Anjalie T. Gulati2 & Chandana Lall2
Received: 26 June 2015 /Revised: 14 September 2015 /Accepted: 18 September 2015 /Published online: 6 October 2015# The Author(s) 2015. This article is published with open access at Springerlink.com
AbstractAwareness of cancer therapy-induced toxicities is importantfor all clinicians treating patients with cancer. Cancer therapyhas evolved to include classic cytotoxic agents in addition tonewer options such as targeted agents and catheter-directedchemoembolisation. Several adverse affects can result fromthe wide array of treatments including effects on the liver,pancreas, and biliary system that can be visualised on imag-ing. These complications include sinusoidal obstruction syn-drome, fatty liver, pseudocirrhosis, acute hepatitis, pancreati-tis, pancreatic atrophy, cholecystitis, biliary sclerosis, and bil-iary stasis. Many of these toxicities are manageable and re-versible with supportive therapies and/or cessation of cancertherapy. The objective of this review is to discuss the imagingfindings associated with cancer therapy-induced toxicity ofthe liver, biliary system, and pancreas.Teaching Points• Cancer therapy can have adverse effects on the hepatobiliarysystem and pancreas.
• Cancer therapy-induced toxicities can be visualised onimaging.
• Knowledge of imaging changes associated with cancertherapy complications can improve treatment.
Keywords Cancer therapy . Drug-associated adverse effects .
Hepatic toxicity . Pancreatic toxicity . Biliary toxicity
Introduction
Chemotherapy is an essential component in the treatmentof cancer. Systemic cancer therapy has evolved from theclassic cytotoxic agents to now include newer classes ofmolecularly targeted therapy. Classic cytotoxic agents tar-get rapidly proliferating cells by interfering with their celldivision and growth. Newer therapies target specific cancermolecules involved in regulating cancer cell growth anddifferentiation. Additionally, the use of chemoembolisation,a minimally invasive procedure used to locally administerchemotherapeutic agents directly to tumours, continues togrow and is predominantly used in the treatment of livercancers.
While these therapies aim to inhibit cancerous tissuegrowth, both systemic and localised therapies are knownto have adverse effects on normal tissues. With the vary-ing mechanisms of action, it is not surprising that theside effects of different anticancer agents and treatmentmodalities are diverse, affecting nearly every organ sys-tem. Many of the adverse effects of cancer therapy onthe liver, pancreas, and biliary system can be detected onimaging (Table 1). These include sinusoidal obstructionsyndrome (SOS), fatty liver, pseudocirrhosis, hepatitis,pancreatitis, pancreatic atrophy, cholecystitis, biliary scle-rosis, and biliary inflammation. The objective of thisarticle is to review and discuss the imaging findingsassociated with cancer therapy-related changes in the liv-er, pancreas, and biliary system and to provide didacticcases.
* Danny [email protected]
1 Eastern Virginia Medical School, 700 W Olney Road,Norfolk, VA 23507, USA
2 Department of Radiological Sciences, University of California,Irvine, 101 The City Drive South, Orange, CA 92868, USA
Insights Imaging (2015) 6:665–677DOI 10.1007/s13244-015-0436-7

Effects of systemic therapy
Liver
Fatty liver
Fatty infiltration of hepatic tissue as well as buildup of fatglobules in hepatocytes is considered hepatic steatosis while
steatohepatitis is a more severe form of fatty liver diseasewith hepatocyte degeneration. Steatohepatitis is oftenasymptomatic; however, it can often manifest through ele-vations of alanine transaminase (ALT) and aspartate trans-aminase (AST). Fatty changes have been linked to thechemotherapeutic agents oxaliplatin, irinotecan, 5-FU, andmethotrexate with initial steatotic appearance occurringfrom 2 weeks to 2 months after therapy [1, 2].
Table 1 Table summarising adverse effects visible on imaging and most commonly associated cancer therapies
Adverse effect Associated therapy Laboratory findings Radiologic findings
Fatty liver Oxaliplatin, irinotecan, fluorouracil,methotrexate
↑ ALT↑ AST
US: increased echogenicity and beamattenuation
CT: reduced liver attenuationMR: reduced liver signal intensity in out-of-
phase imaging
Sinusoidal obstructionsyndrome (SOS)
Oxaliplatin, fluorouracil, mercaptopurine,dacarbazine, azathioprine
↑ Bilirubin US: ascites, gallbladder wall thickening,hepatosplenomegaly
CT: ascites, decreased right hepatic veindiameter (<0.45 cm), perioesophagealvarices, hepatosplenomegaly, andrecanalisation of the umbilical vein
Pseudocirrhosis Gemcitabine None US, CT, MR: segmental volume loss,capsular retraction, fibrosis, enlargementof caudate lobe
Acute hepatitis Anastrozole, lapatinib ↑ ALT↑ AST
US: Bstarry sky^ signCT: Hepatosplenomegaly, thickened
gallbladder wall, periportal oedema,decreased liver enhancement
Hepatic abscess TACE ↑ Alkaline phosphataseHypoalbunaemia
CT: hypoattenuating lesion with peripheralrim enhancement
Hepatic failure TACE Thrombocytopenia↑ PT, INR↑ ALT↑ AST↑ Bilirubin
US: increased echogenicity, ascites, nodularity,segmental hypertrophy/atrophy
CT: surface and parenchymal nodularity,segmental hypertrophy/atrophy
Pancreatitis L-asparaginase, carboplatin, cisplatin,cytarabine, ifosfamide, paclitaxel,tretinoin, vinorelbine, TACE
↑ Amylase↑ Lipase
US: peripancreatic fluid collection,hypoechoic lesions
CT: areas of low attenuation, diffusepancreatic oedema
Pancreatic atrophy Sorafenib, sunitinib None CT: reduced pancreatic volume
Acute acalculous cholecystitis Everolimus, sunitinib, bevacizumab ↑ Alkaline phosphatase↑ Bilirubin
US: gall bladder wall thickening, gallbladderdistension, pericholecystic fluid collection
CT: gallbladder distension, fat stranding,hyperaemia, pericholecystic fluid
Biliary inflammation L-asparaginase, doxorubicin, epirubicin,paclitaxel
None CT: biliary epithelial thickening andenhancement
Biliary sclerosis HAIPC w/ floxuridine ↑ Alkaline phosphatase↑ Bilirubin
CT: thickened/enhanced bile duct wall, bileduct stricture with lumen <3 mm, periductaloedema
ERCP: dilatation and stricture of biliary tree
Biliary stasis Tamoxifen, doxorubicin ↑ Alkaline phosphatase↑ Gamma-glutamyl
transpeptidase
US: biliary dilatationCT: tumefactive sludge
Bile duct injury TACE ↑ Alkaline phosphatase↑ Gamma-glutamyl
transpeptidase↑ Bilirubin
CT: main bile duct dilatation, extrabiliarycollection of bile
MRCP: biliary fluid collection and bile ductleaks
666 Insights Imaging (2015) 6:665–677
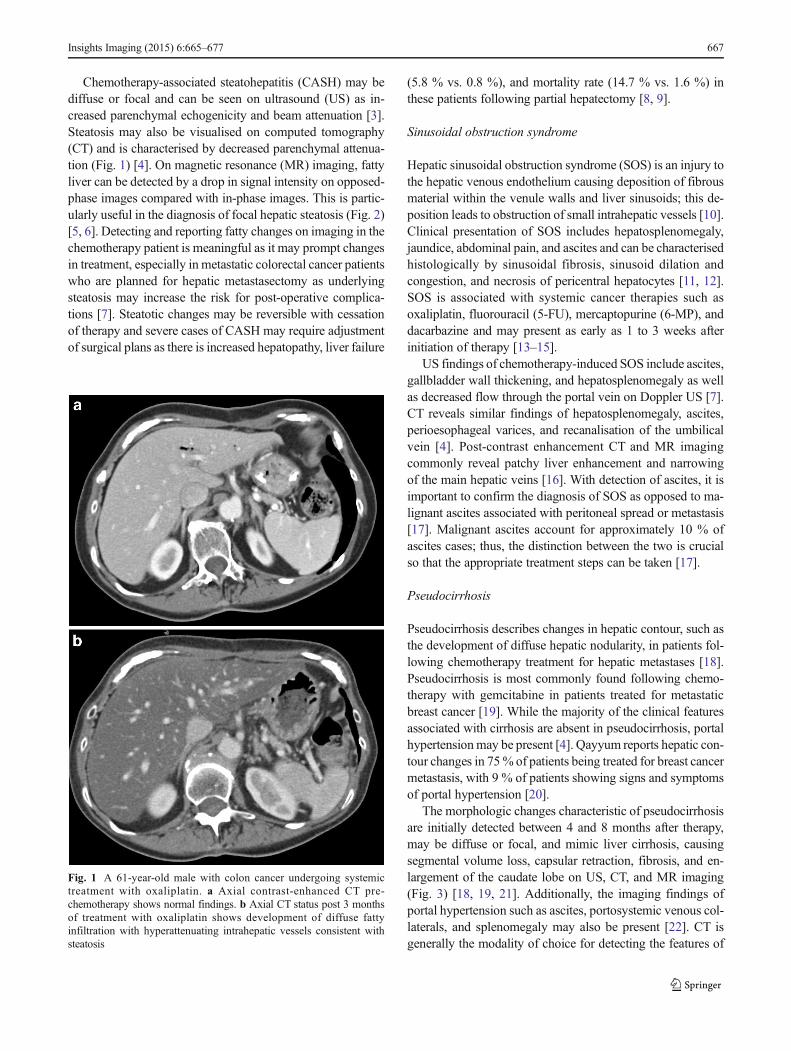
Chemotherapy-associated steatohepatitis (CASH) may bediffuse or focal and can be seen on ultrasound (US) as in-creased parenchymal echogenicity and beam attenuation [3].Steatosis may also be visualised on computed tomography(CT) and is characterised by decreased parenchymal attenua-tion (Fig. 1) [4]. On magnetic resonance (MR) imaging, fattyliver can be detected by a drop in signal intensity on opposed-phase images compared with in-phase images. This is partic-ularly useful in the diagnosis of focal hepatic steatosis (Fig. 2)[5, 6]. Detecting and reporting fatty changes on imaging in thechemotherapy patient is meaningful as it may prompt changesin treatment, especially in metastatic colorectal cancer patientswho are planned for hepatic metastasectomy as underlyingsteatosis may increase the risk for post-operative complica-tions [7]. Steatotic changes may be reversible with cessationof therapy and severe cases of CASH may require adjustmentof surgical plans as there is increased hepatopathy, liver failure
(5.8 % vs. 0.8 %), and mortality rate (14.7 % vs. 1.6 %) inthese patients following partial hepatectomy [8, 9].
Sinusoidal obstruction syndrome
Hepatic sinusoidal obstruction syndrome (SOS) is an injury tothe hepatic venous endothelium causing deposition of fibrousmaterial within the venule walls and liver sinusoids; this de-position leads to obstruction of small intrahepatic vessels [10].Clinical presentation of SOS includes hepatosplenomegaly,jaundice, abdominal pain, and ascites and can be characterisedhistologically by sinusoidal fibrosis, sinusoid dilation andcongestion, and necrosis of pericentral hepatocytes [11, 12].SOS is associated with systemic cancer therapies such asoxaliplatin, fluorouracil (5-FU), mercaptopurine (6-MP), anddacarbazine and may present as early as 1 to 3 weeks afterinitiation of therapy [13–15].
US findings of chemotherapy-induced SOS include ascites,gallbladder wall thickening, and hepatosplenomegaly as wellas decreased flow through the portal vein on Doppler US [7].CT reveals similar findings of hepatosplenomegaly, ascites,perioesophageal varices, and recanalisation of the umbilicalvein [4]. Post-contrast enhancement CT and MR imagingcommonly reveal patchy liver enhancement and narrowingof the main hepatic veins [16]. With detection of ascites, it isimportant to confirm the diagnosis of SOS as opposed to ma-lignant ascites associated with peritoneal spread or metastasis[17]. Malignant ascites account for approximately 10 % ofascites cases; thus, the distinction between the two is crucialso that the appropriate treatment steps can be taken [17].
Pseudocirrhosis
Pseudocirrhosis describes changes in hepatic contour, such asthe development of diffuse hepatic nodularity, in patients fol-lowing chemotherapy treatment for hepatic metastases [18].Pseudocirrhosis is most commonly found following chemo-therapy with gemcitabine in patients treated for metastaticbreast cancer [19]. While the majority of the clinical featuresassociated with cirrhosis are absent in pseudocirrhosis, portalhypertensionmay be present [4]. Qayyum reports hepatic con-tour changes in 75% of patients being treated for breast cancermetastasis, with 9 % of patients showing signs and symptomsof portal hypertension [20].
The morphologic changes characteristic of pseudocirrhosisare initially detected between 4 and 8 months after therapy,may be diffuse or focal, and mimic liver cirrhosis, causingsegmental volume loss, capsular retraction, fibrosis, and en-largement of the caudate lobe on US, CT, and MR imaging(Fig. 3) [18, 19, 21]. Additionally, the imaging findings ofportal hypertension such as ascites, portosystemic venous col-laterals, and splenomegaly may also be present [22]. CT isgenerally the modality of choice for detecting the features of
Fig. 1 A 61-year-old male with colon cancer undergoing systemictreatment with oxaliplatin. a Axial contrast-enhanced CT pre-chemotherapy shows normal findings. b Axial CT status post 3 monthsof treatment with oxaliplatin shows development of diffuse fattyinfiltration with hyperattenuating intrahepatic vessels consistent withsteatosis
Insights Imaging (2015) 6:665–677 667

pseudocirrhosis; however, MRI is more sensitive than CTfor the follow-up of liver metastases and is recommendedin these patients. While the exact mechanism underlyingpseudocirrhosis is not fully understood, it has been linkedwith complications of hepatic encephalopathy, varicealbleeding, and portal hypertension [4]. Discontinuation ofchemotherapy may be warranted if pseudocirrhotic compli-cations cannot be managed conservatively [19].
Acute hepatitis
Recent literature has demonstrated an association between acutehepatitis and several targeted therapies such as anastrozole andlapatinib [8]. Additionally, reactivation of hepatitis B has been
Fig. 2 A 60-year-old female with colorectal cancer currently beingtreated with irinotecan. a, b Axial T1-weighted MR images in and outof phase, respectively, show significant signal drop in the liver consistentwith steatosis
�Fig. 3 A 48-year-old female with metastatic breast cancer status posttreatment with docetaxel and epirubicin. a Axial contrast-enhanced CTbefore chemotherapy shows normal-appearing liver with a smoothsurface. b Repeat CT 6 months after initiation of treatment showsnodularity of the left hepatic lobe. c Repeat CT 7 months after initiationof treatment shows diffuse nodularity and capsular retraction consistentwith pseudocirrhosis
668 Insights Imaging (2015) 6:665–677

observed following treatment with rituximab, alemtuzumab,and infliximab [23]. Reactivation of hepatitis C has been ob-served with rituximab, alemtuzumab, and gemcitabine [24].The presentation of acute hepatitis may range from asymptom-atic to severe with nausea, poor appetite, vomiting, right upperquadrant pain, and jaundice with elevated ASTand ALT. In themajority of patients, hepatitis is improved and reversible withtemporary cessation of cancer therapy [2].
In patients with acute hepatitis, ultrasound demonstratesmultiple echogenic foci within a relatively hypoechoic liverparenchyma, the so-called Bstarry sky^ sign (Fig. 4) [25]. CTfindings of acute hepatitis are nonspecific and includehepatosplenomegaly, thickened gallbladder wall, periportaloedema, and decreased liver enhancement (Fig. 5) [26].
Pancreas
Pancreatitis
Chemotherapy-induced pancreatitis is well documented inthe literature and is associated with several chemothera-peutic agents. These chemotherapeutic agents include L-asparaginase, carboplatin cisplatin, cytarabine, ifosfamide,paclitaxel, tretinoin, and vinorelbine [27, 28]. The onsetof pancreatitis is variable and may range from hours to1 month after drug administration [27].
Among the listed agents, chemotherapy-induced pancrea-titis is most closely associated with asparaginase therapy witha prevalence of 2–16 % [7, 29]. L-asparaginase is a cytotoxicchemotherapeutic agent commonly used in the treatmentof acute lymphocytic leukaemia. Additionally, a correlation
between the targeted tyrosine kinase inhibitors sorafeniband sunitinib and pancreatitis has been described in recentliterature [29]. Motzer et al. examined the effects of suni-tinib in patients with metastatic renal cell carcinoma andreported elevated serum lipase in 30 % of patients withoutany other clinical signs of pancreatitis [30]. In anotherstudy, clinical pancreatitis was found in 3 of 451 patientson sorafenib with several other documented case reports ofsorafenib-induced pancreatitis that resolved with discontin-uation or reduction in sorafenib dosing [31–33].
For detecting and grading the severity of acute pancreatitis,multi-detector computed tomography (MDCT) is themodalityof choice. Chemotherapeutic agents first cause acute intersti-tial pancreatitis, which may further progress to acutenecrotising pancreatitis. On CT, acute interstitial pancreatitismay be characterised by fluid collections, peripancreatic fatstranding, focal areas of decreased attenuation, or diffuse
Fig. 4 A 63-year-old female with metastatic breast cancer undergoingtreatment with a drug regimen that includes lapatinib. Longitudinal US ofthe liver reveals diffuse starry sky appearance consistent with diffusehepatic oedema and acute hepatitis
Fig. 5 A 54-year-old male with acute myelogenous leukaemia treatedwith alemtuzumab. a, b Axial and coronal contrast-enhanced CT images,respectively, demonstrating hepatomegaly and periportal oedema(arrows) indicative of acute hepatitis
Insights Imaging (2015) 6:665–677 669
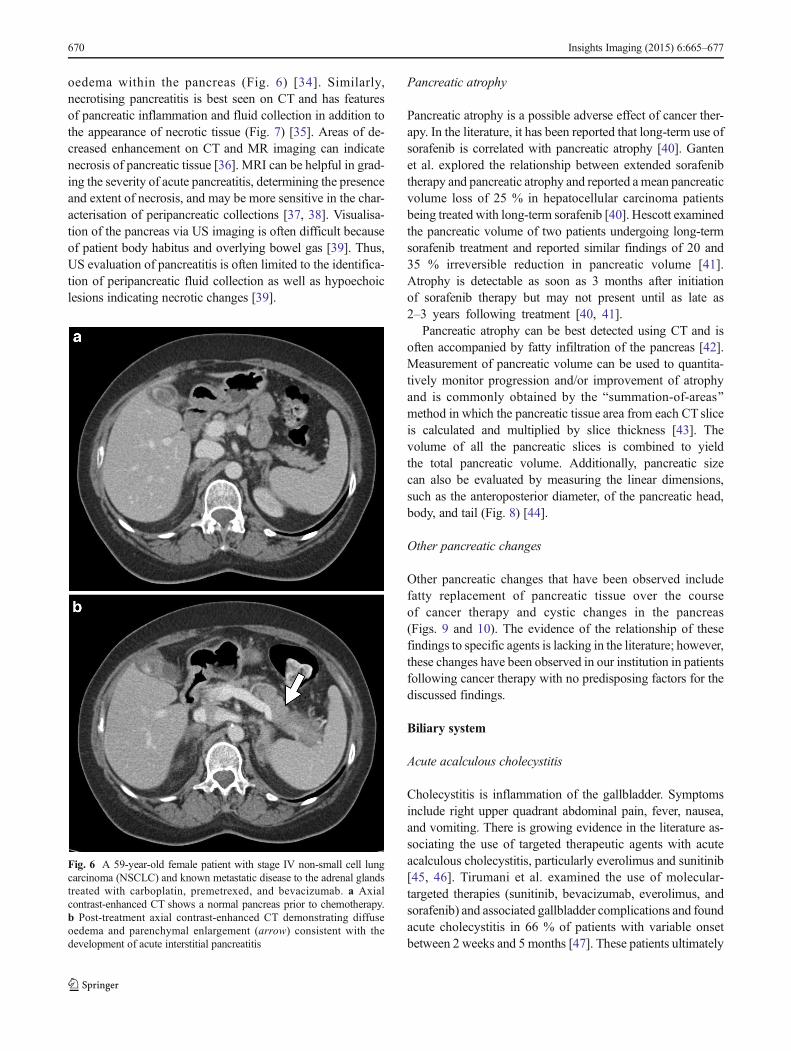
oedema within the pancreas (Fig. 6) [34]. Similarly,necrotising pancreatitis is best seen on CT and has featuresof pancreatic inflammation and fluid collection in addition tothe appearance of necrotic tissue (Fig. 7) [35]. Areas of de-creased enhancement on CT and MR imaging can indicatenecrosis of pancreatic tissue [36]. MRI can be helpful in grad-ing the severity of acute pancreatitis, determining the presenceand extent of necrosis, and may be more sensitive in the char-acterisation of peripancreatic collections [37, 38]. Visualisa-tion of the pancreas via US imaging is often difficult becauseof patient body habitus and overlying bowel gas [39]. Thus,US evaluation of pancreatitis is often limited to the identifica-tion of peripancreatic fluid collection as well as hypoechoiclesions indicating necrotic changes [39].
Pancreatic atrophy
Pancreatic atrophy is a possible adverse effect of cancer ther-apy. In the literature, it has been reported that long-term use ofsorafenib is correlated with pancreatic atrophy [40]. Gantenet al. explored the relationship between extended sorafenibtherapy and pancreatic atrophy and reported a mean pancreaticvolume loss of 25 % in hepatocellular carcinoma patientsbeing treated with long-term sorafenib [40]. Hescott examinedthe pancreatic volume of two patients undergoing long-termsorafenib treatment and reported similar findings of 20 and35 % irreversible reduction in pancreatic volume [41].Atrophy is detectable as soon as 3 months after initiationof sorafenib therapy but may not present until as late as2–3 years following treatment [40, 41].
Pancreatic atrophy can be best detected using CT and isoften accompanied by fatty infiltration of the pancreas [42].Measurement of pancreatic volume can be used to quantita-tively monitor progression and/or improvement of atrophyand is commonly obtained by the Bsummation-of-areas^method in which the pancreatic tissue area from each CT sliceis calculated and multiplied by slice thickness [43]. Thevolume of all the pancreatic slices is combined to yieldthe total pancreatic volume. Additionally, pancreatic sizecan also be evaluated by measuring the linear dimensions,such as the anteroposterior diameter, of the pancreatic head,body, and tail (Fig. 8) [44].
Other pancreatic changes
Other pancreatic changes that have been observed includefatty replacement of pancreatic tissue over the courseof cancer therapy and cystic changes in the pancreas(Figs. 9 and 10). The evidence of the relationship of thesefindings to specific agents is lacking in the literature; however,these changes have been observed in our institution in patientsfollowing cancer therapy with no predisposing factors for thediscussed findings.
Biliary system
Acute acalculous cholecystitis
Cholecystitis is inflammation of the gallbladder. Symptomsinclude right upper quadrant abdominal pain, fever, nausea,and vomiting. There is growing evidence in the literature as-sociating the use of targeted therapeutic agents with acuteacalculous cholecystitis, particularly everolimus and sunitinib[45, 46]. Tirumani et al. examined the use of molecular-targeted therapies (sunitinib, bevacizumab, everolimus, andsorafenib) and associated gallbladder complications and foundacute cholecystitis in 66 % of patients with variable onsetbetween 2 weeks and 5 months [47]. These patients ultimately
Fig. 6 A 59-year-old female patient with stage IV non-small cell lungcarcinoma (NSCLC) and known metastatic disease to the adrenal glandstreated with carboplatin, premetrexed, and bevacizumab. a Axialcontrast-enhanced CT shows a normal pancreas prior to chemotherapy.b Post-treatment axial contrast-enhanced CT demonstrating diffuseoedema and parenchymal enlargement (arrow) consistent with thedevelopment of acute interstitial pancreatitis
670 Insights Imaging (2015) 6:665–677

Fig. 7 An 11-year-old male withacute lymphoblastic leukaemia oncombination therapy that includesL-asparaginase. a, b Axial andcoronal CT images, respectively,show “walled-off” necrosis(arrows) of the pancreas
Fig. 8 A 51-year-old female with stage IIIc ovarian cancer treated withbevacizumab. a Axial contrast-enhanced CT of the pancreas pre-chemotherapy with normal findings (arrow). b Repeat axial contrast-enhanced CT 11 months after initiation of chemotherapy shows markedpancreatic atrophy as well as fatty replacement (arrow)
Fig. 9 A 57-year-old female with leimyosarcoma treated with ifosfamide,mesna, and doxorubicin. a Pre-chemotherapy axial contrast-enhanced CTshows minimal fatty replacement of the pancreas. b Diffuse fattyreplacement of the pancreas (arrows) is noted on axial contrast-enhancedCT performed 3 years later following cessation of chemotherapy
Insights Imaging (2015) 6:665–677 671

required dose reduction, temporary discontinuation of thetherapy, or permanent discontinuation of the therapy with50% requiring either cholecystectomy or cholecystotomy [47].
US is the imaging modality of choice to diagnose acuteacalculous cholecystitis. Sonographic findings of therapy-induced acalculous cholecystitis include gallbladder wall thick-ening (>3 mm), gallbladder distension, and pericholecystic fluidin the absence of cholelithiasis [48]. Findings associated withcholecystitis on CT include gallbladder distension (>40 mm),fat stranding, hyperaemia, and pericholecystic free fluid(Fig. 11) [48].
Biliary inflammation
Oncologic agents are mainly excreted through the kidneys orthe bile. Biliary excretion of certain oncologic agents may
cause changes in the biliary epithelium leading to biliary en-hancement on imaging. Common chemotherapeutic agentsthat are excreted through the bile include L-asparaginase,doxorubicin, epirubicin, and paclitaxel [49]. Commontargeted therapeutics excreted through the bile include soraf-enib and sunitinib [49]. Excretion of these therapeutic agentsmay have adverse effects on the epithelium causing irritation,thickening, and inflammation, which can be visualised as en-hancement on CT and MR imaging (Figs. 12 and 13).
Biliary sclerosis
Chemotherapy-induced biliary sclerosis (CIBS) is a well-known toxicity associated with hepatic arterial infusion pumpchemotherapy (HAIPC) with floxuridine [50]. Chemothera-peutic agents can cause CIBS through adverse toxicity onthe biliary system or ischaemic changes to the pericholangiticvenous plexus, leading to stricture of the biliary ducts [7]. Itoet al. examined the incidence of CIBS following HAIPC withfloxuridine and found 5.5 % incidence in patients receivingHAIPC after hepatectomy and 2 % incidence in patients re-ceiving HAIPC for unresectable disease [51]. CIBS can bemanaged with alternating infusion of an intrahepatic steroidor reduction in the chemotherapeutic dose while some casesmay require stenting or dilatation [7].
The imaging findings of biliary sclerosis resemble those ofprimary sclerosing cholangitis and include a thickened andenhanced bile duct wall, bile duct stricture with the lumenmeasuring less than 3 mm, and periductal oedema [7, 52].The gold standard imaging modality for detecting biliarysclerosis is endoscopic retrograde choloangiopancreatography(ERCP) [52]. ERCP is excellent for visualising the biliary treeand has high sensitivity for detecting dilatations and strictures ofthe biliary tree. Magnetic resonance cholangiopancreatography(MRCP) is non-invasive and offers similar imaging advantagesas ERCP, but without the risks that ERCP has such as infectionand bleeding [52]. The use of ERCP allows for interventionalsteps to be taken if necessary such as stenting and biliary stric-ture dilatation while MRCP reduces the risk of complicationsbecause of its non-invasive nature [52].
Biliary stasis
In addition to the biliary enhancement, biliary stasis has beennoted in our practice after initiation of tamoxifen and doxoru-bicin. Biliary stasis is a condition in which bile cannot beexcreted from the liver into the duodenum and causes subse-quent formation of biliary sludge and biliary dilatation [53].Cholestasis may present with a number of symptoms includ-ing scleral icterus and pruritis; however, drug-induced chole-stasis may be asymptomatic with elevated alkaline phospha-tase as the onlymanifestation [54]. US is the primary modalityused for diagnosing biliary stasis and is characterised by
Fig. 10 A 75-year-old male with lung adenocarcinoma receiving tarcevachemotherapy. a Axial contrast-enhanced CT image performed prior toinitiation of chemotherapy treatment shows normal pancreatic features. bAxial contrast-enhanced CT performed following 2 years ofchemotherapy shows the progression and development of multiple low-attenuating cystic lesions (arrows)
672 Insights Imaging (2015) 6:665–677

dilatation of the common bile duct (>7 mm) [53]. CT, cholan-giography, and MR may be used to confirm biliary dilatationas well as the presence of tumefactive sludge (Fig. 14) [53].Additionally, MR imaging is the modality of choice for non-invasive visualisation of the biliary tree and is useful in thediagnosis of many biliary conditions [53].
Effects of localised therapy
Transcatheter arterial chemoembolisation (TACE) is a widelyused treatment for hepatocellular carcinoma. TACE is a pro-cedure that involves transarterial administration of a mixtureof anticancer agents, such as doxorubicin or cisplatin, and
Fig. 11 A 54-year-old male withstage IV non-small cell lungcancer status post chemotherapytreatment with cisplatin andpremetrexed. a, b Axial andsagittal contrast-enhanced CTimages, respectively, show adistended gallbladder with diffusegallbladder wall thickening(arrows) consistent with acuteacalculous cholecystitis
Fig. 12 An 81-year-old female with stage IV recurrent squamousNSCLC treated with carboplatin, gemcitabine tarceva, and abraxane. a,b Axial and coronal contrast-enhanced CT images, respectively,demonstrate a mildly dilated common bile duct (arrows) with thickenedenhancing walls consistent with biliary epithelial irritation
Fig. 13 A 39-year-old male with non-Hodgkin’s lymphoma treated withdoxorubicin. Coronal post-contrast MR image shows the thickened,enhancing biliary wall (arrow) of the common bile duct consistent withbiliary inflammation
Insights Imaging (2015) 6:665–677 673

iodised oil followed by embolising particles [55]. This allowsfor local administration of chemotherapeutic agents directly totumours.
There are a number of imaging appearance changes thatpresent following TACE. On CT, portions of the tumour thatretain and accumulate iodised oil are necrotic and appear asnon-enhancing foci while enhancing foci indicate viable tissuethat may require additional treatment [55]. Kim et al. evaluat-ed the value of the unenhanced phase in assessing HCC afterTACE and found that the use of the unenhanced phase couldimprove the detection of viable tumour tissue with viableHCC appearing hyperattenuating or isoattenuating on the he-patic arterial phase and hypoattenuating on the unenhancedphase [56]. However, accumulation of iodised oil may gener-ate considerable beam-hardening artefacts on CT that are notpresent on MRI [57]. In cases where there is a significantamount of iodised oil, MR imaging plays a vital role becauseof the artefact that appears on CT, resulting in difficulty de-tecting tumours using this modality [57]. On MRI, necrotictissue will not demonstrate contrast enhancement while resid-ual tumours will appear as hyperintense lesions [58].
Awareness of the normal imaging findings after TACEwill allow for better recognition of pathologic changesassociated with post-TACE complications. The adverse effectsof TACE have been well documented in the literature andinclude hepatic abscess, hepatic failure, pancreatitis, and bileduct injury [59].
Hepatic abscess
Hepatic abscess is a rare complication that can occur afterTACE and may develop secondary to bacterial seeding ofbilomas or from the necrotic core of an embolised hepatictumour [60]. Marelli et al. found liver abscess formation inonly 1.3 % of patients with VanderWalde reporting that pa-tients with a history of bilioenteric anastomosis or biliary
reconstruction are at greatest risk for developing abscesses[61, 62]. Woo et al. performed a study observing liverabscess formation after the TACE procedure with doxoru-bicin, iopamidol, and absorbable gelatin sponge embolisa-tion in patients with bilioenteric anastomoses and foundthat abscesses formed in 12 of 25 patients, significantly higherthan the 1.3 % reported for the general patient population [63].Moreover, Woo et al. reported that particulate embolisation oroily portogram significantly elevated the incidence of liver ab-scess [63]. Hepatic abscess formation may appear at 2 weekspost TACE and most can be treated successfully with a combi-nation of percutaneous drainage and antibiotic therapy [60, 62].
Hepatic abscesses can be diagnosed with the highest sen-sitivity on CT imaging and present as hypoattenuating lesionswith peripheral rim enhancement; however, imaging of thepost-TACE liver commonly reveals gas formation withinthe areas of embolisation, which may confound hepaticabscess diagnosis and require aspiration for accurate diag-nosis [60, 64]. Additionally, MRI may play a helpful rolein the detection, characterisation, and evaluation of liverabscesses because of its multiplanar capability and sensi-tivity to small differences in tissue composition [65].
Hepatic failure
Hepatic failure following TACE is dependent on the baselinehepatic function, with a higher incidence of liver failure inpatients with Child C liver disease compared with B and A[60]. Due to the increased risk of complications, most individ-uals with Child C liver disease will not be accepted for TACE.Huang et al. conducted a prospective study finding acute liverfailure in 13.4 % of patients with HCC following TACE per-formed with doxorubicin, Lipiodol, and Gelfoam cube embo-lisation [66] Acute liver failure was previously established asincreased bilirubin ≥2 mg/dl, increased Child-Pugh score ≥2,or ascites within 14 days of the procedure [66]. Additionally,
Fig. 14 A 60-year-old femalewith recurrent ovarian cancertreated with a multi-drugchemotherapy regimen, whichincluded gemcitabine. a Coronalcontrast-enhanced CT followingchemotherapy shows initialpresentation of tumefactivesludge (arrow) within the gallbladder lumen. b Repeat coronalcontrast-enhanced CT 6 monthslater shows progression oftumefactive sludge (arrows) andenhancing mildly thickenedgallbladder wall changes,consistent with biliary stasis
674 Insights Imaging (2015) 6:665–677

Lu et al. investigated liver function damage followingsuperselective TACE with low-dose versus conventional-dose anticancer drugs in HCC patients. Patients either re-ceived low or conventional dose mitomycin C, epirubicin,and carboplatin [66]. Anticancer drugs were administeredwith Lipiodol followed by either gelatin sponge or polyvinylalcohol (PVA) particle embolisation [66]. Lu et al. found thatboth doses worsened liver function, which was evaluated withChild-Pugh scores, total bilirubin, albumin, and alanine ami-notransferase [66]. However, the conventional dose causedmore severe impairment of liver function, suggesting that he-patic failure from TACE may be dependent on chemothera-peutic agent dosing [66].
Acute hepatic failure is primarily diagnosed clinically andconfirmed with laboratory testing. Prolonged PT/INR, elevatedaminotransferases, elevated bilirubin, and decreased plateletcount are among the abnormalities that may be detected withlaboratory tests [67]. Although the role of imaging is oftenlimited, signs suggestive of hepatic failure can be seen on US,CT, andMR imaging. OnUS, liver failure presents as increasedhepatic echogenicity, ascites, nodularity, and segmental hyper-trophy or atrophy [68]. Similarly, CT and MR can reveal asci-tes, surface and parenchymal nodularity, heterogeneous liverparenchyma, and segmental hypertrophy or atrophy [60, 68].
Pancreatitis
Pancreatitis is an uncommon but severe complication ofTACE. The incidence of this complication is rare, reportedin only 1.7 % of TACE patients, and may occur because ofreflux of chemoembolic agents to the pancreas [69, 70].López-Benítez et al. investigated acute pancreatitis followingTACE and found acute pancreatitis 24 h after the procedure in15.2 % of patients with non-selected embolisation. The num-ber of procedures and volume of embolic material were foundto be the most significant factors associated with incidence[71]. TACE-induced pancreatitis can be treated in the samemanner as pancreatitis from other causes [70].
Awareness of this complication following TACE warrantsroutine monitoring of serum amylase and lipase and com-plaints of abdominal pain may raise suspicions of acute pan-creatitis related to TACE. As mentioned previously, pancrea-titis may be characterised on CT by fluid collections,peripancreatic fat stranding, or diffuse oedema within the pan-creas. Areas of low attenuation within the pancreas can indi-cate necrosis of pancreatic tissue.
Bile duct injury
Bile duct necrosis, biliary stricture, and biloma developmentcan occur following TACE because of ischaemic injury to thebiliary plexus [60]. Sakamoto et al. examined 972 patients toinvestigate the incidence of biloma formation after TACE
[72]; 3.6 % patients developed intrahepatic biloma followingTACE therapy with the main risk factors being injectionof a suspension of anticancer drugs versus a mixture, bileduct dilatation, and repeated chemoembolisations with afrequency of less than 3 months [72]. Miyayama et al.found main bile duct stricture with subsequent develop-ment of bile duct dilatation in 4 % of HCC patients afterTACE performed with Lipiodol, epirubicin, and mitomycinC followed by gelatin sponge particles [73]. The main riskfactor identified by Miyayama for development of mainbile duct stricture following TACE is selective TACE ofthe caudate arterial branch and/or the medial segmentalartery of the liver [73].
Biliary strictures and bilomas commonly require endoscop-ic or percutaneous drainage [60]. CT and MR can be used todiagnose bile duct complications and portal vein obliterationfollowing TACE [74]. Bile duct injury can be seen as bile ductdilatation and areas of decreased attenuation, which is indica-tive of extrabiliary collection of bile [75]. MRCP allows forexcellent evaluation of the biliary tree and fluid collections.When combined with a biliary contrast agent, MRCP is alsoable to detect and localise bile duct leaks [76].
Conclusion
Cancer therapy includes a wide array of different types of treat-ment, which includes chemotherapy, targeted therapy, andcatheter-directed chemoembolisation. The intrinsic toxicity ofthese therapies contributes to their efficacy in combatingtumour growth, but also to the adverse effects they have onhealthy tissues. These toxic agents commonly affect the liver,pancreas, and biliary system. The different treatment modalitiesand anticancer agents can cause sinusoidal obstruction syn-drome, fatty liver, pseudocirrhosis, pancreatitis, pancreatic atro-phy, cholecystitis, biliary sclerosis, and biliary inflammation.These changes may result in severe complications for patientsand even death. It is important to note that the imaging findingsassociated with the cancer therapy complications discussed areoften similar to the findings seen with other causes of compli-cations unrelated to cancer therapy, making clinical informationcrucial when formulating treatment plans. Awareness andfamiliarisation with the imaging features associated with thesecancer therapy-induced changes will allow for early detection ofthese complications and improved patient management andoutcomes.
Open Access This article is distributed under the terms of theCreative Commons Attribution 4.0 International License (http://creativecommons.org/licenses/by/4.0/), which permits unrestricteduse, distribution, and reproduction in any medium, provided yougive appropriate credit to the original author(s) and the source, provide alink to the Creative Commons license, and indicate if changes were made.
Insights Imaging (2015) 6:665–677 675

References
1. Robinson SM, Scott J, Manas DM SA White (2013) The assess-ment and management of chemotherapy associated liver injury,hepatic surgery. Prof. Hesham Abdeldayem (ed) ISBN: 978-953-51-0965-5. INTECH, doi:10.5772/53915
2. King PD, Perry MC (2001) Hepatotoxicity of chemotherapy.Oncologist 6:162–176
3. Robinson PJ (2009) The effects of chemotherapy on liver imaging.Eur Radiol 19:1752–1762
4. Sharma A, Houshyar R, Bhosale P, Choi J, Gulati R, Lall C (2014)Chemotherapy induced liver abnormalities: an imaging perspective.Clin Mol Hepatol 20:317–326
5. Hamer OW, Aguirre DA, Casola G, Lavine JE, Woenckhaus M,Sirlin CB (2006) Fatty liver: imaging patterns and pitfalls.Radiographics 26(6):1637–1653
6. Décarie PO, Lepanto L, Billiard JS, Olivié D, Lavallée JM,Kauffmann C et al (2011) Fatty liver deposition and sparing: apictorial review. Insights Imaging 2(5):533–538
7. Torrisi JM, Schwartz LH, Gollub MJ, Ginsberg MS, Bosl GJ,Hricak H (2011) CT findings of chemotherapy-induced toxicity.Radiology 258:41–56
8. Maor Y, Malnick S (2013) Liver injury induced by anticancer che-motherapy and radiation therapy. Int J Hepatol 2013, Article ID815105. doi:10.1155/2013/815105, 8 pages
9. Kalil AN, Coral GP, Santos FA, Gonzalez MC, Neutzling CB(2014) The association between preoperative chemotherapy andthe prevalence of hepatic steatosis in hepatectomy for metastaticcolorectal cancer. Arq Bras Cir Dig 27(2):120–125
10. Mohty M, Malard F, Abecassis M, Aerts E, Alaskar AS, Aljurf Met al (2015) Sinusoidal obstruction syndrome/veno-occlusive dis-ease: current situation and perspectives—a position statement fromthe European Society for Bone and Marrow Transplantation(EBMT). Bone Marrow Transplant
11. Ikezoe T, Togitani K, Komatsu N, Isaka M, Yokoyama A (2010)Successful treatment of sinusoidal obstruction syndrome after he-matopoietic stem cell transplantation with recombinant human sol-uble thrombomodulin. Bone Marrow Transplant 45:783–785
12. DeLeve LD, Shulman HM, McDonald GB (2002) Toxic injury tohepatic sinusoids: sinusoidal obstruction syndrome (veno-occlusivedisease). Semin Liver Dis 22:27–42
13. Seo AN, Kim H (2014) Sinusoidal obstruction syndrome afteroxaliplatin-based chemotherapy. Clin Mol Hepatol 20:81–84
14. Stoneham S, Lennard L, Coen P, Lilleyman J, Saha V (2003) Veno-occlusive disease in patients receiving thiopurines during mainte-nance therapy for childhood acute lymphoblastic leukemia. Br JHaematol 123:100–102
15. Fan CQ, Crawford JM (2014) Sinusoidal obstruction syndrome(hepatic veno-occlusive disease). J Clin Exp Hepatol 4(4):332–346
16. ZhouH,WangY, LouH,XuX, ZhangM (2014) Hepatic sinusoidalobstruction syndrome caused by herbal medicine: CT and MRIfeatures. Korean J Radiol 15(2):218–225
17. Sangisetty SL, Miner TJ (2012) Malignant ascites: a review ofprognostic factors, pathophysiology, and therapeutic measures.World J Gastrointest Surg 4(4):87–95
18. Jeong WK, Choi SY, Kim J (2013) Pseudocirrhosis as a complica-tion after chemotherapy for hepatic metastasis from breast cancer.Clin Mol Hepatol 19:190–194
19. Lee SM, Chang ED, Na SJ, Kim JS, An HJ, Ko YH et al (2014)Pseudocirrhosis of breast cancer metastases to the liver treated bychemotherapy. Cancer Res Treat 46:98–103
20. Qayyum A, Lee GK, Yeh BM, Allen JN, Venook AP, Coakley FV(2007) Frequency of hepatic contour abnormalities and signs ofportal hypertension at CT in patients receiving chemotherapy forbreast cancer metastatic to the liver. Clin Imaging 31:6–10
21. Jha P, Poder L, Wang ZJ, Westphalen AC, Yeh BM, CoakleyFV (2010) Radiologic mimics of cirrhosis. Am J Roentgenol190:993–999
22. Lee SL, Chang ED, Na SJ, Kim JS, An HJ, Ko YH et al (2014)Pseudocirrhosis of breast cancer metastases to the liver treated bychemotherapy. Cancer Res Treat 46(1):98–103
23. Lau GK (2008) Hepatitis b reactivation after chemotherapy: twodecades of clinical research. Hepatol Int 2(2):152–162
24. Mahale P, Kontoyiannis DP, Chemaly RF, Jiang Y, Hwang JP,Davila M et al (2012) Acute exacerbation and reactivation ofchronic hepatitis C virus infection in cancer patients. J Hepatol57:1177–1185
25. Abu-Judeh HH (2002) The Bstarry sky^ liver with right-sided heartfailure. AJR Am J Roentgenol 178:78
26. Park SJ, Kim JD, Seo YS, Park BJ, Kim MJ, Um SH et al (2013)Computed tomography findings for predicting severe acute hepati-tis with prolonged cholestasis. World J Gastroenterol 19(16):2543–2549
27. Morgan C, Tillett T, Braybrooke J, Ajithkumar T (2011)Management of uncommon chemotherapy-induced emergencies.Lancet Oncol 12:806–814
28. Singh V, Devata S, Cheng YC (2010) Carboplatin anddocetaxel-induced acute pancreatitis: brief report. Int J ClinOncol 15(6):642–644
29. Viswanathan C, Truong MT, Sagebiel TL, Bronstein Y, Vikram R,Patnana M (2014) Abdominal and pelvic complications of nonop-erative oncologic therapy. RadioGraphics 34:941–961
30. Motzer RJ, Rini BI, Bukowski RM, Curti BD, George DJ, HudesGR et al (2006) Sunitinib in patients with metastatic renal cellcarcinoma. JAMA 295(21):2516–2524
31. Saadati H, Saif MW (2010) Sorafenib-induced acute pancreatitis.JOP 11(3):283–284
32. Kobayashi Y, Kanemitu T, Kamoto A, Satoh M, Mori N, YoshiokaT et al (2011) Painless acute pancreatitis associated with sorafenibtreatment: a case report. Med Oncol 28(2):463–465
33. Li M, Srinivas S (2007) Acute pancreatitis associated with sorafe-nib. South Med J 100(9):909–911
34. Ganeshan DM, SalemU, Viswanathan C, Balachandran A, Garg N,Silverman P et al (2013) Complications of oncologic therapy inabdomen and pelvis: a review. Abdom Imaging 38:1–21
35. Calculli L, Pezzilli R, Casadi R, Fiscaletti M, Gavelli G (2005)Imaging techniques for acute necrotizing pancreatitis: multidetectorcomputed tomography. 7:104–109
36. Shyu JY, Sainani NI, Sahni VA, Chick JF, Chauhan NR, ConwellDL et al (2014) Necrotizing pancreatitis: diagnosis, imaging, andintervention. RadioGraphics 34:1218–1239
37. Miller FH, Keppke AL, Dala K, Ly JN, Kamler VA, Sica GT (2004)MRI of pancreatitis and its complications: part 1, acute pancreatitis.Am J Roentgenol 183(6):1637–1644
38. Xiao B, Zhang XM (2010) Magnetic resonance imaging for acutepancreatitis. World J Radiol 28(8):298–308
39. O’connor OJ, McWilliam S, Maher MM (2011) Imaging of acutepancreatitis. Am J Roentgenol 197:221–225
40. Ganten MK, Schuessler M, Bruckner T, Ganten TM, Koschny R(2015) Pancreatic atrophy in hepatocellular carcinoma patients re-ceiving long-term treatment with sorafenib. Oncology
41. Hescot S, Vignaux O, Goldwasser F (2013) Pancreatic atrophy—anew late toxic effect of sorafenib. N Engl J Med 369:1475–1476
42. Stratton A, Murphy T, Laczek J (2012) Atrophic-appearing pan-creas on magnetic resonance cholangiopancreatography as initialpresentation of cystic fibrosis. Hawaii J Med Public Health71(6):151–154
43. Djuric-Stefanovic A, Masulovic D, Kostic J, Randjic K, SaranovicD (2012) CT volumetry of normal pancreas: correlation with thepancreatic diameters measurable by the cross-sectional imaging,
676 Insights Imaging (2015) 6:665–677

and relationship with the gender, age, and body constitution. SurgRadiol Anat 34:811–817
44. Syed AB, Mahal RS, Schumm LP, Dachman AH (2012) Pancreassize and volume on computed tomography in normal adults. 41(4):589–595
45. Cetin B, Coskun U, Yildiz R, Buyukberber S, Baykara M, BenekliM (2010) Acute cholecystitis in a patient with metastatic renal cellcarcinoma treated with everolimus: a case report. J Oncol PharmPract 17(3):274–278
46. Gomez-Abuin G, Karam AA, Mezzadri NA, Bas CA (2009)Acalculous cholecystitis in a patient with metastatic renal cell car-cinoma treated with sunitinib. Clin Genitourin Cancer 7:62–63
47. Tirumani SH, Krajewski KM, Shinagare AB, Jagannathan JP,Ramaiya NK (2014) Gallbladder complications associated withmolecular targeted therapies:clinical and imaging features. ClinImaging 38:50–55
48. O’Connor OJ, Maher MM (2011) Imaging of cholecystitis. Am JRoentgenol 196(4):367–374
49. Superfin D, Iannuci AA, Davies AM (2007) Oncologic drugs inpatients with organ dysfunction: a summary. Oncologist 12:1070–1083
50. Hohn D, Melnick J, Stagg R, Altman D, Friedman M, Ignoffo Ret al (1985) Biliary sclerosis in patients receiving hepatic arterialinfusions of floxuridine. J Clin Oncol 3(1):98–102
51. Ito K, Ito H, Kemeny NE, Gonen M, Allen PJ, Paty PB et al (2012)Biliary sclerosis after hepatic arterial infusion pump chemotherapyfor patients with colorectal cancer liver metastasis: incidence,clinical features, and risk factors. Ann Surg Oncol 19:1609–1617
52. Enns R (2008) The use of ERCP versus MRCP in primary scleros-ing cholangitis. Gastroenterol Hepatol 4(12):852–854
53. Rogoveanu I, Ghenoea DI, Saftoiu A, Ciurea T (2006) The role ofimaging methods in identifying the causes of extrahepatic cholesta-sis. Clin Imaging 15:265–271
54. Padda MS, Sanchez M, Akhtar AJ, Boyer JL (2011) Drug inducedcholestasis. Hepatology 53:1377–1387
55. Agnello F, Salvaggio G, Cabibbo G,MaidaM, Lagalla R, Midiri Met al (2013) Imaging appearance of treated hepatocellular carcino-ma. World J Hepatol 5(8):417–424
56. Kim HC, KimAY, Han JK, Chung JW, Lee JY, Park JH et al (2002)Hepatic arterial and portal venous phase helical CT in patients treat-ed with transcatheter arterial chemoembolization for hepatocellularcarcinoma: added value of unenhanced images. Radiology 225(3):773–780
57. Kloeckner R, Otto G, Biesterfeld S, Oberholzer K, Dueber C, PittonMB (2010) MDCT versus MRI assessment of tumor response aftertransarterial chemoembolization for the treatment of hepatocellularcarcinoma. Cardiovasc Intervent Radiol 33(3):532–540
58. Yaghmai V, Besa C, Kim E, Gatlin JL, Siddiqui NA, Taouli B(2013) Imaging assessment of hepatocellular carcinoma responseto locoregional and systemic therapy. AJR Am J Roentgenol 201:80–96
59. Poggi G, Pozzi E, Riccardi A, Tonini S, Montagna B, Quaretti Pet al (2010) Complications of image-guided transcatheter hepaticchemoembolization of primary and secondary tumours of the liver.Anticancer Res 30:5159–5164
60. Clark T (2006) Complications of hepatic chemoembolization.Semin Interv Radiol 23:119–125
61. Marelli L, Stigliano R, Triantos C, Senzolo M, Cholangitas E,Davies N et al (2007) Transarterial therapy for hepatocellular
carcinoma: which techinique is more effective? a systematicreview of cohort and randomized studies. Cardiovasc InterventRadiol 30(1):6–25
62. VanderWalde A (2009) Liver abscess as a complication of hepatictransarterial chemoembolization: a case report, literature review,and clinical recommendations. Gastrointest Cancer Res 3(6):247–251
63. Woo S, Chung JW, Hur S, Joo SM, Kim HC, Jae HJ et al (2013)Liver abscess after transarterial chemoembolization in patients withbilioenteric anastomosis: frequency and risk factors. AJR Am JRoentgenol 200(6):1370–1377
64. Wang CL, Guo XJ, Qui SB, Lei Y, Yuan ZD, Dong HB et al (2007)Diagnosis of bacterial hepatic abscess by CT. HepatobiliaryPancreat Dis Int 6:271–275
65. Elsayes KM,Narra VR, Yin Y,Mukundan G, LammleM, Brown JJ(2005) Focal hepatic lesions: diagnostic value of enhancement pat-tern approach with contrast-enhanced 3D gradient-echo MR imag-ing. Radiographics 25(5):1299–1320
66. Huang YS, Chiang JH, Wu JC, Chang FY, Lee SD (2002) Risk ofhepatic failure after transcatheter arterial chemoembolization for he-patocellular carcinoma: predictive value ofmonoethylglycinexylididetest. Am J Gastroenterol 97:1223–1227
67. Larson AM (2010) Diagnosis and management of acute liverfailure. Curr Opin Gastroenterol 26(3):214–221
68. Romero M, Palmer SL, Kahn JA, Ihde L, Lin LM, Kosco A et al(2014) Imaging appearance in acute liver failure: correlation withclinical and pathology findings. Dig Dis Sci 59(8):1987–1995
69. Bae SI, Yeon JE, Lee JM, Kim JH, Lee HJ, Lee SJ et al (2012) Acase of necrotizing pancreatitis subsequent to transcatheter arterialchemoembolization in a patient with hepatocellular carcinoma. ClinMol Hepatol 18(3):321–325
70. Ozçinar B, Güven K, Poyanli A, Ozden I (2009) Necrotizing pan-creatitis after transcathether arterial chemoembolization for hepato-cellular carcinoma. Diagn Interv Radiol 15(1):36–38
71. López-Benítez R, Radeleff BA, Barragán-Campos HM, NoeldgeG, Grenacher L, Richter GM et al (2007) Acute pancreatits afterembolization of liver tumors:frequency and associated risk factors.Pancreatology 7:53–62
72. Sakamoto I, Iwanaga S, Nagaoki K, Matsuoka Y, Ashizawa K,Uetani M et al (2003) Intraheptaic biloma formation (bile ductnecrosis) after transcatheter arterial chemoembolization. Am JRoentgenol 181:79–87
73. Miyayama S, Yamashiro M, Okuda M, Yoshie Y, Nakashima Y,Ikeno H et al (2010) Main bile duct stricture occurring after trans-catheter arterial chemoembolization for hepatocellular carcinoma.Cardiovasc Intervent Radiol 33(6):1168–1179
74. Pelletier AL, Hammel P, Zappa M, Bedossa P, Rebours V, Hentic Oet al (2008) Fatal bile duct necrosis: a rare complication of trans-catheter arterial chemoembolization in a patient with endocrine he-patic metastasis. Case Rep Gastroenterol 2:356–362
75. Yu JS, Kim KW, Park MS, Yoon SW (2001) Bile duct injuriesleading to portal vein obliteration after transcatheter arterialchemoembolization in the liver: CT findings and initial observa-tions. Radiology 221:429–436
76. Thompson CM, Saad NE, Quazi RR, Darcy MD, Picus DD,Menias CO (2013) Management of iatrogenic bile duct injuries:role of the interventional radiologist. RadioGraphics 33(1):117–134
Insights Imaging (2015) 6:665–677 677