candidate’s name greg russell - university of manchester
TRANSCRIPT

Diabetic retinal imaging: methods in automatic processing
A thesis submitted to The University of Manchester for the degree of
MPhil in the Faculty of Life Sciences
YEAR OF SUBMISSION 2014
CANDIDATE’S NAME Greg Russell

1
Abstract
Fundus image based screening for diabetic retinopathy is offered to all diabetic
patients aged 12 and older. This has proven to be an effective procedure for the early
detection/diagnosis of diabetic retinopathy and forms the basis of current treatment
plans. However, the increasing number of diabetic patients is putting a strain on the
NHS. Computer based tools to aid detection of/grade diabetic pathologies are
currently under development. In this MPhil a novel database of fundus is described.
Many of whom also possess comorbidities such as glaucoma or hypertension. Retinal
vessel masks were extracted by hand to establish accurate high-resolution images to
test automatic vessel extraction algorithms on. Two previously published automatic
vessel segmentation algorithms were tested on this database.
This collection of images accurately represents the variety of fundus images a retinal
grader can expect to encounter in a regional screening program in the UK. In
addition retinal image quality can be significantly degraded by media opacities,
limiting the diagnostic potential of retinal images. The amount of scattering increases
with age and with some pathologies (e.g. cataract). Even though a large body of work
exists on the enhancement of images recorded in poor visibility very little has been
done on reducing the degradation of retinal images by intraocular scattering. In this
thesis a defogging filter designed to enhance image clarity was applied to fundus
images that had previously been graded as inadequate. 12% of these images were
found to be assessable after filtering suggesting that a ‘cataract filter’ of this type may
be beneficial in diabetic retinopathy screening programmes.
“The only thing worse than being blind is having sight but no vision.”
Helen Keller

2
Acknowledgements
From working in an industry dedicated to providing services of retinal screening for
14 years, to becoming a part time MPhil student for the first time after many years of
education at one of the most prestigious University’s in England can certainly be a
challenge and quite daunting. I would therefore like to thank my supervisors Dr
Vincent Nourrit and for firstly giving me an opportunity to undertake this work and
Dr Niall McLoughlin who offered great support when Vincent took up an excellent
opportunity to work in France, and could no longer be my supervisor (although has
still offered support from overseas). Niall has given me comprehensive support all
though my days as a part time student at Manchester. Also thanks to Dr John Oakley
from the faculty of Engineering and Physical Sciences at the University of
Manchester for all his support on this project and advice, and all of the students and
staff at faculty of eye and vision sciences who have inspired me in this project. Finally
I would like to offer special thanks to my boss Phil Kirby to have the time to complete
my MPhil and my colleague Mr Adam Ellis who assisted with software integration of
the Cleavue filter into our grading software. This then allowed me to alter parameters
needed for my tests and batch processing of images.

3
Contents
Chapter 1: Introduction .......................................................................................... 8
1.1 Rise in the number of patients being screened .................................................. 9
1.2 Non-mydriatic Diabetic Retinopathy Screening................................................ 11
1.3 Diabetic retinopathy .......................................................................................... 12
1.3.1 R0 Classification ................................................................................... 13
1.3.2 R1 Classification ................................................................................... 13
1.3.3 R2 Classification ................................................................................... 14
1.3.4 R3A Classification ................................................................................ 15
1.3.5 R3S Classification ................................................................................. 16
1.3.6 M1 Classification .................................................................................. 17
1.3.7 Other conditions .................................................................................... 18
1.4 Benefits of early diagnosis/detection ................................................................. 18
1.5 Recent advances in diabetic retinal screening ................................................... 24
1.6 Photography ....................................................................................................... 26
1.7 Grading Pathway & Outcomes .......................................................................... 28
1.8 Portable hand held retinal cameras .................................................................... 30
1.9 Online Databases for testing algorithms for automated screening purposes ..... 31
1.9.1 DRIVE database .................................................................................... 31
1.9.2 STARE database ................................................................................... 32
1.9.3 ARIA online database ........................................................................... 33
1.9.4 VICAVR database ................................................................................. 34
1.9.5 Messidor database ................................................................................. 34
1.9.6 ImageRet database ................................................................................ 36
1.9.7 REVIEW image set ............................................................................... 36
1.9.8 ROC database ........................................................................................ 37
1.9.9 The need for a realistic database ........................................................... 38
1.10 Current limitations with digital fundus images ............................................... 39
1.11 Gauging assessablity of retinal images ............................................................ 46
1.12 Possible solution: The cataract filter algorithm (Clearvue) ............................. 50
1.13 Overview of the rest of the thesis .................................................................... 52
Chapter 2: DR HAGIS – A new realistic DR Database for the Automatic
Extraction of Retinal Surface Vessels…………………………………………….54
2.1 The need for a realistic DR database ................................................................. 54
2.2 DR HAGIS database .......................................................................................... 54
2.3 Ground truth images .......................................................................................... 55
2.4 Initial retinal vessel segmentation results .......................................................... 58
2.5 Discussion .......................................................................................................... 62
Chapter 3: Filtering the effects of cataracts .......................................................... 63
3.1 Background ........................................................................................................ 63
3.2 Current image enhancement techniques to improve image quality ................... 64
3.3 Methods ............................................................................................................. 65
4
3.4 A pilot test of the ‘cataract filter’ algorithm ...................................................... 67
3.5 Results ............................................................................................................... 69
3.6 Discussion .......................................................................................................... 72
Chapter 4: Conclusions and future work .............................................................. 74
4.1 DR HAGIS database .......................................................................................... 75
4.2 Issues with the preliminary cataract filter study ................................................ 75
4.3 Further cataract filter studies ............................................................................. 76
4.4 Conclusions ....................................................................................................... 78
References ................................................................................................................. 80
Appendices ................................................................................................................ 87

5
Table of figures
Figure 1 An example image of a patient who would be classed as R0 ...................... 13
Figure 2 An example of an R1 classification ............................................................. 14
Figure 3 An example of the R2 classification ............................................................ 14
Figure 4 An example of the R3A classification ......................................................... 15
Figure 5 An example of stable R3S DR ..................................................................... 16
Figure 6 An example of a retina that would be graded M1 ....................................... 17
Figure 7 Image showing a central retinal vein occlusion .......................................... 18
Figure 8 Four images mandated by the ENSPDR ..................................................... 26
Figure 9 Health Intelligence measurement tool ......................................................... 27
Figure 10 The Common pathway for grading DR fundus images ............................. 29
Figure 11 Optomed Smart Scope Pro portable retinal camera .................................. 31
Figure 12 Two example images from the DRIVE databases ..................................... 32
Figure 13 Two example 35 degree images from the STARE database ..................... 33
Figure 14 Two control images taken from the ARIA online databases ..................... 33
Figure 15 An example from the VICAVR database .................................................. 34
Figure 16 Images taken from the Messidor database ................................................. 35
Figure 17 Images taken from the ImageRet database ................................................ 35
Figure 18 An image from the REVIEW database ..................................................... 36
Figure 19 An example retinal image from the ROC database ................................... 37
Figure 20 An example showing differences of white balance, exposure and barrel
distortion .................................................................................................... 38
Figure 21 The spatial resolution of film in units equivalent to digital camera
megapixels ................................................................................................. 41
Figure 22 Estimated costs of clinical malpractice resulting from misdiagnosis ........ 42
Figure 23 Effects of image manipulation ................................................................... 43
Figure 24 Image showing colour distortions ............................................................. 44
Figure 25 Retinal images showing a microaneurysm ................................................ 45
Figure 26 The progression of cataract in a patient over a 5 year period .................... 46
Figure 27 Example images from the Scottish grading scheme .................................. 48
Figure 28 Screening outcomes for patients in the East Anglia Eye Screening
Programme ................................................................................................ 49
Figure 29 Images depicting the similarities between pictures taken on a foggy day
and fundus images taken through a media opacity ................................... 50
Figure 30 An airborne image degraded by haze ........................................................ 51
Figure 31 An example of segmentation method one. ................................................ 56
Figure 32 An example of segmentation method two ................................................. 57
Figure 33 An example of the final image tracing technique ...................................... 57
Figure 34 Example fundus images from the Dr Hagis database with automatic
segmentation using the intensity based approach ...................................... 59
Figure 35 Example fundus images from the Dr Hagis database with automatic
segmentation using a two scale gabor filter based approach ..................... 60
Figure 36 An example of an unassessable retinal image ........................................... 63
Figure 37 Example of simulated clear and foggy conditions ..................................... 66
Figure 38 The five images selected for detailed investigation .................................. 70
Figure 39 An example of how varying the parameters of the cataract filter affect
the quality of a single unassessable image ................................................ 72
Figure 40 Comparison of unassessable and the ‘Clearvue’ filtered image ................ 73

6
List of Abbreviations
1DD,2DD ................................ One, two optic Disc Diameters
A/V ratio ................................. Artery to Vein ratio
AAO ........................................ American Academy of Ophthalmology
AMD ....................................... Age-related Macular Degeneration
CCD ........................................ Charge Coupled Device
CE ........................................... European Certificate
CMOS ..................................... Complementary Metal Oxide Semiconductor
CRVO ..................................... Central Retinal Vein occlusion
CWS ........................................ Cotton Wool Spots
DM .......................................... Diabetes mellitus
DNA ........................................ Did Not Attend
DR ........................................... Diabetic Retinopathy
DSLR ...................................... Digital Single Lens Reflex
eGFR ....................................... Estimated Glomerular Filtration Rate
FDA ........................................ Federal Drugs Administration
FA ........................................... Fundus Fluorescein Angiography
FFDS,SFDG ............................ First, Second Full Disease Grader
GBP ......................................... Great British Pound
GIMP ...................................... Gnu Image Manipulation Program
HES ......................................... Hospital Eye Service
ICER ....................................... Incremental Cost Effectiveness Ratio
ICO ......................................... International Council for Ophthalmology ICO
IRMA ...................................... Intra-retinal Microvascular Abnormalities
ISO .......................................... International Standards Organisation
LogMAR ................................. Logarithm of the Minimum Angle of Resolution
M0,1 ........................................ Maculopathy Grade
MA .......................................... Microaneurysms
MDT ....................................... Multi-Disciplinary Team Meeting
NHS DESP .............................. NHS Diabetic Eye Screening Programme
NSC ......................................... National Screening Committee
NSF ......................................... National Service Framework
NVD ........................................ New Vessel growth at the Disc (NVD)
NVE ........................................ New Vessel growth Elsewhere in the retina
P0,P1 ....................................... Photocoagulation grade
QALY ..................................... Quality Adjusted Life Year
R0,1,2,3A,3S ........................... Retinopathy Grade
ROG ........................................ Referal Outcome Grade (er)
ROP ......................................... Retinopathy Of Prematurity
RPE ......................................... Retinal Pigmented Epithelium
SLBM ..................................... Slit Lamp Bio-microscopy
SLR ......................................... Single Lens Reflex
STDR ...................................... Sight Threatening Diabetic Retinopathy
UAE ........................................ United Arab Emirates
UKPDS ................................... United Kingdom Prospective Diabetes Study
USD ........................................ United States dollars
VA ........................................... Visual Acuity
VEGF ...................................... Vascular Endothelial Growth Factor
WHO ....................................... World Health Organisation

7
Declaration
No portion of the work referred to in the thesis has been submitted in support of an
application for another degree or qualification of this or any other university or other
institute of learning.
Copyright Statement
The following four notes on copyright and the ownership of intellectual property
rights must be included as written below:
i. The author of this thesis (including any appendices and/or schedules to this
thesis) owns certain copyright or related rights in it (the “Copyright”) and
s/he has given The University of Manchester certain rights to use such
Copyright, including for administrative purposes.
ii. Copies of this thesis, either in full or in extracts and whether in hard or
electronic copy, may be made only in accordance with the Copyright,
Designs and Patents Act 1988 (as amended) and regulations issued under it
or, where appropriate, in accordance with licensing agreements which the
University has from time to time. This page must form part of any such
copies made.
iii. The ownership of certain Copyright, patents, designs, trade marks and
other intellectual property (the “Intellectual Property”) and any
reproductions of copyright works in the thesis, for example graphs and
tables (“Reproductions”), which may be described in this thesis, may not
be owned by the author and may be owned by third parties. Such
Intellectual Property and Reproductions cannot and must not be made
available for use without the prior written permission of the owner(s) of
the relevant Intellectual Property and/or Reproductions.
iv. Further information on the conditions under which disclosure, publication
and commercialisation of this thesis, the Copyright and any Intellectual
Property and/or Reproductions described in it may take place is available
in the University IP Policy (see
http://documents.manchester.ac.uk/DocuInfo.aspx?DocID=487), in any
relevant Thesis restriction declarations deposited in the University Library,
The University Library’s regulations (see
http://www.manchester.ac.uk/library/aboutus/regulations) and in The
University’s policy on Presentation of Theses
v. The work carried out in this thesis is the totally original work of the
author, except where acknowledged by references.

8
Chapter 1: Introduction
Diabetic retinopathy is damage to the retina caused by complications of diabetes. It
can eventually lead to blindness and affects up to 80 percent of all patients who have
had diabetes for 10 years or more (Kertes and Johnson, 2007). Diabetic retinopathy is
currently the only ocular disease that is actively screened for in the UK with annual
screening being offered to all diabetics over the age of 12. However the global
increase in the number of patients diagnosed with diabetes mellitus coupled with the
increasing costs and demands on this screening system means methods to semi-
automate or aid screeners are much in demand. DR is no longer the leading cause of
blindness in the working age population in England and this can be attributed to the
well-established English diabetic eye screening programme (Liew et al, 2014).
This thesis will present the results of two preliminary studies: one outlining a
new database of fundus images taken from diabetic patients being screened under the
NHS Diabetic Eye Screening Programme (DESP) that can be used as a test-bed for
automatic or semi-automatic vessel extraction algorithms to aid in clinical analysis. A
second study investigates the potential of a new software filter that may help in
cleaning-up low quality, so called inadequate, screening images so that fewer patients
will need to wait for results or be referred on for more costly investigations.
Before detailing these studies the need for developments in retinal screening
and how current screening programs operate are presented. Thankfully a number of
effective treatments exist for diabetic retinopathy if it is detected early enough. These
will be briefly reviewed along with recent advances in diabetic retinal screening.
Finally in this chapter the concept of image adequacy/ assessibility will be reviewed

9
along with some of the factors that control this before a new software filter which
demonstrates some promise in helping to clean-up at least some of the poorer quality
fundus images is presented.
1.1 Rise in the number of patients being screened
The dramatic ageing of the world population coupled with the massive increase in the
incidence of diabetes worldwide is increasing the strain on health services to provide
adequate retinal screening for diabetic retinopathy, amongst other age-related ocular
diseases (Zimmet et al., 2001; Voleti and Hubschman, 2013).
Diabetes mellitus (diabetes) is a global epidemic. In 2011, there were 366
million people (8.3% of the world’s adult population) living with diabetes; by 2030
this will have increased by 54% to 552 million (International Diabetes Federation,
2011). More than 80% of deaths associated with diabetes occur in low- and middle-
income countries. The World Health Organisation (WHO) projects that diabetes will
be the 7th leading cause of death by 2030. Diabetes increases the risk of a range of
eye diseases, but the main cause of blindness associated with diabetes is diabetic
retinopathy (DR). While DR is not currently the primary cause of avoidable blindness,
it has the capacity to become the leading cause of blindness in the next 20 years and it
will affect the poorest people the most - already 80% of people with diabetes live in
low-, middle-income countries (World Health Organization, 2014). Assuming an
annual screening model is used then based on a 54% increase in the global diabetic
population by 2030 almost 35 exams per second will be needed every second of every
day in order to screen the diabetic population of the world. This prediction is
compounded by the fact that there will be less than a 2% growth in the number of
ophthalmologists by 2030 (Iapb.org, 2015).

10
The limited availability of a trained workforce limits service quality and reach
globally. An estimation of the worldwide economic and health burden of visual
impairment was found to be in the region of approximately 3 trillion USD (Gordois et
al, 2011). Currently there is a 3 billion USD spending devoted to screening for
blinding eye diseases according to a report from AMD Alliance International.
With the global epidemic of diabetes (Whiting et al, 2011), the worldwide
implementation of eye screening programmes becomes more important. At the same
time, the cost of establishing and running such screening programmes is considerable
and rising. Annual screening for Diabetic Retinopathy (DR) began in Iceland in 1980.
In 1994 they proposed biennial screening of patients without retinopathy and annual
screening for patients with signs of DR. This type of biennial screening has proven to
be safe and effective, while reducing costs (Kristinsson et al, 1995; Olafsdottir and
Stefansson, 2007).
In countries/regions with no provision for DR screening there is the obvious
risk to diabetic patients in developing DR but also from other sight threatening
conditions. One private UK based screening provider for the NHS called Health
Intelligence screens DR images for eight different conditions needing urgent referral,
twelve different conditions that need GP referral, and seven different conditions that
need notification for the patient records. DR screening has a massive impact on saving
people from loss of vision.
In countries/regions with DR screening, existing arrangements such as the
inappropriately high screening frequency for low risk patients can also lead to
increased disease burden in other patients. The minority of patients who are at high
11
risk of developing Sight Threatening Retinopathy (STR) may presently experience
delayed provision of the correct treatment due to inappropriate screening.
While the costs per patient of DR screening are rather low the prevalence of
diabetes is rising and with it the total cost of DR screening as a whole. This makes it
important to make the screening programme as cost effective and efficient as possible.
The attainable cost savings of personalized DR screening vary across countries with
population size. In the UK the cost for providing a full screening service is on average
around £31 GBP based on a survey of 4 separate services charging £15, £17, £45, £50
GBP per patient per annum (depending on local population size and screening model
used e.g. optometrist, technicians subcontracted for delivery of the NHS service). In
addition we can assume that any personalized approach is likely to also promote
compliance with treatment, adding to efficiency gains in health care.
1.2 Non-mydriatic Diabetic Retinopathy Screening
A photographic system has advantages over individual specialist retinal assessment by
a ophthalmologist /optometrist. First, technicians can perform camera screening.
Second, a camera can be flown to an isolated community. Third, images can be
archived to permit comparison over time. There have been a number of proposed
screening methods for DR based on digital retinal photography, the obvious
advantage with digital imaging is the reduced cost, good expectations of clarity of
image and ability to view images remotely (Kim et al 2007; Boucher et al 2003; Sharp
et al 2003). Two-field fundus photography is the most common method deployed
within the UK. In England the national screening programme recommends that two
images are taken of each eye (Lacey and Taylor, 2014). In Scotland a single image is
taken and patients dilated only when required despite the fact that this has been shown

12
to be less effective at detection of clinical features (Aldington et al., 1995,Ding et al.,
2012, Murgatroyd et al, 2004).
In many countries, physicians or optometrists conduct DR screening during
their clinical practice. But they may be limited by a lack of dedicated time and these
professionals are theoretically more costly. In the UK, non-physician graders and
screeners have proven to be able to provide good detection of DR and maculopathy
from fundus photographs and are both clinically and cost-effective.
In the UK screeners are trained on how to operate the fundus camera and take
photographs. The patient’s pupils will be dilated only if they are too small for
adequate imaging and after consent is obtained from the patients. Two-field retinal
photography with one image centred on the macula and encompassing the optic disc
and a second image containing a nasal view centred on the optic disc and
encompassing a second view of the macular is obtained from both eyes of each
participant. This two-field approach supports the correct identification of maculopathy
as fine exudates and haemorrhages which may be difficult to see using other
techniques such as Optical Coherence Tomography (OCT). The photographs are
stored digitally and copies of the grading report are kept electronically along with the
patient’s screening data.
1.3 Diabetic retinopathy
Diabetic retinopathy causes damage to blood vessels of the eyes; diabetic retinopathy
does not usually affect sight until these changes are advanced. At least 75% of people
who have diabetes for more than 20 years will have some form of DR (World Health
Organization, 2014). Annual screening is an effective way of preventing sight loss

13
caused by diabetes, but if no treatment is given this can result in vision loss. Known
risk factors that increase the risk of developing DR include duration and type of
diabetes, poorly controlled HbA1c, high blood pressure, retinopathy stage and gender.
DR develops gradually and the severity of DR is classified using grading
classifications that correspond to disease progression.
1.3.1 R0 classification
The R0 classification occurs when no diabetic retinopathy or maculopathy is present,
and there is little chance that the patients vision is effected other than possible
blurring from lens swelling due to hyperglycemic episodes or cataract formation due
to poor sorbital metabolism (see Figure 1 for an example image of a patient with a R0
classification).
Figure 1: An example image of a patient who would be classed as R0. There are
no visible signs of DR. The image is clearly visualised as we can see the retinal
vessels within 1 disk diameter of the centre of both disc and fovea.
1.3.2 R1 classification
The next stage in disease progression is a R1 classification. This is not too serious,
however there is some noticeable pericytic loss in the blood vessels, perhaps a few

14
small microaneurisms (circled in yellow in Figure 2) and/or superficial flame
haemorrhages may be visible in the retina. There may also be some exudates where
leakage takes place. The patent is notified about these changes but no further action
will be taken until next year’s screen. Again, as with the R0 classification, there is
little chance of the patients vision being affected over all (see Figure 2 for an example
of the fundus image of a patient with an R1 classification).
Figure 2: An example of an R1 classification. Such an image may contain
background microaneurysm (s) retinal haemorrhage(s) ± any exudate not within
the definition of maculopathy. This image shows a yellow circle around a
microaneurysm in an otherwise ‘quiet’ retina with no other observable signs of
retinopathy.
1.3.3 R2 Classification
R2 Classification is defined by substantial amounts of pericytic damage that lead to
deeper rounder haemorrhages. Axoplasmic flow blockage may form Cotton Wool
Spots (CWS) that result in ischemic areas. Typically this will stimulate a release of
vascular endothelial growth factor hormone (VEGF) in the retina leading to intra
retinal microvascular abnormalities (IRMA). These are tiny new vessels trapped
within the retina (circled in yellow in Figure 3), venous beading and venous loops.

15
Multiple deep, round or blot haemorrhages are also symptomatic of R2. Patients are
refereed for non-urgent referral to the hospital eye department as there is significant
risk to their vision. Patient may already be suffering with some vision loss.
Figure 3: An example of the R2 classification. This figures depicts Pre-
proliferative venous beading, venous loops or reduplication, intra-retinal
microvascular abnormalities (IRMA), multiple deep, round or blot
haemorrhages, and some cotton wool spots seen inside the yellow circles.
Figure 4: This image demonstrates the R3A classification. Proliferative new
vessels on disc (NVD) new vessels elsewhere (NVE) and pre-retinal haemorrhage
(circled in yellow on the right).

16
1.3.4 R3A Classification
A fundus image that is classed as R3A typically contains new vessels at the disc
(NVD) or elsewhere (NVE) triggered by VEGF. These new vessels can proliferate on
the surface of the retina growing towards ischemic areas. This deranged repairing
mechanism is the cause of vitreous and sub-haloid haemorrhages. New vessels are
often supported by a structure of fibrous tissue, these can adhere to parts of the retina
causing significant traction, detaching or distorting of the retina. Patients can become
blind if haemorrhage occurs as a result (circled in yellow in Figure 4).
Figure 5: An example of stable R3S DR. Proliferative features including fibrous
tissue (with no traction) and round laser photocoagulation burns that indicate
previous laser treatment are present. There are no bleeds or other retinal
features that have worsened since discharge from the eye clinic.
1.3.5 R3S Classification
The R3S classification is made if the proliferate features appear stable in comparison
to the previous year’s images (exhibiting no change) with the inclusion of a
photocoagulation grade (P1) (see Figure 5). These patients can stay in surveillance
indefinitely until such time as the referral outcome grader (ROG) adds them back in
to screening. Doing so will prevent the patients from being unnecessarily referred

17
back to the hospital eye service by inexperienced graders unless reactivation of stable
treated retinopathy or referable non diabetic retinopathy is found.
1.3.6 M1 Classification
Finally the M1 Classification indicates maculopathy, pathology associated with the
macula. Maculopathy, is typically as a result of ischemia (no blood circulation) or
oedema (water logging from blood plasma) affecting the macula. Ischemic
maculopathy is impossible to treat because the starved blood cells die. Oedema on the
other hand may respond to treatment. Microaneurysms and haemorrhages overlaying
the macular do not necessarily mean significant leakage is occurring, however if these
features are within one disc diameter of the centre of the fovea with an accompanying
visual acuity (VA) of worse than 6/12 there may be a relationship. This patient would
be referred on for urgent laser treatment.
Figure 6: Shows an example of a retina that would be graded M1. Exudates
(lipids) can be seen within 1 disc diameter (DD) of the centre of the fovea. These
features typically appear as a line towards the centre of the fovea (tracking), or
as a ring (circinate) around the centre of vessel plasma leakage.

18
1.3.7 Other conditions
On occasion, as a result of patients attending their diabetic eye-screening test, other
non-diabetic eye conditions are detected. Some of the conditions may require a
referral to the hospital eye service such as the image of a central retinal vein occlusion
(CRVO) (see Figure 7). Others will be directed to their GP practice, as they may
already be aware of their condition. Although these features may have nothing to do
with diabetic retinopathy, the patient will be referred for a hospital eye service
appointment if this is required.
Figure 7: Image showing a central retinal vein occlusion. Within this image we
can see the optic disc, and many superficial flame shaped haemorrhages (typical
of hypertensive bleeds) radiating from the optic disc out along the nerve fibres
giving the illusion of a flame.
1.4 Benefits of early diagnosis/detection
People with DR whose sight is at risk can be treated, typically with laser or intra-
vitreal drug injections (Meads and Hyde, 2003). Because the effects of diabetes on
the eye are generally asymptomatic, many people with diabetes are not aware of any

19
changes. If left unmanaged DR can drastically affect their vision possibly leading to
blindness. The vast majority of patients in countries will poorly established
screening programmes that develop DR have no symptoms until the late stages when
it affects their central vision, by which time it may be too late for effective
preventive treatment.
DR screening is designed to detect early (asymptomatic) sight threatening
changes to optimize the timing of preventive treatment. A reduction by one-third or
more in new blindness due to diabetes was adopted as one of the key five-year
targets in the St Vincent declaration in 1990 (Diabetes Care and Research in Europe:
The Saint Vincent Declaration, 1990) which declares that “annual eye examinations
are recommended for patients with diabetes (and every other year for persons with
excellent glycemic control and no retinopathy at the previous examination in certain
contexts)”.
Members of this consortium have led the transition to biennial screening for
diabetic patients without retinopathy and this is now recommended by the
International Council for Ophthalmology (Chakrabarti et al, 2012). However the DR
screening programme in the UK still screens all diabetic patients annually.
Regular screening of diabetic patients for sight threatening retinopathy (STR)
could optimise the timing of laser treatment. Making sure that patients are treated at
an optimal stage of the disease can improve the sight preservation to about 75%. In
Iceland diabetic blindness prevalence decreased 4-5 fold after the advent of
systematic diabetic eye screening and similar success has been seen in Denmark
Diabetes care (Stefánsson et al, 2000).
20
Saddine et al (2008) forecast that the number of people with DR in the US will
increase 3 fold from 2005 to 2020 further illustrating the importance for establishing
a diabetic retinal screening programme in the US. In the United Arab Emirates
(UAE) the true potential burden of visual impairment is only just being realised. In
the US nearly 8.1 million people have undiagnosed diabetes (American Diabetes
Association, 2014). In the UK it is thought to be 1 in 70 (Diabetes.org.uk, 2014). In
the UAE there are 745,940 diabetics (International Diabetes Federation, 2014) and it
is estimated in approximately 304,000 of these cases the condition has not yet been
diagnosed. There are in addition an estimated 934,300 people with impaired glucose
tolerance, a pre-diabetic state of hyperglycaemia, or elevated levels of blood sugar
(International Diabetes Federation, 2014).
In comparison to the UAE the healthcare system in the US is becoming more
inclusive of screening for DR. Approximately 1 in 29 Americans 40 years and older
has DR of any severity, and 1 in 132 people have vision threatening DR (Congdon
N, and the Eye Disease Prevalence Research Group, 2004). One third of patients
with vision threatening retinopathy will progress to legal blindness within 3 years if
there is no intervention, however with timely intervention this figure could be
reduced to one-tenth. These figures could be improved even further with new
diagnostic technologies such as OCT and treatment options such as Vascular
Endothelial Growth Factor (VEGF) blocking drugs and steroid treatments. These
treatments are dependant on availability as there is a considerable cost to treating
patients with an ongoing treatment plan. These data suggest the need for general
population based screening for diabetes and diabetic retinopathy. The detection and
treatment of diabetic eye disease in both the United States and Scandinavia is not

21
only cost effective, but is actually cost saving from a governmental perspective.
Approximately 350 million people have diabetes and diabetic retinopathy is one
of the fastest growing reason for blindness, the other main reasons for blindess in
western countries are age-related macular degeneration (AMD), glaucoma,
retinopathy of prematurity (ROP) and in developing countries also cataract and
trachoma. All these diseases can be screened and treated at their early stages (Danaei
et al, 2011).
Comparably based on population sizes estimated savings in the United States
could exceed 600 million USD annually, illustrating not only a reduction in vision
loss but additional financial return on public funding. As mentioned earlier there are
potentially many different effective ways of further improving on vision loss with
drug interventions however these are not without cost. A comparison of early and
deferred laser treatment with no treatment has proven that treatment for macular
oedema with laser alone is extremely cost effective, based on 3-year outcomes
(Ferris, 1991). Laser treatment has been shown to provide a gain of 0.236 in
a quality-adjusted life year (QALY), a measure of disease burden that includes both
the quality and the quantity of life lived (Mitchell et at, 2012). Such a gain was
considered highly cost-effective relative to no treatment, and further cost saving can
be found when it is used in combination with Vascular Endothelial Growth Factor
(VEGF) blocking treatments such as ranibizumab (Mitchell et al 2012).
VEGF drugs themselves have also proven to be cost-effective. For example the
RESTORE study data predicts a 0.26 QALY gain and an incremental cost-
effectiveness ratio (ICER) of £10,412 for ranibizumab monotherapy relative to laser

22
therapy (Mitchell et al, 2012). In addition the cost-effectiveness is higher if the
profile of patients being treated is younger, but this is dependant on the ability of a
screening system being able to illustrate and refer the patient in a timely manner.
Software not only needs to be able to capture the retinal image of a patient but
an assessor must be able to correctly identify and refer a condition. The detection of
retinopathy is also somewhat dependant on the skills of the individual grader. The
sensitivity and specificity of a grader is largely down to experience and systematic
adherence to strict protocols. Automated grading of patients is not well established in
developed countries. Even in programmes where automatic screening takes place the
main use of such systems is to detect any disease verses no disease rather than to
grade each case specifically.
An experienced grader is needed to make a final clinical judgement and so there
will always be some degree of human grading used in screening programmes. Thus a
grading support system is of more practical use than a fully automated screening
service. The clarity of the retinal image is always of paramount importance as many
diabetic patients suffer from cataracts, not only a natural manifestation of age, but
also because of the early manifestation of cataracts in the diabetic population.
Images must not only clearly show the retinal vessels but also give an indication
as to the various stages of retinopathy in order to channel patients to the correct
referral pathways (see section 1.7). The more advanced the screening software the
greater the chance of keeping the patient in an appropriate grading and treatment
pathway. In the English diabetic eye screening programmes a large number of non-
DR referable conditions are often detected, including wet age related macular
23
degeneration, optic disc cupping, vein and artery occlusions, detached retina, to
name a few of the more urgent referable findings. In well-established DES
Programmes, 50% of the urgent referrals have been for non-DR conditions.
Regular screening for both diabetes mellitus and diabetic eye disease should be
the gold standard in preventing diabetic blindness globally. In the community of
Laxa, County of Orebro, Sweden, such screening has been carried out since 1983.
With the systematic screening of the population for diabetes and diabetic
retinopathy, the loss of vision due to diabetic retinopathy is uncommon after 10
years (Olafsdottir and Stefansson, 2007). Zoega et al (2005) showed that there was
also a significant relationship between screening compliance and visual outcome in
diabetes patients in the Icelandic screening programme.
Loss of vision is catastrophic to any age group, particularly so in the working age
group as it has personal, family and societal consequences. Studies have shown that
early detection combined with appropriate treatment and management can prevent
visual loss in up to 95% of these cases (Cheung and Wong, 2012). Diabetic
retinopathy fulfils the WHO criteria for screening in that it evolves through key
recognizable stages in the progression of blindness, represents an important public
health problem, has a valid and acceptable screening tool of photographic screening
and visual impairment can be slowed by effective and timely treatment (Andermann
et al, 2008).
Visual impairment due to diabetic retinopathy does not become symptomatic
until maculopathy or advanced proliferative disease occurs. So an effective annual
screening programme would be expected to identify treatable retinopathy at a

24
preventable stage. The St Vincent declaration set out a target of reduction in new
blindness due to DR by a third. The first service objective of the National Diabetic
Retinopathy Screening Programmes in England and Wales was to achieve a
reduction in blindness due to DR in the UK within 5 years by a minimum of 10 %
with an achievable target of 40 % (Scanlon and Garvican, 2003). A near-
comprehensive population coverage over 10 years have resulted in a decline in
visual impairment due to diabetes (Gordon-Bennett, 2008) and DR is now as earlier
mentioned no longer the commonest cause of blindness in the working age-group
(Liew et al, 2014). Indeed, a recent survey in Cambridgeshire showed that DR is the
fifth cause of visual impairment in persons of working age (16–64 years). Diabetic
retinopathy is also a hallmark of other microvascular and macrovascular
complications of diabetes. So screening for DR will enable timely monitoring and
treatment of other diabetes induced morbidity.
1.5 Recent advances in diabetic retinal screening
The first diabetic retinal screening service in the UK was established in Cardiff. It
was based on a basic opthalmoscopic examination and was not improved upon until
after a two-year study in Newcastle which trialled a non-mydriatic polaroid camera
mounted in a mobile screening van. This van was driven to various locations to
screen patients in the community (Taylor and Batey, 2007). One major finding of
this study was that 1 in 20 patients could not be adequately photographed unless
Tropicamide was used to dilate the patients pupils. This finding led to Tropicamide
being used to achieve adequate dilation for retinal screening in England ever since.
The main finding of the study was that the photographic evaluation of Polaroid
images was much better at detecting DR than that of ophthalmoscopy. This research

25
paved the way for the use of modern digital cameras as a means of screening for
retinopathy. The findings from this study empowered the British Diabetic Association
to attract charitable funding for ten more mobile screening units to cover other parts
of the UK. In September 1994 the mobile screening vans had screened over 64,000
patients, 22 % of whom received laser treatment as a result. Diabetic eye screening
services (DES) have often been set up under a very tight budget with a very manual
involvement from the staff. A simple grading pathway was often used and most
software at the time was in its infancy.
Inevitably there are limitations to screening for diabetic retinopathy. Even the best
programs will miss some cases of STDR. In 1984 at a Diabetes UK meeting standards
were set out for a systematic screening program. These are often referred to as the
‘Exeter standards’, and have been widely accepted as standards for retinal screening
and are featured in the NHS Diabetic Eye Screening Programme (DESP) guidelines
(Curriculum.rcophth.ac.uk, 2014).
The Exeter standards cover different aspects of the screening methodology
such as the sensitivity – the ability to detect pathology, and specificity - a measure of
a test's effectiveness. The Exeter standards were based on a meta-analysis of the
ability to effectively detect DR by different screening techniques, and various
methods were gauged including ophthalmoscopy and digital photography throughout
the 80s, 90s, and early 2000s against the ‘gold standard’ of a seven field stereo 35
photography and slit lamp biomicroscopy. This analysis found that overall only slit
lamp biomicroscopy and digital photography achieved near 80% sensitivity and 95%
specificity.

26
Digital fundus photography has become the preferred method for screening for
DR. For best results mydriasis and two-field photography is generally recommended.
Mydriasis reduces the technical failure rate from 27.1% to 8.3% using a single field
and from 28.2% to 8.9% using two fields (Ding et al., 2012). Two-field strategy
increases sensitivity from 75.6% to 87.8% without mydriasis and from 73.2% to
90.2% with mydriasis (Ding et al., 2012).
1.6 Photography
In England and Wales patients are required to have 4 images taken (in Scotland only a
macular image of each eye is taken). The standard order of image capture is right
macular, right nasal, left macular and then left nasal.
Figure 8: This image shows the four images mandated by the English National
Screening Programme for Diabetic Retinopathy (ENSPDR). In the majority of
healthy patients these four images should be obtainable.
For each image the patient fixates on a target to minimise eye movements and to
ensure that each image meets the national standard. Images can vary in quality due to
Right Macular view Left Macular view
Right Nasal view Left Nasal view

27
the final size of the pupil after dilation (in Scotland no dilation is used), the colour of
the retinal pigmentation, any forms of media opacity and/or any artefacts. A Retinal
screener should if possible capture two nominal forty-five degree fields for each eye,
one centred on the fovea and one centred on the optic disc (Figure 8).
The quality of images taken at the time of screening is affected by a number of
variables, on the patient side age, mental health, physical health and willingness to
cooperate are some variables which can adversely affect screening outcomes. On the
side of the screener fatigue, stress, level of training and job satisfaction can play a
role. Training staff and in particular a screeners awareness of what constitutes an
acceptable/assessable image is vital to attaining a gradable set of images as eyelashes,
and mobility can directly affect the validity of the screening encounter.
Figure 9: Showing the definition of the macular. The Measurement Tool used by
Health Intelligence’s Spectra software is designed to allow graders to visually
compare distance based on the diameter of the optic disc. The tool will display
two circles centred at the fovea allowing the user to accurately see clinical
features within 1 disc diameter of the fovea and artefacts in the macular

28
Other considerations such as the software (see Figure 9), lighting of the rooms in
which photography is performed, lighting in the room where grading is performed,
colour gamut of monitors, types, sizes and resolution of displays, white balance
settings on the camera, ISO speed settings, camera back types, lens barrel or pin-
cushioning distortion, anti-aliasing filters on the camera chip, chip type such as
CMOS vs. CCD and human judgment are just a few of the variables which will affect
the ability of the grader to correctly identify referable features. The need for image
clarity is paramount to achieving a gradable image on the NHS DESP guidance. If an
image can be graded the outcome will determine the next stage for the patient,
however if the image cannot be made clear then this will result in an onwards referral
for a slit lamp bi-microscopy.
1.7 Grading Pathway & Outcomes
The English National Screening Programme for Diabetic Retinopathy (ENSPDR) set
out standards for grading DR. Many screening programmes follow pathway 2 which
was set out for non-Optometry based screening (see Figure 10). Pathway 2 involves
the following approach:
Stage 1 First full disease grade (FFDG): A grader accredited to do so, carries
out a full disease grade on all image sets. Urgent referrals (R3) are immediately
passed to the grading center for assessment by a Referral Outcome Grader (ROG).
Stage 2 Second full disease grade (SFDG): A different grader will assess a
random 10% of the no disease image sets and carry out a second full grade on all the
disease image sets from the stage 1 grade. The Second Full Disease Grader does not
see the result of the First Full Disease Grader prior to grading. Again urgent referrals

29
(R3) are passed to the grading centre for immediate assessment by a Referral
Outcome Grader (ROG).
Arbitration: If there is a difference of opinion about referral (sometimes
referred to as a difference in outcome) between the two graders (FFDG and SFDG)
then those image sets are referred onwards for an arbitration grade by a suitably
accredited and experienced professional who will decide whether or not the patient
should be referred to the hospital eye service (HES) or remain in the screening
programme. Once again urgent referrals (R3) are passed to the grading centre for
immediate assessment by a Referral Outcome Grader (ROG).
Figure 10: Showing the ‘Common pathway’. Detailing the flow of patients
thruough screening to referal and re-invitation.
Annual
Screening
Hospital
Eye Service
Non DR - Follow
Local protocol/Refer
back to GP
R3S
Unassessable
Non-DR
R0M0
R1M0
Slit Lamp
Biomicroscopy
Surveillance
Digital
Surveillance
R2,M1
R3A
Secondary Grader
Disagreed other than R3A,R3S,U (Unassessable)
Referral Outcome Grader (ROG)
May combine Arbitration grader function.
R2, M1
+ 10% R0M0 IQA
Grader
Agreed
R0M0
R1M0
30
The purpose of the referral outcome grader (ROG) is to control the type of
referrals (either DR or Non-DR) that are referred to the HES. Typically this will be
carried out by the most experienced graders under the control of the programme
clinical lead, or the ophthalmologist in charge of the HES that the patient is being
referred to. The ideal set up is for the ROG grader to have full access to the patient’s
clinical data however this is not always the case, unless the clinician has the time and
access to the relevant data.
It is hoped that this type of screening pathway will allow screening
programmes to better manage the inevitable ever increasing cost and workload they
face. It is also worth noting that fatigue is a very real problem, with staff assuming
that they are doing a good job while they can often be fatigued and miss pathology.
Experienced grading staff should ideally grade no more than 80 cases a day in order
to prevent fatigue and ensure that they are spending long enough on each case. It may
well be that computer aided diagnosis can help in this regard.
1.8 Portable hand held retinal cameras
The recent development of lightweight portable cameras has driven innovation,
allowing better retinal access to neurologists and paediatricians for monitoring of
optic nerve swelling post neurosurgery, bed bound patients, and retinopathy of
prematurity (ROP) screening for babies (see Figure 11). Probably the most exciting
aspect of these cameras is the lower costs for the use in developing countries where
telemedicine is essential to cover the vast geographical and socioeconomic challenges
that hinder health care coverage.

31
Figure 11: Optomed Smart Scope Pro portable retinal camera . This clinician is
taking an image of a childs eye with an optomed Smart Scope Pro portable
retinal camera, this camera is one of the first which has been approved by the
European Community (CE) and Fedral Drugs Administration (FDA).
1.9 Online Databases for testing algorithms for automated screening
purposes
There are many online databases associated with common eye conditions such as
glaucoma, diabetic retinopathy and age-related macular degeneration. Generally the
aim of such databases are to provide good examples of retinal images for research and
training purposes. In particular this allows researchers to develop and compare
different automated methods. Here we explore a few examples of currently available
databases. These can all be found online and access to them is generally free for
research purposes.
1.9.1 DRIVE database
Digital Retinal Images for Vessel Extraction (DRIVE) is a publicly available database
(Staal et al., 2004; Isi.uu.nl,2014) consisting of forty colour fundus photographs has
been used extensively to test many different automatic vessel extraction algorithms.
The photographs were taken from a Diabetic Eye Screening Program (DESP) in the
Netherlands. These images were chosen randomly from the retinal images of 453
subjects between 31 and 86 years of age. Each image has been JPEG compressed,

32
which is common practice in screening programs (see Figure 12). Seven of the forty
images contain pathologies, such as exudates, haemorrhages and pigment epithelium
changes. The forty images are divided into a test and training set each containing 20
images. Two qualified graders manually traced the retinal vasculature in these images
to produce a mask of the retinal vasculature. In doing so the researchers manually
segmented the retinal vessels from the underlying tissue. This process of
segmentation, or extracting the pattern of blood vessels from the retinal tissue, is a
task that numerous research groups have tried to automate as it is a laborious and
time-consuming procedure.
Figure 12: Two example images from the DRIVE database. Image (a) shows a
nasal view, (b) retina showing diabetic maculopathy. The images were taken with
a Canon CR5 non-mydriatic 3-CCD camera with a 45 degree field of view
(FOV). Each image is captured using 8 bits per colour plane at 768 × 584 pixels.
The masked images have a resolution diameter of approximately 540 pixels.
1.9.2 STARE database
The STARE database (Hoover et al, 2000; Ces.clemson.edu, 2014) contains twenty
digitized slides captured by a TopCon TRV-50 fundus camera taken at 35 degree field
of view (see Figure 13). Ten of these contain DR pathology. All images were
digitized to 605 × 700 pixels, 8 bits per colour channel. The approximate visible FOV
is 650 × 500 pixels. Two image readers manually segmented all the images. The first

33
reader segmented 10.4% of pixels as vessels while the second segmented 14.9% of
the pixels as vessls. The second observer segmented many more of the thinner vessels
than the first one leading to this variation.
Figure 13: Two example 35 degree images from the STARE database: (a) healthy
retina positions to show the optic disc in the nasal view, (b) pathological retina
showing exudates in referable diabetic maculopathy.
1.9.3 ARIA online database
The ARIA online database was created in 2006 (Farnell et al, 2008; Aria-
database.com, 2014), in a collaboration between St. Paul’s Eye Unit, Royal Liverpool
University Hospital Trust, Liverpool, UK and the Department of Ophthalmology,
Clinical Sciences, University of Liverpool, Liverpool, UK. The images were captured
with a Zeiss FF450+ fundus camera at a 50 deg FOV and stored as uncompressed
TIFF files.
Figure 14: These two control images taken from the ARIA online database, both
have a resolution of 768 × 576 pixels in RGB with 8-bits per colour plane. The
images show no referable pathology

34
This database is divided into three distinct groups: the first has 92 images with age-
related macular degeneration, the second has 59 images with diabetes, and the third is
a control group of 61 images (see Figure 14). The blood vessels, the optic disc and
fovea locations were marked in each image by two image readers as a reference
standard.
Figure 15: An example from the VICAVR database. Veins (marked in blue and
white) and arteries (marked in red) are measured to compare vein to artery
ratios.
1.9.4 VICAVR database
The VICAVR database consists of 58 images used for the computation of the A/V
ratio (Ortega Hortas and Penas Centeno, 2010). The images have been captured on
with a TopCon NW-100 model non mydriatic camera. All images are optic disc
cantered with a resolution of 768 × 584 pixels (see Figure 15). The calibre of the
vessels are measured at different radii from the optic disc and marked as artery or vein
by three readers.
1.9.5 Messidor database
The Messidor database is the largest database with 1200 retinal images currently
available on the internet (Agurto et al, 2010; Messidor.crhan.fr,2014). Three different
ophthalmology departments were used to harvest images using a non-mydriatic 3CCD

35
camera fitted to a Topcon TRC NW6 at 45 degrees FOV. These were captured at a
resolution of 1440 × 960, 2240 × 1488 or 2304 × 1536 pixels. All images are stored
in TIFF format (see Figure16). 800 of these images were captured with pupil dilation.
The reference standard provided with each image contains a diabetic retinal screening
stage of progression of disease and the risk of macular oedema in each image.
Figure 16: Images taken from the Messidor database, the image on the left shows
circinate rings of exudate with a registration mark (blue dot) highlighting the
centre optic disc. The image on the right is the same image, however this time all
exudates and haemorrhages have been marked to show progression.
Figure 17: The left image shows an image of diabetic maculopathy from the
ImageRet database. The images on the right highlights areas of patholgy marked
by human graders, Image A showes hard exudates, B showes soft exudates, C
shows soft exudates and D showes Heamorrhgaes. This type of image database is
used) to test automated retinal grading software

36
1.9.6 ImageRet database
Made publicly available in 2008 the ImageRet database is subdivided into two sub-
databases, DIARETDB0 and DIARETDB1 (Valverde et, al., 2010; it.lut.fi, 2014).
The images were acquired with a reported 50 degree FOV using an unknown fundus
camera with unknown settings at a size of 1500 × 1152 pixels in PNG format.
DIARETDB0 contains 130 retinal images of which 20 were determined to be normal
and 110 contain various signs of diabetic retinopathy (see Figure 17). DIARETDB1
contains 89 images, 5 images are of a healthy retina, 84 other images are reported to
have some signs of mild proliferative diabetic retinopathy. The images were marked
by four graders for the presence of microaneurysms, haemorrhages, and hard and soft
exudates.
Figure 18: An image from the REVIEW database. This image shows a retinal
image where the retinal blood vessels have been traced manually by human
graders. This manual ‘segmentation’ reference allows for automated algorithms
to be compared to the human segmentations.
1.9.7 REVIEW image set
The Retinal Vessel Image set for Estimation of Widths (REVIEW) database was
made available online in 2008 by the University of Lincoln (Bashir et al, 2008).
Sixteen mydriatic images with 193 annotated vessel segments consisting of 5066
profile points that were manually marked by three independent readers. Sixteen of the

37
images were subdivided into four sets, a high resolution image set (HRIS, 8 images),
a vascular disease image set (VDIS, 4 images), a central light reflex image set
(CLRIS, 2 images) and the kickpoint image set (KPIS, 2 images) (see Figure 18).
1.9.8 ROC database
Developed by the University of Iowa in 2009, the ROC microaneurysm dataset is a
multi-year online database of microaneurysms (Niemeijer et al, 2010). 100 digital
colour fundus photographs containing microaneurysms is divided in to two sets of 50
images test and non-test images. A reference standard indicating the location of the
microaneurysms is provided with the training set (see Figure 19). The images were
captured using a TopCon NW100 and a Canon CR5-45NM camera at 45 degree FOV
and JPEG compressed. There are three different image sizes present in the database;
768 × 576, 1058 × 1061 and 1389 × 1383 pixels.
Figure 19 : An example retinal image from the ROC database. The righthand
panel displays the boxed region of interest of the fundus image in the left panel.
It is displayed in ‘red free’ mode with arrows pointing to microaneurysms.

38
1.9.9 The need for a realistic database
Considering the current databases available there still remains a need for a database
that is more representative of the range of images collected in current DR screening
programs. For example, the DRIVE database contains images that are comparable to
screening services over a decade old. STARE uses scanned film images. For at least
the last 10 years screening services in the UK have had to conform to certain types of
camera, that have been approved by the national screening programme, together with
suggested image resolutions and white balance settings. No two camera manufactures
will use precisely the same optical pathway so variations will exist even within a
single screening programme (Figure 20).
Even if images are restricted to the same camera and operator they still may
show huge variations because of different settings, media opacities and even pupil
diameters. We see this in screening services that have been in operation for many
years. In Figure 20 we see two images of the same patient taken 2 years apart with
different camera types. Although subtle the differences in camera type can change
significant factors such as vessel calibre and bifurcation angles, this should be
considered when automated systems are looking for specific features.
Figure 20: An example showing differences of white balance, exposure and
barrel distortion. These images from the same patient images on 2 different
cameras. A Topcon NW8 on the left and a Canon CGi on the right.

39
It is worth considering that a standard 100 ISO film image can hold up to the
equivalent of 20 megapixels of information (Langford, 2000). The current range of
cameras approved by the national screening programme still do not match the spatial
resolution, dynamic range, or noise levels of the 35mm analogue 7 field stereo film
photography such as that used in the UK Prospective Diabetes Study (1991).
All cameras currently used in retinal screening in England and Wales have
been tested in accordance with the National Diabetic Eye Screening Programme
guidance. Even though some discrepancies still exist between camera types there has
been a movement towards standardisation from an operation point of view. With this
in mind any image database specifically concerned with diabetic retinopathy should
include cameras set up in line with the latest standards but also show the variation
between camera types - ideally with a series of images from the same patient over
time.
1.10 Current limitations with digital fundus images
The International Standards Organization (ISO) has a standardized scale for
measuring the sensitivity of film to light. These standards have traditionally been used
with film based fundus cameras. Screeners take images on a fundus camera where the
exposure settings have been predetermined by software and the only variables the
screener have are the possible small pupil settings or the flash level of the fundus
camera. As camera technology has advanced, the ISO sensitivity settings have been
changed, for example from 200 ISO to 400 ISO, so that the flash causes less
discomfort for patients and in turn leads to a brighter image. The correct setting for
use in Diabetic Eye Screening (DES) are published on the ENSPDR website. At a low
ISO number a digital camera produces smoother and more detailed images than when

40
it is set to a high ISO, so the trade-off is that typically the flash will need to be high to
achieve the right exposure for a higher resolution.
As mentioned the ISO standards followed are typically dictated by the image
capture software of the fundus camera. These parameters are configurable for each
individual patient, although typically they are seldom checked for consistency in eye
screening programmes and may have been altered by the screener at the request of a
patient for a less bright flash. Arguments for using a digital SLR camera typically
outweigh those for film cameras, generally due to cost and convenience. However
film is still very sensitive and can outperform that of current digital SLR cameras.
Estimates of the resolution of a photograph taken with a 35mm film camera vary as
more information may be recorded if fine-grain film is used in combination with a
specialty film-developer. Conversely less resolution may be recorded with poor
quality optics or with coarse-grained film (see Figure 21 for a comparison between
digital and analogue film).
However the use of film in retinal screening would be problematic and
scanning transparencies can also be problematic because of the film's tendency to
scan with a blue colour cast. Some software producers deliver special colour profiles
with their software to avoid this (Reuters, 2014).
The problem of dynamic range has been acknowledged by a number of digital
single lens reflex (DSLR) manufacturers so for example some cameras have an
automatic exposure bracketing mode that is used in conjunction with high dynamic
range imaging software. Some sensors like the Fujifilm Super CCD combines sensors
of different sizes to give increased dynamic range while other manufacturers use in-

41
camera software to prevent highlight overexposure such as the D-Lighting feature
from Nikon.
Figure 21: Showing the spatial resolution of film in units equivalent to digital
camera megapixels. "Better" refers to spatial resolution only, the grey band is
where the spatial resolution of film and digital are similar (adapted from
Clarkvision.com, 2014).
It is worth noting that the sensitivity of the retinal screening programme is
solely dependent on the ability of a screener to be able to see pathology in the image
of the retina. Unlike pilots and police drivers there is no official guidance specifying
regular vision check-ups for a retinal screener, no minimum standard, and no checks
take place on the graders ability to visualise images or tests for colour vision defects.
In today’s diabetic eye screening environment it would be ideal for a computer to
grade automatically 24 hours a day 7 days a week with high sensitivity and
specificity. However the current recommendation is that a trained and accredited
grader should be used until the automatic detection software has developed further
and it is capable of identifying securely a good range of clinically significant data.

42
Figure 22 below is a stark reminder to how much a missed sight threatening pathology
can affect a patient and also the effect to a screening programme if a patient was to
successfully pursue a claim of clinical malpractice. For a private company to even
consider fully automated retinal screening as an option in place of a team of graders
the evidence would need to be compelling.
Injuries Affecting Senses
Total Blindness £155,250 to £500,000
Loss of Sight in One Eye with Reduced
Vision in the Remaining Eye
£37,150 to £104,500
Total Loss of One Eye £32,000 to £38,175
Complete Loss of Sight in One Eye £28,750 to £32,000
Cases of serious but incomplete loss of vision
in one eye without significant risk of loss or
reduction of vision in the remaining eye, or
where there is constant double vision
£13,750 to £22,650
Minor but permanent impairment of vision in
one eye, including cases where there is some
double vision, which may not be constant
£7,375 to £12,200
Figure 22: Estimated costs of clinical malpractice resulting from misdiagnosis
(trinitylaw.co.uk, 2015)

43
In 2002 twin boys won £1m in damages after a hospital failed to spot
retinopathy of prematurity at birth (News.bbc.co.uk,2002), and clear viewing of the
retina is essential in determining sight threatening pathology. Subtle discrepancies in
image clarity can greatly affect the outcome when trying to visualise the retina. For
example the lighting at the retinal screening location may affect the ability of the
screener to detect pathology (florescent versus incandescent ambient lighting). These
varying light conditions mean that the screener’s eyes may be affected and light
adaptation may effect colour and luminosity perception.
Figure 23: Effects of image manipulation. A) Displays an original image,
alongside examples of the kinds of inappropriate manipulation that are common
with inexperienced screeners. B) displays the same image with typical over
enhancement. C) displays a red free filter image which increases the contrast of
the original image but distorts the image. D) displays the original image of a
self-sclerosed microaneurysm. E) displays a typical over manipulation of the
image (D) that makes feature look like an exudate, and F) shows the correct
amount and type of manipulation that exhibits a subtle grey representation true
to the real likeness of the pathology.
The clarity and assessibility of an image is rather subjective and national standards
statements such as ‘fine vessels on the disc’ can be misinterpreted by different

44
screeners. Even where groups of specialists form expert panels there is often high
levels of variability in interpretation. One common reason for poor images is merely
that the flash settings were set too low for the photography to show the retina in any
clarity. This may highlight issues within the fundus camera such as a weakening
capacitor or incorrect base level flash setting which needs changing in the engineer’s
flash setting menu.
Current methods used in retinal screening to enhance images involve the use
of brightness and contrast. However the over use of these controls can often make
features disappear by posterization ‘blowing out’ detail. This can be seen in Figure 23
where distortion can transform a normal vessel (Figure 23(A)) to appear as pathology
such as intra retinal microvascular abnormalities (IRMA) and therefore lead to false
positive results (Figure 23(B)). This phenomenon has also been noticed by DESP.
New guidance that came into effect in April 2013 which states that unless IRMA is
spotted in the colour image it should not be graded as being present.
Figure 24: Image showing colour distortions. (A)The image on the left shows an
original unenhanced image of the optic disc, the image on the right (B) shows the
distortions that occur at the disc when brightness and contrast is applied to the
original image.

45
Figure 25: Retinal images showing a microaneurysm. A microaneurysm
(marked by an oval) is present in A and C (the original image). B is result of
imaging the same location but under exposing the retina and D has started to
become posterised as the brightness and contrast has been applied solely to
enhance the image to the point where the microaneurysm is visible .
The optic disc often displays a large difference in luminance from the background
tissue and is commonly affected by manipulation. In addition this area can harbour
new vessels in diabetic patients, peripapillary membranes in high myopic patients,
glaucomatous changes and indications of potentially life threatening raised intra-
cranial pressure. So correct exposure and visualisation is essential when viewing
retinal images, as all of these optic disc features can be masked when achieving
correct brightness levels post manipulation
2 years previously slightly under exposed
Brightness and contrast correction to achieve correct exposure to see microaneurysm
Correct exposure = features more visible.
No adjustment to brightness and contrast needed

46
1.11 Gauging assessablity of retinal images
As mentioned previously in English screening programs, a screener should capture
two nominally forty-five degree fields for each eye, one centred on the fovea and one
centred on the optic disc. Extra images may be required, for example when there is
noticeable media opacity such as a cataract, as an anterior image may be useful in
illustrating the reason for a blurred image and rule out suspicions of the image merely
being taken out of focus or even worse that there may be a vitreous haemorrhage so
dense that little or no light is passing through. There may also be a feature on the
anterior of the eye such a Pterygium. The National screening committee (NSC)
guidance state that failure to meet definition of adequate results in an ungradable
image. This is unless referable diabetic retinopathy (R2, R3, M1, unstable treated
proliferative diabetic retinopathy) is visible anywhere in the images. The NSC
guidance also states that in some unusual cases such as patients with a large disc an
image may fall within both good and adequate categories and in such cases the image
should be classified as good.
For some diabetic patients, digital retinal photography does not generate
retinal images deemed to be ‘adequate’ by retinal graders. Images that are
unassessable for retinal grading can be unassessable for a number of reasons.
A significant proportion of ungradable images are a result of cataracts or
opacity caused as a result of cataract surgery (see Figure 26). Cataracts are more
common in diabetic patients and the process can somewhat be accelerated because of
the way that the sorbital-aldose reductase pathway effects the metabolization of
sorbital. In addition the fundus can vary in colour due to differences in the retinal
pigmented epithelium between individuals. For example the retina may appear green

47
2006 2007
2008 2009
2010
or brown in Asian and Afro-Caribbean eyes. This difference in coloration coupled
with a media opacity can hinder a graders ability to detect retinal pathology as the
images may appear blurred or murky.
Figure 26: Showing the progression of cataract in a diabetic patient taken over a
5 year period (2006-10). This clearly demonstrates the progressive deterioration
in the quality of images as a cataract develops. In 2010 the patient had cateract
surgery and the quality of the retinal image increases significantly.
Retinal graders are continuously monitored for quality and reliability via a monthly
online quality assurance exam. Graders are recommended to take these at least 6 times

48
a year to demonstrate competency. However there is no option to grade an image as
being unassessable on these monthly tests. So staff vary greatly in their perception of
what is assessable. The burden on graders to examine degraded images would be
greatly reduced by the introduction of a software tool that automatically rated the
assesability of an image and indicated when images may be deemed unassessable (or
indadequate).
Figure 27: Example images from the Scottish grading scheme. A) displays a red
free image with a clear view of the retina. The center of the fovea is greater than
two disk diamters from the edge and vessels are clearly visible within one disk
diameter of the fovea. B) displays a retinal image with moderate media opacity
while C) shows a fundus image from a patient with a dense cataract. D) shows all
the vessels visible within 1 DD of the centre of the fovea from (A). E) shows a
moderate view of the vessels within 1DD of (B) and finally F) shows virtually no
details of retinal vessles can be made out within 1DD of the fovea of the patient
with the cataract.
Sometimes it can be difficult for a grader to be able to accurately gauge the
difference between a gradable and ungradable image as it typically depends on the
graders skill at image manipulation (see Figure 27 for examples from the Scottish
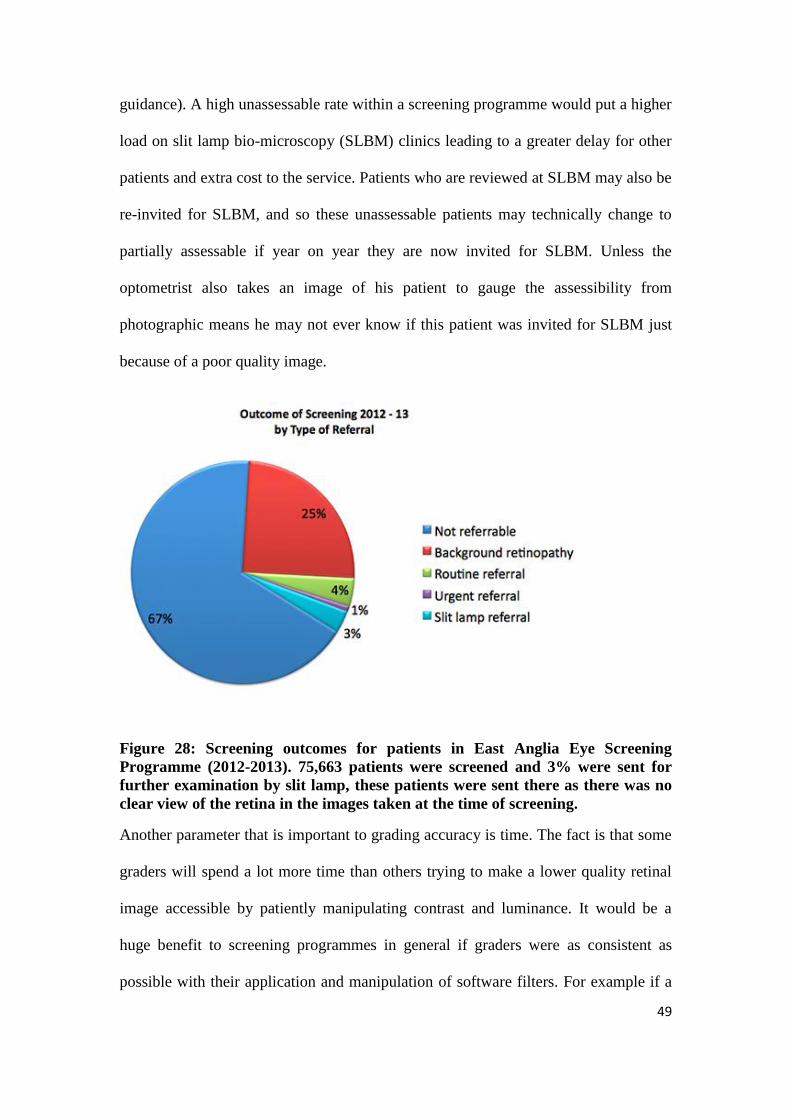
49
guidance). A high unassessable rate within a screening programme would put a higher
load on slit lamp bio-microscopy (SLBM) clinics leading to a greater delay for other
patients and extra cost to the service. Patients who are reviewed at SLBM may also be
re-invited for SLBM, and so these unassessable patients may technically change to
partially assessable if year on year they are now invited for SLBM. Unless the
optometrist also takes an image of his patient to gauge the assessibility from
photographic means he may not ever know if this patient was invited for SLBM just
because of a poor quality image.
Figure 28: Screening outcomes for patients in East Anglia Eye Screening
Programme (2012-2013). 75,663 patients were screened and 3% were sent for
further examination by slit lamp, these patients were sent there as there was no
clear view of the retina in the images taken at the time of screening.
Another parameter that is important to grading accuracy is time. The fact is that some
graders will spend a lot more time than others trying to make a lower quality retinal
image accessible by patiently manipulating contrast and luminance. It would be a
huge benefit to screening programmes in general if graders were as consistent as
possible with their application and manipulation of software filters. For example if a

50
filter was available to staff to standardize manipulation at the press of a button no
doubt there would also be substantial time saving enabling staff to grade more images
while becoming less fatigued. A more regulated method of image analysis may put
less strain on the HES. At multi-disciplinary team meetings nationally over-
manipulation of retinal images is often cited as a cause for concern and staff are often
encouraged not to manipulate image parameters.
1.12 Possible solution: The cataract filter algorithm (Clearvue)
The amount of scattering in a young non pathological eye is low but will increase
with age (e.g. cataract) (Hennelly et al, 2002). This increased scattering will result in a
degradation of the retinal image in terms of reduced brightness, poorer contrast,
colour degradation, and possibly lower spatial resolution. Such a problem is similar to
degradation of images by the atmosphere (see Figure 29).
Figure 29: Images depicting the similarities between pictures taken on a foggy
day and fundus images taken through a media opacity. There are similar
difficulties in making out the features of the branches of the trees and the
branches of retinal arteries and veins. Both images exhibit the same inablity to
see fine details which is caused not by poor focus but by light scatter.
Although a large body of work exist on the enhancement of images recorded in poor
visibility conditions, a paucity of papers have focused on reducing the degradation of
retinal images by intraocular scattering (Peli and Peli, 1989). Image contrast
enhancement can be divided into two main methods, model based and non-model

51
based. Model based algorithms improve image contrast by reversing the underlying
cause of image degradation but requires a large amount of information about the
geometry of the scene and the nature of the scattering. It is difficulty to develop a
realistic yet tractable model of intraocular scattering as many factors can contribute to
the scattering of light in a fundus image. Perhaps the most important non-model based
algorithm is histogram equalization. This algorithm is usually performed on the
luminance and saturation of the image but not the hue so as to maintain the original
colour. However, because intraocular scattering is partly wavelength dependent
(Costello et al, 2007), this method may cause some colour degradation.
Oakley and Bu in 2007 presented a successful non-model based algorithm to
restore the chrominance and luminance of a scene while maintaining good colour
fidelity. In this model, the image (I) recorded by the camera is the sum of the light
reflected by the scene (here the retina (R)) as it would be observed in the absence of
scattering together with the scattered light (S), known in the remote sensing literature
as “airlight”. The airlight value will depend on the distribution and the concentration
of the different scattering particles (e.g. keratocytes in the cornea, proteins aggregates
in the crystalline lens), the distance from the eye to the camera and the angle of
illumination. As a result, the airlight value can vary across the image.
Figure 30: An airborne image degraded by haze. The image on the left is an
example image captured by an airbourne camera which has been degraded by

52
haze. The image on the right demonstrates how the visual haze can be effectively
filtered out to increase visibility (Oakley and Bu, 2007).
This system could be potentially adapted for the purposes of retinal screening. Figure
30 displays an airborne image degraded by atmospheric haze which demonstrates a
large variation in the range from the foreground to the background. This results in a
non-uniform loss of contrast across the image that in many ways mimics the effect of
a media opacity in a retinal image. Figure 30 also displays the output from the
Clearvue algorithm which manages to remove most of the haze from the original
image.
1.13 Overview of the rest of the thesis
As detailed in section 1.9.9 there exists the need for a database of fundus images that
is more representative of the images taken from diabetic patients in current screening
programs. Chapter 2 outlines the efforts to develop such a database. As many diabetic
patients have comorbidities we have grouped our images based on these conditions
and have applied two automatic vessel extraction algorithms to the database (see
Appendix A for a preprint of our manuscript (Holm et al, 2014). As part of this
database development, vessel masks that distinguish the vascular bed from the
surrounding tissue needed to be expertly drawn by hand. As described in chapter 2,
three different semi-automatic methods were trialled by the author and a medical
retina ophthalmologist and the best one employed to help generate the vessel masks.
Each mask, which is associated with a single fundus image, forms part of the database
as the ideal solution to the problem of vessel segmentation.
Following on from the development of the diabetic retinopathy database,
chapter 3 details our initial steps into improving the “assessability” of fundus images
that have previously been deemed inadequate. These preliminary experiments

53
involved various tests of the Clearvue ‘cataract filter’. In particular tests were carried
out that initially involved investigating the effects of the two variables associated with
the cataract filter on the clarity and quality of the processed images. The "dark level"
parameter is used to mitigate the effect/extent of noise in the input image and ranges
from 0 to 2. The level of “smoothness” is set by the second control parameter (the
scale) which ranges from 1-15%. This limits the scale over which the enhancement is
allowed to adapt according to the local image properties. The higher the scale the
‘smoother’ the coverage and the less local the effect of filtering (the broader the
spatial filter).
Once an agreement was reached between the author and a medical retinal
ophthalmologist regarding the best parameters to use a sequence of 100 previously
inadequate images were reprocessed through the cataract filter and re-evaluated by the
author and the medical retinal ophthalmologist. This lead to 12 cases being deemed
adequate for grading with some referable cases being noted. An earlier pilot part of
this study has been published (Russell et al., 2012) and is included in Appendix B.
Finally in chapter 4 the limitations of our initial study are listed and
suggestions are made for future work that may improve performance and areas for
future investigation.

54
Chapter 2: DR HAGIS – A new realistic DR Database
for the Automatic Extraction of Retinal Surface
Vessels
2.1 The need for a realistic DR database
As detailed in Chapter 1 there already exists a number of publically available
databases containing retinal fundus images. Some of these are specifically designed to
test automatic vessel extraction algorithms (Hoover et al., 2000; Staal et al., 2004;
Farnell et al., 2008). However the images in these databases do not accurately
represent the quality, complexity, and resolution that any generic automatic image
analysis system will have to address in a modern day screening programme.
Specifically in all the publically available databases the images are of much lower
resolution than modern digital cameras, are taken in idealized imaging conditions,
with the same camera and operator. While these databases have been particularly
useful in allowing researcher to compare for example automatic vessel extraction
algorithms they do not represent what a modern day grader will typically see. In
addition patients with diabetes often have co-morbidities. To address the lack of a
realistic, publically available, database of fundus images we decided to generate the
DR HAGIS (Diabetic Retinopathy, Hypertension, Age-related macular degeneration
and Glacuoma ImageS) database. The main aim of this chapter is to report on the
development of a new publically available realistic database of DR fundus imgaes (Dr
HAGIS). These fundus images were segmented by hand by the author and used by
collaborators to test two state-of-the-art automatic segmentation algorithms.
2.2 DR HAGIS database
This database consists of thirty-nine high-resolution images provided by Health

55
Intelligence (Sandbach, UK). These were taken from diabetic patients attending a DR
screening programme run by Health Intelligence and were recorded from different DR
screening centers in the UK. All patients gave ethical approval for the use of these
images for medical research. The thirty-nine images were grouped into one of four co-
morbidity subgroups: glaucoma (images 1-10), hypertension (images 11-20), DR
(images 21-30) and AMD (images 31-40). One image was grouped into two
subgroups, as this patient was diagnosed with both AMD and DR (images 24 and 32
are identical). A total of three different non-mydriatic fundus cameras were used to
capture the fundus images: Canon CR DGi (Canon Inc, Tokyo, Japan), Topcon TRC-
NW6s (Topcon Medical Systems, Oakland, NJ), and Topcon TRC-NW8 (Topcon
Medical Systems, Oakland, NJ). All fundus images have a horizontal FOV of 45deg .
Depending on the digital camera used, the images have a resolution of 4752x3168
pixels, 3456x2304 pixels, 3216x2136 pixels, 2896x1944 pixels, or 2816x1880 pixels.
2.3 Ground truth images
Ground truth images corresponding to the segmented vessel patterns were generated
using GIMP Image Manipulation software (Gimp.org, 2014). The original images
were first opened in GIMP as Jpeg files. Then transparent layers were overlaid on
each original image to try a number of methods to determine which gives the most
accurate two-bit black and white tracing of the vessels.
The first method tested was to make the image monochromatic, threshold the
histogram level until maximum contrast level had been reached to assist in the
segmentation, any unwanted pixels were erased and then any gaps between the
vessels walls were filled-in. Unfortunately, this method proved to be both time
consuming and inconstant, with too much variably when comparing the transparency

56
layer to original image (Figure 31 displays one example of this approach).
Figure 31: An example of segmentation method one. This figure displays both
the traced image attrained by thresholding a binary version of the original image
and then filling in between blood vessels (left) versus the original image (right).
The traced image was less clear than the original image and as such this was not
a sutable segmentation method
A second method tested was to trace the path of each vessel in sections. Each section
was processed separately and then pieced together to form the final mask. The final
map was manually corrected with the eraser tool, however once again this proved to
be time consuming taking on average three hours to complete a single retinal image
(see Figure 32 for an example of this method).
The final (and most effective) method used was to utilize the line tool to trace
each vessel and to manually increase and decrease the brush size until the vessel
diameter was matched. The brush tool in GIMP displays a target ring that is visible
above the vessel and so gives a visual guide to the caliber of the brush tip. This
method facilitated drawing a much smoother and solid continual line, this technique
proved to be both visually accurate and rapid taking on average 40 minutes per image.
Throughout the process of tracing the drawn layer was turned on and off manually

57
and rapidly to allow for the accurate checking and rechecking of line width, this
technique could be likened to manually flicking between cells in animation to gauge if
any change had taken place. Finally any imperfections were then erased pixel by pixel
with the eraser tool, the end result was a relatively accurate and smooth representation
of the underlying retinal vessels. This technique was then applied to all images.
Figure 32: Showing a manually traced image in sections. In this image seen as
dots (left side of image) which could be manipulated later to change the angle
and then stroked (painted) to desired vessel calibre (right), this method however
proved to be inadiquate for segementation.
Figure 33: Showing an example of the final image tracing tecnique. As seen on
the image on the right, this 2 bit tracing appears smooth and well defined and
was by far the most effective methed to segment retinal images.

58
2.4 Initial retinal vessel segmentation results
We applied two previously published automatic vessel extraction algorithms (Holm
and McLoughlin, 2014) to this new database to generate some initial segmentation
results (see Appendix A for pre-print of our submitted paper). One approach was
based purely on the intensity of the pixels in the fundus image (intensity-based) while
the other is based on the output of oriented Gabor filters (Daugman, 1985) which
preprocessed each fundus image.
The Gabor filter approach roughly follows that of Rangayyan et al. (2007). In
short, for each fundus image in the database a background estimate was subtracted
from the green-channel image. Then twelve differently oriented Gabor filters,
differing in orientation by 15 degrees, were applied to the field of view (FOV). All
pixels outside the FOV were set to zero. Next a segmentation threshold was applied to
the filter responses to generate binary masks of the vasculature. When more than one
scale of Gabor filters was employed the binary masks of the vasculature were
combined together to form a single segmented image. Finally post-processing steps
were used to reduce as much as possible any edge effects of the FOV (see Figure 34
for an example of this approach).
The intensity-based approach was largely based on the vessel extraction
algorithm of Saleh et al. (2011). Basically this approach includes several steps aimed
at reducing the noise and illumination variation across the fundus images, thereby
increasing the contrast of the vasculature. Top hat and bottom hat filters were used to
reduce the effects of uneven contrast within the fundus images. Next the background
illumination was removed by subtracting the output of a large median filtered version
of each image from itself. This reduces variations in the background intensities. Then

59
after Gaussian smoothing, a h-maxima transform was applied to segment the vascular
bed with the threshold defined as in Saleh et al. (2011). Once again post-processing
steps were used to reduce any edge effects of the FOV (see Figure 35 for an example
of this approach).
Figure 34: Example fundus images from the Dr Hagis database with automatic
segmentation using the intensity based approach. (A) This is an image of a
patient suffering from DR. (B) The results of the vessel extraction using the
intensity based approach. Green pixels highlight correctly segmented pixels (true
positives), red pixels show those vessel pixels false segmented as background
(false negatives), blue pixels are the oversegmented (false positives), and black
pixels represent correctly segmented background pixels (true negatives).
The quality of segmentation was determined by the mean percentage of
correctly segmented pixels within the FOV. The FOV is defined by the provided mask
images. Sensitivity is defined as the percentage of vessel pixels within the FOV
segmented as much, and the specificity as the percentage of correctly segmented

60
background pixels (again within the FOV). Finally the accuracy is the percentage of
correctly segmented pixels (whether vessel or background).
Figure 35: Example fundus images from the Dr Hagis database with automatic
segmentation using a two scale gabor filter based approach. (A) The same fundus
image from Figure 34 showing an image of a patient suffering from DR. (B) The
results of the vessel extraction using the two scale Gabor filter approach. Color
coding is indentical to Figure 34.
Table 1 presents the results from both the intensity based and two scale Gabor filter
approaches. Results are presented as mean (± standard deviation). Both the
approaches resulted in similar overall segmentation accuracy (intensity based:
95.83%, 2-scale Gabor filter approach: 95.71%). For the DRIVE database, the degree
of correspondence between two expert observers was 94.73% (Staal et al., 2004). So
if a similar inter-observer accuracy is assumed we can conclude that both approaches
perform as well as an expert human observer in terms of overall segmentation
accuracy.

61
Table 1: Accuracy, Sensitivity and Specificity for the intensity based approach and
Gabor approach.
Intensity Based Approach
Image Accuracy Sensitivity Specificity Image Accuracy Sensitivity Specificity
1 97.03% 66.73% 98.95% 21 95.43% 59.77% 98.95%
2 95.70% 62.32% 98.46% 22 95.69% 61.30% 98.68%
3 95.97% 53.37% 99.34% 23 94.29% 50.10% 98.83%
4 95.54% 53.74% 99.15% 24 95.22% 48.61% 98.36%
5 95.89% 57.50% 98.70% 25 95.90% 52.23% 98.48%
6 96.38% 49.80% 98.68% 26 95.43% 50.12% 98.73%
7 95.53% 46.73% 99.34% 27 94.71% 52.68% 98.31%
8 96.03% 59.40% 98.86% 28 96.45% 58.02% 98.53%
9 96.47% 65.38% 98.89% 29 95.75% 61.06% 98.81%
10 96.18% 59.43% 99.37% 30 95.37% 49.90% 99.51%
11 96.36% 71.45% 98.90% 31 95.06% 59.89% 99.04%
12 97.06% 62.18% 98.65% 32 95.58% 49.42% 99.07%
13 97.26% 56.42% 98.28% 33 95.24% 55.93% 98.51%
14 96.22% 63.41% 99.09% 34 96.50% 49.70% 98.95%
15 96.15% 50.43% 99.61% 35 95.32% 52.86% 99.20%
16 96.44% 51.75% 99.38% 36 96.25% 58.07% 98.92%
17 95.55% 67.44% 98.36% 37 95.25% 43.57% 99.25%
18 95.94% 56.75% 99.14% 38 95.97% 58.94% 98.65%
19 96.70% 50.93% 98.82% 39 95.02% 53.14% 99.09%
20 94.65% 47.07% 99.47% MEAN 95.83% 55.83% 98.91%
Two Scale Gabor Filter Approach
Image Accuracy Sensitivity Specificity Image Accuracy Sensitivity Specificity
1 97.09% 69.15% 98.86% 21 95.85% 64.10% 98.97%
2 95.73% 63.75% 98.38% 22 96.04% 66.47% 98.61%
3 95.99% 56.81% 99.09% 23 94.76% 54.80% 98.87%
4 95.78% 59.61% 98.90% 24 93.84% 54.38% 96.50%
5 96.15% 68.38% 98.18% 25 95.79% 61.72% 97.81%
6 96.33% 65.19% 97.88% 26 95.31% 60.53% 97.84%
7 95.59% 49.57% 99.17% 27 94.62% 56.60% 97.88%
8 96.02% 63.64% 98.53% 28 95.21% 65.09% 96.84%
9 96.66% 69.73% 98.75% 29 95.78% 63.45% 98.63%
10 96.17% 60.68% 99.26% 30 95.13% 50.11% 99.23%
11 96.28% 69.83% 98.95% 31 95.47% 63.08% 99.13%
12 96.15% 67.66% 97.46% 32 95.56% 53.15% 98.76%
13 96.13% 64.34% 96.91% 33 95.01% 60.22% 97.90%
14 96.40% 65.58% 99.10% 34 95.65% 53.53% 97.85%
15 95.78% 48.45% 99.37% 35 94.97% 51.90% 98.91%
16 96.37% 54.00% 99.16% 36 96.24% 59.28% 98.82%
17 95.77% 69.31% 98.41% 37 94.80% 38.98% 99.12%
18 95.55% 54.08% 98.93% 38 96.15% 64.57% 98.43%
19 96.22% 51.54% 98.29% 39 95.89% 66.33% 98.76%
20 94.40% 47.74% 99.12% MEAN 95.71% 59.68% 98.50%
62
2.5 Discussion
Developments particularly in the resolution of fundus cameras in the last decade or so
have vastly changed the quality and size of digital fundus images now routinely
captured in NHS DR screening centers. Currently there is no comparable high-
resolution database of realistic DR images available to test automatic vessel
extraction/segmentation algorithms on. The DR HAGIS database fills this gap and
provides a realistic collection of high-resolution fundus images collected in the
current NHS screening environment.
The vascular maps, generated by the author, are as close as possible (with
current technologies) to defining what an expert human sees when observing digital
images of the retina. Each vascular map was painstakingly created to ensure as
accurate a segmentation as possible. Each vascular map took over an hour to carefully
trace.
Table 1 presents our initial results for the intensity based and two-scale Gabor
approaches compared against the manually segmented maps. Both approaches
resulted in similar overall segmentation accuracy (intensity based: 95.83%, 2-scale
Gabor filter approach: 95.71%). These algorithms, which represent two current
approaches to retinal vessel segmentation, do a reasonable job in successfully
extracting details of the larger retinal vessels but they clearly leave room for
improvement as their sensitivity is only 55.83% and 59.71%. That said the main aim
of this work was to generate a database of realistic DR fundus images that other
research groups can test their innovations on.

63
Chapter 3: Filtering the effects of cataracts
3.1 Background
Previous guidance on assessablity of retinal fundus images specified a perceived ‘cut
off’ defining a minimum limit of clarity. The automatic detection of the third
generation retinal vessels should make it possible to identify whether an image is
assessable and this may be beneficial in reducing the numbers of false negative
results. However an initial test carried out by Health Intelligence showed a general
lack of agreement between experts on what is adequate/assessable. As part of an audit
on assessability we had a group of 18 graders examine 26 images all of which were
originally graded as unassessable (one example is shown in figure 35). Despite all
these images being previously graded as unassessable 11 of 18 (61%) graders felt that
over half of the images were assessable.
Figure 36: An example of an unassessable retinal image. This image was graded
as assessable by a retinal grader, however the fine vessles within 1DD of the
centre of the fovea are difficult to visualise within this image. This hazy view
inhibits a clear view of the retina and thus the image is now classified as
‘inadequate’ by the ENSPDR guidence.

64
This illustrates the subjective nature of retinal assessment, what is assessable to a
clinician may not necessarily be assessable to a grader and vice versa. Complaints
have been voiced regarding the assessablity of some of the grading image sets
available on the online national EQA grading system. Graders have complained that
they have been forced to grade unassessable images as part of their monthly test
despite the fact that all these images were deemed assessable.
3.2 Current image enhancement techniques to improve image quality
There are four main factors which effect image quality colour, focus, contrast and
illumination. Some images will need adjustment of brightness and contrast because of
media opacities, some will require adjustment as the image may be under exposed.
Current methods used in retinal screening to enhance images involve the use of
brightness and contrast, however as described in the introduction the over use of these
controls can often make features disappear by posterization or ‘blowing out’ of detail
(figure 23). Distortion can for example make fine vessels appear as pathology such as
intra retinal microvascular abnormalities (IRMA) and therefore lead to false positive
results. This phenomenon has also been noticed by DESP and the latest guidance
states that unless IRMA is spotted in the colour image it should not be graded as
present.
One simple modification which shows promise in increasing sensitivity of
fundus cameras is the removal of the Anti-Aliasing filter (AA). The AA filter is
commonly placed on the surface of the image sensor on a digital single lens reflex
(SLR) camera. These filters are designed to deal with fine repeating patterns, as fine
or finer than the pitch of the actual pixels. Such patterns are not common place in the
retina and an anti-aliasing filter works by blurring the image just a tiny amount (only

65
fractions of pixels) so that no details finer than the distance from one pixel to the next
hit the sensor.
Removal of this anti-aliasing filter gives a much sharper image at high levels
of zoom, when examining small clusters of pixels. However this is not the case on any
of the currently approved SLR cameras used in DRS screening although this may
change in the near future when cameras like the Nikon 800e come on to the market.
3.3 Methods
As described previously the amount of scattering in a young non pathological eye is
low but will increase with age and some pathology (e.g. cataract). This increased
scattering will result in a degradation of the retinal image similar to degradation of
images by the atmosphere. Although a large body of work exists on the enhancement
of images recorded in poor visibility conditions, less research has been carried out on
how to reduce the degradation of retinal images by intraocular scattering.
One possible approach is based on research carried out in the Faculty of
Engineering and Physical Sciences at the University of Manchester who developed a
powerful filter to mitigate contrast loss due to atmospheric scattering effects. This
algorithm was made commercially available in both hardware and software formats
by a spinout company Dmist Research Ltd. under the brand names “Clearvue” and
“ClearvueHD”. In principle the same technology could be applied to mitigate the
scattering effects of media opacities such as cataracts. To test the potential of this
Clearvue filter in retinal screening a commercial agreement was put in place between
Health Intelligence Ltd and Dmist Research Ltd. We refer to this as the ‘cataract
filter’ in the context of retinal screening.

66
The cataract filter is based on simple subtraction. The image is first converted
to a linear intensity scale. Images are conventionally represented using gamma
encoding. RGB pixel values do not represent intensity but (roughly) the square root of
intensity. An estimate for the scattered component is then generated and is then
subtracted from the input image. The scattered component usually varies in different
parts of the image. The cataract filter represents this component as an arbitrary
smooth function. The level of “smoothness” is variable according to an input
parameter (filter scale). The output is then rescaled and the non-linear (gamma)
encoding is re-applied.
Figure 37: Example of an artificial scene in simulated clear and foggy conditions.
Where 𝒑𝒌 represents the pixel intensity and ��𝒌 represents the same pixel in a low-
pass filtered version of the image. 𝒑𝒌−��𝒌
��𝒌 gives a measure of local contrast within
the image namely the coefficient of variation (CV).
The cataract filter is designed to mitigate contrast loss due to scattering effects, the
image model works based on the principles outlined in figure 37. Foggy scenes
exhibit a lower coefficient of variation and we can use this statistical signature of the
fogginess to determine an estimate of the additive scattering component. The cataract

67
filter achieves this using a iterative process designed to make the CV in the image as
uniform as possible.
This method is designed to overcome these faults of colour and feature
distortion, allowing the colour levels and contrast to be optimised automatically to
potentially offer retinal graders additional information. If the cataract filter works as is
hoped it should help reduce the rate of ungradable/unassessable images (the current
percentage of unassessable images for most screening programmes is higher than the
7% recommended rate by the DESP) and associated inappropriate referrals for
additional eye examination.
3.4 A pilot test of the ‘cataract filter’ algorithm
All images used in this first test were determined to be unassessable as part of a
national retinal screening programme. They were initially graded as unassessable and
then reviewed a second time at arbitration by an ophthalmologist as per national
guidance. All retinal screening graders for Health Intelligence are trained to the same
levels of competence, and take part in monthly external quality assurance exams.
They also have their grading work audited every quarter to determine sensitivity and
specificity. Preliminary findings from this study were reported at the IEEE Imaging
Systems and Techniques conference (Russell et al., 2012), (see Appendix B).
The cataract filter was applied to previously unassessable images and the
processed images were re-graded. The graders on this occasion could not use the
brightness and contrast tools they are accustomed to using on the grading panel as this
is not possible to do within the audit software.

68
Consent for testing was acquired from the patients prior to screening as no
harm could come from this operation. Two parameters control the cataract filter. The
"dark level" is used to mitigate the effect/extent of noise in the input image and ranges
from 0 to 2. The cataract filter estimates the scattering component of light within the
image as a smooth surface. The level of “smoothness” is set by the second control
parameter (the scale) which ranges from 1-15%. This limits the scale over which the
enhancement is allowed to adapt according to the local image properties. The higher
the scale the ‘smoother’ the coverage and the less local the effect of filtering.
Processing of the retinal images was carried out in the following stages as organised
by the author:
Stage 1 - 100 images previously graded as unassessable taken from the DRS system
Stage 2 - Stage one images were filtered with the cataract filter with the dark level set
at 0.33 and the scale set to 5% (the default settings within the software). The
processed images were then re-graded by the author to determine if any were now
assessable purely as a result of the filter. Any deemed gradable would pass on to a
second full disease grader (SFDG) who was not aware of the authors grade for
confirmation
Stage 3 - 100 more images taken from the DRS system previously graded as
unassessable (so as not to be familiar to the graders) to be prepared for a second test
Stage 4 – Adjustments were made to the filters parameters to attempt to enhance
sensitivity. Firstly five images were selected from the previous 100 unassessable
images and were processed through the cataract filter with the dark level set to 0, 0.5
0.25, 0.75, 1, 1.25, 1.75 and 2 and the scale parameter set to
69
1,2,3,4,5,6,7,8,9,10,11,12,13,14 and 15%. This generated 600 images to review (5
images x 8 dark levels x 15 scale levels). The best settings for the cataract filter were
agreed by discussion between two expert graders (the author and a medical retina
ophthalmologist). These were dark range set at 1 and scale set between 4 -14
depending on the individual image.
Stage 5 – a new data set were generated with dark level set to 1 and range set to
4,5,6,7,8,9,10.11.12.13 and 14% for all 100 images which generated 1400 images to
review. From this expanded dataset the settings of dark range 1 and scale 5 were
determined to be the optimum settings by discussion between the two expert graders
(the author and a medical retina ophthalmologist).
Stage 6 - The 100 images taken from stage 3 were filtered with the new
settings agreed in stage 5 and the images re-assessed in a standard audit
fashion. Any images now deemed gradable were passed on to a second full
disease grader for confirmation (this grader was an experienced second full
disease grader).
3.5 Results
In stage 2, the cataract filter was used at the default settings as delivered from the
manufacturer (dark level 0.33 scale 5%). Ten of the images presented after the
cataract filter was applied were now deemed gradable by the graders. In order to try to
refine the cataract filter settings, five unassessable images that displayed a good
variation (Figure 38) were selected from the 100 in order to keep the numbers of

70
resulting processed images to a manageable level for detailed review. The five images
displayed varied levels of pigmentation and brightness and were selected by the
author and a medical retina ophthalmologist, low contrast and one with asteroid
hyalosis (in order to see how artefacts might be affected). As mentioned above these
five images were processed with combinations of dark level from 0.5 - 2 and scale of
1-15% generating 600 images for review, each of these images were then assessed.
The assessment of a retinal image takes approximately 2.5 mins to complete, the
grader must zoom in pan and apply various filters such as the ‘red free’ filter which
enables a higher contrast to fully assess an image. The assessment took
approximately 1500 min (25 man hours) to complete.
Figure 38: The five images selected for detailed investigation. These images
display a good variation in colour and features. a),b), and c) were selected as they
display variation in pigmentation from asian patients. d) contains a good
example of asteriod hylosis and e) is typical of a caucasian retina.

71
Some distortions were noted for bright reflex images when the scale parameter was
set to 4% or less and so a scale parameter of 9% might be preferable to deal with the
most extreme cases.
However in order to produce a simple and effective filter which can be used
simple and effectively it is less desirable to have a parameter which was manually
operated by the user and can open the doors to human error. It was recognised that
this selection for the optimum setting was subjective, but was based on the same
judgment model used by the NHS DESP and was based on a discussion between a
medical retina consultant ophthalmologist and the author.

72
A further test took place in order to subject all 100 images to these newly
refined parameters in order to determine a good average setting. As described
previously all images from stage 3 were processed using 10 different sets of
parameter settings (dark level 1 and scale from 4-14). Figure 39 displays an example
of how varying the parameters of the cataract filter affect the assessibility of a single
unassessable image.
Figure 39: An example of how varying the parameters of the cataract filter affect
the quality of a single unassessable image. a) the original unassessable image. b)
Image (a) after being filtered by the cataract filter with dark level 1 and scale
6%. These settings were judged to be to be too extreme by the reviewers - with
some distortions noted in the darker areas. c) Image (a) after being filtered by
the cataract filter with dark level 1 and scale 5% (which was judged to be the
ideal setting). d) image (a) after being filtered by the cataract filter with dark

73
level 1 and scale 4% which was judged to be too conservative in contrast by the
experts.
Typically it was felt that dark range 1 scale 4 showed too little contrast while dark
range 1 scale 6 went too far and caused some distortion. This resulted in the graders
choosing dark level 1 and scale 5 as it increased contrast and generated minimal
distortion. When this filter was applied to the images in review 12 cases that were
unassessable were now graded as assessable, of these 9 displayed clinical signs of
exudate and would be classified as referable maculopathy.
Figure 40: Comparison of unassessable and the ‘Clearvue’ filtered image. Here
we see the original ‘unassessable image on the left and the ‘clearvue’ filtered
image on the right. The circled areas not show exudate within 1 DD of the centre
of the fovea and so result in a referable image.
3.6 Discussion
Given that all 100 cases were originally graded unassessable (now termed inadequate
by the NHS DESP) a result of 12% assessable appeared to be a significant
improvement. One criticism of this pilot study is that the graders were using a system
to perform the audit which differed slightly to the system which the graders use to
assess images. This audit system is designed for a fast overview of cases and had

74
limited control over the brightness and contrast, and this may have influenced their
judgment with a bias towards the filtered images. There is no current guidance on the
necessity of modulating brightness and contrast in DR grading systems and in fact at
the Moorfields Biomedical Research Centre for Ophthalmology graders are not
allowed to use these controls as they are not currently approved by the Food and Drug
Administration (FDA) in the US. The initial findings definitely look encouraging and
if borne out by future work there could be substantial cost savings and benefits to
patients.

75
Chapter 4: Conclusions and Future Work
4.1 DR HAGIS database
In Chapter 2 we detailed the development of a new database of retinal fundus images
taken a DR screening programme run by Health Intelligence. This database is
comprised of 39 images of DR patients many of whom suffer from comorbidities that
are commonly associated with diabetic patients. These images are far more
representative of current DR screening images than any freely available datasets. It is
hoped that the publication of this dataset, with results from two different segmentation
algorithms, may result in the development of newer and more powerful automatic
segmentation tools. These 39 images span the rang of assessable images that are
frequently encountered in screening programs, with patients with different
pigmentation, degrees of retinopathy and taken with different cameras with different
resolutions. As described in chapter 2 for any automatic vessel extraction algorithm to
be useful in the clinic it has to be able to deal with all these variations and
complications.
4.2 Issues with the preliminary cataract filter study
As noted in chapter 3 our initial study with the cataract filter looks very promising. If
this filter does in fact lead to a 12% reduction in the number of
unassessable/inadequate images this would be a very useful tool. However our
preliminary findings may have been influenced by:
1. The fact that the graders were using limited brightness and contrast controls in
auditing compared to what they normally do when grading. The use of brightness and

76
contrast controls may have no effect on the results of cataract filtering, it might lead to
distorted images and false alarms or it may in fact aid the graders judgement. This
needs to be tested in future studies.
2. In our preliminary study the graders worked in a single sitting and were hyper-
focused as they knew they were participating in a study. In the normal grading
environment a screener may be less focused when grading images.
3. Experienced arbitration graders were used in order to determine the outcome
of assessablity. These graders are experts and will typically have a better skill set than
a first full disease grader who would be the first users of this filter.
4. The images were not ‘mixed’ in with assessable images. Normally you would
expect most images to be assessable again this may have biased our results.
5. It would be useful to get an automated measure of the assessibility of each test
image (a measure of image quality) and then any improvement caused by the cataract
filter could also be measured automatically.
4.3 Further cataract filter studies
It should be possible to more accurately gauge how much of an improvement had
been made by employing the cataract filter if certain controls are put into place to
address the issues raised in points 1-5. For example brightness and contrast tools
should be made available alongside the cataract filter, as graders have become
accustomed to using these in the course of their jobs.

77
To automatically assess the improvements made by the cataract filter an automatic
retinal image quality grading algorithm (for example Hunter et al., 2011) could be
implemented. This would initially allow us to see if an automatic grading algorithm
was able to detect any improvement in image quality caused by the cataract filter. One
such test is detailed below as Experiment A:
Experiment A
1. A set of images previously graded are taken from a DRS system (500) as a)
adequate (assessable) or b) inadequate (unassessable).
2. The intention is to then “teach” the automatic grading algorithm (Hunter et al.,
2011) how to differentiate between an assessable (adequate) and an unassessable
(inadequate) image across a range of retinal screening environments. Included in these
sets would be images obtained with different camera types/resolutions and from
different groups.
3. Once the algorithm has determined that an image is inadequate, this can be
verified by a number of graders. This will allow an analysis of the sensitivity, and
specificity of the automatic grading filter.
4. Once validated the grading filter will then be used to obtain 5000 inadequate
images from previously screened patient records. These 5000 images will be
processed with the cataract filter and these processed images will be reprocessed by
the automatic grading algorithm to see if this filter has made any difference to the
automated approach.

78
Once an automatic algorithm to measure of image quality has been established this
will allow us to compare automatic grading performance with the assessibility
measures from front line retinal graders. For example:
Experiment B
1. The next step would be to develop two test set of images each containing 80
cases: 30 assessable unfiltered, 30 assessable filtered, 10 unassessable and unfiltered
and 10 unassessable and filtered. The two sets should be counter-balanced so that the
30 assessable cases that were filtered in set 1 would be unfiltered in set 2 and visa-
versa.
2. Then 20 graders sourced from East Anglia diabetic retinal screening
programme (30 Graders available) would be tasked with grading either set 1 or set 2.
3. This would allow us to determine whether the cataract filter affects the
perceived assessabilty of retinal images that were previously determined by retinal
experts to be assessable or unassessable.
4. The two image sets could also be processed by the automatic retinal grading
algorithm to see if this measure correlates with the front line grading staff.
This experiment would remove many of the concerns raised with our preliminary
study. Front line graders would have access to both brightness and contrast controls
for all images whether they had been filtered by the cataract filter or not. The graders
used would be the first full disease graders as opposed to the experts used in our
preliminary study to more accurately reflect the screening environment. All images
would be presented on a Health Intelligence laptop and be similar to training systems
the graders are used to. Both assessable and inassessibile images will be presented

79
randomly to the graders with some but not all (50%) of each type of image having
been processed by the cataract filter prior to presentation.
4.4 Conclusions
Diabetic retinopathy is currently one the leading causes of blindness in the Western
world. The implementation of annual screening for DR of all diabetics over the age of
12 in the UK is reducing the number of patients becoming blind. However the global
increase in the number of patients diagnosed with diabetes mellitus coupled with the
increasing costs and demands on this screening system means methods to semi-
automate or aid screeners are much in demand. In this thesis two preliminary studies
were presented which it is hoped may aid in the development of new software tools to
aid retinal graders. Chapter 2 presented a new database of DR patient fundus images
with manually derived vessel masks. This database can be used to test vessel
extraction algorithms and the success of two such algorithms were presented. Chapter
3 presented the application of a cataract filter to images that were deemed to be
inadequate for grading by retinal screeners. Around 12% of these images changed
from being inadequate to adequate through the use of this filter. Although future work
is needed to confirm this finding, our preliminary results are particularly exciting.

80
References
Agurto C, Murray V, Barriga E, Murillo S, Pattichis M, Davis H, Russell S, Abramoff
M, and Soliz P (2010) "Multiscale AM-FM methods for diabetic retinopathy
lesion detection" IEEE Trans Med Imaging 29(2):502-12.
Aldington, S., Kohner, E., Meuer, S., Klein, R. and Sjolie, A. (1995). Methodology
for retinal photography and assessment of diabetic retinopathy: the EURODIAB
IDDM Complications Study.Diabetologia, 38(4), pp.437-444.
American Diabetes Association, (2014). Statistics About Diabetes. [online] Available
at: http://www.diabetes.org/diabetes-basics/statistics/ [Accessed 11 Nov. 2014].
Andermann, A. Blancquaert I, Beauchamp S, Déry V. (2008). Revisiting Wilson and
Jungner in the genomic age: a review of screening criteria over the past 40
years. Bull World Health Organ, 86(4), pp.317-319.
Aria-database.com, (2014). The Aria Database - Home. [online] Available at:
http://www.aria-database.com/ [Accessed 13 Dec. 2014].
Bashir Al-Diri, Andrew Hunter, David Steel, Maged Habib, Taghread Hudaib and
Simon Berry, (2008), “REVIEW - A Reference Data Set for Retinal Vessel
Profiles”, the 30th Annual International Conference of the IEEE Engineering in
Medicine and Biology Society in Vancouver, British Columbia, Canada, August
20-24/ 2008.
Boucher, M., Gresset, J., Angioi, K. and Olivier, S. (2003). Effectiveness and safety
of screening for diabetic retinopathy with two nonmydriatic digital images
compared with the seven standard stereoscopic photographic fields. Canadian
Journal of Ophthalmology / Journal Canadien d'Ophtalmologie, 38(7), pp.557-
568.
Ces.clemson.edu, (2014). The STARE Project. [online] Available at:
http://www.ces.clemson.edu/~ahoover/stare/ [Accessed 13 Dec. 2014].
Chakrabarti, R., Harper, A. and Keeffe, E. (2012). Diabetic retinopathy management
guidelines. [online] International Council for Ophthalmology. Available at:
http://www.icoph.org/dynamic/attachments/taskforce_documents/diabeticretinop
athymanagement_guidelinespublished-11-10-2012.pdf [Accessed 13 Dec. 2014].
81
Cheung, N. and Wong, T. (2012). Letter by Cheung et al Regarding Article, "Mild
Retinopathy Is a Risk Factor for Cardiovascular Mortality in Japanese With and
Without Hypertension: The Ibaraki Prefectural Health Study". Circulation,
126(1), pp.e13-e13.
Clarkvision.com, (2014). Clarkvision: Film versus Digital Summary. [online]
Available at: http://www.clarkvision.com/articles/film.vs.digital.summary1.html/
[Accessed 11 Nov. 2014].
Congdon N, and the Eye Disease Prevalence Research Group (2004) "Causes and
prevalence of visual impairment among adults in the United States" Archives of
Ophthalmology, 122(4), p477.
Costello, M., Johnsen, S., Gilliland, K., Freel, C. and Fowler, W. (2007). Predicted
Light Scattering from Particles Observed in Human Age-Related Nuclear
Cataracts Using Mie Scattering Theory.Investigative Ophthalmology & Visual
Science, 48(1), pp.303-312.
Curriculum.rcophth.ac.uk, (2014). Health Promotion The Royal College of
Ophthalmologists - Curriculum for Ophthalmic Specialist Training. [online]
Available at: http://curriculum.rcophth.ac.uk/study-guide/health_promotion
[Accessed 13 Dec. 2014].
Danaei, G., Finucane, M., Lu, Y., Singh, G., Cowan, M., Paciorek, C., Lin, J.,
Farzadfar, F., Khang, Y., Stevens, G., Rao, M., Ali, M., Riley, L., Robinson, C.
and Ezzati, M. (2011). National, regional, and global trends in fasting plasma
glucose and diabetes prevalence since 1980: systematic analysis of health
examination surveys and epidemiological studies with 370 country-years and 2·7
million participants. The Lancet, 378(9785), pp.31-40.
Daugman, J. (1985). Uncertainty relation for resolution in space, spatial frequency,
and orientation optimized by two-dimensional visual cortical filters. J. Opt. Soc.
Am. A, 2(7), p.1160.
Diabetes Care and Research in Europe: The Saint Vincent Declaration.
(1990). Diabetic Medicine, 7(4), pp.360-360.
Diabetes.org.uk, (2014). Warning about the one in 70 people who have undiagnosed
Type 2 diabetes - Diabetes UK. [online] Available at:
http://www.diabetes.org.uk/About_us/News_Landing_Page/Warning-about-the-
one-in-70-people-who-have-undiagnosed-diabetes/ [Accessed 13 Dec. 2014].

82
Ding, J., Zou, Y., Liu, N., Jiang, L., Ren, X., Jia, W., Snellingen, T.,
Chongsuvivatwong, V. and Liu, X. (2012). Strategies of Digital Fundus
Photography for Screening Diabetic Retinopathy in a Diabetic Population in
Urban China. Ophthalmic Epidemiology, 19(6), pp.414-419.
Farnell, D., Hatfield, F., Knox, P., Reakes, M., Spencer, S., Parry, D. and Harding, S.
(2008). Enhancement of blood vessels in digital fundus photographs via the
application of multiscale line operators. Journal of the Franklin Institute, 345(7),
pp.748-765.
Ferris, F. (1991). Photocoagulation for diabetic retinopathy. Early Treatment Diabetic
Retinopathy Study Research Group. JAMA: The Journal of the American
Medical Association, 266(9), pp.1263-1265.
Gimp.org, (2014). GIMP - The GNU Image Manipulation Program. [online]
Available at: http://www.gimp.org/ [Accessed 14 Nov. 2014].
Gordois, A., Cutler, H., Pezzullo, L., Gordon, K., Cruess, A., Winyard, S., Hamilton,
W. and Chua, K. (2012). An estimation of the worldwide economic and health
burden of visual impairment. Global Public Health, 7(5), pp.465-481.
Gordon-Bennett, P. (2008). Registration of visual impairment due to diabetic
retinopathy in a subpopulation of Cambridgeshire. Clinical Ophthalmology, p.75.
Hennelly ML, Barbur JL, Edgar DF, and Woodward EG. (1998). The effect of age on
the light scattering characteristics of the eye. Ophthalmic and Physiological
Optics, 18(2), pp.197-203.
Holm S, and McLoughlin N (2014). "Automatic retinal vessel extraction algoritms fro
the alignment of fundus images" PLOS One (submitted)
Holm S, Russell G, McLoughlin N (2013). "Automatic retinal vessel extraction from
fundus images taken from patients with diabetes" Perception 42 ECVP Abstract
Supplement, page 70
Holm S, Russell G, Nourrit V, and McLoughlin N (2014). DR HAGIS – A Novel
Fundus Image Database for the Automatic Extraction of Retinal Surface Vessels
IEEE Transactions on Medical Imaging (submitted).
Hoover, A., Kouznetsova, V. and Goldbaum, M. (2000). Locating blood vessels in
retinal images by piecewise threshold probing of a matched filter response. IEEE
Transactions on Medical Imaging, 19(3), pp.203-210.

83
Hunter A, Lowell JA, Habib M, Ryder B, Basu A, Steel D. (2011)
An automated retinal image quality grading algorithm. Conf Proc IEEE Eng
Med Biol Soc. 5955-8.
Iapb.org, (2015). Diabetic Retinopathy | International Agency for the Prevention of
Blindness. [online] Available at: http://www.iapb.org/vision-2020/what-is-
avoidable-blindness/diabetic-retinopathy [Accessed 6 Jun. 2015].
International Diabetes Federation, (2014). The Global Burden. [online] Available at:
http://www.idf.org/diabetesatlas/global-burden [Accessed 11 Nov. 2014].
Isi.uu.nl, (2014). DRIVE: Digital Retinal Images for Vessel Extraction. [online]
Available at: http://www.isi.uu.nl/Research/Databases/DRIVE/ [Accessed 13
Dec. 2014].
It.lut.fi, (2014). Optimal Detection and Decision-Support Diagnosis of Diabetic
Retinopathy (IMAGERET). [online] Available at:
http://www.it.lut.fi/project/imageret/ [Accessed 13 Dec. 2014].
Kertes, P.J. and Johnson, T.M. (2006) Evidence-based eye care. Lippincott, Williams
and Wilkins. McBrien, N. (1998) Optometry: an evidence-based clinical
discipline. Clin Exp Optom(Editorial) 81(6): 234-235.
Kim, H., Lowery, J. and Kurtz, R. (2007). Accuracy of Digital Images for Assessing
Diabetic Retinopathy. Journal of Diabetes Science and Technology, 1(4), pp.531-
539.
Kristinsson, J., Gudmundsson, J., Stefánsson, E., Jónasson, F., Gíslason, I. and
Thórsson, Á. (1995). Screening for diabetic retinopathy. Initiation and
Frequency. Acta Ophthalmologica Scandinavica, 73(6), pp.525-528.
Langford, M. (2000). Basic photography. Oxford: Focal Press.
Liew, G., Michaelides, M. and Bunce, C. (2014). A comparison of the causes of
blindness certifications in England and Wales in working age adults (16-64
years), 1999-2000 with 2009-2010. BMJ Open, 4(2), pp.e004015-e004015.
Lacey, L. and Taylor, D. (2014). Pathway for Adequate / Inadequate Images and
where images cannot be taken. [online] NHS Diabetic Eye Screening
Programme. Available at:
http://file:///C:/Users/greg.russell/Downloads/Pathway_for_adequate_inadequate
_images_and_where_images_cannot_be_taken_v1_4_10Apr13%20(1).pdf

84
[Accessed 13 Dec. 2014].
Messidor.crihan.fr, (2014). Messidor. [online] Available at:
http://messidor.crihan.fr/download-en.php [Accessed 13 Dec. 2014].
Mitchell, P., Annemans, L., Gallagher, M., Hasan, R., Thomas, S., Gairy, K.,
Knudsen, M. and Onwordi, H. (2012). Cost-effectiveness of ranibizumab in
treatment of diabetic macular oedema (DME) causing visual impairment:
evidence from the RESTORE trial. British Journal of Ophthalmology, 96(5),
pp.688-693.
Murgatroyd, H. Ellingford A, Cox A, Binnie M, Ellis JD, MacEwen CJ, Leese GP
(2004). Effect of mydriasis and different field strategies on digital image
screening of diabetic eye disease. British Journal of Ophthalmology, 88(7),
pp.920-924.
News.bbc.co.uk, (2002). BBC NEWS | UK | England | Blind twins win damages.
[online] Available at: http://news.bbc.co.uk/1/hi/england/2041446.stm [Accessed
23 Nov. 2014].
Niemeijer, M., van Ginneken, B., Cree, M., Mizutani, A., Quellec, G., Sanchez, C.,
Zhang, B., Hornero, R., Lamard, M., Muramatsu, C., Wu, X., Cazuguel, G., You,
J., Mayo, A., Qin Li, Hatanaka, Y., Cochener, B., Roux, C., Karray, F., Garcia,
M., Fujita, H. and Abramoff, M. (2010). Retinopathy Online Challenge:
Automatic Detection of Microaneurysms in Digital Color Fundus
Photographs.IEEE Transactions on Medical Imaging, 29(1), pp.185-195.
Oakley, J. and Bu, H. (2007). Correction of Simple Contrast Loss in Color
Images. IEEE Trans. on Image Process., 16(2), pp.511-522.
Olafsdottir, E. and Stefansson, E. (2007). Biennial eye screening in patients with
diabetes without retinopathy: 10-year experience. British Journal of
Ophthalmology, 91(12), pp.1599-1601.
Ortega Hortas, O and Penas Centeno, M (2010), The VICAVR database. [online]
Available at: http://www.varpa.es/vicavr.html [Accessed 13 Dec. 2014].
Peli, E. and Peli, T. (1989). Restoration of retinal images obtained through
cataracts. IEEE Transactions on Medical Imaging, 8(4), pp.401-406.
Principles and Practice of Screening for Disease. (1968). Annals of Internal Medicine,
69(5), p.1085.

85
Rangayyan, R. Ayres, F. Oloumi, F. Oloumi, F, Eshghzadeh-Zanjani, P. (2008).
(2008). Detection of blood vessels in the retina with multiscale Gabor filters. J.
Electron. Imaging, 17(2), p.023018.
Reuters, (2014). LaserSoft Imaging Introduces the Perfect Kodachrome Workflow.
[online] Available at:
http://www.reuters.com/article/2009/03/26/idUS144340+26-Mar-
2009+BW20090326 [Accessed 11 Nov. 2014].
Russell, G, McLoughlin, N, Nourrit, V, Oakley, J.P (2012). Enhancement of color
retinal images in poor imaging conditions” IEEE International Conference on
Imaging Systems and Techniques (IST) [online] Available at: http://Enhancement
of colour retinal images in poor imaging conditions [Accessed 7 Dec. 2014].
Saaddine, JB, Honeycutt AA, Narayan KM, Zhang X, Klein R, Boyle JP. (2008).
Projection of Diabetic Retinopathy and Other Major Eye Diseases Among People
With Diabetes Mellitus. Archives of Ophthalmology, 126(12), p.1740.
Saleh, M., Eswaran, C. and Mueen, A. (2010). An Automated Blood Vessel
Segmentation Algorithm Using Histogram Equalization and Automatic
Threshold Selection. J Digit Imaging, 24(4), pp.564-572.
Scanlon, P. and Garvican, L. (2003). Essential Elements in Developing a Diabetic
Retinopathy Screening Programme. [online] UK NATIONAL SCREENING
COMMITTEE. Available at: http://file:///C:/Users/greg.russell/Downloads/2010-
SCI-077_ENSPDR_Workbook_2009%20(3).pdf [Accessed 13 Dec. 2014].
Sharp, P., Olson, J., Strachan, F., Hipwell, J., Ludbrook, A., O'Donnell, M., Wallace,
S., Goatman, K., Grant, A., Waugh, N., McHardy, K. and Forrester, J. (2003).
The value of digital imaging in diabetic retinopathy. Health Technol Assess,
7(30).
Staal, J., Abramoff, M., Niemeijer, M., Viergever, M. and van Ginneken, B. (2004).
Ridge-Based Vessel Segmentation in Color Images of the Retina. IEEE
Transactions on Medical Imaging, 23(4), pp.501-509.
Stefansson, E., Bek, T., Porta, M., Larsen, N., Kristinsson, J. and Agardh, E. (2000).
Screening and prevention of diabetic blindness. Acta Ophthalmologica
Scandinavica, 78(4), pp.374-385.
Taylor, R. and Batey, D. (2012). Handbook of retinal screening in diabetes.
Chichester, West Sussex, UK: WileyBlackwell.

86
Trinitylaw.co.uk, (2015). Accident Types. [online] Available at:
http://www.trinitylaw.co.uk/accident-types.html [Accessed 6 Jun. 2015].
UK prospective diabetes study (UKPDS). (1991). Diabetologia, 34(12), pp.877-890.
Valverde, C., Garcãa, M., Hornero, R., Diez, A. And Lopez, M. (2010). Evaluation
of different automated fundus photograph analysis algorithms for detecting and
grading diabetic retinopathy. Acta Ophthalmologica, 88, pp.0-0.
Voleti, V. and Hubschman, J. (2013). Age-related eye disease. Maturitas, 75(1),
pp.29-33.
Whiting, D., Guariguata, L., Weil, C. and Shaw, J. (2011). IDF Diabetes Atlas: Global
estimates of the prevalence of diabetes for 2011 and 2030. Diabetes Research
and Clinical Practice, 94(3), pp.311-321.
World Health Organisation, (2014). WHO | Diabetes programme. [online] Available
at: http://www.who.int/diabetes/en/ [Accessed 13 Dec. 2014].
Zimmet, P., Alberti, K. and Shaw, J. (2001). Global and societal implications of the
diabetes epidemic.Nature, 414(6865), pp.782-787.
Zoega, G., Gunnarsdóttir, Þ., Björnsdóttir, S., Hreiðarsson, Á., Viggósson, G. and
Stefánsson, E. (2005). Screening compliance and visual outcome in
diabetes. Acta Ophthalmologica Scandinavica, 83(6), pp.687-690.

Appendix A:
Holm S, Russell G, Nourrit V, and McLoughlin N (2014) “DR HAGIS – A
Novel Fundus Image Database for the Automatic Extraction of Retinal Surface Vessels” IEEE Transactions on Medical Imaging (submitted).

I
Abstract—In this paper a novel database of retinal fundus
images, the DR HAGIS database, is presented and used to test the
automatic extraction of the retinal surface vasculature. The DR
HAGIS database consists of thirty-nine high-resolution colour fundus
images obtained from a diabetic retinopathy screening programme in
the UK. This NHS screening program uses a variety of services
that employ different fundus cameras. This results in a range of
different image sizes and resolutions depending upon where the
screening takes place. In addition, patients enrolled in such
screening programmes often display other co-morbidities in addition
to diabetes. Therefore, in an effort to replicate the normal range
of images examined by grading experts during screening, the DR
HAGIS database consists not only of images of varying image
resolution, but it is also divided into four co-morbidity subgroups: those
with diabetic retinopathy, hypertension, age-related macular
degeneration and glaucoma. Two published automatic vessel extraction
algorithms were applied to this novel database. The purely intensity-
based algorithm resulted in an overall mean segmentation accuracy of
95.83% (±0.67%), while the algorithm based on oriented Gabor filters
had an accuracy of 95.71% (±0.66%).
Index Terms—Vessel extraction, Retina, Diabetes, Fundus im- age
database.
◦
◦
◦

σ σ
2
◦
◦
1 g(x, y) =
exp 1
x2 y2
\
+ cos(2πf x) (2πσx σy ) 2 2
x y
τ l
l
σx = 2 2 log(2)
σy =l σx
f = l
τ
◦
M
R G B
TGabor
1
TGabor
M = (R + G + B) > 50 =
T = H M AX + 2.5 std(H M AX )

H M AX
std(H M AX )
1
=
=
=
I
C E
C E = [I + T H (I )] BH (I ) T H BH
T H BH
T H BH
C E
C E

τ l
TGabor
τ = 25 l = 0.9 TGabor =
2.1 τ1 = 20 l1 = 1.3 τ2 = 30
l2 = 0.9 TGabor = 2.5
τ1 = 15 l1 = 1.7 τ2 = 25 l2 = 0.9
τ3 = 35 l3 = 0.9 TGabor = 2.9

IB algorithm
MEAN STD
Two-scale Gabor filter algorithm
MEAN STD

IB algorithm
±±±±
±±±±
±±±±
Single-scale Gabor filter algorithm
±±±±
±±±±
±±±±
Two-scale Gabor filter algorithm
±±±±
±±±±
±±±±
Three-scale Gabor filter algorithm
±±±±
±±±±
±±±±

τ
l
BMJ: British Medical Journal
Diabetes Care
Journal of Epidemiology and Community Health
Investigative Oph- thalmology and Visual Science
Graefe’s Archive for Clinical and Experimental Ophthalmology
Experimental Eye Research
Diabetologia
Hypertension
Ophthalmology
Investigative Ophthalmology and Visual Science
Archives of Ophthalmology
Proceedings of the British Machine Vision Conference
IEEE Transactions on Medical Imaging
Engineering in Medicine and Biology Society. EMBS 2008. 30th Annual International
Conference of the IEEE
IEEE Transactions on Medical Imaging
IEEE Transactions on Medical Imaging
Journal of the Franklin Institute
PLOS ONE
Engineering in Medicine and Biology Society, 2007. EMBS 2007. 29th Annual International Conference of the IEEE
Computer Methods in Biomechanics and Biomedical Engineering
Graefe’s Archive for Clinical and Experimental Ophthalmology

Investigative Ophthalmology and Visual Science
British Journal of Ophthalmology
Acta Ophthalmologica
Investigative Ophthalmology and Visual Science
Investigative Ophthalmology and Visual Science
Acta Ophthalmologica

Appendix B:
Russell G, McLoughlin N, Nourrit V, and Oakley JP (2012) “Enhancement of
color retinal images in poor imaging conditions” IEEE International Conference
on Imaging Systems and Techniques (IST)

Enhancement of color retinal images in poor imaging
conditions
G. Russell,
Health Intelligence Ltd. Sandbach, UK
J. P. Oakley University of Manchester, Faculty of Engineering and
Physical Sciences, Manchester, UK [email protected]
N. McLoughlin, V. Nourrit University of Manchester, Faculty of Life Sciences
Manchester, UK
Keywords-component: retinal imaging, scattering.
I. INTRODUCTION
One of the first accounts of retinal observation in vivo is perhaps Jean Mery’s now famous report to the French Royal Academy of Sciences in 1684. The French anatomist described how immersing a cat underwater allowed him to observe the retina in more details [1]. Nowadays a large range of retinal imaging instruments exists (e.g. flood imaging, optical scanning laser ophthalmoscopy, optical coherence tomography, etc. [2]) together sophisticated techniques to correct for the eye’s optical aberrations (e.g. adaptive optics, deconvolution [3]).
Aberrations are however only one of the two main optical phenomena degrading the retinal image’s quality. As light propagates to and from the retina, it will be scattered by small inhomogeneities within the ocular media [4]. The amount of scattering in a young non pathological eye is low but will increase with age and some pathologies (e.g. cataract). This increased scattering will result in a degradation of the retinal image in terms of reduced brightness, poorer contrast, colour degradation and possibly lower spatial resolution.
Such a problem is similar to degradation of images by the atmosphere. Although a large body of work exist on the enhancement of images recorded in poor visibility conditions, a paucity of papers have focused on reducing the degradation of retinal images by intraocular scattering [5].
In this context, our aim was to adapt and assess the potential of an automatic defogging system to retinal imaging.
II. METHODS
A. Descatering
Image contrast enhancement can be divided into two main types: model based and non model based. Model based algorithms improve image contrast by reversing the underlying cause of image degradation but requires a large amount of information about the geometry of the scene and the nature of
the scattering. Due to the difficulty to develop a realistic yet tractable model of intraocular scattering, we took interest in non-model based algorithms as they do not require information about the cause of degradation.
Perhaps the most important non-model based algorithm is histogram equalization (HE). This algorithm is usually performed on the luminance and saturation of the image but not the hue so as to maintain the original color. However, because intraocular scattering is partly wavelength dependent [6], this method may cause some color degradation.
Oakley and Bu [7] presented a successful non-model based algorithm to restore the chrominance and luminance of a scene while maintaining good color fidelity. In this model, the image (I) recorded by the camera is the sum of the light reflected by the scene (here the retina (R)) as it would be observed in the absence of scattering together with the scattered light, known in the remote sensing literature as “airlight” (A).
I = R + A
The airlight value will depend on the distribution and the concentration of the different scattering particles (e.g. keratocytes in the cornea, proteins aggregates in the crystalline lens), the distance from the eye to the camera and the angle of illumination. As a result, the airlight value can vary across the image. Another version of this algorithm has recently been reported that can deal with such spatial variation [8]. The degradation model assumed in both [7] and [8] is an additive noise with a possible scaling of the R term due to extinction. In extremely turbid conditions this model breaks down and significant blurring takes place due to small-angle scattering and recovery of a clear image becomes difficult. However in previous work it was found that the additive noise is the most significant image defect in atmospheric imaging. It is therefore reasonable to assume that the same may be the case in retinal imaging but it is obviously important to check this empirically.
B. Artificial images
Health Intelligence Ltd, Sandbach, Cheshire, CW11 3HL

Full contrast:
30% contrast:
15% contrast:
Figure1. Row 1, image not degraded with corrected version on the right. Row 2, image artificially degraded with corrected version on the right. Row 3, image artificially degraded (strongly) with corrected version on the right.
Figure 2:
The first row presents 2 original images, then for each row from top to bottom: images corrected with histogram equalization, with locally adaptive histogram equalization, with our method (last row).
We first assessed the potential of the technique on retinal images artificially degraded. The images were obtained with an artificial eye and a standard fundus camera. After acquisition an airlight value was added to the images to simulate various level of scattering. This allowed us to assess the optimum value for the adjustable parameters (one that controls the level of spatial variation of the airlight estimate and one that controls the noise compensation) and to quantify the ability of the algorithm to estimate the airlight value.
C. Real images
The industrial partner, Health Intelligence Ltd, provided us
with a series of retinal images obtained in patients with
various degrees of ocular opacities and recorded with a similar
camera
III. RESULTS
Results obtained with artificial images are illustrated in
figure (1). Row 1 shows an image of an artificial eye, with the
enhanced image to the right. Rows 2 and 3 show the same
image but with the contrast deliberately reduced to 30% and
15% using Matlab software with the following command
lines:
im2 = im1*0.30 + 0.70 + 0.004*randn(size(im1));
im3 = im1*0.15 + 0.85 + 0.004*randn(size(im1));
where im2 and im3 are output images, im1 is the input image
(scaled to unity with no gamma encoding) and the ‘randn’
function generates a Normally-distributed random number that
represents a realistic noise level.
As can be observed, the “correction” does not significantly
degrade the image if no scattering is present (i.e. no airlight).
When the visibility is very poor, e.g.in case of advanced
cataract, the recovered images show a grainy effect. This is
due to the scaling needed to restore image contrast after
subtraction of the airlight [8]. However, in spite of this defect,
the recovered images show a good level of consistency when
the input contrast falls to low levels such that the retinal
vessels become almost completely invisible.
Results obtained with real images are illustrated in figure (2) and these show a similar effect. The first row presents the original images. On the second row, the images are corrected by histogram equalization. This processing was performed
using Photoshop CS5.1 from Adobe Corporation. On the third row, images are improved using a more sophisticated contrast enhancement technique (i.e. Contrast-limited adaptive histogram equalization (CLAHE) [9]). Finally, images corrected using our technique are presented on the bottom row.
Image quality is by nature subjective, particularly for images of low to moderate quality as the ones processed, and although few metrics have been suggested for retinal images, there is not yet an accepted gold standard [10]. In addition, the quality of an image measured with one of these metric may not correlate well with the suitability of an image for diagnosis purposes. For these reasons, the processed images presented in Figure 2 were assessed subjectively by an expert retinal grader.

As can be observed simple histogram equalization provides little improvement and significantly alter the color balance. Results presented on the last 2 rows appear more beneficial. The color balance in images processed with CLAHE appears however strongly altered and less natural which reduces the possibility to differentiate between various clinical elements such as arteries and veins, or drusens and exudates. Important artefacts are also present as bands on the right and left sides of the images. If less dramatic, such artefacts could be misinterpreted as pathological feature (e.g. choroidal fold).
IV. DISCUSSION
A novel method to improve the quality of retinal image
degraded by scattering is presented. The main advantage is the
ability to improve automatically the contrast and color fidelity
of the image. These improvements were superior to those
achieved with locally adaptive histogram equalization.
Such improvements could be highly beneficial in the
context of screening for Diabetic Retinopathy (DR). Diabetic
patients regularly undergo fundus photography and if the
image is considered “inadequate” by retinal graders the patient
will usually be referred to additional examination leading to
more stress for the patient, possibly a delayed diagnosis and
increased costs for the health care system.
Current methods used in retinal screening to enhance
images rely basically on simple brightness and contrast
manipulations which can easily lead to loss of information
(e.g. blown out highlights) or the creation of spurious clinical
information (e.g. colour distortion may lead a pigment to look
like a microaneurysm or fine vessels to be confused with a
microvascular abnormality). Our method overcome these
faults of colour and feature distortion, allowing the colour
levels and contrast to be optimised automatically to offer the
grader additional information. This should help reducing the
rate of ungradable images (current for most screening
programmes.is higher than the 7% recommended rate by the
DESP) and associated inappropriate referrals for additional
eye examination.
We plan now to test our algorithms on a large database of
images to confirm that it will not convey any erroneous
clinical information (e.g. to hide an existing lesion or to create
a non-existing one) and quantify the results.
REFERENCES
[1] P. M. Damel., "A simple and inexpensive method for examining the fundus oculi" in Physiol. 1963; 169(Suppl): 1P–9P
[2] Abramoff, M.D.; Garvin, M.K.; Sonka, M.; , "Retinal Imaging and Image Analysis," Biomedical Engineering, IEEE Reviews in , vol.3, no., pp.169-208, 2010
[3] V. Nourrit, B. Vohnsen and P. Artal. Blind deconvolution for high-resolution confocal scanning laser ophthalmoscopy. Journal of Optics 2005; 10(7): 585-92
[4] V. Nourrit, JM Kelly. Intra-ocular scatter and visual performances. Optometry in practice 2009; 10(3):117-26
[5] Peli E, Peli T, Restoration of retinal images obtained through cataracts.IEEE Trans Med Imaging. 1989;8(4):401-6.
[6] E. J. McCartney, Optics of the Atmosphere (Wiley, Toronto,1976).
[7] J P Oakley and H Bu, 2007, Correction of simple contrast loss in color images, IEEE Trans. on Image Processing, 16 (2), pp 511-522.
[8] J.P, Oakley and Z. Marceta. An Automatic HD Defogging System. The Best of IBC and IET. 2011 September; 3: 1. eScholarID:143707
[9] [9] Zuiderveld, Karel. "Contrast Limited Adaptive Histograph Equalization." Graphic Gems IV. San Diego: Academic Press Professional, 1994. 474–485.
[10] J. Paulus, J. Meier, R. Bock, J. Hornegger, G. Michelson. "Automated quality assessment of retinal fundus photos". Int J Comput Assist Radiol Surg. 2010 Nov;5(6):557-64.
