candlesticks demystified copyright ima 20101 1.“candlesticking” is not an exact science, and...
Post on 22-Dec-2015
220 views
TRANSCRIPT
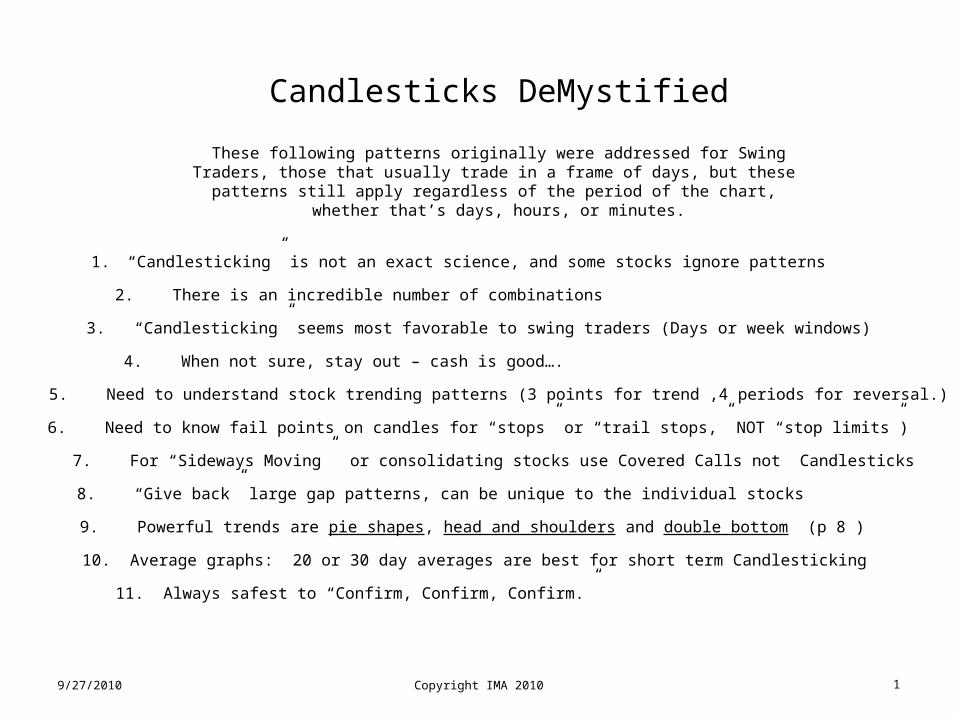
Candlesticks DeMystified
Copyright IMA 2010 1
1. “Candlesticking” is not an exact science, and some stocks ignore patterns
2. There is an incredible number of combinations
4. When not sure, stay out – cash is good….
5. Need to understand stock trending patterns (3 points for trend ,4 periods for reversal.)
6. Need to know fail points on candles for “stops” or “trail stops,” NOT “stop limits”)
7. For “Sideways Moving” or consolidating stocks use Covered Calls not Candlesticks
8. “Give back” large gap patterns, can be unique to the individual stocks
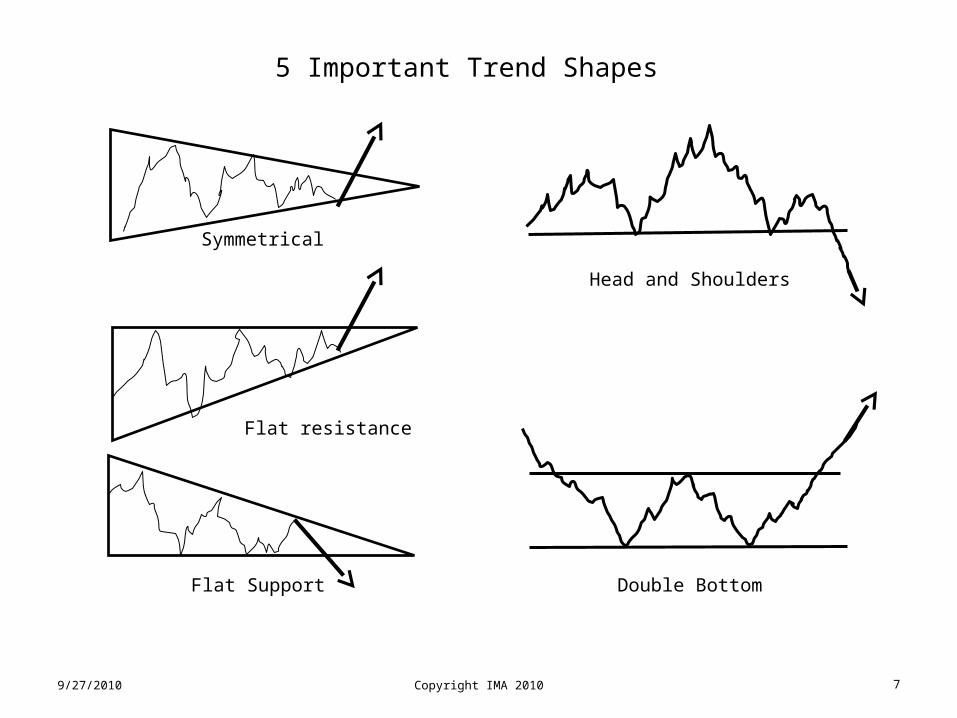
9. Powerful trends are pie shapes, head and shoulders and double bottom (p 8 )
10. Average graphs: 20 or 30 day averages are best for short term Candlesticking
3. “Candlesticking” seems most favorable to swing traders (Days or week windows)
11. Always safest to “Confirm, Confirm, Confirm.”
9/27/2010
These following patterns originally were addressed for SwingTraders, those that usually trade in a frame of days, but these
patterns still apply regardless of the period of the chart, whether that’s days, hours, or minutes.

Spinning Top
Buy or Sell
Hanging Manor
HammerBuy or Sell
Inverted Hammer= Buy
orShooting Star
= Sell
Long-leggedDoji
Buy orSell
Gravestone Doji
Sell only
Buy Sell
Dragonfly DojiBuy only
Color of body here doesn’t really matter, just where the signal shows up.
Marubozus
BullishEngulfing
( Buy )
BearishEngulfing
( Sell )
a
b
c
(a and b >c)
c
a (a=>2xc)
c
a
Copyright IMA 20102
THE “BASIC” CANDLESTICK SET, TARGETED AT CATCHING REVERSALS….
BullishHarami(Buy)
BearishHarami(Sell)
9/27/2010
Copyright IMA 2010 3
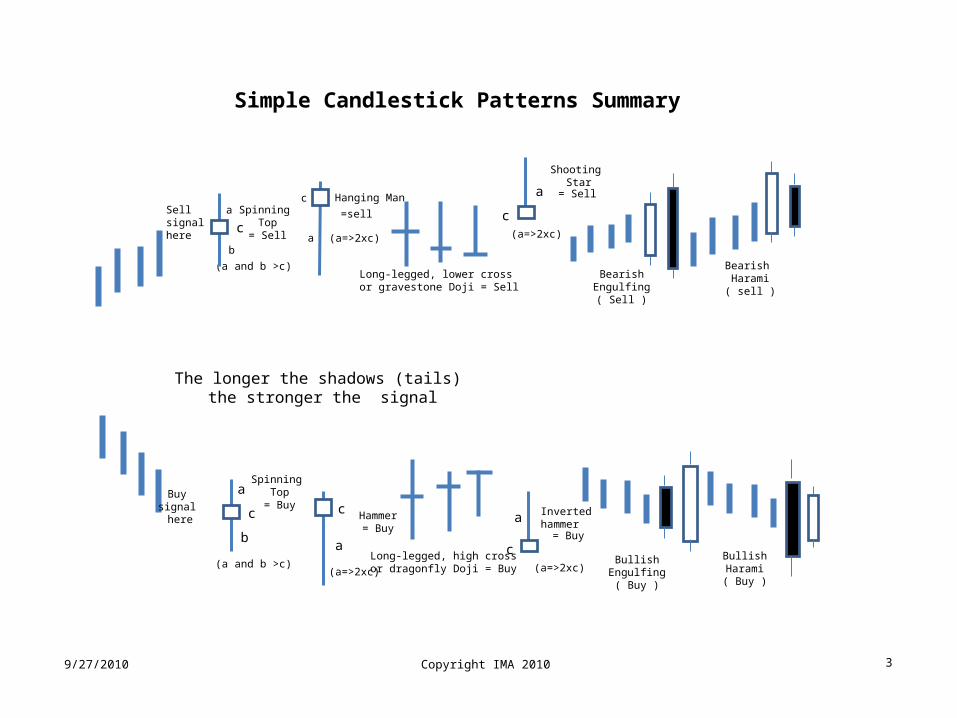
Sell signal here
Buy signal here
Long-legged, high crossor dragonfly Doji = Buy
Long-legged, lower cross or gravestone Doji = Sell
The longer the shadows (tails) the stronger the signal
9/27/2010
(a=>2xc)
Shooting Star
= Sella
c
Bearish Harami( sell )
BearishEngulfing
( Sell )
Spinning Top
= Buy
(a and b >c)
a
b
c
(a=>2xc)
Invertedhammer
= Buy
a
cBullish
Engulfing( Buy )
BullishHarami( Buy )
Simple Candlestick Patterns Summary
Spinning Top
= Sell
(a and b >c)
a
b
c
Hammer= Buy
c
a
(a=>2xc)
c Hanging Man
a (a=>2xc)
=sell
Copyright IMA 2010 4
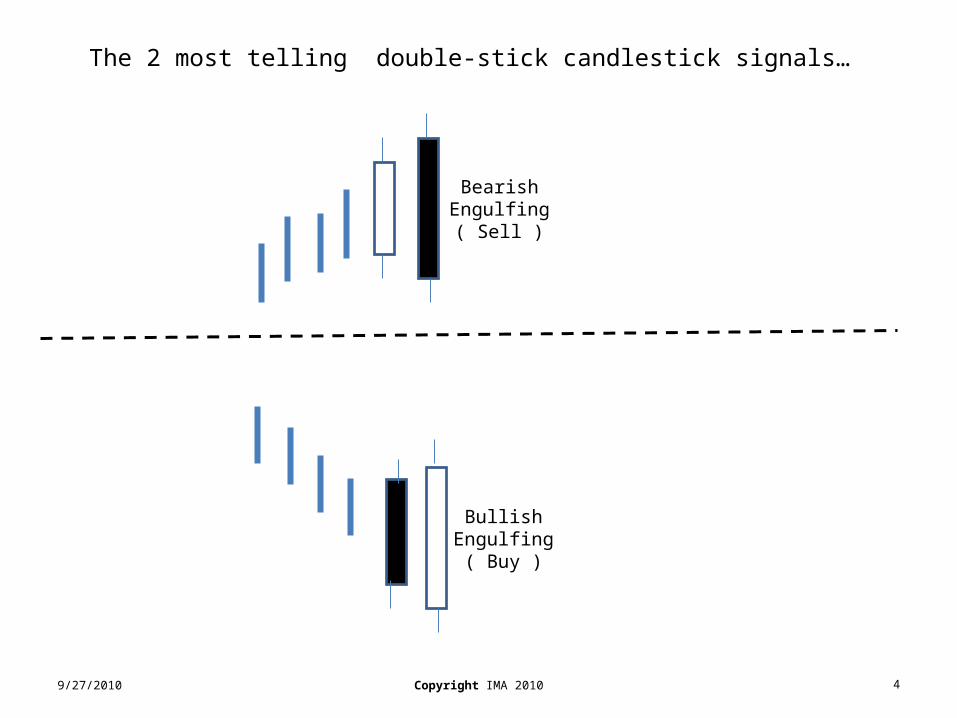
BullishEngulfing
( Buy )
The 2 most telling double-stick candlestick signals…
BearishEngulfing
( Sell )
9/27/2010

Copyright IMA 2010 5
Signal daySetup day
Bullish Harami Pattern
Only the opens andCloses really matter.
Shadows areInconsequential.
TypicalStop level
Bearish Harami pattern
TypicalStop level
Not veryreliable.
Double-stick Haramis (Harami in Japanese means pregnant)
9/27/2010
Copyright IMA 2010 6
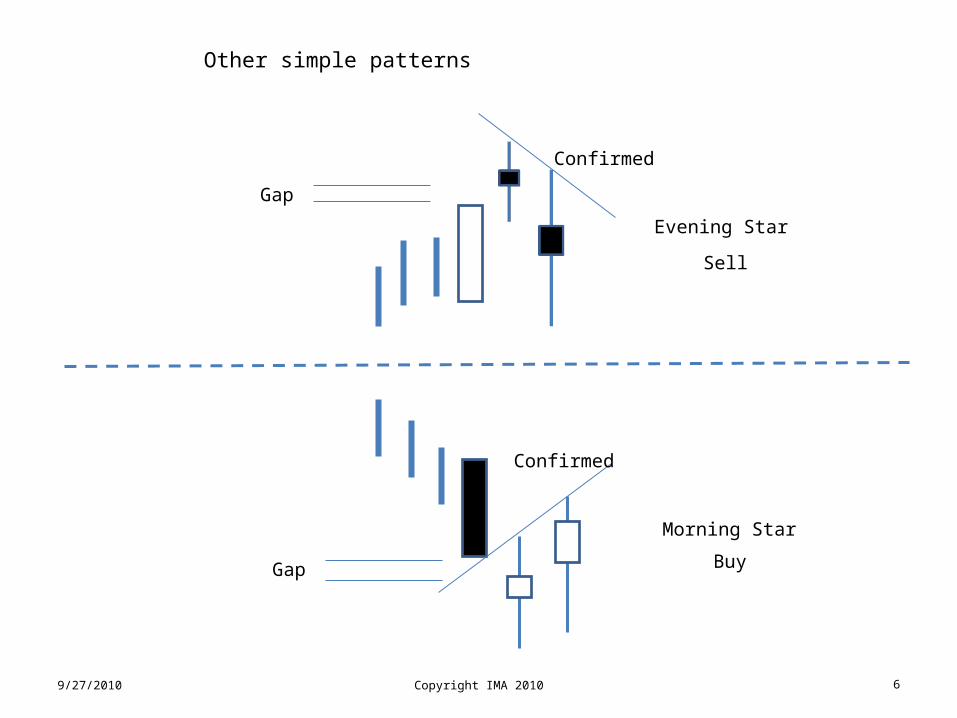
Evening Star
Gap
Sell
Confirmed
Morning Star
Gap Buy
Confirmed
9/27/2010
Other simple patterns
Copyright IMA 2010
5 Important Trend Shapes
Head and Shoulders
Double Bottom
Symmetrical
Flat resistance
Flat Support
79/27/2010

Copyright IMA 2010 8
Sell signal here
Buy signal here
Long-legged, high crossor dragonfly Doji = Buy
Long-legged, lower cross or gravestone Doji = Sell
The longer the shadows (tails) the stronger the signal
9/27/2010
(a=>2xc)
Shooting Star
= Sella
c
Bearish Harami( sell )
BearishEngulfing
( Sell )
Spinning Top
= Buy
(a and b >c)
a
b
c
(a=>2xc)
Invertedhammer
= Buy
a
cBullish
Engulfing( Buy )
BullishHarami( Buy )
Simple Candlestick Patterns Summary
Spinning Top
= Sell
(a and b >c)
a
b
c
Hammer= Buy
c
a
(a=>2xc)
c Hanging Man
a (a=>2xc)
=sell