canmac economics limited dr. mike fosterdr. mike foster …canmac.com/unsm conference.pdf · argyle...
TRANSCRIPT

Canmac Economics LimitedDr. Mike FosterDr. Mike Foster
Mr. John Mersereau
Population by Province
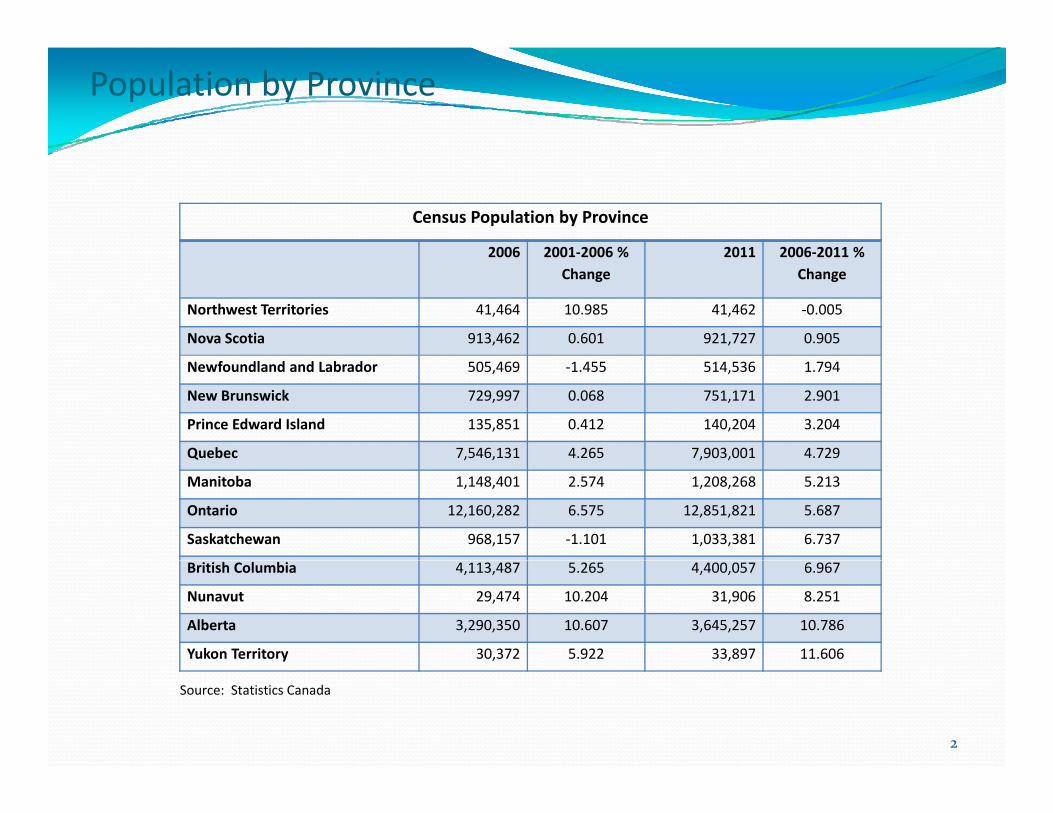
Census Population by Province
2006 2001-2006 % 2011 2006-2011 %2006 2001-2006 % Change
2011 2006-2011 % Change
Northwest Territories 41,464 10.985 41,462 -0.005
Nova Scotia 913,462 0.601 921,727 0.905
Newfoundland and Labrador 505,469 -1.455 514,536 1.794
New Brunswick 729,997 0.068 751,171 2.901
Prince Edward Island 135,851 0.412 140,204 3.204
Quebec 7,546,131 4.265 7,903,001 4.729Quebec ,5 6, 3 65 ,903,00 9
Manitoba 1,148,401 2.574 1,208,268 5.213
Ontario 12,160,282 6.575 12,851,821 5.687
Saskatchewan 968,157 -1.101 1,033,381 6.737
British Columbia 4,113,487 5.265 4,400,057 6.967
Nunavut 29,474 10.204 31,906 8.251
Alberta 3,290,350 10.607 3,645,257 10.786
Yukon Territory 30,372 5.922 33,897 11.606
2
Source: Statistics Canada

Population by Province
Census Population by Province
12,000,000
14,000,000
6,000,000
8,000,000
10,000,000
2,000,000
4,000,000
-NT NS NL NB PE QC MB ON SK BC NT AB YT
2006 2011
3
Dwelling Counts by Province
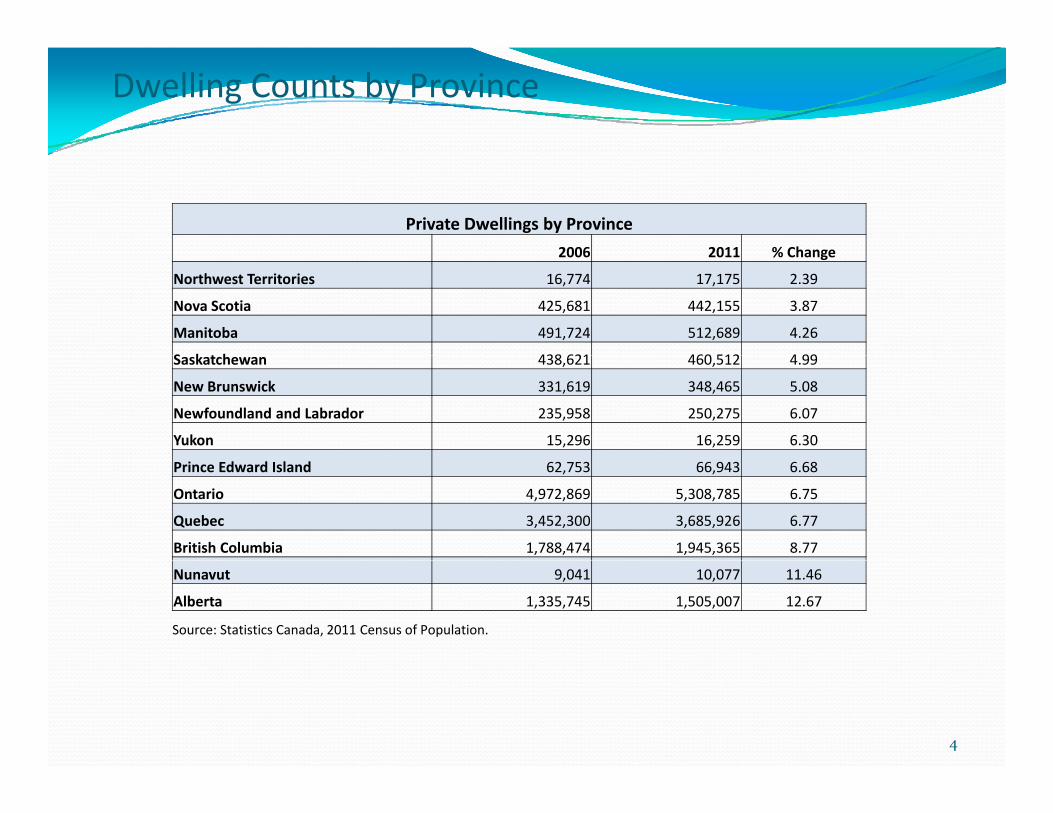
Private Dwellings by Province
2006 2011 % Change2006 2011 % Change
Northwest Territories 16,774 17,175 2.39
Nova Scotia 425,681 442,155 3.87
Manitoba 491,724 512,689 4.26
S k t h 438 621 460 512 4 99Saskatchewan 438,621 460,512 4.99
New Brunswick 331,619 348,465 5.08
Newfoundland and Labrador 235,958 250,275 6.07
Yukon 15,296 16,259 6.30
Prince Edward Island 62,753 66,943 6.68
Ontario 4,972,869 5,308,785 6.75
Quebec 3,452,300 3,685,926 6.77
British Columbia 1,788,474 1,945,365 8.77
Nunavut 9,041 10,077 11.46
Alberta 1,335,745 1,505,007 12.67
Source: Statistics Canada, 2011 Census of Population.
4

Dwelling Counts by Province
P i t D lli b P i
5,000,000
6,000,000Private Dwellings by Province
3,000,000
4,000,000
1,000,000
2,000,000
0
1,000,000
NT NS MB SK NB NL YT PE ON QC BC NU AB
2006 2011
5
Population by Regional Municipality
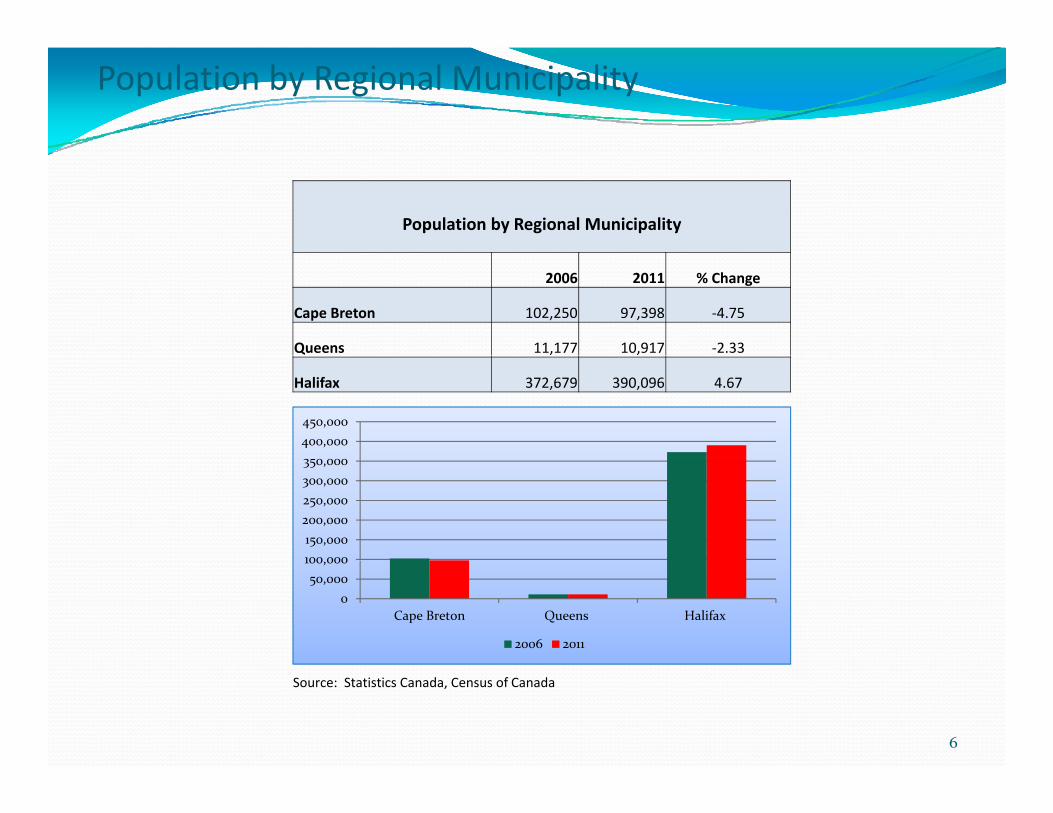
Population by Regional Municipality
2006 2011 % Change
Cape Breton 102,250 97,398 -4.75
Queens 11,177 10,917 -2.33
Halifax 372,679 390,096 4.67
400,000450,000
100 000150,000200,000250,000300,000350,000
050,000
100,000
Cape Breton Queens Halifax
2006 2011
6
Source: Statistics Canada, Census of Canada

Dwellings by Regional Municipality
Dwellings by Regional Municipality
2006 2011 % Ch2006 2011 % Change
Cape Breton 42,026 41,122 -2.15
Queens 4,700 4,798 2.09
Halifax 155,060 165,033 6.43
120,000
140,000
160,000
180,000
40,000
60,000
80,000
100,000
,
-
20,000
Cape Breton Queens Halifax
2006 2011
7
Source: Statistics Canada 2006 Census

Population by Rural Municipality
Population by Rural Municipality2006 2011 % Change
Guysborough 4,681 4,189 -10.51y gSt. Mary's 2,587 2,354 -9.01Shelburne 4,828 4,408 -8.70Victoria 7,186 6,597 -8.20Inverness 14,896 13,781 -7.49Digby 7,986 7,463 -6.55Clare 8,813 8,319 -5.61Richmond 9,296 8,812 -5.21Argyle 8,656 8,252 -4.67Barrington 7,331 6,994 -4.60Cumberland 16,021 15,312 -4.43Annapolis 18,141 17,577 -3.11Yarmouth 10,304 10,105 -1.93Chester 10,741 10,599 -1.32Pictou 21,553 21,278 -1.28Kings 47,814 47,569 -0.51Lunenburg 25,164 25,118 -0.18Colchester 36,134 36,624 1.36Hants West 13,881 14,165 2.05Antigonish 14,239 14,692 3.18Hants East 21,387 22,111 3.39
8
Source: Statistics Canada, Census of Canada
Dwellings by Rural Municipality
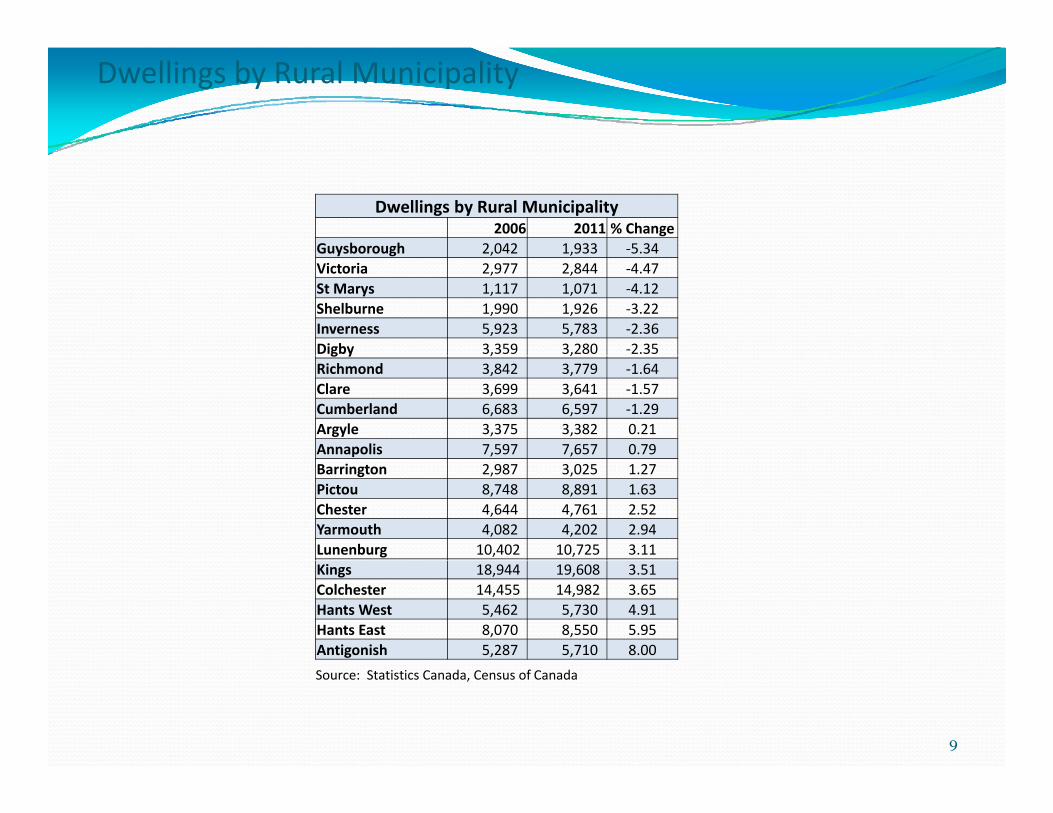
Dwellings by Rural Municipality2006 2011 % Change
Guysborough 2,042 1,933 -5.34Guysborough 2,042 1,933 5.34Victoria 2,977 2,844 -4.47St Marys 1,117 1,071 -4.12Shelburne 1,990 1,926 -3.22Inverness 5,923 5,783 -2.36Digby 3,359 3,280 -2.35g y , ,Richmond 3,842 3,779 -1.64Clare 3,699 3,641 -1.57Cumberland 6,683 6,597 -1.29Argyle 3,375 3,382 0.21Annapolis 7,597 7,657 0.79Barrington 2,987 3,025 1.27Pictou 8,748 8,891 1.63Chester 4,644 4,761 2.52Yarmouth 4,082 4,202 2.94Lunenburg 10,402 10,725 3.11Kings 18,944 19,608 3.51Colchester 14,455 14,982 3.65Hants West 5,462 5,730 4.91Hants East 8,070 8,550 5.95Antigonish 5,287 5,710 8.00
9
Source: Statistics Canada, Census of Canada

Population by Town
Population by TownTown 2006 2011 % Change Town 2006 2011 % Change
Canso 911 806 -11.53 Westville 3,805 3,798 -0.18Shelburne 1,879 1,686 -10.27 Lunenburg 2,317 2,313 -0.17Pictou 3,813 3,437 -9.86 Berwick 2,454 2,454 0.00
Mulgrave 879 794 9 67 New Glasgow 9 455 9 562 1 13Mulgrave 879 794 -9.67 New Glasgow 9,455 9,562 1.13
Lockeport 646 588 -8.98 Stewiacke 1,421 1,438 1.20Parrsboro 1,401 1,305 -6.85 Windsor 3,709 3,785 2.05Yarmouth 7,162 6,761 -5.60 Amherst 9,505 9,717 2.23Stellarton 4 717 4 485 -4 92 Truro 11 765 12 059 2 50Stellarton 4,717 4,485 4.92 Truro 11,765 12,059 2.50
Clark's Harbour 860 820 -4.65 Digby 2,092 2,152 2.87Trenton 2,741 2,616 -4.56 Bridgewater 7,944 8,241 3.74Middleton 1,829 1,749 -4.37 Mahone Bay 904 943 4.31Port Hawkesbury 3,517 3,366 -4.29 Kentville 5,815 6,094 4.80o a esbu y , , e e , ,Hantsport 1,191 1,159 -2.69 Antigonish 4,236 4,524 6.80
Bridgetown 972 949 -2.37 Annapolis Royal 444 481 8.33Oxford 1,178 1,151 -2.29 Wolfville 3,772 4,269 13.18Springhill 3,941 3,868 -1.85
10
Source: Statistics Canada, Census of Canada
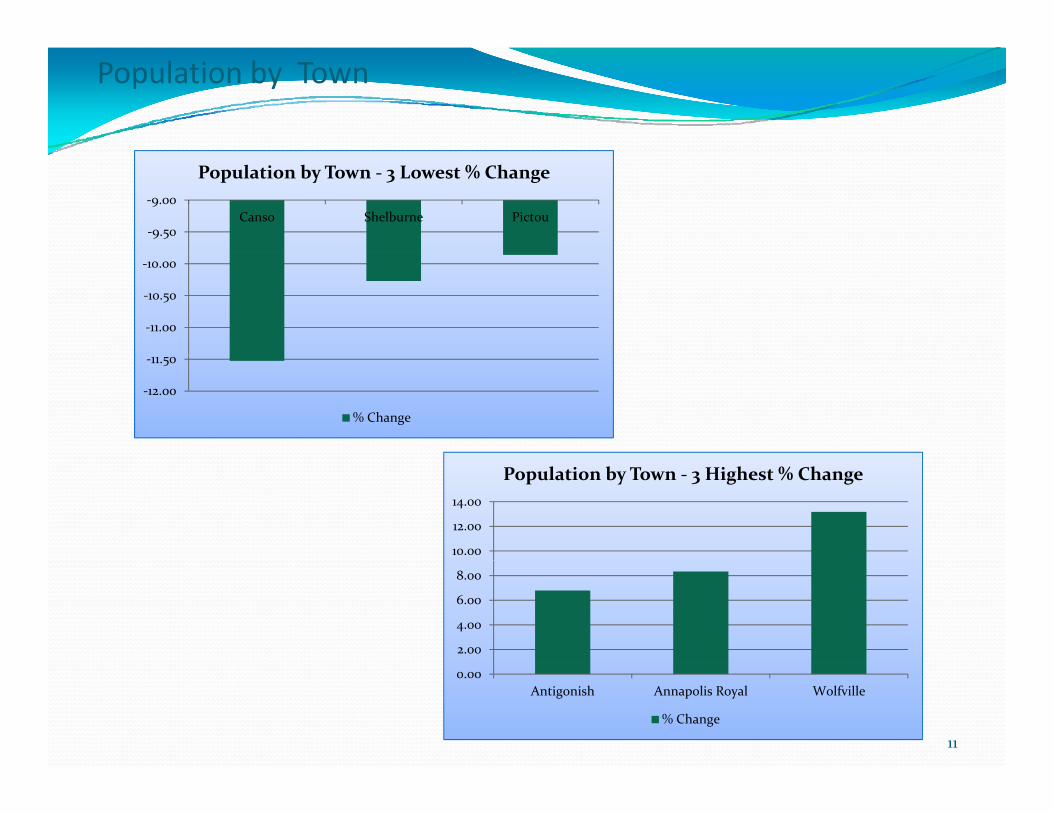
Population by Town
-9.50
-9.00Canso Shelburne Pictou
Population by Town - 3 Lowest % Change
-11.00
-10.50
-10.00
-12.00
-11.50
% Change
10.00
12.00
14.00
Population by Town - 3 Highest % Change
2.00
4.00
6.00
8.00
11
0.00Antigonish Annapolis Royal Wolfville
% Change
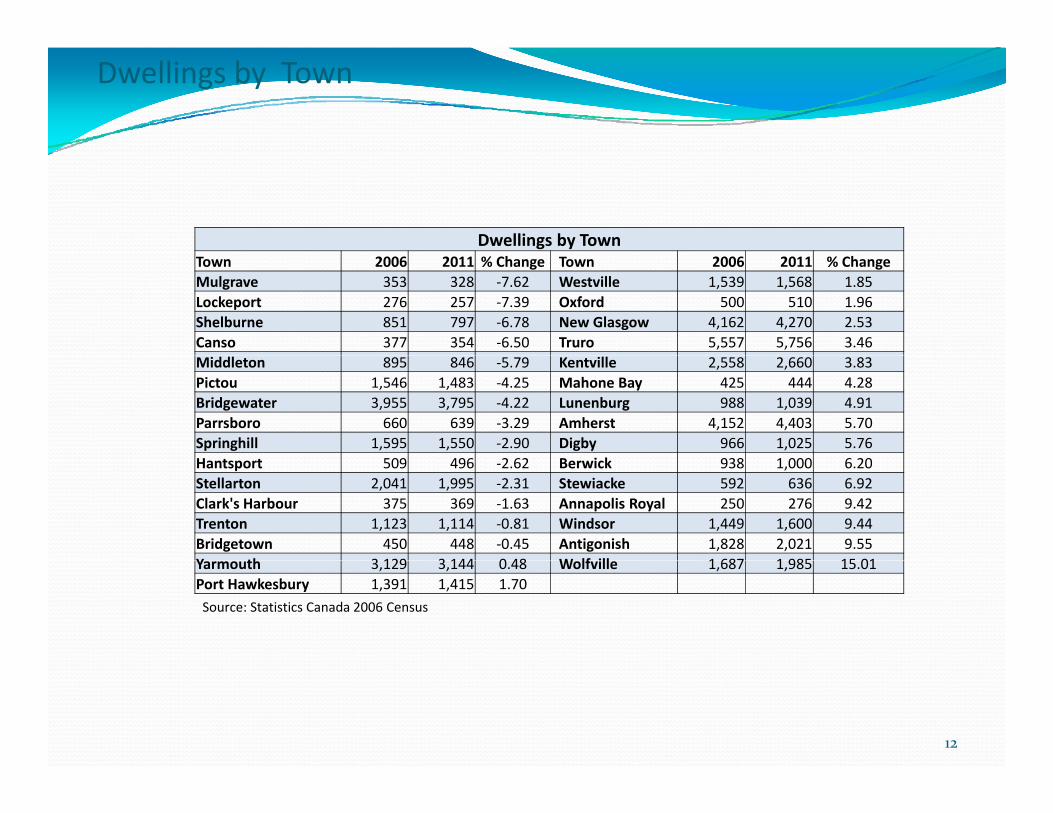
Dwellings by Town
Dwellings by TownTown 2006 2011 % Change Town 2006 2011 % ChangeMulgrave 353 328 -7.62 Westville 1,539 1,568 1.85Lockeport 276 257 -7.39 Oxford 500 510 1.96Shelburne 851 797 -6.78 New Glasgow 4,162 4,270 2.53Canso 377 354 -6.50 Truro 5,557 5,756 3.46Middleton 895 846 -5.79 Kentville 2,558 2,660 3.83Pictou 1,546 1,483 -4.25 Mahone Bay 425 444 4.28Bridgewater 3,955 3,795 -4.22 Lunenburg 988 1,039 4.91Parrsboro 660 639 -3.29 Amherst 4,152 4,403 5.70Springhill 1,595 1,550 -2.90 Digby 966 1,025 5.76
09 96 2 62 i k 938 000 6 20Hantsport 509 496 -2.62 Berwick 938 1,000 6.20Stellarton 2,041 1,995 -2.31 Stewiacke 592 636 6.92Clark's Harbour 375 369 -1.63 Annapolis Royal 250 276 9.42Trenton 1,123 1,114 -0.81 Windsor 1,449 1,600 9.44Bridgetown 450 448 -0.45 Antigonish 1,828 2,021 9.55Y th 3 129 3 144 0 48 W lf ill 1 687 1 985 15 01Yarmouth 3,129 3,144 0.48 Wolfville 1,687 1,985 15.01Port Hawkesbury 1,391 1,415 1.70Source: Statistics Canada 2006 Census
12

Regional Municipalities as a % of Nova Scotia Population
Regional Municipalities as a % of Nova Scotia PopulationRegional Municipalities 2006 2011 DifferenceRegional Municipalities 2006 2011 DifferenceCape Breton 11.19 10.57 -0.63Queens 1.22 1.18 -0.04Halifax 40.80 42.32 1.52
30.00
35.00
40.00
45.00
5.00
10.00
15.00
20.00
25.00
0.00Cape Breton Halifax Queens
2006 2011
Source: Statistics Canada, Census of Canada
13
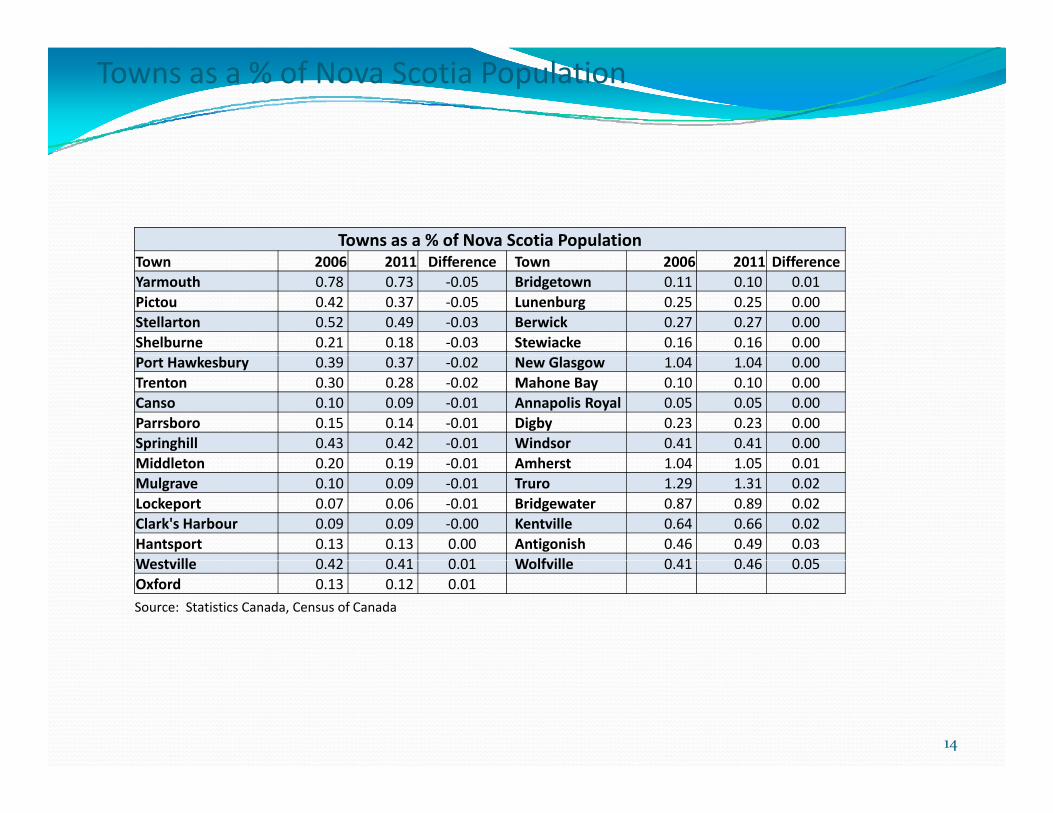
Towns as a % of Nova Scotia Population
Towns as a % of Nova Scotia PopulationTown 2006 2011 Difference Town 2006 2011 DifferenceYarmouth 0.78 0.73 -0.05 Bridgetown 0.11 0.10 0.01Pictou 0.42 0.37 -0.05 Lunenburg 0.25 0.25 0.00Stellarton 0.52 0.49 -0.03 Berwick 0.27 0.27 0.00Shelburne 0.21 0.18 -0.03 Stewiacke 0.16 0.16 0.00Port Hawkesbury 0.39 0.37 -0.02 New Glasgow 1.04 1.04 0.00Trenton 0.30 0.28 -0.02 Mahone Bay 0.10 0.10 0.00Canso 0.10 0.09 -0.01 Annapolis Royal 0.05 0.05 0.00Parrsboro 0.15 0.14 -0.01 Digby 0.23 0.23 0.00Springhill 0.43 0.42 -0.01 Windsor 0.41 0.41 0.00
iddl 0 20 0 9 0 0 h 0 0 0 0Middleton 0.20 0.19 -0.01 Amherst 1.04 1.05 0.01Mulgrave 0.10 0.09 -0.01 Truro 1.29 1.31 0.02Lockeport 0.07 0.06 -0.01 Bridgewater 0.87 0.89 0.02Clark's Harbour 0.09 0.09 -0.00 Kentville 0.64 0.66 0.02Hantsport 0.13 0.13 0.00 Antigonish 0.46 0.49 0.03W t ill 0 42 0 41 0 01 W lf ill 0 41 0 46 0 05Westville 0.42 0.41 0.01 Wolfville 0.41 0.46 0.05Oxford 0.13 0.12 0.01Source: Statistics Canada, Census of Canada
14
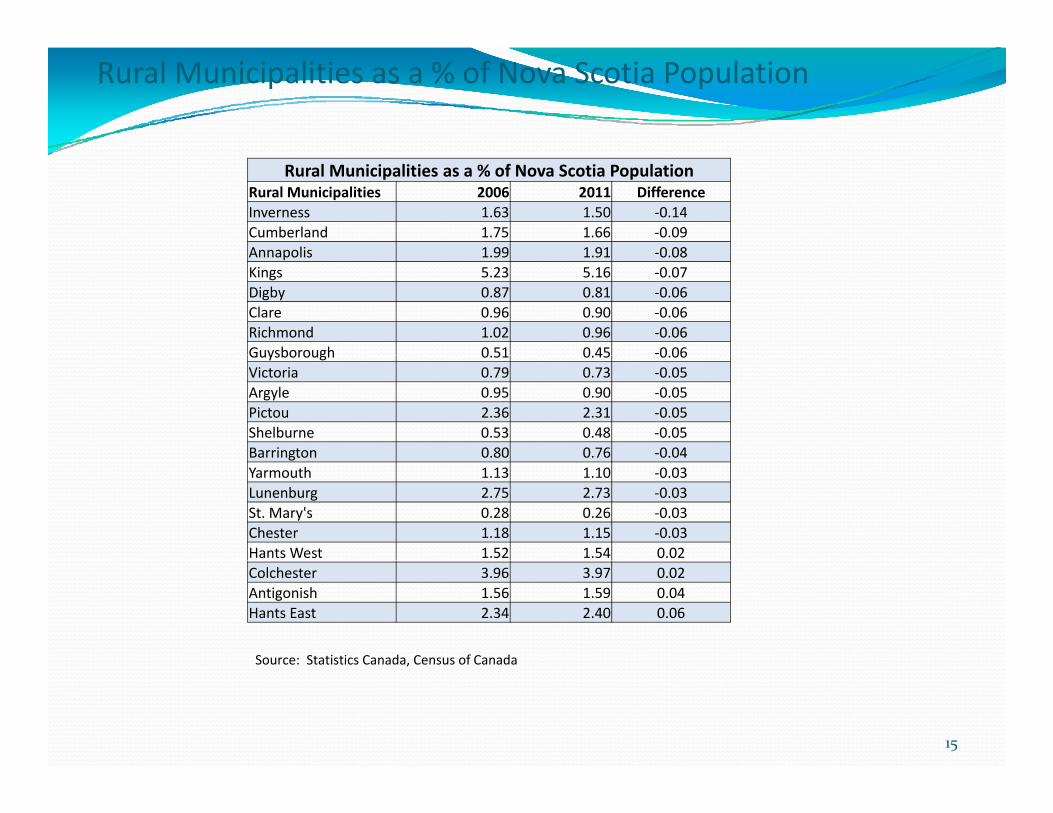
Rural Municipalities as a % of Nova Scotia Population
Rural Municipalities as a % of Nova Scotia PopulationRural Municipalities 2006 2011 DifferenceInverness 1.63 1.50 -0.14Cumberland 1.75 1.66 -0.09Annapolis 1 99 1 91 -0 08Annapolis 1.99 1.91 -0.08Kings 5.23 5.16 -0.07Digby 0.87 0.81 -0.06Clare 0.96 0.90 -0.06Richmond 1.02 0.96 -0.06Guysborough 0 51 0 45 -0 06Guysborough 0.51 0.45 0.06Victoria 0.79 0.73 -0.05Argyle 0.95 0.90 -0.05Pictou 2.36 2.31 -0.05Shelburne 0.53 0.48 -0.05Barrington 0.80 0.76 -0.04gYarmouth 1.13 1.10 -0.03Lunenburg 2.75 2.73 -0.03St. Mary's 0.28 0.26 -0.03Chester 1.18 1.15 -0.03Hants West 1.52 1.54 0.02Colchester 3.96 3.97 0.02Antigonish 1.56 1.59 0.04Hants East 2.34 2.40 0.06
Source: Statistics Canada, Census of Canada
15
Source: Statistics Canada, Census of Canada

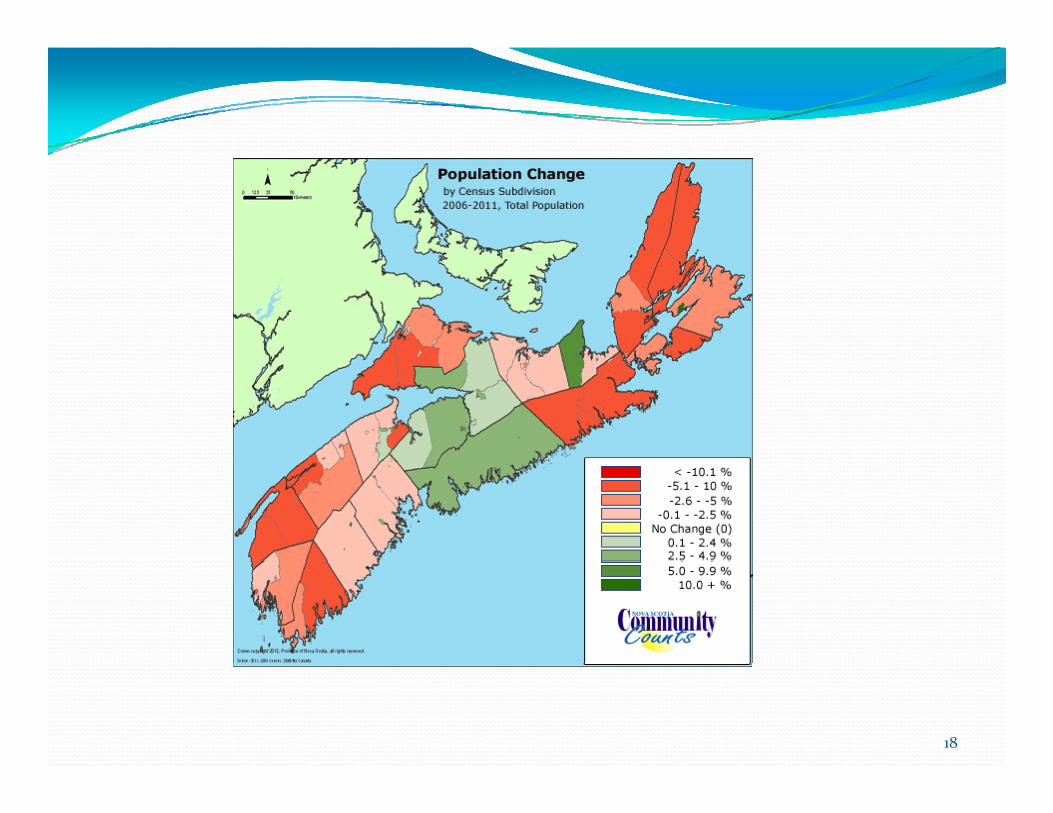
Policy Issues
Slowing Population Ageing Population
HRM Area Concentrated Population
16
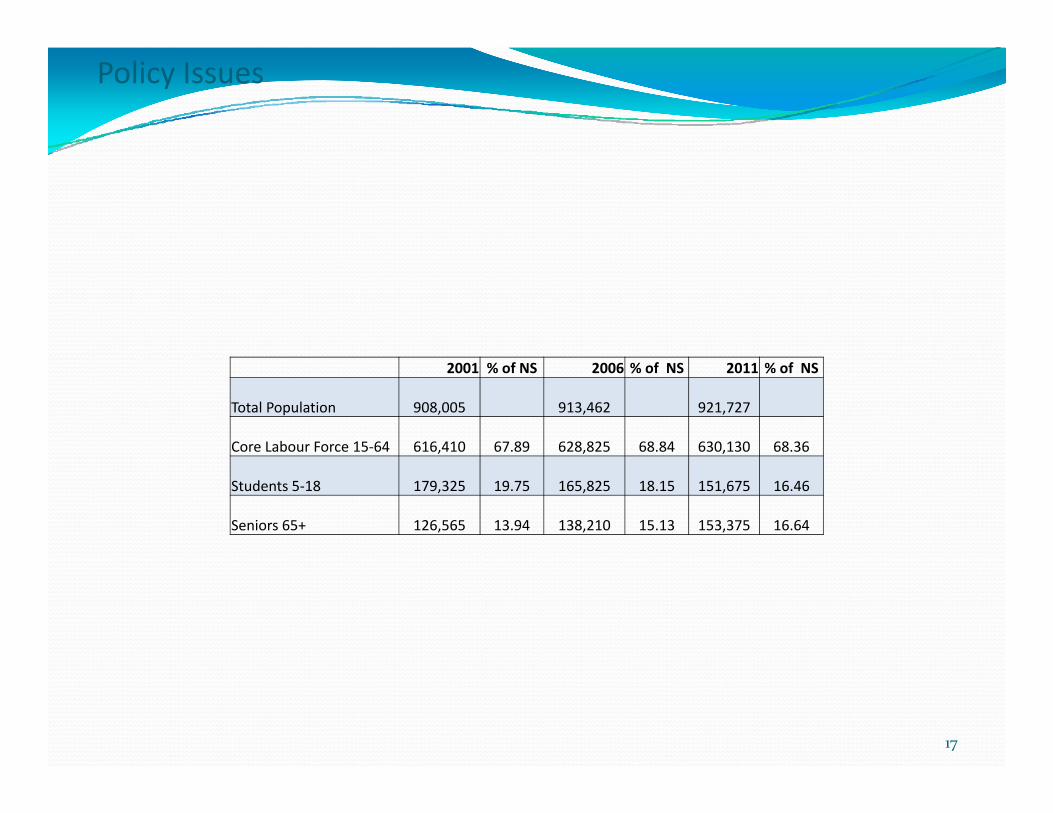
Policy Issues
2001 % of NS 2006 % of NS 2011 % of NS
Total Population 908,005 913,462 921,727
Core Labour Force 15-64 616,410 67.89 628,825 68.84 630,130 68.36
Students 5-18 179,325 19.75 165,825 18.15 151,675 16.46
Seniors 65+ 126,565 13.94 138,210 15.13 153,375 16.64
17
18
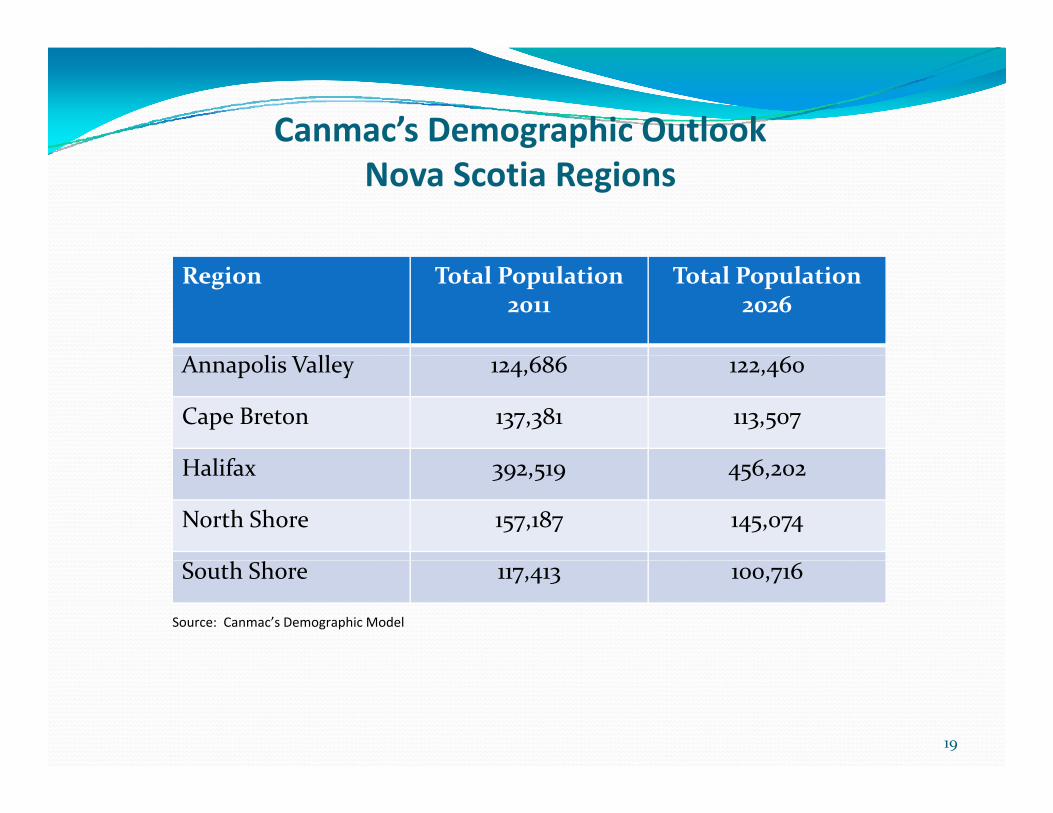
Canmac’s Demographic OutlookNova Scotia Regions
Region Total Population2011
Total Population2026
l llAnnapolis Valley 124,686 122,460
Cape Breton 137,381 113,507
l fHalifax 392,519 456,202
North Shore 157,187 145,074
South Shore 117,413 100,716
Source: Canmac’s Demographic Model
19