cap type diabetes mellitus x20299allp1
DESCRIPTION
Age - Related Diabetes type 1 DM type 1 for children related,TRANSCRIPT

CHAPTER 236 TYPE 1 DIABETES MELLITUS e78
Incidence and PrevalencePrevalence rates for type 1 diabetes are relatively accurate because these patients invariably become symptomatic. In the United States, this is approxi-mately 0.3%, with an annual incidence in youths of approximately 19 per 100,000. Type 1 diabetes is more prevalent in Finland, Scandinavia, and the United Kingdom; less prevalent in most of southern Europe and the Middle East; and relatively uncommon in Asian nations. The annual incidence appears to have risen in the last half century, which could imply the introduc-tion of unidentified environmental factors. Prevalence rates are strikingly different among ethnic groups living in the same geographic region, probably because of genetic differences in susceptibility to the disease.
The recognition that type 1 diabetes has a protracted preclinical phase has shed new light on some epidemiologic characteristics of the disease. Type 1 diabetes has an increased incidence in the winter months and may be associ-ated with specific viral epidemics. These observations may be explained in part by the superimposition of illness-provoked insulin resistance in patients with marginal β-cell function. Similarly, the common appearance of type 1 diabetes during puberty may be attributed to insulin resistance; even under normal circumstances, puberty is accompanied by impaired insulin-stimulated glucose metabolism. New methods for tracking islet-directed autoimmunity have led to a reappraisal of the age at which type 1 diabetes first appears. Although the age-specific incidence rises progressively from infancy to puberty and then declines, incidence rates persist at low levels for many decades; in fact, nearly 30% of patients are diagnosed after the age of 20 years. In patients with a later onset, the clinical syndrome tends to evolve more slowly; in addition, islet-directed antibody titers may be lower, and human leukocyte antigen (HLA) types may be different from those of younger patients. As a result, type 1 diabetes is initially misdiagnosed as type 2 in many of these patients.
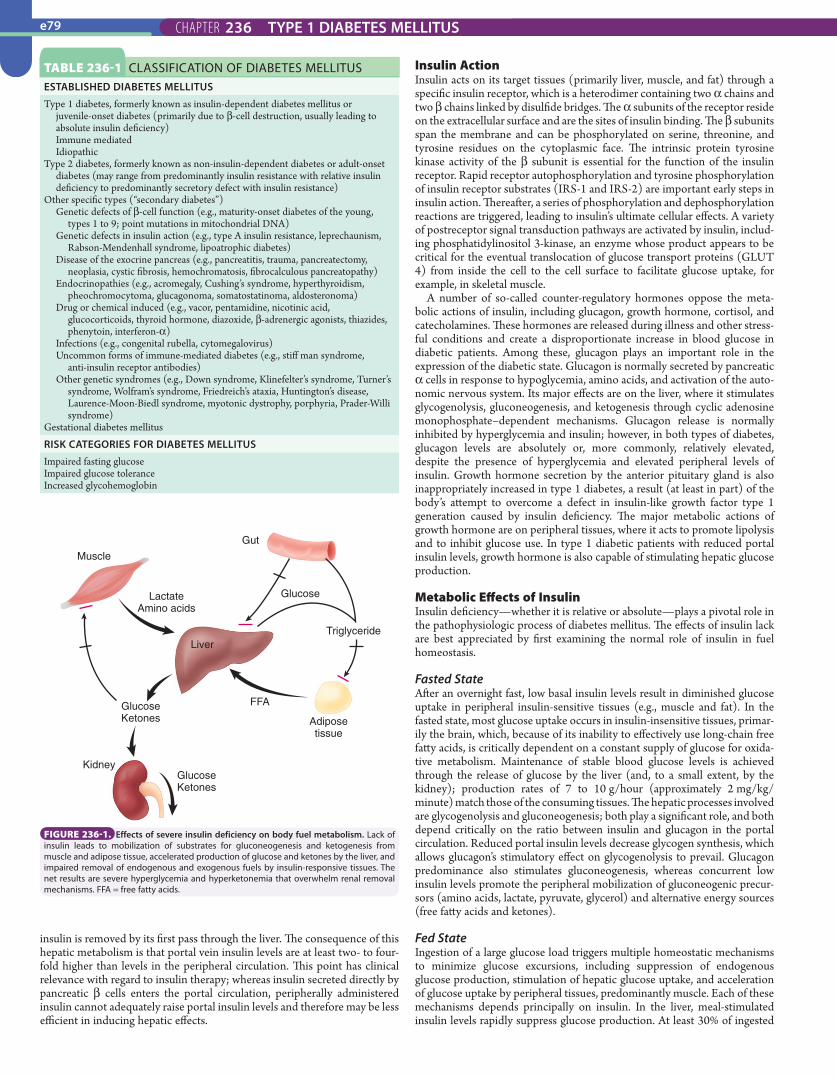
PATHOBIOLOGYFigure 236-1 summarizes the effects of insulin deficiency on body fuel metabolism.
Insulin Secretion and ActionThe gene coding for human insulin is located on the short arm of chromo-some 11. Insulin is initially synthesized in pancreatic β cells as proinsulin, a single-chain, 86–amino acid polypeptide. Subsequent cleavage of proinsulin removes a connecting strand (C-peptide) to form the smaller, double-chain insulin molecule, which contains 51 amino acid residues. Both insulin and the C-peptide remnant are packaged in membrane-bound storage granules; stimulation of insulin secretion results in the discharge of equimolar amounts of insulin and C-peptide (and a small amount of proinsulin) into the portal circulation. Whereas a large proportion of insulin is bound to its receptor and subsequently metabolized during its first pass through the liver, the C-peptide fragment largely escapes hepatic metabolism; as a result, peripheral C-peptide levels provide a more precise marker of endogenous insulin secretion.
Glucose ConcentrationGlucose concentration is the key regulator of insulin secretion. For the activa-tion of secretion, a glucose molecule must first be transported by a protein (GLUT 2) into the β cell, phosphorylated by the enzyme glucokinase, and metabolized. The precise triggering process is poorly understood but prob-ably involves activation of signal transduction pathways and mitochondrial signals, closure of adenosine triphosphate–sensitive potassium channels, and calcium entry into the cytoplasm of the β cell. Normally, when the blood glucose concentration rises even slightly above fasting levels, β cells secrete insulin, initially from preformed (stored) insulin and later from de novo insulin synthesis as well. The magnitude of the insulin response is determined by the level of glucose as well as by the mode of glucose entry; compared with intravenous administration, higher insulin levels are produced when glucose is given orally because of the simultaneous release of gut peptides known as incretins (e.g., glucagon-like peptide-1 [GLP-1], glucose-dependent insulinotropic peptide [GIP, formerly, gastric inhibitory polypeptide]), which amplify the insulin response (see The Role of the Incretins later).
Other SecretagoguesOther insulin secretagogues include amino acids (e.g., leucine), vagal stimula-tion, sulfonylurea drugs, repaglinide, nateglinide, and agents that modulate the incretin system, such as GLP-1 agonists and dipeptidyl peptidase (DPP)-IV inhibitors. Once it is secreted into the portal vein, 50% or more of
236 TYPE 1 DIABETES MELLITUSSILVIO E. INZUCCHI AND ROBERT S. SHERWIN
TYPE 1 DIABETES MELLITUS
DEFINITIONDiabetes mellitus is a chronic disorder characterized by hyperglycemia and the late development of vascular and neuropathic complications. Regardless of its cause, the disease is associated with a common hormonal defect—namely, insulin deficiency—that may be absolute or relative in the context of coexisting insulin resistance. The effect of insufficient insulin plays a primary role in the metabolic derangements linked to diabetes; hyperglycemia, in turn, plays an important role in disease-related complications.
CLASSIFICATIONThe American Diabetes Association classification scheme for diabetes mel-litus is summarized in Table 236-1. Clinical diabetes is divided into four general subclasses: type 1, primarily caused by autoimmune pancreatic β-cell destruction and characterized by absolute insulin deficiency; type 2, characterized by insulin resistance and relative insulin deficiency; other spe-cific types of diabetes (associated with identifiable clinical conditions or syndromes); and gestational diabetes mellitus. In addition to these clinical categories, impaired glucose tolerance, impaired fasting glucose, and a high glycohemoglobin (hemoglobin A1c [HbA1c] 5.7 to 6.4%), sometimes referred to as prediabetes, describe intermediate metabolic states between normal glucose homeostasis and overt diabetes. Both impaired glucose tol-erance and impaired fasting glucose significantly increase the risk for the future development of diabetes mellitus and in many cases are part of the disease’s natural history. Patients with any form of diabetes may require insulin therapy; for this reason, the previously used terms insulin-dependent diabetes (type 1) and non-insulin-dependent diabetes (type 2) have been eliminated.
EPIDEMIOLOGYIn 2008 the Centers for Disease Control and Prevention estimated that nearly 24 million Americans (or nearly 8% of the U.S. population) fulfilled the diagnostic criteria for diabetes mellitus. Most (90 to 95%) have type 2 dia-betes, and approximately one in four of these individuals is unaware of the diagnosis (Chapter 237). In those older than 60 years, the prevalence is now estimated at almost 25%. An additional 57 million Americans have pre-diabetes. Since 1980, the prevalence of diabetes in the United States has more than quadrupled. The number of affected patients continues to rise, with current estimates exceeding 1.6 million new cases per year in those older than 20 years. The most recent estimates of diabetes in youth reveal that approxi-mately 15,000 are diagnosed with type 1 diabetes and nearly 4000 with type 2 diabetes each year. It is estimated that one of every three Americans born in the past decade will develop diabetes in their lifetime. Diabetes is the fourth most common reason for contact with a physician, accounting for approximately 14% of U.S. health care dollars and total annual costs exceed-ing $174 billion in 2007—$116 billion in direct medical costs, and another $58 billion in indirect costs due to losses in productivity. Worldwide, diabetes affects more than 220 million people; this figure is projected to double by the year 2030. The rate of increase in diabetes is greatest in developing nations as a result of urbanization and Westernization of lifestyle habits where barri-ers still exist to proper diagnosis and treatment.
Diabetes is a leading cause of both mortality and early disability; in the United States, it is the leading cause of blindness among working-age adults, end-stage renal disease, and nontraumatic limb amputation. Diabetes increases the risk of cardiac, cerebral, and peripheral vascular disease two- to seven-fold and is a major contributor to neonatal morbidity and mortality. A growing body of evidence, however, suggests that most if not all of the debili-tating complications of diabetes can be prevented or delayed by the prospec-tive treatment of hyperglycemia and other cardiovascular risk factors. In treating diabetes, the timing of therapy is crucial; clinical outcomes depend on early recognition and treatment of the disease.
CHAPTER 236 TYPE 1 DIABETES MELLITUSe79
Insulin ActionInsulin acts on its target tissues (primarily liver, muscle, and fat) through a specific insulin receptor, which is a heterodimer containing two α chains and two β chains linked by disulfide bridges. The α subunits of the receptor reside on the extracellular surface and are the sites of insulin binding. The β subunits span the membrane and can be phosphorylated on serine, threonine, and tyrosine residues on the cytoplasmic face. The intrinsic protein tyrosine kinase activity of the β subunit is essential for the function of the insulin receptor. Rapid receptor autophosphorylation and tyrosine phosphorylation of insulin receptor substrates (IRS-1 and IRS-2) are important early steps in insulin action. Thereafter, a series of phosphorylation and dephosphorylation reactions are triggered, leading to insulin’s ultimate cellular effects. A variety of postreceptor signal transduction pathways are activated by insulin, includ-ing phosphatidylinositol 3-kinase, an enzyme whose product appears to be critical for the eventual translocation of glucose transport proteins (GLUT 4) from inside the cell to the cell surface to facilitate glucose uptake, for example, in skeletal muscle.
A number of so-called counter-regulatory hormones oppose the meta-bolic actions of insulin, including glucagon, growth hormone, cortisol, and catecholamines. These hormones are released during illness and other stress-ful conditions and create a disproportionate increase in blood glucose in diabetic patients. Among these, glucagon plays an important role in the expression of the diabetic state. Glucagon is normally secreted by pancreatic α cells in response to hypoglycemia, amino acids, and activation of the auto-nomic nervous system. Its major effects are on the liver, where it stimulates glycogenolysis, gluconeogenesis, and ketogenesis through cyclic adenosine monophosphate–dependent mechanisms. Glucagon release is normally inhibited by hyperglycemia and insulin; however, in both types of diabetes, glucagon levels are absolutely or, more commonly, relatively elevated, despite the presence of hyperglycemia and elevated peripheral levels of insulin. Growth hormone secretion by the anterior pituitary gland is also inappropriately increased in type 1 diabetes, a result (at least in part) of the body’s attempt to overcome a defect in insulin-like growth factor type 1 generation caused by insulin deficiency. The major metabolic actions of growth hormone are on peripheral tissues, where it acts to promote lipolysis and to inhibit glucose use. In type 1 diabetic patients with reduced portal insulin levels, growth hormone is also capable of stimulating hepatic glucose production.
Metabolic Effects of InsulinInsulin deficiency—whether it is relative or absolute—plays a pivotal role in the pathophysiologic process of diabetes mellitus. The effects of insulin lack are best appreciated by first examining the normal role of insulin in fuel homeostasis.
Fasted StateAfter an overnight fast, low basal insulin levels result in diminished glucose uptake in peripheral insulin-sensitive tissues (e.g., muscle and fat). In the fasted state, most glucose uptake occurs in insulin-insensitive tissues, primar-ily the brain, which, because of its inability to effectively use long-chain free fatty acids, is critically dependent on a constant supply of glucose for oxida-tive metabolism. Maintenance of stable blood glucose levels is achieved through the release of glucose by the liver (and, to a small extent, by the kidney); production rates of 7 to 10 g/hour (approximately 2 mg/kg/minute) match those of the consuming tissues. The hepatic processes involved are glycogenolysis and gluconeogenesis; both play a significant role, and both depend critically on the ratio between insulin and glucagon in the portal circulation. Reduced portal insulin levels decrease glycogen synthesis, which allows glucagon’s stimulatory effect on glycogenolysis to prevail. Glucagon predominance also stimulates gluconeogenesis, whereas concurrent low insulin levels promote the peripheral mobilization of gluconeogenic precur-sors (amino acids, lactate, pyruvate, glycerol) and alternative energy sources (free fatty acids and ketones).
Fed StateIngestion of a large glucose load triggers multiple homeostatic mechanisms to minimize glucose excursions, including suppression of endogenous glucose production, stimulation of hepatic glucose uptake, and acceleration of glucose uptake by peripheral tissues, predominantly muscle. Each of these mechanisms depends principally on insulin. In the liver, meal-stimulated insulin levels rapidly suppress glucose production. At least 30% of ingested
Muscle
Gut
Adiposetissue
Liver
Kidney
GlucoseKetones
GlucoseKetones
FFA
Triglyceride
GlucoseLactateAmino acids
FIGURE 236-1. Effects of severe insulin deficiency on body fuel metabolism. Lack of insulin leads to mobilization of substrates for gluconeogenesis and ketogenesis from muscle and adipose tissue, accelerated production of glucose and ketones by the liver, and impaired removal of endogenous and exogenous fuels by insulin-responsive tissues. The net results are severe hyperglycemia and hyperketonemia that overwhelm renal removal mechanisms. FFA = free fatty acids.
insulin is removed by its first pass through the liver. The consequence of this hepatic metabolism is that portal vein insulin levels are at least two- to four-fold higher than levels in the peripheral circulation. This point has clinical relevance with regard to insulin therapy; whereas insulin secreted directly by pancreatic β cells enters the portal circulation, peripherally administered insulin cannot adequately raise portal insulin levels and therefore may be less efficient in inducing hepatic effects.
TABLE 236-1 CLASSIFICATION OF DIABETES MELLITUSESTABLISHED DIABETES MELLITUSType 1 diabetes, formerly known as insulin-dependent diabetes mellitus or
juvenile-onset diabetes (primarily due to β-cell destruction, usually leading to absolute insulin deficiency)Immune mediatedIdiopathic
Type 2 diabetes, formerly known as non-insulin-dependent diabetes or adult-onset diabetes (may range from predominantly insulin resistance with relative insulin deficiency to predominantly secretory defect with insulin resistance)
Other specific types (“secondary diabetes”)Genetic defects of β-cell function (e.g., maturity-onset diabetes of the young,
types 1 to 9; point mutations in mitochondrial DNA)Genetic defects in insulin action (e.g., type A insulin resistance, leprechaunism,
Rabson-Mendenhall syndrome, lipoatrophic diabetes)Disease of the exocrine pancreas (e.g., pancreatitis, trauma, pancreatectomy,
neoplasia, cystic fibrosis, hemochromatosis, fibrocalculous pancreatopathy)Endocrinopathies (e.g., acromegaly, Cushing’s syndrome, hyperthyroidism,
pheochromocytoma, glucagonoma, somatostatinoma, aldosteronoma)Drug or chemical induced (e.g., vacor, pentamidine, nicotinic acid,
glucocorticoids, thyroid hormone, diazoxide, β-adrenergic agonists, thiazides, phenytoin, interferon-α)
Infections (e.g., congenital rubella, cytomegalovirus)Uncommon forms of immune-mediated diabetes (e.g., stiff man syndrome,
anti-insulin receptor antibodies)Other genetic syndromes (e.g., Down syndrome, Klinefelter’s syndrome, Turner’s
syndrome, Wolfram’s syndrome, Friedreich’s ataxia, Huntington’s disease, Laurence-Moon-Biedl syndrome, myotonic dystrophy, porphyria, Prader-Willi syndrome)
Gestational diabetes mellitus
RISK CATEGORIES FOR DIABETES MELLITUSImpaired fasting glucoseImpaired glucose toleranceIncreased glycohemoglobin

CHAPTER 236 TYPE 1 DIABETES MELLITUS e80
glucose is deposited directly in the liver by glycogen synthesis and storage; concurrently, endogenous hepatic glucose production decreases and triglyc-eride synthesis increases. Peripherally, insulin-stimulated glucose transport across the cell membrane of both adipose and muscle tissue is attributable to the recruitment of glucose transport proteins (i.e., GLUT 4) from the cyto-solic compartment to the plasma membrane. In muscle, glucose may then be metabolized or converted to glycogen for storage. In adipose tissue, glucose is used primarily for the formation of α-glycerophosphate, which is necessary for the esterification of free fatty acids to form triglycerides for storage in adipose tissue.
The scenario described—the ingestion of large quantities of pure glucose—is not representative of conditions during ordinary meals. If the quantity of carbohydrate consumed and the resulting insulin response are small, glucose homeostasis is maintained largely by reduced net hepatic glucose production rather than by increased glucose uptake; this is because glucose production is much more sensitive than glucose uptake to the effects of small changes in insulin secretion. The rise in insulin that accompanies the consumption of mixed meals also facilitates protein and fat storage. Because muscle is in nega-tive nitrogen balance in the fasting state, repletion of muscle nitrogen depends on the net uptake of amino acids in response to protein feeding. In muscle, insulin acts to promote positive nitrogen balance by facilitating amino acid uptake, inhibiting the breakdown of protein, and (to a lesser extent) stimulat-ing new protein synthesis. In adipose tissue, the action of insulin accelerates triglyceride incorporation by stimulating lipoprotein lipase while simultane-ously inhibiting the hormone-sensitive lipase, which catalyzes the hydrolysis of stored triglycerides. In adipose tissue, the net effect of insulin is to inhibit lipolysis and to promote the synthesis and storage of triglycerides.
The Role of the IncretinsIt has long been recognized that an equivalent amount of carbohydrate administered by mouth generates a more robust pancreatic insulin response than when it is administered by vein. This “incretin” effect is the result of the secretion of insulinotropic peptides by the gut, in response to meals that augment insulin output. The best studied of these hormones, GLP-1, has additional beneficial effects on glucose homeostasis, including the attenua-tion of glucagon secretion, a slowing of gastric emptying, and a central nervous system effect to enhance satiety.
Metabolic Defects in DiabetesFasting HyperglycemiaIn both type 1 and type 2 diabetes, fasting hyperglycemia results mainly from an inappropriate increase in hepatic glucose production; this effect is magni-fied in type 1 diabetes owing to absolute portal insulin deficiency. Increased hepatic glucose production in both types of diabetes is mostly due to acceler-ated gluconeogenesis; the loss of insulin’s restraining effect on the α cell leads to a relative increase in portal glucagon levels, resulting in increased uptake and conversion of glycogenic substrates to glucose within the liver. Insulin deficiency in type 1 diabetes leads to the hypersecretion of growth hormone as well, which further accentuates glucose overproduction. In the extreme situation of total insulin lack, marked increases in counter-regulatory hormone release further stimulate gluconeogenesis while blocking compen-satory increases in glucose disposal. The clinical correlate is profound hyper-glycemia and glycosuria (see Fig. 236-1).
Postprandial HyperglycemiaDiabetes is also characterized by marked postprandial hyperglycemia. In type 2 diabetes, delayed insulin secretion and hepatic insulin resistance join forces to impair both the suppression of hepatic glucose production and the liver’s ability to store glucose as glycogen. Hyperglycemia ensues, even though insulin levels may eventually rise to exceed those seen in nondiabetic indi-viduals (insulin secretion remains deficient relative to the prevailing glucose level), because insulin resistance also reduces the capacity of myocytes to extract and store the ingested carbohydrate calories and the excess glucose released from the liver.
Under normal circumstances, insulin increases the levels of glucose-6-phosphate in muscle; this rise is markedly attenuated in diabetes, which implies that the block in glycogen synthesis and glucose metabolism precedes glucose-6-phosphate formation and thus is mediated at the level of glucose transport (by GLUT 4). The conversion of glucose to glucose-6-phosphate (by hexokinase) might contribute as well. These defects are more pronounced in patients with severe hyperglycemia, in whom insulin secretion is further reduced.
Type 1 patients show the most marked and prolonged elevations in blood glucose after the ingestion of carbohydrates. These individuals have low portal vein insulin levels, which cannot be reversed by current subcutaneous insulin therapy. Consequently, during hyperglycemia, the liver fails to arrest glucose production and fails to appropriately take up glucose for storage as glycogen. In addition, glucose uptake by peripheral tissues is impaired by the lack of insulin and by the development of insulin resistance secondary to chronic insulin deprivation and the toxic effects of chronic hyperglycemia. The net result is a gross defect in glucose disposal that can be compensated only partially by renal glycosuria.
Free Fatty AcidsIn addition to hyperglycemia, fasting free fatty acid levels are elevated in diabetes because of accelerated mobilization of fat stores. In type 2 diabetes, elevated free fatty acid levels occur in the presence of normal or even increased insulin levels, suggesting that adipocytes become resistant to insulin’s inhibi-tory effect on lipolysis. This adipocyte resistance ultimately leads to the mobi-lization and inappropriate deposition of triglyceride into liver and muscle, which in turn is linked to insulin resistance in these organs. This is most likely caused by the combination of excessive fatty acid delivery and the defective capacity of mitochondria in liver and muscle to oxidize them. It has recently been suggested that this leads to the intracellular net accumulation of diacyl-glycerol, which induces cellular changes that impair insulin signaling.
Although free fatty acids are not directly converted to glucose, they do promote hyperglycemia by providing the liver with energy to support gluco-neogenesis, as well as by impairing insulin signaling in muscle and liver. Endogenous insulin secretion in type 2 diabetes provides sufficient portal levels of insulin to suppress the conversion of free fatty acids to ketones in the liver. In type 1 diabetes, however, mobilized free fatty acids are more readily converted to ketone bodies. The combined effects of insulin defi-ciency and the presence of glucagon suppress fat synthesis in the liver. This suppression of fat synthesis reduces intrahepatic malonyl coenzyme A, which together with carnitine stimulates the activity of hepatic carnitine acyltransferase I and thereby facilitates the transfer of long-chain fatty acids into mitochondria, where they are broken down by β-oxidation and con-verted to ketone bodies. In addition, by decreasing ketone turnover, hypoin-sulinemia enhances the magnitude of the ketosis for any given level of ketone production. During diabetic ketoacidosis, ketone levels are further increased because of the concurrent release of counter-regulatory hormones. Glucagon levels rise, accelerating hepatic ketogenesis, whereas elevations of catecholamines, growth hormone, and cortisol act in concert to increase lipolysis and the subsequent delivery of free fatty acids to the liver (see Fig. 236-1). The increase in substrate delivery may become so pronounced that it saturates the oxidative pathway, leading to hepatic steatosis and severe hypertriglyceridemia.
HyperaminoacidemiaIn addition to disordered glucose disposal, type 1 diabetic patients may exhibit defects in the disposal of ingested proteins and fats. In the absence of the normal rise in insulin, meal ingestion may produce hyperaminoacidemia, because of a failure to stimulate the net uptake of amino acids in muscle, and hypertriglyceridemia, through the reduced activity of lipoprotein lipase. Thus, diabetes should be viewed not only as a disorder of glucose tolerance but also as a disorder of protein and fat tolerance.
PATHOGENESISType 1 diabetes produces profound β-cell failure with secondary insulin resistance, whereas type 2 diabetes is associated with less severe insulin defi-ciency but greater impairment of insulin action. Given their similarities overall, it is not surprising that the two major forms of diabetes share many pathophysiologic features. However, despite the apparent phenotypic simi-larity, the underlying pathogenetic mechanisms leading to type 1 and type 2 diabetes are strikingly different (see Chapter 237 for the pathogenesis of type 2 diabetes). Type 1 diabetes most likely results from an interplay of genetic, environmental, and autoimmune factors that selectively destroy insulin-producing β cells (Fig. 236-2).
Genetic FactorsThe role of genetic factors in type 1 diabetes is underscored by data in identi-cal twins showing concordance rates of 30 to 40%. It has been assumed that because concordance rates are not 100%, environmental factors must be important for disease expression. Although the presence of an environmental

CHAPTER 236 TYPE 1 DIABETES MELLITUSe81
an epitope resembling a β-cell protein, viral infection could theoretically abrogate self-tolerance and trigger autoimmunity. It has recently been sug-gested based on rodent models of type 1 diabetes that disease expression may also be influenced by the microorganisms present in the gastrointestinal tract, the greatest surface area for interaction with the environment.
Autoimmune FactorsAbout 80% of patients with new-onset type 1 diabetes have islet cell antibod-ies. Antibodies to a variety of β-cell constituents have been identified, includ-ing insulin, isoforms of glutamic acid decarboxylase (GAD 65 and GAD 67), and the secretory granule protein islet cell antigen (ICA) 512 or IA-2, which contains a tyrosine phosphatase–like domain. The concept that type 1 diabe-tes is a chronic autoimmune disease with acute clinical manifestations is supported by the fact that islet antigen-directed antibodies may be present in asymptomatic first-degree relatives of patients. Such antibody-positive indi-viduals are at risk for the development of type 1 diabetes, although clinical onset may be delayed by many years. The likelihood of developing type 1 diabetes is greater than 50% if autoantibodies are present to more than one β-cell antigen (i.e., insulin, GAD 65, ICA 512); diabetes rarely develops in antibody-negative relatives. If antibodies appear at a young age, the risk for clinical diabetes is particularly high.
The listed antibodies appear to be markers for rather than the cause of β-cell injury. β-cell destruction (by apoptotic and cytotoxic mechanisms) is mediated by a variety of cytokines or by direct T-lymphocyte activity. Sup-porting this notion, type 1 diabetes has been transferred through bone marrow cells from a diabetic patient to a nondiabetic recipient. In addition, autopsies performed on patients who died soon after disease onset have shown islet-restricted monocytic cellular infiltrates (termed insulitis) that are composed of CD8+ and CD4+ T cells, macrophages, and B cells. Usually, as the disease progresses, the islets become completely devoid of β cells and inflammatory infiltrates; α, δ, and pancreatic polypeptide cells are left intact, thus illustrating the exquisite specificity of the autoimmune attack. At the time of clinical diagnosis, about 10 to 20% of the original β-cell mass typically remains (see Fig. 236-2). In most patients there is gradual loss of these remaining β cells; some patients continue to exhibit residual insulin produc-tion for many years. These patients are generally easier to control with insulin and have fewer complications.
A critical role for T cells is supported by studies involving pancreatic trans-plantation in identical twins. Monozygotic twins with diabetes who received kidney and pancreas grafts from their nondiabetic, genetically identical sib-lings required little or no immunosuppression for graft acceptance. Never-theless, the islets were soon selectively invaded by mononuclear cells, predominantly CD8+ T cells, with the subsequent recurrence of diabetes. Thus, decades after the original onset of the disease, the immune system retains the ability to selectively destroy β cells. Evidence implicating T cells also derives from clinical trials using immunosuppressive drugs. Drugs such as cyclosporine or antibodies directed against a component of the T-cell receptor (anti-CD3) or that alter antigen presentation by B cells (anti-CD20) slow the progression of recent-onset diabetes, but this effect is not sustained if immunosuppression is withdrawn. Further supporting data for T cells’ primary role derive from NOD mice, in which insulitis and islet auto-antibodies develop at about 4 weeks of age and diabetes ultimately develops after 12 to 24 weeks; in these mice, a variety of treatments designed to deplete T cells can prevent diabetes. Most important, adoptive transfer of T cells isolated from diabetic mouse donors into immune-incompetent NOD mice rapidly produces diabetes. Both CD4+ and CD8+ T cells are generally required for disease transfer, which suggests that both are necessary for disease expression. These diabetogenic T cells target specific β-cell antigens, including insulin and GAD. A likely role for GAD or insulin is also suggested by data showing that if NOD mice are made tolerant to GAD or insulin (or to peptides derived from these molecules) early in life, insulitis and diabetes fail to develop. In keeping with the concept of immunomodulation, admin-istration of a GAD vaccine reportedly slows the loss of β-cell function in patients with recent-onset diabetes. Finally, the chronic, smoldering nature of type 1 diabetes suggests the presence of regulatory or protective influ-ences. In keeping with this observation, T cells that release immunoregula-tory cytokines and, in turn, protect the islet from immune attack have been isolated from the islets of NOD mice. Such findings suggest that the rate of appearance and clinical expression of disease may be modulated by the balance between diabetogenic and protective populations of T cells. “Tipping the scales” in favor of protective T-cell proliferation is the goal of protective immunization.
00
50
100
1 2 3 4 5 6 7 8 9 10
Time (yrs)
Stablediabetes
Unstablediabetes
Impaired 1st-phaseinsulin secretion
DKAtrigger (illness?)
Islet cell–directed antibodies
+
T-cell–mediated β-cell injury
RegulatoryT-cells?
β-ce
ll m
ass
(%)
Geneticpredisposition
Environmentaltrigger (virus?)
FIGURE 236-2. Summary of the sequence of events that lead to pancreatic β-cell loss and ultimately to the clinical evolution of type 1 diabetes. DKA = diabetic ketoacidosis.
trigger is highly likely, even identical twins do not express identical T-cell receptor and immunoglobulin genes; as a result, total concordance might not be expected.
Although many of the genes linked to type 1 diabetes have not been identi-fied, some are known. HLA genes, located on the short arm of chromosome 6, clearly play a dominant role; in nonaffected siblings, the risk of developing diabetes is 15 to 20% if they are HLA identical, approximately 5% if they share one HLA gene, and less than 1% if no HLA genes are shared. Specific HLA haplotypes have been linked to type 1 diabetes; 90 to 95% of type 1 patients express DR3 or DR4 class II HLA molecules (compared with 50 to 60% of the general population), whereas 60% express both alleles—a rate more than 10-fold that of the general population. Another class II allele, DQB1*0602, has a negative association with the disease. Specific class II DQ haplotypes (e.g., DQ8 and DQ2) correlate even more strongly with disease susceptibility in white individuals; this susceptibility is associated with poly-morphisms of the allele encoding the β chain of the DQ class II HLA mol-ecule. The presence of aspartic acid at position 57 protects against disease, whereas substitution of a neutral amino acid at this position is associated with higher disease frequency. Other polymorphisms, such as the substitution of arginine at position 52 of the DQ α chain, may confer additional risk. Overall, it seems clear that significant genetic heterogeneity exists and that no single class II HLA gene accounts for all HLA-associated susceptibility to disease. Association of the disease with specific class II HLA genes implies the involvement of CD4+ T cells in the autoimmune process because these mol-ecules are critical for both the presentation of antigenic peptides to CD4+ T cells and the selection of the CD4+ T-cell repertoire in the thymus.
Other genes likely contribute to genetic susceptibility to type 1 diabetes. IDDM2 (chromosome 11p), a noncoding promoter region of the insulin gene, may influence insulin gene expression in the thymus and may therefore affect thymic selection of insulin-reactive T cells. CTLA4 (chromosome 2q) plays a role in T-cell action and regulation. Protein tyrosine phosphatase N22 (PTPN22) on chromosome 1 is also a regulator of T-cell activation. Many other genes have also been implicated, underscoring the polygenic nature of this disease.
Environmental FactorsAlthough environmental factors such as diet and toxins have been proposed as triggers of diabetes, most of the scientific attention has focused on putative viruses. Epidemics of mumps, congenital rubella, and coxsackievirus infec-tion have been associated with an increased frequency of type 1 diabetes. Moreover, specific and convincing examples of virus-induced diabetes have been reported. However, it is likely that acute, lytic viral infections are respon-sible for only an occasional case of diabetes. Instead, if viruses are involved, it is far more likely that they trigger an autoimmune response. If a virus contains

CHAPTER 236 TYPE 1 DIABETES MELLITUS e82
CLINICAL MANIFESTATIONSPatients with type 1 diabetes mellitus have little or no insulin secretory capac-ity and depend on exogenous insulin to prevent metabolic decompensation and death. Classically, symptoms appear relatively abruptly (i.e., over days or weeks) in previously healthy, nonobese children or young adults who may have close relatives with the disease but more commonly do not. Older patients often present more gradually. At the time of initial evaluation, most type 1 diabetic patients are ill and symptomatic, most commonly presenting with polyuria, polydipsia, polyphagia, blurred vision, fatigue, and weight loss; such patients may also present with ketoacidosis. Type 1 diabetes is believed to have a prolonged asymptomatic preclinical phase (often lasting years), during which pancreatic β cells are gradually destroyed by an autoimmune attack influenced by HLA and other genetic factors as well as by the environ-ment (see Fig. 236-2). In some patients an acute illness and the development of secondary insulin resistance may speed the transition from the preclinical phase to clinical disease.
Initially, most type 1 patients require high-dose insulin therapy to restore a disordered metabolism. However, a so-called honeymoon period may follow (lasting weeks or months), during which smaller doses of insulin are needed because of partial recovery of β-cell function and reversal of the insulin resistance caused by acute illness. Thereafter, insulin secretory capac-ity is gradually lost; in some patients, particularly older individuals, this process commonly takes several years, sometimes referred to as latent autoim-mune diabetes of adulthood. The rate of decline is slowed by intensive insulin therapy targeting near normoglycemia.
DIAGNOSISBecause diagnosis and screening are more germane to the evaluation of patients with type 2 diabetes or other forms of diabetes, this topic is reviewed in Chapter 237.
0
2
4
6
0
2
4
6
8
0
2
4
6
8
0
2
4
6
0
4
8
12
0
4
8
12
16
Rat
e pe
r 10
0 pa
tient
-yr
Primary Prevention
Retinopathy
Rat
e pe
r 10
0 pa
tient
-yr
Secondary Intervention
Retinopathy
Micro-albuminuria
Micro-albuminuria
Neuropathy
Neuropathy
Conventional care Intensive care
FIGURE 236-3. Summary of the results of the Diabetes Control and Complications Trial (DCCT).
In type 1 diabetes, the primary focus of treatment is to replace the insulin secretion that has been lost. A healthy lifestyle is also required to facilitate insulin therapy and to optimize health. In the short term, the goals of diabetes treatment are to optimize metabolic control, improve the patient’s sense of clinical well-being, and prevent long-term complications.
Management of ComplicationsRelation between Diabetes Control and Its Complications
Whether the vascular and neuropathic complications of diabetes mellitus can be prevented or delayed by improved glycemic control was debated for more than half a century. The definitive answer was provided by the Diabetes Control and Complications Trial (DCCT), a 9-year multicenter study involving 1441 type 1 patients aged 13 to 39 years who were randomly assigned to either intensive insulin therapy or conventional care. 1 The intensive therapy group used multiple insulin injections or an insulin pump to maintain pre-meal blood glucose levels of 70 to 120 mg/dL, postprandial blood levels of less than 180 mg/dL, and glycohemoglobin (HbA1c) values as close as possible to normal. In the conventional care group, the primary goal was simply to main-tain clinical well-being, usually with two injections per day. The DCCT achieved a clear separation of glucose levels between the two groups during the study period. HbA1c and mean glucose levels in the intensive therapy group were 1.5 to 2.0% and 60 to 80 mg/dL lower, respectively, than in those receiving con-ventional care. Intensive therapy reduced the development of retinopathy by 76% in the primary prevention group and the progression of retinopathy by 54% in the secondary intervention group (Fig. 236-3); the latter effect became apparent after only 4 years. In addition, intensive therapy reduced the risk of microalbuminuria by 39%, frank proteinuria by 54%, and clinical neuropathy by 60%. The incidence of major cardiovascular events also tended to be lower, but the number of events was insufficient for statistical proof; at the very least, intensive therapy did not pose a risk for macrovascular complications. An exponential relationship over time between the average blood glucose level (as reflected by HbA1c) and the progression of retinopathy in the intensive care group suggests that there may be no threshold level at which complications occur. These findings imply that any degree of improvement in glycemic control has benefit and that normalization of glucose levels is not required to slow the progression of diabetic complications.
However, the benefits achieved by intensive control in the DCCT were not without risk. Weight gain was more common in the intensive care group. Most important, the frequency of severe hypoglycemia (including multiple episodes in some patients) was three-fold higher in the intensive care group. It is reason-able to conclude that in some patients, the risks of intensive therapy may outweigh the benefits; possibly included are patients with recurrent severe
TREATMENT
hypoglycemia and decreased perception of hypoglycemia, patients with advanced complications that are less likely to benefit from glucose lowering, young children, and patients who are unable or unwilling to participate in their management (e.g., self-monitoring of blood glucose level). Such individuals are likely to benefit from less aggressive therapy designed to lower glucose levels moderately without the risk of hypoglycemia. Despite the higher rate of hypoglycemia, intensive therapy in the DCCT had no detectable long-term effects on cognitive function.
Translating these results into clinical practice remains a challenge because patients require significant motivation to comply with the intensive monitor-ing and insulin administration regimens necessary. Significant expertise is also required on the part of practitioners to manage these individuals properly on an ongoing basis. An important lesson from these studies is that successful treatment of diabetes is largely accomplished through the efforts of the patients themselves as well as by nurse educators, dietitians, and diabetes counselors.
In an update involving the original DCCT cohort, the Epidemiology of Dia-betes Interventions and Complications (EDIC) study, the beneficial effect of intensive glycemic control on microvascular complications persisted. 2 Even more important, the intensively treated group had long-lived cardiovascular benefits. Among the 1375 volunteers who agreed to participate in this obser-vational extension of the DCCT, the intensively treated patients had less than half the number of cardiovascular events (myocardial infarction, coronary revascularization, stroke) of the conventionally treated group (46 vs. 98 events) during a total of 17 years of follow-up. These results were all the more impres-sive because the mean HbA1c in the intensively treated group had actually risen to about 8% from about 7% during the EDIC study, whereas the conven-tionally treated group improved their mean HbA1c from about 9% to about 8%. Therefore, despite nearly equal glycemic control during most of the EDIC study, a persistent benefit in terms of macrovascular end points was observed after intensive treatment. Some have referred to this process as metabolic memory or the legacy effect of tight glucose control.
Medical TherapyInsulin Preparations and Pharmacokinetics
A variety of highly purified insulin preparations are commercially available (Table 236-2). Premixed insulin preparations are also available and offer added convenience for selected patients with residual endogenous insulin secretion. Nearly all insulin preparations contain 100 U/mL (U-100), although a more concentrated preparation of 500 U/mL (U-500) of regular insulin can be obtained for severely resistant patients.
CHAPTER 236 TYPE 1 DIABETES MELLITUSe83
Short- and Rapid-Acting Insulin PreparationsAfter subcutaneous injection, regular (R) insulin begins to act in about 30
minutes and should therefore be administered 20 to 30 minutes before a meal. Because it acts relatively quickly and has a relatively short duration of action (5 to 8 hours), it is effective for blunting postprandial glucose excursions and for facilitating rapid dose adjustments based on measured blood glucose values. The properties of regular insulin are especially helpful in managing glucose elevations that occur during illness or after the consumption of large meals. Given by intravenous infusion, regular insulin is also effective in the perioperative period and in the management of severely ill hospitalized patients and acute hyperglycemic complications.
In regular insulin preparations, insulin molecules exist predominantly in hexameric form. Before being absorbed, insulin hexamers must first be diluted in subcutaneous interstitial fluid, then dissociate into single molecules; this property accounts for the slightly delayed absorption of regular insulin from subcutaneous injection sites. Advances in recombinant DNA technology led to the development of several insulin analogues intended to limit this property, allowing more rapid absorption in an effort to more closely mimic the normal brisk increase in endogenously secreted insulin in response to meals. Insulin lispro was the first analogue approved by the Food and Drug Administration (FDA), with amino acids in positions B28 (lysine) and B29 (proline) reversed. Lispro thereby has a reduced capacity for hexameric self-association and is more rapidly absorbed. Its effects begin within 10 to 15 minutes of administra-tion and generally wane within 3 to 4 hours. In insulin aspart, a neutral proline residue at position B28 is replaced by negatively charged aspartic acid, result-ing in a reduced capacity for self-association and faster absorption. The phar-macokinetic properties of insulin aspart are similar to those of insulin lispro; insulin aspart may have a slightly longer duration of effect. In a third rapid-acting insulin, insulin glulisine, lysine in position B29 is replaced by glutamic acid, and asparagine at position B3 is replaced by lysine, with changes in polar-ity similar to those seen with lispro and aspart. Because of their quick onset of action, these analogues can be administered a shorter time before eating (<30 minutes), which greatly simplifies the planning and consumption of meals; also, because the effects wane more rapidly, there is a reduced risk of “late” hypoglycemia if the next meal is delayed. With their use, postprandial glucose and HbA1c reductions are equal to or better than those achieved with regular insulin, and there is a reduced incidence of delayed hypoglycemia. For these reasons, and because of their greater convenience and flexibility, rapid-acting analogues have become the standard in intensive treatment regimens. However, these differences in response are relatively modest, and these formu-lations are significantly more expensive than older insulins.
Intermediate- and Long-Acting Insulin PreparationsThe longer acting insulin preparations have been modified to delay their
absorption from injection sites, resulting in a longer duration of insulin activity. The addition of protamine and zinc yields intermediate-acting neutral pro-tamine Hagedorn (NPH) insulin. Ideally, NPH is given twice per day, offering a compromise between some degree of meal coverage (coinciding with peak activity) and the provision of basal insulin levels. It is likely the most cost-effective insulin product.
Insulin glargine, the first long-acting, basal insulin analogue, differs from human insulin both at position A21, where asparagine is replaced by glycine, and at the carboxyl terminus of the B chain, where two arginine residues have been added. Insulin glargine is soluble at acidic pH and less so in physiologic conditions; injected at a pH of 4, it is neutralized in subcutaneous tissue and forms microprecipitates, delaying its absorption and prolonging its duration of activity. The primary advantages of glargine insulin are its longer than 24-hour activity (allowing once-daily dosing) and the near absence of peak concentrations; both characteristics are desirable for the provision of consis-tent basal insulin levels. Disadvantages include the higher cost, a higher inci-dence of mild injection site discomfort (compared with NPH, 6.0% vs. 0.3%), and the inability to mix glargine with other insulins. Insulin detemir is another basal insulin analogue. It has been engineered with a unique fatty acid side
chain that facilitates self-association at the injection site and, once absorbed, binding to circulating serum albumin. Both these features allow a smooth basal profile when insulin determir is taken once or twice daily. Although it has a shorter duration of action compared with glargine, it appears to have less intraindividual variation in activity.
Insulin RegimensAlthough it is a simple concept, the clinical use of insulin to treat diabetes
mellitus, especially absolutely insulin-deficient type 1 diabetes, can be extraor-dinarily complex. There are many important interpatient (and intrapatient) variables, so a predictable algorithm cannot be uniformly applied to all patients or to a single patient at all times. In general, subcutaneous insulin regimens for type 1 diabetes can be classified as conservative or intensive. Continuous subcutaneous insulin infusion with insulin pumps is becoming increasingly popular, mainly in patients with type 1 diabetes, and this mode of therapy provides the most flexible and refined insulin replacement regimen to date.
Conservative Insulin TherapyThrough the early stages of type 1 diabetes, some degree of β-cell function
is usually preserved, allowing many patients to achieve near-normal glycemic control with less intensive effort. Because intermediate-acting insulins are not generally sustained during a 24-hour period, and because insulin require-ments tend to increase early in the morning, many of these patients can start with two daily injections, consisting of a mixture of intermediate-acting and short- or rapid-acting human insulins administered before breakfast and before dinner. Regardless of the initiation method used, insulin dose adjust-ments are inevitably required. Initially, doses of the intermediate-acting insulin should be adjusted to optimize predinner and fasting (morning) glucose levels. Once these goals are accomplished, short- or rapid-acting insulin doses should be adjusted to optimize postprandial, prelunch, and bedtime glucose values. Some patients may experience a brief “honeymoon” period, during which β-cell function partially recovers and insulin needs are temporarily reduced.
Premixed combinations of intermediate insulins and short- or rapid-acting insulins are also available (NPH/regular 70/30, neutral protamine lispro/lispro 75/25, and neutral protamine aspart/aspart 70/30). The fixed proportions in these insulin products make their titration more challenging.
Intensive Therapy: Multiple Subcutaneous InjectionsWithin several years after the onset of type 1 diabetes, residual insulin secre-
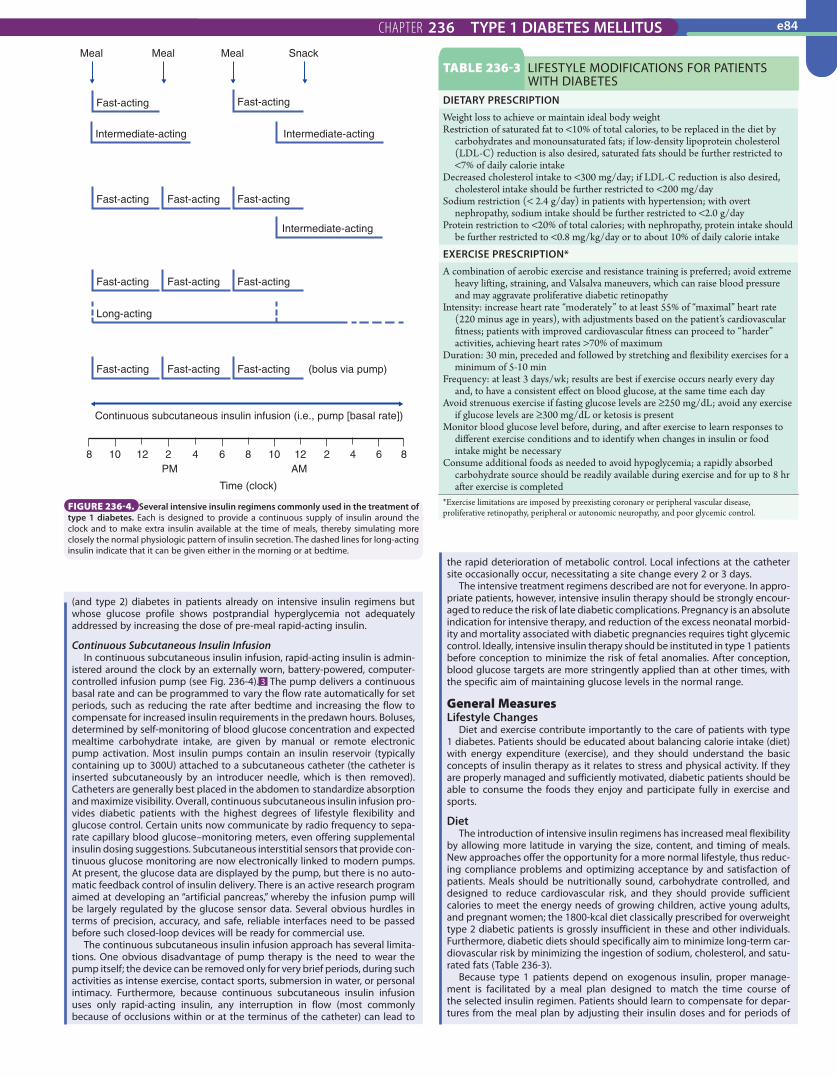
tion typically ceases. When this occurs, twice-daily insulin injections are no longer acceptable, even if they continue to control marked hyperglycemia and diabetic symptoms. For optimal glycemic control, insulin delivery should more closely simulate the “normal” pattern of insulin secretion; continuous or “basal” insulin levels are required throughout the day, whereas brief increases in insulin levels (“boluses”) should coincide with the ingestion of meals. Success-ful management of diabetes begins with fasting glucose control. Failure to control the morning glucose level often results in the stubborn perpetuation of hyperglycemia throughout the day. The key factors responsible for fasting hyperglycemia are inadequate overnight delivery of insulin and sleep-associated growth hormone release. The “dawn phenomenon” is most pro-nounced in patients with type 1 diabetes because of their inability to compensate by raising endogenous insulin secretion. The magnitude of the dawn phenomenon can be attenuated by designing insulin regimens to ensure that the effects of exogenous insulin do not peak in the middle of the night and dissipate by morning. Several approaches to insulin therapy can reduce this problem; some of the more common regimens are displayed in Figure 236-4. For patients seeking the tightest control, multidose insulin regi-mens have gained in popularity. These incorporate rapid-acting insulin ana-logue injections before each meal, with one or two daily doses of a long-acting basal insulin. Ideally, the rapid insulin dose is calculated based on carbohy-drate intake, typically using a fixed ratio, such as 1 U for every 15 g consumed. Many intensive programs also adjust this calculated dose based on the pre-prandial blood glucose reading and/or any anticipated exercise after the meal. Such regimens require a motivated patient and intensive education and moni-toring. Pen-style insulin injectors are also available; these may make multidose regimens more convenient for patients.
PramlintideAmylin is a natural peptide that is normally secreted by the pancreatic β cell
with insulin in response to meals. It has several beneficial effects on glucose homeostasis, including the suppression of glucagon secretion, the retardation of gastric emptying, and the promotion of satiety. Pramlintide, a synthetic amylin analogue, is currently approved for use in patients with type 1 diabetes (as well as those with insulin-requiring type 2 diabetes) who are inadequately controlled with their current regimens. It is given before meals, usually in conjunction with prandial insulin, but in a separate subcutaneous injection. Its major role is to decrease postprandial glucose excursions, stabilizing glycemic control. In clinical trials, the absolute reduction in HbA1c is modest (–0.3 to 0.5%), although it is associated with mild weight loss, which distinguishes it from insulin therapy. Side effects include nausea and vomiting, especially at higher doses. At this time, its niche appears to be for poorly controlled type 1
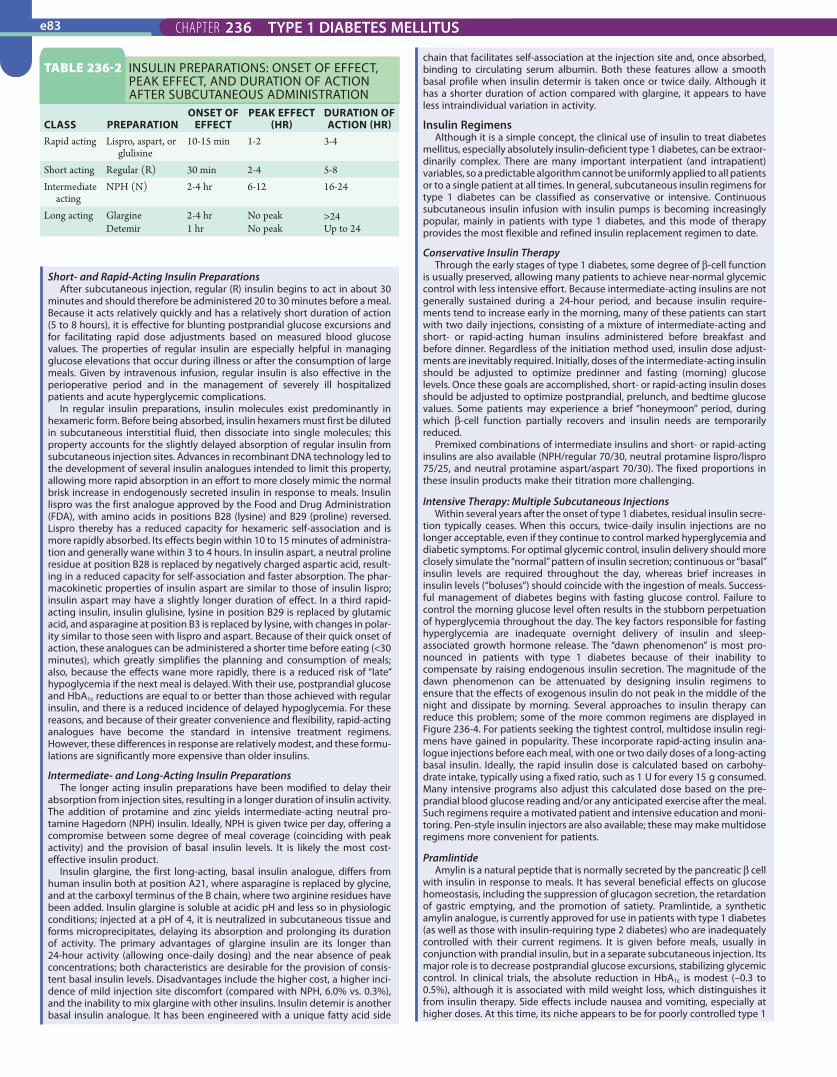
TABLE 236-2 INSULIN PREPARATIONS: ONSET OF EFFECT, PEAK EFFECT, AND DURATION OF ACTION AFTER SUBCUTANEOUS ADMINISTRATION
CLASS PREPARATIONONSET OF
EFFECTPEAK EFFECT
(HR)DURATION OF ACTION (HR)
Rapid acting Lispro, aspart, or glulisine
10-15 min 1-2 3-4
Short acting Regular (R) 30 min 2-4 5-8Intermediate
actingNPH (N) 2-4 hr 6-12 16-24
Long acting Glargine 2-4 hr No peak >24Detemir 1 hr No peak Up to 24
CHAPTER 236 TYPE 1 DIABETES MELLITUS e84
108 12 2 64 8 10 12 2 4 6 8
Time (clock)
Continuous subcutaneous insulin infusion (i.e., pump [basal rate])
Fast-acting Fast-acting Fast-acting (bolus via pump)
Long-acting
Fast-acting Fast-acting Fast-acting
Fast-acting
Fast-acting
Meal Meal Meal Snack
Fast-acting Fast-acting
Fast-acting
Intermediate-acting
Intermediate-acting Intermediate-acting
PM AM
FIGURE 236-4. Several intensive insulin regimens commonly used in the treatment of type 1 diabetes. Each is designed to provide a continuous supply of insulin around the clock and to make extra insulin available at the time of meals, thereby simulating more closely the normal physiologic pattern of insulin secretion. The dashed lines for long-acting insulin indicate that it can be given either in the morning or at bedtime.
(and type 2) diabetes in patients already on intensive insulin regimens but whose glucose profile shows postprandial hyperglycemia not adequately addressed by increasing the dose of pre-meal rapid-acting insulin.
Continuous Subcutaneous Insulin InfusionIn continuous subcutaneous insulin infusion, rapid-acting insulin is admin-
istered around the clock by an externally worn, battery-powered, computer-controlled infusion pump (see Fig. 236-4). 3 The pump delivers a continuous basal rate and can be programmed to vary the flow rate automatically for set periods, such as reducing the rate after bedtime and increasing the flow to compensate for increased insulin requirements in the predawn hours. Boluses, determined by self-monitoring of blood glucose concentration and expected mealtime carbohydrate intake, are given by manual or remote electronic pump activation. Most insulin pumps contain an insulin reservoir (typically containing up to 300U) attached to a subcutaneous catheter (the catheter is inserted subcutaneously by an introducer needle, which is then removed). Catheters are generally best placed in the abdomen to standardize absorption and maximize visibility. Overall, continuous subcutaneous insulin infusion pro-vides diabetic patients with the highest degrees of lifestyle flexibility and glucose control. Certain units now communicate by radio frequency to sepa-rate capillary blood glucose–monitoring meters, even offering supplemental insulin dosing suggestions. Subcutaneous interstitial sensors that provide con-tinuous glucose monitoring are now electronically linked to modern pumps. At present, the glucose data are displayed by the pump, but there is no auto-matic feedback control of insulin delivery. There is an active research program aimed at developing an “artificial pancreas,” whereby the infusion pump will be largely regulated by the glucose sensor data. Several obvious hurdles in terms of precision, accuracy, and safe, reliable interfaces need to be passed before such closed-loop devices will be ready for commercial use.
The continuous subcutaneous insulin infusion approach has several limita-tions. One obvious disadvantage of pump therapy is the need to wear the pump itself; the device can be removed only for very brief periods, during such activities as intense exercise, contact sports, submersion in water, or personal intimacy. Furthermore, because continuous subcutaneous insulin infusion uses only rapid-acting insulin, any interruption in flow (most commonly because of occlusions within or at the terminus of the catheter) can lead to
the rapid deterioration of metabolic control. Local infections at the catheter site occasionally occur, necessitating a site change every 2 or 3 days.
The intensive treatment regimens described are not for everyone. In appro-priate patients, however, intensive insulin therapy should be strongly encour-aged to reduce the risk of late diabetic complications. Pregnancy is an absolute indication for intensive therapy, and reduction of the excess neonatal morbid-ity and mortality associated with diabetic pregnancies requires tight glycemic control. Ideally, intensive insulin therapy should be instituted in type 1 patients before conception to minimize the risk of fetal anomalies. After conception, blood glucose targets are more stringently applied than at other times, with the specific aim of maintaining glucose levels in the normal range.
General MeasuresLifestyle Changes
Diet and exercise contribute importantly to the care of patients with type 1 diabetes. Patients should be educated about balancing calorie intake (diet) with energy expenditure (exercise), and they should understand the basic concepts of insulin therapy as it relates to stress and physical activity. If they are properly managed and sufficiently motivated, diabetic patients should be able to consume the foods they enjoy and participate fully in exercise and sports.
DietThe introduction of intensive insulin regimens has increased meal flexibility
by allowing more latitude in varying the size, content, and timing of meals. New approaches offer the opportunity for a more normal lifestyle, thus reduc-ing compliance problems and optimizing acceptance by and satisfaction of patients. Meals should be nutritionally sound, carbohydrate controlled, and designed to reduce cardiovascular risk, and they should provide sufficient calories to meet the energy needs of growing children, active young adults, and pregnant women; the 1800-kcal diet classically prescribed for overweight type 2 diabetic patients is grossly insufficient in these and other individuals. Furthermore, diabetic diets should specifically aim to minimize long-term car-diovascular risk by minimizing the ingestion of sodium, cholesterol, and satu-rated fats (Table 236-3).
Because type 1 patients depend on exogenous insulin, proper manage-ment is facilitated by a meal plan designed to match the time course of the selected insulin regimen. Patients should learn to compensate for depar-tures from the meal plan by adjusting their insulin doses and for periods of
TABLE 236-3 LIFESTYLE MODIFICATIONS FOR PATIENTS WITH DIABETES
DIETARY PRESCRIPTIONWeight loss to achieve or maintain ideal body weightRestriction of saturated fat to <10% of total calories, to be replaced in the diet by
carbohydrates and monounsaturated fats; if low-density lipoprotein cholesterol (LDL-C) reduction is also desired, saturated fats should be further restricted to <7% of daily calorie intake
Decreased cholesterol intake to <300 mg/day; if LDL-C reduction is also desired, cholesterol intake should be further restricted to <200 mg/day
Sodium restriction (< 2.4 g/day) in patients with hypertension; with overt nephropathy, sodium intake should be further restricted to <2.0 g/day
Protein restriction to <20% of total calories; with nephropathy, protein intake should be further restricted to <0.8 mg/kg/day or to about 10% of daily calorie intake
EXERCISE PRESCRIPTION*A combination of aerobic exercise and resistance training is preferred; avoid extreme
heavy lifting, straining, and Valsalva maneuvers, which can raise blood pressure and may aggravate proliferative diabetic retinopathy
Intensity: increase heart rate “moderately” to at least 55% of “maximal” heart rate (220 minus age in years), with adjustments based on the patient’s cardiovascular fitness; patients with improved cardiovascular fitness can proceed to “harder” activities, achieving heart rates >70% of maximum
Duration: 30 min, preceded and followed by stretching and flexibility exercises for a minimum of 5-10 min
Frequency: at least 3 days/wk; results are best if exercise occurs nearly every day and, to have a consistent effect on blood glucose, at the same time each day
Avoid strenuous exercise if fasting glucose levels are ≥250 mg/dL; avoid any exercise if glucose levels are ≥300 mg/dL or ketosis is present
Monitor blood glucose level before, during, and after exercise to learn responses to different exercise conditions and to identify when changes in insulin or food intake might be necessary
Consume additional foods as needed to avoid hypoglycemia; a rapidly absorbed carbohydrate source should be readily available during exercise and for up to 8 hr after exercise is completed
*Exercise limitations are imposed by preexisting coronary or peripheral vascular disease, proliferative retinopathy, peripheral or autonomic neuropathy, and poor glycemic control.

CHAPTER 236 TYPE 1 DIABETES MELLITUSe85
altered activity by adjusting their consumption of food. Even in patients on basal-bolus regimens or those receiving continuous subcutaneous insulin infusion, an effort should be made to avoid long delays between meals, and small snacks may be helpful at times of peak insulin action to avoid hypoglycemia. The potential for insulin-induced weight gain requires special emphasis on portion control; to control hypoglycemia, patients should master the determination of appropriate carbohydrate intake and avoid overcompensation.
ExerciseRegular exercise is important to promote overall health and to reduce car-
diovascular complications. Through accelerated insulin absorption (due to increased local blood flow at the injection site) and increased muscle glucose consumption, exercise can rapidly reduce blood glucose levels, particularly when it coincides with the peak action of an insulin injection. In nondiabetic individuals, blood glucose levels remain stable during exercise, as decreased endogenous insulin secretion promotes increased hepatic glucose production to match the increased rate of glucose consumption. In diabetic patients receiving exogenous insulin, however, this finely tuned homeostatic mecha-nism is perturbed. The continued presence of exogenous insulin during exer-cise further accelerates glucose uptake and, more important, blocks the compensatory increase in glucose production; as a result, circulating glucose levels can fall precipitously during exercise. Because the magnitude of this fall is not easily titrated, hypoglycemia may occur if the patient is unable to adjust diet and insulin appropriately before, during, and after physical activity. Some general guidelines useful in regulating the glycemic response to exercise are summarized in Table 236-3.
MonitoringSelf-Monitoring of Blood Glucose Concentration
Self-monitoring of blood glucose concentration has revolutionized the management of diabetes. It actively involves patients in the treatment process, allows more rapid treatment adjustments, and reinforces dietary changes. Self-monitoring provides patients with the tools necessary to assist in man-agement of the disease; it is especially useful during periods of stress and for patients who are susceptible to hypoglycemia. Urine glucose testing provides only a gross approximation of recent glucose status and should be used only in patients who cannot or refuse to test their blood.
Newer glucose meters are small, portable, and reliable; they provide a digital readout and have a computerized memory to facilitate recordkeeping. Blood sampling is facilitated (and made less painful) by automated, spring-operated lancet devices and the option of testing at sites other than the finger (e.g., the arm), which are less painful. Self-monitoring of blood glucose con-centration is of maximal value if patients perform tests on a regular basis, can accurately measure glucose levels, and can make use of the results. Patients must become familiar with what a normal glucose value is, what the glucose targets are, and how levels can vary with changes in diet or activity and insulin absorption. At a minimum, patients should be able to adjust to repetitive pat-terns of hypoglycemia or hyperglycemia, as well as to periods of stress and illness (“sick days”).
Continuous Glucose MonitoringTraditional self-monitoring of blood glucose concentration is often inade-
quate to optimize metabolic control. Continuous glucose monitoring of inter-stitial fluid has revealed that tight glycemic control is often achieved at the expense of unacceptably high rates of nocturnal hypoglycemia, and postpran-dial glucose excursions are often larger than expected. To minimize these highs and lows, continuous glucose monitoring systems have been approved for clinical use, despite some limitations in accuracy. Data from the first genera-tion of “real-time” glucose sensors were evaluated post hoc, similar to a cardiac Holter monitor, to alert clinicians to previously undetected nocturnal hypogly-cemia and postprandial glucose elevations. Current models are needle-like percutaneous glucose sensors inserted under the skin by the patient; the sensors use an enzyme (glucose oxidase) coupled to electrochemical detectors to measure glucose levels for several days to 1 week before they must be replaced. Mechanical continuous glucose sensors give patients (and parents of young children) the ability to view real-time glucose levels (every 5 minutes), review trends and fluctuations in recent blood glucose levels, and receive alerts when blood glucose levels become too high or too low. Recent clinical trials suggest that continuous glucose monitoring, if used daily, helps patients improve glycemic control without increasing the near-term risk of hypoglycemia. 4
GlycohemoglobinGlycohemoglobin (glycosylated hemoglobin) assays have emerged as the
“gold standard” for long-term glycemic control. The test does not rely on a patient’s ability to self-monitor blood glucose levels and is not influenced by acute glycemic changes or by recent meals. Glycohemoglobin is formed when glucose reacts nonenzymatically with the hemoglobin A molecule; it is com-posed of several fractions, the largest being HbA1c. HbA1c (expressed as the percentage of total hemoglobin) varies in proportion to the average level of glucose during the lifespan of the red blood cell, thereby providing an index
of glycemic control during the preceding 8 to 12 weeks. Several assay methods have been developed, but all are now standardized to the DCCT assay, as approved by the National Glycohemoglobin Standardization Program.
Although ambient glucose levels are the dominant influence on glycohe-moglobin levels, other factors can confound the interpretation of the test result. For example, any condition that increases red blood cell turnover (e.g., pregnancy, hemolytic anemia) spuriously lowers glycohemoglobin levels, regardless of the assay used. Some assays yield spuriously low values in patients with hemoglobinopathies (e.g., sickle cell disease or trait, hemoglobin C or D) or high values when either hemoglobin F is increased (e.g., thalassemia, myeloproliferative disorders) or large doses of aspirin are consumed. HbA1c can also be affected in uremia and iron deficiency anemia. In addition, poorly understood genetic factors may affect the results of this test, although while estimated average glucose ranges have been proposed for each percentage HbA1c, there remains a fair degree of variability from patient to patient (the so-called glycation gap).
Treatment PlanningA management plan should take into consideration the life patterns, age,
work and school schedules, psychosocial needs, educational level, and motiva-tion of each individual patient. The plan should include lifestyle changes, a meal plan, medications, monitoring instructions (including sick-day manage-ment), and education about the prevention and treatment of hypoglycemia. Importantly, all components of the plan must be both understood and accepted by the patient. The patient’s active participation in problem solving, as well as ongoing support from the health care team, is critical for the suc-cessful management of diabetes.
At each visit, the management plan should be reviewed, and the patient’s progress in achieving glucose targets should be assessed. If goals are not being met, causes need to be identified, and the plan should be modified accordingly. Regular clinical evaluation should focus on early signs and symp-toms of retinal, cardiovascular, neurologic, and podiatric complications and on reinforcement of the diet and exercise prescription. A complete ophthalmo-logic examination, assessment of cardiovascular risk factors, and measure-ment of urinary albumin excretion (through either a timed collection or the more convenient spot urine albumin-to-creatinine ratio) should be performed annually. Specialized podiatric care is also recommended for all patients with evidence of peripheral neuropathy, foot deformities, history of ulcerations, or evidence of peripheral vascular disease. Table 236-4 presents target glycemic guidelines for nonpregnant diabetic patients as well as targets for other clini-cal factors (e.g., blood pressure, lipids) related to the development of diabetic complications.
Surgical TherapyPancreas or Islet Transplantation
Intensive insulin therapy rarely if ever restores glucose homeostasis to levels achieved in nondiabetic individuals. As a result, a more effective method of treatment remains a crucial long-term goal of diabetes research. Pancreas transplantation is conceptually promising in this regard; with growing experi-ence in recent years, there have been substantial improvements in the outcome of pancreas transplantation surgery. Unfortunately, because of the need for long-term immunosuppression, pancreas transplantation is currently an option for only a select group of patients, mainly type 1 diabetic patients who already require immunosuppression for a renal allograft. In such individu-als, successful pancreas transplantation may also be effective in preventing nephropathy in the grafted kidney. In the absence of indications for kidney transplantation, pancreas transplantation alone should generally be consid-ered only in rare diabetic patients with a history of frequent, severe metabolic complications (e.g., life-threatening hypoglycemia with or without recurrent ketoacidosis) in whom insulin therapy consistently fails to achieve metabolic control.
Pancreatic islet cell transplantation holds many potential advantages over whole gland transplantation because it is simpler to perform and less costly. Initially, this still largely experimental procedure involves the intraportal injec-tion of isolated islets from cadaveric sources. Although initial reports appeared encouraging, subsequent follow-up of patients beyond 1 to 2 years reveals that most must resume insulin therapy, and many have little or no β-cell func-tion. The critical issue of an adequate source of islets remains a major chal-lenge, and extensive research efforts are being directed at the bioengineering of islets from noncadaveric sources (“islet farming”).
ACUTE METABOLIC COMPLICATIONSHyperglycemic StatesMetabolic decompensation in diabetes is generally classified into one of two broad clinical syndromes: diabetic ketoacidosis (DKA) or hyperosmolar hyperglycemic syndrome (HHS). Although DKA is generally seen in type 1 patients, whereas HHS affects patients with type 2 diabetes (Chapter 237), lines of classification are commonly blurred. For example, HHS can present with variable degrees of ketosis and acidosis, and DKA is seen with increasing

CHAPTER 236 TYPE 1 DIABETES MELLITUS e86
depressed mental function, and Kussmaul (deep, rapid) respirations. Ketosis may be recognizable by a sweet, sickly smell on the patient’s breath.
DIAGNOSISThe diagnosis of DKA is usually straightforward and needs to be made promptly. The clinical picture and the presence of hyperglycemia should alert the clinician to test for ketones, assess the acid-base status, and measure arte-rial pH. Initial laboratory tests to be performed include routine serum chem-istries (including divalent cations), complete blood count with differential, and urinalysis. Cardiac enzymes and liver and pancreatic function tests should also be checked. An electrocardiogram and a chest x-ray are routinely obtained, and culture specimens should be taken from blood, urine, and other potential sources as clinically indicated. In DKA, glucose levels may vary from 250 to more than 1000 mg/dL, serum bicarbonate concentration drops below 18 mEq/L, and there is an excess anion gap that is generally proportional to the decrease in serum bicarbonate. Hyperchloremia may be superimposed if the patient maintains an adequate glomerular filtration rate and is able to exchange ketoacid anions for chloride in the kidney. The degree of depression of arterial pH depends largely on respiratory compensation. In mild cases the pH may range from 7.20 to 7.30; in severe cases it can fall below 7.00. In general, the clinical severity of DKA depends more on the magnitude of acidosis than on hyperglycemia; as a result, arterial pH is widely used as a reference indicator of DKA severity (Table 236-6). On occasion, a degree of superimposed metabolic alkalosis (e.g., caused by vomiting or diuretic use) may obscure the true severity of the ketoacidosis. An anion gap out of proportion to the fall of bicarbonate should suggest this possibility. Other laboratory abnormalities commonly seen in DKA include a reduced measured serum sodium concentration (due to hyperosmolarity and the resulting osmotic shift of intracellular water into the intravascular space), prerenal azotemia, and hyperamylasemia. The last is usually of nonpancreatic origin and can lead to an erroneous diagnosis of pancreatitis. Normal, ele-vated, or reduced concentrations of potassium, phosphate, and magnesium may exist when DKA is diagnosed; however, large deficits of these electro-lytes invariably accompany the osmotic diuresis and become readily apparent during the course of treatment. The serum triglyceride concentration is fre-quently elevated, a reflection of deranged lipid metabolism in the setting of insulin deficiency. The white blood cell count is typically elevated; the hemo-globin and hematocrit may be elevated, reflecting volume contraction.
Special care should be taken in interpreting serum or urine ketone results. Because quantitative measurements of β-hydroxybutyrate and acetoacetate are not readily available, rapid diagnosis usually requires qualitative assess-ment of serum ketones by the use of serum dilutions and reagent strips (e.g., Ketostix) or tablets (e.g., Acetest), which depend on a nitroprusside reaction with acetoacetate. However, acetone reacts weakly with nitroprusside, and β-hydroxybutyrate does not react at all; thus, the results of qualitative testing for ketones can be misleadingly low. Furthermore, because of the presence of
TABLE 236-4 THERAPEUTIC TARGETS FOR NONPREGNANT DIABETIC PATIENTS
PARAMETER NORMAL TARGET*Preprandial plasma glucose (mg/dL) <100 90-130
2-hr postprandial glucose (mg/dL) <140 <160-180Bedtime plasma glucose (mg/dL) <120 110-150
Hemoglobin A1c (%)† <6 <7LDL cholesterol (mg/dL) <130 <100‡
HDL cholesterol (mg/dL) >40 (m), >50 (w) >45 (m), >55 (w)Fasting triglycerides (mg/dL) <150 <150Blood pressure (mm Hg) <140/90 <130/80§
HDL = high-density lipoprotein; LDL = low-density lipoprotein; m = men; w = women.*Clinical targets vary for individual patients, depending on an assessment of overall health and the risk-benefit ratio.†Whereas the hemoglobin A1c goal in general is <7%, a goal as close as possible to normal (<6%) without significant hypoglycemia is advisable. Also, less stringent goals may be appropriate for some patients (those with a history of severe hypoglycemia, limited life expectancy, or significant comorbidities, and very young children or older adults).‡<70 mg/dL an optional target in very high risk patients, such as those with overt cardiovascular disease.§<125/75 is the target in patients with overt nephropathy or proteinuria.
frequency in obese type 2 patients. Criteria for both conditions can be met by some patients who experience an overlap syndrome. Despite aggressive treatment, mortality rates remain high for both conditions, approaching 5% for DKA and 15% for HHS. Mortality is associated with advanced age and comorbidity and is usually due to an associated catastrophic illness (e.g., myocardial infarction, cerebrovascular accident, sepsis) or acute complica-tions, including aspiration, cardiac arrhythmias, and cerebral edema. Treat-ment of hyperglycemic states therefore involves far more than the administration of insulin to reverse hyperglycemia; it also depends on prompt attention to the accompanying fluid and electrolyte disturbances, as well as the detection and treatment of any precipitating illness.
DIABETIC KETOACIDOSIS
PATHOBIOLOGYDKA may herald the onset of type 1 diabetes, but it most often occurs in established diabetic patients as a result of intercurrent illness (e.g., infection), inappropriate reduction in insulin dosage, or missed insulin injections (espe-cially in adolescents). A common scenario is a patient who fails to adjust insulin therapy or to maintain adequate volume status during an illness, typi-cally a viral gastroenteritis or an influenza-like syndrome. A list of common precipitants appears in Table 236-5.
The three cardinal biochemical features of DKA—hyperglycemia, ketosis, and acidosis—result from the combined effects of deficient circulating insulin activity and the excessive secretion of counter-regulatory hormones. These hormonal imbalances mobilize the delivery of substrates from muscle (amino acids, lactate, pyruvate) and adipose tissue (free fatty acids, glycerol) to the liver, where they are actively converted to glucose or to ketone bodies (β-hydroxybutyrate, acetoacetate, acetone). Both are ultimately released into the circulation at rates that greatly exceed the capacity of tissues to use them. The end results are hyperglycemia (>250 mg/dL), ketoacidosis (arte-rial pH <7.30), and an osmotic diuresis that promotes dehydration and electrolyte loss.
CLINICAL MANIFESTATIONSThe clinical history of DKA typically involves deterioration over several days, with advancing polyuria, polydipsia, and other symptoms of progressive hyperglycemia. Other common clinical features are weakness, lethargy, nausea, and anorexia. Abdominal pain in the setting of DKA is classically periumbilical and can mimic an acute abdomen. Reduced motility of the gastrointestinal tract or, in severe cases, paralytic ileus may further contribute to diagnostic confusion. Nausea and vomiting are ominous symptoms because they preclude oral replacement of fluid losses; severe volume deple-tion may follow quickly. Physical findings in DKA are mainly secondary to dehydration and acidosis; these include dry skin and mucous membranes, reduced jugular venous pressure, tachycardia, orthostatic hypotension,
TABLE 236-5 PRECIPITANTS OF DIABETIC KETOACIDOSIS AND HYPEROSMOLAR HYPERGLYCEMIC SYNDROME
MOST COMMON PRECIPITANTSInfections (30-50%): pneumonia, urinary tract infections, sepsis, gastroenteritisInadequate insulin treatment (20-40%): includes noncompliance, insulin pump
failureMyocardial ischemia or infarction (3-6%): often clinically “silent” in diabetic patients
OTHER PRECIPITANTSCerebrovascular accidentIntracranial bleeding (e.g., subdural hematoma)Acute pulmonary embolismIntestinal or mesenteric thrombosisIntestinal obstructionAcute pancreatitisAlcohol intoxication or abuseSevere burns; hyperthermia or hypothermiaEndocrine disorders: Cushing’s syndrome, thyrotoxicosis, acromegalyTotal parenteral nutritionDrugs: corticosteroids, pentamidine, sympathomimetics, thiazides

CHAPTER 236 TYPE 1 DIABETES MELLITUSe87
intracellular acidosis, β-hydroxybutyrate levels are often much higher than acetoacetate levels, which may further conceal the true degree of ketoacido-sis. Conversely, after insulin therapy begins, the nitroprusside reaction may give the “false” impression of sustained ketoacidosis for hours or even days. This results because nonacidic acetone is slowly cleared from the circulation and also because, as acidosis improves, β-hydroxybutyrate is converted to acetoacetate, giving the illusion of worsening ketonemia.
HHS is discussed in Chapter 237.
The initial goals of therapy for both hyperglycemic states are to replace fluid and electrolyte deficits and to slowly correct hyperglycemia. Unless it is severe, ketoacidosis is generally corrected with these measures and requires no spe-cific therapy. Current management guidelines of the American Diabetes Asso-ciation are presented in Figure 236-5 and summarized here. In the treatment of hyperglycemic states, special attention must be paid to both the precipitat-ing illness and potential complications that may arise during (or as a result of ) medical therapy.
Conventional Medical TherapyIn the early hours of treatment, the primary considerations are to restore
intravascular volume, correct tissue hypoperfusion, and restore insulin sensi-tivity. With DKA, large total body deficits of water (5 to 10 L), sodium (5 to 10 mEq/kg), and other electrolytes (see later) may exist (these losses are even more profound in HHS, which typically develops over a longer time). Although water loss usually exceeds the loss of sodium, it is almost always preferable to begin fluid replacement with isotonic normal saline (0.9% NaCl solution) for efficient intravascular volume restoration. Fluid replacement regimens vary, but it is common to administer 1 L of normal saline within the first hour, fol-lowed by a continuous infusion with either 0.45% NaCl or 0.9% NaCl, depend-ing on the corrected serum sodium concentration, the patient’s hemodynamic status, and the clinical assessment of tissue perfusion. Likewise, the rate of infusion (commonly 250 to 500 mL/hour) should be adjusted according to both biochemical responses and the age and clinical status of the patient (e.g., oliguria or underlying cardiovascular disease). In pediatric patients with DKA, isotonic solutions are generally preferred because they are less likely than hypotonic solutions to accelerate water shifts into the intracellular space and contribute to cerebral edema. During the course of treatment, once the blood glucose concentration falls below 250 mg/dL, dextrose should be added to intravenous fluids to avoid eventual hypoglycemia because continued insulin delivery will be required to correct the often persistent acidosis.
Although insulin resistance is present in both DKA and HHS, supraphysio-logic doses of insulin are unnecessary and are more likely to provoke hypoka-lemia, hypophosphatemia, and delayed hypoglycemia. A typical insulin replacement regimen uses an intravenous bolus of 0.15 U/kg of rapid-acting (e.g., regular) insulin, followed by 0.1 U/kg/hour thereafter. Intravenous
TREATMENT
administration is the most predictable way to deliver insulin to target tissues, particularly in severely hypovolemic patients with reduced peripheral blood flow. If intravenous administration is not possible, intramuscular or subcutane-ous routes of administration can be used. It is ideal if blood glucose levels fall at a steady and predictable rate (50 to 75 mg/dL/hour), so it is important to monitor blood glucose levels hourly during insulin therapy to ensure an appropriate rate of decline. Blood glucose levels should not fall too rapidly, especially in young children, in whom accelerated correction of plasma glucose concentrations has been associated with cerebral edema.
After a stable blood glucose level below 250 mg/dL is achieved, with resolu-tion of the anion gap acidosis, subcutaneous administration of insulin can be started, and the intravenous insulin infusion may be discontinued. With DKA, it is important to overlap the intravenous and subcutaneous routes by 1 to 2 hours to avoid the return of ketoacidosis. After the return of normoglycemia, long-term medical management should be initiated (or resumed), with both long-acting and short-acting insulins, to approximate the discharge regimen. A temporary “regular insulin sliding scale” is not advisable because such therapy will likely allow the glucose levels to rise into the hyperglycemic range before insulin is administered. More proactive insulin replacement regimens are preferred. The eventual dosage and frequency of insulin depend on mul-tiple factors, including body habitus, comorbidity, insulin sensitivity, and effec-tiveness of prior therapeutic regimens.
Potassium replacement in DKA (and HHS) is vital. Hypokalemia can result in muscle weakness, cramps, and nausea; both hyperkalemia and hypokalemia are associated with cardiac arrhythmias. At the time of initial evaluation, patients have a severe total body potassium deficit (about 3 to 7 mEq/kg), yet measured serum potassium levels may be normal or high, especially if acidosis or renal failure is present. Once intravenous fluids and insulin are started, serum potassium levels fall quickly because of an insulin-mediated shift of potassium into the intracellular space. In addition, fluid replacement causes extracellular dilution of potassium, leading to improved renal perfusion and increased urinary potassium excretion. This rapid decline can be countered by potassium replacement based on measured serum levels. A low potassium level (<3.5 mEq/kg) requires prompt treatment with up to 40 mEq/hour, whereas “normal” serum levels (3.5 to 5.0 mEq/kg) call for less aggressive repletion (10 to 30 mEq/hour), assuming adequate urine output. In patients who may have lost potassium for additional reasons, such as diuretic use or gastrointestinal loss, one should anticipate the need for greater potassium supplementation.
In the majority of patients with mild to moderate DKA, ketoacids clear spontaneously with standard therapeutic measures, and artificial correction with alkali (bicarbonate) is unnecessary. Suppression of lipolysis by insulin reduces free fatty acid flux to the liver and blocks ketogenesis. The remaining ketoacids are then cleared or oxidized, with subsequent regeneration of bicar-bonate and restoration of arterial pH. In cases of severe acidosis (pH <6.9 to 7.0), however, bicarbonate administration may be indicated; the hyperventila-tory drive of severe acidosis is uncomfortable, and severe acidosis also impairs cardiac function and peripheral vasodilation. Bicarbonate therapy should be used with caution, however, and only at the minimal doses required to stabi-lize the patient, because it can further provoke hypokalemia. In addition, by causing a sudden left shift of the dissociation curve for oxyhemoglobin, bicar-bonate may impair oxygen delivery to the tissues. Therefore, if alkali therapy is given, small amounts should be administered slowly: 50 mEq (one ampoule) of NaHCO3 over 1 hour for arterial pH 6.9 to 7.0, and 100 mEq (two ampoules) over 2 hours for pH below 6.9. After bicarbonate administration, arterial pH (and serum potassium levels) should be rechecked every 2 hours, and alkaline therapy should be discontinued when the pH rises above 7.0.
In the setting of DKA, phosphate losses average 3 to 7 mmol/kg; magne-sium losses reach 1 to 2 mEq/kg. (Magnitudes of depletion for both ions may be greater for HHS because of a more prolonged osmotic diuresis.) Phosphate is shifted extracellularly during hyperosmolar states, so initial serum levels may be falsely elevated and may drop rapidly during therapy. Complications of hypophosphatemia generally occur at serum levels below 1.0 mg/dL and include respiratory and skeletal muscle weakness, impaired cardiac systolic performance, and hemolytic anemia. Phosphate repletion should be used in patients with serum phosphate levels below 1.0 mg/dL and in patients with evidence of cardiac or respiratory compromise, hypoxia, or hemolytic anemia. An effective means of replacing phosphate is to replace one third to one half of the potassium losses (discussed previously) as potassium phosphate. In severe hypophosphatemia, cautious IV administration of additional small amounts of potassium phosphate may be necessary. Because of calcium binding, hypocalcemic tetany may complicate phosphate therapy unless mag-nesium supplements are also provided; for this reason, serum calcium, phos-phate, and magnesium levels should be monitored during any phosphate infusion.
Management of ComplicationsThe most common complications of therapy for hyperglycemic states are
hypoglycemia, hypokalemia, hypophosphatemia, and fluid overload; precau-tions to avoid these complications are described earlier. Cerebral edema, which occurs primarily in pediatric patients, is associated with overaggressive correction of hyperglycemia and with hypotonic fluid replacement. It is likely
TABLE 236-6 DIAGNOSTIC CRITERIA FOR DIABETIC KETOACIDOSIS AND HYPEROSMOLAR HYPERGLYCEMIC SYNDROME
CRITERIONMILD DKA
MODERATE DKA
SEVERE DKA HHS
Plasma glucose (mg/dL) >250 >250 >250 >600Effective serum osmolality
(mOsm/kg)*Variable Variable Variable >320
Urine or serum ketones (NP reaction)
Positive Positive Positive Negative to small
Arterial pH 7.25-7.30 7.00-7.24 <7.00 >7.30Serum bicarbonate
(mEq/L)15-18 10-15 <10 >15
Anion gap (mEq/L) >10 >12 >12 Variable, usually <12
Typical mental status Alert Drowsy Stupor or coma
Stupor or coma
*Effective serum osmolality (mOsm/kg) = 2 [measured serum sodium (mEq/L)] + [serum glucose (mg/dL)/18]. Normal range = 285 ± 5 mOsm/kg. Urea nitrogen is an “ineffective osmole” (i.e., it diffuses freely across compartments) and is therefore purposely excluded from this equation.
Modified from Kitabchi AE, Umpierrez G, Miles JM, et al. Management of hyperglycemic crises in patients with diabetes. Diabetes Care. 2009;32:1335-1343.
DKA = diabetic ketoacidosis; HHS = hyperosmolar hyperglycemic syndrome; NP = nitroprusside.

CHAPTER 236 TYPE 1 DIABETES MELLITUS e88
Medical history and physical examinationComplete blood count with differentialFingerstick blood glucoseSerum chemistries (“Chem-10” plus serum ketones)
Urine for urinalysis and ketonesCultures as indicated (wound, blood, urine, etc.)Chest±abdominal x-ray
12-lead ECG
IV FluidsBased on corrected serum sodium*If high/normal, use 0.45% NaClIf low/normal, use 0.9% NaClContinue IV fluids at 250-1000 mL/hr,
depending on volume status, cardiovascular history, and cardiovascular status (pulse, BP)
Follow and replete serum electrolytes (including divalent cations) q2-4h until stable
After resolution of hyperglycemic state, follow blood glucose q4h and initiate sliding scale regular insulin coverage
Convert IV insulin to subcutaneous injections (or resumption of prior therapy), ensuring adequate overlap
Begin clear liquid diet and advance as tolerated. Encourage resumption of ambulation and activity
Review and update diabetes education, with special attention to prevention of further hyperglycemic crises
Potassium (K+) RepletionObtain baseline serum potassiumObtain 12-lead ECG
Follow serum [K+] every 2-4 hours until stable: anticipate rapid drop of serum [K+] during therapy, due to dilution and intracellular shifting
Ensure adequate urine output to avoid over-repletion and hyperkalemiaContinue K+ repletion until serum [K+] is stable at 4-5 mEq/LIf refractory hypokalemia, ensure concurrent magnesium repletionRepletion may need to be continued for several days, as total body losses
may reach up to 500 mEq
[K+]≥5.5 mEq/L [K+]<5.5 mEq/L and adequate urine output
Hold K+ therapy Add K+ to IV fluids (Use KCl and/or KPhos)
Treat hyperkalemia ifECG changes present [K+] = 4.5-5.4: add 20 mEq/L IV fluids [K+] = 3.5-4.4: add 30 mEq/L IV fluidsRecheck [K+] in 2 hr [K+] <3.5: add 40 mEq/L IV fluids
Bicarbonate TherapyObtain ABGObtain baseline serum bicarbonate
pH<6.9 6.9£pH<7.0 pH≥7.0
100 mEq/L 50 mEq/L(2 amps) (1 amp)NaHCO3 NaHCO3
over 2 hr over 1 hr
Repeat ABG after bicarbonate administrationRepeat NaHCO3 therapy until pH≥7.0, then discontinue therapyFollow serum bicarbonate q4h until stable
*Sodium correction: Serum sodium should be corrected for hyperglycemia. For every 100 mg/dL of glucose elevation above 100 mg/dL, add 1.6 mEq/L to the measured sodium value; this will yield the corrected serum sodium concentration.
Regular insulin bolus, 0.15 U/kgIV infusion, 0.10 U/kg/hrCheck serum glucose hourly—should fall by 50-80 mg/dL/hr
Complete initial evaluation, including (but not limited to): Concurrently, begin empirical fluid resuscitation with 0.9% NaCl at 1000 mL/hrConsider volume expanders if hypovolemic shock is presentContinue fluid resuscitation until volume status and cardiovascular parameters (pulse, BP) have been restored
If serum glucose falling too rapidly, back off on insulin infusion
If serum glucose rising or falling too slowly, increase insulin infusion rate by 50-100%
Insulin Therapy
Continuing Management:When Serum Glucose Reaches 250-300 mg/dL:
For DKA, add dextrose to IV fluids and reduce insulin infusion, adjusted to maintain serum glucose ~200 mg/dL until anion gap has closedFor HHS, continue IV fluids but may reduce insulin infusion until plasma osmolality drops below 310 mOsm/kgBegin more exhaustive search for precipitant of metabolic decompensation
Adult patient with DKA or HHS
Bicarbonatetherapy usuallynot necessary
FIGURE 236-5. Management of diabetic ketoacidosis (DKA) and hyperosmolar hyperglycemic syndrome (HHS). ABG = arterial blood gases; BP = blood pressure; ECG = electrocardio-gram; IV = intravenous.

CHAPTER 236 TYPE 1 DIABETES MELLITUSe89
the result of the osmotically driven movement of water into the central nervous system when plasma osmolarity declines too rapidly. Clinically, cere-bral edema is characterized by lethargy and headache, with progressive decline in mental status and neurologic deterioration. The acute respiratory distress syndrome is also attributed to rapid reductions in colloid osmotic pressure, causing increased lung water content, decreased lung compliance, and noncardiogenic pulmonary edema.
PREVENTIONPrevention of DKA requires extensive education in sick-day insulin and fluid management, as well as home-based assessment of urine ketones whenever severe hyperglycemia or physical illness is noted.
Hypoglycemia
DEFINITIONHypoglycemia is the most frequent complication of insulin therapy for type 1 diabetes. Nearly all patients are symptomatically affected at least once per year, and a significant percentage have severe hypoglycemia requiring medical assistance. Studies using continuous glucose monitoring of type 1 diabetics have shown alarmingly high rates of hypoglycemia, especially at night, when sleeping patients are unaware of its existence.
PATHOBIOLOGYSymptoms of low blood glucose concentration result from changes in auto-nomic activity and brain function. Autonomic symptoms, including sweat-ing, tremor, and palpitations, are often the earliest subjective warning signs of hypoglycemia. Central nervous system symptoms and signs of glucose deficiency, termed neuroglycopenia, may be nonspecific (e.g., fatigue, weak-ness) or more clearly neurologic (e.g., double vision, oral paresthesias, slurring of speech, apraxia, personality change, behavioral disturbances). Hypoglycemia affects type 2 patients as well; most cases occur during treat-ment with insulin or insulin secretagogues, especially the longer acting sulfo-nylureas. Because of the long-acting nature of some oral insulin secretagogues, low blood glucose concentration can recur up to 24 to 48 hours after drug withdrawal, and a more extended course of therapy is often required.
It is well known that prolonged, severe hypoglycemia can cause irreversible brain damage. What is less clear, however, is whether significant neurologic damage results from shorter, milder episodes of low blood glucose concentra-tion over time. Nevertheless, hypoglycemia may provoke seizures, accidental injury, and a catecholamine response that can induce cardiac ischemia or arrhythmias in patients with underlying cardiac disease. Overall, hypoglyce-mia is thought to account for 3 to 4% of deaths in insulin-treated diabetic patients. Hypoglycemia also has far-reaching social implications. On a per-sonal level, it can induce great fear, preclude comfortable engagement in routine activities (e.g., driving), and lead both patient and clinician to aim deliberately for less than optimal glycemic control.
In nondiabetic persons, hypoglycemia provokes a rapid, multitiered meta-bolic response intended to restore normal blood glucose levels. The brain cannot store more than a few minutes’ supply of energy; in the short term, its function is exclusively dependent on a constant supply of glucose for fuel. To preserve central nervous system function, spontaneous recovery from hypoglycemia involves both the activation of endogenous glucose produc-tion and reduced peripheral glucose use. Three fundamental mechanisms are responsible for this process: dissipation of endogenous insulin; counter-regulatory hormone activity; and subjective awareness of hypoglycemia, resulting in hunger and subsequent carbohydrate ingestion. Early hormonal changes are triggered when the plasma glucose concentration approaches the hypoglycemic range (65 to 70 mg/dL). A rise in glucose production, attribut-able mainly to stimulation of hepatic glycogenolysis, is initiated by the release of glucagon from pancreatic α cells in conjunction with falling levels of endogenous insulin. Catecholamines are also released, producing “alarm” symptoms of hypoglycemia (e.g., hunger, tremor, palpitations) and further promoting the synthesis of glucose through the stimulation of hepatic glyco-genolysis, mobilization of substrates for gluconeogenesis, and further sup-pression of insulin production. When hypoglycemia is sustained, additional counter-regulatory hormones such as growth hormone and corticosteroids are released; through a variety of complementary mechanisms, these hor-mones also help promote continued glucose availability. For a more in-depth discussion of metabolic responses to hypoglycemia, refer to Chapter 238.
Patients with type 1 diabetes are more likely to have hypoglycemia, for several reasons. First, injected insulin enters the circulation from a
nonphysiologic source (e.g., a subcutaneous depot) and therefore cannot be curtailed by any counter-regulatory response to falling glucose levels, as may occur in type 2 patients who have residual endogenous insulin secretion. In addition, patients with type 1 diabetes, as a rule, are insulin sensitive, as opposed to their type 2 counterparts. Type 1 patients also lose their glucagon response to hypoglycemia; this appears to be a stimulus-specific phenomenon because their glucagon response to other stimuli may be unaffected. Defective glucagon responses develop in most type 1 patients 2 to 5 years after diagnosis, at about the same time they become completely insulin deficient, implying that the loss of endogenous insulin regulation is a contributory factor. Once this occurs, glucose counter-regulation must rely predominantly on epinephrine release. Unfortunately, half of patients with long-standing type 1 diabetes exhibit diminished epi-nephrine responses to hypoglycemia as well, further predisposing them to severe episodes. In addition, patients may lose the ability to recognize hypoglycemia and take corrective action. In some cases the irritability and confusion that occur during hypoglycemia may prevent the patient’s aware-ness of its cause. In other cases, patients may lose the autonomic warning symptoms of hypoglycemia and may recognize the condition (or even fail to recognize it) only when somatic neurologic function becomes impaired. This so-called hypoglycemic unawareness syndrome has been associated with a number of factors, including duration of diabetes and autonomic neuropathy.
Hypoglycemia unawareness may also occur when patients are switched to intensive insulin regimens. The introduction of intensified treatment regi-mens can lower the glucose level that triggers epinephrine release and adren-ergic symptoms, which at least partly explains the increased frequency of severe hypoglycemia reported in the DCCT. This leads to an increased inci-dence of iatrogenic hypoglycemia during intensified insulin therapy. It has been shown that even brief periods of antecedent hypoglycemia can suppress counter-regulatory responses during subsequent hypoglycemic episodes.
CHRONIC DIABETIC COMPLICATIONSThe pathogenesis of the microvascular and neuropathic complications of diabetes is complex and poorly understood. However, these complications are undoubtedly mediated in large part by the metabolic derangements asso-ciated with diabetes, especially hyperglycemia. It has been suggested that glucose-induced cell injury is particularly pronounced in those cell types that are unable to regulate their intracellular glucose concentration (e.g., endothe-lial cells and neurons) and that this leads to the increased production of reactive oxygen species (superoxide) as well as advanced glycation end prod-ucts (AGEs), accelerated polyol and hexosamine pathways, and protein kinase C activation.
Studies suggest that hyperglycemia-mediated intracellular overproduction of reactive oxygen species may be the common mechanism triggering a variety of pathways thought to contribute to cell injury in diabetes. In addi-tion, a variety of proteins are nonenzymatically glycosylated in vivo (includ-ing hemoglobin, collagen, laminin, low-density lipoprotein particles, and peripheral nerve proteins) in direct proportion to prevailing levels of glucose. AGE cross-linking capabilities render them resistant to natural degradation. The consequent AGEs accumulate in a variety of tissues (including the kidneys and blood vessels), where they bind to a receptor for AGE (RAGE). Of particular interest, the binding of AGEs to RAGE is thought to contribute to cell injury through a variety of mechanisms, including stimulation of oxida-tive reactions as well as pro-inflammatory cytokines, complement, and growth factors. In the polyol pathway, increased activity of intracellular aldose reductase leads to accumulation of sorbitol and fructose, resulting in decreased glutathione antioxidant activity (through decreased NAD+) and enhanced formation of diacylglycerol. Diacylglycerol formation, in turn, can activate specific isoforms of protein kinase C, which stimulate transforming growth factor-β release and play an important role in cell proliferation and vascular permeability. In experimental diabetic animals, prevention of super-oxide accumulation, inhibition of AGE formation, and specific protein kinase C inhibitors reduce diabetic complications.
Hemodynamic changes in the microcirculation may also contribute to microangiopathy. In the diabetic kidney, glomerular filtration rate is increased out of proportion to renal plasma flow owing to an elevation in the transglo-merular pressure gradient. It is assumed that raised glomerular pressures promote the passage of proteins and AGEs; with time, their accumulation in the mesangium is likely to trigger the proliferation of mesangial cells and matrix production, eventually leading to glomerulosclerosis. Compensatory hyperfiltration and a decreasing number of functional glomeruli would

CHAPTER 236 TYPE 1 DIABETES MELLITUS e90
exacerbate matters, increasing intraglomerular pressure and resulting in pro-gressive glomerular damage.
Although microvascular complications can affect patients with either type 1 or type 2 diabetes, they are discussed in this chapter. The macrovascular complications, which are particularly common in type 2 diabetes, are dis-cussed in Chapter 237.
Diabetic Retinopathy
DEFINITIONDiabetic retinopathy refers to progressive pathologic alterations in the retinal microvasculature, leading to areas of retinal nonperfusion, increased vascular permeability, and the pathologic proliferation of retinal vessels.
CLINICAL MANIFESTATIONSNonproliferative Diabetic RetinopathyE-Table 236-1 details the revised international classification (disease severity scales) for this complication. The earliest pathologic changes associated with retinopathy are termed mild nonproliferative diabetic retinopathy. In type 1 patients, these changes generally begin no sooner than 5 years after diagnosis. The first signs of mild nonproliferative diabetic retinopathy are microaneu-rysms, which arise most often in areas of capillary occlusion. Subsequently, increasing vascular permeability leads to retinal blot hemorrhages (round, with blurred edges) and “hard” exudates (sharply defined and yellow). Infarc-tions of the nerve fiber layer, known as soft exudates or cotton-wool spots, appear as white or gray, rounded swellings. At this early stage of retinopathy, visual acuity is generally unaffected, and the risk of progression to high-risk proliferative diabetic retinopathy (see later) is about 15% at 5 years.
Moderate nonproliferative diabetic retinopathy is characterized by intra-retinal microvascular abnormalities, including venous caliber changes, beading, and increased capillary dilation and permeability. Later changes, termed severe or very severe nonproliferative diabetic retinopathy, include progressive retinal capillary loss and ischemia, with further development of extensive hemorrhages, exudates, and microaneurysms. After 5 years, moder-ate and severe nonproliferative diabetic retinopathy are associated with a 30% and 60% risk of progression to high-risk proliferative diabetic retinopathy, respectively.
Proliferative Diabetic RetinopathyProliferative diabetic retinopathy involves neovascularization—the growth of fine tufts of new blood vessels and fibrous tissue from the inner retinal surface or the optic head. Early proliferative changes are confined to the retina, but later invasion of the vitreous body constitutes high-risk prolifera-tive diabetic retinopathy; during this end stage, fibrosis and contracture of the neovasculature result in retinal detachment and hemorrhage, the most important determinants of blindness. On occasion, new vessels can invade the iris and anterior chamber, leading to sight-threatening closed-angle glaucoma.
Clinically Significant Macular EdemaClinically significant macular edema results from vascular leakage at the macula and can occur either with or without the stages of retinopathy described earlier. Clinically significant macular edema is suggested by hard macular exudates on funduscopic examination and can be confirmed with slit lamp biomicroscopy. In general, maculopathy is more common in type 2 patients, in whom it is an important contributor to the loss of visual acuity. As discussed later, the treatment of clinically significant macular edema runs parallel to the treatment of other forms of diabetic retinopathy.
E-TABLE 236-1 INTERNATIONAL CLINICAL DIABETIC RETINOPATHY AND MACULAR EDEMA DISEASE SEVERITY SCALES
PROPOSED DISEASE SEVERITY LEVEL
FINDINGS OBSERVABLE ON DILATED OPHTHALMOSCOPY
A. RETINOPATHYNo apparent retinopathy No abnormalitiesMild NPDR Microaneurysms onlyModerate NPDR More than just microaneurysms but less than severe
NPDRSevere NPDR Any of the following:
>20 intraretinal hemorrhages in each of 4 quadrantsDefinite venous beading in 2+ quadrantsProminent intraretinal microvascular abnormalities
in 1+ quadrantAnd no signs of proliferative retinopathy
PDR One or more of the following:NeovascularizationVitreous or preretinal hemorrhage
B. MACULAR EDEMADME apparently absent No apparent retinal thickening or hard exudates in
posterior poleDME apparently present Some apparent retinal thickening or hard exudates in
posterior poleDME present Mild DME (some retinal thickening or hard exudates in
posterior pole, but distant from the center of the macula)
Moderate DME (retinal thickening or hard exudates approaching the center of the macula but not involving the center)
Severe DME (retinal thickening or hard exudates involving the center of the macula)
DME = diabetic macular edema; NPDR = nonproliferative diabetic retinopathy; PDR = proliferative diabetic retinopathy.From Fong DS, Aiello LP, Ferris FL, Klein R. Diabetic retinopathy. Diabetes Care. 2004;27:2540-2553.
Medical TherapyAt present, medical management of diabetic retinopathy is aimed at con-
trolling risk factors for progression. The value of tight glycemic control was proved by the DCCT, 1 whose primary prevention arm demonstrated an impressive 76% risk reduction for the onset of retinopathy with intensive therapy. In the secondary prevention arm, patients with early nonproliferative diabetic retinopathy undergoing intensive therapy demonstrated a 47% risk reduction in the development of severe nonproliferative diabetic retinopathy or proliferative diabetic retinopathy, a 51% risk reduction in the need for laser treatment, and a 26% risk reduction in the development of clinically significant macular edema. Other targets for medical management, all associated with
TREATMENT
accelerated retinal damage, include the control of hypertension and hyperlip-idemia, treatment of nephropathy, and careful follow-up during pregnancy, when accelerated retinal disease has been linked to preexisting diabetes (but not gestational disease). Fenofibrate can reduce the progression of retinopa-thy and the need for laser treatment by about one third, with the benefit not clearly related to its reduction of lipid levels. 5 In the Diabetic Retinopathy Candesartan Trials (DIRECT) involving 3326 adults with type 1 diabetes, the angiotensin II receptor blocker candesartan modestly reduced the incidence of diabetic retinopathy, a finding of borderline significance, but it could not prevent its progression in those with established disease. 6
Surgical TherapySurgical management of retinopathy is aimed at slowing disease progres-
sion because baseline visual acuity is difficult to recover. In the 1980s large-scale prospective clinical trials such as the Diabetic Retinopathy Study and the Early Treatment Diabetic Retinopathy Study established photocoagulation as the treatment of choice when retinopathy threatens vision. Most patients with proliferative diabetic retinopathy, and selected patients with severe nonpro-liferative diabetic retinopathy, are now treated primarily with scatter (pan-retinal) photocoagulation; cryotherapy or vitrectomy may be required if laser treatment is unfeasible for technical reasons or because of extensive disease. Clinically significant macular edema is treated with focal photocoagulation, with the possible exception of patients exhibiting no or minimal nonprolifera-tive diabetic retinopathy. In such patients, close follow-up at 2- to 4-month intervals is an acceptable option. The decision to treat depends not only on stage of retinopathy and extent of clinically significant macular edema but also on the type of diabetes, the patient’s general medical status, compliance with follow-up, and the status of the contralateral eye.
These considerations make it imperative for physicians to prospectively identify diabetic patients at risk for retinopathy and visual loss. Nonspecialists may have difficulty diagnosing the stages of retinopathy. Accordingly, patients should be referred to an experienced eye specialist for a complete examina-tion, including a dilated funduscopic examination, tonometry, and slit lamp biomicroscopy. The most recent guidelines of the American Diabetes Associa-tion recommend an initial eye examination within 5 years of diagnosis of type 1 diabetes and at the time of diagnosis in type 2 patients.
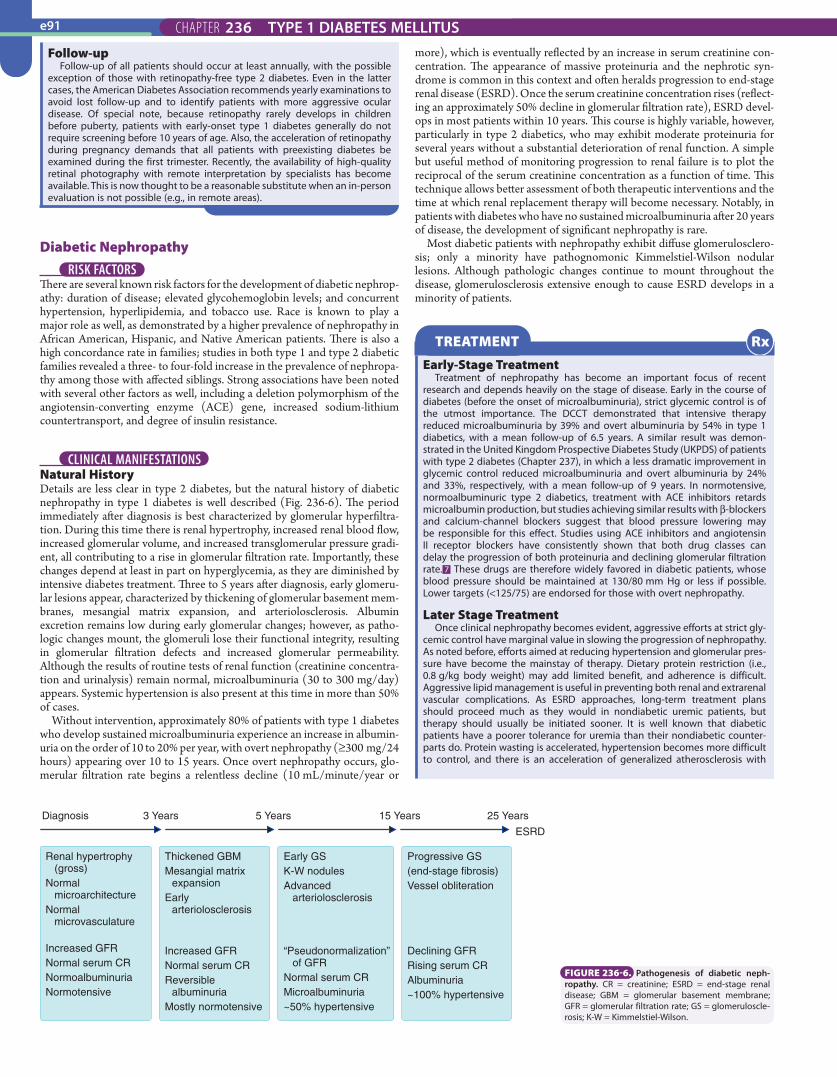
CHAPTER 236 TYPE 1 DIABETES MELLITUSe91
more), which is eventually reflected by an increase in serum creatinine con-centration. The appearance of massive proteinuria and the nephrotic syn-drome is common in this context and often heralds progression to end-stage renal disease (ESRD). Once the serum creatinine concentration rises (reflect-ing an approximately 50% decline in glomerular filtration rate), ESRD devel-ops in most patients within 10 years. This course is highly variable, however, particularly in type 2 diabetics, who may exhibit moderate proteinuria for several years without a substantial deterioration of renal function. A simple but useful method of monitoring progression to renal failure is to plot the reciprocal of the serum creatinine concentration as a function of time. This technique allows better assessment of both therapeutic interventions and the time at which renal replacement therapy will become necessary. Notably, in patients with diabetes who have no sustained microalbuminuria after 20 years of disease, the development of significant nephropathy is rare.
Most diabetic patients with nephropathy exhibit diffuse glomerulosclero-sis; only a minority have pathognomonic Kimmelstiel-Wilson nodular lesions. Although pathologic changes continue to mount throughout the disease, glomerulosclerosis extensive enough to cause ESRD develops in a minority of patients.
Follow-upFollow-up of all patients should occur at least annually, with the possible
exception of those with retinopathy-free type 2 diabetes. Even in the latter cases, the American Diabetes Association recommends yearly examinations to avoid lost follow-up and to identify patients with more aggressive ocular disease. Of special note, because retinopathy rarely develops in children before puberty, patients with early-onset type 1 diabetes generally do not require screening before 10 years of age. Also, the acceleration of retinopathy during pregnancy demands that all patients with preexisting diabetes be examined during the first trimester. Recently, the availability of high-quality retinal photography with remote interpretation by specialists has become available. This is now thought to be a reasonable substitute when an in-person evaluation is not possible (e.g., in remote areas).
ESRD
Diagnosis 3 Years 5 Years 15 Years 25 Years
Renal hypertrophy (gross) Normal microarchitectureNormal microvasculature
Increased GFRNormal serum CRNormoalbuminuriaNormotensive
Thickened GBM Mesangial matrix expansionEarly arteriolosclerosis
Increased GFRNormal serum CRReversible albuminuriaMostly normotensive
Early GSK-W nodulesAdvanced arteriolosclerosis
“Pseudonormalization” of GFRNormal serum CRMicroalbuminuria~50% hypertensive
Progressive GS(end-stage fibrosis)Vessel obliteration
Declining GFRRising serum CRAlbuminuria~100% hypertensive
FIGURE 236-6. Pathogenesis of diabetic neph-rop athy. CR = creatinine; ESRD = end-stage renal disease; GBM = glomerular basement membrane; GFR = glomerular filtration rate; GS = glomeruloscle-rosis; K-W = Kimmelstiel-Wilson.
Diabetic Nephropathy
RISK FACTORSThere are several known risk factors for the development of diabetic nephrop-athy: duration of disease; elevated glycohemoglobin levels; and concurrent hypertension, hyperlipidemia, and tobacco use. Race is known to play a major role as well, as demonstrated by a higher prevalence of nephropathy in African American, Hispanic, and Native American patients. There is also a high concordance rate in families; studies in both type 1 and type 2 diabetic families revealed a three- to four-fold increase in the prevalence of nephropa-thy among those with affected siblings. Strong associations have been noted with several other factors as well, including a deletion polymorphism of the angiotensin-converting enzyme (ACE) gene, increased sodium-lithium countertransport, and degree of insulin resistance.
CLINICAL MANIFESTATIONSNatural HistoryDetails are less clear in type 2 diabetes, but the natural history of diabetic nephropathy in type 1 diabetes is well described (Fig. 236-6). The period immediately after diagnosis is best characterized by glomerular hyperfiltra-tion. During this time there is renal hypertrophy, increased renal blood flow, increased glomerular volume, and increased transglomerular pressure gradi-ent, all contributing to a rise in glomerular filtration rate. Importantly, these changes depend at least in part on hyperglycemia, as they are diminished by intensive diabetes treatment. Three to 5 years after diagnosis, early glomeru-lar lesions appear, characterized by thickening of glomerular basement mem-branes, mesangial matrix expansion, and arteriolosclerosis. Albumin excretion remains low during early glomerular changes; however, as patho-logic changes mount, the glomeruli lose their functional integrity, resulting in glomerular filtration defects and increased glomerular permeability. Although the results of routine tests of renal function (creatinine concentra-tion and urinalysis) remain normal, microalbuminuria (30 to 300 mg/day) appears. Systemic hypertension is also present at this time in more than 50% of cases.
Without intervention, approximately 80% of patients with type 1 diabetes who develop sustained microalbuminuria experience an increase in albumin-uria on the order of 10 to 20% per year, with overt nephropathy (≥300 mg/24 hours) appearing over 10 to 15 years. Once overt nephropathy occurs, glo-merular filtration rate begins a relentless decline (10 mL/minute/year or
Early-Stage TreatmentTreatment of nephropathy has become an important focus of recent
research and depends heavily on the stage of disease. Early in the course of diabetes (before the onset of microalbuminuria), strict glycemic control is of the utmost importance. The DCCT demonstrated that intensive therapy reduced microalbuminuria by 39% and overt albuminuria by 54% in type 1 diabetics, with a mean follow-up of 6.5 years. A similar result was demon-strated in the United Kingdom Prospective Diabetes Study (UKPDS) of patients with type 2 diabetes (Chapter 237), in which a less dramatic improvement in glycemic control reduced microalbuminuria and overt albuminuria by 24% and 33%, respectively, with a mean follow-up of 9 years. In normotensive, normoalbuminuric type 2 diabetics, treatment with ACE inhibitors retards microalbumin production, but studies achieving similar results with β-blockers and calcium-channel blockers suggest that blood pressure lowering may be responsible for this effect. Studies using ACE inhibitors and angiotensin II receptor blockers have consistently shown that both drug classes can delay the progression of both proteinuria and declining glomerular filtration rate. 7 These drugs are therefore widely favored in diabetic patients, whose blood pressure should be maintained at 130/80 mm Hg or less if possible. Lower targets (<125/75) are endorsed for those with overt nephropathy.
Later Stage TreatmentOnce clinical nephropathy becomes evident, aggressive efforts at strict gly-
cemic control have marginal value in slowing the progression of nephropathy. As noted before, efforts aimed at reducing hypertension and glomerular pres-sure have become the mainstay of therapy. Dietary protein restriction (i.e., 0.8 g/kg body weight) may add limited benefit, and adherence is difficult. Aggressive lipid management is useful in preventing both renal and extrarenal vascular complications. As ESRD approaches, long-term treatment plans should proceed much as they would in nondiabetic uremic patients, but therapy should usually be initiated sooner. It is well known that diabetic patients have a poorer tolerance for uremia than their nondiabetic counter-parts do. Protein wasting is accelerated, hypertension becomes more difficult to control, and there is an acceleration of generalized atherosclerosis with
TREATMENT

CHAPTER 236 TYPE 1 DIABETES MELLITUS e92
typically report numbness and tingling of the distal extremities, often in the classic “stocking-glove” distribution. Pain is also common, involving either C fibers (burning, dysesthesia, and allodynia) or the large fibers, usually described as gnawing or like a toothache. Severe, spontaneous, short-lived lancinating pains may also occur. Left unchecked, all types of pain may gradu-ally gain in intensity, with a tendency to worsen at night, and there may be progressive loss of sensorimotor function as well. Later stages of disease can involve severe sensory loss, small muscle wasting of the hands and feet, sensory ataxia, and neuropathic arthropathy (Charcot joints).
Proximal Motor NeuropathyProximal motor neuropathy (diabetic amyotrophy), although classified as a polyneuropathy, is a unique condition that deserves special mention. This syndrome primarily affects elderly type 2 patients and is more common in men. It classically begins with pain in the bilateral thighs, hips, and buttocks, followed by weakness and atrophy of the proximal pelvic muscle groups. Iliopsoas, obturator, and adductor muscles of the pelvis are preferentially affected, with relative preservation of the hamstrings and gluteal muscles. Weight loss may also occur.
Autonomic NeuropathySymptomatic autonomic diabetic neuropathy (Chapter 427) carries a poor prognosis and is thankfully now less common than it once was. Autonomic neuropathy typically accompanies other chronic complications of diabetes and may play a pathogenetic role through disturbed regulation of local blood flow.
CardiacCommon cardiovascular abnormalities seen with autonomic neuropathy include resting tachycardia (due to preferential dysfunction of parasympa-thetic fibers), diminished heart rate variability, prolonged QTc, and silent myocardial ischemia. Diabetic patients often have defective heart rate and blood pressure responses to exercise, and their lack of autonomic regulation places them at high risk for myocardial infarction, congestive heart failure, and sudden cardiac death.
VascularPostural hypotension is probably caused by an impaired sympathetic vaso-constrictor response and impaired cardiac reflexes. Non-neurogenic causes of orthostasis, such as volume depletion, impaired cardiac function, and infectious causes, should be ruled out before the diagnosis is made. Tilt-table testing can be useful to confirm the diagnosis (Chapter 62). Nonphar-macologic measures, such as a raised head position at night, reduction of rapid positional changes, and supportive elastic stockings, can be useful in mild cases. Disabling disease may require pharmacologic intervention; first-line agents include mineralocorticoids (9-α-fluorohydrocortisone) and α-agonists (midodrine).
GastrointestinalAltered gastrointestinal function is commonly seen in diabetes. Constipation is the most common clinical syndrome. Diarrhea is another frequent com-plaint and can be caused by a variety of conditions, including hypermotility (impaired sympathetic inhibition), hypomotility with bacterial overgrowth, pancreatic insufficiency, and bile salt irritation. Treatment is generally aimed at the underlying condition and may include antidiarrheals, intermittent use of broad-spectrum antibiotics, pancreatic enzymes, and bile acid sequestrants (cholestyramine).
Gastroparesis is a particularly disabling condition, often presenting with bloating, early satiety, nausea, and vomiting. Labile glycemic control can result from delayed delivery of nutrients to the small bowel. Treatment of gastroparesis begins with small, frequent meals and the use of metoclo-pramide, a central dopaminergic agonist with gastric cholinergic activity. Early treatment is useful, but the drug’s effect may diminish over time. In selected cases, erythromycin, which acts on the motilin receptor to promote gastric motility, may also be considered. Recently, gastric pacemakers have been used as experimental therapy in selected cases.
GenitourinaryImpaired parasympathetic innervation leads to bladder hypotonia, incom-plete bladder emptying, dribbling, and overflow incontinence. Bethanechol, a parasympathomimetic agent, can be helpful to reverse these symptoms, but its use is often limited by side effects, including salivation, lacrimation,
extensive cardiovascular morbidity. Current options for ESRD patients include hemodialysis, peritoneal dialysis, kidney transplantation, and combined kidney-pancreas transplantation (Chapter 133). Choosing among these options is complex, and decisions must be made on an individual basis. Careful attention to and treatment of coexisting anemia (due to erythropoietin defi-ciency; Chapter 161) and optimization of calcium–vitamin D homeostasis are also very important in any patient with advancing renal disease, but especially in those with diabetes. Finally, mortality associated with both dialysis and organ transplantation is higher in diabetic than in nondiabetic patients, usually because of cardiovascular comorbidity and the more rapid develop-ment of complications such as vascular insufficiency.
Management of ComplicationsGlomerular nephropathy is not the only entity that commonly affects the
genitourinary system in diabetic patients. Asymptomatic bacteriuria and pyelonephritis are twice as common in diabetic women because of several factors, including autonomic bladder dysfunction, impaired organ perfusion, and glycosuria. Papillary necrosis is also associated with diabetes, and renal artery stenosis is more common as well. Hyperkalemia, another frequent com-plication of diabetes, is due to a variety of factors, including insulin deficiency, metabolic acidosis, reduced glomerular filtration rate, use of pharmacologic modulators of the renin-angiotensin axis, and the syndrome of hyporeninemic hypoaldosteronism commonly seen in elderly patients with impaired renal function. Finally, diabetic patients are at notable risk for azotemic complica-tions after the injection of contrast dye for radiologic studies. For this reason, aggressive hydration with intravenous fluids, especially those containing sodium bicarbonate, before and after the study or the prophylactic use of N-acetylcysteine is critical in these cases.
Diabetic Neuropathy
PATHOBIOLOGYThe term diabetic neuropathy describes a wide variety of clinical syndromes representing a complex interplay of pathogenic factors. Chronic, more insidi-ous neuropathies may be mediated by metabolic factors, whereas the more acute, self-limited neuropathies most likely have a vascular cause. Also, nerve growth factor is diminished in the neurons of patients with neuropathy, perhaps limiting regenerative capacity. Autoimmune mechanisms may also be involved; in affected type 1 diabetics, autonomic nerve bundles may show monocytic infiltration, and the sera may contain complement-fixing antibodies to sympathetic ganglia. Because of the multifactorial nature of diabetic neuropathy, current classification schemes are based largely on clini-cal presentation. Current taxonomy includes focal, diffuse, and autonomic neuropathies. Our suboptimal understanding of the underlying causes of diabetic neuropathy has slowed the development of appropriate medical therapies.
CLINICAL MANIFESTATIONSFocal Diabetic NeuropathiesFocal diabetic neuropathies (mononeuropathies) typically present with pain, but motor losses and abnormal deep tendon reflexes can be present. They usually begin suddenly, suggesting a vascular cause. Although any cranial or peripheral nerve can be involved, the most common sites include the oculo-motor, median, radial, and lateral popliteal nerves. Painful radiculopathy may also occur in the distribution of one or more spinal roots and can easily be confused clinically with internal organ disease or postherpetic neuralgia. Because of the self-limited nature of focal neuropathy, treatment is generally aimed at pain control, with physical therapy as needed to maintain function of the affected muscle groups. Focal neuropathies are generally self-limited, with an average duration of 6 to 8 weeks; chronicity can occur but is less common.
Distal Symmetrical PolyneuropathyDistal symmetrical (sensorimotor) polyneuropathy (Chapter 428) is the most common neurologic syndrome seen in diabetes. This process involves all somatic nerves but has a strong predilection for distal sensorimotor nerves of the feet and, to a lesser extent, the hands. Sensory fibers are generally preferentially affected; disease affects both small, unmyelinated C fibers (transmitting pain and temperature) and larger, myelinated Aδ/Aβ fibers, which carry touch, vibration, and proprioception. Early on, most patients with distal neuropathy are asymptomatic, with subtle abnormalities on exam-ination, including the loss of vibration sense, light touch, two-point discrimi-nation, and thermal sensitivity. Once they become symptomatic, patients

CHAPTER 236 TYPE 1 DIABETES MELLITUSe93
diarrhea, and bronchoconstriction. α-Blockers help by relaxing the urinary sphincter, but these agents potentiate postural hypotension, which is already prevalent in diabetic patients. Advanced cases of bladder dysfunction often require intermittent straight catheterization or, if absolutely necessary, the placement of an indwelling catheter. Chronic bacterial colonization and actual infections may result, however.
Erectile dysfunction is commonly seen in male diabetic patients. Selective oral inhibitors of phosphodiesterase type 5 (sildenafil, tadalafil, vardenafil) inhibit the local breakdown of cyclic guanosine monophosphate, which, in the presence of nitric oxide, leads to selective engorgement of the corpus callosum. Caution should be used in patients with suspected coronary disease, and such drugs are contraindicated in combination with nitrate therapy. In men who do not respond to these drugs, intrapenile injections of locally acting vasomotor agents, such as alprostadil and papaverine, have been used with moderate success but carry the risk of priapism, infection, and local fibrosis with repeated use. In refractory cases, urologic referral for a penile prosthetic implant should be considered.
examination of the feet. In affected patients, examination by a specialist is recommended at least once per year. In cases of deformed feet, pressure relief (offloading) is essential and may include the use of orthotics, specialty shoes, assistive devices, or a total-contact cast to direct pressure away from a high-risk area.
Early treatment of diabetic sensory neuropathy should include tight glyce-mic control. In the DCCT, intensive therapy slowed the onset of neuropathy by 70% and the progression of early neuropathy by 57%; in the UKPDS, glucose control in type 2 diabetes was associated with improved vibratory sensation.
The use of several therapies for neuropathic pain (Chapters 29 and 428) has been supported by randomized controlled trials. Tricyclic antidepressants, including amitriptyline, desipramine, and nortriptyline, are moderately effec-tive and well tolerated at low doses, but dose escalation can result in drowsiness, anticholinergic effects, potentiation of cardiac arrhythmias, and worsening of glaucoma. Anticonvulsants, such as carbamazepine and gaba-pentin, are also effective, but carbamazepine can cause hematologic abnor-malities, and patients taking gabapentin may report dizziness, fatigue, headaches, or diarrhea. Two drugs have been specifically approved by the FDA for use in diabetic neuropathy. The first, duloxetine, is a selective serotonin and norepinephrine reuptake inhibitor (related to venlafaxine) that is also approved as an antidepressant. The second, pregabalin, an analogue of γ-aminobutyric acid (GABA; related to gabapentin), modulates calcium channels and GABAer-gic neurotransmission. Both are modestly effective in decreasing neuropathic pain. Topical therapies, such as capsaicin cream (which depletes stores of axonal substance P) and lidocaine gels, can be moderately effective.
TREATMENT
The Diabetic Foot
DEFINITIONThe diabetic foot is characterized by slowly healing plantar ulcers that result from apparently insignificant trauma. Left untreated, superficial ulcers may penetrate to underlying tissues, leading to complications including cellulitis, abscess formation, joint sepsis, and osteomyelitis. Gangrene may occur, and amputation may be required.
CLINICAL MANIFESTATIONSTo varying degrees, the diabetic foot is characterized by the combination of chronic sensorimotor neuropathy, vascular disease, autonomic neuropathy, and impaired immune function. Sensory neuropathy prevents the detection of minor traumatic events, so that ill-fitting shoes (or sharp objects in the shoe) may erode the skin surface without signaling pain. Pedal neuropathy also produces abnormalities in both proprioception and intrinsic muscle motor function, pathologically altering weight distribution on the metatarsal heads and leading to “clawing” of the metatarsophalangeal joints. In advanced cases, abnormal loading of the foot can result in repeated painless fractures and the displacement of normal joint surfaces, producing the so-called Charcot foot or Charcot joint. Aortic and peripheral vascular disease often coexist. Diminished cardiac output or disturbed autoregulatory mechanisms of the microcirculation may further contribute to impaired blood flow and delay ulcer healing. Finally, abnormal immune function (secondary to hyper-glycemia) can predispose to prolonged inflammation and infection, further slowing wound closure and increasing the likelihood of ulcer complications.
PREVENTIONPrevention of the diabetic foot parallels general diabetes care, with an empha-sis on proper nutrition, tight glycemic control, and medical risk factor modification, including smoking cessation. A general foot care prescription (Table 236-7) is valuable, and office visits should routinely include careful
TABLE 236-7 FOOT CARE PRESCRIPTION FOR DIABETIC PATIENTS WITH LOWER EXTREMITY SENSORY NEUROPATHY
Avoid walking barefootDo not apply very hot water or heating pads to the feetInspect the feet daily, using a mirror for plantar surfacesWash the feet daily, drying thoroughly between the toesLubricate dry skin to avoid crackingWear clean, soft, cotton socksWear properly fitting, well-cushioned shoes (insoles)Break in new shoes slowlyConsider a second pair of shoes for evenings (larger size to account for any
dependent edema)Cut toenails straight acrossSchedule regular visits to a diabetic foot care specialist, especially if there are any
signs or symptoms of neuropathy, vascular disease, or bony deformity
TABLE 236-8 KEY ELEMENTS OF A COMPREHENSIVE MANAGEMENT PLAN FOR PATIENTS WITH DIABETES MELLITUS
LIFESTYLE CHANGESHealthy dietAerobic exerciseWeight controlSmoking cessationStress reduction
CONTROL OF MODIFIABLE METABOLIC FACTORSGlucoseLipidsBlood pressureAspirin prophylaxis in higher risk patients
PREVENTIVE CARERegular medical screening examinationsRegular screening for albuminuriaRegular ophthalmologic examinationsRegular podiatric examinations (and self-examinations)Regular dental check-upsYearly influenza vaccinationsPneumococcus vaccination
Once an ulcer has formed, it should be treated aggressively with antibiotics, appropriate local wound care, and débridement of necrotic tissue. In selected cases, local application of recombinant human platelet-derived growth factor can moderately accelerate wound healing. Bioengineered tissue therapies, containing human dermal-epidermal components, are also effective in refrac-tory cases. These products act as biologic dressings and contain live human fibroblasts that deliver growth factors and extracellular matrix components directly to damaged skin. For extensive cases of gangrene or deep tissue infec-tions, surgical amputation may be required. A compromised peripheral circula-tion makes such an outcome more likely. If poor circulation is a dominant clinical feature, a vascular surgeon should be consulted for consideration of revascularization.
TREATMENT
Key elements of a comprehensive management plan for the care of diabetic patients are summarized in Table 236-8.
1. Diabetes Control and Complications Trial Research Group. The effect of intensive treatment of diabetes on the development and progression of long-term complications of insulin-dependent dia-betes mellitus. N Engl J Med. 1993;329:927.

CHAPTER 236 TYPE 1 DIABETES MELLITUS e94
2. Diabetes Control and Complications Trial/Epidemiology of Diabetes Intervention and Complica-tions (DCCT/EDIC) Study Research Group. Intensive diabetes treatment and cardiovascular disease in patients with type 1 diabetes. N Engl J Med. 2005;353:2643-2653.
3. Misso ML, Egberts KJ, Page M, et al. Continuous subcutaneous insulin infusion (CSII) versus mul-tiple insulin injections for type 1 diabetes mellitus. Cochrane Database Syst Rev. 2010;CD005103.
4. Juvenile Diabetes Research Foundation Continuous Glucose Monitoring Study Group, Tamborlane WV, Beck RW, et al. Continuous glucose monitoring and intensive treatment of type 1 diabetes. N Engl J Med. 2008;359:1464-1476.
5. Keech AC, Mitchell P, Summanen PA, et al. Effect of fenofibrate on the need for laser treatment for diabetic retinopathy (FIELD study): a randomised controlled trial. Lancet. 2007;370:1687-1697.
6. Chatuervedi N, Porta M, Klein R, et al. Effect of candesartan on prevention (DIRECT-Prevent 1) and progression (DIRECT-Protect 1) of retinopathy in type 1 diabetes: randomised, placebo-controlled trials. Lancet. 2008;372:1394-1401.
7. Strippoli GF, Bonifati C, Craig M, et al. Angiotensin converting enzyme inhibitors and angiotensin II receptor antagonists for preventing the progression of diabetic kidney disease. Cochrane Database Syst Rev. 2006;4:CD006257.
SUGGESTED READINGS
American Diabetes Association. Standards of medical care in diabetes—2011. Diabetes Care. 2011;34:S11-S61. An up-to-date summary of the current classification of diabetes and clinical practice recommendations for the management of diabetic patients, including goals of treatment.
Camilleri M, Bharucha AE, Farrugia G. Epidemiology, mechanisms, and management of diabetic gastro-paresis. Clin Gastroenterol Hepatol. 2011;9:5-12. Review including nutrition, metoclopramide, venting gastrostomy or jejunostomy, and gastric electrical stimulation.
Cheung N, Mitchell P, Wong TY. Diabetic retinopathy. Lancet. 2010;376:124-136. Review.Kanji JN, Anglin RE, Hunt DL, et al. Does this patient with diabetes have large-fiber peripheral neuropa-
thy? JAMA. 2010;303:1526-1532. Case-based review emphasizing the value of altered vibration and pressure sensation on the physical examination.
Kavanagh BP, McCowen KC. Glycemic control in the ICU. N Engl J Med. 2010;363:2540-2546. Case-based review recommending a target glucose level of 140 to 180 mg/dL.
Melendez-Ramirez LY, Richards RJ, Cefalu WT. Complications for type 1 diabetes. Endocrinol Metab Clin North Am. 2010;39:625-640. Review.
Powlson AS, Coll AP. The treatment of diabetic foot infections. J Antimicrob Chemother. 2010;65:iii3-iii9. Review emphasizing their polymicrobial growth and common multidrug resistance.
Tesfaye S, Boulton AJ, Dyck PJ, et al. Diabetic neuropathies: update on definitions, diagnostic criteria, estimation of severity, and treatments. Diabetes Care. 2010;33:2285-2293. Consensus review of peripheral neuropathies and autonomic neuropathy.
Tridgell DM, Tridgell AH, Hirsch IB. Inpatient management of adults and children with type 1 diabe-tes. Endocrinol Metab Clin North Am. 2010;39:595-608. Review of ketoacidosis, uncontrolled hypergly-cemia, and hypoglycemia, including perioperative insulin management.
Vardanyan M, Parkin E, Gruessner C, et al. Pancreas vs. islet transplantation: a call on the future. Curr Opin Organ Transplant. 2010;15:124-130. Review of the pros and cons of these two alternative.
ADDITIONAL SUGGESTED READINGS
Bergenstal RM, Tamborlane WV, Ahmann A, et al. Effectiveness of sensor-augmented insulin-pump therapy in type 1 diabetes. N Engl J Med. 2010;363:311-320. In a randomized trial, treatment with a sensor-augmented insulin-pump was superior to injection therapy for improving average glycated hemo-globin levels (7.5% vs. 8.1%).
Declèves AE, Sharma K. New pharmacological treatments for improving renal outcomes in diabetes. Nat Rev Nephrol. 2010;6:371-380. Review including direct rennin inhibitors and statins.
Diabetes Control and Complications Trial/Epidemiology of Diabetes Interventions and Complications (DCCT/EDIC) Research Group, Nathan DM, Zinman B, et al. Modern-day clinical course of type 1 diabetes mellitus after 30 years’ duration: the diabetes control and complications trial/epidemiology of diabetes interventions and complications and Pittsburgh epidemiology of diabetes complications experience (1983-2005). Arch Intern Med. 2009;169:1307-1316. A good overview of the epidemiology of the complications of type 1 diabetes, based on a large clinical trial and an observational study.
Dib SA, Gomes MB. Etiopathogenesis of type 1 diabetes mellitus: prognostic factors for the evolution of residual beta cell function. Diabetol Metab Syndr. 2009;1:25-32. A brief review of the autoimmune underpinnings of type 1 diabetes, with mention of ongoing prevention studies in this area.
Dronavalli S, Duka I, Bakris GL.The pathogenesis of diabetic nephropathy. Nat Rev Endocrinol. 2008;4:444-452. Excellent summary of our current understanding of the etiology of diabetic kidney disease.
Kitabchi AE, Umpierrez GE, Miles JM, et al. Hyperglycemic crises in adult patients with diabetes. Dia-betes Care. 2009;32:1335-1343. An excellent summary of the recognition and evidence-based therapy of diabetic ketoacidosis and hyperosmolar hyperglycemic syndrome.
Ma J, Rayner CK, Jones KL, et al. Diabetic gastroparesis: diagnosis and management. Drugs. 2009;69:971-986. Review of management strategies.
Mohamed Q, Gillies MC, Wong TY. Management of diabetic retinopathy. JAMA. 2007;298:902-916. A systematic review.
Pescovitz MD, Greenbaum CJ, Krause-Steinrauf H, et al. Rituximab, B-lymphocyte depletion, and preservation of beta-cell function. N Engl J Med. 2009;361:2145-2152. In a randomized study, ritux-imab (375 mg/M2 once weekly for 4 weeks) increased C peptide levels and reduced glycated hemoglobin and the need for insulin in newly diagnosed type 1 diabetes.
Simó R, Hernández C. Advances in the medical treatment of diabetic retinopathy. Diabetes Care. 2009;32:1556-1562. Update on medical interventions demonstrated to prevent or delay retinopathy in diabetes.
Suckling RJ, He FJ, Macgregor GA. Altered dietary salt intake for preventing and treating diabetic kidney disease. Cochrane Database Syst Rev. 2010;12:CD006763. Reducing salt intake at least to less than 5-6 g/day would lower blood pressure by 6.9/2.9 mm Hg, similar to the benefits of single-drug therapy.
Veves A, Backonja M, Malik RA. Painful diabetic neuropathy: epidemiology, natural history, early diag-nosis, and treatment options. Pain Med. 2008;9:660-674. Systematic review of painful neuropathy in diabetes and its management.