capability of constitutive models to simulate soils with ... · capability of constitutive models...
TRANSCRIPT

Capability of constitutive models to simulate soils with differentOCR using a single set of parameters
Vaclav Hajek∗
David Masın∗
Jan Bohac∗∗Faculty of Science, Charles University in Prague, Czech Republic
correspondence to:David Masın
Charles University in Prague
Faculty of Science
Albertov 6, 128 43 Prague 2, Czech Republic
E-mail: [email protected]
Tel: +420-2-2195 1552, Fax: +420-2-2195 1556
October 30, 2008
Technical Note accepted for publication inComputers and Geotechnics
AbstractIncorporation of void ratio as a state variable into constitutive models allows, inprinciple, to use a singleset of parameters for soils with differentOCRs. Two sets of experimental data on reconstituted clays areused for evaluation of three constitutive models of different complexity (Modified Cam clay model, 3-SKHmodel, hypoplastic model for clays). Although all the models predict the influence ofOCR correctly fromthe qualitative point of view, quantitative comparison using a suitable scalar error measure reveals meritsand shortcomings of different models.
Keywords: clay; overconsolidation ratio; constitutive model; hypoplasticity; kinematic hardening.
1 Introduction
It has been recognised since the development of critical state soil mechanics in 1960’s that realisticconstitutive models should consider void ratioe as a state variable. This approach, in theory, allows to usea single set of material parameters to predict the behaviour of soils with a broad range of overconsolidationratios (OCRs) and thus simplifies practical application of constitutive models. As a matter of fact,however, qualitatively correct predictions of the behaviour of soils with differentOCRs based on a singleset of material parameters do not necessarily imply satisfactory performance from the quantitative point ofview. An engineer aiming to apply the constitutive model for solution of practical geotechnical problemsshould be aware of the range ofOCRs for which a single set of material parameters may be used anddesign an experimental program accordingly. Also, the mean stress andOCR vary throughout the soilstrata. If their influence is not predicted appropriately, different parameter sets must be used for differentdepth levels, which is not desirable.
To the knowledge of the authors, a detailed evaluation of constitutive models inthis respect is missingthroughout the geotechnical literature. To investigate predictive capabilities of currently availableconstitutive models, three models of different complexities based on different mathematical backgroundshave been evaluated using two sets of experimental data on reconstituted fine-grained soils at differentOCRs. It is acknowledged that complete evaluation of the models for use in practical problems shouldconsider a wide range of stress paths and loading conditions, preferably directional response of soil shouldbe studied (see, e.g., [14, 5]). As such detailed experimental data for differentOCRs are not available, thepresent evaluation focus on shear experiments performed under axisymmetric conditions in the triaxialapparatus.
Soil mechanics sign convention is used throughout this paper, i.e. compression stresses and strains arepositive. All stresses are effective stresses in the sense of Terzaghi principle. The single element and finiteelement implementations of all the models considered is freely available [4].
2 Experimental data
Two sets of experimental data have been used throughout this study. Thefirst is a comprehensive set ofdata on kaolin clay by Hattab and Hicher [6], which has been supplemented by purpose-made experimentson reconstituted kaolinitic-illitic clay in order to draw more general conclusions.
The experiments on kaolin clay have been described in detail in Reference[6]. They were conducted in aBishop and Wesley triaxial apparatus with computer control, which made it possible to follow the constanteffective mean stressp path with accuracy±1 kPa. The axial deformation has been recorded by means ofexternal LVDT transducers and volumetric strains using GDS pressure controllers. The specimens ofkaolin clay with Atterberg limitswL = 40% andwP = 20% were prepared in a consolidometer from aslurry at a water content of twice the liquid limit. The height of the samples was equal to their width (35mm) and smooth end-plattens were used. The specimens were isotropically loaded up to the maximumpreconsolidation pressurep0 = 1000 kPa and then isotropically unloaded to the pressurep = p0/OCR,
1

from which the shear tests at constant mean stressp followed. Altogether 12 shear experiments arereported, atOCR = 1, 2.25, 2.5, 2.7, 3, 4, 5, 8, 10, 20 and50, with stress paths shown in Fig. 1(a).
The soil for the second set of experiments was a kaolinitic-illitic clay from a Tertiarry sedimentary basinnearUstı and Labem, Czech Republic, which is characterised bywL = 58 − 62% andIP = 29 − 34% [7].Constant cell pressure drained triaxial tests have been performed in a triaxial cell using a load frame. Axialdeformation has been measured externally by means of digital dial gauge, volumetric strains were recordedby GDS pressure controllers.
The soil from a rotary drill core was reconstituted in distilled water at a watercontent approximately 1.5wL, transferred into a double drainage consolidometer and consolidated under vertical load of 70 kPa,which was enough to create specimens that could be handled and transferred into the triaxial apparatus.After removing from the consolidometer, the specimens were trimmed to a slenderness ratio 2:1 (D=38mm, H=76 mm) and set up in the triaxial cell. A radial drainage has been used in order to speed up thedissipation of pore pressures, while the bottom drainage was facilitated by rough end platens. Beforetesting, Skempton B-value has been measured in order to check saturation of the samples. A minimumvalue of 97 % was required.
A similar test procedure to that of Hattab and Hicher [6] has been followed,i.e. the specimens were firstisotropically consolidated to the mean stressp0 = 600 kPa and then isotropically unloaded top = p0/OCR. Five different values ofOCR have been applied, namelyOCR = 1, 1.5, 2, 4 and8. Fromthis state, strain-controlled drained triaxial tests have been conducted up tofailure, at the rate of axialdeformation of 0.001 mm/min. The stress paths are shown in Fig. 1(b). Due to theuse of the rough endplatens, the deformation tended to localise into shear bands in the post-peak regime, especially in the caseof specimens tested at higher overconsolidation ratios. This rendered thelarge-strain data less reliable, ithad however only little influence on the pre-peak states, which were in a particular scope of this study.
0
200
400
600
800
1000
1200
0 200 400 600 800 1000
q [k
Pa]
p [kPa]
(a)
0
100
200
300
400
500
600
0 100 200 300 400 500 600 700 800
q [k
Pa]
p [kPa]
(b)
Figure 1: Stress paths of experiments used for evaluation of the models on kaolin clay by Hattab and Hicher[6] (a) and illitic clay (b).
3 Constitutive models and their parameters
Three constitutive models of different complexity and based on differentmathematical backgrounds havebeen selected for evaluation presented in the paper. All of them are based on the critical state soilmechanics and as such it is implicitly assumed that consideration of void ratio (or, equivalently,preconsolidation pressure) as a state variable is sufficient to use a singleset of material parameters forpredicting the behaviour of soils with differentOCRs.
The first model considered is a basic critical state soil mechanics model,Modified Cam clay (CC)[17].This model has a number of well-known shortcomings, among which possibly themost important is an
2

elastic behaviour inside the yield surface and overprediction of peak friction anglesϕp of overconsolidatedsoils. However, as this model is still widely used in practice it provides a valuable reference for the twomore advanced models considered. In this work a version with Butterfield’s[3] compression law is used,mainly due to the simplified comparison with the two other models, which use the same compression law.Therefore, the isotropic virgin compression line reads
ln(1 + e) = N − λ∗ ln(p/pr) (1)
with parametersN andλ∗ and a reference stresspr = 1 kPa. The slope of the isotropic unloading line iscontrolled by the parameterκ∗, a constant shear modulusG is assumed inside the yield surface and thestress ratioη = q/p at critical state (whereq is shear stress andp is mean stress) is equal to the parameterM .
The second model,three surface kinematic hardening model (3SKH)by Stallebrass and Taylor [19], is anadvanced example of the kinematic hardening plasticity models for soils [15]. The model represents anevolution of the CC model and of the two surface kinematic hardening model byAl Tabbaa and MuirWood [1]. With respect to the model by Al Tabbaa and Muir Wood [1], two kinematic surfaces in the stressspace (named yield surface and history surface) improve predictions in the small strain range and enablethe effects of recent stress history [2] to be modelled. Since the hardening modulus depends on the distancefrom the outer bounding surface (of the same shape as the yield surfaceof the CC model), the 3SKH modelpredicts the non-linear behaviour inside the bounding surface and thus itdoes not suffer from the two mainshortcomings of the CC model. Sketch of the three characteristic surfaces of the 3SKH model is in Fig. 2.
sasb
aa p
q
Ta
TSa
bounding surface
history surface
yield surface
Figure 2: Characteristic surfaces of the 3-SKH model, from Masın et al. [14].
Four of the parameters of the 3SKH model, namelyN , λ∗, κ∗ andM , have the same meaning as theparameters of the considered version of the CC model. The shear modulus inside the elastic rangeG iscalculated from an equation by Viggiani and Atkinson [20]
G
pr
= A
(
p
pr
)n
OCRm (2)
with parametersA, n andm. The parametersT andS characterise the relative sizes of the kinematicsurfaces, as demonstrated in Fig. 2 (if we denote the size of the bounding surface2a, then the sizes ofhistory and yield surfaces are equal to2Ta and2TSa respectively). The last parameter,ψ, is an exponentthat controlls the influence of the distance of the current stress state fromthe bounding surface on thehardening modulus, and therefore it controlls the rate of decay of stiffness as the state moves towardsbounding surface (as demonstrated later in the text, e.g. Fig. 9).
The last model tested is based on a mathematically different approach – hypoplasticity. Ahypoplasticconstitutive model for clays(HC) was proposed by Masın [11] and investigated further by Masın and Herle[13], who have shown that the model predicts the state boundary surface (defined as a boundary of all
3

possible states in the stress vs. void ratio space), although it is not explicitly incorporated in itsmathematical formulation. The model combines the mathematical formulation of hypoplastic models (e.g.,[9, 21, 16, 8]) with the basic principles of the critical state soil mechanics, and therefore the influence ofOCR is predicted in a qualitatively similar way to the 3SKH and CC models. Similarly to the 3SKHmodel, the hypoplastic model predicts non-linear behaviour inside the state boundary surface, and thereforeit does not suffer from shortcomings of the CC model.
The model requires five parameters with a similar physical interpretation as parameters of the CC model.N andλ∗ are coefficients in the Butterfield’s [3] compression law (1),κ∗ controls the slope of the isotropicunloading line in theln(1 + e) vs. ln(p/pr) space.ϕc is the critical state friction angle, which is for triaxialcompression linked directly to the parameterM of the CC and 3SKH models through
ϕc = sin−1
(
6M
3 +M
)
(3)
The last parameterr determines the shear modulus, which for a givenOCR depends linearly on the meanstressp, same as the bulk modulus does. Due to the non-linear character of the basichypoplastic equation,the parameterr is usually calibrated by means of a parametric study, similarly to the parameterψ of the3SKH model.
4 Scalar error measure
In order to decrease the subjectivity of the model calibration and in order toasses the model performancein the pre-failure regime, a scalar measure of the ”difference” between model predictions and experimentaldata has been introduced.
The suitable error measure should reflect differences in both predictedand observed stiffnesses and strainpath directions. As experiments and simulations are characterised by identical stress paths, simulation erroris here measured in the strain space. Let the pre-failure part of the stress path be subdivided intoLincrements, each of length∆q = qmax/L. Then, following Masın et al. [14], the simulation error can bedefined as
err(OCR, qmax) =
L∑
k=1
∥
∥
∥∆ǫ
(k)sim − ∆ǫ
(k)exp
∥
∥
∥
L∑
k=1
∥
∥
∥∆ǫ
(k)exp
∥
∥
∥
(4)
where∆ǫ(k)exp and∆ǫ
(k)sim are the measured and predicted strain increment tensors, respectively,
corresponding to thek-th stress increment of size∆q.
In order to demonstrate the meaning of the numerical value oferr, it is plotted for two special cases in Fig.3. First, experiment and simulation with identical strain path directions and different incrementalstiffnesses (measured by their ratioα = ‖∆ǫ
(k)exp‖/‖∆ǫ
(k)sim‖ from (4), i.e.α = Gsim/Gexp = Ksim/Kexp,
whereG andK are shear and bulk moduli respectively) are considered. In the second case experiment andsimulation are characterised by identical incremental stiffnesses (α = 1), but different directions of thestrain paths measured by the angleψǫ in the Rendulic plane ofǫ (ǫa vs.
√2ǫr, whereǫa andǫr are axial
and radial strains respectively). Investigation of (4) reveals thaterr = |1 − 1/α| for the first case anderr = |2 sin(∆ψǫ/2)| for the second one (with∆ψǫ = ψǫ sim − ψǫ exp).
Calculation oferr is complicated by the scatter in experimental data, which becomes important in testsatlow mean stressesp (highOCRs). Therefore, for calculatingerr the experimental data were approximatedby smooth curves, namely by polynomial functions of the form
ǫs = asqbs + csq
ds + esqfs . . . (5)
4

0
0.2
0.4
0.6
0.8
1
1.510.5
err
α70450-45
∆ψε [°]
Figure 3: Numerical values oferr for experiments and simulations that differ only in incremental stiffnesses(left) and strain path directions (right).
andǫv = avq
bv + cvqdv + evq
fv . . . (6)
with coefficientsas, bs, cs, ds, es, fs . . . andav, bv, cv, dv, ev, fv . . . . In this way a good fit of experimentaldata was achieved, as demonstrated in Fig. 4 for an experiment on kaolin clay with OCR = 10.
0
0.4
0.8
1.2
1.6
-0.02 -0.01 0
q/p
[-]
εv [-]0 0.02 0.04 0.06
εs [-]
experimentpolynomial
Figure 4: Approximation of experimental data on kaolin clay forOCR = 10 by a polynomial function forcalculation oferr.
In the present work, for all simulationsqmax from Eq. (4) is chosen such thatqmax = 0.7qpeak, whereqpeak is the peak deviator stress achieved in the particular experiment. The value of err thereforecorresponds to model prediction in the pre-peak, medium strain range, and thus its value should not besignificantly influenced by localisation of deformation into shear bands. Thisoccurred mainly in the testson illitic clay at higherOCRs. L in Eq. (4) is taken high enough so it does not influence calculatederr(typically,L = 100 was used).
5 Calibration
For the purpose of the calibration of the models we divide their parameters intotwo groups. In the firstgroup are the parameters with a clear physical meaning, which are calibrated by standardized calibrationprocedures (e.g.,ϕc, λ∗,N ). The second group covers parameters whose calibration is rather subjectiveand they influence significantly the results of simulation of the shear tests, which are in a scope of thisstudy (G, ψ, r). In the present work, parameters from the first group are calibratedusing a standardprocedures and their values are kept constant for all simulations. Parameters from the second group arefound separately for differentOCRs. In order to eliminate subjectivity from their calibration, they areevaluated by means of minimisation of the value oferr from Eq. (4).
5

The initial states ofp, q ande measured in the experiments were used in the simulations. In addition, the3SKH model requires to specify the initial positions of the kinematic surfaces.These were aligned toreflect the stress history followed in the experiments (Fig. 5).
Figure 5: Sketch of the initial position of the kinematic surfaces of the 3SKH model for normally consoli-dated (A) and overconsolidaed (B) states
5.1 The first group of parameters
ParametersN , λ∗ andκ∗ were found by evaluating an isotropic loading and unloading test, asdemonstrated for the CC model in Fig. 6(a) for the kaolin clay and in Fig. 6(b)for the illitic clay. Allisotropic experiments performed on illitic clay are shown in Fig. 6(b), which demonstrate consistent resultsfor the slopeλ∗ and a certain scatter of the slope of the isotropic unloading line (parameterκ∗). Note thatthe numerical values of the parameterκ∗ differ in Tab. 2, as they have slightly different physicalinterpretations in the three constitutive models. In the 3SKH model,κ∗ specifies a bulk stiffness in thesmall strain range and it was calculated from an assumed Poisson ratio and the shear modulus, as accuratevolumetric measurements in the small strain range were not available. In the HC model, the slope of theisotropic unloading line is for higherOCRs influenced also by the non-linear character of the hypoplasticequation. For this reason,κ∗ of the HC model could be considered to belong to the second group ofparameters. However, as it has only minor effect on the predictions of shear tests (scope of this study), itsvalue was kept constant for all simulations.
0.45
0.5
0.55
0.6
0.65
2 3 4 5 6 7
ln (
1+e)
ln p/pr [-]
κ*
λ*
1
1
N=0.918, λ*=0.065κ*=0.0175
experiment
(a)
0.5
0.55
0.6
0.65
0.7
0.75
0.8
2 3 4 5 6 7
ln (
1+e)
ln (p/pr) [-]
N=1.09, λ*=0.091
κ*=0.016
(b)
Figure 6: Calibration of parametersN , λ∗ andκ∗ of the CC model for kaolin clay (a) and illitic clay (b).
An approximate average value of the critical state friction angle from the shear experiments performed at
6

low OCRs (so the results are not influenced significantly by localisation of deformationinto shear bands)was used to calculate the parametersM andϕc (linked via Eq. 3), see Fig. 7(a) for kaolin clay and Fig.7(b) for the illitic clay.
0
0.2
0.4
0.6
0.8
1
1.2
1.4
0 0.05 0.1 0.15 0.2 0.25
q/p
εs
OCR=1OCR=2
OCR=2.24M=1.1
0
0.2
0.4
0.6
0.8
1
0 0.05 0.1 0.15 0.2 0.25
q/p
[-]
εs [-]
OCR=1OCR=1.5
OCR=2M=0.72
Figure 7: Calibration of parameterM (or, alternatively,ϕc) for kaolin clay (a) and illitic clay (b).
The 3SKH model requires five additional parameters that control the behaviour in the small strain rangeand the influence of the recent history (A, n,m, T andS). Neither the data on kaolin clay by Hattab andHicher [6] nor the present data on illitic clay contain experiments required for their calibration. However,as these parameters do not influence significantly the results of the simulationsin the medium strain rangefor tests with stress history shown in Fig. 5, they were taken over from different experimental studies onsoils with similar mineralogy and granulometry as the soils used for the present evaluation. Namely,parameters evaluated using the tests on Speswhite kaolin by Stallebrass and Taylor [19] were consideredrelevant for the kaolin clay, and parameters evaluated by Masın [10] using experiments on reconstitutedand resedimented London clay [18] were considered representative for the illitic clay.
The parameters from the first group used in the present study are summarised in Table 1.
5.2 The second group of parameters
The parameters from the second group, namelyG (CC),r (HC) andψ (3SKH), influence significantly theresults of the shear experiments in the pre-failure regime and their calibrationis subjective. In order toeliminate this subjectivity, these parameters were found by minimizing the scalar error measureerrdefined in Sec. 4 (Eq. (4)). The calibration is demonstrated in the case ofψ of the 3SKH model using anexperiment on kaolin clay atOCR = 10.
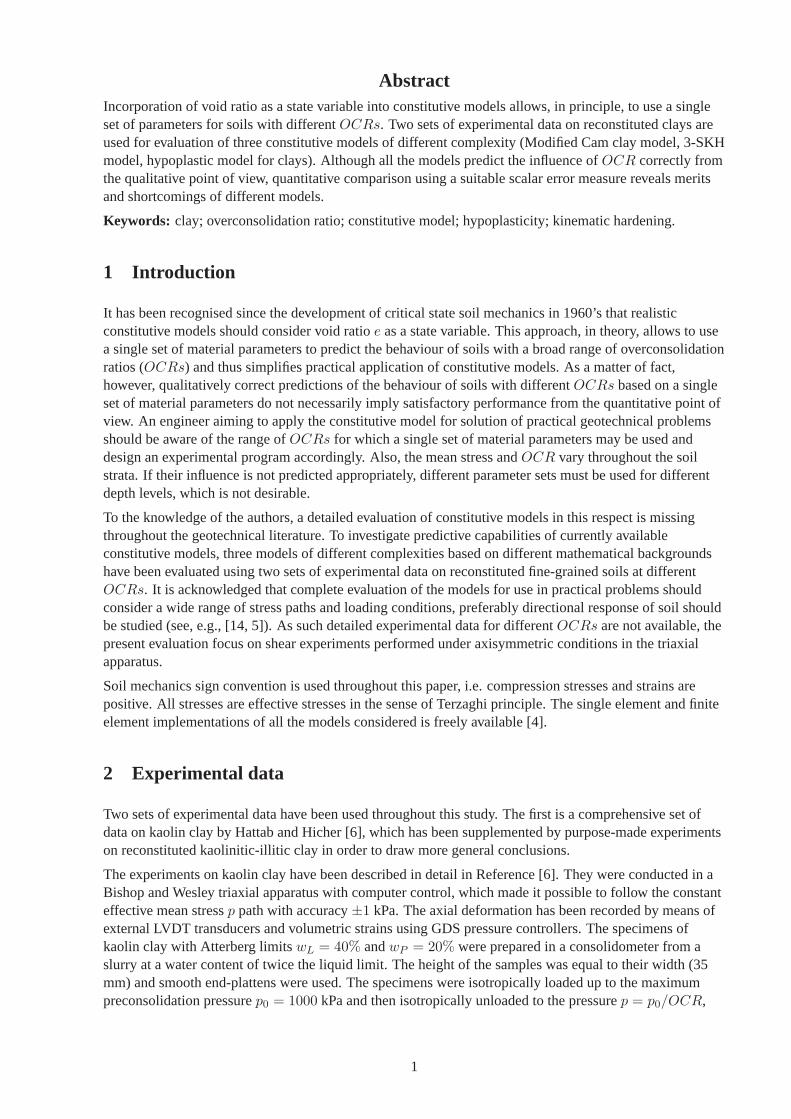
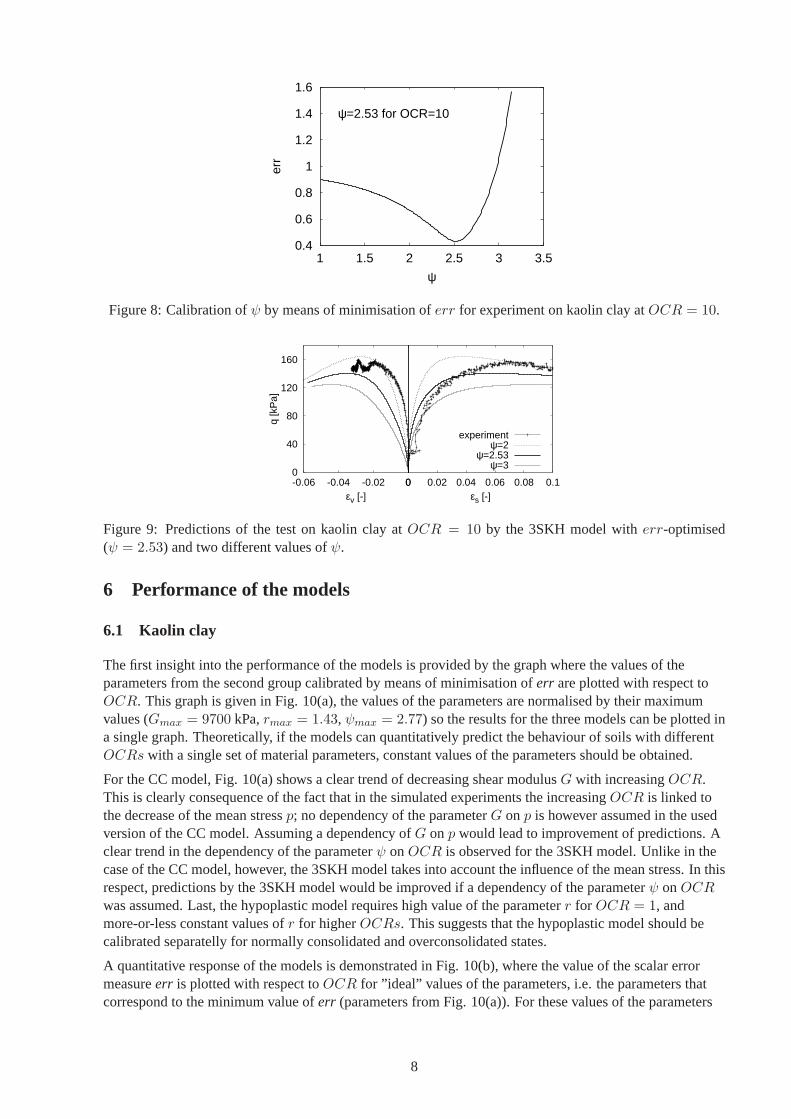
The relation betweenerr andψ is shown in Fig. 8. The curve has a clear minimum that corresponds toψ = 2.53. To demonstrate the applicability of the proposed approach to calibration of the models, theoptimised value ofψ, together with two different values, were used for simulation of the experiment, whichwas used for the calibration (Fig. 9). When both stress-strain diagram and the volumetric response in thepre-failure regime are taken into account, it may be concluded that the valueof ψ found by optimisationwith respect toerr corresponds quite well to the value that could have been chosen by meansof asubjective trial-and-error calibration procedure.
Parametersr andG were found using the same procedure as outlined above, a clear minimum oferr wasobtained in all cases. The only exception were tests on the illitic clay at lowOCRs, where the change ofthe parameters leads to a gradual decrease oferr without a minimum value.
7
0.4
0.6
0.8
1
1.2
1.4
1.6
1 1.5 2 2.5 3 3.5er
rψ
ψ=2.53 for OCR=10
Figure 8: Calibration ofψ by means of minimisation oferr for experiment on kaolin clay atOCR = 10.
0
40
80
120
160
-0.06 -0.04 -0.02 0
q [k
Pa]
εv [-]0 0.02 0.04 0.06 0.08 0.1
εs [-]
experimentψ=2
ψ=2.53ψ=3
Figure 9: Predictions of the test on kaolin clay atOCR = 10 by the 3SKH model witherr-optimised(ψ = 2.53) and two different values ofψ.
6 Performance of the models
6.1 Kaolin clay
The first insight into the performance of the models is provided by the graphwhere the values of theparameters from the second group calibrated by means of minimisation oferr are plotted with respect toOCR. This graph is given in Fig. 10(a), the values of the parameters are normalised by their maximumvalues (Gmax = 9700 kPa,rmax = 1.43, ψmax = 2.77) so the results for the three models can be plotted ina single graph. Theoretically, if the models can quantitatively predict the behaviour of soils with differentOCRs with a single set of material parameters, constant values of the parameters should be obtained.
For the CC model, Fig. 10(a) shows a clear trend of decreasing shear modulusG with increasingOCR.This is clearly consequence of the fact that in the simulated experiments the increasingOCR is linked tothe decrease of the mean stressp; no dependency of the parameterG onp is however assumed in the usedversion of the CC model. Assuming a dependency ofG onp would lead to improvement of predictions. Aclear trend in the dependency of the parameterψ onOCR is observed for the 3SKH model. Unlike in thecase of the CC model, however, the 3SKH model takes into account the influence of the mean stress. In thisrespect, predictions by the 3SKH model would be improved if a dependencyof the parameterψ onOCRwas assumed. Last, the hypoplastic model requires high value of the parameter r for OCR = 1, andmore-or-less constant values ofr for higherOCRs. This suggests that the hypoplastic model should becalibrated separatelly for normally consolidated and overconsolidated states.
A quantitative response of the models is demonstrated in Fig. 10(b), where the value of the scalar errormeasureerr is plotted with respect toOCR for ”ideal” values of the parameters, i.e. the parameters thatcorrespond to the minimum value oferr (parameters from Fig. 10(a)). For these values of the parameters
8
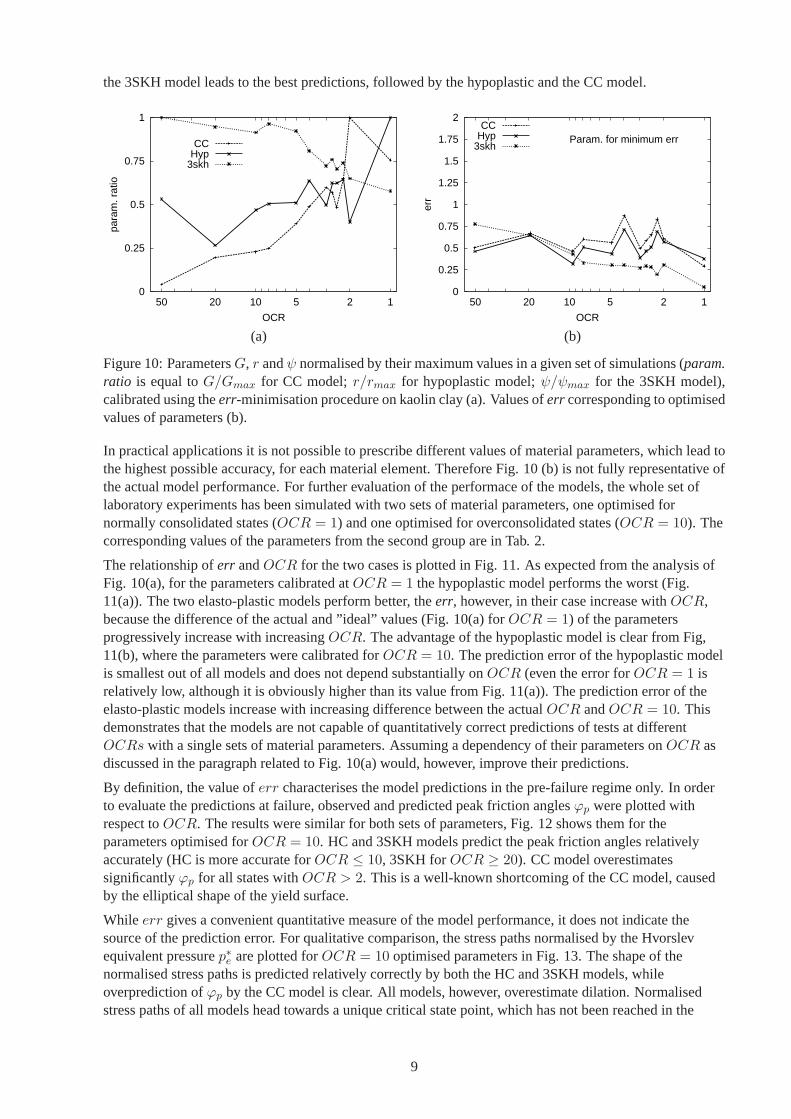
the 3SKH model leads to the best predictions, followed by the hypoplastic andthe CC model.
0
0.25
0.5
0.75
1
50 20 10 5 2 1
para
m. r
atio
OCR
CCHyp
3skh
(a)
0
0.25
0.5
0.75
1
1.25
1.5
1.75
2
50 20 10 5 2 1
err
OCR
Param. for minimum errCC
Hyp3skh
(b)
Figure 10: ParametersG, r andψ normalised by their maximum values in a given set of simulations (param.ratio is equal toG/Gmax for CC model;r/rmax for hypoplastic model;ψ/ψmax for the 3SKH model),calibrated using theerr-minimisation procedure on kaolin clay (a). Values oferr corresponding to optimisedvalues of parameters (b).
In practical applications it is not possible to prescribe different values of material parameters, which lead tothe highest possible accuracy, for each material element. Therefore Fig. 10 (b) is not fully representative ofthe actual model performance. For further evaluation of the performaceof the models, the whole set oflaboratory experiments has been simulated with two sets of material parameters,one optimised fornormally consolidated states (OCR = 1) and one optimised for overconsolidated states (OCR = 10). Thecorresponding values of the parameters from the second group are in Tab. 2.
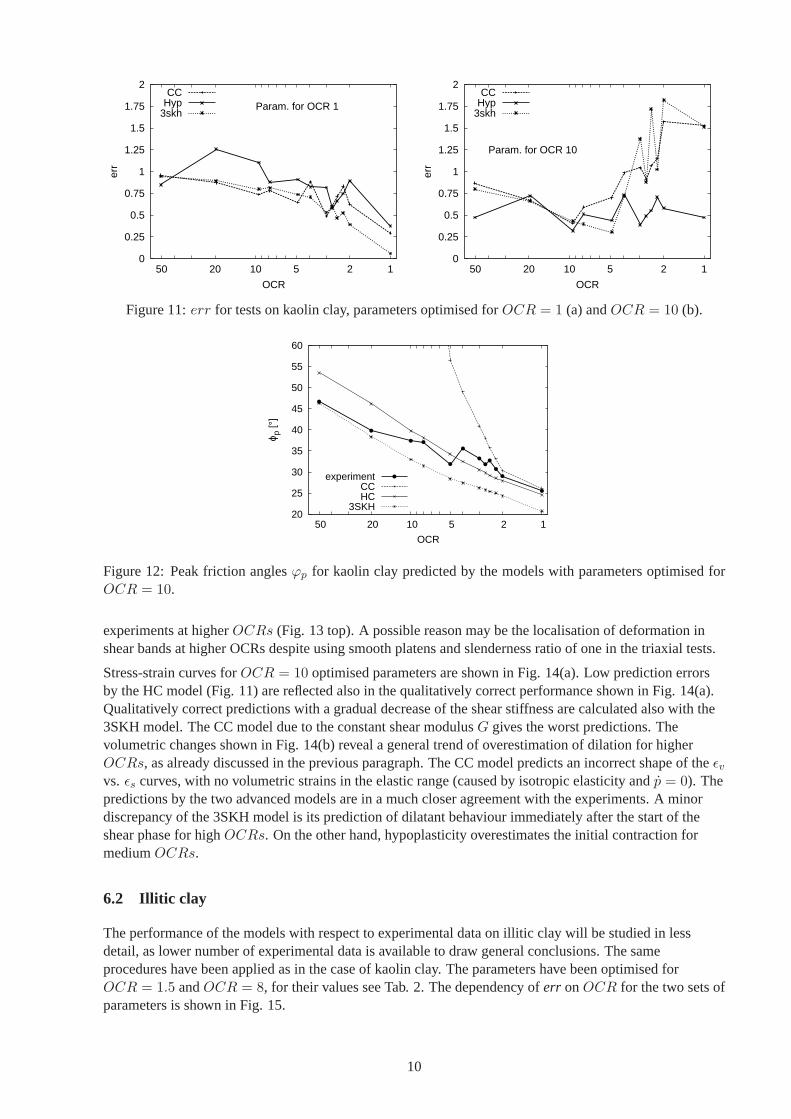
The relationship oferr andOCR for the two cases is plotted in Fig. 11. As expected from the analysis ofFig. 10(a), for the parameters calibrated atOCR = 1 the hypoplastic model performs the worst (Fig.11(a)). The two elasto-plastic models perform better, theerr, however, in their case increase withOCR,because the difference of the actual and ”ideal” values (Fig. 10(a) for OCR = 1) of the parametersprogressively increase with increasingOCR. The advantage of the hypoplastic model is clear from Fig,11(b), where the parameters were calibrated forOCR = 10. The prediction error of the hypoplastic modelis smallest out of all models and does not depend substantially onOCR (even the error forOCR = 1 isrelatively low, although it is obviously higher than its value from Fig. 11(a)). The prediction error of theelasto-plastic models increase with increasing difference between the actual OCR andOCR = 10. Thisdemonstrates that the models are not capable of quantitatively correct predictions of tests at differentOCRs with a single sets of material parameters. Assuming a dependency of their parameters onOCR asdiscussed in the paragraph related to Fig. 10(a) would, however, improve their predictions.
By definition, the value oferr characterises the model predictions in the pre-failure regime only. In orderto evaluate the predictions at failure, observed and predicted peak friction anglesϕp were plotted withrespect toOCR. The results were similar for both sets of parameters, Fig. 12 shows them for theparameters optimised forOCR = 10. HC and 3SKH models predict the peak friction angles relativelyaccurately (HC is more accurate forOCR ≤ 10, 3SKH forOCR ≥ 20). CC model overestimatessignificantlyϕp for all states withOCR > 2. This is a well-known shortcoming of the CC model, causedby the elliptical shape of the yield surface.
While err gives a convenient quantitative measure of the model performance, it does not indicate thesource of the prediction error. For qualitative comparison, the stress paths normalised by the Hvorslevequivalent pressurep∗e are plotted forOCR = 10 optimised parameters in Fig. 13. The shape of thenormalised stress paths is predicted relatively correctly by both the HC and 3SKH models, whileoverprediction ofϕp by the CC model is clear. All models, however, overestimate dilation. Normalisedstress paths of all models head towards a unique critical state point, which has not been reached in the
9
0
0.25
0.5
0.75
1
1.25
1.5
1.75
2
50 20 10 5 2 1
err
OCR
Param. for OCR 1CC
Hyp3skh
0
0.25
0.5
0.75
1
1.25
1.5
1.75
2
50 20 10 5 2 1
err
OCR
Param. for OCR 10
CCHyp
3skh
Figure 11:err for tests on kaolin clay, parameters optimised forOCR = 1 (a) andOCR = 10 (b).
20
25
30
35
40
45
50
55
60
50 20 10 5 2 1
ϕ p [°
]
OCR
experimentCCHC
3SKH
Figure 12: Peak friction anglesϕp for kaolin clay predicted by the models with parameters optimised forOCR = 10.
experiments at higherOCRs (Fig. 13 top). A possible reason may be the localisation of deformation inshear bands at higher OCRs despite using smooth platens and slenderness ratio of one in the triaxial tests.
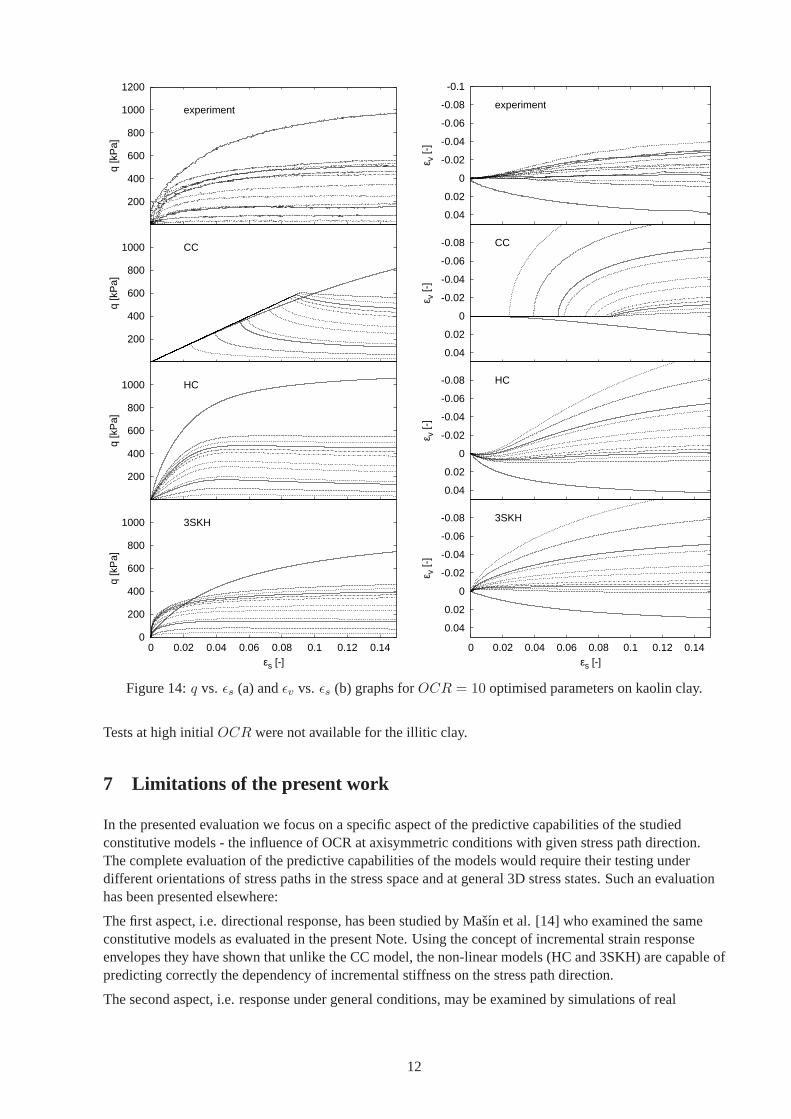
Stress-strain curves forOCR = 10 optimised parameters are shown in Fig. 14(a). Low prediction errorsby the HC model (Fig. 11) are reflected also in the qualitatively correct performance shown in Fig. 14(a).Qualitatively correct predictions with a gradual decrease of the shear stiffness are calculated also with the3SKH model. The CC model due to the constant shear modulusG gives the worst predictions. Thevolumetric changes shown in Fig. 14(b) reveal a general trend of overestimation of dilation for higherOCRs, as already discussed in the previous paragraph. The CC model predicts an incorrect shape of theǫvvs. ǫs curves, with no volumetric strains in the elastic range (caused by isotropic elasticity andp = 0). Thepredictions by the two advanced models are in a much closer agreement with theexperiments. A minordiscrepancy of the 3SKH model is its prediction of dilatant behaviour immediatelyafter the start of theshear phase for highOCRs. On the other hand, hypoplasticity overestimates the initial contraction formediumOCRs.
6.2 Illitic clay
The performance of the models with respect to experimental data on illitic clay willbe studied in lessdetail, as lower number of experimental data is available to draw general conclusions. The sameprocedures have been applied as in the case of kaolin clay. The parameters have been optimised forOCR = 1.5 andOCR = 8, for their values see Tab. 2. The dependency oferr onOCR for the two sets ofparameters is shown in Fig. 15.
10

0
0.2
0.4
0.6
0 0.2 0.4 0.6 0.8 1
q/p e*
p/pe*
3SKH
0.2
0.4
0.6
q/p e*
HC
0.2
0.4
0.6q/
p e*CC
0.7
0.6
0.4
0.2
q/p e*
experiment
Figure 13: Stress paths normalised byp∗e for OCR = 10 optimised parameters.
As in the case of the kaolin clay, the CC model gives the highest values oferr. Conclusions for thehypoplastic model from the study on kaolin clay are confirmed. The values of the parameterr are similarfor OCR = 1.5 andOCR = 8 and also the values oferr are in both cases more-or-less constant for thewhole range ofOCRs. No significant difference in the calculated value oferr is now observed fornormally consolidated state. The value oferr of the 3SKH model is significantly dependent onOCR. Itgives the best predictions forOCR ≥ 4, forOCR ≤ 2 the values oferr are smaller for the hypoplasticmodel.
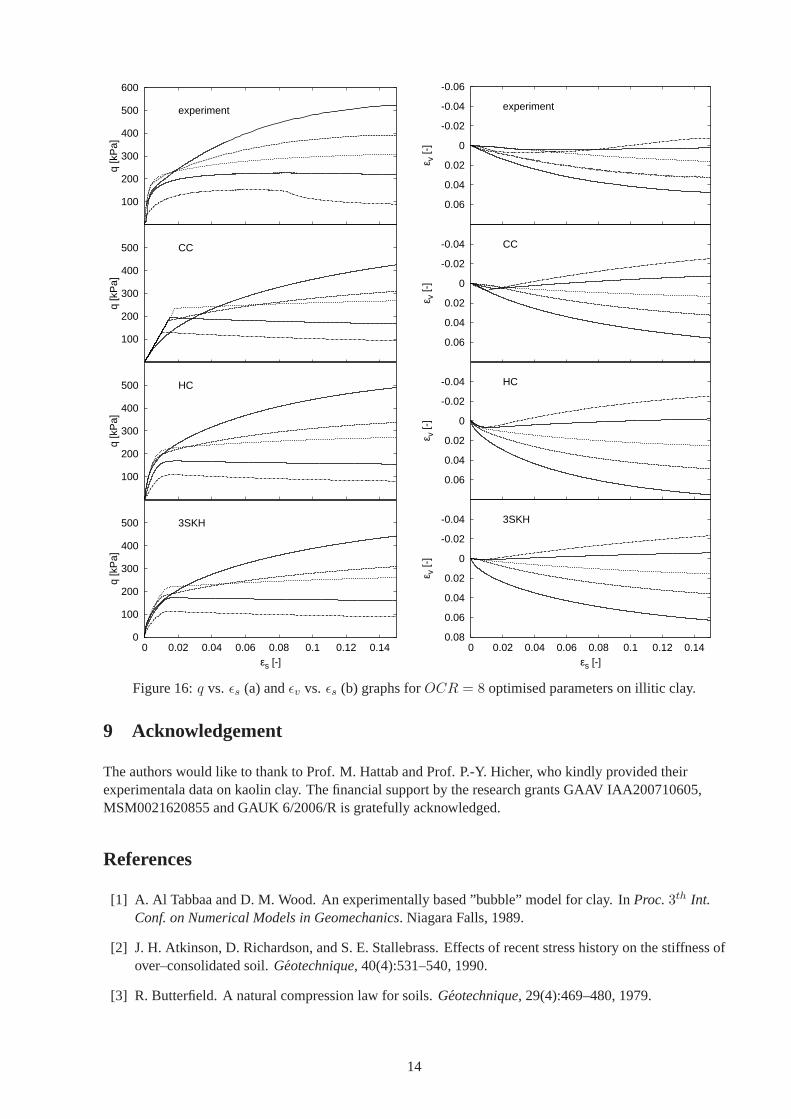
From the qualitative point of view (Fig. 16) the results are again in agreement with the results on kaolinclay. The two advanced models give better predictions as they reproducenon-linearity of soil behaviour.For higherOCR the hypoplastic model predicts more significant initial volumetric contractancy than the3SKH model, the experimental results are somewhat in between predictions bythe 3SKH and hypoplasticmodels. The CC model gives qualitatively better predictions than the same modelfor tests on kaolin clay.This is due to the fact that the shortcomings of the CC model become more pronounced at highOCRs.The illitic clay was subjected to drained triaxial tests with constant cell pressure (as opposed to constantptests on the kaolin clay), so the peak state was achieved at lowerOCR than in the tests on kaolin clay.
11
0
200
400
600
800
1000
0 0.02 0.04 0.06 0.08 0.1 0.12 0.14
q [k
Pa]
εs [-]
3SKH
200
400
600
800
1000
q [k
Pa]
HC
200
400
600
800
1000
q [k
Pa]
CC
200
400
600
800
1000
1200
q [k
Pa]
experiment
-0.08
-0.06
-0.04
-0.02
0
0.02
0.04
0 0.02 0.04 0.06 0.08 0.1 0.12 0.14
ε v [-
]
εs [-]
3SKH
-0.08
-0.06
-0.04
-0.02
0
0.02
0.04
ε v [-
]
HC
-0.08
-0.06
-0.04
-0.02
0
0.02
0.04
ε v [-
]
CC
-0.1
-0.08
-0.06
-0.04
-0.02
0
0.02
0.04
ε v [-
]
experiment
Figure 14:q vs. ǫs (a) andǫv vs. ǫs (b) graphs forOCR = 10 optimised parameters on kaolin clay.
Tests at high initialOCR were not available for the illitic clay.
7 Limitations of the present work
In the presented evaluation we focus on a specific aspect of the predictive capabilities of the studiedconstitutive models - the influence of OCR at axisymmetric conditions with given stress path direction.The complete evaluation of the predictive capabilities of the models would require their testing underdifferent orientations of stress paths in the stress space and at general 3D stress states. Such an evaluationhas been presented elsewhere:
The first aspect, i.e. directional response, has been studied by Masın et al. [14] who examined the sameconstitutive models as evaluated in the present Note. Using the concept of incremental strain responseenvelopes they have shown that unlike the CC model, the non-linear models (HC and 3SKH) are capable ofpredicting correctly the dependency of incremental stiffness on the stress path direction.
The second aspect, i.e. response under general conditions, may be examined by simulations of real
12

0
0.25
0.5
0.75
1
1.25
1.5
1.75
2
8 4 2 1
err
OCR
CCHyp
3skh
0
0.25
0.5
0.75
1
1.25
1.5
1.75
2
8 4 2 1
err
OCR
CCHyp
3skh
Figure 15:err for tests on the illitic clay, parameters optimised forOCR = 1.5 (a) andOCR = 8 (b).
boundary values problems. The three models from the present Note havebeen evaluated by the simulationof a tunneling problem in fine grained soils in Reference [12]. Advantages of the more advanced HC and3SKH models when compared to the simpler CC model have clearly been demonstrated.
8 Conclusions
It has been demonstrated that the well-known shortcoming of the Modified Cam clay (CC) model, namelythe elastic response inside the bounding surface (which coincides with the yield surface), is evident fromboth the qualitative comparison using the stress-strain diagrams and quantitative comparison using thescalar error measureerr. The model gives, as expected, worse predictions than the two more advancednon-linear models. The predictions of the CC model would be improved if the shear modulusG wasassumed to depend on the mean stressp (i.e., if constant poisson ratioν was assumed instead of constantG).
The two advanced models (3SKH and HC) give qualitatively similar predictions, as both predict correctlythe non-linear behaviour of overconsolidated soils. A single set of material parameters is sufficient for thehypoplastic model to predict the behaviour of soils with differentOCRs (except at the normallyconsolidated state) with approximately constant accuracy expressed in terms of the scalar error measureerr. The model is therefore able to predict with a single set of parameters the change of soil behaviour withdepth through the soil massive, which is desirable for practical applications. The simulation of normallyconsolidated kaolin clay suggests that the hypoplastic model should be calibrated separately for normallyconsolidated soil. This conclusion has, however, not been confirmed byevaluation of tests on illitic clay.
The performance of the 3SKH model for a single set of material parametersis less satisfactory in the sensethat the prediction errorerr increases with increasing difference between the actualOCR andOCR forwhich the model has been calibrated. This observation should be taken into account in practicalapplications of the model, by assuming different values ofψ for differentOCRs. Allowing for thisdependency, predictions by the 3SKH model would be quantitatively better than predictions by thehypoplastic model.
In addition to evaluation of the model predictions in the pre-failure regime, predicted peak friction angleshave been compared with the experimental results. As expected, the CC modelsignificantly overpredictedϕp at higherOCRs. This is a well-known shortcoming of the CC model imposed by the elliptical shapeofthe yield surface. Both advanced models gave satisfactory predictions, which were in a good agreementwith the experimental data.
13
0
100
200
300
400
500
0 0.02 0.04 0.06 0.08 0.1 0.12 0.14
q [k
Pa]
εs [-]
3SKH
100
200
300
400
500
q [k
Pa]
HC
100
200
300
400
500
q [k
Pa]
CC
100
200
300
400
500
600
q [k
Pa]
experiment
-0.04
-0.02
0
0.02
0.04
0.06
0.080 0.02 0.04 0.06 0.08 0.1 0.12 0.14
ε v [-
]
εs [-]
3SKH
-0.04
-0.02
0
0.02
0.04
0.06
ε v [-
]
HC
-0.04
-0.02
0
0.02
0.04
0.06
ε v [-
]
CC
-0.06
-0.04
-0.02
0
0.02
0.04
0.06
ε v [-
]
experiment
Figure 16:q vs. ǫs (a) andǫv vs. ǫs (b) graphs forOCR = 8 optimised parameters on illitic clay.
9 Acknowledgement
The authors would like to thank to Prof. M. Hattab and Prof. P.-Y. Hicher, who kindly provided theirexperimentala data on kaolin clay. The financial support by the researchgrants GAAV IAA200710605,MSM0021620855 and GAUK 6/2006/R is gratefully acknowledged.
References
[1] A. Al Tabbaa and D. M. Wood. An experimentally based ”bubble” modelfor clay. InProc.3th Int.Conf. on Numerical Models in Geomechanics. Niagara Falls, 1989.
[2] J. H. Atkinson, D. Richardson, and S. E. Stallebrass. Effects of recent stress history on the stiffness ofover–consolidated soil.Geotechnique, 40(4):531–540, 1990.
[3] R. Butterfield. A natural compression law for soils.Geotechnique, 29(4):469–480, 1979.
14
[4] G. Gudehus, A. Amorosi, A. Gens, I. Herle, D. Kolymbas, D. Masın, D. Muir Wood, R. Nova,A. Niemunis, M. Pastor, C. Tamagnini, and G. Viggiani. The soilmodels.info project. InternationalJournal for Numerical and Analytical Methods in Geomechanics, 32(12):1571–1572, 2008.
[5] G. Gudehus and D. Masın. Graphical representation of constitutive equations.Geotechnique (inprint), 2008.
[6] M. Hattab and P.-Y. Hicher. Dilating behaviour of overconsolidated clay. Soils and Foundations,44(4):27–40, 2004.
[7] V. Herbstova, D. Masın, and J. Bohac. Parameters for non-engineered colliery clayfills. In H. Bilseland Z. Nalbantoglu, editors,Proc. Int. Conf. on Problematic Soils (GEOPROB), Famagusta, Cyprus,volume 1, pages 335–342. Eastern Mediterrean University Press, 2005.
[8] I. Herle and D. Kolymbas. Hypoplasticity for soils with low friction angles.Computers andGeotechnics, 31(5):365–373, 2004.
[9] D. Kolymbas. An outline of hypoplasticity.Archive of Applied Mechanics, 61:143–151, 1991.
[10] D. Masın. Laboratory and Numerical Modelling of Natural Clays. M. Phil. Thesis, City University,London, 2004.
[11] D. Masın. A hypoplastic constitutive model for clays.International Journal for Numerical andAnalytical Methods in Geomechanics, 29(4):311–336, 2005.
[12] D. Masın. The influence of a constitutive model on predictions of a natm tunnel in stiff clays. InT. Triantafillidis, editor,Proc. GKK 08 - Geomechanics Colloquium, Karlsruhe, Germany. Part1 -Rock mechanics and Tunnelling. University of Karlsruhe, 2008.
[13] D. Masın and I. Herle. State boundary surface of a hypoplastic model for clays. Computers andGeotechnics, 32(6):400–410, 2005.
[14] D. Masın, C. Tamagnini, G. Viggiani, and D. Costanzo. Directional response of areconstituted finegrained soil. Part II: performance of different constitutive models.International Journal forNumerical and Analytical Methods in Geomechanics, 30(13):1303–1336, 2006.
[15] Z. Mroz, V. A. Norris, and O. C. Zienkiewicz. An anisotropic hardening model for soils and itsapplication to cyclic loading.International Journal for Numerical and Analytical Methods inGeomechanics, 2:203–221, 1978.
[16] A. Niemunis.Extended hypoplastic models for soils. Habilitation thesis, Ruhr-University, Bochum,2002.
[17] K. H. Roscoe and J. B. Burland. On the generalised stress-strainbehaviour of wet clay. In J. Heymanand F. A. Leckie, editors,Engineering Plasticity, pages 535–609. Cambridge: Cambridge UnivesrityPress, 1968.
[18] S. E. Stallebrass, J. H. Atkinson, and D. Masın. Manufacture of samples of overconsolidated clay bylaboratory sedimentation.Geotechnique, 52(2):249–253, 2007.
[19] S. E. Stallebrass and R. N. Taylor. Prediction of ground movements inoverconsolidated clay.Geotechnique, 47(2):235–253, 1997.
[20] G. Viggiani and J. H. Atkinson. Stiffness of fine–grained soil at very small strains.Geotechnique,45(2):245–265, 1995.
[21] P. A. von Wolffersdorff. A hypoplastic relation for granular materials with a predefined limit statesurface.Mechanics of Cohesive-Frictional Materials, 1:251–271, 1996.
15

List of Tables
1 Material parameters of the first group . . . . . . . . . . . . . . . . . . . . . . .. . . . . . 16
2 Material parameters of the second group . . . . . . . . . . . . . . . . . . . . .. . . . . . . 16
Table 1: Material parameters of the first group
kaolin clay illitic clayM , ϕc λ∗ κ∗ N M , ϕc λ∗ κ∗ N
CC 1.1 0.065 0.0175 0.918 0.72 0.091 0.016 1.09HC 27.5◦ 0.065 0.01 0.918 18.7◦ 0.091 0.01 1.09
3SKH 1.1 0.065 0.0034 0.918 0.72 0.091 0.0084 1.09A n m T S A n m T S
3SKH 1964 0.65 0.2 0.25 0.08 457 0.71 0.27 0.24 0.16
Table 2: Material parameters of the second group
model (parameter) kaolin clay illitic clayOCR 1 OCR 10 OCR 1.5 OCR 8
CC (param.G) 7330 kPa 2210 kPa 20000 kPa 4310 kPaHC (param.r) 1.43 0.67 0.11 0.18
3SKH (param.ψ) 1.60 2.53 0.33 0.49
16

List of Figures
1 Stress paths of experiments used for evaluation of the models on kaolin clayby Hattab andHicher [6] (a) and illitic clay (b). . . . . . . . . . . . . . . . . . . . . . . . . . . . . .. . . 2
2 Characteristic surfaces of the 3-SKH model, from Masın et al. [14]. . . . . . . . . . . . . . 3
3 Numerical values oferr for experiments and simulations that differ only in incrementalstiffnesses (left) and strain path directions (right). . . . . . . . . . . . . . . .. . . . . . . . 5
4 Approximation of experimental data on kaolin clay forOCR = 10 by a polynomial functionfor calculation oferr. . . . . . . . . . . . . . . . . . . . . . . . . . . . . . . . . . . . . . . 5
5 Sketch of the initial position of the kinematic surfaces of the 3SKH model for normallyconsolidated (A) and overconsolidaed (B) states . . . . . . . . . . . . . . . .. . . . . . . . 6
6 Calibration of parametersN , λ∗ andκ∗ of the CC model for kaolin clay (a) and illitic clay (b). 6
7 Calibration of parameterM (or, alternatively,ϕc) for kaolin clay (a) and illitic clay (b). . . . 7
8 Calibration ofψ by means of minimisation oferr for experiment on kaolin clay atOCR = 10. 8
9 Predictions of the test on kaolin clay atOCR = 10 by the 3SKH model witherr-optimised(ψ = 2.53) and two different values ofψ. . . . . . . . . . . . . . . . . . . . . . . . . . . . 8
10 ParametersG, r andψ normalised by their maximum values in a given set of simulations(param. ratiois equal toG/Gmax for CC model;r/rmax for hypoplastic model;ψ/ψmax
for the 3SKH model), calibrated using theerr-minimisation procedure on kaolin clay (a).Values oferr corresponding to optimised values of parameters (b). . . . . . . . . . . . . . .9
11 err for tests on kaolin clay, parameters optimised forOCR = 1 (a) andOCR = 10 (b). . . 10
12 Peak friction anglesϕp for kaolin clay predicted by the models with parameters optimisedfor OCR = 10. . . . . . . . . . . . . . . . . . . . . . . . . . . . . . . . . . . . . . . . . . 10
13 Stress paths normalised byp∗e for OCR = 10 optimised parameters. . . . . . . . . . . . . . 11
14 q vs. ǫs (a) andǫv vs. ǫs (b) graphs forOCR = 10 optimised parameters on kaolin clay. . . 12
15 err for tests on the illitic clay, parameters optimised forOCR = 1.5 (a) andOCR = 8 (b). . 13
16 q vs. ǫs (a) andǫv vs. ǫs (b) graphs forOCR = 8 optimised parameters on illitic clay. . . . . 14
17