capacity assessment hero of switzerland, loughborough
TRANSCRIPT

Scott White and Hookins LLP
Harman House
Andover Road
Winchester
Hampshire
SO23 7BS
T +44 (0)1962 844855
Capacity Assessment
Hero of Switzerland,
Loughborough Junction, London
Prepared by: ..............................................
Harry Hunter BEng (Hons) GMICE
Checked by: ..............................................
Ian Llewellyn MEng (Hons) CEng MICE MIStructE

Structural and Civil Engineering Services
W02047 Hero of Switzerland
London
Bedford
Winchester
Contents
1.0 Introduction 2
2.0 Existing Conditions 3
3.0 Proposed Conditions 5
4.0 Summary & Conclusions 6
Appendices 7

London
Bedford
Winchester
Structural and Civil Engineering Services
W02047 Hero of Switzerland
1.0 Introduction
1.1 Scott White and Hookins (SWH) have prepared this Capacity Statement for a proposed
development at The Hero of Switzerland, Brixton, London. This statement has been produced as
a supporting document for a planning application and takes the form of a desk study.

London
Bedford
Winchester
Structural and Civil Engineering Services
W02047 Hero of Switzerland
2.0 Existing Conditions
2.1 Existing Site
2.1.1 The existing site comprises a public house with a residential flat above. Drainage serving the existing
site is comprised of a combined drainage network serving both foul and surface water discharge.
2.1.2 The existing foul water drainage loadings have been calculated in accordance with BS EN 12056-
2:2000.
2.1.3 A copy of the existing site layout is located in Appendix A.
2.2 Foul Water Network
2.2.1 The existing foul water loading has been calculated as follows:
The existing building use can be considered as frequent, which gives a peak foul water discharge
rate of 3.00l/s.
2.3 Surface Water Network
2.3.1 The existing surface water discharge rates have been calculated by modelling the existing drainage
network in MicroDrainage with the existing impermeable areas.
2.3.2 The proposed site has an area of 0.045ha, of which 100% is impermeable. Based on this, the existing
brownfield runoff rates from the site are as follows:-
1 in 1 year: 6.2 l/s
1 in 30 year: 16.9 l/s
1 in 100 year : 22.0 l/s
MicroDrainage calculations for the existing surface water network are located in Appendix B.
London
Bedford
Winchester
Structural and Civil Engineering Services
W02047 Hero of Switzerland
2.4 The total existing peak off site discharge for the site to the combined sewer for a 1 in 100yr storm
event is therefore 25.0 l/s.

London
Bedford
Winchester
Structural and Civil Engineering Services
W02047 Hero of Switzerland
3.0 Proposed Conditions
3.1 Proposed Site
3.1.1 The proposed site comprises the reconstruction of the existing public house with 36 residential
apartments above over 14 stories. Drainage for the proposed site will be separated into a separate
foul and surface water network before discharging into an existing combined manhole on site.
3.1.2 The proposed foul water drainage loadings have been calculated in accordance with BS EN 12056-
2:2000 and Sewers for Adoption 6th Addition.
3.1.3 A copy of the proposed site layout is located in Appendix C.
3.2 Foul Water Network
3.2.1 The existing foul water loading has been calculated as follows:
It is assumed the loading from the proposed public house will mimic the existing conditions and will
therefore have a peak discharge rate of 3.00l/s.
The foul water discharge rate for the 36 residential apartments based on SfA6, at 4000l/dwelling/day,
is 1.67l/s.
3.3 Surface Water Network
3.3.1 It is proposed to restrict the surface water discharge rate from the proposed site to better the
existing rates as reasonably possible. In order to avoid the risk of blockage of the flow control, it is
proposed to restrict the surface water discharge rate to 5.00l/s for all storm events up to and
including the 1 in 100yr storm event + 40% climate change allowance.
3.3.2 With the restricted surface water outfall, the extra volume of water is to be attenuated on site in
cellular storage crates. The attenuation volume is approximately 12.8m3.
MicroDrainage calculations for the proposed surface water network are located in Appendix D.
3.4 The total proposed peak off site discharge for the site to the combined sewer is therefore 9.67 l/s.
This provides a betterment over the existing condition of 15.33 l/s.

London
Bedford
Winchester
Structural and Civil Engineering Services
W02047 Hero of Switzerland
4.0 Summary & Conclusions
4.1 The total existing peak off site discharge for the site to the combined sewer is 25.0 l/s, comprising
3.00l/s for the peak foul water discharge and 22.0l/s for the surface water network for the 1 in 100yr
storm event.
4.2 The total proposed peak off site discharge for the site to the combined sewer is therefore 9.67 l/s.
This is comprised of 4.67l/s from the foul water network, and 5.00l/s from the surface water network
for the 1 in 100yr storm event including 40% allowance for climate change.
4.3 This proposed development therefore provides a reduction in peak off-site surface and foul water
discharge of 15.33 l/s.
4.4 The figures provided in this report were provided to Thames Water for a Pre-Planning enquiry.
Thames Water have subsequently confirmed that there is sufficient capacity in the existing network
to accommodate the foul and surface water discharge from the proposed development. The Pre-
Planning Capacity confirmation letter is located in Appendix E.

London
Bedford
Winchester
Structural and Civil Engineering Services
W02047 Hero of Switzerland
Appendices

London
Bedford
Winchester
Structural and Civil Engineering Services
W02047 Hero of Switzerland
Appendix A
Existing Site Layout

8
UNIDENTIFIED
HEATING PIPES
SERVICE DUCTS
VAPOUR RECOVERY
GAUGE LINE
OFFSET FILL PIPE
VENT PIPE
FUEL PIPE
PUMPING MAIN
COMBINED DRAINAGE
SURFACE DRAINAGE
CONTAMINATED SURFACE
FOUL DRAINAGE
GAS PIPE
WATER PIPE
COMMUNICATION CABLE
CABLE TELEVISION
TELECOMS CABLE
ELECTRIC CABLE
UTILITY KEY
ELECTRIC & COMMS CABLE
TRAFFIC SIGNAL CABLE
SURVEY BOUNDARY
TRENCH SCAR
GROUND DEPRESSION
EARTHING ROD / CABLE
END OF TRACECABLE / PIPE RISER
BACKDROP / TRAPPED EXIT HEAD OF RUN / CAPPED
PIPE INLET / OUTFALLDRAINAGE VALVE

London
Bedford
Winchester
Structural and Civil Engineering Services
W02047 Hero of Switzerland
Appendix B
MicroDrainage Existing Surface Water Calculations

Scott-White & Hookins Page 142 West Street W02047London House Hero of SwitzerlandCarshalton SM5 2PR Existing Runoff RatesDate 03/09/2018 16:13 Designed by HHFile W0247 Existing runoff Rates.MDX Checked byMicro Drainage Network 2018.1
STORM SEWER DESIGN by the Modified Rational Method
Design Criteria for Storm
©1982-2018 Innovyze
Pipe Sizes STANDARD Manhole Sizes STANDARD
FSR Rainfall Model - England and WalesReturn Period (years) 100 PIMP (%) 100
M5-60 (mm) 20.100 Add Flow / Climate Change (%) 0Ratio R 0.436 Minimum Backdrop Height (m) 0.200
Maximum Rainfall (mm/hr) 50 Maximum Backdrop Height (m) 1.500Maximum Time of Concentration (mins) 30 Min Design Depth for Optimisation (m) 1.200
Foul Sewage (l/s/ha) 0.000 Min Vel for Auto Design only (m/s) 1.00Volumetric Runoff Coeff. 0.750 Min Slope for Optimisation (1:X) 500
Designed with Level Soffits
Time Area Diagram for Storm
Time(mins)
Area(ha)
Time(mins)
Area(ha)
0-4 0.043 4-8 0.002
Total Area Contributing (ha) = 0.045
Total Pipe Volume (m³) = 0.532
Network Design Table for Storm
PN Length(m)
Fall(m)
Slope(1:X)
I.Area(ha)
T.E.(mins)
BaseFlow (l/s)
k(mm)
HYDSECT
DIA(mm)
Section Type AutoDesign
S1.000 22.772 0.500 45.5 0.023 4.00 0.0 0.600 o 150 Pipe/ConduitS1.001 7.313 0.320 22.9 0.022 0.00 0.0 0.600 o 150 Pipe/Conduit
Network Results Table
PN Rain(mm/hr)
T.C.(mins)
US/IL(m)
Σ I.Area(ha)
Σ BaseFlow (l/s)
Foul(l/s)
Add Flow(l/s)
Vel(m/s)
Cap(l/s)
Flow(l/s)
S1.000 50.00 4.25 10.500 0.023 0.0 0.0 0.0 1.49 26.4 3.1S1.001 50.00 4.31 10.000 0.045 0.0 0.0 0.0 2.12 37.4 6.1

Scott-White & Hookins Page 242 West Street W02047London House Hero of SwitzerlandCarshalton SM5 2PR Existing Runoff RatesDate 03/09/2018 16:13 Designed by HHFile W0247 Existing runoff Rates.MDX Checked byMicro Drainage Network 2018.1
Area Summary for Storm
©1982-2018 Innovyze
PipeNumber
PIMPType
PIMPName
PIMP(%)
GrossArea (ha)
Imp.Area (ha)
Pipe Total(ha)
1.000 - - 100 0.023 0.023 0.0231.001 - - 100 0.022 0.022 0.022
Total Total Total0.045 0.045 0.045
Free Flowing Outfall Details for Storm
OutfallPipe Number
OutfallName
C. Level(m)
I. Level(m)
MinI. Level
(m)
D,L(mm)
W(mm)
S1.001 S 10.740 9.680 7.320 0 0
Simulation Criteria for Storm
Volumetric Runoff Coeff 0.750 Additional Flow - % of Total Flow 0.000Areal Reduction Factor 1.000 MADD Factor * 10m³/ha Storage 2.000
Hot Start (mins) 0 Inlet Coeffiecient 0.800Hot Start Level (mm) 0 Flow per Person per Day (l/per/day) 0.000
Manhole Headloss Coeff (Global) 0.500 Run Time (mins) 60Foul Sewage per hectare (l/s) 0.000 Output Interval (mins) 1
Number of Input Hydrographs 0 Number of Offline Controls 0 Number of Time/Area Diagrams 0Number of Online Controls 0 Number of Storage Structures 0 Number of Real Time Controls 0
Synthetic Rainfall Details
Rainfall Model FSR Profile Type SummerReturn Period (years) 100 Cv (Summer) 0.750
Region England and Wales Cv (Winter) 0.840M5-60 (mm) 20.100 Storm Duration (mins) 30
Ratio R 0.436

Scott-White & Hookins Page 342 West Street W02047London House Hero of SwitzerlandCarshalton SM5 2PR Existing Runoff RatesDate 03/09/2018 16:13 Designed by HHFile W0247 Existing runoff Rates.MDX Checked byMicro Drainage Network 2018.1
1 year Return Period Summary of Critical Results by Maximum Outflow (Rank 1) for Storm
©1982-2018 Innovyze
Simulation CriteriaAreal Reduction Factor 1.000 Additional Flow - % of Total Flow 0.000
Hot Start (mins) 0 MADD Factor * 10m³/ha Storage 2.000Hot Start Level (mm) 0 Inlet Coeffiecient 0.800
Manhole Headloss Coeff (Global) 0.500 Flow per Person per Day (l/per/day) 0.000Foul Sewage per hectare (l/s) 0.000
Number of Input Hydrographs 0 Number of Offline Controls 0 Number of Time/Area Diagrams 0Number of Online Controls 0 Number of Storage Structures 0 Number of Real Time Controls 0
Synthetic Rainfall DetailsRainfall Model FSR M5-60 (mm) 20.000 Cv (Summer) 0.750
Region England and Wales Ratio R 0.432 Cv (Winter) 0.840
Margin for Flood Risk Warning (mm) 300.0 DVD Status OFFAnalysis Timestep Fine Inertia Status OFF
DTS Status ON
Profile(s) Summer and WinterDuration(s) (mins) 15, 30, 60, 120, 180, 240, 360, 480, 600, 720, 960,
1440Return Period(s) (years) 1, 30, 100
Climate Change (%) 0, 0, 0
PNUS/MHName Storm
ReturnPeriod
ClimateChange
First (X)Surcharge
First (Y)Flood
First (Z)Overflow
OverflowAct.
Water Level(m)
SurchargedDepth(m)
FloodedVolume(m³)
S1.000 S1 15 Winter 1 +0% 10.537 -0.113 0.000S1.001 S2 15 Winter 1 +0% 10.045 -0.105 0.000
PNUS/MHName
Flow /Cap.
Overflow(l/s)
PipeFlow(l/s) Status
LevelExceeded
S1.000 S1 0.14 3.5 OKS1.001 S2 0.19 6.2 OK

Scott-White & Hookins Page 442 West Street W02047London House Hero of SwitzerlandCarshalton SM5 2PR Existing Runoff RatesDate 03/09/2018 16:13 Designed by HHFile W0247 Existing runoff Rates.MDX Checked byMicro Drainage Network 2018.1
30 year Return Period Summary of Critical Results by Maximum Outflow (Rank 1) for Storm
©1982-2018 Innovyze
Simulation CriteriaAreal Reduction Factor 1.000 Additional Flow - % of Total Flow 0.000
Hot Start (mins) 0 MADD Factor * 10m³/ha Storage 2.000Hot Start Level (mm) 0 Inlet Coeffiecient 0.800
Manhole Headloss Coeff (Global) 0.500 Flow per Person per Day (l/per/day) 0.000Foul Sewage per hectare (l/s) 0.000
Number of Input Hydrographs 0 Number of Offline Controls 0 Number of Time/Area Diagrams 0Number of Online Controls 0 Number of Storage Structures 0 Number of Real Time Controls 0
Synthetic Rainfall DetailsRainfall Model FSR M5-60 (mm) 20.000 Cv (Summer) 0.750
Region England and Wales Ratio R 0.432 Cv (Winter) 0.840
Margin for Flood Risk Warning (mm) 300.0 DVD Status OFFAnalysis Timestep Fine Inertia Status OFF
DTS Status ON
Profile(s) Summer and WinterDuration(s) (mins) 15, 30, 60, 120, 180, 240, 360, 480, 600, 720, 960,
1440Return Period(s) (years) 1, 30, 100
Climate Change (%) 0, 0, 0
PNUS/MHName Storm
ReturnPeriod
ClimateChange
First (X)Surcharge
First (Y)Flood
First (Z)Overflow
OverflowAct.
Water Level(m)
SurchargedDepth(m)
FloodedVolume(m³)
S1.000 S1 15 Summer 30 +0% 10.561 -0.089 0.000S1.001 S2 15 Winter 30 +0% 10.077 -0.073 0.000
PNUS/MHName
Flow /Cap.
Overflow(l/s)
PipeFlow(l/s) Status
LevelExceeded
S1.000 S1 0.35 8.6 OKS1.001 S2 0.53 16.9 OK

Scott-White & Hookins Page 542 West Street W02047London House Hero of SwitzerlandCarshalton SM5 2PR Existing Runoff RatesDate 03/09/2018 16:13 Designed by HHFile W0247 Existing runoff Rates.MDX Checked byMicro Drainage Network 2018.1
100 year Return Period Summary of Critical Results by Maximum Outflow (Rank 1) for Storm
©1982-2018 Innovyze
Simulation CriteriaAreal Reduction Factor 1.000 Additional Flow - % of Total Flow 0.000
Hot Start (mins) 0 MADD Factor * 10m³/ha Storage 2.000Hot Start Level (mm) 0 Inlet Coeffiecient 0.800
Manhole Headloss Coeff (Global) 0.500 Flow per Person per Day (l/per/day) 0.000Foul Sewage per hectare (l/s) 0.000
Number of Input Hydrographs 0 Number of Offline Controls 0 Number of Time/Area Diagrams 0Number of Online Controls 0 Number of Storage Structures 0 Number of Real Time Controls 0
Synthetic Rainfall DetailsRainfall Model FSR M5-60 (mm) 20.000 Cv (Summer) 0.750
Region England and Wales Ratio R 0.432 Cv (Winter) 0.840
Margin for Flood Risk Warning (mm) 300.0 DVD Status OFFAnalysis Timestep Fine Inertia Status OFF
DTS Status ON
Profile(s) Summer and WinterDuration(s) (mins) 15, 30, 60, 120, 180, 240, 360, 480, 600, 720, 960,
1440Return Period(s) (years) 1, 30, 100
Climate Change (%) 0, 0, 0
PNUS/MHName Storm
ReturnPeriod
ClimateChange
First (X)Surcharge
First (Y)Flood
First (Z)Overflow
OverflowAct.
Water Level(m)
SurchargedDepth(m)
FloodedVolume(m³)
S1.000 S1 15 Winter 100 +0% 10.570 -0.080 0.000S1.001 S2 15 Summer 100 +0% 10.092 -0.058 0.000
PNUS/MHName
Flow /Cap.
Overflow(l/s)
PipeFlow(l/s) Status
LevelExceeded
S1.000 S1 0.45 11.2 OKS1.001 S2 0.69 22.0 OK

London
Bedford
Winchester
Structural and Civil Engineering Services
W02047 Hero of Switzerland
Appendix C
Proposed Site Layout

UP
UP
UPDN
ResidentialStaircase
flue riser
PublicHouse
dumbwaiter
1500
StoreStore
ResidentialBin Store
ResidentialLobby
Sliding doors
WC
Sliding doors
PublicHouse Bin
StoreSubstation
WORK IN PROGRESS
date revision note drawn checkedrev
N
© Gensler All rights reserved, including but not limited to The Copyright, Design and Patents Act
1988
key plan
category
project
client
2016
number rev
rev drawn checkedscale
family
project number
notes:Do not scale from drawings. All discrepancies to be reported to Gensler architect immediately.All dimensions to be verified by contractor on site prior to any works
lead consultant
consultant
title
ISSUED DATE: 13/08/18
Tel +44 (0)20 7073 9600Fax +44 (0)20 7539 1917
Aldgate House33 Aldgate High StreetLondon, EC3N 1AHUnited Kingdom
UDN Properties65 Delamere Road, HayesMiddlesex UB4 0NNUKTel 020 3726 9801
1 : 100
15/0
4/20
19 1
4:19
:31
\\gen
sler
.ad\
Pro
ject
s\R
evitU
serM
odel
s\24
746 \
Arc
hite
ctur
e -
08. 7
369.
000_
Luke
_Ask
with
@ge
nsle
r.c o
m.r
vt
CA1.201
PROPOSED GROUND FLOOR PLAN
08.7369.000
Hero of Switzerland
SW9 7LL
1 GENERAL ARRANGEMENT
200-299 ENLARGED PLANS PARTITION
02/04/19 NLLA
A 06/03/19 Draft Issue LA NL
B 02/04/19 Planning Issue LA NL
C 15/04/19 Planning Issue LA NL
SCALE: 1 : 100
PROPOSED GROUND FLOOR1

London
Bedford
Winchester
Structural and Civil Engineering Services
W02047 Hero of Switzerland
Appendix D
MicroDrainage Proposed Surface Water Calculations

Scott-White & Hookins Page 142 West Street W02047London House Hero of SwitzerlandCarshalton SM5 2PR Attenuation CalcsDate 03/09/2018 17:45 Designed by HHFile W02047 Attenuation Calcs.SRCX Checked byMicro Drainage Source Control 2018.1
Summary of Results for 100 year Return Period (+40%)
©1982-2018 Innovyze
Half Drain Time : 20 minutes.
StormEvent
MaxLevel(m)
MaxDepth(m)
MaxInfiltration
(l/s)
MaxControl(l/s)
MaxΣ Outflow(l/s)
MaxVolume(m³)
Status
15 min Summer 10.297 0.297 0.0 5.0 5.0 9.0 O K30 min Summer 10.336 0.336 0.0 5.0 5.0 10.2 O K60 min Summer 10.331 0.331 0.0 5.0 5.0 10.1 O K120 min Summer 10.266 0.266 0.0 5.0 5.0 8.1 O K180 min Summer 10.203 0.203 0.0 5.0 5.0 6.2 O K240 min Summer 10.157 0.157 0.0 5.0 5.0 4.8 O K360 min Summer 10.114 0.114 0.0 4.6 4.6 3.5 O K480 min Summer 10.097 0.097 0.0 3.8 3.8 2.9 O K600 min Summer 10.086 0.086 0.0 3.3 3.3 2.6 O K720 min Summer 10.079 0.079 0.0 2.8 2.8 2.4 O K960 min Summer 10.069 0.069 0.0 2.3 2.3 2.1 O K1440 min Summer 10.057 0.057 0.0 1.7 1.7 1.7 O K2160 min Summer 10.048 0.048 0.0 1.2 1.2 1.4 O K2880 min Summer 10.042 0.042 0.0 1.0 1.0 1.3 O K4320 min Summer 10.035 0.035 0.0 0.7 0.7 1.1 O K5760 min Summer 10.031 0.031 0.0 0.5 0.5 0.9 O K7200 min Summer 10.028 0.028 0.0 0.5 0.5 0.9 O K8640 min Summer 10.026 0.026 0.0 0.4 0.4 0.8 O K10080 min Summer 10.024 0.024 0.0 0.3 0.3 0.7 O K
15 min Winter 10.340 0.340 0.0 5.0 5.0 10.3 O K30 min Winter 10.380 0.380 0.0 5.0 5.0 11.5 O K60 min Winter 10.364 0.364 0.0 5.0 5.0 11.1 O K120 min Winter 10.261 0.261 0.0 5.0 5.0 7.9 O K180 min Winter 10.170 0.170 0.0 5.0 5.0 5.2 O K
StormEvent
Rain(mm/hr)
FloodedVolume(m³)
DischargeVolume(m³)
Time-Peak(mins)
15 min Summer 141.917 0.0 12.0 1530 min Summer 91.958 0.0 15.5 2560 min Summer 56.713 0.0 19.1 42120 min Summer 33.812 0.0 22.8 74180 min Summer 24.675 0.0 25.0 104240 min Summer 19.628 0.0 26.5 134360 min Summer 14.150 0.0 28.6 188480 min Summer 11.224 0.0 30.3 248600 min Summer 9.372 0.0 31.6 308720 min Summer 8.084 0.0 32.7 370960 min Summer 6.399 0.0 34.5 4901440 min Summer 4.596 0.0 37.2 7342160 min Summer 3.296 0.0 40.0 11002880 min Summer 2.602 0.0 42.1 14684320 min Summer 1.862 0.0 45.2 21885760 min Summer 1.467 0.0 47.5 28647200 min Summer 1.219 0.0 49.3 36488640 min Summer 1.047 0.0 50.9 440010080 min Summer 0.921 0.0 52.2 5024
15 min Winter 141.917 0.0 13.4 1630 min Winter 91.958 0.0 17.4 2660 min Winter 56.713 0.0 21.4 46120 min Winter 33.812 0.0 25.5 80180 min Winter 24.675 0.0 28.0 108

Scott-White & Hookins Page 242 West Street W02047London House Hero of SwitzerlandCarshalton SM5 2PR Attenuation CalcsDate 03/09/2018 17:45 Designed by HHFile W02047 Attenuation Calcs.SRCX Checked byMicro Drainage Source Control 2018.1
Summary of Results for 100 year Return Period (+40%)
©1982-2018 Innovyze
StormEvent
MaxLevel(m)
MaxDepth(m)
MaxInfiltration
(l/s)
MaxControl(l/s)
MaxΣ Outflow(l/s)
MaxVolume(m³)
Status
240 min Winter 10.121 0.121 0.0 4.8 4.8 3.7 O K360 min Winter 10.094 0.094 0.0 3.7 3.7 2.8 O K480 min Winter 10.080 0.080 0.0 2.9 2.9 2.4 O K600 min Winter 10.072 0.072 0.0 2.5 2.5 2.2 O K720 min Winter 10.066 0.066 0.0 2.1 2.1 2.0 O K960 min Winter 10.057 0.057 0.0 1.7 1.7 1.7 O K1440 min Winter 10.048 0.048 0.0 1.2 1.2 1.4 O K2160 min Winter 10.040 0.040 0.0 0.9 0.9 1.2 O K2880 min Winter 10.035 0.035 0.0 0.7 0.7 1.1 O K4320 min Winter 10.030 0.030 0.0 0.5 0.5 0.9 O K5760 min Winter 10.026 0.026 0.0 0.4 0.4 0.8 O K7200 min Winter 10.024 0.024 0.0 0.3 0.3 0.7 O K8640 min Winter 10.022 0.022 0.0 0.3 0.3 0.7 O K10080 min Winter 10.021 0.021 0.0 0.3 0.3 0.6 O K
StormEvent
Rain(mm/hr)
FloodedVolume(m³)
DischargeVolume(m³)
Time-Peak(mins)
240 min Winter 19.628 0.0 29.7 132360 min Winter 14.150 0.0 32.1 190480 min Winter 11.224 0.0 33.9 250600 min Winter 9.372 0.0 35.4 310720 min Winter 8.084 0.0 36.7 370960 min Winter 6.399 0.0 38.7 4921440 min Winter 4.596 0.0 41.7 7342160 min Winter 3.296 0.0 44.8 11002880 min Winter 2.602 0.0 47.2 14324320 min Winter 1.862 0.0 50.7 22005760 min Winter 1.467 0.0 53.2 29047200 min Winter 1.219 0.0 55.3 35768640 min Winter 1.047 0.0 57.0 440010080 min Winter 0.921 0.0 58.5 5072
Scott-White & Hookins Page 342 West Street W02047London House Hero of SwitzerlandCarshalton SM5 2PR Attenuation CalcsDate 03/09/2018 17:45 Designed by HHFile W02047 Attenuation Calcs.SRCX Checked byMicro Drainage Source Control 2018.1
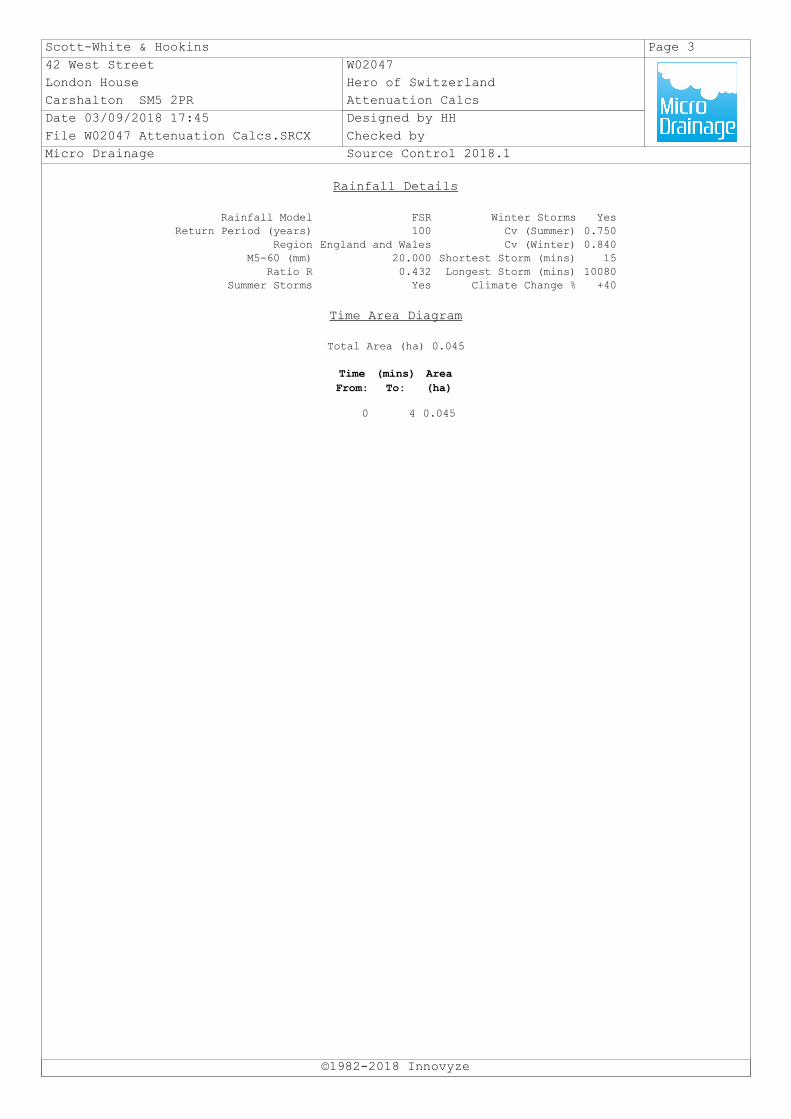
Rainfall Details
©1982-2018 Innovyze
Rainfall Model FSR Winter Storms YesReturn Period (years) 100 Cv (Summer) 0.750
Region England and Wales Cv (Winter) 0.840M5-60 (mm) 20.000 Shortest Storm (mins) 15
Ratio R 0.432 Longest Storm (mins) 10080Summer Storms Yes Climate Change % +40
Time Area Diagram
Total Area (ha) 0.045
TimeFrom:
(mins)To:
Area(ha)
0 4 0.045

Scott-White & Hookins Page 442 West Street W02047London House Hero of SwitzerlandCarshalton SM5 2PR Attenuation CalcsDate 03/09/2018 17:45 Designed by HHFile W02047 Attenuation Calcs.SRCX Checked byMicro Drainage Source Control 2018.1
Model Details
©1982-2018 Innovyze
Storage is Online Cover Level (m) 11.200
Cellular Storage Structure
Invert Level (m) 10.000 Safety Factor 2.0Infiltration Coefficient Base (m/hr) 0.00000 Porosity 0.95Infiltration Coefficient Side (m/hr) 0.00000
Depth (m) Area (m²) Inf. Area (m²) Depth (m) Area (m²) Inf. Area (m²) Depth (m) Area (m²) Inf. Area (m²)
0.000 32.0 32.0 0.400 32.0 41.1 0.401 0.0 41.1
Hydro-Brake® Optimum Outflow Control
Unit Reference MD-SHE-0114-5000-0400-5000Design Head (m) 0.400
Design Flow (l/s) 5.0Flush-Flo™ CalculatedObjective Minimise upstream storage
Application SurfaceSump Available YesDiameter (mm) 114
Invert Level (m) 10.000Minimum Outlet Pipe Diameter (mm) 150Suggested Manhole Diameter (mm) 1200
Control Points Head (m) Flow (l/s) Control Points Head (m) Flow (l/s)
Design Point (Calculated) 0.400 5.0 Kick-Flo® 0.312 4.5Flush-Flo™ 0.169 5.0 Mean Flow over Head Range - 4.0
The hydrological calculations have been based on the Head/Discharge relationship for the Hydro-Brake®Optimum as specified. Should another type of control device other than a Hydro-Brake Optimum® beutilised then these storage routing calculations will be invalidated
Depth (m) Flow (l/s) Depth (m) Flow (l/s) Depth (m) Flow (l/s) Depth (m) Flow (l/s) Depth (m) Flow (l/s)
0.100 4.0 0.800 6.9 2.000 10.6 4.000 14.8 7.000 19.50.200 5.0 1.000 7.7 2.200 11.1 4.500 15.6 7.500 20.20.300 4.6 1.200 8.3 2.400 11.6 5.000 16.4 8.000 20.90.400 5.0 1.400 9.0 2.600 12.0 5.500 17.3 8.500 21.50.500 5.5 1.600 9.6 3.000 12.9 6.000 18.0 9.000 22.10.600 6.0 1.800 10.1 3.500 13.9 6.500 18.8 9.500 22.7

London
Bedford
Winchester
Structural and Civil Engineering Services
W02047 Hero of Switzerland
Appendix E
Thames Water Capacity Confirmation Letter

Thames Water Utilities Limited – Registered Office: Clearwater Court, Vastern Road, Reading RG1 8DB
Company number 02366661. VAT registration no GB 537-4569-15
Mr. Harry Hunter Scott White and Hookins LLP Harman House Andover Road SO23 7BS
DS6052898
30 October 2018
Pre-planning enquiry: Confirmation of sufficient capacity
Dear Mr. Hunter,
Thank you for providing information on your development at Hero of Switzerland, 142
Longhborough Road, Stockwell, London, SW9 7LL. Existing site is 300sqm of public house, foul
discharge via gravity, existing SW rates 1 in 1: 6.2l/s, 1 in 30 16.9l/s, 1 in 100: 22l/s via existing
chamber which discharges into 1140x760 combined sewer. Development proposal for retaining
existing public house and proposed 36 flats, foul discharge by gravity, proposed SW rates at 5l/s
via existing chamber which discharges into 1140x760 combined sewer.
We have completed the assessment of the foul water flows and surface water run-off based on
the information submitted in your application with the purpose of assessing sewerage capacity
within the existing Thames Water sewer network.
Foul Water
If your proposals progress in line with the details you’ve provided, we’re pleased to confirm that
there will be sufficient sewerage capacity in the adjacent combined sewer network to serve your
development.
This confirmation is valid for 12 months or for the life of any planning approval that this
information is used to support, to a maximum of three years.
You’ll need to keep us informed of any changes to your design – for example, an increase
in the number or density of homes. Such changes could mean there is no longer
sufficient capacity.
Surface Water
We confirm that there will be sufficient capacity in our sewerage network to accept the surface
water discharge rate provided as part of the enquiry, however this does not preclude the
requirement as set out by the Policy 5.13 of the London Plan.
Management of surface water from the site should follow policy 5.13 of the London Plan,
development should ‘aim to achieve greenfield run-off rates’ utilising Sustainable Drainage and
where this is not possible information explaining why it is not possible should be provided to both
the LLFA and Thames Water.

Typically greenfield run off rates of 5l/s/ha should be aimed for using the drainage hierarchy. The
hierarchy lists the preference for surface water disposal as follows; Store Rainwater for later use
> Use infiltration techniques, such as porous surfaces in non-clay areas > Attenuate rainwater in
ponds or open water features for gradual release > Discharge rainwater direct to a watercourse
> Discharge rainwater direct to a surface water sewer/drain > Discharge rainwater to the
combined sewer.
No green/blue roof proposed so could possibly restrict further.
What happens next?
Please make sure you submit your connection application, giving us at least 21 days’ notice of
the date you wish to make your new connection/s.
If you’ve any further questions, please contact me on 0203 577 9018 / 07747 640 273.
Yours sincerely
David Stamateris
Adoptions Engineer
Thames Water