capacity optimization of battery-generator hybrid power
TRANSCRIPT

Purdue UniversityPurdue e-Pubs
Open Access Theses Theses and Dissertations
4-2016
Capacity optimization of battery-generator hybridpower system: Toward minimizing maintenancecost in expeditionary basecamp/operational energyapplicationsJude C. OnwuanumkpePurdue University
Follow this and additional works at: https://docs.lib.purdue.edu/open_access_theses
Part of the Mechanical Engineering Commons, and the Power and Energy Commons
This document has been made available through Purdue e-Pubs, a service of the Purdue University Libraries. Please contact [email protected] foradditional information.
Recommended CitationOnwuanumkpe, Jude C., "Capacity optimization of battery-generator hybrid power system: Toward minimizing maintenance cost inexpeditionary basecamp/operational energy applications" (2016). Open Access Theses. 804.https://docs.lib.purdue.edu/open_access_theses/804

Graduate School Form30 Updated
PURDUE UNIVERSITYGRADUATE SCHOOL
Thesis/Dissertation Acceptance
This is to certify that the thesis/dissertation prepared
By
Entitled
For the degree of
Is approved by the final examining committee:
To the best of my knowledge and as understood by the student in the Thesis/Dissertation Agreement, Publication Delay, and Certification Disclaimer (Graduate School Form 32), this thesis/dissertation adheres to the provisions of Purdue University’s “Policy of Integrity in Research” and the use of copyright material.
Approved by Major Professor(s):
Approved by:Head of the Departmental Graduate Program Date
JUDE C. ONWUANUMKPE
CAPACITY OPTIMIZATION OF BATTERY-GENERATOR HYBRID POWER SYSTEM: TOWARD MINIMIZINGMAINTENANCE COST IN EXPEDITIONARY BASECAMP/OPERATIONAL ENERGY APPLICATIONS
Master of Science
ERIC DIETZChair
JOSEPH PEKNY Co-chair
MARK FRENCHCo-chair
ERIC DIEZ
KATHRINE NEWTON 4/29/2016


CAPACITY OPTIMIZATION OF BATTERY-GENERATOR HYBRID POWER
SYSTEM: TOWARD MINIMIZING MAINTENANCE COST IN EXPEDITIONARY
BASECAMP/OPERATIONAL ENERGY APPLICATIONS
A Thesis
Submitted to the Faculty
of
Purdue University
by
Jude C. Onwuanumkpe
In Partial Fulfillment of the
Requirements for the Degree
of
Master of Science
May 2016
Purdue University
West Lafayette, Indiana

ii
ii
To my family, whose sacrifices, patience, and understanding throughout the past two
years allowed me to focus and deal with challenges of this project.

iii
iii
ACKNOWLEDGEMENTS
I would like to acknowledge the overwhelming support, guidance, and mentorship I
received from my graduate advisors, Dr. Eric Dietz and Dr. Joseph Pekny. I also
appreciate assistance from Mr. Tim Raney in the U.S. Army Combined Arms Support
Command (CASCOM), Steve Iverson, Doreen Sorensen, Elias Anaya, and the R&D team
at Cummins Power Generation. I am also grateful to the Purdue Military Research
Initiative (PMRI) and the Purdue Homeland Security Institute (PHSI) for enabling my
pursuit of unique research opportunities that are tailored and relevant to my profession.
These programs ensured that I received professional development concurrently with my
academic endeavors, so that one did not suffer because of the other. I am also grateful for
the guidance provided by the senior staff in the Department of Chemistry and Chemical
Engineering at the U.S. Military Academy—COL Robert, COL Burpo, and LTC Clancy.
Last but not least, I owe a great deal of gratitude to my wife and two young children who
have borne the brunt of sacrifices that we have had to make along this journey. Thank you
all.

iv
iv
TABLE OF CONTENTS
Page
LIST OF TABLES ............................................................................................................ vii
LIST OF FIGURES .......................................................................................................... viii
GLOSSARY ........................................................................................................................ x
ABSTRACT ...................................................................................................................... xii
CHAPTER 1. INTRODUCTION ................................................................................. 1
1.1 Problem Statement ................................................................................................ 2
1.2 Research Question ........................................................................................................ 5
1.3 Significance .................................................................................................................. 6
1.4 Scope ............................................................................................................................ 7
1.5 Assumptions ................................................................................................................. 7
1.6 Limitations.................................................................................................................... 8
1.7 Delimitations ................................................................................................................ 9
1.8 Chapter Summary ......................................................................................................... 9
CHAPTER 2. LITERATURE REVIEW ................................................................... 10
2.1 Diesel Generator Operation under Non-Ideal Load Conditions ......................... 10
2.2 Prevalence of Non-Ideal Load and Underutilization in Military Basecamp ...... 13
2.3 Potential Benefits of Energy Storage .................................................................. 15
2.4 Circuit/System-Level Characteristics of Rechargeable Batteries ....................... 16
2.5 Modeling and Simulation .................................................................................... 20
2.6 Hybrid Power System (HES) Optimization Studies ........................................... 21
2.7 Analytical Computation-Based Studies .............................................................. 22
2.8 Simulation-Based Studies ................................................................................... 23
2.9 Military Hybrid Energy Programs ...................................................................... 25

v
v
Page
2.10 Chapter Summary ..................................................................................................... 29
CHAPTER 3. METHODOLOGY.............................................................................. 30
3.1 Research Framework .......................................................................................... 30
3.2 Experiment Design ............................................................................................. 31
3.3 Identification of Parameters ................................................................................ 32
3.4 Objective Function and Simulation Model Design............................................. 32
3.5 Sample Set .......................................................................................................... 34
3.6 Criteria for Optimization .................................................................................... 34
3.7 Chapter Summary ............................................................................................... 34
CHAPTER 4. PRESENTATION OF DATA ............................................................. 37
4.1 Input Parameters Chapter Summary ................................................................... 37
4.2 Generator Model Validation ............................................................................... 40
4.3 Battery Model Validation ................................................................................... 41
4.4 Optimal C-Rate Analysis .................................................................................... 41
4.5 Hybrid System Validation .................................................................................. 43
4.6 Analysis for Fall/Spring Load ............................................................................. 44
4.6.1 Standalone Generator .................................................................................. 46
4.6.2 Hybrid System ............................................................................................. 46
4.7 Analysis For Summer and Winter Loads ........................................................... 47
4.7.1 Standalone Generator .................................................................................. 47
4.7.1 Hybrid System ............................................................................................ 34
4.8 Analysis of MEHPS Capacity Requirements .................................................... 54
4.9 Analysis of CASCOM "Storage-Only-Hybrid" system ................................... 59
4.10 Chapter Summary .............................................................................................. 61
CHAPTER 5. CONCLUSION ................................................................................... 62
LIST OF REFERENCES .................................................................................................. 66
APPENDICES
Appendix A ............................................................................................................ 72

vi
vi
Appendix B ............................................................................................................. 74
Appendix C ............................................................................................................. 78
Page
vii
vii
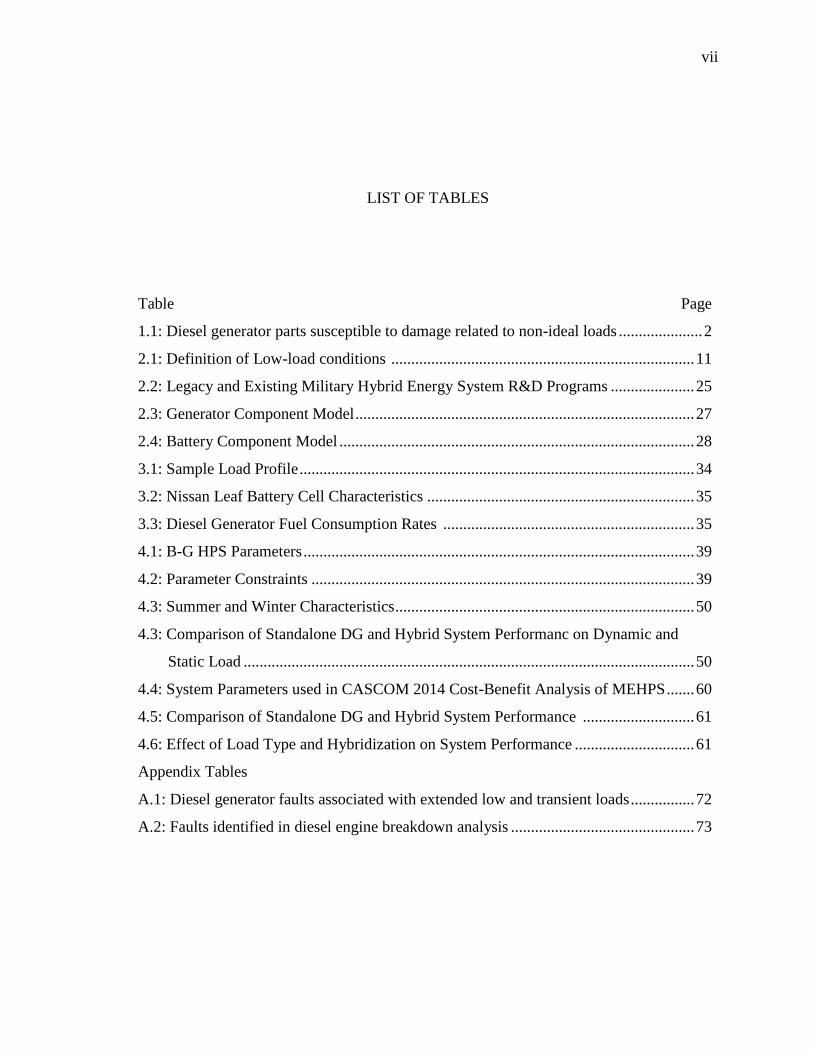
LIST OF TABLES
Table .............................................................................................................................. Page
1.1: Diesel generator parts susceptible to damage related to non-ideal loads ..................... 2
2.1: Definition of Low-load conditions ............................................................................ 11
2.2: Legacy and Existing Military Hybrid Energy System R&D Programs ..................... 25
2.3: Generator Component Model ..................................................................................... 27
2.4: Battery Component Model ......................................................................................... 28
3.1: Sample Load Profile ................................................................................................... 34
3.2: Nissan Leaf Battery Cell Characteristics ................................................................... 35
3.3: Diesel Generator Fuel Consumption Rates ............................................................... 35
4.1: B-G HPS Parameters .................................................................................................. 39
4.2: Parameter Constraints ................................................................................................ 39
4.3: Summer and Winter Characteristics ........................................................................... 50
4.3: Comparison of Standalone DG and Hybrid System Performanc on Dynamic and
Static Load ................................................................................................................. 50
4.4: System Parameters used in CASCOM 2014 Cost-Benefit Analysis of MEHPS ....... 60
4.5: Comparison of Standalone DG and Hybrid System Performance ............................ 61
4.6: Effect of Load Type and Hybridization on System Performance .............................. 61
Appendix Tables
A.1: Diesel generator faults associated with extended low and transient loads ................ 72
A.2: Faults identified in diesel engine breakdown analysis .............................................. 73

viii
viii
LIST OF FIGURES
Figure Page
1.1: Ideal B-G HPS Duty Cycle .......................................................................................... 7
2.1: Diesel engine response to load increase .................................................................... 12
2.2: Sample seasonal load profile of a USMC basecamp ................................................. 14
2.3: Relationship of discharge current to cell voltage....................................................... 17
2.4: Relationship of battery power output to DOD ........................................................... 17
2.5: Typical Li-ion cell charge/discharge curve ............................................................... 18
2.6: Li-ion battery charging protocols .............................................................................. 19
2.7: Analytical vs Simulation Modeling ........................................................................... 21
2.8a: Supply Chain model of a HPS ................................................................................. 24
2.8b: Larkin Hybrid Generator Duty Cycle ...................................................................... 24
2.9a: SD Model of energy flow......................................................................................... 24
2.9b: SD Model of dispatch control .................................................................................. 24
2.10: B-G HPS Design Concept ....................................................................................... 26
4.1: Generator Performance Model Validation ................................................................. 40
4.2: Simulation of 12kW battery servicing fall/spring profile load with a 5kW DG ........ 41
4.3: C-Rate sensitivity to generator maintenance cost ...................................................... 42
4.4: Simulation of 10kW-12kWh B-G HPS ..................................................................... 44
4.5: Standalone DG performance metrics on fall/spring load........................................... 45
4.6: B-G HPS Design Space For Fall/Spring Load........................................................... 48
4.7: Summer and winter load profile ................................................................................ 50
4.8: Standalone DG performance on summer and winter load ......................................... 51
4.9: Design space for B-G HPS performance on summer and winter load ...................... 53

ix
ix
4.10a: Simulation of”MEHPS-Low” lower boundary with fall/spring load..................... 54
4.10b: Simulation of”MEHPS-Low” upper boundary with fall/spring load .................. 55
4.10c: Simulation of”MEHPS-Medium” lower boundary with summer load ................. 55
4.10d: Simulation of”MEHPS-Medium” upper boundary with summer load ................. 55
4.11: Change in Performance of MEHPS-Low on summer load...................................... 57
4.12: Change in Performance of ”MEHPS-Medium on summer load.............................. 58
4.13: Optimization Criteria Analysis for MEHPS-Medium ............................................. 58
4.14: Simulation of CASCOM “Storage-Only-Hybrid-Medium System ......................... 60
Appendix Figures
A.1: Mechanism of Diesel Engine Damage ...................................................................... 73
B.1: Battery C-Rate Impact on Charge/Discharge Cycle ................................................. 74
B.2: B-G HPS Capacity Design Space for Summer Load ................................................ 75
B.3: B-G HPS Capacity Design Space for7.5kW Static Load .......................................... 76
B.4: B-G HPS Capacity Design Space for 2kW Static Load ........................................... 77
C.1: Excel Model Code and sample data ........................................................................ 78
Figure Page

x
x
LIST OF ABBREVIATIONS
AMMPS ADVANCED MEDIUM MOBILE POWER SOURCE
ARCIC Army Capabilities Integration Center
B-G HPS Battery-diesel Generator Hybrid Power System
CASCOM Combined Arms Support Command (CASCOM)
COP Combat Outpost
DG Diesel Generator
DOD Depth of Discharge
EOCV End-of-Charge Voltage
EODV End-of-Discharge Voltage
FOB Forward Operating Base
HPS Hybrid Power System
MEHPS Mobile Electric Hybrid Power Sources
M&S Modeling and Simulation
SOC State of Charge
TEP Tactical Electrical Power
TQG Tactical Quiet Generator
USMC United States Marine Corps

xi
xi
GLOSSARY
Battery: a device that converts and chemical energy into electrical energy and vice versa.
Capacity (Ah): total hours of charge available when a battery is discharged from 100%
SOC to a cut-off SOC at a certain discharge current.
Charge/Discharge Current: also known as “C-rate”; the maximum safe current at which a
battery can be charged or discharged continuously without damaging the battery or
reducing its capacity.
Contingency Operations: operations that involve hostilities and require military action.
Contingency Basecamp: locations that support military operations in an expeditionary
environment, and provide the support and services necessary to sustain operations.
Combat Outpost (COP): a type of military contingency basecamp that can sustain a small
group (less than 200 soldiers) for extended periods of time in a remote environment.
COPs have short cycle life and provide protection, shelter, sanitation, and dining.
Infrastructure is likely to provide portable generator, temporary wiring, water
storage, crude toilets and shows. Energy systems tend to be inefficient, and
therefore present significant improvement opportunities.
Cycle Life: the number of charge-discharge cycles a battery can experience before it can
no longer meet specific performance criteria. This is dependent on the frequency
and depth of the cycles, as well as other battery conditions such as temperature and
humidity. Shallow discharge cycles extend cycle life.
Deployability: ease of movement to the battlefield of a military equipment.
Depth of Discharge (DOD): an expression of battery capacity that has been discharged at
any given time as a percentage of maximum capacity.
Emergency Operations Center (EOC): a central command and control facility responsible
for carrying out emergency preparedness or disaster management functions such as
information gathering and analysis, and coordination of field service operations.
Energy (Wh): total Watt-hours available when a battery is discharged from 100% SOC to
a cut-off SOC at a certain discharge current.

xii
xii
Forward Operating Base (FOB): A type of contingency basecamp that generally support a
battalion or larger size population. FOBs typically have temporary or semi-
permanent structures, electrical power grids, water, sewage systems, and
operational, administrative, housing and recreational facilities that require energy
for lighting, heating, and air conditioning.
Low load Operation: the operation of a diesel generator at engine loads below 40% of its
maximum-rated power capacity.
Operational Energy (OE): Also referred to in this work as “expeditionary energy”. The
energy and associated systems, processes and resources required to train, move, and
sustain forces and systems for military operations.
State of Charge (SOC - %): an expression of a battery’s capacity at any given time as a
percentage of its maximum capacity.
Tactical Electric Power (TEP) – A range of electrical power output (0 to 200 kilowatts)
that satisfies the power requirements of an expeditionary force. TEP meets
electricity demand of mission-critical C4ISR and life support systems employed by
tactical military echelons (brigades, battalions, companies, and platoons).
Transient Load Operations: operation of a diesel generator under variable load condition
or sudden changes in load demand, which causes engine torque deficit and speed
change.
Voltage (V): potential difference between battery terminals—known as “terminal”
voltage when a load is applied, and “open-circuit” voltage when no load is applied.
Voltage varies with SOC and rate of charge/discharge.
Wet-stacking: formation of carbon deposits and soot due to incomplete combustion of
fuel inside the cylinder of an internal combustion diesel engine.

xii
xii
ABSTRACT
Onwuanumkpe, Jude C. M.S., Purdue University, May 2016. Capacity Optimization of
Battery-Generator Hybrid Power System: Toward Minimizing Maintenance Cost In
Expeditionary Base Camp Applications. Major Professor: Eric Dietz
Low and transient load conditions have been shown to have deleterious impact on
the efficiency and health of diesel generators (DGs). Extensive operation under such
loads reduces fuel consumption and energy conversion efficiency, and incrementally
contribute to diesel engine degradation, damage, or catastrophic failure. Unfortunately
non-ideal loads are prevalent in contingency basecamps that support contingency
operations in austere environments or remote locations where grid electricity is either
non-existent or inaccessible. The impact of such loads on DG exacerbates already
overburdened energy logistics requirements. There is a need, therefore, to eliminate or
prevent the occurrence of such non-ideal loads. Although advances in diesel engine
technologies have improved performance, DGs remain vulnerable to the consequence of
non-ideal loads and inherent inefficiencies of combustion. The mechanism through
which DGs mitigate non-ideal loads is also mechanically stressful and energy-intensive.
Energy storage could provide load-levelling capability that is more ameliorative than
modern DGs’ load-following capability. Thus, this research investigated the idea of using
batteries to prevent DGs from encountering non-ideal loads, as a way to reduce basecamp
energy logistics requirements. Results show that if optimized for dynamic loads, a

xiii
xiii
battery-diesel generator system allows for more than 50% reduction to generator runtime
and maintenance cost.

1
1
CHAPTER 1. INTRODUCTION
1.1 Introduction
Expeditionary basecamps enable life support, communications, and command and
control functions of contingency operations—emergency response and disaster-relief
activities, humanitarian aid missions, and military combat operations. Such basecamps
are usually isolated from a reliable power grid by combat threats and safety hazards. In
the absence of accessible electricity infrastructure, contingency basecamps rely on diesel
generators (DGs) and a steady supply of fuel for electric power, without which many
functions and capabilities would be lost in the technology-intensive 21st-century
operating environment.
The sustainment of basecamp power requirements is a major logistical
undertaking that comes with extraordinary financial and human costs. Efforts to
minimize those costs are also a major effort that continues to yield positive results.
Innovation in combustion engine technology and intelligent control electronics has led to
significant improvement in the efficiency, reliability, and durability of diesel generators.
This is evident in the performance of the recently fielded Advanced Medium Mobile
Power Source (AMMPS) family of military generators.
Performance enhancements notwithstanding, DGs remain susceptible to the
negative impact of non-ideal load conditions. Extended DG operation under low and

2
2
transient loads exacerbate inherent limitations of internal combustion engine (ICE)
science and manifest in increased basecamp energy logistics requirements. This research
seeks to contribute to continued effort to find solutions that might lower or eliminate the
impact of non-ideal load conditions on DGs. Solutions exist which not only enable DGs
to deal with non-ideal loads, but also ensure that they do not encounter such loads at all.
1.2 Problem Statement
Vulnerability of DGs to the impact of non-ideal load exacerbates or at least
contributes to basecamp energy logistics burden. A major challenge to meeting tactical
electric power requirements are still center on energy conversion, despite recent
improvements to combustion technology. Although diesel generators provide reliable,
high-quality power, their energy-conversion efficiency is less than 50%, which is lower
than the efficiency of many other energy conversion technologies (DOE, 2006). The
efficiency decreases when DGs are subjected to non-ideal operating conditions. DGs
subjected to extended periods of low-average and drastically-fluctuating power demand
consume more energy per power output, and are more prone to damage or essential
function failure (Tufts, 2014). They require more frequent resupply of fuel, repair parts
(Table 1.2), maintenance man-hours, and increased costs.
Table 1.1 Diesel generator parts susceptible to damage related to non-ideal loads
(Tufts, 2014)
- Cylinder
- Fuel pump
- Piston ring
- Piston ring seals
- Cylinder liner
- Crankcase bearing
- Head gasket
- Lubricating oil and filter
- Fuel and filter
- Fuel Injector nozzle
3
3
Non-ideal load conditions are prevalent in military basecamps. During certain
phases of contingency operations, the tempo of basecamp activities—including command
& control, life support, and force protection functions—is very dynamic. This manifests
in a basecamp load profile that is characterized by wide fluctuations. Operational
readiness requirements and planning practices—such as the requirement for redundant
generators—also contribute to the existence of non-ideal conditions. Engineers at
Cummins Power Generation—a major DG manufacturer—note that stringent power-
quality requirements necessitate overdesign of military DGs. These factors inevitably
contribute to the prevalence of conditions that subjects DGs to suboptimal utilization, and
increases basecamp energy sustainment costs, which include the risk of maintaining
supply lines through enemy territory and difficult terrain.
Modern DGs are equipped with advanced combustion technology features—
electronic fuel inject, variable engine speed, power control electronics--which enable
improved performance. AMMPS DGs, for example, can probably handle non-ideal load
conditions better than their predecessors; however, the process through which they
achieve that feat is not immune to consequences. Research suggests that the mere
existence of non-ideal loads, and the mechanics of adjusting to those conditions, also take
a toll on generator’s operating efficiency and long-term health. Furthermore, the degree
advanced combustion technologies address wet-stacking and other engine problems
associated with suboptimal DG operation is not yet known. Cummins engineers concede
that the wet-stacking solution equipped in AMMPS DGs—an artificial engine
temperature control—does not completely eliminate wet-stacking potential (interview
citation). DGs remain vulnerable to a compendium of faults related to low and transient
4
4
conditions (Appendix A). These realities compound the logistics burden of sustaining
energy requirements of contingency basecamps.
Research Question
Diesel generators’ vulnerability to deleterious impact of non-ideal load conditions
remains a significant technological problem, the ultimate solution of which may require
not using DGs at all. The long-term solution may indeed require complete transition
away from combustion-based technologies, and towards renewable energy technologies.
Unfortunately a perception that renewable technologies currently do not meet weight,
size, and cost standards limits their use in contingency basecamp applications. An
alternate solution may lie not only in enabling DGs to handle low and transient loads, but
also in ensuring that they do not encounter such loads at all.
Reduction of basecamp energy requirements (fuel, maintenance, etc) achieved
from minimizing DG usage may exceed that achieved by engine performance
enhancements. Introducing an energy storage capability may be the most effective way to
inoculate DGs from the effects of non-ideal load conditions. A battery would not only
provide additional load that forces DGs to run at greater efficiency, but also provide
power capacity that can be used to reduce DG usage. To the extent that these potential
benefits exist, there is value in investigating how those they might be realized. This
research therefore seeks to contribute to that investigation by asking and answering the
following question:
How can the components of battery-diesel generator hybrid power system (B-G
HPS) be rightsized to (a) eliminate the generator’s vulnerability to the negative

5
5
impacts non-ideal load conditions which are prevalent in contingency basecamps,
(b) minimize engine wear caused by prolonged exposure to low and transient
loads, and (c) reduce generator maintenance cost and the overall burden of
basecamp energy logistics?
1.3 Significance
The performance and benefits of a B-G HPS depend on right-sizing its
components and employing it under optimal conditions. Results and findings in this
study provide insight that could encourage hybridization of the military’s vast inventory
of diesel generators using increasingly reliable and affordable off-the-shelf batteries. It
may also help set conditions for an eventual transition to renewable hybrid technologies
while enhancing the investment in existing combustion-based power systems.
1.4 Scope
The scope of this research is limited to expeditionary power infrastructure,
particularly small military basecamps and tactical sites that provide support for
contingency operations. Energy requirements in such basecamps are more challenging to
manage and sustain. DGs employed there are predictably more susceptible to
underutilization and all the attendant consequences of non-ideal load conditions. This
research builds on the USMC’s Mobile Electric Hybrid Power Source (MEHPS) program,
which prescribes a range of storage capacity for the 3kW and 10kW AMMPS DGs
(USMC Expeditionary Energy Office, 2013). If its components are appropriately sized
for a given load profile, the duty cycle of a battery-DG hybrid system would mimic an

6
6
ideal cycle (Figure 1.1) with short generator runtime, short battery charging time, and
long discharge time. Such a cycle would minimize generator runtime, frequency of
maintenance, and maintenance cost over time. This research will analyze performance of
using MEHPS capacity prescriptions with respect to maintenance cost, fuel consumption,
and energy-conversion efficiency over 90-day mission cycle.
Figure 1.1. Ideal Duty Cycle (Sloane, 2008)
1.5 Assumptions
The following assumptions are necessary for completion of this study:
Hybrid generator components (battery, diesel engine, inverter) operate at high
efficiencies and near perfect conditions
o Battery does not experience significant chemical degradation over time.
o Energy losses by electronic control devices are negligible
Available basecamp load data sufficiently replicates low and transient loads.
Battery is subject to degradation or reduced capacity in temperature extremes.
Hybrid system is already located at a basecamp and is not subject to battery
transportation safety requirements.
7
7
Battery at the start of operation has at least 90% of charge
Generator capacity is large enough to service load and charge battery
simultaneously at the battery’s maximum charge rate.
Hybrid system, in default mode, controlled autonomously/passively by battery
state-of-charge.
Battery is sized so that the sum of its capacity at minimum state-of-charge (SOC)
average load over a duty cycle is less than or equal to generator’s rated capacity.
1.6 Limitation
The limitations of this study include:
Analysis of hybrid system is limited to loads and battery capacity ranges
prescribed for the MEHPS program.
Analysis considers a limited sample power demand data for each category of
generator size.
Analysis considers system parameters established for the MEHPS program.
Analysis uses one specific cell chemistry or design.
Optimization is based on minimization of excess power production, energy waste,
generator runtime, and maintenance cost.
Battery model does not include temperature and capacity fading effects
Since AMMPS generators are newly fielded, there is no service history or record
of damages that can provide data to qualitatively measure the frequency and
impact of low and transient load conditions.

8
8
1.7 Delimitations
The delimitations of this study include:
Hybrid Power System (HPS) does not include renewable generation sources such
as wind turbines and solar photovoltaic (PV) cells.
Hybrid system is simulated for operation at standard atmospheric conditions.
1.8 Summary
This research attempts to identify the optimal capacity of a battery that may be
used in conjunction with a diesel generator to provide electric power for contingency
operations in austere environments. Batteries would force generators to run at full
capacity and more efficiently, thus reducing frequency and impact of LL and TL
generator operations. Right-sizing the components of a hybrid power system is a classic
design problem that can be solved experimentally through optimization. Therefore, the
research studies four scenarios establish a general guideline for tailoring a hybrid
generator solution to a specific power demand profile. The research seeks to improve
storage capacity estimates established by the Marine Corps MEHPS program. Results
might yield a less broad, more targeted estimates that would facilitate design and
production of energy storage device that is tailored to unique basecamp applications.
10
10
CHAPTER 2. REVIEW OF RELEVANT LITERATURE
This section discusses review of research literature on topics related to the motivation,
scope, and question posed in this research. The main areas covered include effects of
non-ideal load conditions on diesel generators, general cycling behavior of modern high-
capacity rechargeable batteries, as well as computational and simulation-based
experimental methods used study hybrid power systems. The review focuses on aspects
of the topics that are relevant for application to modeling, simulating, and analyzing
battery-generator hybrid power systems.
2.1 Diesel Generator Operation under Non-Ideal Load Conditions
The term “diesel generator” refers to a set of two devices—an internal combustion
diesel engine and a permanent-magnet alternator—that work tandem to produce to
electrical power. During the combustion part of process, the diesel engine continuously
ignites a mixture of air and fuel under high temperature and pressure induced by
compression of a piston within the engine’s cylinders. This converts the fuel’s chemical
energy content into kinetic energy, which the alternator consequently converts to electric
power through electromagnetism. The efficacy of this process depends on several
variables related to load level, which Tuft (2014) defined according to Table 2.1.

11
11
Table 2.1. Definition of Low-load conditions (Tufts, 2014)
0 – 25% Extreme low load
25 – 40% Low Load
40 – 80% Regular generator operation load
80 – 90% High load
90 – 100% Extreme high load
Tufts (2014) linked a compendium of diesel engine problems (Table A.1) to
operation under low load conditions. Low loads, according to Tufts, deteriorates two key
parameters—temperature and pressure—that contribute most to deteriorate DG engine’s
combustion efficiency. As Tufts described in detail,
“Temperature the most important parameter in the combustion process because of
its exponential dependence on chemical reaction rate (p. 9)… Low load
operations of a diesel engines cause lower cylinder pressures, and thus lower
temperature, which can result in ignition problems and incomplete combustion.
Low cylinder pressure has mainly a negative effect on the cylinder temperature,
but also deteriorates the piston ring sealing efficiency as piston rings rely on the
gas pressure in the combustion chamber to work properly. Incomplete
combustion will lead to increased soot formation and aggregation of unburned
fuel in the cylinder…”(p. 83)
Tufts noted that low loads negative impact other parameters that contribute to
combustion efficiency—rate and geometry of fuel injection, timing of valve openings to
allow intake of fresh air and exhaust of combustion gas products from the cylinder, and
the physical integrity of cylinder components—piston rings, piston crown, liner, and oil
ring (Tuft, 2014, p. 15). With prolonged exposure to low loads, the initial chain of events

12
12
described above cascades to many other problems that eventually lead to significant DG
engine failure.
Similar sequence of deleterious consequences can result from transient loads,
which refer to sudden change in power demand that causes drastic fluctuations in the
voltage and frequency output of a diesel generator alternator. Diesel generators are built
to different standards and capacity to maintain power quality amidst load fluctuations;
thus there is no universal threshold of transient load that is considered detrimental.
Nevertheless, Rakopoulos & Giakoumis (2009) representation of DG’s response to load
change, as well as findings from diesel engine damage cases (Figure A.1), shows that
load changes are indeed consequential. The dependence of the energy-conversion process
on load factor—the ratio of power demand to supply—suggests that diesel generators are
always susceptible to inefficiencies and other forms of performance tax imposed by non-
ideal loads.
Figure 2.1. Diesel engine response to load increase (Rakopoulos & Giakoumis (2009)

13
13
Additionally, Allen (1993) observed that engine loading is one of several factors
that contribute significantly to formation and accumulation of carbon deposits, and
consequent degradation of combustion efficiency. Additionally, Buhaug (2003) posited
that the accumulation of lacquer—a resinous substance formed from condensed fuel bi-
products of combustion—tends to occur in non-ideal load conditions that also promote
incomplete fuel combustion. Woodyard (2009) also attributed long period of load
variation, along with other factors, to lacquer formation, which causes smoothing or
glazing of cylinder liner surface and increases consumption of lubricating oil.
2.2 Prevalence of Non-Ideal Load and DG Underutilization in Military Basecamps
Reports and analysis of military basecamp operations in Iraq and Afghanistan
found that low and transient loads (Figure 2.2) were prevalent in small, semi-permanent
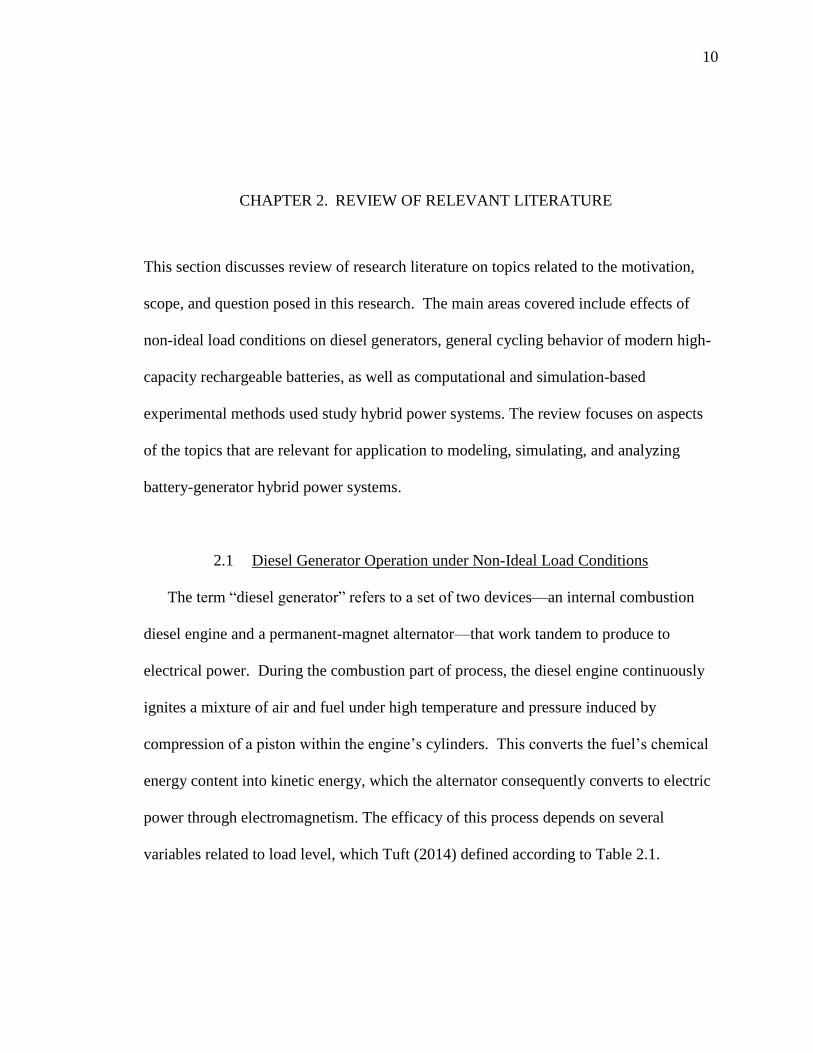
basecamps such as combat outposts (COPs) and Fire Bases (FBs) (ARCIC, 2010; USMC,
2013). The U.S. Army’s Capability Integration Command observed that power demand
at such basecamps “vary greatly…and are more difficult to resupply and sustain”
(ARCIC, 2012). A USMC study also found that less than 1% of 767 electric load
samples were serviced by diesel generators (DGs) operating at more than 75% of their
rated capacity. The same study found that approximately 80% of those loads were
serviced by generators operating at less than 55% of capacity (USMC Expeditionary
Energy Office, 2013).
The prevalence of low loads and extent of generator underutilization in military
basecamps suggests that DGs employed there experienced wet-stacking and other
14
14
combusted-related problems associated with operation under non-ideal conditions. Most
of those were older generation models known as Tactical Quiet Generators (TQGs), and
did not have load-following capability—the ability to toggle engine speed to match
power demand—or combustion control electrics that allow for better performance.
Recently fielded AMMPS DGs are equipped with advanced features—variable-speed
engine, electronic fuel inject, power control electronics—which, according to design
literature and manufacturer tests claims, enable them to deal with non-ideal load
conditions better than their TQG predecessors (Hess, 2002; ORNL, 2002; Tolbert, Peters,
Theiss & Scudiere, 2003). However, a robust damage record or service history has not
been established to measure their resistance to wet-stacking under actual basecamp
operating conditions.
Figure 2.2 Sample seasonal load profile of a USMC basecamp
0 10 200
2
4
6
8
10
Summer
Winter
Fall/Spring
Summer average
Winter average
Spring/Fall average
Time (hr)
Pow
er (k
W)

15
15
2.3 Potential Benefits of Energy Storage
Advances in high capacity batteries over the last decade have spurred massive
price reduction and proliferation in automobile applications, as well as in grid/utility-
scale stationary energy storage services (Manghani, 2015). This development trend is
compelling evidence of the increasing reliability of modern rechargeable batteries,
especially those based on Lithium ion (Li-ion) chemistry. The trajectory of progress may
have also influenced recognition of potential benefits of energy storage to military
basecamp applications. A 2010 U.S. Army Power and Energy Strategy white paper
proposed the following goals for future base capabilities (ARCIC, 2010, p. 9-11):
- “12 hours of silent power to support COP-level life support and C4I functions
- “Minimize or replace current hydrocarbon energy systems”
- “Establish expeditionary grid for charging batteries”
- “Eliminate generator by 2030”
- “Import and/or export power to civilian systems” and achieve “security through
improving conditions and civic engagement.”
These long-term goals indeed illustrate recognition of the potential benefits that
batteries could provide. Despite the improvements, however, acceptance of batteries as a
prime power source in contingency basecamp applications continue to be limited by
portability, cost, and safety concerns, as well as stigmatized perception of their reliability.
In fact, a 2014 U.S. Army study advised discontinuation of then on-going expeditionary
energy storage R&D efforts on the basis that they were cost-prohibitive compared to new
diesel-generator programs (CASCOM, 2014). The study specifically noted that future
16
16
commitments to such efforts would require “radical advances in size, weight, and power
ratios” (p. 26).
2.4 Circuit/System-Level Characteristics of Rechargeable Batteries
Indeed even the best battery technologies in existence today have scientific
limitations. Just as diesel engines’ performance depends on load conditions, battery
performance also depends the effectiveness of its electrochemical response to cycling
conditions, which are defined by several parameters, including load profile. Interplay of
those parameters determines the amount of energy the battery can store, how long it takes
to store the energy, and the time and amount of power that the battery can output. It also
determine the battery’s useful cycle life—the number of complete charge-discharge
cycles the battery can undergo. Maximizing performance requires making tradeoffs and
striking a balance between the impacts of multiple variables.
Modern rechargeable batteries are complex systems with chemical and electrical
properties. In an electric circuit, batteries act as a power source and sink, dual roles that
both depend on conditions external and internal to the battery. Concerns about the
viability and cost-effectiveness of employing them for TEP stem from the degree to
which those tradeoffs are not only understood, but deemed acceptable. Unfortunately
many aspects of rechargeable batteries’ science is complex and not intuitive.
Nevertheless, a rudimentary understanding can serve the purpose of maximizing the
potential benefits of energy storage as part of a hybrid power system. To integrate a
battery into a hybrid power system, the relationships between its internal state variables
(DOD, SOC, open-circuit voltage, internal resistance) and system-level variables must be
17
17
understood. Knowledge of how these parameters affect performance—measured in terms
of charge and discharge time, storage capacity, power output, and cycle life—enables
analysis that might inform successful and optimal employment of batteries.
Fortunately, several research works have created a comprehensive body of
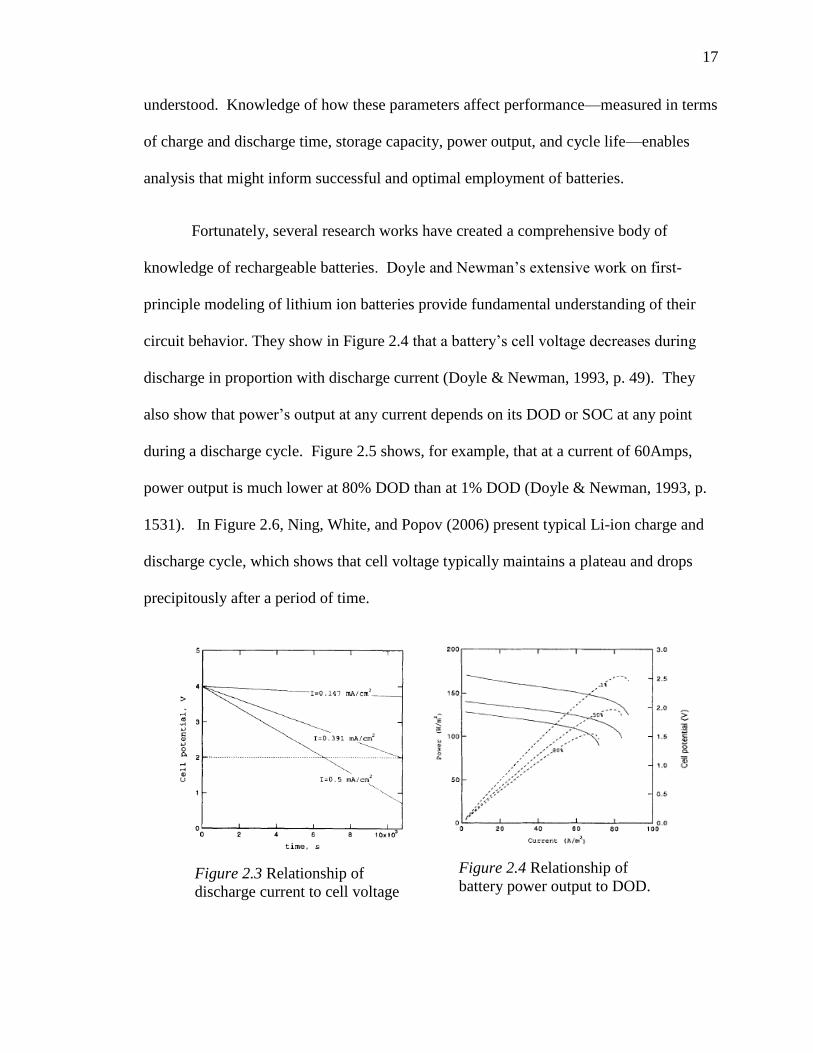
knowledge of rechargeable batteries. Doyle and Newman’s extensive work on first-
principle modeling of lithium ion batteries provide fundamental understanding of their
circuit behavior. They show in Figure 2.4 that a battery’s cell voltage decreases during
discharge in proportion with discharge current (Doyle & Newman, 1993, p. 49). They
also show that power’s output at any current depends on its DOD or SOC at any point
during a discharge cycle. Figure 2.5 shows, for example, that at a current of 60Amps,
power output is much lower at 80% DOD than at 1% DOD (Doyle & Newman, 1993, p.
1531). In Figure 2.6, Ning, White, and Popov (2006) present typical Li-ion charge and
discharge cycle, which shows that cell voltage typically maintains a plateau and drops
precipitously after a period of time.
Figure 2.4 Relationship of
battery power output to DOD. Figure 2.3 Relationship of
discharge current to cell voltage
18
18
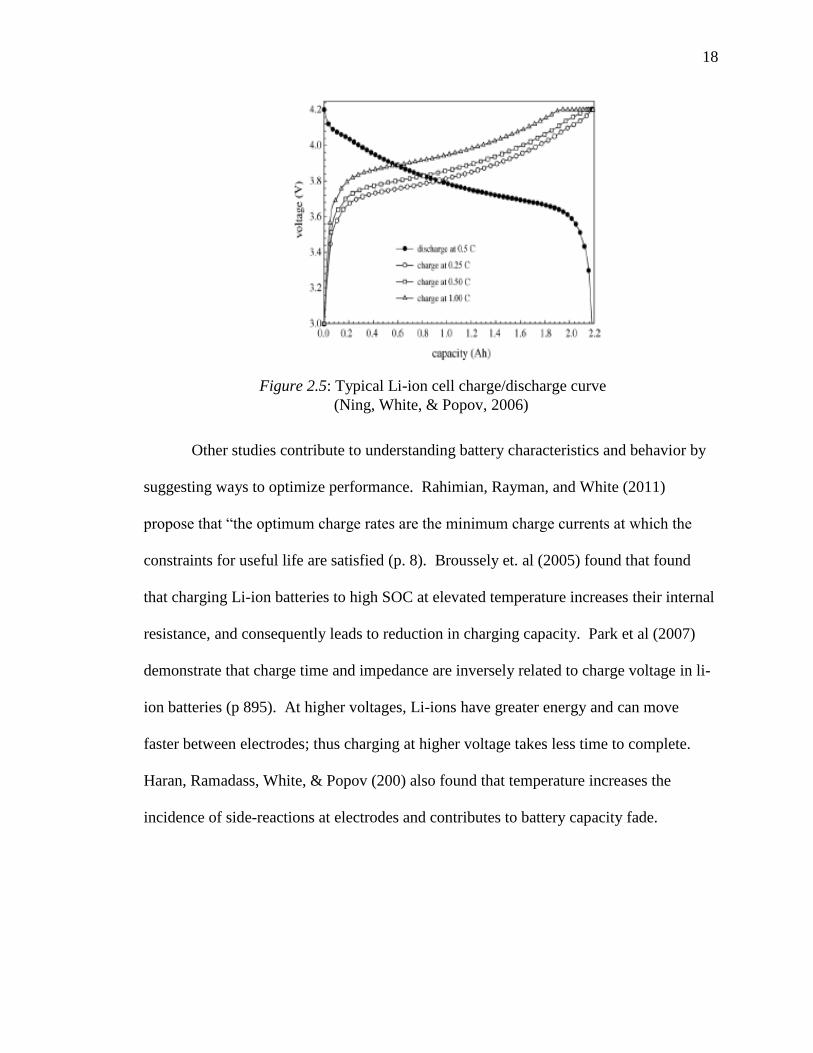
Other studies contribute to understanding battery characteristics and behavior by
suggesting ways to optimize performance. Rahimian, Rayman, and White (2011)
propose that “the optimum charge rates are the minimum charge currents at which the
constraints for useful life are satisfied (p. 8). Broussely et. al (2005) found that found
that charging Li-ion batteries to high SOC at elevated temperature increases their internal
resistance, and consequently leads to reduction in charging capacity. Park et al (2007)
demonstrate that charge time and impedance are inversely related to charge voltage in li-
ion batteries (p 895). At higher voltages, Li-ions have greater energy and can move
faster between electrodes; thus charging at higher voltage takes less time to complete.
Haran, Ramadass, White, & Popov (200) also found that temperature increases the
incidence of side-reactions at electrodes and contributes to battery capacity fade.
Figure 2.5: Typical Li-ion cell charge/discharge curve
(Ning, White, & Popov, 2006)

19
19
Additionally, according to Methekar, Ramadesigan, and Braatz (2010), “the
method in which battery is charged can significantly alter its efficiency, safety and life
time cycle”(p. 143). Zhang (2006) also found that a battery’s cycle life “strongly
depends” on how it is charged (Figure 2.7). Zhang also established definition of “slow”
and “fast” charging with respect to battery capacity. For Li-ion batteries, Zhang found
that charging at 1C is not only fast but also increases the capacity fade (Zhang, 2006).
Zhang, Xu, and Jow (2006) reported that beyond a certain charge rate (0.4C for grahite-
LithiumCoO2 batteries), increasing charge current did not significantly shorten charge
time; instead it aggravated other conditions that are detrimental to the battery’s health.
Figure 2.6: Li-ion battery charging protocols (Zhang, 2006). (a)
Constant Current-Constant Voltage; (b) Constant Power-Constant
Voltage, (c) Multistage Constant Current.

20
20
2.5 Modeling and Simulation
The nature of the question posed in this research necessitates a non-traditional
experiment approach that relies on the aide of computer information technology. A
traditional approach would use actual hybrid system components and real-time loads to
obtain performance data needed to conduct analysis; however such resources neither exist
at the disposal of the researcher, nor are necessary, given that the research goals can be
accomplished with modeling and simulation software. Such information technology
tools provide sufficient alternative to the expense and challenges of solving real-world
problems via experiments. As Grigoryev (2015) notes, it is often impractical and
sometimes impossible to conduct experiments with real objects because “building,
destroying, and making changes may be too expensive, dangerous, or impossible” (p. 7).
Summarizing the purpose of modeling, Grigoreyev states held that “modeling is about
finding a way from the problem to its solution through a risk-free world where we’re
allowed to make mistakes, undo things, go back in time, and start over again (Grigoryev,
2015, p. 8).
To conducting an experiment with a model is to requires execute of the modeling
process, which Borschchev and Fillipov (2004) describe as follows:
“The modeling process include the process of mapping the problem from the real
world to the world of models, the process of abstraction, model analysis and
optimization, and mapping the solution back to the real system” (p. 1)
The process also includes choosing one of several modeling methods that can be divided
into two broad category of computer models—analytical and simulation models.
Grigoreyev (2015) notes that that are two major types of computer models: analytical and

21
21
simulation. Analytical models use formulas to define a problem and can be solved with
common computation/data management tool such as Microsoft Excel. Some problems,
however, are too complex, have intricate, non-intuitive dependencies and involve too
many time-dependent or causal variables (Grigoreyev, 2015, p. 9). Those type of
dynamic problems are usually require significant computational resources to solve
analytical, if even possible, but are more approachable with simulation models, which
Borschchev and Fillipov (2004) describe as “a set of rules…that define how the system
being modeled will change in the future, given its present state” (p, 1).
2.6 Hybrid Power System (HES) Optimization Studies
Optimization is the process of iteratively solving a problem several times under
various conditions in order to identify a “best” solution based a certain criteria. An
optimal solution is obtained by analytically or numerically evaluating an objective
function—a mathematical/analytical expression or some rendering that define
relationships between the problem’s dependent and independent variables—multiple
Figure 2.7 Analytical vs Simulation Modeling (Borshchev & Fillipo,
2004).

22
22
times. An optimum solution is determined either by following a specific search
algorithm, or simply comparing simulation results with established optimization criteria.
The process often involves complex computations and a large amount of data, and is
therefore tedious without an automated tool with sufficient computing resources (time
and computer processor capacity). Efficiency, accuracy requirements may also drive need
for additional resources.
2.7 Analytical Computation-Based Studies
The following studies provide examples of the aforementioned optimization
approach. Diaf et al (2007) used this approach to minimize LCE in order to optimize size
of a residential PV/wind system in Corsica Island. Agarwal, Kumar, and Varun (2013)
optimized component sizes of a PV/DG/battery HES in Uttar Predesh, India by
integrating a unique optimization algorithm into a C-programing computational tool to
minimize LCC and COE. The mathematical model developed in this study comprise of
35 total parameters. 10 of the parameters model the system’s storage component and are
independent of battery chemistry.
Furthermore, several studies incorporate one or a combination of stochastic
algorithms to improve computational efficiency. According to Hong and Lian (2012), the
use of Markov-based genetic algorithm (GA) in optimization of an HES located on
Orchid Island, Taiwan greatly reduced computational resources. Bilal et al. (2011) also
used genetic algorithm to minimize LCE and COE for optimization of a
PV/wind/DG/battery system located in northwestern Senegal. Additionally, Borhanazad
et al. (2014) applied particle swarm optimization (PSO) algorithm in the size and

23
23
operation-scheme optimization of a HES in Iran. Wang and Singh (2007) also applied a
derivative of PSO, known as constrained mixed-integer multi-objective particle swarm
optimization (CMIMOPSO), to optimize a complex HES.
2.8 Simulation-Based Studies
Many other studies analyzed HES with numerical methods embedded in modeling
and simulation (M&S) tools (Bernal-Agustin & Dufo-Lopez, 2009). These tools also
used parameters, decision variables, and objective functions, but in a less primitive
format. They also make higher order (more complex and more numerous) computations
less tedious. M&S tools allow flexibility and automation capability which make them
well suited for optimizing both size and operation control of hybrid systems. The earliest
variation is HYBRID—Hybrid System Simulation Model, developed by the National
Renewable Energy Research Lab (NREL) and the University of Massachusetts. Baring-
Gould, Green, and van Dijk (1996) reported the use of second generation HYBRID2 for
optimization of a wind-diesel-battery hybrid power system located in Froya, Norway.
Furthermore, Khare, Nema, and Baredar (2015) used the Hybrid Optimization Model for
Electric Renewable (HOMER) simulation tool, in conjunction with particle swarm
algorithm (PS) to optimize a renewable energy system in Sagar, India. HOMER enabled
researchers to “fine-tune” various system parameters (generator loading, battery depth of
discharge, and rate of recharge) and thereby determine optimal size and operational
control strategy for the hybrid system. Kusakana and Vermaat (2013) also used HOMER
to study the impact of adding a battery storage system to a diesel generator (DG) in two
cases—a rural household and a base transceiver station.

24
24
Figure 2.8a. Supply Chain model of
a HPS (Larkin, 2014)
Figure 2.9a SD model of energy flow Figure 2.9b: SD model of
dispatch control
Figure 2.8b. Larkin Hybrid
Generator Duty Cycle
Larkin (2014) used AnyLogic to model a B-G HPS in form of a stock supply
chain (Figure 2.9a). AnyLogic is a java-based M&S tool permits the use of one or a
combination of three modelling frameworks: system dynamics (SD), discrete event (DE),
and agent base (AB) (The AnyLogic Company, 2014). Result of the study, however, is
far from ideal as the system’s duty cycles are short and frequent (Figure 2.9b). This
suggests that the modeled battery is not appropriately sized for sample the load.
Nevertheless, Larkin(2014) provides a good conceptual start point for this current
research. Also, Bazan and German (2012) adapted AnyLogic to their i7-AnyEnergy
simulation tool, using SD to model energy flows, and state charts to model power control
decisions. Pruckner and German (2013, 2014) alssed AnyLogic to build a hybrid
simulation model for large-scale electricity generation systems that includes pumped
hydro storage. Both studies modeled a hybrid system and power dispatch control with
SD (Figure 2.10a and 2.10b, respectively).

25
25
2.9 Military Hybrid Energy Programs
The idea of storing energy or hybridizing diesel generators is not novel. Several
military research and development programs have explored it to varying degrees of
success. These programs (Table 1.2) represent a continuous effort to not only reduce the
burdens of basecamp power logistics, but also close capability gaps, mitigate risks, and
shore up vulnerabilities in contingency operations. U.S. government R&D investments
and focus in this area suggests that it is a matter of national/strategic importance, not only
for the U.S. military, but also for American taxpayers (DoD, 2012; Hammick, 2012;
Jagels, 2013a,b; U.S. Army, 2010, 2013).
Table 2.2 Legacy and Existing Military Hybrid Energy System R&D Programs
Program Source
Reusing Existing Natural Energy
from Wind & Solar (RENEWS)
system
Jagles, 2013
Ground Renewable Expeditionary
Energy System (GREENS)
USMC Expeditionary Energy Office, 2013
Transportable Hybrid Energy Power
Station (THEPS) Ellwood, Cycowski, Raney, & Panozzo, 2009
Deployable Renewable Energy
Alternative Module (DREAM) Ellwood, Cycowski, Raney, & Panozzo, 2009
Exprimental Forward Operating Base
(ExFob) system Lasswell, 2009
Mobile Hybrid Electric Power
Systems (MEHPS)
USMC Expeditionary Energy Office, 2013
Solar Portable Alternative
Communication Equipment System USMC Expeditionary Energy Office, 2013
The R&D programs mentioned above combined generation from fossil fuel and
renewable energy sources with storage. Although they were effective in reducing fuel
consumption, their employment requires significant tradeoff in with respect to cost and
power density. This present study excludes renewable generation devices, as Figure 2.11

26
26
depecits, and explores a battery-generator hybrid power system (BG-HPS). The
performance and benefits of the system depend on right-sizing its components and
employing it under optimal conditions. By answering the research question posed above,
this study sought to determine optimal combination of battery and generator capacity, as
well as other operating conditions that might minimize energy waste and reduce
maintenance costs. The results might provide insight that could encourage hybridization
of the military’s vast inventory of diesel generators using increasingly reliable and
affordable off-the-shelf batteries. It may also help set conditions for an eventual
transition to renewable hybrid technologies while enhancing the investment in existing
combustion-based power systems.
Figure 2.10 B-G HPS Design Concept (Dufo-Lopez & Bernal-Agustin (2005)
The problem tackled in this research is such that features of both analytical and
simulation model can be employed to solve it. Characteristics and behavior of hybrid
power system and its subcomponents have been developed and employed by several
studies. Table 2.1 and Table 2.2 list models of hybrid system features and functions that
are incorporated in this research.

27
27
Table 2.3. Generator Component Model
Parameter Model Source
Hourly Fuel
Consumption 3kW: 0.2 LF(t) + 0.132
5kW: 0.328 LF(t) + 0.164
10kW: 0.528 LF(t) + 0.238
15kW: 0.948 LF(t) + 0.25
where LF(t) = Load Factor =PL(t)
PG,
Regression analysis using
AMMPS Fuel Consumption
chart
USMC MEHPS RFP (2015)
Power Output 𝑃𝐺
0.8∗ 𝐿𝐹(𝑡)
All AMMPS rated at 80% loading
Diesel Engine Theory
Dufo-Lopez & Bernal-
Augustin (2005)
Energy Content of
consumed Fuel
Energy Content of JP-8: 18,400BTU/lb
Density: 7.00lb/gal
1khW = 3412.14BTU
MIL-DTL-46162E
(November, 2012)
Power Conversion
Efficiency Power Output ∗ ∆t
Energy Content of Consumed Fuel
Dufo-Lopez & Bernal-
Agustin (2005)
Yang et al. (2008)
Iverson, 2007
Excess Runtime due
to generator
inefficiencies
OR
Runtime equivalent of
fuel consumption and
power conversion
inefficiencies
Due to power-conversion inefficiency
Gen Power Output − Load
Load∗ ∆t
Due to fuel-consumption inefficiency
Energy content of consumed fuel − Load
Load∗ ∆t
Tazvinga et al. (2013)
Kaabeeche & Ibtiouen (2014)
Total Runtime Runtime + Average of Excess Runtime

28
28
Table 2.4. Battery Component Models
Parameter Model Source
SOC (t)
SOC(t − 1) ∗ (1 − σ) +[PG ∗ ∆t −
PL(t) ∗ ∆tηinv
] ∗ ηB ∗ 𝑪𝑹𝒂𝐭𝐞
CapB
: Charge
SOC(t − 1) ∗ (1 − σ) −[PL(t) ∗ ∆t
ηinv]
CapB : Discharge
Kaabeche, Belhamel, Ibtiouen
(2011)
Gonzalez-De-Durana et al.
(2009)
Deshmukh & Deshmukh (2008)
Ashok (2007)
Terminal Voltage Voc − IL(t) ∗ Resistance, where IL(t) = (PL
VDC) ηB
Open-circuit Voltage 43.796(SOC)6 + 150.27(SOC)5 - 203.96(SOC)4 + 139.85(SOC)3 - 51.336(SOC)2
+ 10.17(SOC) + 2.9108
Regression Analysis of Nissan
Leaf Battery-pack performance.
Data of transient characterisics
provided by Ectality under
contract from US.DOE
V. Vermeulen – ANL
Resistance Discharging
0.0694(SOC)6 - 0.3484(SOC)5 + 0.6135(SOC)4 - 0.5054(SOC)3 + 0.2078(SOC)2
- 0.0407(SOC) + 0.0044
Charging
-0.0019(SOC)6 - 0.0323(SOC)5 + 0.0949(SOC)4 - 0.0984(SOC)3 +
0.0469(SOC)2 - 0.0103(SOC) + 0.0021
Energy Change per
time step
1
Δt∗ [SOCmax − SOC(t)] ∗ CapB : ; Charging
[SOC(t) − SOCmin] ∗1
Δt∗ CapB : Discharging
Schuhmacher (1993)
Power flow 𝑃𝐵(𝑡) PL
ηinv − PG,nom⁄
VDC: Charging
PG,nom −PL
ηinv⁄
VDC: Discharging
Yang, Zhou, Lu, & Fang (2007)
29
29
2.10 Summary
It is clear that extensive work has already been done on optimization of hybrid
energy system. Several authors have developed analytical and numerical tools to
accurately model the components of HES and their interaction. Majority of existing
literature report studies that try to improve performance of HES by either optimizing their
component size or the manner in which the power produced by those components are
harvested and controlled. Most HES include intermittent renewable energy sources
whose efficiency depend on local meteorological conditions. Hence the mathematical
models used to describe HES are often complex and comprise a large quantity of
parameters and variables. Similarly, HES operation scheme can be complex and subject
to several constraints, and assumptions. The studies reviewed herein provide adequate
understanding of the challenges associated with modelling HES, as well as insight on
experimental techniques to improve the performance through capacity and operation
scheme optimization.

30
30
CHAPTER 3. METHODOLOGY
This chapter discusses the investigative and experimental approach used in this research.
It also provides a detailed explanation of the parameters, and modeling and simulation
tools, as well as criteria used for data analysis.
3.1 Research Framework
This research is a semi-empirical quantitative study of a battery-generator hybrid
system (B-G HPS). The system’s battery component has similar cell characteristics as
the battery in the Nissan Leaf Hybrid Electric Vehicle (HEV), while the diesel generator
component has similar power output and fuel consumption characteristics as TQG and
AMMPS military generators. The system also includes a bi-directional AC/DC power
inverter with known efficiency. The framework of the research entailed using computer
software to model and simulate various sizes (capacities) of the system’s battery and
generator components. Performance statistics were collected for various load samples,
then compared to a standalone generator’s performance. For each load scenario, a
battery-generator capacity combination that yields the lowest maintenance cost and other
performance metrics is subsequently identified as optimal.
31
31
3.2 Experiment Design
Experiment design for this research followed two key trends observed from
review of HPS optimization literature. The first is that most studies take a similar
approach comprising of the following steps:
(1) Identify and categorize relevant parameters as dependent or independent variables.
(2) Formulate a mathematical expression for individual components of the system.
(3) Define an objective function that describes the dependent variable.
(4) Develop an optimization model using the objective function, design variables,
and applicable constraints
(5) Test and implement the model by applying to a real-world load scenario.
Second, most HPS optimization efforts tried to improve the system by either optimizing
the size of its components, or optimizing its operation and control strategy. Furthermore,
most studies sought minimization of various cost functions such as life-cycle-cost (LCC),
levelized cost of energy (LCE), and net present cost (NPC). This research proceeds in a
similar vein to minimize maintenance cost by varying component sizes and control
strategies.
The experiment design simply entails use of known or assumed values of various
parameters to evaluate analytical models that define characteristics of a power system and
its subcomponents. The resulting data is then used to conduct a comparative analysis of
the performance of stand-alone generators and a BG-HPS against a given load profile.
The experiment design also enables optimization without using conventional algorithm.
Although crude and tedious, approach provides sufficient data to test the hypothesis that

32
32
optimizing a B-G HPS for maintenance cost may yield a more refined estimate of
generator-battery capacity combination than that proposed by the MEHPS program.
3.3 Identification of Parameters
Selection of relevant parameters for an object or system depends on the intended
goal of analysis, as well as the level of detail or abstraction envisioned for an experiment.
For the purposes of this research, parameters are outlined in Table 3.1 and include only
those that describe behavior of system components as electric power source, sink, or
transmission node. The generator is a power source, load is a sink, battery is both source
and sink, and inverter is a transmission node. Parameters that describe these components
include operational features and technical data specifications provided in manufacturer
literature, or scientific theory, or intuition. Among them are independent (design)
variables, constraints, and dependent variables. Battery parameters include only those
that describe its electric-circuit behavior, and exclude cell microstructure or topology (i.e.
electrode and electrolyte properties).
3.4 Objective Function and Simulation Model Design
The objective of this research is to identify optimal parameters of a B-G HPS,
specifically power and energy-storage capacities, which minimizes maintenance cost for
the system’s diesel generator component. Equations 1 to 3 below define maintenance
cost as an objective function that is several parameters.
Generator Maintenance Cost = # 𝑠𝑒𝑟𝑣𝑖𝑐𝑒𝑠 ∗ $/𝑠𝑒𝑟𝑣𝑖𝑐𝑒 (1)
where # 𝑠𝑒𝑟𝑣𝑖𝑐𝑒𝑠 =𝑇𝑜𝑡𝑎𝑙 𝑅𝑢𝑛𝑡𝑖𝑚𝑒
𝑠𝑒𝑟𝑣𝑖𝑐𝑒 𝑖𝑛𝑡𝑒𝑟𝑣𝑎𝑙(2)
and 𝑇𝑜𝑡𝑎𝑙 𝑅𝑢𝑛𝑡𝑖𝑚𝑒 = 𝐻𝑜𝑢𝑟𝑠 𝑜𝑛 + 𝐸𝑥𝑐𝑒𝑠𝑠 𝑟𝑢𝑛𝑡𝑖𝑚𝑒 (3)

33
33
It is apparent from the preceding equations that the objective function is minimized by
minimizing generator runtime. For a stand-alone generator employed as primary power
source, runtime is limited only by periodic shutdown for routine maintenance or by
unanticipated failure. For a hybrid system, generator runtime is minimized by
maximizing battery discharge/autonomy time. This is possible if the system is set for
deep cycle operation, wherein the battery is discharged to its maximum safe limits, and
the generator is used to either charge the battery or provide additional power when
demand exceeds battery capacity. Under this rubric, the following is true:
𝐻𝑜𝑢𝑟𝑠 𝑜𝑛 = 𝐵𝑎𝑡𝑡𝑒𝑟𝑦 𝐶ℎ𝑎𝑟𝑔𝑒 𝑡𝑖𝑚𝑒 (4)
or 𝐻𝑜𝑢𝑟𝑠 𝑜𝑛 = 𝐷𝑢𝑡𝑦 𝐶𝑦𝑐𝑙𝑒 − 𝐵𝑎𝑡𝑡𝑒𝑟𝑦 𝐷𝑖𝑠𝑐ℎ𝑎𝑟𝑔𝑒 𝑡𝑖𝑚𝑒 (5)
Given the multi-variable dependencies of battery operation, as outlined in preceding
chapters, a comprehensive definition of the objective function proceeds as follows:
𝑀𝑎𝑖𝑛𝑡𝑒𝑛𝑎𝑛𝑐𝑒 𝑐𝑜𝑠𝑡 =
𝑓(𝑐𝑜𝑚𝑝𝑜𝑛𝑒𝑛𝑡 𝑐𝑎𝑝𝑎𝑐𝑖𝑡𝑖𝑒𝑠, 𝑏𝑎𝑡𝑡𝑒𝑟𝑦 𝑐ℎ𝑎𝑟𝑔𝑒 𝑎𝑛𝑑 𝑑𝑖𝑠𝑐ℎ𝑎𝑟𝑔𝑒 𝑟𝑎𝑡𝑒, 𝑆𝑂𝐶, 𝑙𝑜𝑎𝑑,
𝑒𝑓𝑓𝑖𝑐𝑖𝑒𝑛𝑐𝑖𝑒𝑠, 𝑠𝑦𝑠𝑡𝑒𝑚 𝑐𝑜𝑛𝑡𝑟𝑜𝑙 𝑠𝑐ℎ𝑒𝑚𝑒) (6)
Equation 6 shows that the objective function actually depends on several parameters that
are also defined as functions of time (Appendix C and Appendix D). With this design, it
is clear that an analytical solution for the objective function would be extremely complex,
if possible. The numerical approach taken in this research is also complex and requires
several computation steps. However, the complexity is resolved by using sample data,
assumptions and intuition informed by the research objectives, to constrain the problem
and make computations more manageable.

34
34
3.5 Sample Set
The sample data used for this research include actual military basecamp load
profiles (Table 3.1), as well as data that describes characteristic features of the generator
and battery that make up the B-G HPS. The seasonal load profiles are those of a midsize
U.S. Marine Corps basecamp in Iraq. Table 3.1 also includes static loads used by
CASCOM to conduct the cost-benefit analysis of the MEHPS program alluded to in
Chapter 2.
Table 3.1 Sample Load Profiles (kW)
Hour Summer Winter Fall/Spring COSFPS-
static
Guard tower
floodlights-static
0 2.5 8.3 0.5 7.5 2
1 3.4 8.9 0.5 7.5 2
2 3.4 8.9 0.5 7.5 2
3 3.4 9.7 0.5 7.5 2
4 4.2 8.9 0.5 7.5 2
5 4.2 8.3 1.0 7.5 2
6 4.2 8.3 1.0 7.5 2
7 4.2 7.8 1.0 7.5 2
8 4.6 6.7 1.0 7.5 2
9 5.0 5.8 1.0 7.5 2
10 5.0 5.8 2.0 7.5 2
11 5.8 5.0 2.0 7.5 2
12 5.8 4.2 2.0 7.5 2
13 6.6 4.2 3.0 7.5
14 6.6 3.7 3.5 7.5
15 7.8 3.7 3.0 7.5
16 6.6 4.2 2.0 7.5
17 6.6 4.2 2.0 7.5
18 5.8 5.0 2.0 7.5
19 5.0 5.0 2.0 7.5
20 5.0 5.0 1.0 7.5
21 5.0 5.8 1.0 7.5
22 4.2 5.8 1.0 7.5
23 3.3 6.8 1.0 7.5

35
35
Table 3.2 Nissan Leaf Battery Cell Characteristics (Vermeulen, 2013)
Chemistry
EODV
Graphite-LiMn1/3Ni1/3Co1/3+LiMn2O4)
3.5
EOCV 4.2
Nominal Voltage 3.75
Current Capacity (Ah) 1.5
Nominal Energy Capacity (kWh) 0.005625
Table 3.3 Diesel Generator Fuel Consumption Rates (USMC, 2015)
Load
Factor
(%)
Fuel Consumption rate (gal/h) at rated load factor
3kW
TQG
5kW
AMMPS
10kW
AMMPS
15kW
AMMPS
0 0.14 0.16 0.23 0.28
25 0.18 0.24 0.37 0.46
50 0.22 0.34 0.50 0.70
75 0.28 0.42 0.67 0.97
100 0.34 0.48 0.86 1.21
3.6 Criteria for Optimization
Selection of optimal component capacity in this research was based on comparison
of maintenance cost between a stand-alone generator and for the B-G HPS, as well as
other factors. As outlined above, the cost is a function of generator runtime, which, for
the hybrid system, depends on battery charge and discharge time. Other factors such as
fuel consumption and number of battery charge/discharge cycles were also considered.
The non-linear relationship between the system capacity and the performance metrics
imply that optimization required tradeoffs between all design variables; thus the study
included sensitivity analysis. Adjustments of various design variables have different
degrees of impact on the objective function. Moreover, while the employment of a

36
36
battery as primary power source prevents continuous generator operation under non-ideal
load conditions, it is likely that the generator’s start-and-stop function is just as
mechanically stressful to its engine as adjusting to load variability. Therefore, the goal of
minimizing generator runtime had to beaccompanied by the goal of minimizing duty
cycles, i.e. the start and stop frequency. The benefit of hybridization would be
maximized by if the system spends more time discharging and doing useful work than
this charging. That is, the system capacity must be such that total hours of battery
discharge (silent operation capability) are at least twice the total charge time. Also, DG
efficiency influenced optimization since it is directly related to the issue of engine
vulnerability to non-ideal loads, which underpins motivation of this research.
3.7 Summary
This research is a quantitative study that employs within-subjects experimental
design methodology, which allows for measurement and comparison of same subjects
(dependent variables) from repeated treatments. With the aid of the AnyLogic computer
software, the experiment models and simulates scenarios in which four different sets of
B-G HPS provide electric power to a military base camp for a one year period. For each
B-G HPS set, the experiment is repeated multiple times while changing operating
conditions (independent variables). Analysis compares the measurements between the
BG-HPS sets and generator-only baseline. Results of the comparison would lead to
determination of a battery capacity at which optimal value of the measured dependent
variable occurs.

37
37
CHAPTER 4. PRESENTATION OF DATA
This chapter presents data input and outputs from the simulations. One of the primary
goals of this research is to paint a picture of the difference that energy storage can make
to the performance of a generator operating in non-ideal load conditions. The preceding
chapters established that a battery reduces fuel consumption and overall efficiency.
Simulation and optimization results presented in this chapter show the extent of that
reduction, as well as reduction in generator runtime and maintenance cost. Standalone
generators and B-G HPS of various capacity combinations are simulated for various
basecamp load over a 90-day contingency operation.
4.1 Input Parameters
Tables 4.1 and 4.2 list values (obtained from literature or otherwise assumed in
accordance with research objectives) for all system parameters. These values also
establish constraints to certain parameters that are design (independent) variables—
generator capacity, load profile, and charge rate. Table 4.2 shows that each generator is
restricted to load profiles whose peak is less than the generator’s maximum capacity. For
example, peak of the Fall/Spring load is 3.5kW. All military generators are nominally
rated at 80% load factor, so that the maximum capacity of a 3kW-rated generator is
actually 3.75kW. Therefore, the fall/spring load can be serviced by all four generators.

38
38
However, this is not the case for the summer and winter loads, whose peaks are 7.8kW
and 9.7kW respectfully, and can only be serviced the 10kW and 15kW generators.
Table 4.2 also establishes lower and upper bound for battery capacity;
nevertheless, simulation will also test battery capacities that are outside of these bounds
to get a more comprehensive picture of the design space. Battery capacity to the left and
right of those bounds may yield lower maintenance cost, greater fuel consumption
savings, or less reduction in battery lifecycle. Furthermore, reference to “passive control”
in Table 3.4 implies that the system is tied to and controlled autonomously by SOC.
When the battery is depleted (SOC = 10%), or is insufficient to service load, the
generator automatically turns on, and services load while simultaneously charging battery.
Active control, which may be applied to a different optimization scenario, simply applies
additional constraints to passive control by the commanding battery discharge according
to specified schedule. Two categories of active control may be applied:
a. Tactical active control: additional discharge to ensure silent operations based
tactical needs (noise and heat signature reduction required for force-protection or
anti-surveillance posture)
b. Economic active control: additional discharge requirement to maximize fuel
savings (ex: discharge during extended low-average demand, or when generator
load factor is less than 50%.
In either passive or active control mode, system charges battery to maximum SOC (90%)
before allowing the next duty cycle. Additional constraints could be applied to the
objective function. Charging for the hybrid system could be constrained to a specific C-
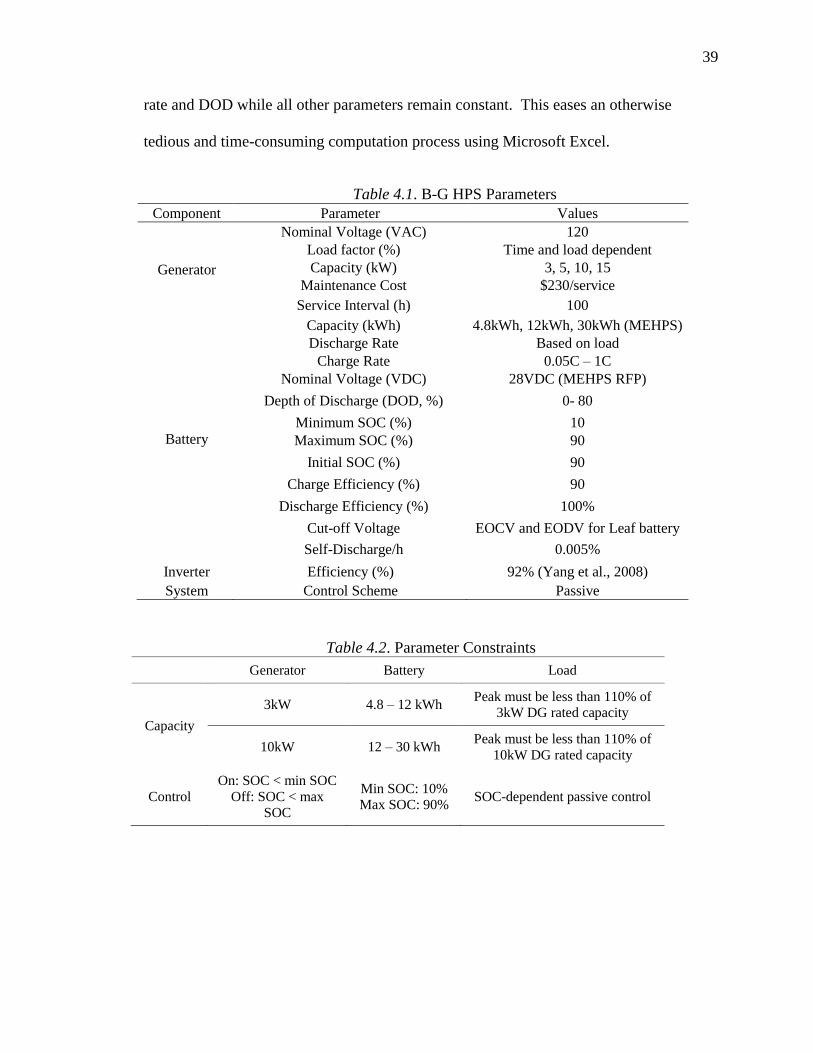
39
39
rate and DOD while all other parameters remain constant. This eases an otherwise
tedious and time-consuming computation process using Microsoft Excel.
Table 4.1. B-G HPS Parameters
Component Parameter Values
Generator
Nominal Voltage (VAC) 120
Load factor (%) Time and load dependent
Capacity (kW) 3, 5, 10, 15
Maintenance Cost $230/service
Service Interval (h) 100
Battery
Capacity (kWh) 4.8kWh, 12kWh, 30kWh (MEHPS)
Discharge Rate Based on load
Charge Rate 0.05C – 1C
Nominal Voltage (VDC) 28VDC (MEHPS RFP)
Depth of Discharge (DOD, %) 0- 80
Minimum SOC (%) 10
Maximum SOC (%) 90
Initial SOC (%) 90
Charge Efficiency (%) 90
Discharge Efficiency (%) 100%
Cut-off Voltage EOCV and EODV for Leaf battery
Self-Discharge/h 0.005%
Inverter Efficiency (%) 92% (Yang et al., 2008)
System Control Scheme Passive
Table 4.2. Parameter Constraints
Generator Battery Load
Capacity
3kW 4.8 – 12 kWh Peak must be less than 110% of
3kW DG rated capacity
10kW 12 – 30 kWh Peak must be less than 110% of
10kW DG rated capacity
Control
On: SOC < min SOC
Off: SOC < max
SOC
Min SOC: 10%
Max SOC: 90% SOC-dependent passive control
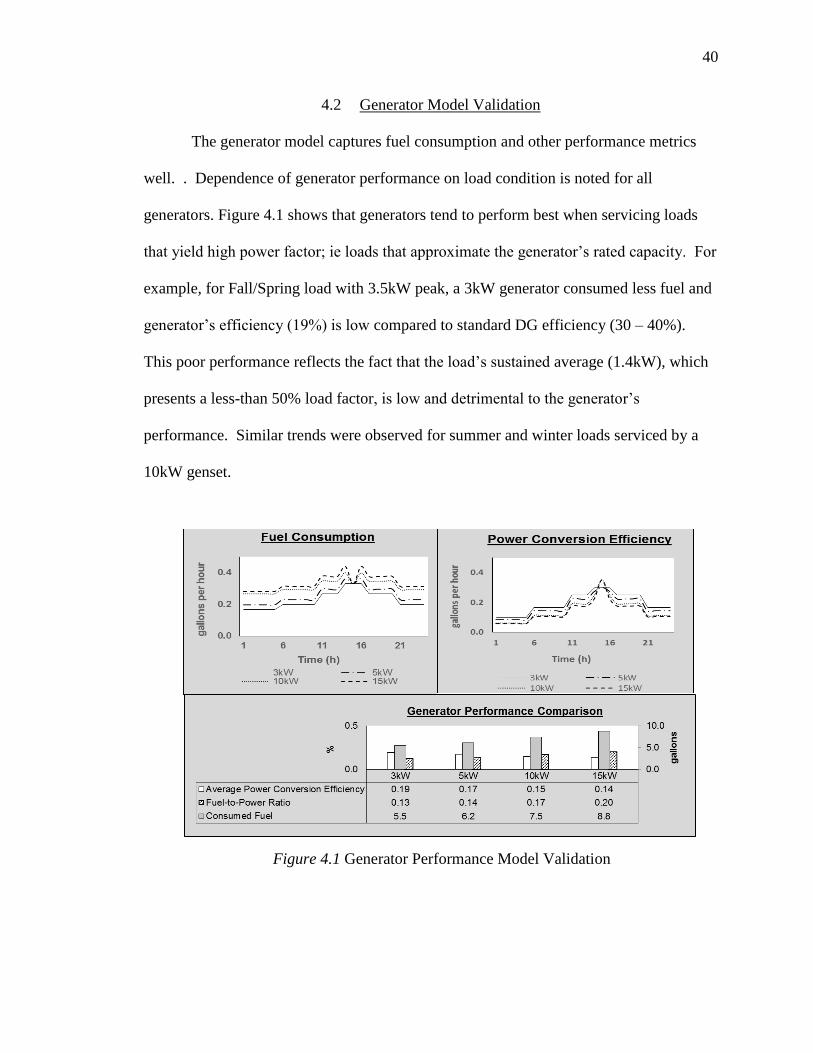
40
40
4.2 Generator Model Validation
The generator model captures fuel consumption and other performance metrics
well. . Dependence of generator performance on load condition is noted for all
generators. Figure 4.1 shows that generators tend to perform best when servicing loads
that yield high power factor; ie loads that approximate the generator’s rated capacity. For
example, for Fall/Spring load with 3.5kW peak, a 3kW generator consumed less fuel and
generator’s efficiency (19%) is low compared to standard DG efficiency (30 – 40%).
This poor performance reflects the fact that the load’s sustained average (1.4kW), which
presents a less-than 50% load factor, is low and detrimental to the generator’s
performance. Similar trends were observed for summer and winter loads serviced by a
10kW genset.
Figure 4.1 Generator Performance Model Validation
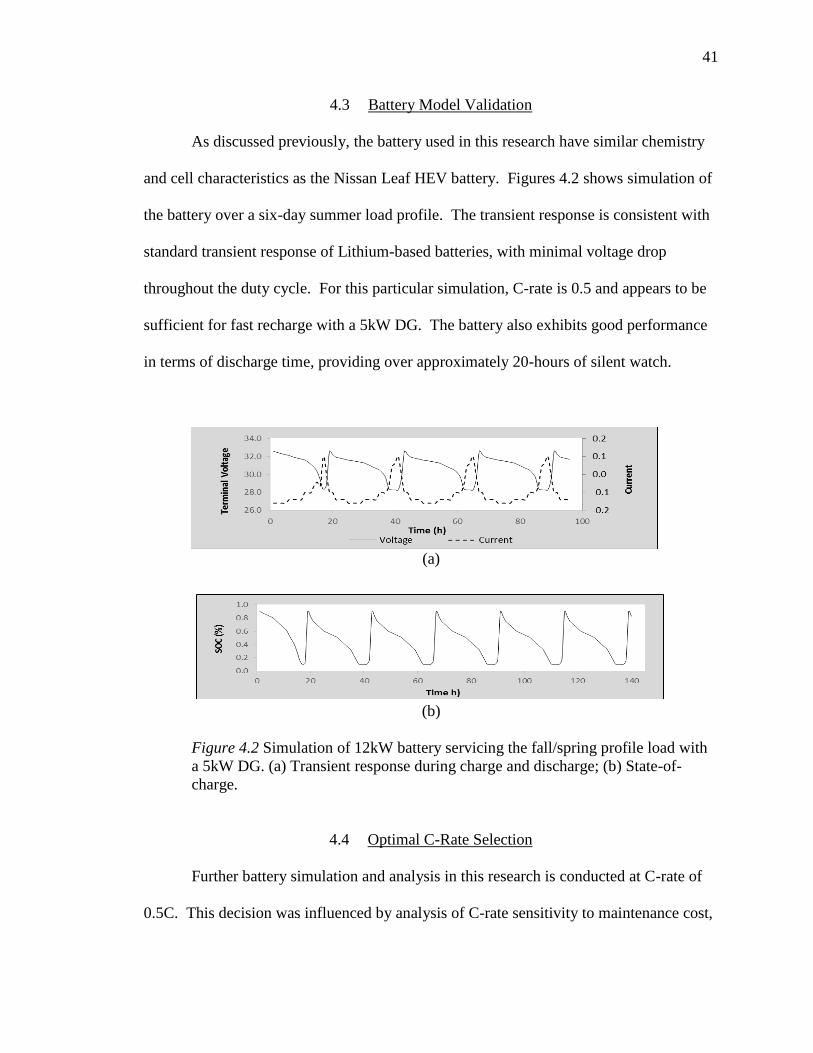
41
41
4.3 Battery Model Validation
As discussed previously, the battery used in this research have similar chemistry
and cell characteristics as the Nissan Leaf HEV battery. Figures 4.2 shows simulation of
the battery over a six-day summer load profile. The transient response is consistent with
standard transient response of Lithium-based batteries, with minimal voltage drop
throughout the duty cycle. For this particular simulation, C-rate is 0.5 and appears to be
sufficient for fast recharge with a 5kW DG. The battery also exhibits good performance
in terms of discharge time, providing over approximately 20-hours of silent watch.
Figure 4.2 Simulation of 12kW battery servicing the fall/spring profile load with
a 5kW DG. (a) Transient response during charge and discharge; (b) State-of-
charge.
4.4 Optimal C-Rate Selection
Further battery simulation and analysis in this research is conducted at C-rate of
0.5C. This decision was influenced by analysis of C-rate sensitivity to maintenance cost,
(b)
(a)
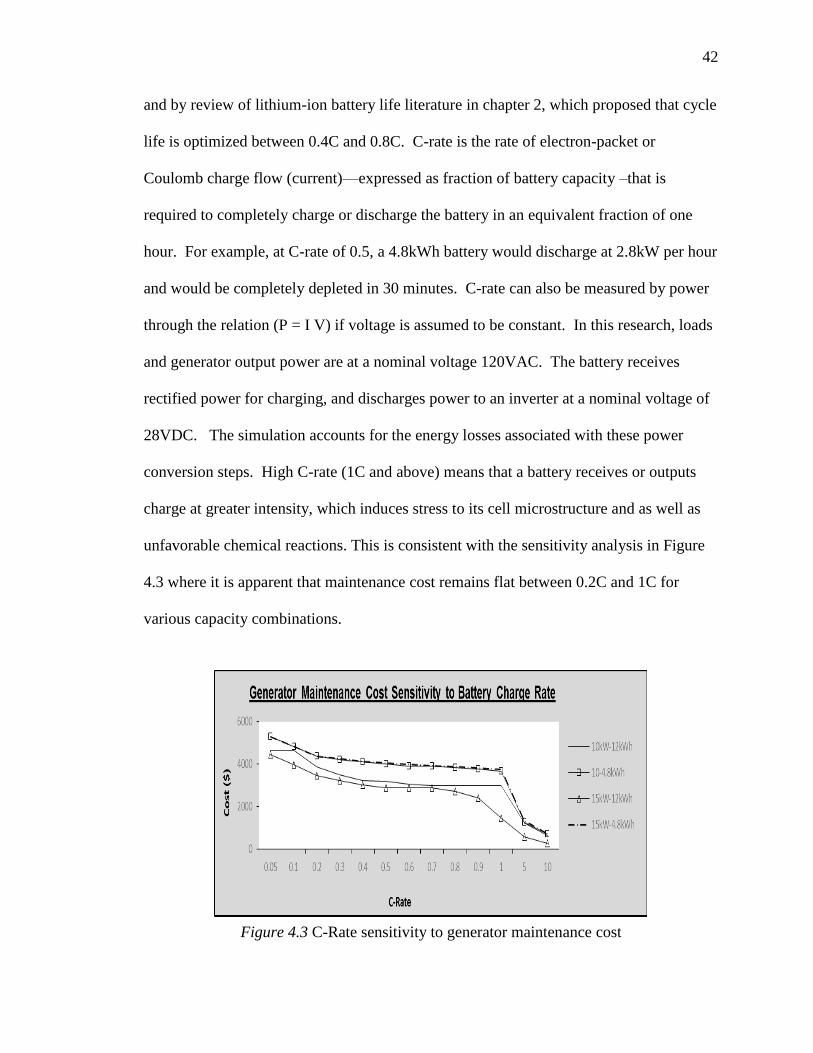
42
42
and by review of lithium-ion battery life literature in chapter 2, which proposed that cycle
life is optimized between 0.4C and 0.8C. C-rate is the rate of electron-packet or
Coulomb charge flow (current)—expressed as fraction of battery capacity –that is
required to completely charge or discharge the battery in an equivalent fraction of one
hour. For example, at C-rate of 0.5, a 4.8kWh battery would discharge at 2.8kW per hour
and would be completely depleted in 30 minutes. C-rate can also be measured by power
through the relation (P = I V) if voltage is assumed to be constant. In this research, loads
and generator output power are at a nominal voltage 120VAC. The battery receives
rectified power for charging, and discharges power to an inverter at a nominal voltage of
28VDC. The simulation accounts for the energy losses associated with these power
conversion steps. High C-rate (1C and above) means that a battery receives or outputs
charge at greater intensity, which induces stress to its cell microstructure and as well as
unfavorable chemical reactions. This is consistent with the sensitivity analysis in Figure
4.3 where it is apparent that maintenance cost remains flat between 0.2C and 1C for
various capacity combinations.
Figure 4.3 C-Rate sensitivity to generator maintenance cost
43
43
Battery life literature also established that C-rate is directly proportional to
capacity fade. This is evident in Figure 4.3, wherein duty cycles (reduction in battery
cycle life) increases with C-rate. It is also evident that C-rate is directly proportional to
discharge time, and inversely proportional to charge time, so that the battery charges
faster at high C-rate, and vice versa. This is intuitive and analogous to a water tank—the
faster the flow in and out of the tank, the faster the tank will fill up and drain out. This
will remain true if inflow and outflow water pressure is constant over time, and if inflow
and outflow do not occur simultaneously. Under dynamic pressure, however, time
required to fill or drain the tank will change in accordance with the magnitude of pressure
change. This is another way of stating that charge and discharge are dependent on load.
4.5 Hybrid System Validation
Figure 4.4 shows simulation of a 10kW-12kWh B-G HPS employed for the
summer load. Results show that the system, under passive control, tracks and responds to
battery SOC. SOC never exceeds the minimum and maximum threshold of 10% and 90%
respectively, although these thresholds are not reached during some parts of duty cycle.
This non-uniformity represents inefficiency due to transient loads. The system’s power
output is also consistent with expected behavior. The battery’s output (green line) closely
tracks load (red line), and when the generator is on, it outputs enough power to sustain
the load and charge the battery. Although the generator output (black line) exceeds
demand, a significant proportion of the excess power is used to charge the battery. This
guarantees that they generator runs at high load factor, which improves its power

44
44
conversion efficiency and fuel consumption. These trends are consistent for all loads and
battery-generator capacity combinations, with slight magnitude variations across C-rate
range of 0.05-1C (see Appendix C).
4.6 Analysis for Fall/Spring Load
4.6.1 Stand-alone Generators
The Fall/Spring daily load (Figures 4.5a) is characterized by a 3.5kW peak, and
1.5kW average, and seven transitions (four increases and three decreases). Demand is
below average during 14 hours of the day, and load factor for the 3kW generator (the
smallest of all four tested generators) is below 40% for 14hours. The load is
characteristic of non-ideal conditions that are detrimental to efficient and healthy DG
Figure 4.4 Simulation of 10kW-12kWh B-G HPS (top chart – battery
voltage response, middle chart – SOC, bottom chart – power output).

45
45
operation. Figure 4.4b and c show standalone DG performance on the fall/spring load.
It is obvious that the 3kW performs best on all metrics. Employing a higher capacity
generator would be wasteful; however the 3kW generator leaves no room for flexibility.
Figure 4.5a. Standalone DG performance metrics on fall/spring load. (a) Load profile; (b)
comparison of runtime, fuel consumption, and maintenance cost; (c) efficiency
comparison
(b)
(a)
(c)

46
46
4.6.2 Hybrid System
The preceding results should be different for a hybrid system. As the research
proposed, a battery should enable significant reduction generator runtime, and
consequently maintenance cost. However, the extent to which a certain battery and DG
capacity would reduce cost is not intuitive. To that end, this research presents result of
B-G HPS capacity optimization in the context of design-space analysis. As presented,
the analysis visualizes degree flexibility for optimizing a specific B-G HPS performance
metric. The space boundaries incorporate constraints established by MEHPS
requirements. A raw measurement of each metric is presented, as well as the percentage
difference from the measurement taken for a standalone generator. Figure 4.6a-h show
design space in which various performance metrics are optimized for the fall/spring load
profile, at C-rate of 0.5. It is clear that an optimum occurs at different capacity
combinations for each metric.
For maintenance cost, Figure 4.6a and 4.6b show that it is possible to achieve
significant improvement from generator-only performance throughout a range of battery
and generator capacities. High percentage cost reduction is achieved in the upper bound
of the design space; however, improvement at those capacities will come with a penalty
on other performance metrics. Given the weight and volume concerns outlined in chapter
2, it would be unwise to pursue such maintenance cost reduction of over 80%, since that
would translate to significant increase in battery size. Furthermore, Figures 4.6c and 4.6d
show that the region of design space which yields high percentage reduction in
maintenance cost also yield the least reduction in fuel consumption. Figure 4.6c also
show that for the fuel system capacity limits simulated, there is at least 300 gallons of

47
47
fuel consumed, which still represents at least 20% reduction from standalone generator
fuel consumption.
Figure 4.6e show that maximum efficiency of 40% can be achieved over a wide
range of both generator and battery capacities. However, flexibility for optimizing
efficiency decreases near the lower bound of the space. Minimum duty cycle is desired
because it represents the lowest reduction to battery lifecycle. Figure 4.6g shows that
only the upper bound of battery capacity can minimize duty cycle for all generator
capacities. That region also achieves the maximum discharge time-to-charge time ratio
(D-C time ratio), which must be greater than 2 (Figure 4.6h). The D-C ratio requirement
eliminates one-third of the design space (battery capacity less than 4.8kWh) from
consideration. However, if all other considerations compel selection of battery capacity in
this range, D-C ratio can be improved by increasing C-rate to decrease charge time.

48
48
Figure 4.6: B-G HPS Design Space For Fall/Spring Load
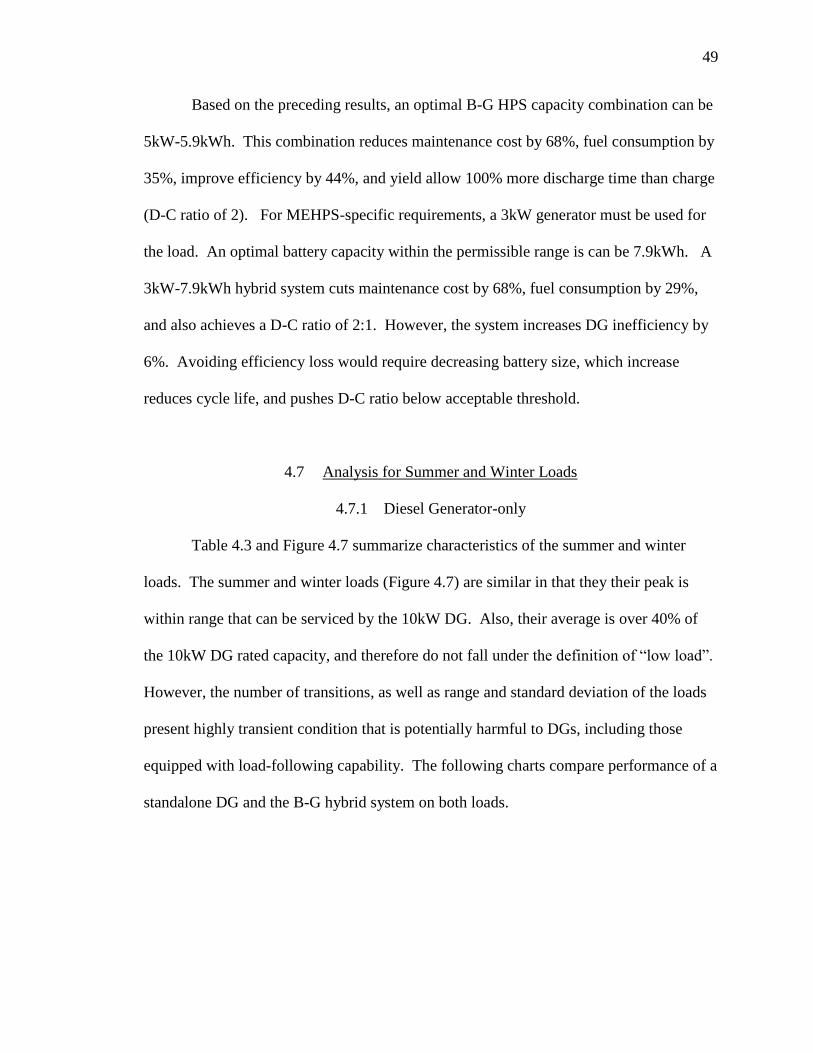
49
49
Based on the preceding results, an optimal B-G HPS capacity combination can be
5kW-5.9kWh. This combination reduces maintenance cost by 68%, fuel consumption by
35%, improve efficiency by 44%, and yield allow 100% more discharge time than charge
(D-C ratio of 2). For MEHPS-specific requirements, a 3kW generator must be used for
the load. An optimal battery capacity within the permissible range is can be 7.9kWh. A
3kW-7.9kWh hybrid system cuts maintenance cost by 68%, fuel consumption by 29%,
and also achieves a D-C ratio of 2:1. However, the system increases DG inefficiency by
6%. Avoiding efficiency loss would require decreasing battery size, which increase
reduces cycle life, and pushes D-C ratio below acceptable threshold.
4.7 Analysis for Summer and Winter Loads
4.7.1 Diesel Generator-only
Table 4.3 and Figure 4.7 summarize characteristics of the summer and winter
loads. The summer and winter loads (Figure 4.7) are similar in that they their peak is
within range that can be serviced by the 10kW DG. Also, their average is over 40% of
the 10kW DG rated capacity, and therefore do not fall under the definition of “low load”.
However, the number of transitions, as well as range and standard deviation of the loads
present highly transient condition that is potentially harmful to DGs, including those
equipped with load-following capability. The following charts compare performance of a
standalone DG and the B-G hybrid system on both loads.

50
50
Table 4.3 Summer and winter load characteristics (USMC, 2015)
Summer Winter
Peak 9.7 7.8
Average 6.3 4.9
Range 6.0 5.3
Standard Deviation 1.9 1.3
Number of transitions 14 12
Figure 4.8a-d show performance of 10kW and 15kW standalone DGs on the
summer and winter loads. For the winter load, the 15kW DG performs better—it
consumes less fuel, has less total runtime (which implies less inefficiency losses), and
lower maintenance cost; yet the 10kW DG has a higher energy-conversion efficiency.
The same trend is observed for the summer load, and implies that optimization between
the two generators will require nuanced analysis.
Figure 4.7 Summer and winter load profile
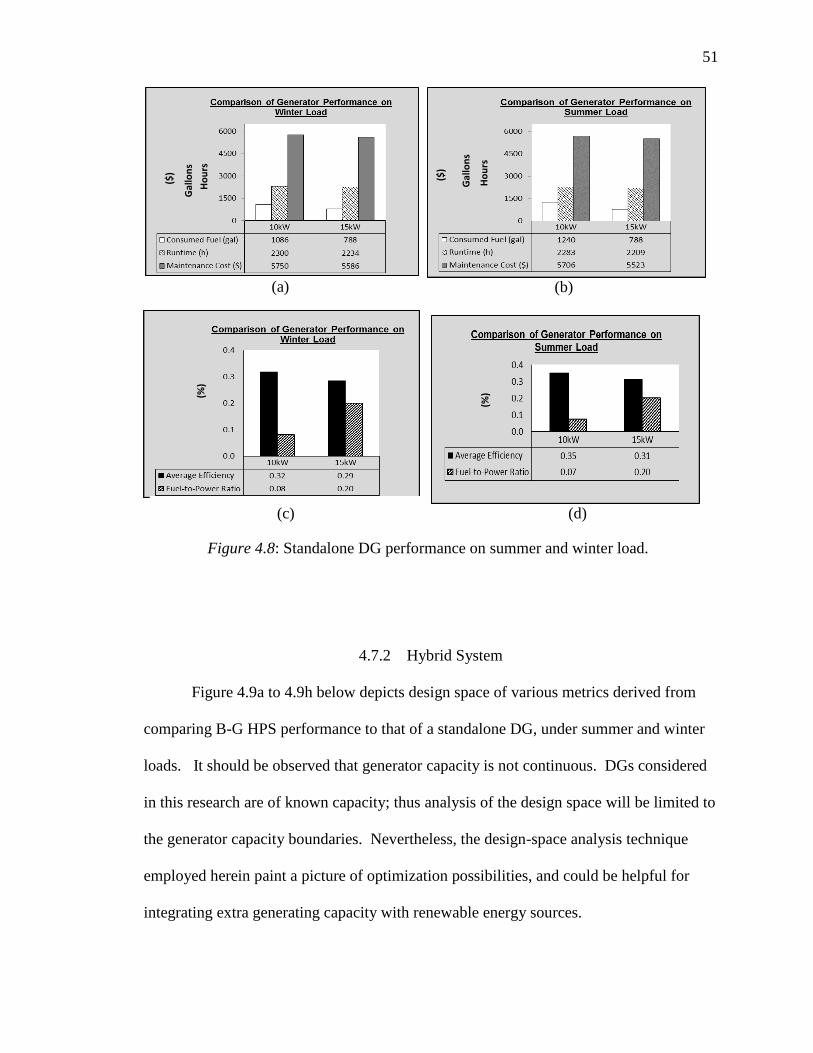
51
51
4.7.2 Hybrid System
Figure 4.9a to 4.9h below depicts design space of various metrics derived from
comparing B-G HPS performance to that of a standalone DG, under summer and winter
loads. It should be observed that generator capacity is not continuous. DGs considered
in this research are of known capacity; thus analysis of the design space will be limited to
the generator capacity boundaries. Nevertheless, the design-space analysis technique
employed herein paint a picture of optimization possibilities, and could be helpful for
integrating extra generating capacity with renewable energy sources.
(a) (b)
(c) (d)
Figure 4.8: Standalone DG performance on summer and winter load.
Ho
urs
($)
Gal
lon
s
(%) (%
) G
allo
ns
Ho
urs
($)

52
52
In Figure 4.9a and 4.9b, an inverse linear relationship between maintenance-cost
reduction and battery capacity are observed in both load scenarios. Increasing battery
capacity reduces maintenance cost by up to 80% at both generator boundaries. Also
reduction in fuel consumption (Figure 4.9c and 4.9d) can reach up to 20% in the low end
of battery for the 10kW generator under both load scenarios. There is negative fuel
consumption reduction throughout the 15kW generator boundary under winter load. This
means that more fuel is consumed by a B-G system comprised of 15kW and any battery
size between 2.5kWh and 30kWh. For analysis in which fuel consumption is an
optimization or decision criteria, the 15kW generator would be disqualified. There is,
however, slightly more flexibility for using fuel consumption as capacity optimization
criteria under the summer load. Both generators can achieve at least 10% fuel reduction
when combined with battery capacity between 4.8kWh and 12kWh.
Furthermore, up to 40% improvement in DG power conversion efficiency is
possible in the winter, but this can only be achieved with the 15kW generator and a
limited battery capacity range. There is more flexibility in the summer load, where both
generators can achieve and up to 50% efficiency improvement within a wider battery
capacity range. Nevertheless, the upper bound of battery capacity for both loads appears
to result in efficiency loss when combined with the 10kW generator. This is because at a
fixed C-rate, a larger battery takes more time to charge; so the generator would run longer
and consume more aggregate fuel than a standalone generator. Unfortunately, neither
load allows for acceptable discharge-charge ratio within battery capacity range of
2.5kWh to 12kWh. For the 10kW and 15kW DGs, battery size must be greater than
12kWh for the hybrid system to spend more time doing useful work.

53
53
(a) Maintenance cost for winter load (b) Maintenance cost for summer load
(c) Fuel consumption for winter
(f) Genset efficiency for summer (e) Genset efficiency for winter
(h) D-C time ratio for summer (g) D-C time ratio for winter
(d) Fuel consumption for summer
Figure 4.9 Design space for various performance
metrics for summer and winter load profiles
% %
%
% %
% %
%

54
54
4.8 Analysis for MEHPS Capacity Requirements
The design spaces analyzed above include a range of system capacities defined by
the MEPHS program (Table 4.2). While it is apparent that significant performance
enhancements (relative to a standalone DG) are achievable within capacity the capacity
range, this research sought to refine the capacity estimate by finding an optimum within
that range . Thus B-G HPS with “MEHPS-Low” and “MEPS-Medium” capacity
boundaries were simulated respectively with the fall/spring and summer loads. Fixed
parameters from preceding simulations were used: 0.5 C-rate, 10% min SOC, and 90%
max SOC. Simulation results (Figures 4.10a to 4.10d) show normal cycle behavior.
SOC remains within limits throughout duty cycle, and generator and battery power output
satisfy demand.
Figure 4.10a Simulation of “MEHPS-Low” lower boundary
(3kW-4.8kWh) with fall/spring load.

55
55
Figure 4.10b Simulation of “MEHPS-Low” upper boundary
(3kW-12kWh) with fall/spring load.
Figure 4.10c Simulation of “MEHPS-Medium lower boundary
(10kW-12kWh) with summer load
Figure 4.10d Simulation of “MEHPS-Medium” upper boundary
( 10kW-30kWh) with summer load
56
56
Performance metrics for MEHPS-Low (Figures 4.11) show that there is a +12%
maintenance cost gap between the lower and upper bound of battery capacity. This
signifies improvement relative to maintenance cost of a 3kW standalone DG. However,
given that the battery capacity range (7.2kWh) is 50% of the minimum, the 12%
maintenance cost margin may not satisfy decision or optimization criteria. Furthermore,
the upper battery bound achieves lower fuel consumption improvement and no
improvement in power conversion efficiency. Nonetheless, the bigger battery increases
discharge-to-charge time ratio by almost 50%. Optimization within the MEHPS-Low
capacity range requires tradeoff between minimal change in fuel consumption and
maintenance cost, moderate generator efficiency change, and significant change to
battery cycle life
.As noted in Chapter 3, the optimization criterion for this research is that D-C
time ratio must be greater than two—a B-G HPS capacity must enable twice as much
discharge time as charging. The criterion is satisfied for in the upper bound of MEHPS-
Low battery capacity, starting precisely from 7.9kWh. This optimal battery capacity
(3kW-7.9kWh) , relative to a 3kW standalone DG, yields a 68% and 21% reduction in
maintenance cost and fuel consumption, respectively. However, the optimized system
leads to 6% loss of energy conversion efficiency, which is significant, given that the
standalone DG efficiency (19%) is already low. Nevertheless, the efficiency loss is
compensated by a lower reduction to battery cycle life. Compared to a 4.8kWh battery,
which enables 24% power conversion efficiency, the 7.9kWh battery would cycle 28%
less often and would last longer.

57
57
Performance metrics for MEHPS-Medium (Figure 4.12 ) also show maintenance
cost reduction between within the battery capacity range. Fuel consumption reduction is
evident only toward the lower boundary. Power conversion efficiency decreases on both
boundaries. These results are slightly different from MEHPS-Low results, but similar
conclusion is evident: optimization within the battery capacity range will require tradeoff
between moderate maintenance cost reduction, fuel consumption increase, and worsening
conversion efficiency. Another obvious conclusion is that the D-C time optimization
criterion is not satisfied within this battery capacity range. To obtain a D-C ratio of 2,
battery size must be at least 39.4kWh, which allows for 15% duty cycle reduction (i.e.
battery life extension) from the MEHPS-Medium upper battery capacity limit. However,
the 39.4kWh battery would exacerbate DG efficiency loss by efficiency loss by 32% .
This is significant and challenges prudence of the D-C ratio criterion.
Given the motivations for this research—the need to minimize impact of non-
ideal load conditions on DG health, efficiency loss should be minimized or avoided
completely. This consideration compels changing the D-C ratio criterion to a point that
leads to zero efficiency loss. Such a point would be optimal, but does not exist within the
(a) D-C Ratio: 1.4 (b)
D-C Ratio: 2.7
Figure 4.11 Change in performance of “MEHPS-Low” capacity B-G
HPS, relative to standalone DGs, simulated with summer load.
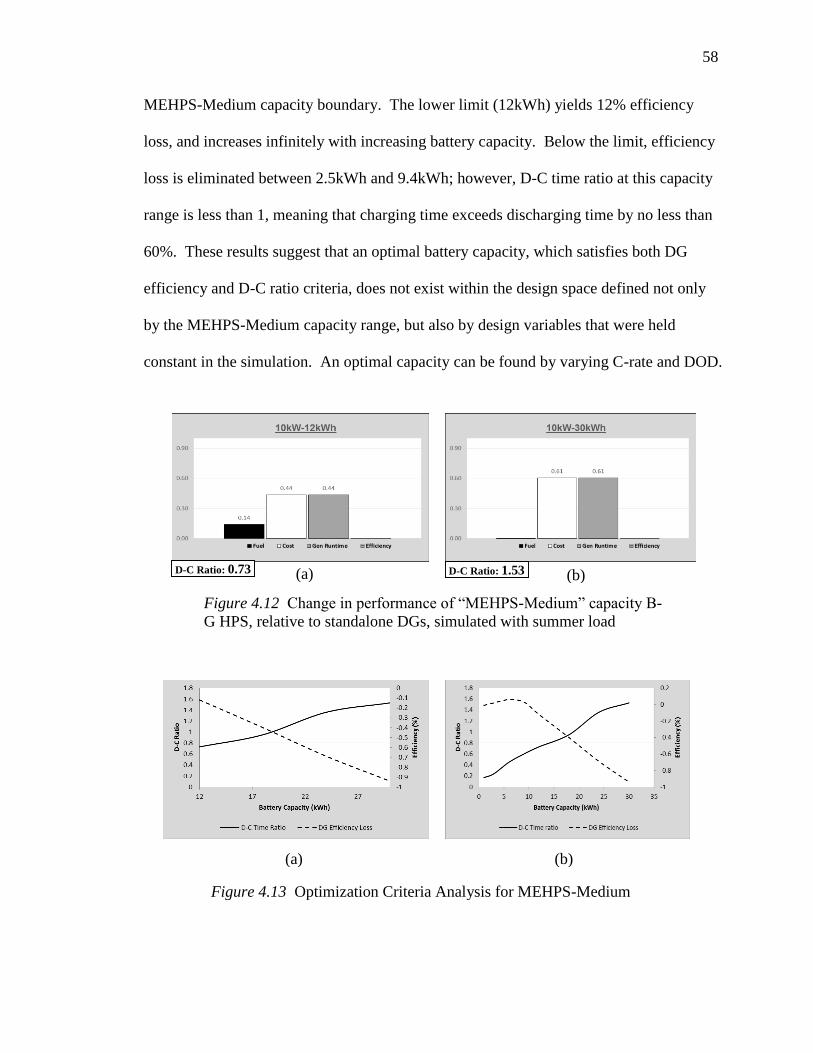
58
58
MEHPS-Medium capacity boundary. The lower limit (12kWh) yields 12% efficiency
loss, and increases infinitely with increasing battery capacity. Below the limit, efficiency
loss is eliminated between 2.5kWh and 9.4kWh; however, D-C time ratio at this capacity
range is less than 1, meaning that charging time exceeds discharging time by no less than
60%. These results suggest that an optimal battery capacity, which satisfies both DG
efficiency and D-C ratio criteria, does not exist within the design space defined not only
by the MEHPS-Medium capacity range, but also by design variables that were held
constant in the simulation. An optimal capacity can be found by varying C-rate and DOD.
(b) (a) D-C Ratio: 0.73 D-C Ratio: 1.53
Figure 4.12 Change in performance of “MEHPS-Medium” capacity B-
G HPS, relative to standalone DGs, simulated with summer load
(a) (b)
Figure 4.13 Optimization Criteria Analysis for MEHPS-Medium

59
59
Analysis for CASCOM Systems
As noted in Chapter 2, cost-benefit analysis (C-BA) of the MEHPS program
conducted by CASCOM concluded that the life-cycle cost, as well as operation and
maintenance (O&M) cost of battery-generator hybrid power systems, relative to other on-
going TEP programs, do not justify further R&D investments. The study focused on
specific employment scenarios in which hybrid power systems are dedicated to
independent static loads such as that of basecamp perimeter-defense systems (CASCOM,
2014, p. 8). These scenarios (Table 4.4) simulate extended system operation under
relatively high load factors—67% and 75% respectively—but do not capture nor enable
visualization of the attenuating effects of energy storage for operation under less ideal
load conditions. While the analysis highlights the cost and technical limitations of hybrid
systems, it also reinforced the understanding that solutions to contingency basecamp
energy problems inherently require tradeoffs, and should be comprehensive. This
research presents results of simulation and optimization for the CASCOM hybrid systems
employed against the dynamic fall/spring load profile. The results highlight need for
tradeoffs and nuance.
Simulation of CASCOM systems also assumed 100-hour service intervals, and
per-service cost of $250. Table 4.5 compares performance of the Storage-Only Low
system to performance of a standalone 3kW DG, while Table 4.6 compares results for the
Storage-Only Medium system with a 10kW standalone DG. At a maximum discharge
rate of 1C, the hybrid systems yield moderate to significant reduction in generator
runtime, fuel consumption, and maintenance cost over a 90-day mission cycle. Analysis
in this research also shows that capacity of both CASCOM systems could be further
(a)
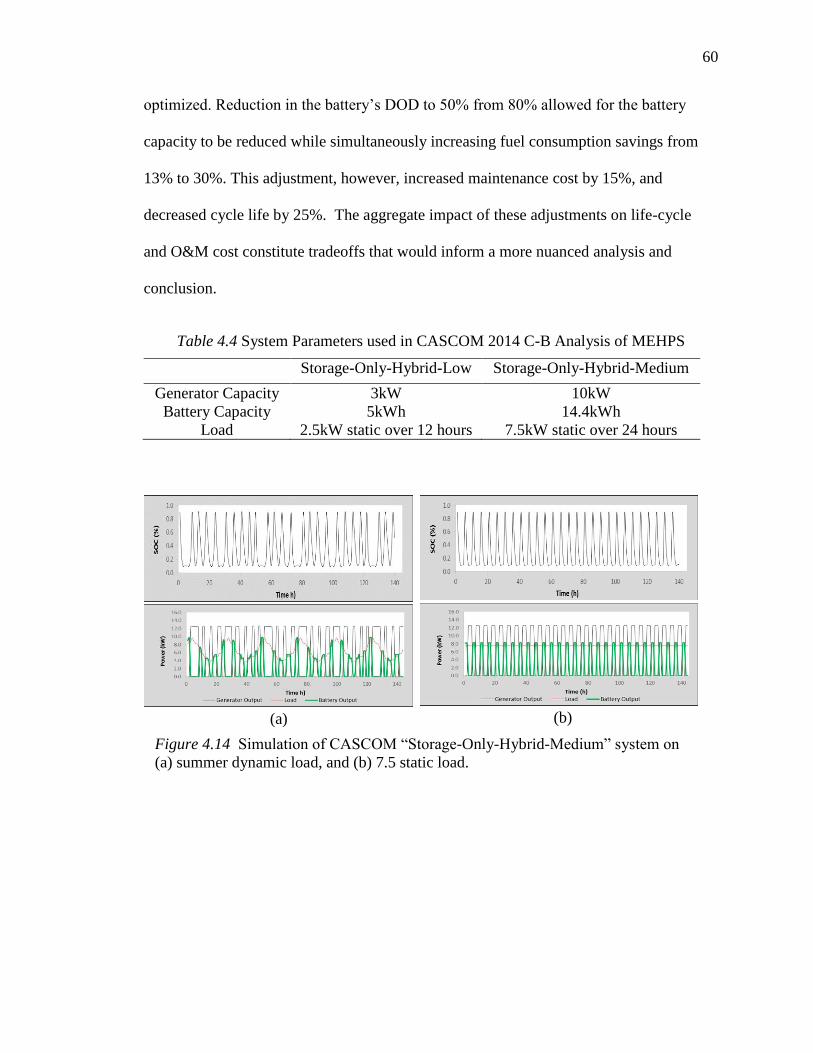
60
60
optimized. Reduction in the battery’s DOD to 50% from 80% allowed for the battery
capacity to be reduced while simultaneously increasing fuel consumption savings from
13% to 30%. This adjustment, however, increased maintenance cost by 15%, and
decreased cycle life by 25%. The aggregate impact of these adjustments on life-cycle
and O&M cost constitute tradeoffs that would inform a more nuanced analysis and
conclusion.
Table 4.4 System Parameters used in CASCOM 2014 C-B Analysis of MEHPS
Storage-Only-Hybrid-Low Storage-Only-Hybrid-Medium
Generator Capacity 3kW 10kW
Battery Capacity 5kWh 14.4kWh
Load 2.5kW static over 12 hours 7.5kW static over 24 hours
(b) (a)
Figure 4.14 Simulation of CASCOM “Storage-Only-Hybrid-Medium” system on
(a) summer dynamic load, and (b) 7.5 static load.

61
61
Table 4.5 Comparison of Standalone DG and Hybrid System Performance on Dynamic and Static Load
10kW-Only
on static load
10kW-Only on
dynamic load
10kW-14.4kWh-Hybrid
on static load
10kW-14.4kWh-Hybrid
on dynamic load
Generator Runtime (h) 2272 2283 1321 1111 Fuel (gallons) 1386 1240 1388 1122
#services 23 23 13 11 Maintenance Cost ($) 5679 5706 3303 2777
Efficiency 0.39 0.35 0.31 0.32 Duty Cycles NA NA 420 435
Discharge Time (h) NA NA 58 72 Charge Time (h) NA NA 86 72
Table 4.6 Effect of Load Type and Hybridization on System Performance
% Change for
10kW-Only due
to change in
load type
% change between
hybrid system and
standalone DG on
static load
% change between
hybrid system and
standalone DG on
dynamic load
Difference due to
dynamic load
Generator Runtime (h) 0 -0.72 -1.05 -0.33 Fuel (gallons) -0.12 0 -0.11 -0.11
#services 0 -0.43 -0.52 -0.09 Maintenance Cost ($) 0 -0.72 -1.05 -0.33
Efficiency -0.11 -0.13 -0.09 0.04 Duty Cycles N/A N/A N/A 0.03 D-C Ratio N/A N/A N/A 0.33

62
62
Results in Tables 4.5 and 4.6 indicate that the CASCOM analysis is moderately
sensitive to load type. Using the 7.5kW static load is used to the”Medium” hybrid
system yields a 72% reduction in maintenance cost relative to a 10kW standalone DG.
However, using the dynamic summer load is used to simulate the hybrid system yields 33%
more maintenance cost reduction relative to standalone DG. Similar result is evident
when the dynamic load is used to simulate the 10kW standalone DG. However, in both
hybrid system and standalone DG, simulation with the dynamic load yielded loss in DG
efficiency. The efficiency loss under dynamic load reflects the fact that the static load
presents a high load factor to the 10kW generator, making it run more efficiency. The
loss also suggests that there are enough low-load periods to reduce the DG’s average load
factor of the dynamic profile below that of the static load. This is evident in the fat that
the hybrid system’s battery would cycle 33% more times under the dynamic load. The
dynamic load reveals more non-linearities and tradeoffs, considerations of which may
influence cost-benefit analysis.

63
63
CHAPTER 5. CONCLUSION
Diesel generators are reliable source of power in isolated settings where grid
electricity is either practically inaccessible or not available. However, their performance
suffers when subjected to low and transient load conditions, which are prevalent in
expeditionary basecamps that support military contingency operations and disaster-relief
activities. The dynamic tempo and sustainment requirements of contingency operations
give rise to sustained periods of low-average power demand and frequent short-duration
peaks. Such conditions are less-than-ideal, and subject diesel engines to energy-intensive
and mechanically-tasking operations, which lead to inefficient combustion, inefficient
fuel consumption, increased wear and tear, and greater chance of essential function
failure.
According to 2010 estimates, there are approximately 106,000 generators sets
across the Department of Defense (Richard, 2009; RDECOM, 2013). This inventory and
recent acquisition and R&D investments represent a long-term commitment to DGs as the
military’s primary source of TEP (CASCOM, 2014a, 2014b). Underlying this
commitment is role of innovative combustion technologies—such as variable-speed
engines, electronic fuel injection, and power control electronics— in improving
performance modern generators such as AMMPS. Nevertheless, investment in DGs
unfortunately keeps the military tethered to fuel and its attendant logistical challenges,

64
64
which are exacerbated by the effects of non-ideal load condition on DG’s power
conversion efficiency and reliability.
Notwithstanding the ability to adjust speed, follow load changes, the science of
combustion suggests that DGs are inherently vulnerable to non-ideal load conditions.
The process of dealing with those conditions are potentially deleterious to healthy DG
operation. Even with ideal conditions that are favorable for efficient generator operation,
the burdens associated with contingency basecamp energy logistics are significant, and
include risks inherent in protecting extensive supply lines that often run through
treacherous terrain or hostile territory. The deleterious impact of low and transient load
conditions exacerbates that inherent burden, and contributes to increased requirement for
fuel and repair parts. The ultimate solution to this problem may be to replace diesel
generators with renewable energy or non-combustion technologies that do not rely on
externally-provided fuel. However, cost, energy density, and deployability limitations of
renewable energy technologies continue to mar their wide application to TEP generation.
Until those challenges are overcome, DG’s vulnerability to non-ideal load conditions will
This research investigated the potential of an interim solution—hybridizing diesel
generators with energy storage batteries. The solution is based on the simple idea that a
battery would provide additional load that forces generators to operate at full load, thus
eliminating the occurrence of load and transient loads. Batteries provide an energy
storage capacity that can be used as prime power source, thus reducing generator runtime
and eliminating the need for redundant generators. Results show that hybridizing
DGs—combining them with a battery and limiting their usage to the battery’s recharging
period, enables over 50% in the generator’s runtime. This allows for equally significant

65
65
reduction in the number of times the generator needs to under maintenance services.
Consequently, maintenance cost over a given period is reduced. The research also
showed that a battery improves other generator performance metrics. Depending on the
load, fuel consumption can be reduced by up to 30%, and power-conversion efficiency is
improved by up to 20%. These improvements are possible while the battery can provide
at least twice as much discharge time (silent watch capability) than charging time.

REFERENCES

66
66
LIST OF REFERENCES
Aalborg University (2014). Energy plan: Advanced energy systems analysis computer
model. Department of Development and Planning. Aalborg, Demark. Retrieved
from http://www.energyplan.eu/
Agarwal, N., Kumar, A., & Varun. (2013). Optimization of grid independent hybrid PV-
diesel battery system for power generation in remote villages of Uttar Pradesh,
India. Energy for Sustainable Development, 17(3), 210–219.
doi:10.1016/j.esd.2013.02.002
Army Capability Integration Center. (2010). Power and energy strategy white paper.
(Research, Development, and Engineering Command). Ft. Monroe, VA: U.S.
Army
Army Equipping Enterprise System (AE2S) data, 25 January 2010.
Baring-Gould, E I, Green, H J, van Dijk, V A.P., & Manwell, J F. (1996). Hybrid2: The
hybrid power system simulation model. United States. Retrieved from
http://www.osti.gov/scitech/servlets/purl/377591
Bilal, B. O., Sambou, V., Kébé, C. M. F., Ndiaye, P. a., & Ndongo, M. (2012).
Methodology to size an optimal stand-alone PV/wind/diesel/battery system
minimizing the levelized cost of energy and the CO 2 emissions. Energy
Procedia, 14, 1636–1647. doi:10.1016/j.egypro.2011.12.1145
Bolton, C. (2009). Army R&D Efforts. Electrical Generating Systems Association
(EGSA) Fall 2009 Meeting.
Borhanazad, H., Mekhif, S., Gounder Ganapathy, V., Modiri-Delshad, M., & Mirtaheri,
A. (2014). Optimization of micro-grid system using MOPSO. Renewable Energy,
71, 295–306. doi:10.1016/j.renene.2014.05.006
Borshchev, A., & Filippov, A. (2004). From system dynamics to agent based modeling.
22nd International Conference of System Dynamics Society.

67
67
Broussely, M., Biensan, P., Bonhomme, F., Blanchard, P., Herreyre, S., Nechev, K., &
Staniewicz, R. J. (2005). Main aging mechanisms in Li ion batteries. Journal of
Power Sources, 146(1-2), 90–96. http://doi.org/10.1016/j.jpowsour.2005.03.172
Buhaug, Ø. (2003). Deposit Formation on Cylinder Liner Surface in medium-speed
Engines.
Burke, S. (2013). The Institutional Advantage: Building an energy-informed military.
DoD Power, Energy, & Propulsion
Communications-Electronics Research, Development, and Engineering Center. (2013).
Small Tactical Electric Power Technology Transition Brief. (Research,
Development, and Engineering Command). : U.S. Army
Current Operational Analysis Support Team. (2010, September). Analysis of logistics
related casualties for Marine forces in Afghanistan. (Operations Analysis
Division, Marine Corps Combat Development Command): Quantico, VA: U.S.
Marine Corps
Deshmukh, M. K., & Deshmukh, S. S. (2008). Modeling of hybrid renewable energy
systems. Renewable and Sustainable Energy Reviews.
http://doi.org/10.1016/j.rser.2006.07.011
Diaf, S., Diaf, D., Belhamel, M., Haddadi, M., & Louche, a. (2007). A methodology for
optimal sizing of autonomous hybrid PV/wind system. Energy Policy, 35(11),
5708–5718. doi:10.1016/j.enpol.2007.06.020
Dufo-López, R., & Bernal-Agustín, J. L. (2005). Design and control strategies of PV-
Diesel systems using genetic algorithms. Solar Energy, 79(1), 33–46.
http://doi.org/10.1016/j.solener.2004.10.004
Doyle, M., Fuller, T. F., & Newman, J. (1993). Modeling of galvanostatic charge and
discharge of the lithium/polymer/insertion Cell. Journal of The Electrochemical
Society, 140(6), 1526. http://doi.org/10.1149/1.2221597
Doyle, M., & Newman, J. (1995). Modeling the performance of rechargeable lithium-
based cells: Design correlations for limiting cases. Journal of Power Sources, 54,
46–51.
Ellwood, L., Cycowski, A., Panozzo, P., & Raney, T. (2009). Tactical Electric Power
(TEP): Emerging technologies and initiatives that influence organization power
needs white paper (Combined Arms Support Command publication). U.S. Army
Expeditionary Energy Office. (2013). Mobil Electric Hybrid Power Sources
(MEHPS) Brief to Industry. U.S. Marine Corps.

68
68
Fares, R. L., & Webber, M. E. (2014). A flexible model for economic operational
management of grid battery energy storage. Energy, 78, 768–776.
doi:10.1016/j.energy.2014.10.072
Frederich-Alexander University (2014). Hybrid Simulation of Smart Energy Systems.
Department of Computer Science. Erlangen-Nuerenburg, Germany. Retrieved
from http://www7.cs.fau.de/en/.
Green, H. J., & Dijk, V. A. P. Van. (1996). Hybrid2 - The Hyb System Simulation
Power, (July).
Grigoryev, I. (2015). Anylogic 7 in three days: A quick course in simulation modeling.
Lexington, KY: The AnyLogic Company
Hammack, K., (2012). The Value of Energy Security from Battlefield to the Base:
Statement by Assistant Secretary of the Army for Installations, Energy, and
Environment. House Armed Services Committee. U.S. House of Representatives.
Second Session, 112th Congress.
Harada, Fukzawa and Takimoto (2007). Investigation Report. Mitsubishi Heavy
Industries, Ltd.
Hong, Y. Y., & Lian, R. C. (2012). Optimal sizing of hybrid wind/PV/diesel generation
in a stand-alone power system using markov-based genetic algorithm. IEEE
Transactions on Power Delivery, 27(2), 640–647.
doi:10.1109/TPWRD.2011.2177102
Jagels, G. (2013). Solving Austerity: How will the DoD provide power to off-the-grid
bases? DoD Power, Energy & Propulsion, 1, 2 – 5.
Kaabeche, A., & Ibtiouen, R. (2014). Techno-economic optimization of hybrid
photovoltaic/wind/diesel/battery generation in a stand-alone power system. Solar
Energy, 103, 171–182. http://doi.org/10.1016/j.solener.2014.02.017
Khare, V., Nema, S., & Baredar, P. (2015). Optimisation of the hybrid renewable energy
system by HOMER, PSO and CPSO for the study area. International Journal of
Sustainable Energy, (June), 1–18. doi:10.1080/14786451.2015.1017500
Kusakana, K., & Vermaak, H. J. (2013). Hybrid diesel generator - battery systems for
offgrid rural applications. Proceedings of the IEEE International Conference on
Industrial Technology, 839–844. doi:10.1109/ICIT.2013.6505781
Larsen, A. (2014). A method of visualizing state of charge of batteries in hybrid
generators. Unpublished manuscript. Department of Computer and Information
Technology, Purdue University, West Lafayette, Indiana, USA.

69
69
Lasswell, J. (2010). Experimental Forward Operating Base (ExFOB), Power and
Energy.
Lee, J. W., Anguchamy, Y. K., & Popov, B. N. (2006). Simulation of charge-discharge
cycling of lithium-ion batteries under low-earth-orbit conditions. Journal of Power
Sources, 162(2 SPEC. ISS.), 1395–1400.
http://doi.org/10.1016/j.jpowsour.2006.07.045
Manghani, R. (2016, March 16). Behind-the-meter energy storage poised for explosive
growth. Greentechmedia.com. Retrieved from
http://www.greentechmedia.com/articles/read/behind-the-meter-energy-storage-
market-poised-for-exponential-growth
Marine Corp Systems Command. (2013). Mobile Electric Hybrid Power Source Analysis
of Alternatives (AoA) Final Report. Quantico, VA: U.S. Marine Corps
Marine Corps Systems Command (n.d.). Initial Capability Document (ICD) for
Expeditionary Energy, Water, and Waste (E2W2). U.S. Marine Corps.
Methekar, R. N., Ramadesigan, V., Braatz, R. D., Subramanian, V. R., & Louis, S.
(2010). Optimum Charging Profile for Lithium-ion Batteries to Maximize Energy
Storage and Utilization. ECS Transaction, 25(35), 139–146.
Ning, G., White, R. E., & Popov, B. N. (2006). A generalized cycle life model of
rechargeable Li-ion batteries. Electrochimica Acta, 51(10), 2012–2022.
http://doi.org/10.1016/j.electacta.2005.06.033
Office of Naval Research, U. S. N. (2016). Ground Renewable Expeditionary Energy
System (GREENS): Fact Sheet.
Pruckner, M., & German, R. (2014). A Simulation Model to Analyze the Residual Load
During the Extension of Highly Fluctuating Renewables in Bavaria , Germany, 5,
3–8.
Pruckner, M., & German, R. (2013). Hybrid simulation model for large-scaled electricity
generation systems. In P. Pasupathy, S. Kim, A. Tolk, R. Hill, & M. E. Kuhl
(Eds.), 2013 Winter Simulation Conference (pp. 1881–1892). Erlangen, Germany
Rahimian, S. K., Rayman, S., & White, R. E. (2011). Optimal charge rates for a lithium
ion cell. Journal of Power Sources, 196(23), 10297–10304.
http://doi.org/10.1016/j.jpowsour.2011.07.019
Richard, P. (2009). Mobile Electric Power Systems Command brief to EGSA. In
Department of Defense Tactical Electric Power (TEP) Initiatives. Project Manager
Mobile Electric Power.
70
70
Rakopoulos, C.D., & Giakoumis, E.G. (2009). Diesel Engine Transient Operation.
London: Springer.
Santhanagopalan, S., Guo, Q., Ramadass, P., & White, R. E. (2006). Review of models
for predicting the cycling performance of lithium ion batteries. Journal of Power
Sources, 156(2), 620–628. http://doi.org/10.1016/j.jpowsour.2005.05.070
Turnbull, G. (2014, August 20). Unleash the tether: reducing the U.S. military’s thirst for
foreign oil. Kable. Retrieved from http://www.army-
technology.com/features/featureunleash-the-tether-reducing-the-us-militarys-
thirst-for-foreign-oil-4346558/
U.S. Army Combined Arms Support Command. (2014). Cost-benefit analysis summary:
Mobile Electric Hybrid Power Source (MEHPS). (Material Systems Directorate,
Sustainment Center of Excellence). Fort Lee, Virginia: U.S. Army
U.S. Army Combined Arms Support Command. (2014). Capabilities production
document for tactical electrical power (0.5kW to 200kW). (Material Systems
Directorate, Sustainment Center of Excellence), Fort Lee, Virginia: U.S. Army.
U.S. Department of Defense (2012). Operational energy strategy implementation plan.
U.S. Army, (2013). Army operational energy policy letter.
U.S. Army (2010). Army sustainability campaign plan.
USMC Expeditionary Energy Office. (2016). Expeditionary Energy Concepts (E2C).
Retrieved from http://www.hqmc.marines.mil/e2o/E2CExFOB.aspx
Wang, L., & Singh, C. (2007). Compromise between cost and reliability in optimum
design of an autonomous hybrid power system using mixed-integer PSO
algorithm. In 2007 International Conference on Clean Electrical Power, ICCEP
’07 (pp. 682–689). doi:10.1109/ICCEP.2007.384284
Woodyard, Doug. (2009). Pounder's Marine Diesel Engines and Gas Turbines (9th
Edition). Retrieved from
http://app.knovel.com/hotlink/toc/id:kpPMDEGTE4/pounders-marine-
diesel/pounders-marine-diesel
Yang, H., Zhou, W., Lu, L., & Fang, Z. (2008). Optimal sizing method for stand-alone
hybrid solar-wind system with LPSP technology by using genetic algorithm. Solar
Energy, 82(4), 354–367. http://doi.org/10.1016/j.solener.2007.08.00

71
71
Zhou, W., Yang, H., & Fang, Z. (2008). Battery behavior prediction and battery working
states analysis of a hybrid solar-wind power generation system. Renewable Energy, 33(6),
1413–1423.

71
71
APPENDICES

72
72
Appendix A: Impact of Low and Transient Load Conditions on Diesel Generators
- Incomplete fuel combustion
- Excessive buildup of carbon deposit in cylinder (wet-stacking)
- Weakening of piston ring seal
- Leakage of high-pressure and high-temperature combustion gas
- Low fuel injection pressure
- Drastic changes to fuel and lubricating oil viscosity
- Soot formation and contamination of lubricating oil
- Water condensation and contamination of lubricating oil
- Poor fuel injection timing
- Poor ignition timing
- Poor timing of intake and exhaust valve openings
- Suboptimal fuel injection dispersion
- Presence of excessive lubricating oil in cylinder liner
- Corrosion from fuel acidity
- Scoring or polishing of cylinder liner
- Fouling of compressor blades from leaked crankcase gases
- Piston scuffing
- Lacquer formation
- Increased consumption of lubricating oil
- Reduction of fuel ignition capacity
- Impairment of gravity-dependent centrifuging process used to purify fuel.
- Growth of “diesel bugs” (bacteria, yeast, and fungus) that clog filters
- Loss of alkaline additives needed to neutralize acidic products of combustion
- Low air/fuel ratio
- Clogging of fuel and oil filters
Table A.1. Diesel generator faults associated with extended low and transient loads

73
73
Carbon deposits and polishing wear in cylinder liner.
Large amounts of carbon deposits found on cylinder
head surface
Scuffing marks on the entire circumference of a piston.
a. Carbon sludge on bearing inner surfaces of cylinder
b. Large amounts of carbon sludge observed on the
plated overlay of connecting rod bearings.
Broken cylinder line, and polishing wear due to
Presence of hard carbon particles.
Table A.2 Faults identified in diesel engine breakdown analysis (Tufts, 2014)
Figure A.1: Mechanism of Diesel Engine Damage
(Harada, Harada, Fukzawa and Takimoto (2007)

74
74
Appendix B: Additional Simulation Results
1C
0.05C 0.1C
0.2C 0.3C
0.4C 0.5C
0.6C 0.7C
0.8C 0.9C
Figure B.1 Battery C-Rate Impact on Charge/Discharge Cycle

75
75
Figure B.2. B-G HPS Capacity Design Space for Summer Load

76
76
Figure B.3. B-G HPS Design Space Simulation for a 24hr 7.5kW Static Load
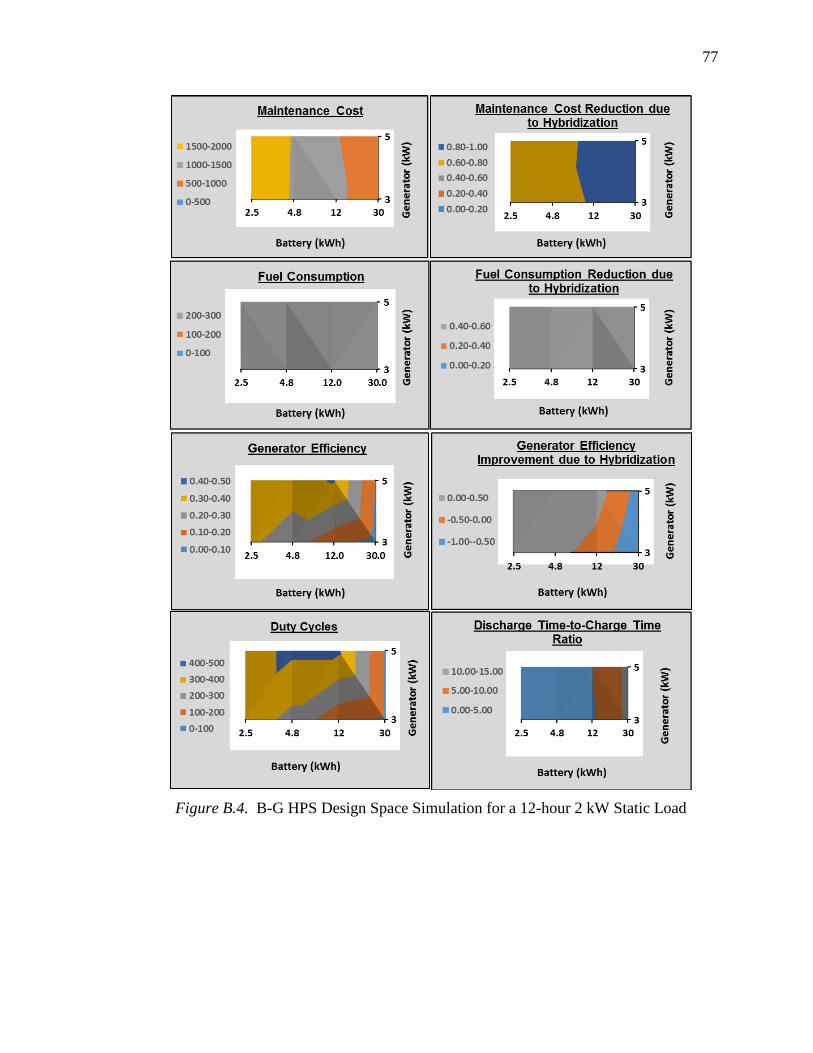
77
77
Figure B.4. B-G HPS Design Space Simulation for a 12-hour 2 kW Static Load

78
78
Appendix C: Excel Simulation Code and Data
Figure C.1: Excel simulation code and sample data