cape cod pond and lake atlas · cape cod pond and lake atlas may, 2003 ii dissolved oxygen...
TRANSCRIPT

Cape Cod Pond and Lake Atlas
Project 2000-02
Prepared by:
Cape Cod Commission Eduard M. Eichner, Water Scientist/Project Manager Thomas C. Cambareri, Water Resources Program Manager
Gabrielle Belfit, Hydrologist Donna McCaffery, Water Resources Project Assistant
Scott Michaud, Hydrologist Ben Smith, GIS Analyst
Margo Fenn, Executive Director
Prepared for:
MASSACHUSETTS EXECUTIVE OFFICE OF ENVIRONMENTAL AFFAIRS
COMMUNITY FOUNDATION OF CAPE COD
AND
SCHOOL OF MARINE SCIENCE AND TECHNOLOGY AT UNIVERSITY OF MASSACHUSETTS - DARTMOUTH
May, 2003
This project has been partially funded by and carried out in partnership with the Massachusetts Executive Office of Environmental Affairs. The contents do not necessarily reflect the views and policies of EOEA or of the Department, nor does mention of trade names or commercial products constitute endorsement or recommendation for use.
Cape Cod Pond and Lake Atlas May, 2003 i
EXECUTIVE SUMMARY Cape Cod is blessed with abundant waters, both fresh and salt. During the past ten years,
significant strides have been made to assess the water quality status and impacts on coastal estuary waters, but a comparable effort had not been initiated to assess pond and lake water quality. In 1999, the Cape Cod Commission, in coordination with a number of other organizations, set a goal of developing a network of citizens and organizations concerned with the quality of Cape Cod ponds. A limited number of ponds had been studied extensively in the 1980’s and regional sampling of ponds had been done a couple of times, but these regional assessments had generally focussed on the larger ponds and had not provided a comprehensive picture of pond water quality on Cape Cod. With funding from the state Executive Office of Environmental Affairs, the cooperation and free laboratory services provided by the School of Marine Science and Technology (SMAST) at UMASS-Dartmouth, subsequent funding from the Community Foundation of Cape Cod, and the grass-roots enthusiasm of volunteer water quality samplers and other concerned citizens, the Cape Cod Pond and Lake Stewardship (PALS) program was initiated and nurtured to achieve the goal of better understanding the status of Cape Cod ponds.
This Pond and Lake Atlas is a status report on the PALS program. It documents the outreach and education activities leading to the creation of the PALS program, reviews water quality data collected by volunteers during the 2001 PALS Snapshot from over 190 ponds, uses this data to develop Cape Cod-specific indicators of pond impacts, reviews data collected in previous studies, and details further efforts necessary to move pond protection and remediation forward on the Cape.
Cape Cod has nearly 994 ponds covering nearly 11,000 acres. These ponds range in size from less than an acre to 735 acres; with the 21 biggest ponds having nearly half of the total Cape-wide pond acreage. Approximately 40% of the ponds are less than an acre. Prior to the creation of this Pond Atlas, a complete count of all the ponds on Cape Cod had not been accomplished. Of the 994 ponds, only 176 have maximum depth measurements and only 89 have bathymetric information, which is important for understanding water quality information.
As part of the overall PALS program, SMAST provided laboratory services at no cost to towns or volunteers for the 2001 PALS Snapshot of pond water quality. Volunteers collected dissolved oxygen and temperature profiles, clarity readings, and 421 water quality samples from 195 ponds between August 15 and September 30. Samples were analyzed for chlorophyll a, alkalinity, pH, total nitrogen, and total phosphorus. This information is the most comprehensive dataset on Cape Cod ponds.
This dataset was used to provide a general assessment of pond water quality on Cape Cod. The authors reviewed existing tools for evaluating pond ecosystem nutrient levels, including Carlson’s Trophic Status Index and USEPA’s ecoregion nutrient thresholds, and applied USEPA’s nutrient threshold calculation methodology to develop Cape Cod-specific nutrient thresholds. These tools were used to look at the general status of ponds on town by town basis and select number of individual ponds.
The review of current USEPA nutrient thresholds and Cape Cod nutrient thresholds suggest that the water quality in Cape Cod ponds is significantly impacted by surrounding development. Review of 2001 dissolved oxygen concentrations and comparison of 1948 and 2001 dissolved oxygen concentrations suggest that many of these pond ecosystems are not only impacted, but also seriously impaired. Based on information in this Atlas, between 74 and 93% of the Cape’s ponds are impacted by surrounding development or uses. Based largely on
Cape Cod Pond and Lake Atlas May, 2003 ii
dissolved oxygen information, approximately 45% of all the ponds and 89% of the deepest ponds are impaired.
Although these measures indicate significant ecological problems, most of the ponds still provide the majority of uses that most Cape Codders desire. Bacterial testing of ponds show that these ponds generally provide healthy conditions for swimming. Fishing and boating are still popular and recent property values and sales show that demand for pondfront properties is only increasing.
But even some these uses are impacted by ecological problems. Occasional large fish kills or algal blooms are due to excessive nutrients. Regular stocking of deep ponds sustains trout fisheries, but trout generally do not have adequate habitats to make it through a summer due to lack of oxygen cold waters of deeper ponds. More nutrients generally favor bass fishing, but half of the eighteen pond tested for mercury now have health warnings about consumption of fish tissue.
Because the appearance of these ponds is shaped by what the users observe from the surface, actions to correct these ecological impairments will depend on community and state priorities. Active discussion of ecological management strategies for these ponds may lead to refinement of pond users’ expectations for habitat and recreation.
The PALS Program offers the opportunity to concerned citizens (Pond and Lake Stewards (PALS)) to gather meaningful ecological and use information that can later be used to influence future funding priorities and provide data to scientists that can be used in later assessments of remedial water quality options. The PALS Program currently has a number of monitoring components (Snapshots and more frequent town programs) that are developing information that will be useful for better understanding the regional status, as well as the status of individual ponds. The networking components of the PALS program encourage the sharing of experiences among all PALS.
In order to encourage and sustain the nascent network of PALS on Cape Cod the following are recommended as future steps:
1. Continue the PALS Snapshots of pond water quality 2. Recruit volunteer coordinators, volunteers, and other PALS in each town 3. Encourage towns to acquire necessary sampling equipment 4. Encourage towns to initiate summer pond sampling programs 5. Provide sufficient personnel to train volunteer monitors, develop monitoring
locations, provide regular feedback to volunteers to ensure protocols are followed during sampling season
6. Provide qualified personnel to review and analyze sampling data 7. Provide adequate funding to have annual or semi-annual PALS gatherings for
outreach, education, and technical transfer 8. Provide adequate long-term funding to remediate impairments 9. Ensure that pond water quality is thoroughly considered in town comprehensive
wastewater assessments
Cape Cod Pond and Lake Atlas May, 2003 iii
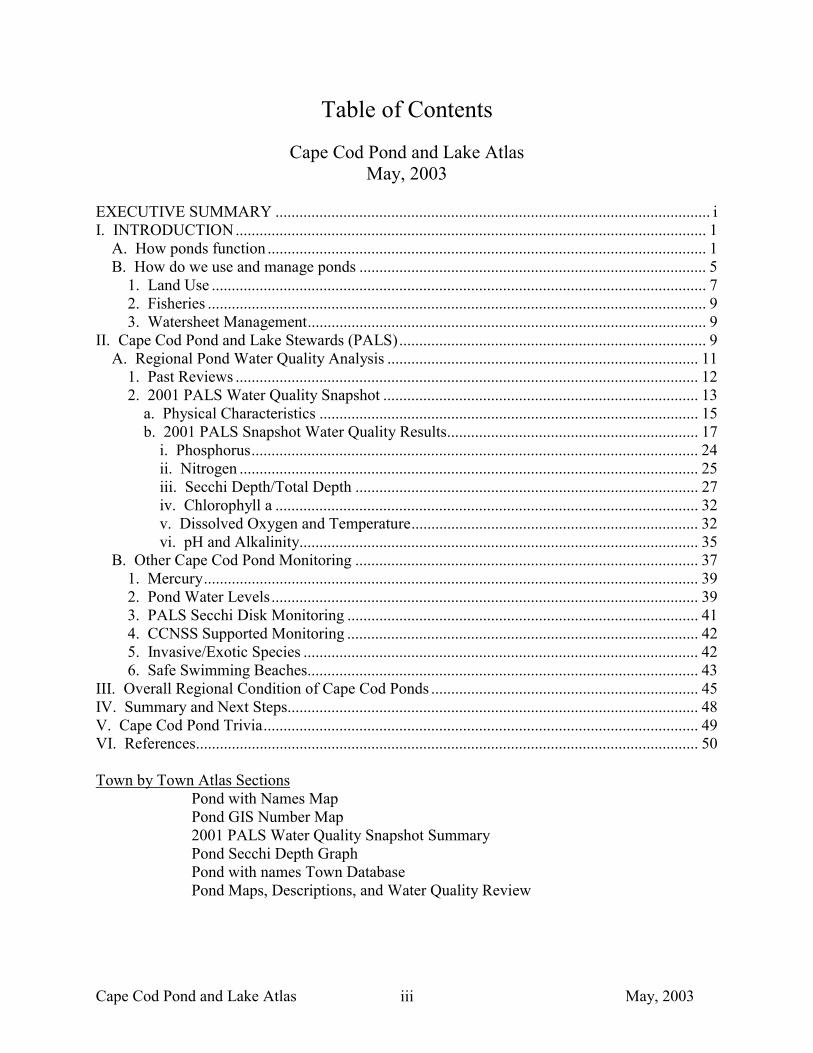
Table of Contents
Cape Cod Pond and Lake Atlas May, 2003
EXECUTIVE SUMMARY ............................................................................................................. i I. INTRODUCTION...................................................................................................................... 1
A. How ponds function .............................................................................................................. 1 B. How do we use and manage ponds ....................................................................................... 5
1. Land Use ............................................................................................................................ 7 2. Fisheries ............................................................................................................................. 9 3. Watersheet Management.................................................................................................... 9
II. Cape Cod Pond and Lake Stewards (PALS)............................................................................. 9 A. Regional Pond Water Quality Analysis .............................................................................. 11
1. Past Reviews .................................................................................................................... 12 2. 2001 PALS Water Quality Snapshot ............................................................................... 13
a. Physical Characteristics ............................................................................................... 15 b. 2001 PALS Snapshot Water Quality Results............................................................... 17
i. Phosphorus................................................................................................................ 24 ii. Nitrogen ................................................................................................................... 25 iii. Secchi Depth/Total Depth ...................................................................................... 27 iv. Chlorophyll a .......................................................................................................... 32 v. Dissolved Oxygen and Temperature........................................................................ 32 vi. pH and Alkalinity.................................................................................................... 35
B. Other Cape Cod Pond Monitoring ...................................................................................... 37 1. Mercury............................................................................................................................ 39 2. Pond Water Levels........................................................................................................... 39 3. PALS Secchi Disk Monitoring ........................................................................................ 41 4. CCNSS Supported Monitoring ........................................................................................ 42 5. Invasive/Exotic Species ................................................................................................... 42 6. Safe Swimming Beaches.................................................................................................. 43
III. Overall Regional Condition of Cape Cod Ponds ................................................................... 45 IV. Summary and Next Steps....................................................................................................... 48 V. Cape Cod Pond Trivia............................................................................................................. 49 VI. References.............................................................................................................................. 50 Town by Town Atlas Sections
Pond with Names Map Pond GIS Number Map
2001 PALS Water Quality Snapshot Summary Pond Secchi Depth Graph Pond with names Town Database Pond Maps, Descriptions, and Water Quality Review
Cape Cod Pond and Lake Atlas May, 2003 iv
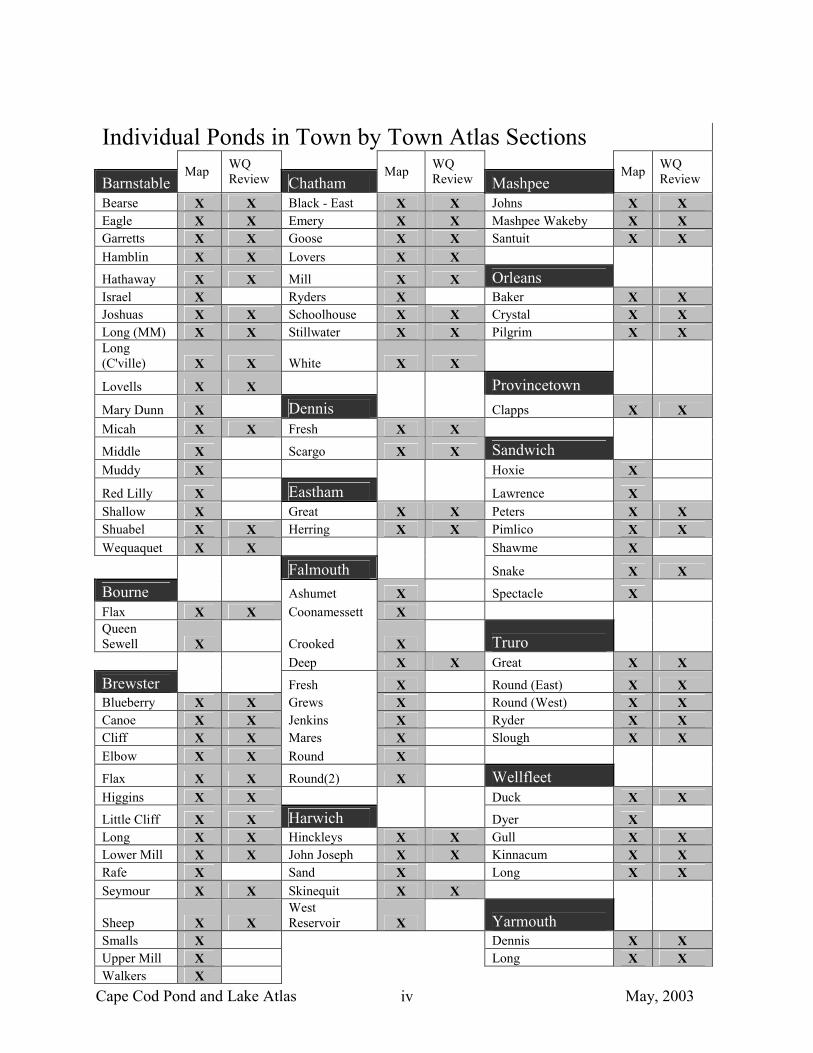
Individual Ponds in Town by Town Atlas Sections
Barnstable Map WQ
Review Chatham Map WQ
Review Mashpee Map WQ
Review
Bearse X X Black - East X X Johns X X Eagle X X Emery X X Mashpee Wakeby X X Garretts X X Goose X X Santuit X X Hamblin X X Lovers X X Hathaway X X Mill X X Orleans Israel X Ryders X Baker X X Joshuas X X Schoolhouse X X Crystal X X Long (MM) X X Stillwater X X Pilgrim X X Long (C'ville) X X White X X
Lovells X X Provincetown
Mary Dunn X Dennis Clapps X X Micah X X Fresh X X Middle X Scargo X X Sandwich Muddy X Hoxie X
Red Lilly X Eastham Lawrence X Shallow X Great X X Peters X X Shuabel X X Herring X X Pimlico X X Wequaquet X X Shawme X
Falmouth Snake X X Bourne Ashumet X Spectacle X Flax X X Coonamessett X Queen Sewell X Crooked X Truro
Deep X X Great X X Brewster Fresh X Round (East) X X Blueberry X X Grews X Round (West) X X Canoe X X Jenkins X Ryder X X Cliff X X Mares X Slough X X Elbow X X Round X
Flax X X Round(2) X Wellfleet Higgins X X Duck X X Little Cliff X X Harwich Dyer X Long X X Hinckleys X X Gull X X Lower Mill X X John Joseph X X Kinnacum X X Rafe X Sand X Long X X Seymour X X Skinequit X X
Sheep X X West Reservoir X Yarmouth
Smalls X Dennis X X Upper Mill X Long X X Walkers X
Cape Cod Pond and Lake Atlas May, 2003 v
List of Figures and Tables
Cape Cod Pond and Lake Atlas May, 2003
FIGURE PageFigure 1. Generalized Pond Temperature Stratification 2Figure 2. Relative Phosphorus Mass at Lake Trophic Levels 3Figure 3. Hydrograph for USGS Well A1W294 5Figure 4. Plymouth Gentian 5Figure 5 Nearshore Landscaping and Buffers 8Figure 6. PALS Secchi Disks 10Figure 7. Helicopter Impact on Lake Surface 13Figure 8. Cape Cod Ponds: Area and Number 16Figure 9. Number and Area of Ponds by Town 18Figure 10. Cape Cod Ponds: Depth and Number 19Figure 11. USEPA Subecoregions within Ecoregion 14 21Figure 12. USEPA Methods for setting reference condition thresholds 22Figure 13. Total Phosphorus in Cape Cod Ponds: Comparison to Cape Cod Impacted Thresholds 26Figure 14. Total Nitrogen in Cape Cod Ponds: Comparison to Cape Cod Impacted Thresholds 28Figure 15. Secchi Disk 29Figure 16. Secchi Depth in Cape Cod Ponds: Comparison to Cape Cod Impacted Thresholds 30Figure 17. Secchi Depth as a Percentage of Total Depth 31Figure 18. Chlorophyll a in Cape Cod Ponds: Comparison to Cape Cod Impacted Thresholds 33Figure 19. Carlson Chlorophyll Trophic Status Index (TSI): Cape Cod 2001 Snapshot Ponds 34Figure 20. Cape Cod Ponds: Deepest Dissolved Oxygen by General Stratification Depth 36Figure 21. pH in Cape Cod Ponds: Comparison to Cape Cod Reference Criteria 38Figure 22. Surface Water Elevations of Long Pond, Brewster 41Figure 23. 2001 Secchi Dip-In: Comparison of Results 41Figure 24. Hydrilla at Wakulla Springs, Florida 43Figure 25. Comparison of 2001 and 2002 PALS Chlorophyll a Surface Concentrations 45Figure 26. Comparison of 1948 and 2001 Dissolved Oxygen in Cape Cod Ponds and Lakes 47 TABLE PageTable 1. Current PALS Pond Coordinators 14Table 2. PALS Sample SMAST Laboratory Analytical Methods 14Table 3. Carlson Trophic State Index (TSI) 20Table 4. USEPA Ecoregion 14 Reference Information 22Table 5. Reference Criteria for Cape Cod Ponds based on 2001 PALS Snapshot 23Table 6. Summary of Surface Water Level Monitoring - Cape Cod, 1973-2002 40Table 7. Cape Cod Freshwater Beaches Bacterial Testing: 2001-2002 44
Cape Cod Pond and Lake Atlas May, 2003 vi
Acknowledgments The effort to produce this Atlas depended on the energy, generosity, skills, and knowledge of numerous individuals and organizations. Without their participation, this Atlas and the Pond and Lake Stewards (PALS) program would not be possible. The authors thank everyone involved in this effort, including the following folks who deserve special recognition: Sandy Bayne, Eastham Bill Boothe, Dennis Jo Anne Buntich, Town of Sandwich Ed Baker, Mashpee Environmental Coalition Judith Bruce, Orleans Jon Budreski, National Park Service Lindsey Counsell, 3 Bay Preservation, Inc. Seth Crowell, Dennis Bob Duncanson, Town of Chatham Ryan Elting, AmeriCorps-Cape Cod Joann Figueras, Brewster Jim Hanks, Mashpee Brian Howes, SMAST, UMASS-D Karen Howes, Barnstable County Health Carroll Johnson, Brewster Jane Johnson, Brewster Krista Lee, National Park Service Henry Lind, Town of Eastham Bob Mant, Town of Brewster John Portnoy, National Park Service Heinz Proft, Town of Harwich Dale Saad, Town of Barnstable Frank Sampson, Harwich Judy Scanlon, Orleans Kate Strom, AmeriCorps-Cape Cod Dave White, SMAST, UMASS-D Tony Williams, Coalition for Buzzards Bay
Cape Cod Pond and Lake Atlas May, 2003 1
I. INTRODUCTION Cape Cod is a land of water. If one were to fly over Cape Cod on a sunny spring day,
nearly a 1,000 surface water bodies would reflect back, like black diamonds in the land surface. These water bodies, many of which disappear as water levels drop throughout the summer, cover nearly 11,000 acres of Cape Cod.
Generally, these lakes and ponds are depressions left in the land surface after the glaciers that formed Cape Cod about 12,000 years ago retreated to the north. The glaciers left large chunks of ice that were surrounded and covered by the sands carried by the glacial meltwater as it flowed to the south. As these chunks of ice melted, the landscape above them collapsed forming large depressions called “kettle holes”. As precipitation fell and the Cape’s aquifer system developed, the water table eventually rose to fill these kettle hole depressions and create the hundreds of ponds we see on Cape Cod today.
Typical kettle hole ponds or lakes lack streams flowing into or out of them. Instead, the sandy sides of these ponds allow a steady inflow and outflow of groundwater to and from the adjacent aquifer. The pond surfaces generally fluctuate up and down in response to the seasonal rise and fall of the water table, giving us a “window” into the aquifer.
But there are a wide variety of ponds on the Cape: shallow or deep, with streams or without, surrounded by houses or with a largely pristine shoreline, near the coast or inland at the top of the aquifer. Although some folks would even like to see a better distinction between “ponds” and “lakes”, all of these surface water bodies are considered in this Atlas and “lake” and “pond” will be used interchangeably throughout. Most of them share one common feature, however: little was known about their condition and characteristics. This Atlas presents new information, reviews old information, and provides a basis for Cape Cod to move forward with protection and remediation of these resources.
A. How ponds function
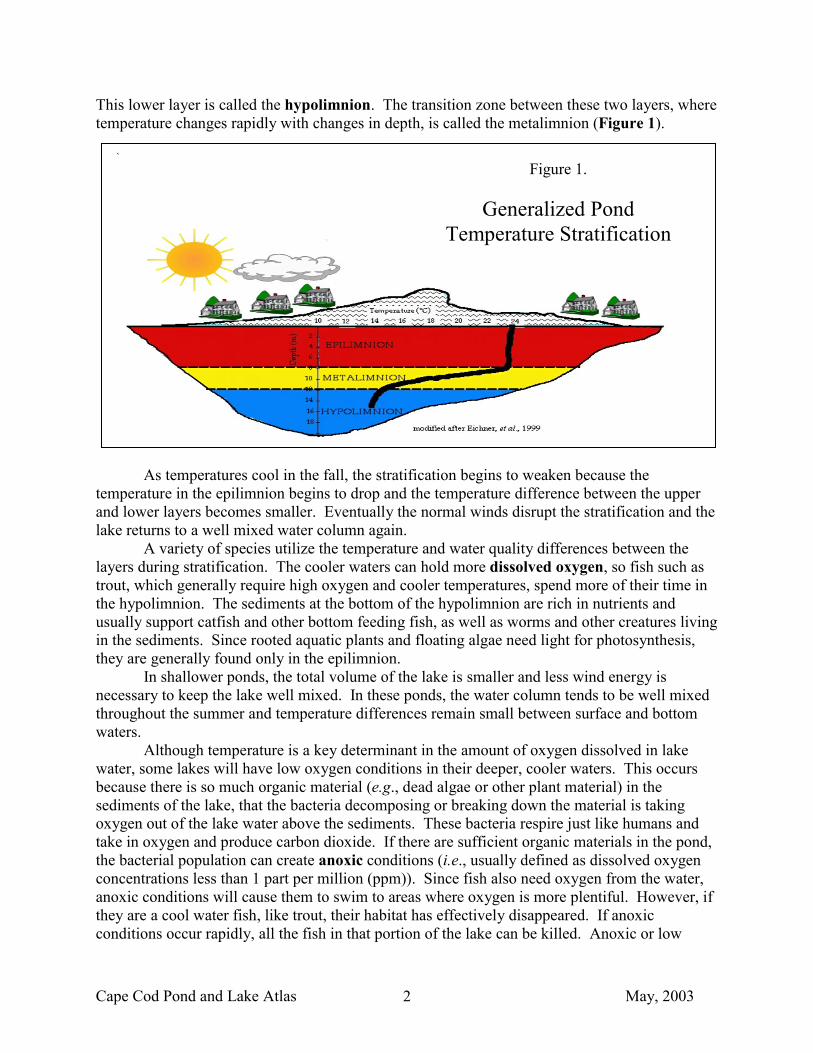
Lake and pond ecosystems are controlled by interactions among physical features and internal chemical interactions. Physical features include the surface shape of the lake, surrounding topography, bathymetry, and watershed size. Chemical interactions occur between and among the plants and animals in the lake and the sediments, water, and constituents in the water. Outside factors such as strength and direction of wind, air and water temperature, groundwater and surface water inflows and outflows also play important roles in how a given ecosystem functions. The ecosystems of Cape Cod kettle ponds change throughout the seasons of the year and from year to year depending on all of the factors above, but temperature changes are a key factor for every pond, especially for deeper ponds. Beginning in early spring, air and water temperatures begin to rise as the days become longer. If the winds are strong enough to keep the lake well mixed, the warming of the water is consistent and the same temperature can be measured throughout the water column. But usually, at some point, the warming is too rapid and the winds are not strong enough to maintain mixing, and cooler bottom waters are separated from warmer upper waters. This process is called stratification and generally occurs in ponds that are 9 meters or deeper. The upper, warmer waters continue to warm as the year moves into the summer. This upper layer of water is called the epilimnion and can usually reach between 24 and 27°C (75 to 80°F). The cooler, bottom waters generally maintain a temperature close to the overall temperature of the lake just prior to the onset of stratification (usually 10 to 15°C or 50 to 60°F).
Cape Cod Pond and Lake Atlas May, 2003 2
This lower layer is called the hypolimnion. The transition zone between these two layers, where temperature changes rapidly with changes in depth, is called the metalimnion (Figure 1).
As temperatures cool in the fall, the stratification begins to weaken because the
temperature in the epilimnion begins to drop and the temperature difference between the upper and lower layers becomes smaller. Eventually the normal winds disrupt the stratification and the lake returns to a well mixed water column again. A variety of species utilize the temperature and water quality differences between the layers during stratification. The cooler waters can hold more dissolved oxygen, so fish such as trout, which generally require high oxygen and cooler temperatures, spend more of their time in the hypolimnion. The sediments at the bottom of the hypolimnion are rich in nutrients and usually support catfish and other bottom feeding fish, as well as worms and other creatures living in the sediments. Since rooted aquatic plants and floating algae need light for photosynthesis, they are generally found only in the epilimnion. In shallower ponds, the total volume of the lake is smaller and less wind energy is necessary to keep the lake well mixed. In these ponds, the water column tends to be well mixed throughout the summer and temperature differences remain small between surface and bottom waters.
Although temperature is a key determinant in the amount of oxygen dissolved in lake water, some lakes will have low oxygen conditions in their deeper, cooler waters. This occurs because there is so much organic material (e.g., dead algae or other plant material) in the sediments of the lake, that the bacteria decomposing or breaking down the material is taking oxygen out of the lake water above the sediments. These bacteria respire just like humans and take in oxygen and produce carbon dioxide. If there are sufficient organic materials in the pond, the bacterial population can create anoxic conditions (i.e., usually defined as dissolved oxygen concentrations less than 1 part per million (ppm)). Since fish also need oxygen from the water, anoxic conditions will cause them to swim to areas where oxygen is more plentiful. However, if they are a cool water fish, like trout, their habitat has effectively disappeared. If anoxic conditions occur rapidly, all the fish in that portion of the lake can be killed. Anoxic or low
Figure 1.
Generalized Pond Temperature Stratification
Cape Cod Pond and Lake Atlas May, 2003 3
oxygen (i.e., hypoxic) conditions can occur in any lake, regardless of depth. Shallow lakes can have well mixed conditions, but if the organic load in the sediments is sufficient, oxygen concentrations can be low.
Plants in ponds can be free-floating algae (i.e., phytoplankton) or rooted aquatic plants. As the population of plants grows and dies over a series of years, the leftover plant material or detritus falls to the bottom of ponds and is degraded by bacteria. This material usually gathers in the deepest portions of pond and continues to degrade. The accumulation of this material forms the sediments. In ponds with stream inputs, the streams can also be sources of sediment materials.
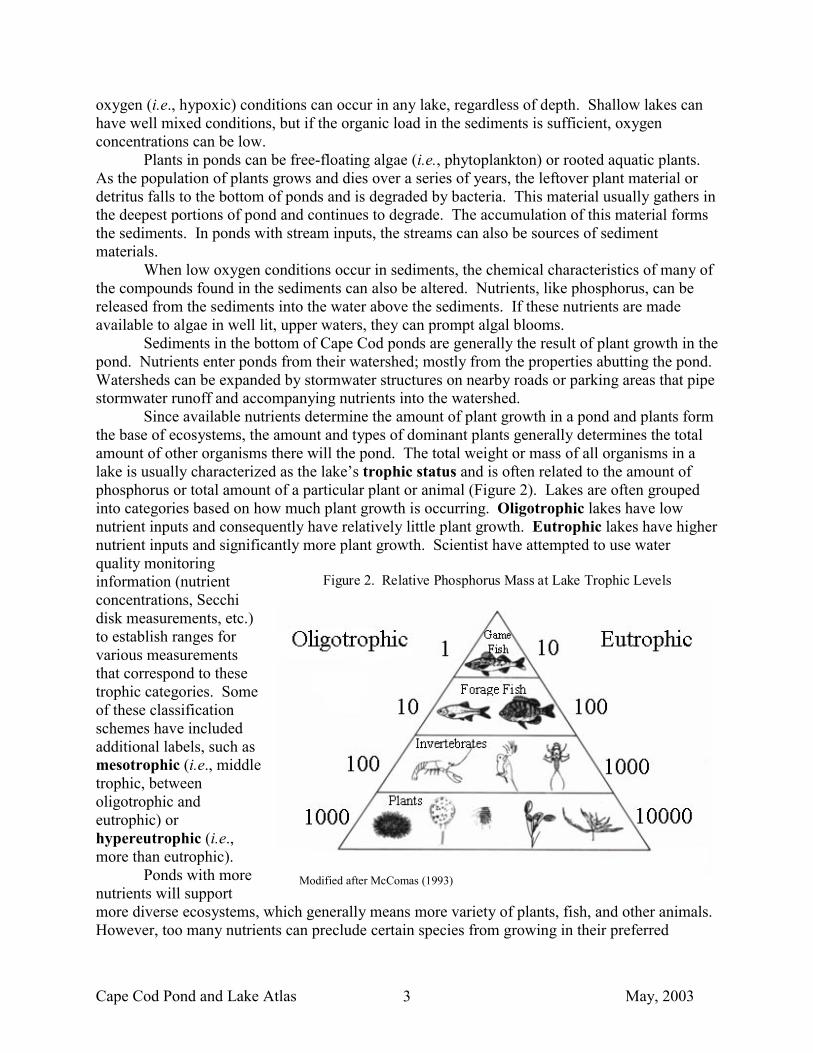
When low oxygen conditions occur in sediments, the chemical characteristics of many of the compounds found in the sediments can also be altered. Nutrients, like phosphorus, can be released from the sediments into the water above the sediments. If these nutrients are made available to algae in well lit, upper waters, they can prompt algal blooms. Sediments in the bottom of Cape Cod ponds are generally the result of plant growth in the pond. Nutrients enter ponds from their watershed; mostly from the properties abutting the pond. Watersheds can be expanded by stormwater structures on nearby roads or parking areas that pipe stormwater runoff and accompanying nutrients into the watershed. Since available nutrients determine the amount of plant growth in a pond and plants form the base of ecosystems, the amount and types of dominant plants generally determines the total amount of other organisms there will the pond. The total weight or mass of all organisms in a lake is usually characterized as the lake’s trophic status and is often related to the amount of phosphorus or total amount of a particular plant or animal (Figure 2). Lakes are often grouped into categories based on how much plant growth is occurring. Oligotrophic lakes have low nutrient inputs and consequently have relatively little plant growth. Eutrophic lakes have higher nutrient inputs and significantly more plant growth. Scientist have attempted to use water quality monitoring information (nutrient concentrations, Secchi disk measurements, etc.) to establish ranges for various measurements that correspond to these trophic categories. Some of these classification schemes have included additional labels, such as mesotrophic (i.e., middle trophic, between oligotrophic and eutrophic) or hypereutrophic (i.e., more than eutrophic). Ponds with more nutrients will support more diverse ecosystems, which generally means more variety of plants, fish, and other animals. However, too many nutrients can preclude certain species from growing in their preferred
Figure 2. Relative Phosphorus Mass at Lake Trophic Levels
Modified after McComas (1993)
Cape Cod Pond and Lake Atlas May, 2003 4
portion of a pond. As mentioned previously, trout prefer colder water that is usually found in the hypolimnion of stratified lakes, but too many nutrients can produce too much decaying plant matter or detritus in the sediments and lead to anoxic conditions. Since trout need oxygen to survive, they cannot live in their preferred, colder portion of the lake. Because of this relationship, more oligotrophic ponds tend to be better fisheries for trout. Phosphorus is the key nutrient in ponds and lakes because it is usually more limited in freshwater systems than nitrogen. Typical plant organic matter contains phosphorous, nitrogen, and carbon in a ratio of 1 P:7 N:40 C per 500 wet weight (Wetzel, 1983). Therefore, if the other constituents are present in excess, phosphorus, as the limiting nutrient can theoretically produce 500 times its weight in algae. Because it is more limited, 90% or more of the phosphorus occurs in organic forms (plant and animal tissue or plant and animal wastes) and any available inorganic phosphorus (mostly orthophosphate (PO4
-3)) is quickly reused by the biota in the lake (Wetzel, 1983). Much research has been directed towards trying to determine the most important phosphorus pool for determining the overall productivity of lake ecosystems, but to date most of the work has found that a measure of total phosphorus is the best predictor of productivity of lake ecosystems (Vollenweider, 1968).
While the pond ecosystems on Cape Cod are similar to pond ecosystems seen in other parts of the country, there are niches within Cape pond ecosystems that are somewhat unique. Two of these niches are the naturally low pH (acidic) condition of Cape Cod’s waters and the water table fluctuation zone around Cape Cod ponds. Because the Cape is largely composed of sand carried and deposited here by the glaciers, there are no carbonate-based rocks (e.g., limestone) available to provide carbon to buffer the natural acidity of rainwater. Water in equilibrium with the carbon dioxide in the atmosphere has an acidic pH of 5.65; pH above 7 is basic, below 7 is acidic. As precipitation falls on the Cape, it may pick up some buffering capacity as it moves through the root zone of plants as it recharges the aquifer. Available groundwater data generally shows pH on Cape Cod between 6 and 6.5; Frimpter and Gay (1979) sampled groundwater from 202 wells on Cape Cod and found a median pH of 6.1. The plants and animals in Cape Cod ponds have developed in this low pH, acidic environment.
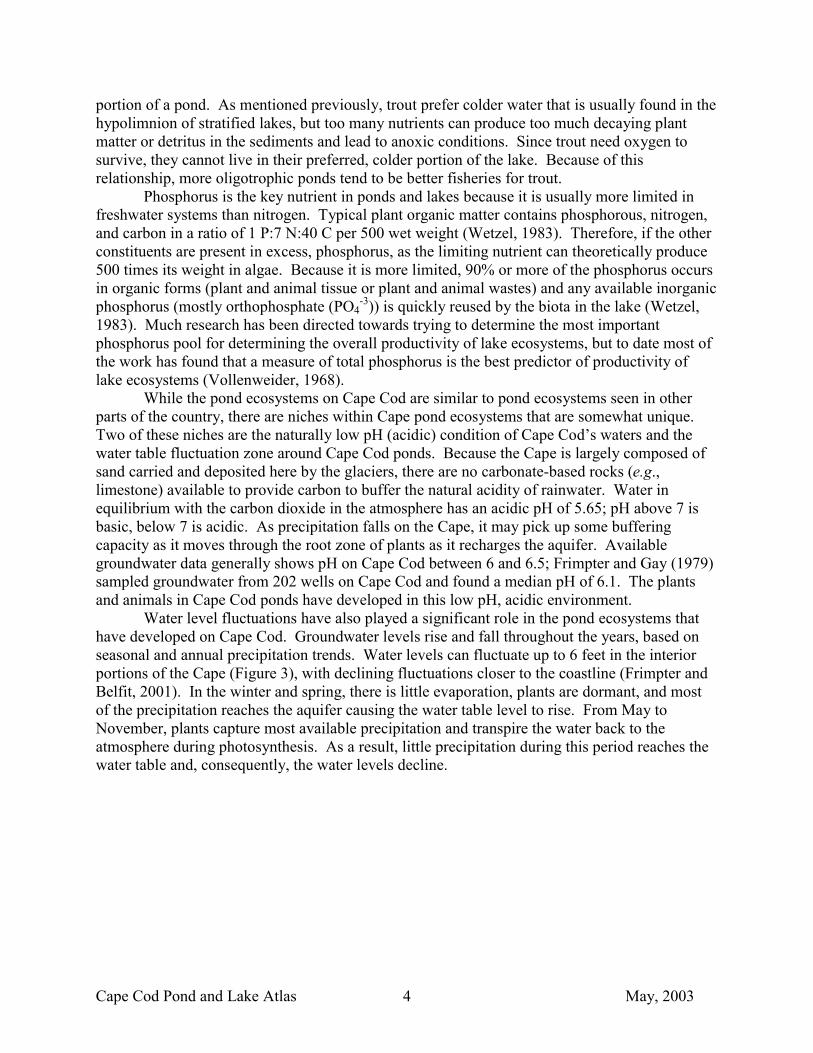
Water level fluctuations have also played a significant role in the pond ecosystems that have developed on Cape Cod. Groundwater levels rise and fall throughout the years, based on seasonal and annual precipitation trends. Water levels can fluctuate up to 6 feet in the interior portions of the Cape (Figure 3), with declining fluctuations closer to the coastline (Frimpter and Belfit, 2001). In the winter and spring, there is little evaporation, plants are dormant, and most of the precipitation reaches the aquifer causing the water table level to rise. From May to November, plants capture most available precipitation and transpire the water back to the atmosphere during photosynthesis. As a result, little precipitation during this period reaches the water table and, consequently, the water levels decline.
Cape Cod Pond and Lake Atlas May, 2003 5
In general, water levels in kettle ponds are similar to levels in the surrounding groundwater. Changes in the water table level can be seen directly by looking at a kettle pond. This is most noticeable by looking at the size of the shoreline beaches. The beaches become larger during times of low water and become smaller and sometimes disappear altogether during years with above average precipitation. The size of the beach is also directly related to the nearshore bathymetry (or bottom elevations) of the pond.
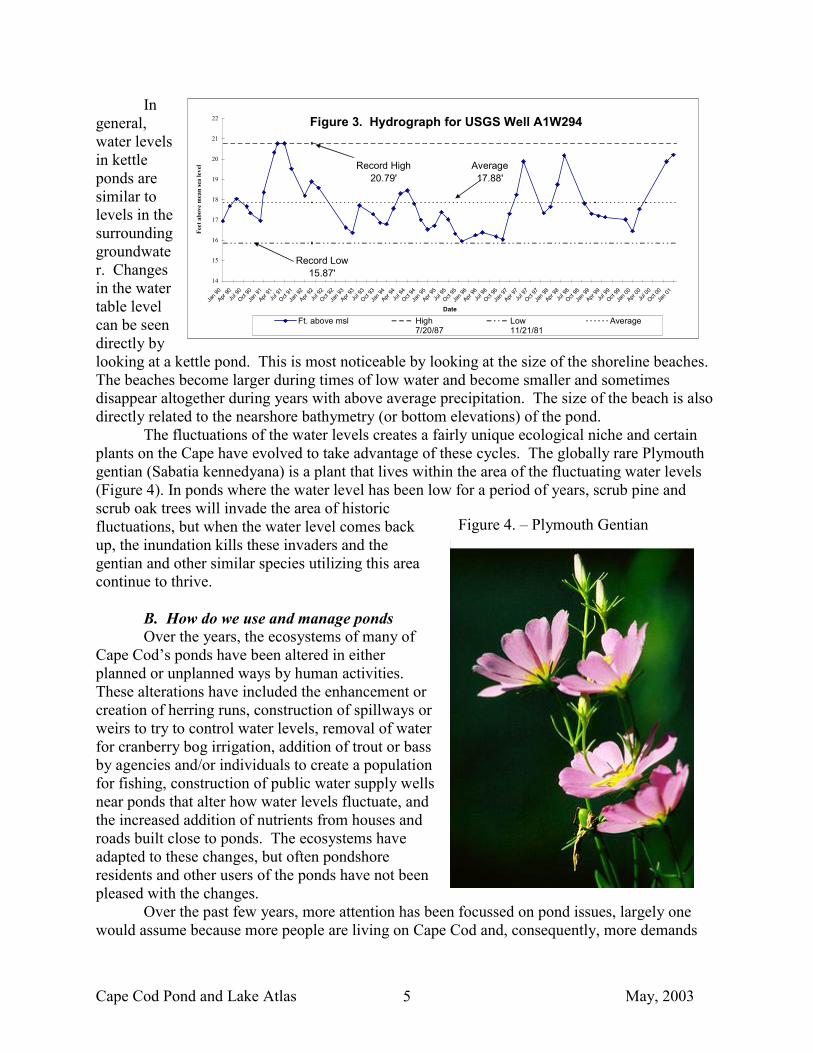
The fluctuations of the water levels creates a fairly unique ecological niche and certain plants on the Cape have evolved to take advantage of these cycles. The globally rare Plymouth gentian (Sabatia kennedyana) is a plant that lives within the area of the fluctuating water levels (Figure 4). In ponds where the water level has been low for a period of years, scrub pine and scrub oak trees will invade the area of historic fluctuations, but when the water level comes back up, the inundation kills these invaders and the gentian and other similar species utilizing this area continue to thrive.
B. How do we use and manage ponds Over the years, the ecosystems of many of Cape Cod’s ponds have been altered in either planned or unplanned ways by human activities. These alterations have included the enhancement or creation of herring runs, construction of spillways or weirs to try to control water levels, removal of water for cranberry bog irrigation, addition of trout or bass by agencies and/or individuals to create a population for fishing, construction of public water supply wells near ponds that alter how water levels fluctuate, and the increased addition of nutrients from houses and roads built close to ponds. The ecosystems have adapted to these changes, but often pondshore residents and other users of the ponds have not been pleased with the changes.
Over the past few years, more attention has been focussed on pond issues, largely one would assume because more people are living on Cape Cod and, consequently, more demands
Figure 4. – Plymouth Gentian
Figure 3. Hydrograph for USGS Well A1W294
14
15
16
17
18
19
20
21
22
Jan 9
0
Apr 90
Jul 9
0
Oct 90
Jan 9
1
Apr 91
Jul 9
1
Oct 91
Jan 9
2
Apr 92
Jul 9
2
Oct 92
Jan 9
3
Apr 93
Jul 9
3
Oct 93
Jan 9
4
Apr 94
Jul 9
4
Oct 94
Jan 9
5
Apr 95
Jul 9
5
Oct 95
Jan 9
6
Apr 96
Jul 9
6
Oct 96
Jan 9
7
Apr 97
Jul 9
7
Oct 97
Jan 9
8
Apr 98
Jul 9
8
Oct 98
Jan 9
9
Apr 99
Jul 9
9
Oct 99
Jan 0
0
Apr 00
Jul 0
0
Oct 00
Jan 0
1
Date
Feet
abo
ve m
ean
sea
leve
l
Ft. above msl High7/20/87
Low11/21/81
Average
Record High20.79'
Record Low15.87'
Average17.88'
Cape Cod Pond and Lake Atlas May, 2003 6
are being placed on the pond resources. Local Cape Cod newspapers have described concerns over rising and falling water levels, algal blooms, and fish kills. Public debates about permitting of public drinking water supply and golf course irrigation wells and their impact on nearby pond levels and discussions about conflicts between swimmers and watercraft users have also generated newspaper articles. The public attention has often led to the creation of watershed or pond associations by concerned citizens and subsequent management action by a town agency to resolve the issues of concern.
In order to understand what management options can be used on ponds, some understanding of the legal issues surrounding some of the options is necessary. Ponds of a certain area are “waters of the Commonwealth of Massachusetts” and, therefore, are owned by the public. The area of these “Great Ponds” is either 20 acres or 10 acres depending on which portion of Massachusetts General Law is reviewed (Chapter 131, Section 1 or Chapter 91, Section 35, respectively). In 1933, the legislature designated 164 Great Ponds on Cape Cod. Analysis of 1994 aerial photos reviewed for this Atlas show 165 ponds of 10 acres or more on Cape Cod.
Because these ponds are public resources, substantial activities on, in, or near them, including adopting local bylaws, generally require some sort of public notice and discussion by a government agency, like a local conservation commission or the state Department of Environmental Management. For example, the building of a new permanent dock requires a Chapter 91 license from the local conservation commission, but depending on the impact could also be reviewed by the state Department of Environmental Protection. This need for public participation in the review of changes to the characteristics (e.g., pond levels) or use (e.g., horsepower limitations on watercraft) of ponds generally ensures that decisions regarding ponds are subject to public discussion.
However, much of the public concerns about ponds are the result of decisions that occurred long before the current regulatory system was developed. In the past, road stormwater structures often discharged directly into ponds, septic systems for seasonal homes were built 10 to 20 feet from the pond shoreline to save on excavation costs, and natural pondshore vegetation was destroyed in order to extend lawns or improve access to the pond. Much of the current concerns raised about Cape Cod ponds, especially in the area of water quality, are the result of impacts caused by decisions like these made in the during the past 50 years.
As the study of lakes, the field of limnology, has advanced, science has provided details about the impacts of these decisions and, more importantly, translation of the science into potential activities to repair and prevent impairments of lake ecosystems. Some local bylaws have required naturally vegetated buffers to decrease or eliminate nutrient-laden stormwater or lawn runoff. Alum or other sequestering agents has been added to ponds to cover the sediments and prevent internal regeneration of nutrients from pond sediments. Plant harvesters have been developed to remove excessive growth of aquatic vegetation and the nutrients which could be released from them as they decay. Chemists have developed herbicides that target specific invasive plant species. Some state regulations and laws have required the production of detergents with lowered amounts of phosphorus.
In order to determine which of these activities are most appropriate for a given problem, scientist have to gain a better understanding of a particular lake and the problem. This information is obtained through a refined assessment of the pond. In order to conduct such a study, funds need to be provided to hire someone who is appropriately trained to gather or direct
Cape Cod Pond and Lake Atlas May, 2003 7
the gathering of the information to complete the characterization. Since the ponds are public resources, obtaining funding usually has to occur through a town or state agency.
Finding funding for these assessments is usually an obstacle to their completion. Town budgets are usually more constrained than state budgets for obtaining funds for pond assessments. Current state programs providing funding for a lake assessment are: 1) the Department of Environmental Management (DEM) Lake and Ponds Program, 2) the Department of Environmental Protection (DEP) Section 604(b) Water Quality Management Planning Grant Program, 3) the DEP Section 319 Nonpoint Source Competitive Grant Program, and 4) the DEP Section 104(b)(3) Water Quality and Wetland Program. The DEP listed sources are federal funds directed to DEP for administration of the Clean Water Act. Most lake assessments completed on Cape Cod were funded under Section 314 of the Clean Water Act, which currently does not have a budget at the federal level.
Each of the available funding programs has criteria that may limit its potential use for completing lake assessments. Among the criteria that are reviewed for applications under the DEM program are: 1) a maximum of 50% of the total project cost, up to $25,000 will be provided by DEM, 2) public access to the pond must be available to any resident of the Commonwealth, and 3) the body of water must be publicly owned. The DEP 604(b) Program requirements include that proposed projects support current DEP assessment priorities and that the project meets federal affirmative action procurement requirements. The 604(b) program does not require a match and eligible respondents include regional planning agencies, councils of governments, conservation districts, counties, cities and towns, and other substate planning agencies and interstate agencies. The DEP 319 Program focuses on implementation of assessment recommendations, includes a requirement for a 40% non-federal match, and is available to any interested Massachusetts public or private organization. Funding under the 104(b)(3) program is available on a competitive basis to state environmental agencies and requires a non-federal match of 25% of the total project cost. Recent examples of the use of state funding for lake projects on the Cape include: 1) the Management Study of Long Pond, Brewster and Harwich (ENSR, 2001), funded using 604b grant funds through the Cape Cod Commission and 2) the Baker Pond Water Quality Assessment, Orleans (Eichner, et al., 2001), funded using DEM Lake and Pond Program funds.
Lake assessments may be completed to address any number of problems. There are a number of management issues that are somewhat related, but often have their own special concerns. Four of these issues are briefly discussed below. 1. Land Use
As the study of lakes and their water quality has advanced, the impact of nearby land uses on pond water quality has been clearly established. Sand has an iron coating that naturally binds phosphorus, so the Cape has a relative advantage for dealing with phosphorus loads coming from septic systems, lawns, and runoff. However, if the phosphorus flows directly into a lake, the filtering capacity of our sands are negated.
Humans annually produce about 2 pounds of phosphorus, which is reduced between 50 and 90% by sand around leachfields of conventional Title 5 septic systems (MEDEP, 1989; McComas, 1993). However, once all the phosphorus binding sites are occupied, the phosphorus can flow with the groundwater and eventually discharge into a pond (Robertson, et al., 1998).
In order to address this, a number of recommendations have been made regarding leachfield setbacks from pond shores to maximize the adsorption of phosphorus and minimize

Cape Cod Pond and Lake Atlas May, 2003 8
the amount getting into ponds. Through the Clean Lakes Program, USEPA recommended a 100 meter setback for leachfields. This recommendation has been translated into 300 ft setbacks, which has been incorporated into the county’s Regional Policy Plan (CCC, 1991, 1996, 2002) and a number of the town’s Local Comprehensive Plans.
Although the circumstances of each lake are different, usually a greater concern for phosphorus entering ponds is lawn fertilizers. Conventional fertilizers contain the nutrients nitrogen, phosphorus, and potassium, the ratio of which is usually shown on the packaging (e.g., 14-3-6, which would be 14 parts nitrogen, 3 parts phosphorus, 6 parts potassium). Using this example ratio, about 0.26 pounds of phosphorus would be applied annually to a 5,000 ft2 lawn. This load is roughly equivalent to the load expected from one septic system. If a higher phosphorus ratio fertilizer is utilized and the load is not utilized by the grass or runs off the lawn in a rainstorm, the load from a lawn can easily surpass the load from a septic system.
In order to address these potential ecological problems, management recommendations for near shore lawns have included avoiding or limiting phosphorus containing fertilizers, designing steeper slopes to encourage runoff infiltration, winding paths to shore, limiting lawn areas, and maintaining natural vegetated buffers between lawn areas and pondshores. Figure 5 shows examples of good and poor shoreline landscaping practices.
Figure 5. Nearshore Landscaping and Buffers
Photos courtesy of Ken Wagner, ENSR Road runoff is another source of nutrients entering ponds. As mentioned previously,
ponds are often a low point in the topography, so past road design included runoff directly into ponds or down steep banks to ponds. Although there are still some problems areas, towns have included better treatment of stormwater as a key design component in parking lot and road design, DEP has adopted a stormwater design policy (DEP, 1997), which includes best management practices, and towns have been encouraging Mass Highway to address runoff to surface waters on state roads. Together, these land use management practices have led to greater protection of pond water quality. However, altering existing development to address these practices often creates difficulties that are expensive or hard to implement. In addition, historic activities on or near lakes, often with very high nutrient loads (e.g., keeping large numbers of domesticated duck and geese on Hamblin Pond in Barnstable) have often left a legacy of excessive nutrients. Establishing options to improve or protect water quality is part of pond management plans, which establish usually establish a number of decisions that could be taken in or around a
Good Landscaping/ Natural Buffer
No Buffer/Lawn to Edge of Pond
Cape Cod Pond and Lake Atlas May, 2003 9
pond and their associated costs (e.g., ENSR, 2001). Development of these plans allows communities to make reasoned decisions about management of these resources rather than the past practices that did not consider pond water quality in land use decisions. 2. Fisheries
Ponds have been actively managed for fisheries far longer than any other pond management concerns. Given that many of the ponds on the Cape have neither a stream inlet or outlet, it is possible that many of these ponds had no fish in them during their early development and only developed fisheries as a result of man’s intervention. Common fish currently found in Cape Cod ponds include perch (yellow and white), brown bullhead, pumpkinseed, bass (largemouth and smallmouth), banded killifish, American eel, and alewife.
The Massachusetts Division of Fish and Wildlife in the Department of Fisheries, Wildlife and Environmental Law Enforcement is responsible fish management on Cape Cod, which includes regular stocking and fishing licenses (see www.state.ma.us/dfwele/dfw/dfw_toc.htm). Current efforts in support of sport fishing in freshwater ponds have included stocking of trout and bass.
Of course, focussing on only one aspect of pond management has in the past led to decisions that, in retrospect, do not support good pond ecosystem function. In order to maintain active sport fisheries, past DFW activities have included applying poison (e.g., rotenone and toxaphene) to ponds in concentrations designed kill the entire fish population in order to “reclaim” them for trout fisheries. Hathaway Pond in Barnstable, for example, has been “reclaimed” seven times: 1952, 1956, 1962, 1967, 1969, 1971 and 1973. Other fisheries activities have included applying fertilizer (1956-1957, Edmunds Pond in Bourne) and digging of herring runs (1867, Lake Wequaquet in Barnstable). DFW staff are currently involved in an effort to document the fisheries management history of ponds that are now actively managed. Because of the long history of management of many of the Cape’s ponds, individual pond assessments should always include a review of DFW files.
3. Watersheet Management Pond surfaces are used for many activities: fishing, swimming, and a variety of different types of boating. Some of these uses will necessarily conflict with others (e.g., swimmers and boaters). Over a period of time, most lake communities and states have adopted “watersheet” regulations that strive to avoid these conflicts; for example, boaters needing to keep a specified distance from swimmers. Another example of these types of regulations are the horsepower restrictions that many Cape towns on specified ponds. Recent conflicts on the Cape have also arisen over the use of personal watercraft (i.e., jetskis). As the population on the Cape continues to grow, it is likely that additional conflicts will develop over the use of pond surfaces.
II. Cape Cod Pond and Lake Stewards (PALS) The Cape Cod Pond and Lake Stewards (PALS) program is working to bring the
management and water quality concerns together with pond-specific information and includes: 1) involving motivated citizens in the collection of water quality information and advocacy for the ponds that they care about, 2) government environmental agencies and universities providing technical assistance to correctly collect and interpret the water quality and pond watershed information and consider various pond management scenarios, and 3) non-governmental agencies providing citizens with organizational assistance to form lake associations and other
Cape Cod Pond and Lake Atlas May, 2003 10
stewardship entities. The production of this Atlas is a significant milestone in an effort to develop a public stewardship program for the ponds of Cape Cod.
A grant to initiate this program was provided to the Cape Cod Commission by the Massachusetts Executive Office of Environmental Affairs via the Massachusetts Watershed Initiative (MWI). Partners with the Commission in this grant include: the School of Marine Science and Technology at UMASS-Dartmouth, the Compact of Cape Cod Conservation Trusts, the Cape Cod National Seashore, the Association for the Preservation of Cape Cod, the Community Foundation of Cape Cod, the Waquoit Bay National Estuarine Research Reserve, and Cape Cod Community College.
One of the most visible projects under the PALS program have been the “Ponds in Peril” workshops. Three of these workshops, which were held in Dennis (May 2001), Sandwich (November 2001), and Harwich (May 2002), included briefings on pond specific assessments, volunteer pond monitoring, potential funding opportunities, and lake and pond management strategies. Each of the workshops was very well attended and provided opportunities for those concerned about their own pond to learn from experts, share their experiences, and discuss stewardship activities with folks from other ponds. It is hoped that more of these meetings will be possible in the future.
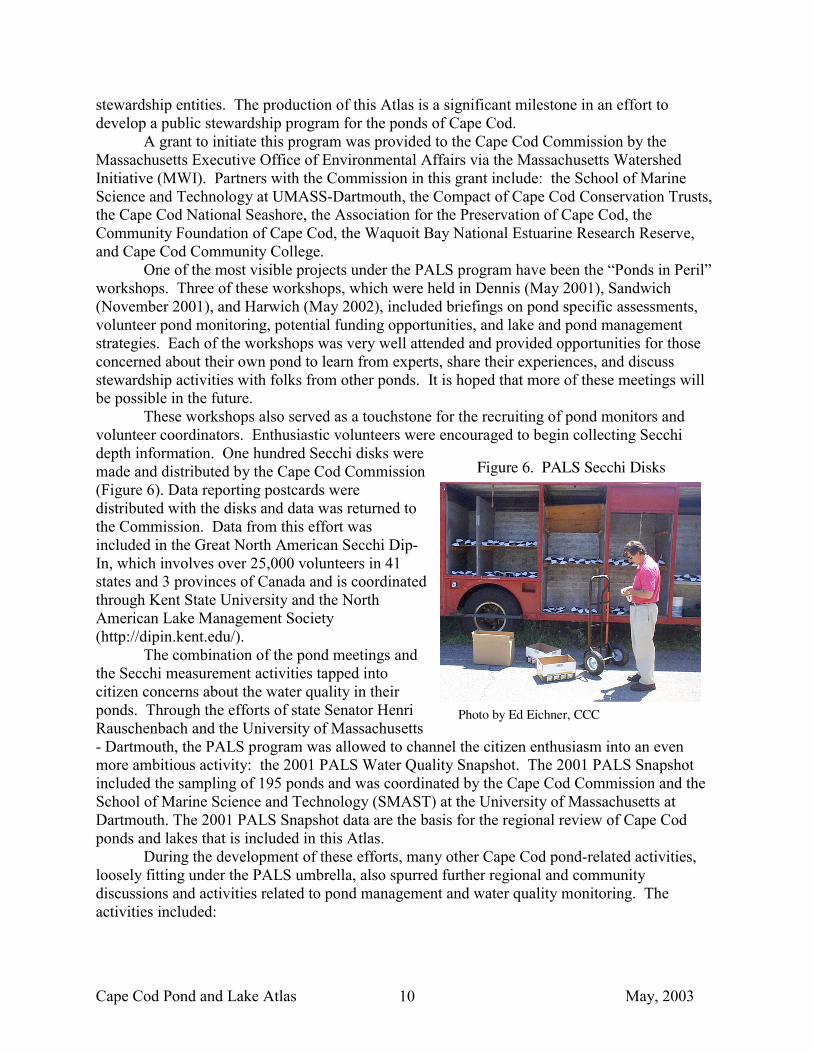
These workshops also served as a touchstone for the recruiting of pond monitors and volunteer coordinators. Enthusiastic volunteers were encouraged to begin collecting Secchi depth information. One hundred Secchi disks were made and distributed by the Cape Cod Commission (Figure 6). Data reporting postcards were distributed with the disks and data was returned to the Commission. Data from this effort was included in the Great North American Secchi Dip-In, which involves over 25,000 volunteers in 41 states and 3 provinces of Canada and is coordinated through Kent State University and the North American Lake Management Society (http://dipin.kent.edu/).
The combination of the pond meetings and the Secchi measurement activities tapped into citizen concerns about the water quality in their ponds. Through the efforts of state Senator Henri Rauschenbach and the University of Massachusetts - Dartmouth, the PALS program was allowed to channel the citizen enthusiasm into an even more ambitious activity: the 2001 PALS Water Quality Snapshot. The 2001 PALS Snapshot included the sampling of 195 ponds and was coordinated by the Cape Cod Commission and the School of Marine Science and Technology (SMAST) at the University of Massachusetts at Dartmouth. The 2001 PALS Snapshot data are the basis for the regional review of Cape Cod ponds and lakes that is included in this Atlas.
During the development of these efforts, many other Cape Cod pond-related activities, loosely fitting under the PALS umbrella, also spurred further regional and community discussions and activities related to pond management and water quality monitoring. The activities included:
Figure 6. PALS Secchi Disks
Photo by Ed Eichner, CCC
Cape Cod Pond and Lake Atlas May, 2003 11
1. The Commission obtained a special grant from the US Environmental Protection Agency to measure mercury concentrations in fish tissue in eight ponds (Michaud, 2001).
2. The Commission provided funding to the Town of Dennis Water Quality Advisory Committee to purchase pond monitoring equipment.
3. Commission staff assisted the Town of Orleans in the completion of monitoring reports for Baker Pond (Eichner, et al., 2001) and Crystal Lake (Orleans Water Quality Task Force, 2001).
4. Under a DEP grant to the Commission, the towns of Brewster and Harwich completed a management plan for Long Pond (ENSR, 2001) to investigate the cost and feasibility of various techniques to improve water quality. An alum treatment was identified as an appropriate activity to reduce in-lake nutrient loads. Subsequently, the 2002 state environmental bond bill passed containing $200,000 to assist the towns in paying for this treatment.
5. The Cape Cod National Seashore Laboratory obtained a grant from the Community Foundation of Cape Cod to provide pond water quality analysis services to Outer Cape towns.
6. The Compact of Cape Cod Conservation Trusts began a project to identify and prioritize parcels around ponds for water quality, wildlife habitat, and recreation purposes.
7. The Cape Cod National Seashore released its Kettle Pond Atlas (Portnoy, et al., 2001a) and accompanying collection of water quality monitoring data from 1975 to 1999 (Portnoy, et al., 2001b).
8. The Community Foundation of Cape Cod creating the Agua Fund program to fund freshwater monitoring activities.
9. An alum treatment to reduce in-lake nutrient loads in Ashumet Pond in Falmouth and Mashpee was successfully completed in September 2001 by the Air Force Center of Environmental Excellence.
All of these activities have brought pond water quality and management issues into
sharper focus for Cape Cod. This atlas builds on these activities and provides both a regional and local basis to help understand where Cape communities should prioritize future efforts.
The funding for this Atlas and the projects leading to its production came from a number of sources. As mentioned previously, the initial funding was provided via MWI funds from the MA Executive Office of Environmental Affairs. Subsequent funding was provided by Community Foundation of Cape Cod. The water quality analyses that form the base of the pond reviews in this Atlas could not have been completed without funding from the University of Massachusetts at Dartmouth, School of Marine Science and Technology to provide new water quality information. Aside from providing the funding for this Atlas, these funds and the efforts of all involved have created a better informed citizenry with better opportunities to make more informed decisions about land uses and wastewater treatment that may impact pond water quality.
A. Regional Pond Water Quality Analysis The 2001 PALS Water Quality Snapshot dataset is the most comprehensive regional
water quality assessment of Cape Cod pond water quality ever created. In order to maximize the use of this dataset, additional information about each individual pond also needs to be considered along with the water quality information. This additional information includes: physical
Cape Cod Pond and Lake Atlas May, 2003 12
features of the ponds (e.g., size, depth, watershed), historic water quality data, and current and past land use information. Continuation of the PALS program offers the opportunity to address the protection of all Cape Cod ponds by bringing together all the pertinent information for each individual pond.
1. Past Reviews
A handful of Cape Cod ponds have been subject to so-called “diagnostic feasibility studies,” where water quality data is combined with physical data to review potential options to address water quality problems (e.g., ENSR, 2001; BEC, 1993). However, regional reviews of Cape-wide pond water quality have been even more limited.
During July and August 1948, the state Division of Fisheries and Game (DFG) collected depth, dissolved oxygen, temperature, pH, methyl orange alkalinity, plankton, and transparency data for 51 Cape Cod ponds. The data is presented in DFG (1948), but is not interpreted save for whether “trout water” is available.
During 1969, J.A. McCann completed an inventory of all ponds and lakes in Barnstable County over five acres or identified on US Geological topographic maps. This inventory includes the review of aerial photographs taken during the spring of 1965 and concludes that there are 356 ponds, 206 of which could be classified as Great Ponds (>10 acres). This review includes classification of access, mean and maximum depth, whether the pond was stocked, land use of the shoreline, and a subjective evaluation of use, but does not contain water quality data except for some limited Secchi readings. No interpretation or synthesis of the information is presented.
During the mid-1970’s, Environmental Management Institute (EMI, 1976) was hired to complete a special study of the Cape Cod ponds in support of the 208 Wastewater Management Study (CCPEDC, 1978). This study included sampling of 152 ponds from a helicopter between September 2 and September 6, 1975. The report also mentions “winter” sampling January 20 and April 13, 1976, but it is unclear whether this sampling also involved use of a helicopter. Standard sampling procedure for the helicopter sampling included: 1) hovering above the pond and taking a color photograph, 2) landing at a sampling point and collecting a dissolved oxygen and temperature profile to the bottom, and 3) collecting a water sample one foot below the surface. Samples were analyzed for ammonia-nitrogen, nitrate-nitrogen, ortho-phosphorus, sodium, calcium, potassium, iron, manganese, mercury, magnesium, copper, arsenic, selenium, cadmium, chromium, lead, zinc, nickel, chlorophyll a, chloride, pH, conductivity, and alkalinity.
Limited data review is provided in the EMI (1976) report, but the helicopter sampling method calls into question how representative the sampling results are. Based on airflow calculations at www.bellhelicopter.textron.com, a 3,000 pound helicopter with a 33.3 ft rotor (a Bell model 206 helicopter) would force 1,450,000 ft3 of air per minute through the rotor while hovering (Figure 7). Given the density of air, 58.5 tons of air per minute would be forced down onto the lake surface while the helicopter hovered. This mass would displace an equivalent mass of water. In smaller lakes, the displacement could cause significant mixing and introduction of oxygen throughout the volume of water when the sampling would occur. In larger lakes, the displacement would be a smaller percentage of the volume of the lake, but the localized oxygenation might still be a cause for concern since many of the chemicals analyzed from the pond samples are sensitive to changes in oxygen concentrations (e.g., higher oxygen concentrations cause ammonia-nitrogen to be converted to nitrate-nitrogen). It is unclear how much the sampling method might have impacted the water quality results in the 1976 study.
Cape Cod Pond and Lake Atlas May, 2003 13
Ahrens and Siver (2000) collected samples at 1 m depth from 60 ponds three times between October 1996 and July 1998. Secchi disk depths and 1 m increment profiles of specific conductivity were also collected in the field. Water samples were analyzed for pH, alkalinity, total phosphorus, total nitrogen, sulfate (SO4
-), potassium(K+), sodium (Na+), calcium (Ca+2), magnesium (Mg+2), and chlorophyll-a. Analysis of the sampling results looks at the ponds Cape-wide and by various portions of the Cape (i.e., “Forearm, Bicep, Elbow, and Provincetown”). This analysis generally focussed on the acidity, ionic balance, and trophic characteristics and found that: 1) the percentage of acidic lakes on Cape Cod was greater than other regions in eastern North America, 2) that sodium and chloride (i.e., the constituents of table salt) were the dominant cation and anion species, and 3) that Forearm (Wellfleet and Truro) lakes were generally the least productive, although differences between the regions were “slight”. Ahrens and Siver (2000) concluded the analysis with the following: “The lakes of Cape Cod are rather unique and different from lakes in other regions in the eastern U.S. They are very acidic, poorly buffered, oligotrophic, and have high sodium, chloride, and magnesium concentrations.” 2. 2001 PALS Water Quality Snapshot
Between August 15 and September 30, 2001, volunteers collected 421 water quality samples from 195 ponds; at least one pond was sampled in each of the fifteen Cape Cod towns. This sampling followed a sampling protocol developed jointly by the Cape Cod Commission and the School of Marine Science and Technology (SMAST) at the University of Massachusetts at Dartmouth. The collected samples were analyzed at the SMAST lab for: 1) pH, 2) alkalinity, 3) chlorophyll a, 4) phaeophytins, 5) total phosphorus, and 6) total nitrogen. The Commission provided logistical support for the effort, including: developing the lists of ponds to sample, ensuring adequate training of volunteers, locating sampling points, distributing sample bottles, transporting collected samples, and recruiting town coordinators. Volunteers also collected dissolved oxygen and temperature profiles at each pond, as well as a Secchi disk depth measurement. A field sampling sheet from the 2001 sampling season is included in Appendix A. SMAST also provided funding for by a 2002 Snapshot; the results of which should be available in Spring 2003.
The Commission and SMAST built on the volunteer network developed as a result of the Secchi Dip-In program and recruited town coordinators to assist in the timing of sample collection. A variety of coordination arrangements with towns were developed in support of the Snapshot; some towns use town staff, some use citizens, and some use both town staff and citizens. These town coordinators have developed into the backbone of the sampling portions of the on-going PALS effort, including the 2002 PALS Snapshot and town-based summer long sampling programs. Table 1 lists the current town pond monitoring coordinators.
Figure 7. Helicopter Impact on Lake Surface
From: www.bellhelicopter.textron.com,
Cape Cod Pond and Lake Atlas May, 2003 14
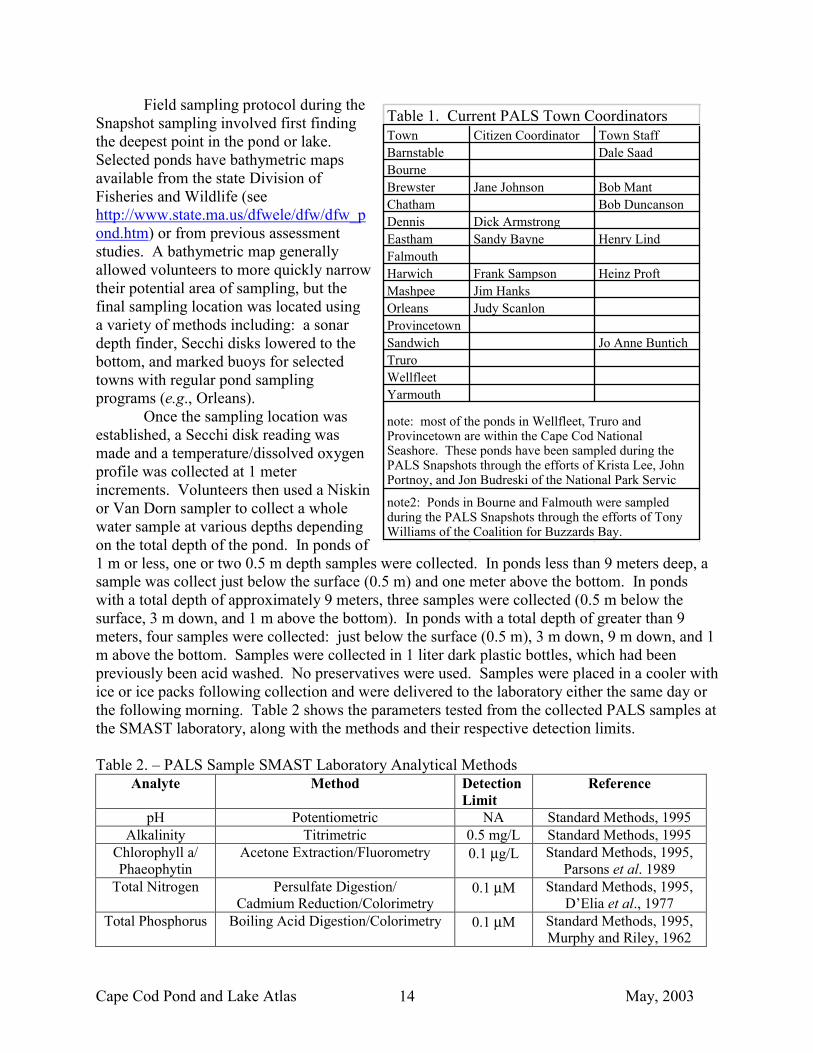
Field sampling protocol during the Snapshot sampling involved first finding the deepest point in the pond or lake. Selected ponds have bathymetric maps available from the state Division of Fisheries and Wildlife (see http://www.state.ma.us/dfwele/dfw/dfw_pond.htm) or from previous assessment studies. A bathymetric map generally allowed volunteers to more quickly narrow their potential area of sampling, but the final sampling location was located using a variety of methods including: a sonar depth finder, Secchi disks lowered to the bottom, and marked buoys for selected towns with regular pond sampling programs (e.g., Orleans).
Once the sampling location was established, a Secchi disk reading was made and a temperature/dissolved oxygen profile was collected at 1 meter increments. Volunteers then used a Niskin or Van Dorn sampler to collect a whole water sample at various depths depending on the total depth of the pond. In ponds of 1 m or less, one or two 0.5 m depth samples were collected. In ponds less than 9 meters deep, a sample was collect just below the surface (0.5 m) and one meter above the bottom. In ponds with a total depth of approximately 9 meters, three samples were collected (0.5 m below the surface, 3 m down, and 1 m above the bottom). In ponds with a total depth of greater than 9 meters, four samples were collected: just below the surface (0.5 m), 3 m down, 9 m down, and 1 m above the bottom. Samples were collected in 1 liter dark plastic bottles, which had been previously been acid washed. No preservatives were used. Samples were placed in a cooler with ice or ice packs following collection and were delivered to the laboratory either the same day or the following morning. Table 2 shows the parameters tested from the collected PALS samples at the SMAST laboratory, along with the methods and their respective detection limits.
Table 2. – PALS Sample SMAST Laboratory Analytical Methods
Analyte Method Detection Limit
Reference
pH Potentiometric NA Standard Methods, 1995 Alkalinity Titrimetric 0.5 mg/L Standard Methods, 1995
Chlorophyll a/ Phaeophytin
Acetone Extraction/Fluorometry 0.1 µg/L Standard Methods, 1995, Parsons et al. 1989
Total Nitrogen Persulfate Digestion/ Cadmium Reduction/Colorimetry
0.1 µM Standard Methods, 1995, D’Elia et al., 1977
Total Phosphorus Boiling Acid Digestion/Colorimetry 0.1 µM Standard Methods, 1995, Murphy and Riley, 1962
Table 1. Current PALS Town CoordinatorsTown Citizen Coordinator Town StaffBarnstable Dale SaadBourneBrewster Jane Johnson Bob MantChatham Bob DuncansonDennis Dick ArmstrongEastham Sandy Bayne Henry LindFalmouthHarwich Frank Sampson Heinz ProftMashpee Jim HanksOrleans Judy ScanlonProvincetownSandwich Jo Anne BuntichTruroWellfleetYarmouth
note2: Ponds in Bourne and Falmouth were sampled during the PALS Snapshots through the efforts of Tony Williams of the Coalition for Buzzards Bay.
note: most of the ponds in Wellfleet, Truro and Provincetown are within the Cape Cod National Seashore. These ponds have been sampled during the PALS Snapshots through the efforts of Krista Lee, John Portnoy, and Jon Budreski of the National Park Servic
Cape Cod Pond and Lake Atlas May, 2003 15
a. Physical Characteristics In order to prepare the PALS sampling lists for volunteers and provide a structure for organizing existing information about the ponds, Commission staff and AmeriCorps volunteers began to gather physical information about the ponds. An unique numbering system for all the freshwater bodies on the Cape was developed; summaries of pond characteristics are included in separate town by town sections at the back of the Atlas. Although water quality is a defining feature of how well pond ecosystems are functioning, physical characteristics of the pond, including its depth, surface area, nearby topography, recharge area, and sediment thickness, also play an important role.
Using a Spring 1994 aerial photo, Commission GIS staff digitized all the surface water features on the Cape. Each water body was assigned a unique number and the area for each surface water body was determined. The numbering system consists of a two letter town code and a unique number for each pond (e.g., SA-431 is Lawrence Pond in Sandwich). This information was then combined in a database with available depth information, including depths determined during the 2001 PALS Snapshot. Development of this information allowed Commission staff to review the areas of all the Cape’s fresh surface waters (Figure 8). Based on this information, there are 994 surface waters on Cape Cod with a total area of 10,453 acres. Forty-four percent (44%) of the 994 ponds on the Cape are less than one acre in area; little is known about these ponds and their functions. Since some of these surface waters likely dry up during low water conditions or even every summer, it raises the question of whether these surface waters are ponds or not.
In order to try to answer this question, dictionaries and available limnology and ecology texts were reviewed for definitions of what constitutes a lake. As mentioned previously, Massachusetts law defines “Great Ponds” and the common practice in the Commonwealth has been to use “lake” and “pond” interchangeably. Merriam-Webster On-line (www.m-w.com) defines a lake as “a considerable inland body of standing water” and defines a pond as “a body of water usually smaller than a lake.” The North American Lake Management Society (www.nalms.org) defines a lake as “a considerable body of inland water or an expanded part of a river” and a pond as “a body of water smaller than a lake, often artificially formed.” These definitions allude to size being a defining characteristic, but do not clarify a dividing line that could be used to separate “ponds” from “lakes.” Review of limnology texts (e.g., Wetzel (1983) and Horne and Goldman (1994)) do not offer definitions of lakes. G.E. Hutchinson (1957) treatise on limnology defined 75 different lake types. Given all of this information, the authors suggest that all 994 fresh surface waters should be regarded as “ponds” or “lakes” until a better definition is provided.
Only three ponds of less than one acre were sampled during the 2001 Snapshot with maximum depths of 0.2, 0.87, and 2 meters. Additional aerial photography during various water table conditions might help to clarify how ephemeral many of these small surface waters are. The combined area of these 442 surface waters, however, is less than 2% of the total freshwater surface area on Cape Cod.
In contrast, the 21 largest ponds on the Cape make up 48% of the total freshwater surface area (see Figure 8). Since these large ponds represent the largest proportion of the total pond area, the average pond area is 10.5 acres, but the large number of small ponds causes the median pond area to be only 1.3 acres.
Cape Cod Pond and Lake Atlas May, 2003 17
Figure 9 reviews the same information by town. Barnstable and Falmouth have the greatest number of ponds with 184 and 142, respectively. The largest total area is in Brewster with 2,028 acres of ponds, followed by Barnstable with 1,892 acres. Mashpee has the largest average pond size with 28.8 acres for its 56 ponds, including the large ponds of Mashpee-Wakeby (726 acres), Johns (338 acres), Ashumet (218 acres), and Santuit (171 acres).
Figure 10 combines the areal information with available information about maximum depth. Maximum depth was used because pond-wide bathymetric information is available for only approximately 80 ponds, while the number of ponds with available depth maximum depth readings is 176 ponds. Many of the maximum depth readings are only available because one was collected at the time of the 2001 Snapshot sampling. Because the Snapshot is the source of much of the data, the mean depth (5.88 meters) and median depth (4.08 meters) are likely skewed higher to reflect larger, more easily accessible ponds. Based on this information, the 23% of ponds have a maximum depth between 1 to 3 meters and the thirteen deepest ponds (15-29 m deep) occupy the largest surface area (2,443 acres). b. 2001 PALS Snapshot Water Quality Results
At most of the PALS workshops, folks approached Commission, SMAST, and other expert staff and commonly asked a version of the following question: “Is my pond ok?” That question has driven much of the research that has occurred in the field of limnology, or lake science, for over 100 years. With the collection of the 2001 Snapshot data, we have a better opportunity to answer that question, but we also have to understand the range of what constitutes a “healthy” pond ecosystem.
As mentioned previously, G.E. Hutchison (1957) defined over 75 different types of ponds. The results from Figures 8 and 10 indicate the fairly wide range of physical characteristics of Cape Cod ponds, so even with a common climate and geologic setting, one would expect to see a range of what is “ok.” In order to better answer the question, the authors reviewed the answers that have been developed in other areas of the country.
Project staff begin by reviewing available trophic indices and current efforts to define “unimpacted” ponds. An “index” is a method of assigning a numerical rank to a pond based on a series of parameters. In this fashion, scientists often group lakes into various trophic categories (e.g., oligotrophic, mesotrophic, eutrophic, etc.). Staff then reviewed various efforts to define “reference” lakes or lakes that are “pristine” or unimpacted by human development.
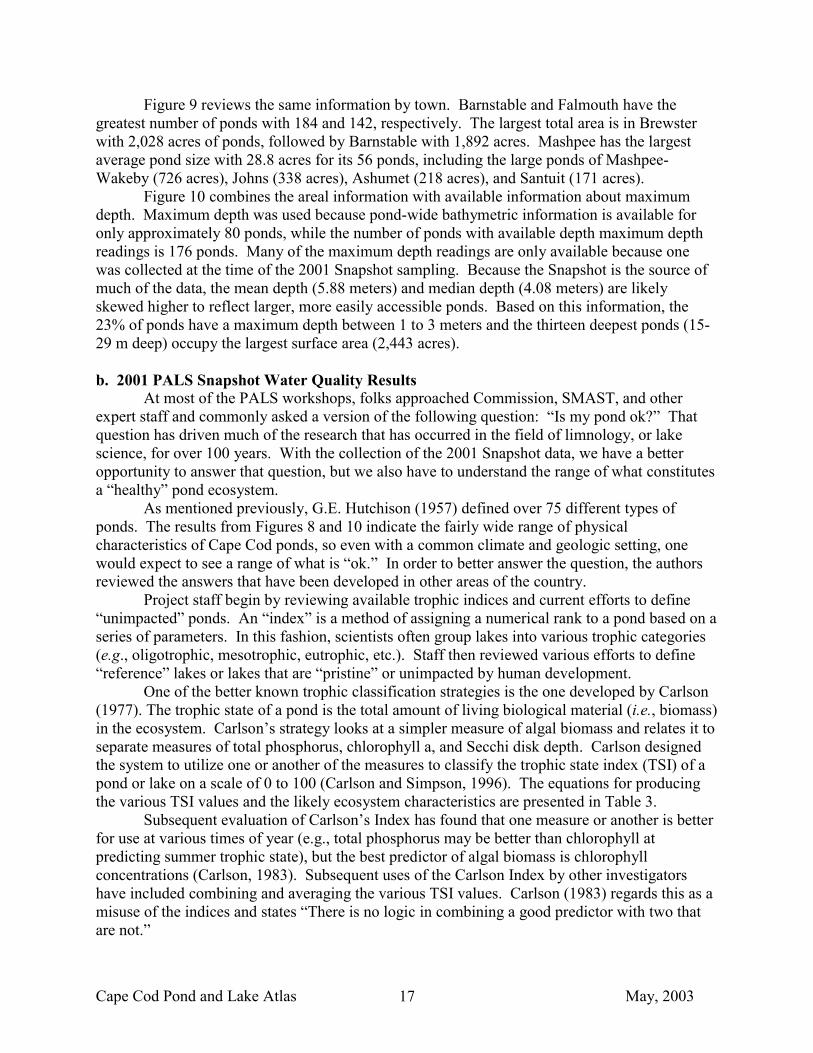
One of the better known trophic classification strategies is the one developed by Carlson (1977). The trophic state of a pond is the total amount of living biological material (i.e., biomass) in the ecosystem. Carlson’s strategy looks at a simpler measure of algal biomass and relates it to separate measures of total phosphorus, chlorophyll a, and Secchi disk depth. Carlson designed the system to utilize one or another of the measures to classify the trophic state index (TSI) of a pond or lake on a scale of 0 to 100 (Carlson and Simpson, 1996). The equations for producing the various TSI values and the likely ecosystem characteristics are presented in Table 3.
Subsequent evaluation of Carlson’s Index has found that one measure or another is better for use at various times of year (e.g., total phosphorus may be better than chlorophyll at predicting summer trophic state), but the best predictor of algal biomass is chlorophyll concentrations (Carlson, 1983). Subsequent uses of the Carlson Index by other investigators have included combining and averaging the various TSI values. Carlson (1983) regards this as a misuse of the indices and states “There is no logic in combining a good predictor with two that are not.”
20
Table 3. – Carlson Trophic State Index (TSI) TSI Calculations TSI(SD) = 60 - 14.41 ln(SD) SD = Secchi disk depth (meters) TSI(CHL) = 9.81 ln(CHL) + 30.6 CHL = Chlorophyll a concentration (µg/L) TSI(TP) = 14.42 ln(TP) + 4.15 TP = Total phosphorus concentration (µg/L) TSI values and likely pond attributes TSI Values
Chl a (µg/L)
SD (m)
TP (µg/L)
Attributes Fisheries & Recreation
<30 <0.95 >8 <6 Oligotrophy: Clear water, oxygen throughout the year in the hypolimnion
Salmonid fisheries dominate
30-40 0.95-2.6 8-4 6-12 Hypolimnia of shallower lakes may become anoxic
Salmonid fisheries in deep lakes only
40-50 2.6-7.3 4-2 12-24 Mesotrophy: Water moderately clear; increasing probability of hypolimnetic anoxia during summer
Hypolimnetic anoxia results in loss of salmonids.
50-60 7.3-20 2-1 24-48 Eutrophy: Anoxic hypolimnia, macrophyte problems possible
Warm-water fisheries only. Bass may dominate.
60-70 20-56 0.5-1 48-96 Blue-green algae dominate, algal scums and macrophyte problems
Nuisance macrophytes, algal scums, and low transparency may discourage swimming and boating.
70-80 56-155 0.25-0.5
96-192 Hypereutrophy: (light limited productivity). Dense algae and macrophytes
>80 >155 <0.25 192-384 Algal scums, few macrophytes
Rough fish dominate; summer fish kills possible
after Carlson and Simpson (1996); Carlson TSI developed in algal dominated, northern temperate lakes
Although the Carlson indices were developed for use in northern temperate lakes and do
not work well in lakes where macrophytes (i.e., rooted aquatic plants) dominate the ecosystem, project staff used the chlorophyll a concentrations from the 2001 Snapshot as one measure of the general trophic state of the Cape’s lakes and ponds (see following sections). Further detailed pond by pond analysis of other measures (e.g., total phosphorus, dissolved oxygen, macrophyte cover, etc.) need to be evaluated to assess the trophic status of an individual lake. It should also be further noted that higher Carlson values do not necessarily mean that the water quality in a pond is “poor”; although water quality and biomass levels are linked, higher biomass levels are valuable for warm water fisheries (e.g., bass) and may be appropriate for shallow, more naturally productive pond ecosystems.
21
Figure 11. – USEPA Subecoregions within Ecoregion 14
from USEPA (2001)
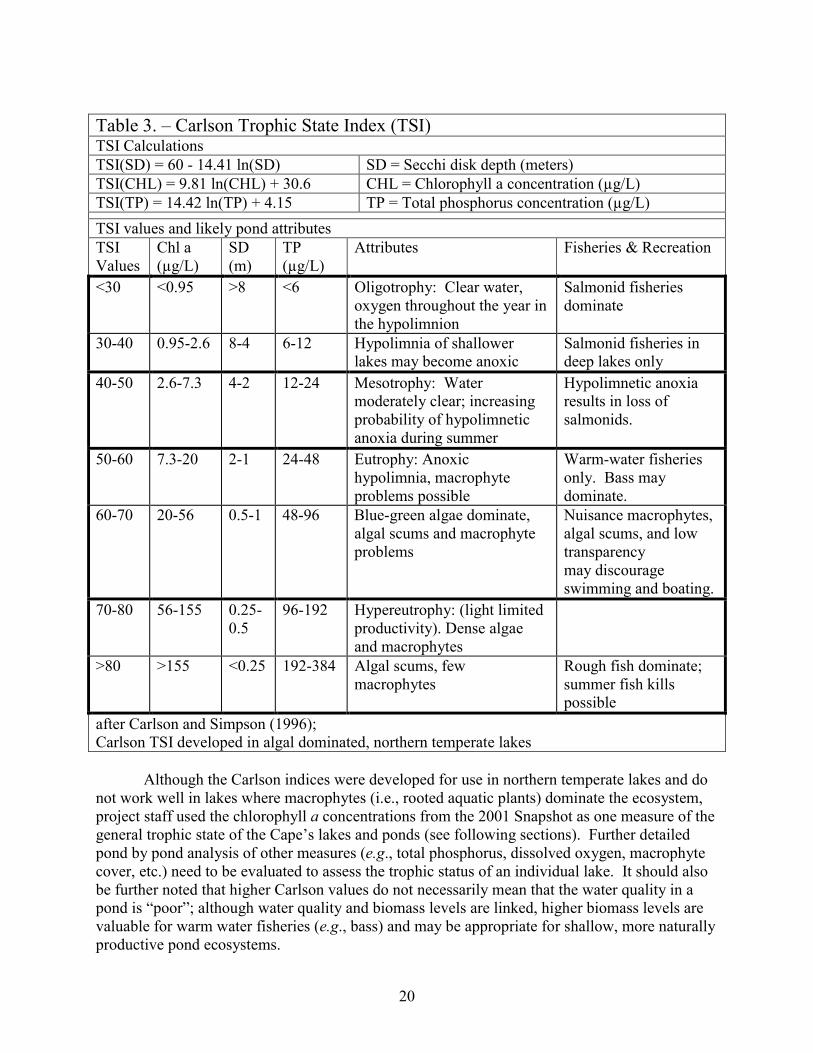
Where the Carlson indices try to establish the trophic level of a pond, the US Environmental Protection Agency (USEPA) has recently been working to characterize “reference” or “unimpacted” conditions in lakes and ponds. This effort, which is being pursued in order to satisfy regulatory provisions under the federal Clean Water Act, is focussed on developing reference criteria for various nutrients in lakes and reservoirs (USEPA, 2000). USEPA has refined this work by dividing the United States into various “ecoregions” and
comparing only ponds and lakes only within these ecologically similar settings. Cape Cod, for example, is located within Ecoregion 14 (“Eastern Coastal Plain’), which extends along the Atlantic Ocean coast from southern Maine to northern Florida and subecoregion 84 (“Atlantic Coastal Pine Barrens”), which includes Nantucket, Martha’s Vineyard, southern New Jersey, Long Island, and portions of Plymouth (Figure 11).
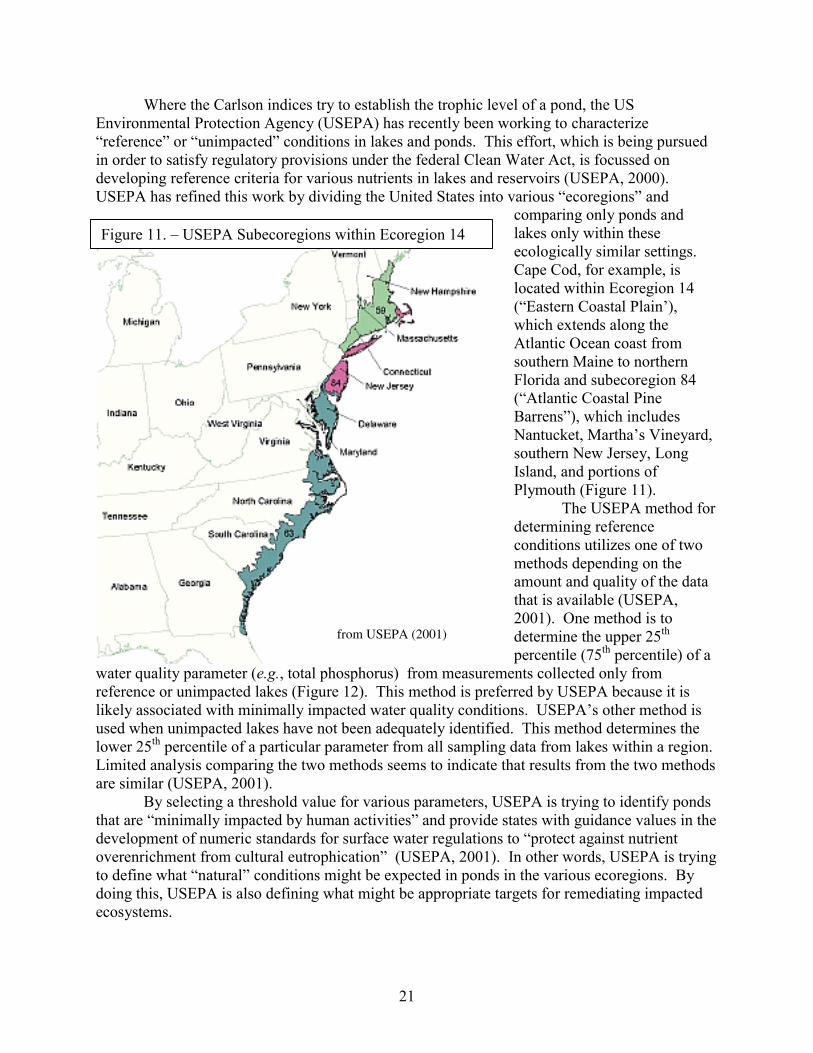
The USEPA method for determining reference conditions utilizes one of two methods depending on the amount and quality of the data that is available (USEPA, 2001). One method is to determine the upper 25th percentile (75th percentile) of a
water quality parameter (e.g., total phosphorus) from measurements collected only from reference or unimpacted lakes (Figure 12). This method is preferred by USEPA because it is likely associated with minimally impacted water quality conditions. USEPA’s other method is used when unimpacted lakes have not been adequately identified. This method determines the lower 25th percentile of a particular parameter from all sampling data from lakes within a region. Limited analysis comparing the two methods seems to indicate that results from the two methods are similar (USEPA, 2001).
By selecting a threshold value for various parameters, USEPA is trying to identify ponds that are “minimally impacted by human activities” and provide states with guidance values in the development of numeric standards for surface water regulations to “protect against nutrient overenrichment from cultural eutrophication” (USEPA, 2001). In other words, USEPA is trying to define what “natural” conditions might be expected in ponds in the various ecoregions. By doing this, USEPA is also defining what might be appropriate targets for remediating impacted ecosystems.
22
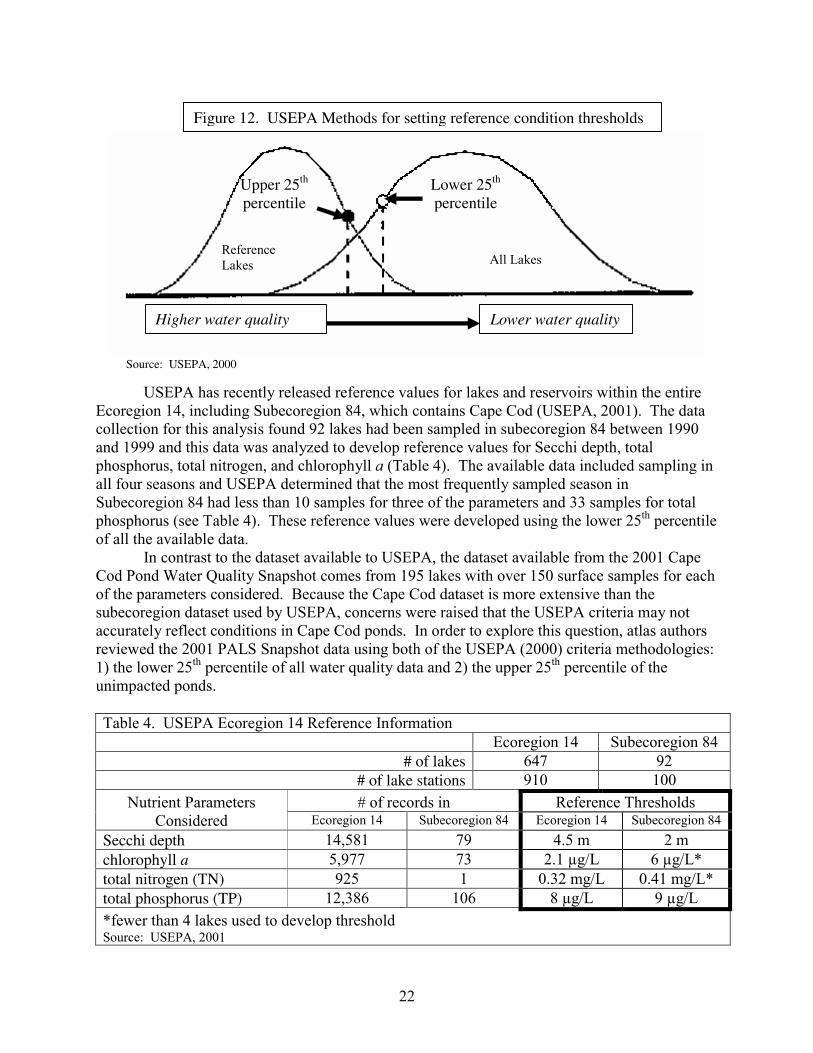
USEPA has recently released reference values for lakes and reservoirs within the entire Ecoregion 14, including Subecoregion 84, which contains Cape Cod (USEPA, 2001). The data collection for this analysis found 92 lakes had been sampled in subecoregion 84 between 1990 and 1999 and this data was analyzed to develop reference values for Secchi depth, total phosphorus, total nitrogen, and chlorophyll a (Table 4). The available data included sampling in all four seasons and USEPA determined that the most frequently sampled season in Subecoregion 84 had less than 10 samples for three of the parameters and 33 samples for total phosphorus (see Table 4). These reference values were developed using the lower 25th percentile of all the available data.
In contrast to the dataset available to USEPA, the dataset available from the 2001 Cape Cod Pond Water Quality Snapshot comes from 195 lakes with over 150 surface samples for each of the parameters considered. Because the Cape Cod dataset is more extensive than the subecoregion dataset used by USEPA, concerns were raised that the USEPA criteria may not accurately reflect conditions in Cape Cod ponds. In order to explore this question, atlas authors reviewed the 2001 PALS Snapshot data using both of the USEPA (2000) criteria methodologies: 1) the lower 25th percentile of all water quality data and 2) the upper 25th percentile of the unimpacted ponds. Table 4. USEPA Ecoregion 14 Reference Information Ecoregion 14 Subecoregion 84
# of lakes 647 92 # of lake stations 910 100 # of records in Reference Thresholds Nutrient Parameters
Considered Ecoregion 14 Subecoregion 84 Ecoregion 14 Subecoregion 84Secchi depth 14,581 79 4.5 m 2 m chlorophyll a 5,977 73 2.1 µg/L 6 µg/L* total nitrogen (TN) 925 1 0.32 mg/L 0.41 mg/L* total phosphorus (TP) 12,386 106 8 µg/L 9 µg/L *fewer than 4 lakes used to develop threshold Source: USEPA, 2001
Figure 12. USEPA Methods for setting reference condition thresholds
Reference Lakes All Lakes
Lower 25th percentile
Upper 25th percentile
Source: USEPA, 2000
Higher water quality Lower water quality
23
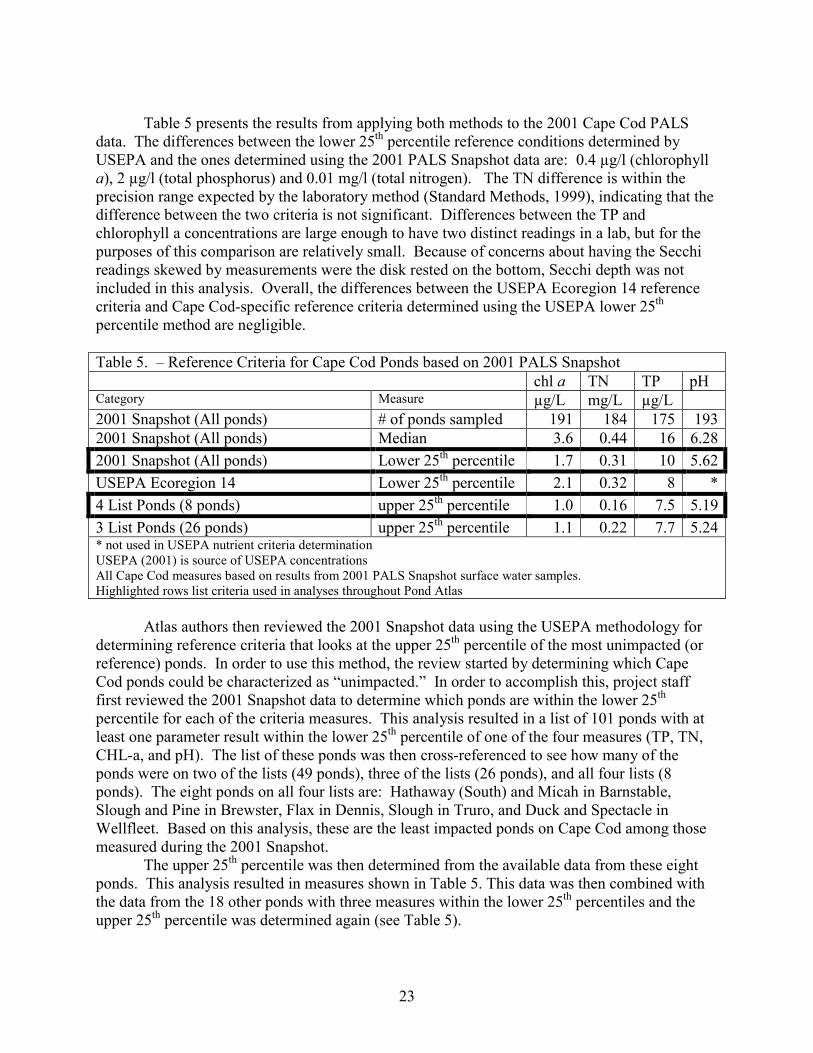
Table 5 presents the results from applying both methods to the 2001 Cape Cod PALS
data. The differences between the lower 25th percentile reference conditions determined by USEPA and the ones determined using the 2001 PALS Snapshot data are: 0.4 µg/l (chlorophyll a), 2 µg/l (total phosphorus) and 0.01 mg/l (total nitrogen). The TN difference is within the precision range expected by the laboratory method (Standard Methods, 1999), indicating that the difference between the two criteria is not significant. Differences between the TP and chlorophyll a concentrations are large enough to have two distinct readings in a lab, but for the purposes of this comparison are relatively small. Because of concerns about having the Secchi readings skewed by measurements were the disk rested on the bottom, Secchi depth was not included in this analysis. Overall, the differences between the USEPA Ecoregion 14 reference criteria and Cape Cod-specific reference criteria determined using the USEPA lower 25th percentile method are negligible. Table 5. – Reference Criteria for Cape Cod Ponds based on 2001 PALS Snapshot chl a TN TP pH Category Measure µg/L mg/L µg/L 2001 Snapshot (All ponds) # of ponds sampled 191 184 175 1932001 Snapshot (All ponds) Median 3.6 0.44 16 6.282001 Snapshot (All ponds) Lower 25th percentile 1.7 0.31 10 5.62USEPA Ecoregion 14 Lower 25th percentile 2.1 0.32 8 *4 List Ponds (8 ponds) upper 25th percentile 1.0 0.16 7.5 5.193 List Ponds (26 ponds) upper 25th percentile 1.1 0.22 7.7 5.24* not used in USEPA nutrient criteria determination USEPA (2001) is source of USEPA concentrations All Cape Cod measures based on results from 2001 PALS Snapshot surface water samples. Highlighted rows list criteria used in analyses throughout Pond Atlas
Atlas authors then reviewed the 2001 Snapshot data using the USEPA methodology for determining reference criteria that looks at the upper 25th percentile of the most unimpacted (or reference) ponds. In order to use this method, the review started by determining which Cape Cod ponds could be characterized as “unimpacted.” In order to accomplish this, project staff first reviewed the 2001 Snapshot data to determine which ponds are within the lower 25th percentile for each of the criteria measures. This analysis resulted in a list of 101 ponds with at least one parameter result within the lower 25th percentile of one of the four measures (TP, TN, CHL-a, and pH). The list of these ponds was then cross-referenced to see how many of the ponds were on two of the lists (49 ponds), three of the lists (26 ponds), and all four lists (8 ponds). The eight ponds on all four lists are: Hathaway (South) and Micah in Barnstable, Slough and Pine in Brewster, Flax in Dennis, Slough in Truro, and Duck and Spectacle in Wellfleet. Based on this analysis, these are the least impacted ponds on Cape Cod among those measured during the 2001 Snapshot.
The upper 25th percentile was then determined from the available data from these eight ponds. This analysis resulted in measures shown in Table 5. This data was then combined with the data from the 18 other ponds with three measures within the lower 25th percentiles and the upper 25th percentile was determined again (see Table 5).
24
The resulting concentrations based on the 8 ponds for total nitrogen, chlorophyll a, and total phosphorus are 52, 59, and 75%, respectively, of the criteria concentrations determined using all the 2001 Snapshot data. The corresponding percentages using the three-list ponds are 71, 65, and 77%, respectively. Interestingly, the reference criteria for total phosphorus from this methodology is roughly equivalent to the USEPA Ecoregion 14 criterion, while the total nitrogen and chlorophyll a concentrations are roughly half of the USEPA criteria.
It is clear from this analysis that further data collection could help to refine these concentrations, but it is unclear how appropriately the upper 25th percentile method criteria reflect “unimpacted” ponds on Cape Cod. Given the rapid population increases and land development over the past 40 years on the Cape, it may be difficult to accurately characterize any pond on Cape Cod as “unimpacted.” The above method to identify the least impacted pond is reasonable, but alternative methods might result in different criteria. At this point, the 2001 PALS Snapshot data is the most comprehensive dataset available for Cape Cod ponds and is an appropriate basis for determining nutrient criteria.
The following sections discuss each of the water quality parameters measured during the 2001 PALS Snapshot and their importance in assessing whether a pond ecosystem is impacted or impaired. Included in this discussion are town-by-town comparisons of the 2001 Snapshot results to the Cape Cod reference criteria developed using both USEPA development methods. Since the Snapshot database is larger than the dataset used by USEPA for the Subecoregion that contains Cape Cod, the authors feel that it is more appropriate to consider Cape Cod data when assessing which criteria should apply. i. Phosphorus
Phosphorus is a nutrient; typical plant organic matter contains phosphorous, nitrogen, and carbon in a ratio of 1 P: 7 N: 40 C per 500 wet weight (Wetzel, 1983). Therefore, if the other constituents are present in excess, phosphorus, as the limiting nutrient can theoretically produce 500 times its weight in algae. Because it is usually the most limited nutrient in lakes, 90% or more of the total mass of phosphorus in a lake usually occurs in organic forms (plant and animal tissue or plant and animal wastes) and any available inorganic phosphorus (mostly orthophosphate (PO4
-3)) is quickly reused by the biota in the lake (Wetzel, 1983). Because all phosphorus forms may be made available to stimulate plant growth most studies of lakes focus on total phosphorus concentrations (Vollenweider, 1968). Total phosphorus (TP) includes ortho-phosphorus and all phosphorus bound in organic matter, including algae.
USEPA currently recommends a reference threshold of 8 µg/l TP for Cape Cod’s ecoregion, while use of the USEPA nutrient criteria methods to review the 2001 PALS Snapshot data results in a reference threshold of 10 µg/l when all data is considered and 7.5 µg/l when only “unimpacted” ponds are considered (see Table 5). Carlson’s TSI classifies lakes with TP concentrations up to 12 µg/L as the lowest nutrient or oligotrophic ponds (see Table 3). Most Cape Cod lakes have low phosphorus concentrations due to the lack of phosphorus in the surrounding glacially-derived sands.
Aherns and Siver (2000) sampling of 60 Cape Cod lakes in 1997 and 1998 found a mean TP concentration in surface waters of 0.014 ppm (14 µg/l). This concentration would place the “average” Cape Cod lake in the oligotrophic to mesotrophic range based on 200 lakes measured throughout the world (Wetzel, 1983), the mesotrophic range based on Carlson’s index (see Table 3) and would place it above the Cape Cod and USEPA Ecoregion “impacted” thresholds.
25
Figure 13 presents the comparison of the Cape Cod reference criteria for total phosphorus with the 2001 Snapshot surface water results by town. During the 2001 Snapshot sampling, 175 surface water TP samples were collected. The average of TP concentration of these samples is 27.2 µg/l (or 0.0272 ppm), while the median is 16.4 µg/l. Town results show how many pond’s surface water TP concentrations are below the reference concentration (7.5 µg/l) based only on data from unimpacted ponds, above the reference concentration (10 µg/l) based on data from all the ponds, and how many are between these two concentrations. For example, Mashpee volunteers collected surface TP samples from 18 ponds, 17 of which were impacted (i.e., TP concentration greater than 10 µg/L) (see Figure 13). Overall, 16% of the pond had concentrations that would be considered unimpacted (TP<7.5 µg/l), 74% would be considered impacted (TP>10 µg/l), and 10% could be considered either impacted or unimpacted depending on which USEPA method was used to develop the threshold. Individual pond results are included in the town-specific sections of this Atlas.
Regardless of which methodology is used, this analysis indicates that a minimum of 74% of the ponds sampled during the 2001 PALS Snapshot have been impacted by human development. This finding then raises the issue of whether these impacts are impairments that require reductions in the phosphorus concentrations. All of the PALS data would need to be brought together for individual ponds along with additional monitoring in order to evaluate whether the “impacts” are causing ecosystem-wide problems like increasing tendencies toward algal blooms and fish kills or whether the impacts are prompting just enough plant growth to create good bass fisheries. Certainly, based on this analysis, at least three-quarters of the pond ecosystems on Cape Cod have been altered from what they would otherwise be without human influence. ii. Nitrogen
Nitrogen is one of the primary nutrients in surface water systems (phosphorus and potassium being the other two). Nitrogen switches between a number of chemical species (nitrate, nitrite, ammonium, nitrogen gas, and organic nitrogen) depending on a number of factors, including dissolved oxygen, pH, and biological uptake (Stumm and Morgan, 1981). Nitrate-nitrogen is the fully oxidized form of nitrogen, while ammonium-nitrogen is the fully reduced (i.e., low oxygen) form. Inorganic nitrogen generally enters ponds in the nitrate-nitrogen form, is incorporated into algae forming organic nitrogen, and then is converted back to inorganic forms (nitrate- and ammonium-nitrogen) in the waste from algae or organisms higher up the food chain or by bacteria decomposing dead algae in the sediments. Total Kjeldahl nitrogen (TKN) is a measure of organic nitrogen and ammonium forms. Total nitrogen (TN) is generally reported as the addition of TKN and nitrate-nitrogen concentrations.
Nitrogen is not usually the limiting nutrient in ponds, but ecosystem changes during the course of a year or excessive phosphorus loads can create conditions where it is the limiting nutrient. In very productive or eutrophic lakes, algae that can extract nitrogen directly from the atmosphere, which is approximately 75% nitrogen gas, often have a strong competitive advantage and tend to dominate the pond ecosystem. These blue-green algae, more technically known as cyanophytes, are generally indicators of excessive nutrient loads.
USEPA currently recommends a reference threshold of 0.32 mg/l (or 0.32 ppm) TN for Cape Cod’s ecoregion, while use of the USEPA nutrient criteria methods to review the 2001 PALS Snapshot data results in a reference threshold of 0.31 mg/l when all data is considered and 0.16 mg/l when only “unimpacted” ponds are considered (see Table 5). Aherns and Siver (2000)
27
sampling of 60 Cape Cod lakes in 1997 and 1998 found a mean TN concentration in surface waters of 0.249 ppm. This concentration places the “average” Cape Cod lake solidly in the oligotrophic range based on 200 lakes measured throughout the world (Wetzel, 1983), characterizes it as “impacted” if the threshold from only unimpacted ponds of Cape Cod is considered, and would characterize it as “unimpacted” if the threshold using all Cape Cod pond data is considered (see Table 5). For comparison, the average groundwater nitrate-nitrogen in over 5,000 private wells sampled throughout Cape Cod, roughly an approximation of average aquifer nitrogen concentrations, is 0.23 ppm (CCC files).
Figure 14 presents the comparison of the Cape Cod reference criteria for TN with the 2001 Snapshot surface water results by town. During the 2001 Snapshot sampling, 184 surface water TN samples were collected. The average of concentration of these samples is 0.58 mg/l (or 0.58 ppm), while the median is 0.44 mg/l. Town results show how many pond’s surface water TN concentrations are below the reference concentration (0.16 mg/l) based only on data from unimpacted ponds, above the reference concentration (0.31 mg/l) based on data from all the ponds, and how many are between these two concentrations. For example, Barnstable volunteers and staff collected surface total nitrogen samples from 34 ponds, 28 of which were impacted (i.e., TN concentration greater than 0.31 mg/L)(see Figure 14). Overall, 7% of the ponds had concentrations that would be considered unimpacted (TN<0.16 mg/l), 75% would be considered impacted (TN>31 mg/l), and 18% could be considered either impacted or unimpacted depending on which USEPA method was used to develop the threshold. Individual pond results are included in the town-specific sections of this Atlas. iii. Secchi Depth/Total Depth An approximate evaluation of transparency, or light penetration, of water can be made using a Secchi disc (Figure 15). Fluctuations in Secchi depths are generally linked to fluctuations in concentrations of plankton or inorganic particles and has been linked through a variety of analyses to trophic status of lakes (e.g., Carlson, 1977). Observed Secchi disc transparencies range from a few centimeters in very turbid lakes to over 40 m in a few clear lakes (Wetzel, 1983). Secchi depth is also related to the overall depth of a pond; if the pond is relatively shallow, the disk may be visible on the bottom even with significant algal densities.
The 1948 Massachusetts DFG Fisheries Report transparency results from fifty-one Cape Cod ponds averaged 18.4 ft (5.6 m) and ranged between 1 ft (0.3 m) in Pilgrim Lake in Truro and 34 ft (10.4 m) in Long Pond in Wellfleet. The Aherns and Siver (2000) survey of sixty Cape Cod lakes and ponds found Secchi depths ranged between 0.31 m in Duck Pond in Provincetown to 9.35 m in Sheep Pond in Brewster; thirty-six percent of the lakes had a mean Secchi depth greater than 5.0 m. USEPA (2001) currently has a reference threshold of 1.2 meters for ponds within Ecoregion 14, which includes Cape Cod (see Table 5).
Although the staff has concerns about the skewing of the relationship between Secchi depth and total depth, which are discussed below, staff developed a Cape Cod reference criterion for Secchi readings using both USEPA reference criteria methods based on data collected during the 2001 PALS Snapshot. Since higher Secchi readings are more indicative of good water quality, the USEPA method looks at the upper 25th percentile (i.e., the 75th percentile) of all data. The reference criterion (3.8 m) using all the 2001 PALS data is slightly shallower than the criterion (4.5 m) developed by USEPA for the ecoregion that contains Cape Cod. The lower 25th percentile reference criteria based on data from the least impacted ponds on the Cape is 6.8 m.
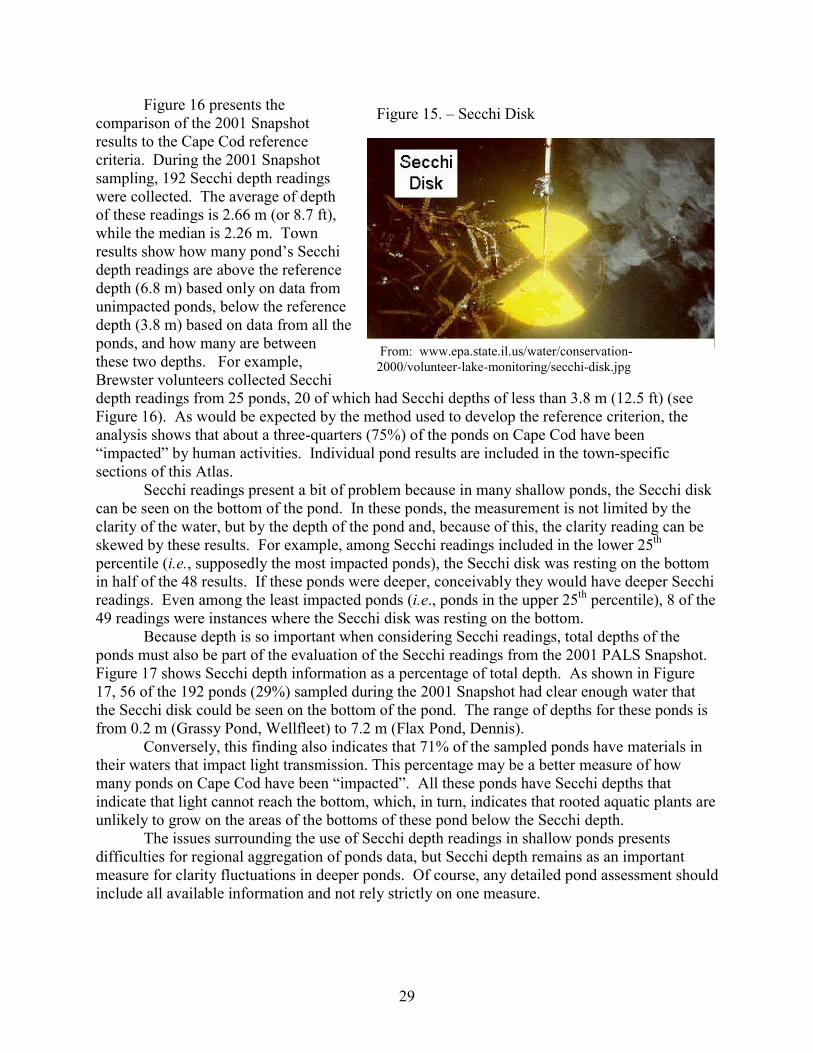
29
Figure 16 presents the comparison of the 2001 Snapshot results to the Cape Cod reference criteria. During the 2001 Snapshot sampling, 192 Secchi depth readings were collected. The average of depth of these readings is 2.66 m (or 8.7 ft), while the median is 2.26 m. Town results show how many pond’s Secchi depth readings are above the reference depth (6.8 m) based only on data from unimpacted ponds, below the reference depth (3.8 m) based on data from all the ponds, and how many are between these two depths. For example, Brewster volunteers collected Secchi depth readings from 25 ponds, 20 of which had Secchi depths of less than 3.8 m (12.5 ft) (see Figure 16). As would be expected by the method used to develop the reference criterion, the analysis shows that about a three-quarters (75%) of the ponds on Cape Cod have been “impacted” by human activities. Individual pond results are included in the town-specific sections of this Atlas.
Secchi readings present a bit of problem because in many shallow ponds, the Secchi disk can be seen on the bottom of the pond. In these ponds, the measurement is not limited by the clarity of the water, but by the depth of the pond and, because of this, the clarity reading can be skewed by these results. For example, among Secchi readings included in the lower 25th percentile (i.e., supposedly the most impacted ponds), the Secchi disk was resting on the bottom in half of the 48 results. If these ponds were deeper, conceivably they would have deeper Secchi readings. Even among the least impacted ponds (i.e., ponds in the upper 25th percentile), 8 of the 49 readings were instances where the Secchi disk was resting on the bottom.
Because depth is so important when considering Secchi readings, total depths of the ponds must also be part of the evaluation of the Secchi readings from the 2001 PALS Snapshot. Figure 17 shows Secchi depth information as a percentage of total depth. As shown in Figure 17, 56 of the 192 ponds (29%) sampled during the 2001 Snapshot had clear enough water that the Secchi disk could be seen on the bottom of the pond. The range of depths for these ponds is from 0.2 m (Grassy Pond, Wellfleet) to 7.2 m (Flax Pond, Dennis).
Conversely, this finding also indicates that 71% of the sampled ponds have materials in their waters that impact light transmission. This percentage may be a better measure of how many ponds on Cape Cod have been “impacted”. All these ponds have Secchi depths that indicate that light cannot reach the bottom, which, in turn, indicates that rooted aquatic plants are unlikely to grow on the areas of the bottoms of these pond below the Secchi depth.
The issues surrounding the use of Secchi depth readings in shallow ponds presents difficulties for regional aggregation of ponds data, but Secchi depth remains as an important measure for clarity fluctuations in deeper ponds. Of course, any detailed pond assessment should include all available information and not rely strictly on one measure.
From: www.epa.state.il.us/water/conservation-2000/volunteer-lake-monitoring/secchi-disk.jpg
Figure 15. – Secchi Disk

32
iv. Chlorophyll a Chlorophyll is the primary photosynthetic pigment in plants, both algae and macrophytes
(i.e., any aquatic plants larger than microscopic algae, including rooted aquatic plants). Because of its prevalence, measurement of chlorophyll can be used to estimate how much algae is present. Chlorophyll a (CHL-a) is a specific pigment in the chlorophyll family and plays a primary role in photosynthesis (USEPA, 2000).
USEPA (2001) cites a reference threshold of 2.1 µg/l chlorophyll a for ponds within Cape Cod’s ecoregion, while use of the USEPA nutrient criteria methods to review the 2001 PALS Snapshot data results in a reference threshold of 1.7 µg/l when all data is considered and 1.0 µg/l when only “unimpacted” ponds are considered (see Table 5). Aherns and Siver (2000) survey of sixty Cape Cod lakes and ponds found the mean CHL-a concentration to be 3.07 µg/L with a range of 0.51 to 19.25 µg/L.
Figure 18 presents the comparison of the Cape Cod reference criterion for chlorophyll a with the 2001 Snapshot results by town. During the 2001 Snapshot sampling, 191 CHL-a samples were collected. The average of concentration of these samples is 8.44 µg/L with a range from 0.01 to 102.9 µg/L. Town results in Figure 18 show how many pond’s surface water CHL-a concentrations are below the reference concentration (1.0 µg/l) based only on data from unimpacted ponds, above the reference concentration (1.7 µg/l) based on data from all the ponds, and how many are between these two concentrations. For example, volunteers from National Park Service at Cape Cod National Seashore collected surface CHL-a samples from seven ponds in Truro, four of which had concentrations that in the unimpacted category, one with a concentration in the impacted category, and two with concentrations between the two reference concentrations (see Figure 18). Overall, 73% of the ponds sampled during the 2001 PALS Snapshot had surface CHL-a concentrations in the impacted category. Additional pond by pond analysis of chlorophyll a and all other parameters would help gauge the severity of these impacts. Individual pond results are included in the town-specific sections of this Atlas.
Since CHL-a is the primary constituent for the application of the Carlson (1977) Trophic State Index (TSI), Atlas authors also used the Carlson Index to evaluate the 2001 PALS Snapshot data. This evaluation shows that 38% of the 191 ponds with surface chlorophyll a concentrations are in the oligotrophic category (TSI range of <30 – 40), 34% are in the mesotrophic category (TSI range of 40-50), 26% are in the eutrophic category (TSI range of 50-70) and 3% are in the hypereutrophic category (TSI range of 70 – 80). When these values are broken down by region, the percentage of oligotrophic ponds is: 35% of the Sagamore lens ponds, 37% of the Monomoy lens ponds, and 47% of the Outer Cape ponds. Figure 19 has the CHL-a TSI results grouped by town.
v. Dissolved Oxygen and Temperature
As mentioned in the above discussion, lake ecosystems are controlled by interactions among the physical, chemical and biological factors within the lake. The availability of oxygen determines distributions of various species; some require higher concentrations, while others are more tolerant of occasional low oxygen concentrations. Oxygen concentrations also determine the solubility of many inorganic elements; higher concentrations of phosphorus, nitrogen, and iron, among other constituents, occur in the hypolimnion when anoxic conditions convert bound, solid forms into soluble forms that are then released into the water column. Temperature negatively interacts with oxygen concentrations (i.e., higher temperature water holds less
35
dissolved oxygen) and the formation of thermal layers (i.e., stratification) in deeper lakes does not allow hypolimnetic waters to interact with the atmosphere.
Biological interactions can also impact DO concentrations. Since one of the main byproducts of photosynthesis is oxygen; a vigorous algal population can produce DO concentrations that are greater than the concentrations that would be expected based simply on temperature interactions. These instances of “supersaturation” usually occur in lakes with high nutrient concentrations, since the algal population would need readily available nutrients in order to thrive. In some lakes, algal populations can cause oxygen maxima deeper in the pond, at or near the metalimnion, where the algae can utilize higher phosphorus concentrations leaking through from the hypolimnion, while still having adequate, albeit low, light for photosynthesis.
The discussion of dissolved oxygen and temperature reinforces the consideration of depth in the characterization of lake ecosystems. Consideration of depth-related impacts contrasts with the USEPA reference methodology, save for Secchi depth. As discussed in the above Secchi section, depth considerations present a number of challenges when considering reference conditions. Although USEPA had DO information available, it chose not to include DO in the reference criteria. However, given the importance of oxygen in the survival of aquatic species, DO is a preeminent measure to consider in gauging the status of pond and lake ecosystems.
Whereas Secchi depth focuses on the upper portions of the water column, most of the focus in DO discussions is on the deepest (or hypolimnetic) waters of ponds. DO concentrations in the deepest parts of lakes are a function of the amount of oxygen consumption by bacteria in the sediments as they decompose organic matter deposited in the sediments and the temperature of the water. Higher oxygen demand by the bacteria will reduce the oxygen concentrations, which is balanced somewhat by the increased ability of lower temperature water to hold more dissolved oxygen. Oxygen concentrations in surface waters will be the result of temperature, oxygen demand from the sediments, and how well winds mix oxygen into the waters from the atmosphere. DO concentrations in hypolimnetic waters will usually be determined by the oxygen content of the water at the time of stratification minus whatever bacterial consumption occurs; if bacteria consume all the oxygen, it cannot be replenished because the thermal layering prevents these waters from being replenished by the atmosphere.
Figure 20 shows DO concentrations at the deepest measuring point in ponds measured during the 2001 Snapshot sampling. Measurements in Figure 20 are further divided into those from ponds that should stratify (depth >9 meters) and those not likely to stratify (depth ≤9 meters). Of the 151 non-stratifying ponds, 35 (or 23%) had anoxic conditions in their deepest waters. Of the 35 stratifying ponds, 28 (or 80%) had anoxic conditions in their deepest waters. Overall, 34% of the ponds measured during the 2001 Snapshot sampling had anoxic conditions and 45% had deep water with concentrations that would be a concern for fish survival (≤4 ppm). vi. pH and Alkalinity
pH is a measure of acidity; pH values less than 7 are considered acidic, while pH values greater than 7 are considered basic. pH is the negative log of the hydrogen ion concentration in water (e.g., water with a H+ concentration = 10-6.5 has a pH of 6.5). pH is determined by the interaction of all of the ions with carbon species, like carbon dioxide, carbonate, and bicarbonate, having the most direct effect (Stumm and Morgan, 1981). The pH of rainwater, in equilibrium with carbon dioxide in the atmosphere, is 5.65. Photosynthesis takes carbon dioxide and hydrogen ions out of the water causing pH to increase, so more productive lakes will tend to have higher pH measurements. Alkalinity is a measure of the compounds that shift pH toward
37
more basic values, is mostly determined by the concentrations of bicarbonate, carbonates, and hydroxides, and is a measure of the capacity of waters to buffer acidic inputs. Consequently, pH and alkalinity are linked values.
Since the sand deposited as Cape Cod during the last glacial period does not have carbonate minerals, Cape soils have low alkalinity and little capacity to buffer the naturally acidic rainwater that falls on the Cape. Aherns and Siver (2000) found an average pH of 6.1 with a range of 4.4 to 8 and an average alkalinity of 1.95 mg/L as CaCO3 in the 60 ponds they measured in 1997 and 1998. The median pH among the 18 lakes sampled on Cape Cod as part of the Acid Rain Monitoring Program was 5.95. Median pH concentration in 20 ponds monitored in Cape Cod National Seashore is 5.1, while the median alkalinity concentration is 0.22 mg/L as CaCO3 (Portnoy, et al., 2001b).
USEPA chose not to include pH or alkalinity as values for the development of reference criteria, likely because lower pH and alkalinity measures are not necessarily indicative of unimpacted ecosystems. Extremely low pH values would be associated with acid rain impacts. Values of 6 to 8 are generally acceptable pH values in state water quality standards, but it is unclear what a “natural” range on Cape Cod is.
The average surface pH of 193 ponds sampled in the 2001 Snapshot is 6.16 with a range of 4.38 to 8.92, while the average alkalinity is 7.21 mg/L as CaCO3 with a range of 0 to 92.1. If the USEPA (2000) lower 25th percentile reference condition method is applied to all the 2001 Snapshot surface water data, the Cape Cod reference pH threshold is 5.62 and the reference alkalinity threshold is 1.55 mg/L as CaCO3. Figure 21 shows the application of the Cape Cod pH reference threshold to the 2001 Snapshot results by town.
Within the towns in Figure 21 the percentage of ponds above the reference threshold varies widely. In most of the Outer Cape towns, where most of the ponds are located within the Cape Cod National Seashore, the percentage of ponds below the threshold approaches or exceeds 50% of the ponds measured, led by Provincetown with all six ponds with pHs less than 5.625. In contrast, 82% (9 of 11) ponds in Eastham, which are all located outside of the National Seashore, are above the threshold. In other towns, the percentage of ponds above the threshold range from 54% (Dennis) to 100% (Bourne, Falmouth, Sandwich). Application of the alkalinity reference condition results in essentially the same percentages.
Since acid rain is a concern in many lakes on the Cape because of the limited alkalinity, pH values in lakes can also be lower than the 5.65 expected based on simple equilibrium with atmospheric carbon dioxide. This is especially important for the lakes that are largely unimpacted by nutrients from surrounding land use because the counteracting influences of photosynthesis is not available to buffer the pH-lowering inputs from acid rain. When the ponds are grouped into three regions, those in the Sagamore lens, those in the Monomoy lens, and those on the outer Cape, the percentage of sampled ponds with surface water pH’s less than 5.65 are 15%, 23%, and 50%. This analysis shows that half of the ponds sampled on the outer Cape have pH’s that may be indicative of acid rain impacts; refined analysis of individual ponds and other measures would be required to further clarify the impacts.
B. Other Cape Cod Pond Monitoring The PALS Snapshots are one aspect of the monitoring that is underway to better characterize the condition of Cape Cod ponds. Other monitoring projects have included: mercury in fish tissue, water levels, and Secchi disk depths. Each of these projects are briefly discussed below.
39
1. Mercury Mercury is a naturally occurring element that is often released into the atmosphere by
burning of fossil fuels. Mercury is also neurotoxin that can concentrate in fish to levels that are of health concern for humans that eat them. Studies of lake pH levels and concentrations of mercury in fish have shown that low pH/acidic conditions generally favor high mercury concentrations (e.g., Greenfield, et al. (2001), MADEP (1997)). Given the generally low pH of most Cape Cod ponds (see above), this relationship has raised concerns about the safety of consuming fish caught in these ponds.
Currently, Massachusetts Department of Public Health lists 111 ponds and lakes in the commonwealth with various forms of fish consumption advisories, mostly related to mercury impacts (see http://www.state.ma.us/dph/beha/fishlist.htm for the entire list). Nine of these ponds are located within Barnstable County. A total of 18 Cape Cod ponds have been tested for mercury contamination by either MADEP, the Cape Cod Commission or the National Park Service.
Three of the nine ponds were included on the advisory list following fish tissue testing by the Cape Cod Commission during the summer of 2001 under a grant from USEPA (Michaud, 2001). This testing also indicated a number of ponds with fish that had mercury concentrations above health thresholds, but the sample sizes were too small for the issuance of health advisories. Given the high percentage of advisories issued for the number of ponds tested and the relationship between low pH and high mercury concentrations in fish tissue, the Commission has been encouraging DEP and DPH to conduct additional testing. 2. Pond Water Levels As mentioned previously, pond water levels on Cape Cod generally fluctuate with groundwater levels. The Cape Cod Commission has been gathering groundwater levels from a regional network of 60 to 65 wells since the early 1970’s. This monitoring supports US Geological Survey (USGS) programs and provides the data necessary for groundwater separation calculations required in the state septic system regulations (310 CMR 15: Title 5). The historic database of groundwater levels is an important resource for management of the water on Cape Cod. Pond water level monitoring, up until recently, had not received similar support. Volunteers from the Association for the Preservation of Cape Cod (APCC) gathered monthly water level reading on a dozen Cape ponds between May and September since 1973. In 1985, the DEP instituted water withdrawal permitting for public supply wells, which required suppliers with wells near ponds to monitor pond levels. In 1994, the Cape Cod Commission began the monitoring of 24 ponds in the Monomoy Lens with a volunteer "Adopt-a Pond" program. Each of these programs ran into problems with maintaining staff gauges and finding volunteers. In order to provide a more reliable method of pond water level measurements, the Commission contracted with the USGS in 1997 to install stilling wells adjacent to 12 ponds. These wells connect with the surface waters providing a permanent water level measuring without the need for gauge replacement or resurveying. However, these gauges have been subject to some of the same vandalism and maintenance concern as the staff gauges. In the spring of 2002, APCC requested that the Cape Cod Commission add the seven remaining ponds measured by APCC volunteers to the larger pond network coordinated by the Commission. Currently, water levels in 29 ponds are monitored in the Cape Cod Water Level Network (Table 6). Most of the levels are collected by volunteers and the data collection, network
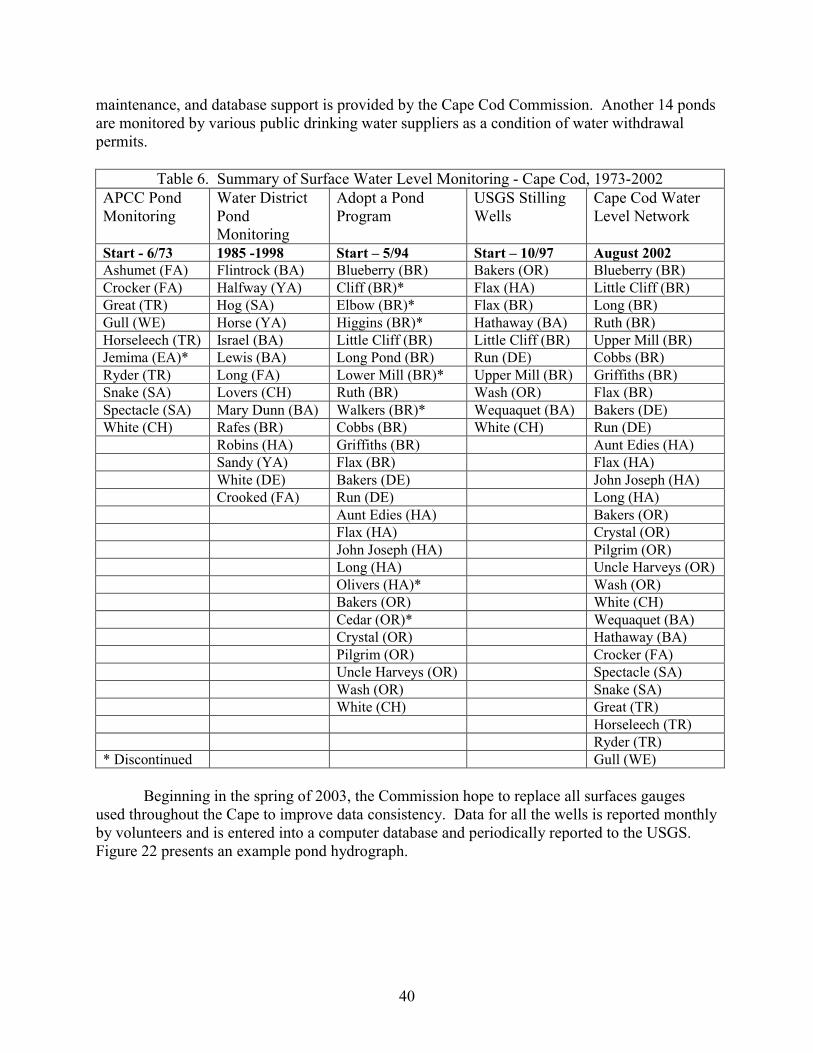
40
maintenance, and database support is provided by the Cape Cod Commission. Another 14 ponds are monitored by various public drinking water suppliers as a condition of water withdrawal permits.
Table 6. Summary of Surface Water Level Monitoring - Cape Cod, 1973-2002 APCC Pond Monitoring
Water District Pond Monitoring
Adopt a Pond Program
USGS Stilling Wells
Cape Cod Water Level Network
Start - 6/73 1985 -1998 Start – 5/94 Start – 10/97 August 2002 Ashumet (FA) Flintrock (BA) Blueberry (BR) Bakers (OR) Blueberry (BR) Crocker (FA) Halfway (YA) Cliff (BR)* Flax (HA) Little Cliff (BR) Great (TR) Hog (SA) Elbow (BR)* Flax (BR) Long (BR) Gull (WE) Horse (YA) Higgins (BR)* Hathaway (BA) Ruth (BR) Horseleech (TR) Israel (BA) Little Cliff (BR) Little Cliff (BR) Upper Mill (BR) Jemima (EA)* Lewis (BA) Long Pond (BR) Run (DE) Cobbs (BR) Ryder (TR) Long (FA) Lower Mill (BR)* Upper Mill (BR) Griffiths (BR) Snake (SA) Lovers (CH) Ruth (BR) Wash (OR) Flax (BR) Spectacle (SA) Mary Dunn (BA) Walkers (BR)* Wequaquet (BA) Bakers (DE) White (CH) Rafes (BR) Cobbs (BR) White (CH) Run (DE) Robins (HA) Griffiths (BR) Aunt Edies (HA) Sandy (YA) Flax (BR) Flax (HA) White (DE) Bakers (DE) John Joseph (HA) Crooked (FA) Run (DE) Long (HA) Aunt Edies (HA) Bakers (OR) Flax (HA) Crystal (OR) John Joseph (HA) Pilgrim (OR) Long (HA) Uncle Harveys (OR) Olivers (HA)* Wash (OR) Bakers (OR) White (CH) Cedar (OR)* Wequaquet (BA) Crystal (OR) Hathaway (BA) Pilgrim (OR) Crocker (FA) Uncle Harveys (OR) Spectacle (SA) Wash (OR) Snake (SA) White (CH) Great (TR) Horseleech (TR) Ryder (TR) * Discontinued Gull (WE)
Beginning in the spring of 2003, the Commission hope to replace all surfaces gauges
used throughout the Cape to improve data consistency. Data for all the wells is reported monthly by volunteers and is entered into a computer database and periodically reported to the USGS. Figure 22 presents an example pond hydrograph.
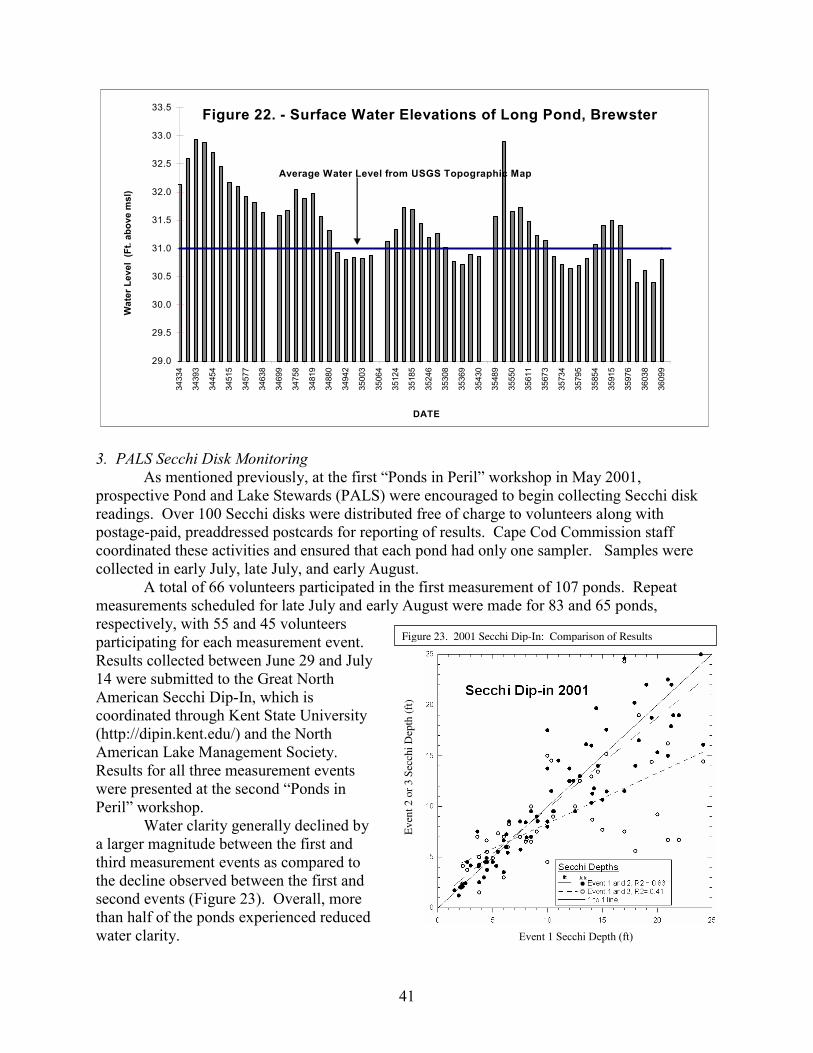
41
Event 1 Secchi Depth (ft)
Eve
nt 2
or
3 Se
cchi
Dep
th (
ft)
Figure 23. 2001 Secchi Dip-In: Comparison of Results
3. PALS Secchi Disk Monitoring
As mentioned previously, at the first “Ponds in Peril” workshop in May 2001, prospective Pond and Lake Stewards (PALS) were encouraged to begin collecting Secchi disk readings. Over 100 Secchi disks were distributed free of charge to volunteers along with postage-paid, preaddressed postcards for reporting of results. Cape Cod Commission staff coordinated these activities and ensured that each pond had only one sampler. Samples were collected in early July, late July, and early August.
A total of 66 volunteers participated in the first measurement of 107 ponds. Repeat measurements scheduled for late July and early August were made for 83 and 65 ponds, respectively, with 55 and 45 volunteers participating for each measurement event. Results collected between June 29 and July 14 were submitted to the Great North American Secchi Dip-In, which is coordinated through Kent State University (http://dipin.kent.edu/) and the North American Lake Management Society. Results for all three measurement events were presented at the second “Ponds in Peril” workshop.
Water clarity generally declined by a larger magnitude between the first and third measurement events as compared to the decline observed between the first and second events (Figure 23). Overall, more than half of the ponds experienced reduced water clarity.
Figure 22. - Surface Water Elevations of Long Pond, Brewster
29.0
29.5
30.0
30.5
31.0
31.5
32.0
32.5
33.0
33.5
3433
4
3439
3
3445
4
3451
5
3457
7
3463
8
3469
9
3475
8
3481
9
3488
0
3494
2
3500
3
3506
4
3512
4
3518
5
3524
6
3530
8
3536
9
3543
0
3548
9
3555
0
3561
1
3567
3
3573
4
3579
5
3585
4
3591
5
3597
6
3603
8
3609
9
DATE
Wat
er L
evel
(Ft
. abo
ve m
sl)
Average Water Level from USGS Topographic Map
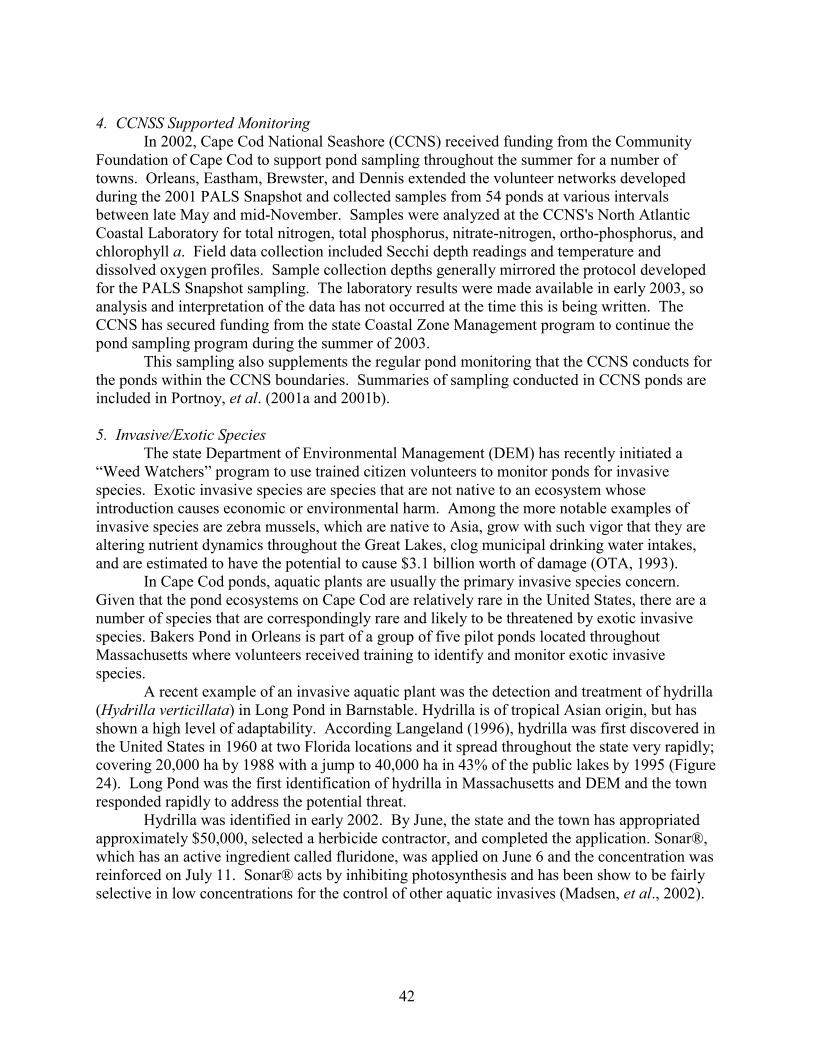
42
4. CCNSS Supported Monitoring
In 2002, Cape Cod National Seashore (CCNS) received funding from the Community Foundation of Cape Cod to support pond sampling throughout the summer for a number of towns. Orleans, Eastham, Brewster, and Dennis extended the volunteer networks developed during the 2001 PALS Snapshot and collected samples from 54 ponds at various intervals between late May and mid-November. Samples were analyzed at the CCNS's North Atlantic Coastal Laboratory for total nitrogen, total phosphorus, nitrate-nitrogen, ortho-phosphorus, and chlorophyll a. Field data collection included Secchi depth readings and temperature and dissolved oxygen profiles. Sample collection depths generally mirrored the protocol developed for the PALS Snapshot sampling. The laboratory results were made available in early 2003, so analysis and interpretation of the data has not occurred at the time this is being written. The CCNS has secured funding from the state Coastal Zone Management program to continue the pond sampling program during the summer of 2003.
This sampling also supplements the regular pond monitoring that the CCNS conducts for the ponds within the CCNS boundaries. Summaries of sampling conducted in CCNS ponds are included in Portnoy, et al. (2001a and 2001b). 5. Invasive/Exotic Species
The state Department of Environmental Management (DEM) has recently initiated a “Weed Watchers” program to use trained citizen volunteers to monitor ponds for invasive species. Exotic invasive species are species that are not native to an ecosystem whose introduction causes economic or environmental harm. Among the more notable examples of invasive species are zebra mussels, which are native to Asia, grow with such vigor that they are altering nutrient dynamics throughout the Great Lakes, clog municipal drinking water intakes, and are estimated to have the potential to cause $3.1 billion worth of damage (OTA, 1993).
In Cape Cod ponds, aquatic plants are usually the primary invasive species concern. Given that the pond ecosystems on Cape Cod are relatively rare in the United States, there are a number of species that are correspondingly rare and likely to be threatened by exotic invasive species. Bakers Pond in Orleans is part of a group of five pilot ponds located throughout Massachusetts where volunteers received training to identify and monitor exotic invasive species.
A recent example of an invasive aquatic plant was the detection and treatment of hydrilla (Hydrilla verticillata) in Long Pond in Barnstable. Hydrilla is of tropical Asian origin, but has shown a high level of adaptability. According Langeland (1996), hydrilla was first discovered in the United States in 1960 at two Florida locations and it spread throughout the state very rapidly; covering 20,000 ha by 1988 with a jump to 40,000 ha in 43% of the public lakes by 1995 (Figure 24). Long Pond was the first identification of hydrilla in Massachusetts and DEM and the town responded rapidly to address the potential threat.
Hydrilla was identified in early 2002. By June, the state and the town has appropriated approximately $50,000, selected a herbicide contractor, and completed the application. Sonar®, which has an active ingredient called fluridone, was applied on June 6 and the concentration was reinforced on July 11. Sonar® acts by inhibiting photosynthesis and has been show to be fairly selective in low concentrations for the control of other aquatic invasives (Madsen, et al., 2002).
43
Given the potential rapid spread, extensive impact, and number of pond ecosystems that could be impacted on the Cape, public education and assistance is necessary to ensure that exotic invasives do not gain a foothold on Cape Cod.
6. Safe Swimming Beaches
Since Cape Cod ponds are used extensively for swimming, ensuring that waters are safe for swimming is an important pond management consideration. In 2001, Massachusetts adopted the Beaches Bill, which required regular testing of all public and semi-public bathing beaches. State regulations to implement the law are contained 105 CMR 445 and require weekly bacterial testing. The Barnstable County Department of Health and Environment conducts most of the laboratory analyses for Cape towns and maintains the results on a portion of their website (www.barnstablecountyhealth.org/bsgeneralinfo.htm).
Review of 2001 and 2002 testing shows that beaches at Cape Cod ponds are safe for swimming. Of the 1,112 samples collected from 83 pond beaches tested in 2001, 15 samples (or 1.5%) exceeded the limit of 235 E. coli colony forming units allowed per 100ml sample. In 2002, 928 samples were collected from 74 pond beaches and 10 (or 1.1%) exceeded the limit. Between the two years, only two samples persisted beyond one day and no tested ponds had consistent exceedences. Table 7 lists the ponds sampled.
Figure 24. Hydrilla at Wakulla Springs, Florida
Photo from: http://plants.ifas.ufl.edu/hydwakulla.jpg
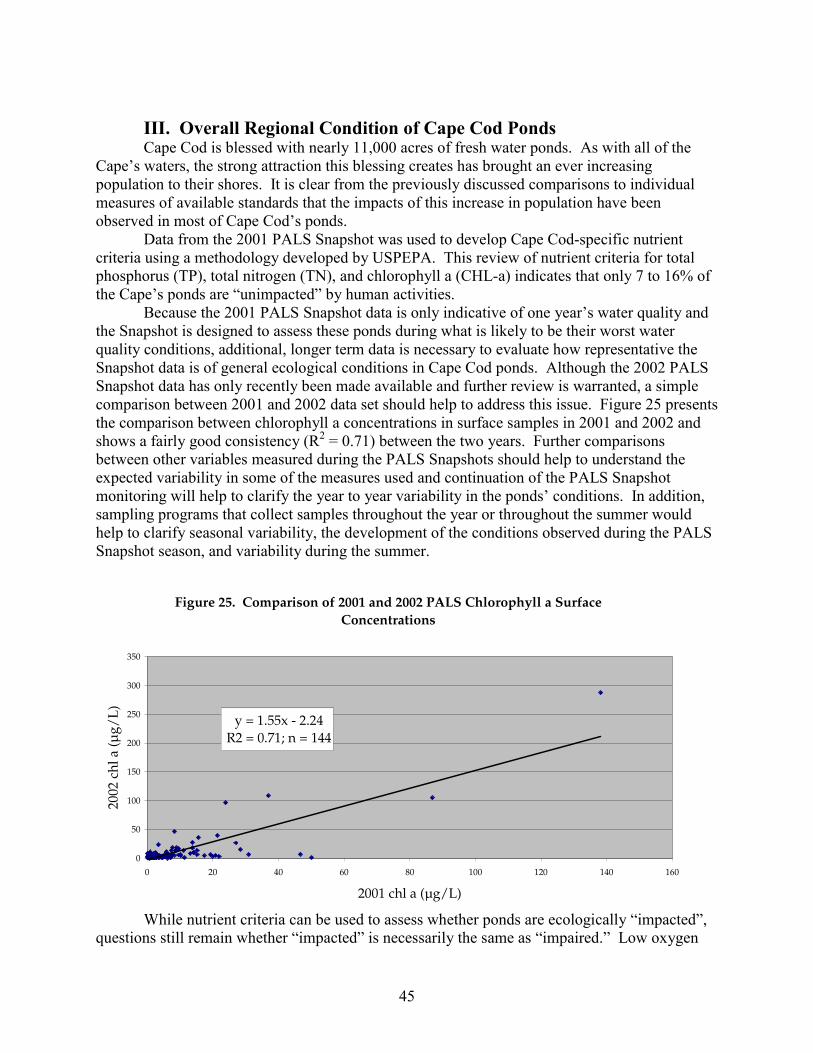
45
III. Overall Regional Condition of Cape Cod Ponds Cape Cod is blessed with nearly 11,000 acres of fresh water ponds. As with all of the
Cape’s waters, the strong attraction this blessing creates has brought an ever increasing population to their shores. It is clear from the previously discussed comparisons to individual measures of available standards that the impacts of this increase in population have been observed in most of Cape Cod’s ponds.
Data from the 2001 PALS Snapshot was used to develop Cape Cod-specific nutrient criteria using a methodology developed by USPEPA. This review of nutrient criteria for total phosphorus (TP), total nitrogen (TN), and chlorophyll a (CHL-a) indicates that only 7 to 16% of the Cape’s ponds are “unimpacted” by human activities.
Because the 2001 PALS Snapshot data is only indicative of one year’s water quality and the Snapshot is designed to assess these ponds during what is likely to be their worst water quality conditions, additional, longer term data is necessary to evaluate how representative the Snapshot data is of general ecological conditions in Cape Cod ponds. Although the 2002 PALS Snapshot data has only recently been made available and further review is warranted, a simple comparison between 2001 and 2002 data set should help to address this issue. Figure 25 presents the comparison between chlorophyll a concentrations in surface samples in 2001 and 2002 and shows a fairly good consistency (R2 = 0.71) between the two years. Further comparisons between other variables measured during the PALS Snapshots should help to understand the expected variability in some of the measures used and continuation of the PALS Snapshot monitoring will help to clarify the year to year variability in the ponds’ conditions. In addition, sampling programs that collect samples throughout the year or throughout the summer would help to clarify seasonal variability, the development of the conditions observed during the PALS Snapshot season, and variability during the summer.
While nutrient criteria can be used to assess whether ponds are ecologically “impacted”, questions still remain whether “impacted” is necessarily the same as “impaired.” Low oxygen
Figure 25. Comparison of 2001 and 2002 PALS Chlorophyll a Surface Concentrations
y = 1.55x - 2.24 R2 = 0.71; n = 144
0
50
100
150
200
250
300
350
0 20 40 60 80 100 120 140 160
2001 chl a (µg/L)
2002
chl
a (µ
g/L
)
46
conditions are a well-defined habitat impairment; recent efforts have better defined the level of impairment, including quantifying impairment of fish breeding success in low oxygen conditions (e.g., Wu, et al., 2003).
Because this is a well-defined impairment, the Atlas authors reviewed deep DO concentrations to assess how many of the ponds might be classified as “impaired.’ This analysis indicates 23% of the “shallow” ponds had anoxic conditions in their deepest waters, while 34% had hypoxic (≤4 ppm DO) conditions. Shallow ponds are defined as those with a maximum depth of 9 m or less; 151 of these ponds were measured during the 2001 PALS Snapshot. When the 35 deepest ponds (maximum depth of greater than 9 m) are evaluated, 80% had anoxic conditions in their deepest waters and 89% had hypoxic conditions. Overall, 34% of the ponds (68 of 186) measured during the 2001 Snapshot sampling had anoxic conditions and 45% (83 ponds) had hypoxic conditions. These ponds could reasonably be considered “impaired.”
Some might debate that a number of the ponds, especially the deeper ponds, naturally have anoxic or hypoxic conditions in their deeper waters. In order to try to address this issue, dissolved oxygen readings in the same ponds in both 1948 and 2001 were compared. The PALS Snapshot data is the source of the 2001 data. MADFG (1948) is the source of the 1948 data and contains DO data for 51 ponds collected between July 6 and August 26, 1948.
The focus of the 1948 data is generally on trout fisheries, so DO profiles are usually not continuous. In addition, the 1948 depths were measured in feet, while the PALS depths were measured in meters. Data were generally matched to within one meter of depth readings in the two years, although some bottom readings were up to 2 m off. Readings collected in 41 ponds in 2001 are matched by comparable 1948 readings; a total 156 matched readings are available. The average difference in depth over 156 readings is 0.057 m.
In order to minimize temperature-related DO differences and allow a better comparison between the 1948 and 2001 datasets, concentration data was converted to percent saturation. In the temperature range observed in both 1948 and 2001 (10 to 24°C), a 4 ppm DO concentration (i.e., a hypoxic threshold) is between 36 and 48% saturation, while a concentration of 1 ppm (i.e., an anoxic threshold) is between 9 and 12% saturation. The following analysis used the average of 42% DO saturation as a hypoxia threshold and 10% saturation as an anoxia threshold.
The comparison of the DO saturation values shows 76% of the matched readings are lower in 2001 than 1948. Average percent saturation in 1948 is 83%, while it is 60% in 2001. In 1948, 17 of the 156 readings had anoxic saturation values of 10% or less, while in 2001 51 readings were anoxic (Figure 26). In 1948, 30 readings had hypoxic saturation values of 42% or less, while in 2001, 62 readings were hypoxic.
This comparison between 1948 and 2001 data generally shows that water quality in a approximately 75% of the ponds reviewed has been degraded. Thirty-two of the 41 ponds (78%) reviewed developed hypoxic conditions between 1948 and 2001. Thirty-four (34) of the ponds (83%) developed anoxic conditions between 1948 and 2001. These findings suggest that the low DO concentrations observed in the ponds are not “natural” conditions, but are the reflection of 50 years worth of impacts from surrounding development and use.
48
IV. Summary and Next Steps The review of current USEPA nutrient thresholds, Cape Cod nutrient thresholds,
dissolved oxygen concentrations, and comparison of 1948 and 2001 dissolved oxygen concentrations suggest that the water quality in Cape Cod ponds is impacted by surrounding development and, in many cases, is impaired by the same development. Based on information in this Atlas, between 74 and 93% of the Cape’s ponds are impacted by surrounding development or uses. Based largely on dissolved oxygen information, approximately 45% of all the ponds and 89% of the deepest ponds are impaired.
Because many of these impairments are not readily observed from the surface, the extent of the impairment is often seen only when there is a fish kill or an algal bloom. Actions to correct these impairments will depend on community and state priorities.
Although the ecological comparisons show significant impairments of pond ecosystems, bacterial testing of ponds show that these ponds generally provide healthy conditions for swimming. Concerns have also been raised about eating fish from selected ponds and about conflicts among various users (e.g., jetskis), but recent measurements of property values and sale of pondfront properties have shown significant upward trends. Active discussion of management strategies for these ponds may lead to refinement of pond users’ expectations for habitat and recreation.
Gathering additional water quality readings in these ponds can serve dual purposes of providing concerned citizens (Pond and Lake Stewards (PALS)) with information to influence future funding priorities and provide data to scientists that can be used in later assessments of remedial options. The PALS program currently has a number of monitoring components (Snapshots and more frequent town programs) that are developing information that will be useful for better understanding the regional status, as well as the status of individual ponds. The networking components of the PALS program encourage the sharing of experiences among all PALS.
In order to reinforce and encourage the nascent network of PALS on Cape Cod, the following are recommended as future steps:
1. Continue the PALS Snapshots of pond water quality 2. Recruit volunteer coordinators, volunteers, and other PALS in each town 3. Encourage towns to acquire necessary sampling equipment 4. Encourage towns to initiate summer pond sampling programs 5. Provide sufficient personnel to train volunteer monitors, develop monitoring
locations, provide regular feedback to volunteers to ensure protocols are followed during sampling season
6. Provide qualified personnel to review and analyze sampling data 7. Provide adequate funding to have annual or semi-annual PALS gatherings for
outreach, education, and technical transfer 8. Provide adequate long-term funding to remediate impairments 9. Ensure that pond water quality is thoroughly considered in town comprehensive
wastewater assessments
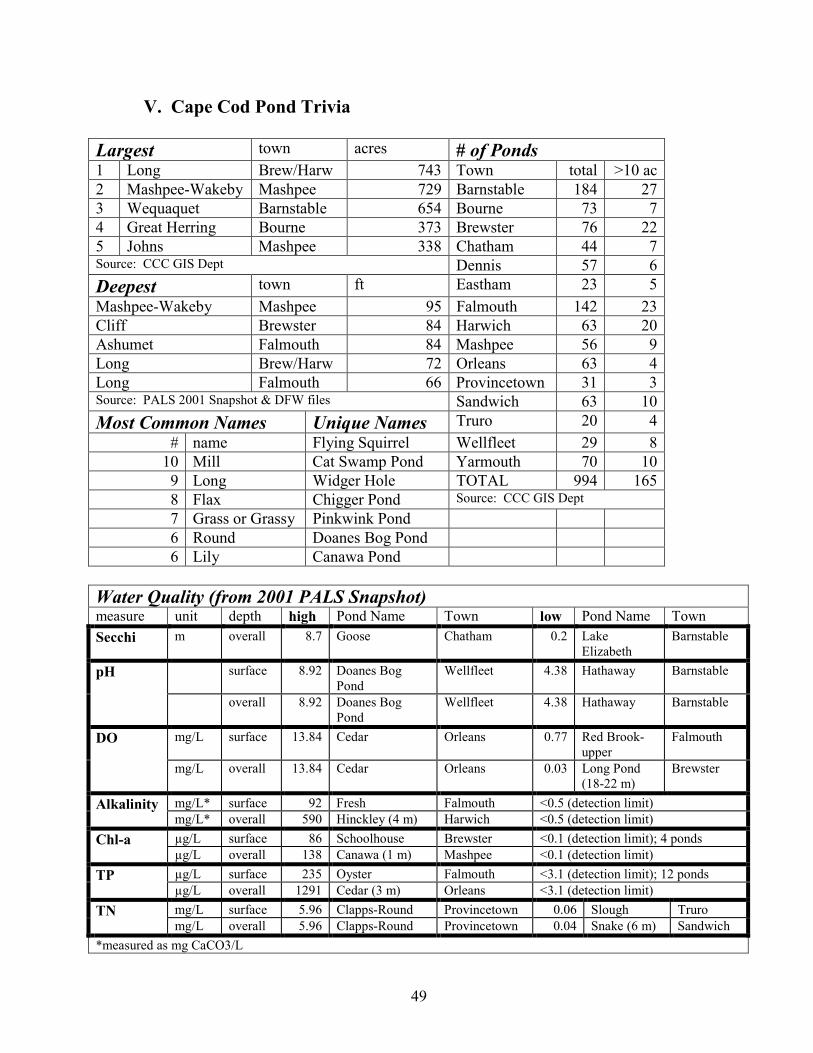
49
V. Cape Cod Pond Trivia Largest town acres # of Ponds 1 Long Brew/Harw 743 Town total >10 ac2 Mashpee-Wakeby Mashpee 729 Barnstable 184 273 Wequaquet Barnstable 654 Bourne 73 74 Great Herring Bourne 373 Brewster 76 225 Johns Mashpee 338 Chatham 44 7Source: CCC GIS Dept Dennis 57 6Deepest town ft Eastham 23 5Mashpee-Wakeby Mashpee 95 Falmouth 142 23Cliff Brewster 84 Harwich 63 20Ashumet Falmouth 84 Mashpee 56 9Long Brew/Harw 72 Orleans 63 4Long Falmouth 66 Provincetown 31 3Source: PALS 2001 Snapshot & DFW files Sandwich 63 10Most Common Names Unique Names Truro 20 4
# name Flying Squirrel Wellfleet 29 810 Mill Cat Swamp Pond Yarmouth 70 109 Long Widger Hole TOTAL 994 1658 Flax Chigger Pond Source: CCC GIS Dept 7 Grass or Grassy Pinkwink Pond 6 Round Doanes Bog Pond 6 Lily Canawa Pond
Water Quality (from 2001 PALS Snapshot) measure unit depth high Pond Name Town low Pond Name Town Secchi m overall 8.7 Goose Chatham 0.2 Lake
Elizabeth Barnstable
surface 8.92 Doanes Bog Pond
Wellfleet 4.38 Hathaway Barnstable pH
overall 8.92 Doanes Bog Pond
Wellfleet 4.38 Hathaway Barnstable
mg/L surface 13.84 Cedar Orleans 0.77 Red Brook-upper
Falmouth DO
mg/L overall 13.84 Cedar Orleans 0.03 Long Pond (18-22 m)
Brewster
mg/L* surface 92 Fresh Falmouth <0.5 (detection limit) Alkalinity mg/L* overall 590 Hinckley (4 m) Harwich <0.5 (detection limit) µg/L surface 86 Schoolhouse Brewster <0.1 (detection limit); 4 ponds Chl-a µg/L overall 138 Canawa (1 m) Mashpee <0.1 (detection limit) µg/L surface 235 Oyster Falmouth <3.1 (detection limit); 12 ponds TP µg/L overall 1291 Cedar (3 m) Orleans <3.1 (detection limit) mg/L surface 5.96 Clapps-Round Provincetown 0.06 Slough Truro TN mg/L overall 5.96 Clapps-Round Provincetown 0.04 Snake (6 m) Sandwich
*measured as mg CaCO3/L
50
VI. References Ahrens, T.D., and P.A. Siver. 2000. Trophic conditions and water chemistry of lakes on Cape Cod, Massachusetts, USA. Lake and Reservoir Management. 16(4): 268-280. American Public Health Association, American Water Works Association, and Water Environment Federation. 1995. Standard Methods for the Examination of Water and Wastewater, 19th edition. Washington, DC. Baystate Environmental Consultants, Inc. January, 1987. Diagnostic/Feasibility Study for the Management of Great Pond, Eastham, MA. Prepared for the Town of Eastham and the Massachusetts Division of Water Pollution Control. East Longmeadow, MA. Baystate Environmental Consultants, Inc. December, 1991. A Diagnostic/Feasibility Study for the Management of Herring Pond, Eastham, MA. Prepared for the Town of Eastham and the Massachusetts Division of Water Pollution Control. East Longmeadow, MA. Baystate Environmental Consultants, Inc. July, 1993. Diagnostic/Feasibility Study of Hamblin Pond, Barnstable, MA. Prepared for the Town of Barnstable Conservation Department. Canfield, D.E., Jr., C.D. Brown, R.W. Bachmann and M.V. Hoyer. Volunteer Lake Monitoring: Testing the Reliability of Data Collected by the Florida LAKEWATCH Program. Lake and Reservoir Management. 18(1): 1-9. Cape Cod Planning and Economic Development Commission. 1978. Final Environmental Impact Statement and 208 Water Quality Management Plan for Cape Cod. Barnstable County. Barnstable, MA. Cape Cod Commission. 1991. Regional Policy Plan. Cape Cod Commission, Barnstable County. Barnstable, MA. Cape Cod Commission. 1996. Regional Policy Plan. Cape Cod Commission, Barnstable County. Barnstable, MA. Cape Cod Commission. 2002. Regional Policy Plan. Cape Cod Commission, Barnstable County. Barnstable, MA. Carlson, R.E. 1977. A trophic state index for lakes. Limnology and Oceanography. 22: 361-369. Carlson, R.E. 1983. Discussion on “Using differences among Carlson’s trophic state index values in regional water quality assessment”, by Richard A. Osgood. Water Resources Bulletin. 19: 307-309. Carlson, R.E. and J. Simpson. 1996. A Coordinator’s Guide to Volunteer Lake Monitoring Methods. North American Lake Management Society. 96 pp. (summarized at http://dipin.kent.edu/tsi.htm#A). D'Elia, C.F., P.A. Stuedler and N. Corwin. 1977. Determination of total nitrogen in aqueous samples using persulfate digestion. Limnology and Oceanography. 22: 760-764. Eichner, E.M., T.C. Cambareri. V. Morrill, and B. Smith. 1998. Lake Wequaquet Water Level Study, Final Report. Cape Cod Commission, Water Resources Office, Barnstable, MA.
51
Eichner, E.M., V. Morrill, B. Smith, and K. Livingston. 1999. Long Pond Water Quality Assessment, Final Report. Cape Cod Commission, Water Resources Office, Barnstable, MA. Eichner, E.M., J. Scanlon, G. Heufelder, and J. Wood. 2001. Baker Pond Water Quality Assessment. Prepared for Town of Orleans and MA Department of Environmental Management. Cape Cod Commission. Barnstable, MA. ENSR International. 2001. Management Study of Long Pond, Brewster and Harwich, Massachusetts. Willington, CT. Environmental Management Institute. 1976. Final Report, Water Quality Assessment, Cape Cod, 1976. Prepared for Area Wide Wastewater Management Program, Cape Cod Planning and Economic Development Commission, Barnstable County, Massachusetts. Marion, MA. Frimpter, M.H. and G.C. Belfit. 1992. Estimation of High Ground-Water Levels for Construction and Land Use Planning, A Cape Cod Example – Updated 1991. Cape Cod Commission Technical Bulletin 92-001. Prepared in cooperation with the US Geological Survey, Water Resources Division. Cape Cod Commission. Barnstable, MA. Frimpter, M.H. and F.B. Gay. 1979. Chemical Quality of Ground Water on Cape Cod, Massachusetts. Water Resources Investigations 79-65. US Geological Survey. Boston, MA. Godfrey, P.J., M.D. Mattson, M-F Walk, P.A. Kerr, O.T. Zajicek, and A. Ruby, III. 1996. The Massachusetts Acid Rain Monitoring Project: Ten Years of Monitoring Massachusetts Lakes and Streams with Volunteers. Water Resources Research Center, University of Massachusetts – Amherst. Publication No. 171. Available at: www.umass.edu/tei/wrrc/pdf/ARMfinalrpt.PDF Greenfield, B.K., Hrabik, T.R., Harvey, C.J., and Carpenter, S.R. 2001. Predicting mercury levels in yellow perch: Use of water chemistry, trophic ecology, and spatial traits. Canadian Journal of Fisheries and Aquatic Sciences. 58(7): 1419-1429. Hazardous Waste Remedial Actions Program. 1994. Ashumet and Johns Ponds, 1994 Annual Report. Installation Restoration Program, Air National Guard. Oak Ridge, TN. Horne, A.J. and C.R. Goldman. 1994. Limnology. 2nd edition. McGraw-Hill Co., New York, New York. Hutchinson, G.E. 1957. A treatise on limnology in Geography, Physics and Chemistry, Vol. I. John Wiley & Sons, New York, New York. Jacobs Engineering Group, Inc. 1998. Final Ecological Quarterly Data Summary Report, Fall 1997. Air Force Center for Environmental Excellence/Massachusetts Military Reservation, Installation Restoration Program. Otis ANGB, MA. Langeland, K.A. 1996. Hydrilla verticillata (L.F.) Royle (Hydrocharitaceae), "The Perfect Aquatic Weed". Castanea. 61: 293-304. Available at: plants.ifas.ufl.edu/hydcirc.html
52
Madsen, J.D., K.D. Getsinger, R.M. Stewart and C.S. Owens. Whole Lake Fluridone Treatments for Selective Control of Eurasian Watermilfoil: II. Impacts on Submersed Plant Communities. Lake and Reservoir Management. 18(3): 181-190. Maine Department of Environmental Protection. 1989. Phosphorus Control in Lake Watersheds: A Technical Guide to Evaluating New Development. Massachusetts Department of Environmental Protection. 1997. Fish Mercury Distribution in Massachusetts Lakes. Office of Research and Standards and Office of Watershed Management. Available at: www.state.ma.us/dep/ors/files/fish_hg.pdf. Massachusetts Department of Environmental Protection. 1998. Stormwater Management Policy. Available at: www.state.ma.us/dep/brp/stormwtr/files/2103ch.pdf). Massachusetts Division of Fisheries and Game. 1948. Fisheries Report – Lakes of Plymouth, Berkshire and Barnstable Counties. Mattson, M.D., P.J. Godfrey, R.A. Barletta, and A. Aiello. 1997. Draft Generic Environmental Impact Report: Eutrophication and Aquatic Plant Management in Massachusetts. Massachusetts Department of Environmental Protection and Department of Environmental Management. McCann, J.A. 1969. An Inventory of the Ponds, Lakes, and Reservoirs of Massachusetts, Barnstable County. Water Resources Research Center, University of Massachusetts – Amherst. Publication No. 10-1. McComas, S. 1993. Lake Smarts: The First Lake Maintenance Handbook. Terrene Institute and US Environmental Protection Agency. Washington, DC. Michaud, S. 2001. Cape Cod Commission letter report to US Environmental Protection Agency regarding Evaluation of Mercury Occurrence in Freshwater Fish on Cape Cod. Murphy, J. and J.P. Riley. 1962. A modified single solution method for determination of phosphate in natural waters. Analytica Chimica Acta. 27: 31-36. Office of Technology Assessment. 1993. Harmful Non-Indigenous Species in the United States, OTA-F-565. US Congress, Office of Technology Assessment. Washington, DC. Available at: http://www.wws.princeton.edu/cgi-bin/byteserv.prl/~ota/disk1/1993/9325/932501.PDF. Orleans Water Quality Task Force. 2001. Baseline Water Quality Study for Crystal Lake, Orleans, MA. Final Report, FY2000, Department of Environmental Management Lakes and Ponds Grant. Parsons, T.R., Y. Maita and C. Lalli. 1989. Manual of Chemical and Biological Methods for Seawater Analysis. Pergamon Press. Oxford, England. Portnoy, J.W., M.G. Winkler, P.R. Sanford, and C.N. Farris. 2001a. Kettle Pond Data Atlas. Paleoecology and Modern Water Quality. Cape Cod National Seashore. National Park Service, US Department of the Interior. Wellfleet, MA.
53
Portnoy, J.W., M.G. Winkler, P.R. Sanford, and C.N. Farris. 2001b. Kettle Pond Data Atlas. Compendium of Water Quality Monitoring, 1975-1999. Cape Cod National Seashore. National Park Service, US Department of the Interior. Wellfleet, MA. Robertson, W.D., S.L. Schiff, and C.J. Ptacek. 1998. Review of Phosphate Mobility and Persistence in 10 Septic System Plumes. Ground Water. 36(6): 1000-1010. Scanlon, J. and G. Meservey. 2001. 3 Ponds Study, Orleans, MA: Crystal Lake, Pilgrim Lake, and Baker’s Pond. Strahler, A.N. 1966. A Geologist’s View of Cape Cod. The Natural History Press. Garden City, NY. Stumm, W. and J.J. Morgan. 1981. Aquatic Chemistry. John Wiley & Sons, Inc., New York, NY. U.S. Environmental Protection Agency. 2000. Nutrient Criteria Technical Guidance Manual: Lakes and Reservoirs. First Edition. EPA-822-B00-001. US Environmental Protection Agency, Office of Water, Office of Science and Technology. Washington, DC. U.S. Environmental Protection Agency. 2001. Ambient Water Quality Criteria Recommendations. Information Supporting the Development of State and Tribal Nutrient Criteria for Lakes and Reservoirs in Nutrient Ecoregion XIV. EPA 822-B-01-011. US Environmental Protection Agency, Office of Water, Office of Science and Technology, Health and Ecological Criteria Division. Washington, DC. Vollenweider, R.A. 1968. Scientific Fundamentals of the Eutrophication of Lakes and Flowing Waters, with Particular Reference to Nitrogen and Phosphorus as Factors in Eutrophication. Paris, Rep. OECD, DAS/CSI/68.27. Wetzel, R. G. 1983. Limnology. Second Edition. CBS College Publishing, New York, NY. Wu, R.S.S., B.S. Zhou, D.J. Randall, N.Y.S. Woo, and P.K.S. Lam. 2003. Aquatic Hypoxia is an Endocrine Disruptor and Impairs Fish Reproduction. Environmental Science and Technology. 37(6): 1137-1141.
Appendix A 1
Appendix A
Cape Cod Pond Snapshot Field Sampling Sheet
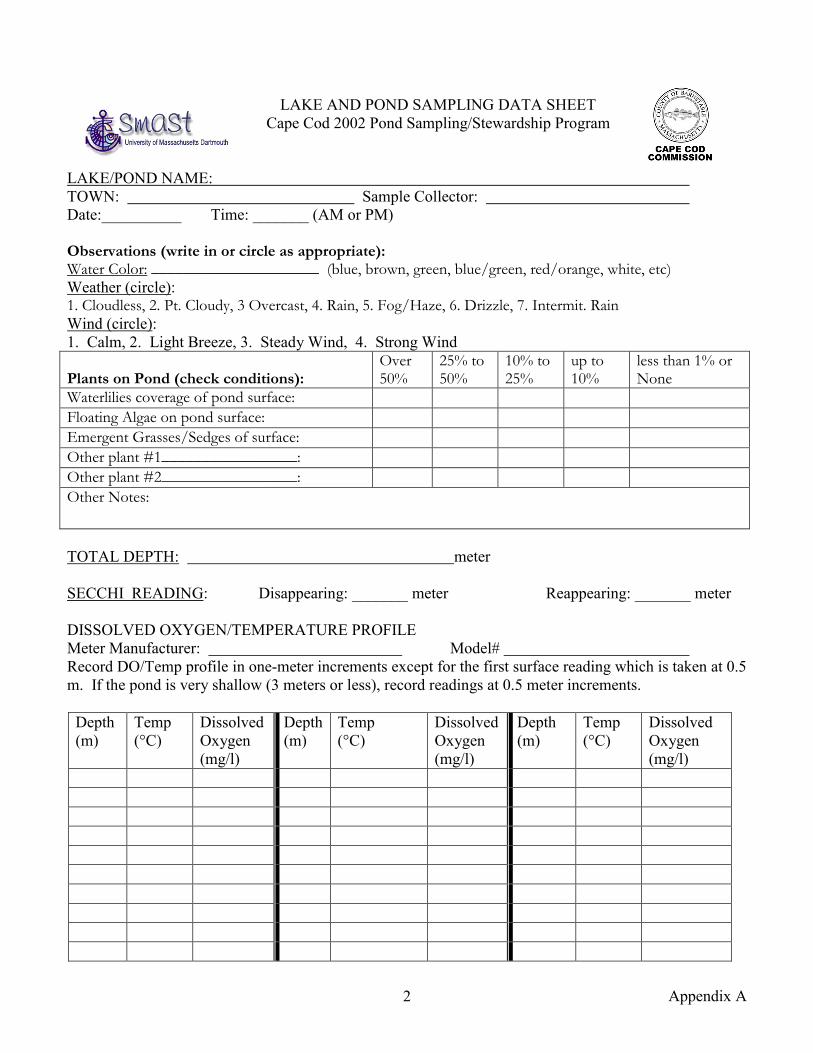
Appendix A 2
LAKE AND POND SAMPLING DATA SHEET Cape Cod 2002 Pond Sampling/Stewardship Program
LAKE/POND NAME: TOWN: Sample Collector: Date:__________ Time: _______ (AM or PM) Observations (write in or circle as appropriate): Water Color: _____________________ (blue, brown, green, blue/green, red/orange, white, etc) Weather (circle): 1. Cloudless, 2. Pt. Cloudy, 3 Overcast, 4. Rain, 5. Fog/Haze, 6. Drizzle, 7. Intermit. Rain Wind (circle): 1. Calm, 2. Light Breeze, 3. Steady Wind, 4. Strong Wind
Plants on Pond (check conditions): Over 50%
25% to 50%
10% to 25%
up to 10%
less than 1% or None
Waterlilies coverage of pond surface: Floating Algae on pond surface: Emergent Grasses/Sedges of surface: Other plant #1_________________: Other plant #2_________________: Other Notes:
TOTAL DEPTH: meter SECCHI READING: Disappearing: _______ meter Reappearing: _______ meter DISSOLVED OXYGEN/TEMPERATURE PROFILE Meter Manufacturer: Model# Record DO/Temp profile in one-meter increments except for the first surface reading which is taken at 0.5 m. If the pond is very shallow (3 meters or less), record readings at 0.5 meter increments.
Depth (m)
Temp (°C)
Dissolved Oxygen (mg/l)
Depth (m)
Temp (°C)
Dissolved Oxygen (mg/l)
Depth (m)
Temp (°C)
Dissolved Oxygen (mg/l)

Appendix A 3
LAKE/POND NAME: TOWN: Sample Collector: WATER QUALITY SAMPLING !! FILL BOTTLE TO TOP and RECORD BOTTLE #’s !! Pond greater than 9 meters deep Sampling Depth Bottle Number/Label a. just below the surface b. 3 m down c. 9 m down d. 1 m above the bottom In ponds approximately 9 m deep, collect three samples (just below the surface, 3 m down, and 1 m above the bottom). Pond less than 9 meters deep Sampling Depth Bottle Number/Label a. just below the surface b. 1 m above the bottom In ponds approximately 1 m deep, please collect two samples just below the surface TIME SAMPLING COMPLETED: ________ (AM or PM) All water samples must be kept cold, in a cooler with ice packs, and delivered to the Cape Cod Commission offices the same day (prior to 3:30 PM)! CAPE COD COMMISSION OFFICES, 3225 MAIN ST., BARNSTABLE (on 6A in Barnstable Village, across from the Post Office). SAMPLE SIGNOFFS Signature Received Delivered Date/Time Date/TimePond Monitor Sampling Coordinator Cape Cod Commission SMAST