cape town informal economy development study …psef.org.za/sites/default/files/cape town informal...
TRANSCRIPT

CAPE TOWN INFORMAL ECONOMY DEVELOPMENT STUDY
Public Sector Economists Forum: 25th November

Approach to Formulation of TOR
1. Conducted a scan of the literature available on the Informal Economy within Cape Town and the Western Cape. Important sources
1. SALGA Informal Economy Guideline
2. DEDAT Informal Sector Research Study
3. Informal Trading Policy
4. Various WIEGO and LED Network factsheets and briefs
2. Conducted a Gap Analysis to identify what was lacking and what would be useful for the City of Cape Town to know
3. Compiled a list of research questions which should be answered by the research project
4. Formulated a problem statement
5. Defined the scope of the project and the expected deliverables

Key Elements of the TOR
• Focuses on what hasn’t been done
• Adopts a ‘Developmental’ Approach – in line with the Informal Trading Policy
• Recognises the permanence of the informal economy
• Takes an integrated view of the formal and informal economies
• Moves beyond informal trading
• Seeks to quantify the size of the informal economy
• Takes an aggregate rather than case study/anecdotal approach
• Requires the formulation of a vision for the informal economy within Cape Town
• Takes a whole organisation approach
• Not a detailed strategy or implementation plan

• Size and geographic scope
• Characteristics
• Barriers to employment
Macro Analysis
• Linkages to formal
• Understanding non-trading
• Value chain analysis
Value Chain Analysis
• Consolidating and aligning
• Institutional context
• International Best Practice
• Long-term vision
Achieving a Developmental
Approach
Deliverables
1. Inception Report
2. Info Portal
3. Macro-economic
and Spatial
Report
4. Economic and
Value Chain
Modelling
5. Vision and
Framework
6. Close-out report
Spe
cifi
c A
ctiv
itie
s
Problem Statement

WORK THUS FAR

Completed sections
1. Data Bibliography Tool
2. Informal Economy Scoping Study
3. Value Chain Analyses
4. Scope of Informal Economy Report

SCOPING STUDY OF INFORMAL
WORK

Formalising the categorisation of the informal economy
Whilst various government and academic institutions have established monitoring and estimation programmes and tools for macroeconomic analysis, relatively little exists that records or documents the totality of informal economic activity in South Africa.
Methodology – Triangulation
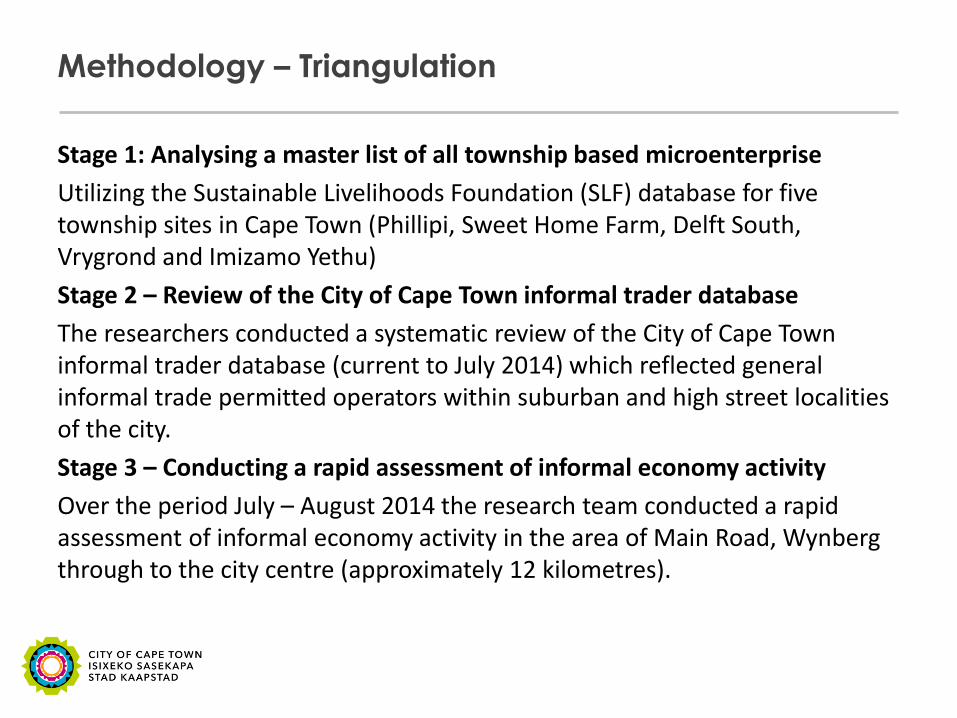
Stage 1: Analysing a master list of all township based microenterprise
Utilizing the Sustainable Livelihoods Foundation (SLF) database for five township sites in Cape Town (Phillipi, Sweet Home Farm, Delft South, Vrygrond and Imizamo Yethu)
Stage 2 – Review of the City of Cape Town informal trader database
The researchers conducted a systematic review of the City of Cape Town informal trader database (current to July 2014) which reflected general informal trade permitted operators within suburban and high street localities of the city.
Stage 3 – Conducting a rapid assessment of informal economy activity
Over the period July – August 2014 the research team conducted a rapid assessment of informal economy activity in the area of Main Road, Wynberg through to the city centre (approximately 12 kilometres).
Cape Town informal economy – common representation
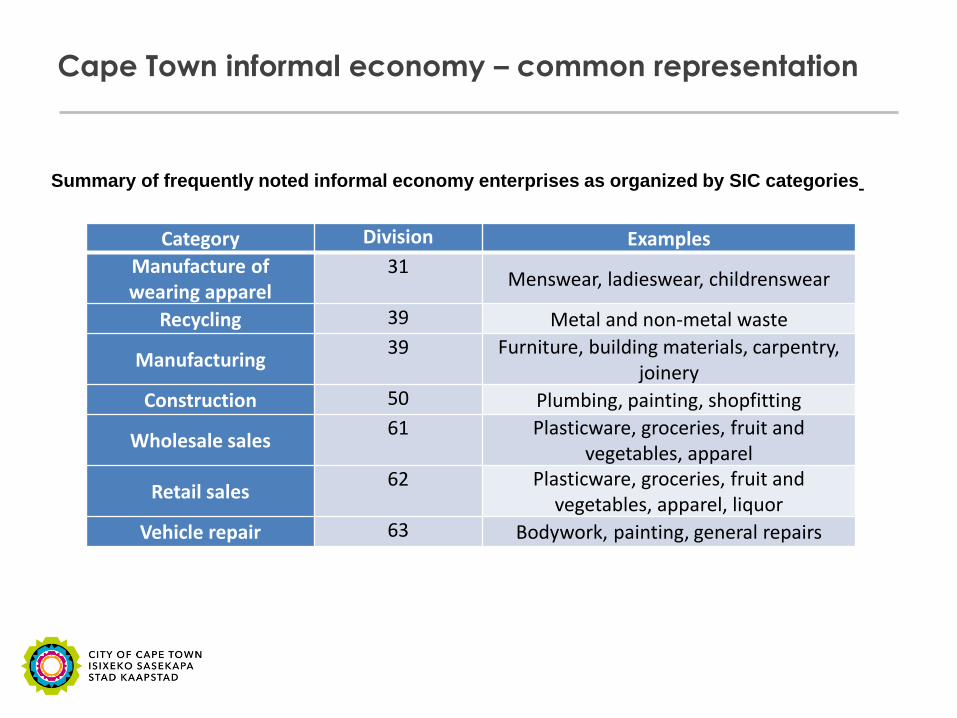
Category Division Examples
Manufacture of wearing apparel
31 Menswear, ladieswear, childrenswear
Recycling 39 Metal and non-metal waste
Manufacturing 39 Furniture, building materials, carpentry,
joinery
Construction 50 Plumbing, painting, shopfitting
Wholesale sales 61 Plasticware, groceries, fruit and
vegetables, apparel
Retail sales 62 Plasticware, groceries, fruit and
vegetables, apparel, liquor
Vehicle repair 63 Bodywork, painting, general repairs
Summary of frequently noted informal economy enterprises as organized by SIC categories
Cape Town informal economy – non representation
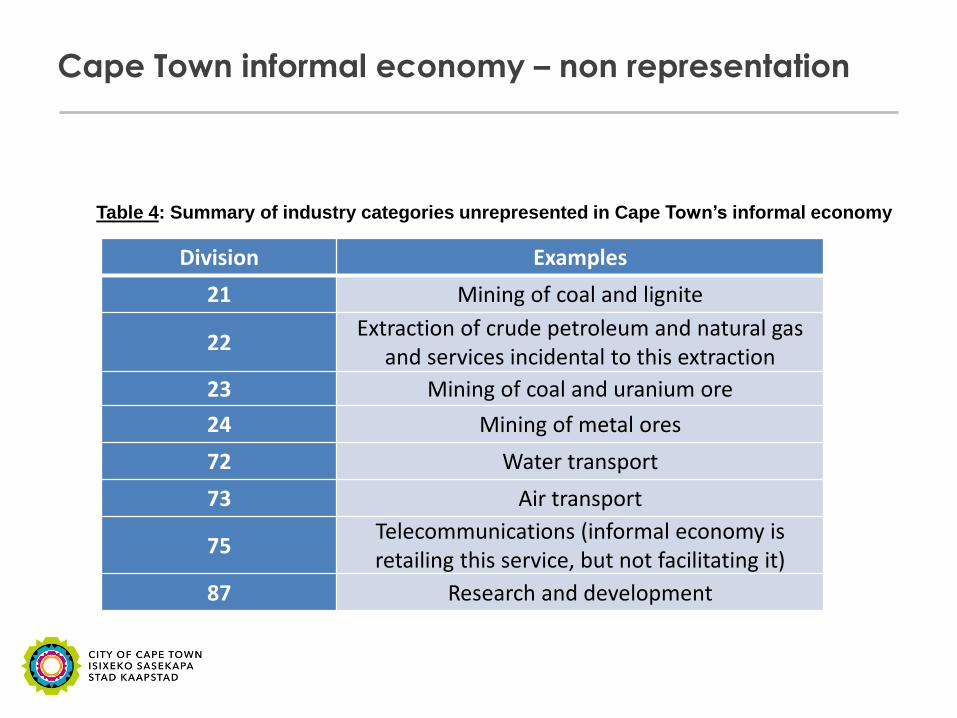
Division Examples
21 Mining of coal and lignite
22 Extraction of crude petroleum and natural gas
and services incidental to this extraction
23 Mining of coal and uranium ore
24 Mining of metal ores
72 Water transport
73 Air transport
75 Telecommunications (informal economy is retailing this service, but not facilitating it)
87 Research and development
Table 4: Summary of industry categories unrepresented in Cape Town’s informal economy

Major Categories Division Examples located in study
Description Total enterprise types noted
Forestry and logging and related services
12 Firewood clearing in public open spaces
Alien tree felling for firewood 1
Fishing, operation of fish hatcheries and farms
13 Fishing Cash based marine fishing 1
Mining and quarrying
25 Sand quarrying Digging of sand from public open space (eg Phillippi) for building purposes
1
Manufacture of other non-metallic mineral products.
34 Ceramic ware and cement block making
Building blocks for house construction 2
Manufacture of electrical machinery and apparatus, (not elsewhere classified)
36 Wire art lampshades and wire art radios
Items traded on tourist routes, mostly from pirated and re-engineered consumer electronics
2
Manufacture of radio, television and communication equipment and apparatus and of medical, precision and optical instruments, watches and clocks
37 False teeth manufacturing A home-based false teeth manufacturer
1
Manufacture of transport equipment
38 Trailer making and motor mechanics
Welding and artisanal construction 2
Collection, purification and distribution of water
42 Water supply Supply and delivery of water to street trader enterprises – such as hair salons
1
Post and telecommunication
75 Public phones and international courier services
Provision of telephones, but not of the network
2
Financial intermediation, except insurance and pension funding
81 Stokvel (umgalelo) Saving clubs
Informal financial savings clubs for collective wellbeing
2
Insurance and pension funding, except compulsory social security
82 Burial societies Informal collective insurance saving schemes for funeral costs
1
Computer and related activities
86 Computer repair Internet cafes’
Internet access and computer services in home based enterprises
2
Table 5: Categories / divisions little represented in the Cape Town informal economy

Informal economy = limited specialisation
• The SIC categories reveal that informal economy businesses reflect limited specialization compared to formal economy activities.
• Conversely a range of Cape Town formal economy activities appear able to operate in highly specialized niche markets with no informal economy equivalent.
• It is possible that the lack of informal economy equivalence is a response to barriers to entry including legislation, education or required capital investment. As such, the formal economy appears to hold relative strength in specialized services, products and processes.

Value Chain Analysis

Informal environment
Value chain – informal metalwork
Informal metalworkers
Formal suppliers - MacSteel, SA
Metal
Township consumers Informal transport
providers
Policy and by-
laws Steel manufacturers (South African)
Own transport
Value addition
Accessible on township fringe
Selling in bulk Discounts for volume
South African and foreign production of raw steel
Multiple transport opportunities Own vehicles
Supplier delivery to site
Shaping, cutting, welding and building. Owner operators
Driven by price, locality and known
relationships
Producers Wholesalers Transport Consumers
Raw steel Raw steel cut to measure Transport
Either own, or provided for bulk orders Some informal services
Margins per unit largely w/s price + margin + labour
Price addition
Steel manufacturers
(imports)
Formal environment
Individuals, skarellaars etc
Unknown localities
Galvanising
Transport


Value chain – emergent informal foodservice
Formal environment
Informal environment
Informal foodservice
Formal suppliers - Strikers, Mr Poultry
Township consumers
Informal suppliers – live chickens, bakkie trade, condiments
Informal transport providers
Policy and by-
laws
Brazil (chicken)
South Africa (chicken and other meat)
Own transport
Value addition
Accessible on township fringe
Selling in bulk Selling budget items in
demand
South African and foreign Commercial farming
Brazil growing supplier for chicken products
Multiple transport services
From wholesalers Bulk deliveries allows for high trading scale
Basic preparation, cooking, serving. Owner operator
Driven by convenience, price
and taste
Producers Wholesalers Transport Retailers Consumers
Chicken pieces - R14.50 / kg (SA) R12.50 / kg Brazil)
Chicken feet – R7.50/kg Whole birds R26.95/kg Boerwors R22.00/kg
Cost per load variable But R50-70 common per delivery inc. loading
Margins per unit +/- 50% on w/s price
Price addition

A remarkably even geographic spread!

SIZE OF THE INFORMAL ECONOMY
– STATISTICAL ANALYSIS

Matching data to questions:
• Employment rates in informal sector by demographic groups: QLFS
• Time series trends of employment numbers and rates, with a comparison to other cities: QLFS
• Relationship between education and informal sector employment: QLFS
• Contribution of informal sector to GGP of CCT: SESE
• Sectoral breakdown of activities: SESE, SLF
• Effects of informal sector on poverty and livelihoods: QLFS and SESE (together)
• Understanding participation in informal sector: QLFS and maybe QLFS panel

Employment distribution Cape Town: QLFS 2012:1 - 2014:2
wave Informal
sector Formal
Or unknown unempl discourag NEA Total
Est. Number of workers in
informal sector
1 11.31 42.97 16.56 0.18 28.99 100 283324
2 11.39 44.32 17.31 0.24 26.73 100 298151
3 11.23 44.44 17.74 0.25 26.35 100 289110
4 11.32 46.62 15.46 0.85 25.74 100 297402
5 9.64 46.09 17.43 0.31 26.52 100 251609
6 8.77 45.97 17.38 0.21 27.67 100 234455
7 9.14 45.42 18.98 0.19 26.27 100 236015
8 9.01 44.93 18.43 0.18 27.45 100 233703
9 9.45 43.41 18.21 0.12 28.81 100 248724
10 9.38 44.46 18.45 0.12 27.58 100 240444
11 9.07 45.01 17.97 0.22 27.73 100 233746
12 8.88 48.07 16.97 0.19 25.89 100 229449
13 8.58 47.43 17.23 0.31 26.46 100 226632
14 9.29 46.11 18.25 0.23 26.12 100 253594
Total 9.74 45.39 17.6 0.26 27.02 100

Comparing across other large metro areas: QLFS 2012:1 - QLFS 2014:2
Labour market state Unemployment rate
Metro/non-metro informal formal or unknown
unemployed
discouraged NEA Total Narrow Broad
Cape Town 9.74 45.39 17.6 0.26 27.02 100 24,2 24,5
eThekwini 14.99 37.37 9.52 5.45 32.68 100 15,4 22,2
Johannesburg 15.71 43.89 19.21 2.11 19.08 100 24,4 26,3
Tshwane 11.7 45.64 15.39 4.52 22.75 100 21,2 25,8
Total 13.22 43.08 15.8 2.86 25.03 100 21,9 24,9

Informal sector composition by demographic group in Cape Town QLFS 2012:1 - QLFS 2014:2
% of informal sector workers % in informal
sector Male 52.35 0.104 Female 47.65 0.091 African/Black 51.52 0.138 Coloured 34.12 0.073 Indian/Asian 0.54 0.073 White 13.82 0.078 youth 15-29 25.77 0.072 almost youth 30-34 14.91 0.109 prime 35-49 41.15 0.122 older 50 - 64 18.16 0.093 None 2.59 0.259 Less than primary 9.65 0.154 Primary 6.31 0.138 Less than secondary 46.59 0.112 Matric 24 0.075 Some tertiary 8.39 0.053 Other 2.48 0.168 Urban formal 87.07 0.092 Urban informal 12.93 0.165
Low youth participation
Clear inverse trend

Occupational distribution of informal sector employees
Main occupation Percent
Legislators, senior officials and manag 6.26
Professionals 2.33
Technical and associate professionals 5.44
Clerks 4.5
Service workers and shop and market sales 16.75
Skilled agricultural and fishery worker 0.59
Craft and related trades workers 17.06
Plant and machine operators 6.73
Elementary Occupation 22.97
Domestic workers 17.38

Industry distribution of informal sector employees
Main industry Percent
Agriculture, hunting, forestry 1.37
Mining and quarrying 0.01
Manufacturing 8.72
Electricity, gas and water supply 0.03
Construction 14.51
Wholesale and retail trade 27.23
Transport, storage and communication 6.89
Financial industry 8.93
Community, social and personal services 11.63
Private households 20.67
Total 100

Triangulating with the SLF Database