capillary electrophoresis in biotechnology industry: a look at ...ce pharm 1999 - 2008 1999, 1st...
TRANSCRIPT

Capillary Electrophoresis inBiotechnology Industry: aLook at the Last Decade
Stacey Ma, Ph. DDirector
ES Pharmaceutical Development
Feb. 5, 2009, Boston, MA Feb. 5, 2009, Boston, MA
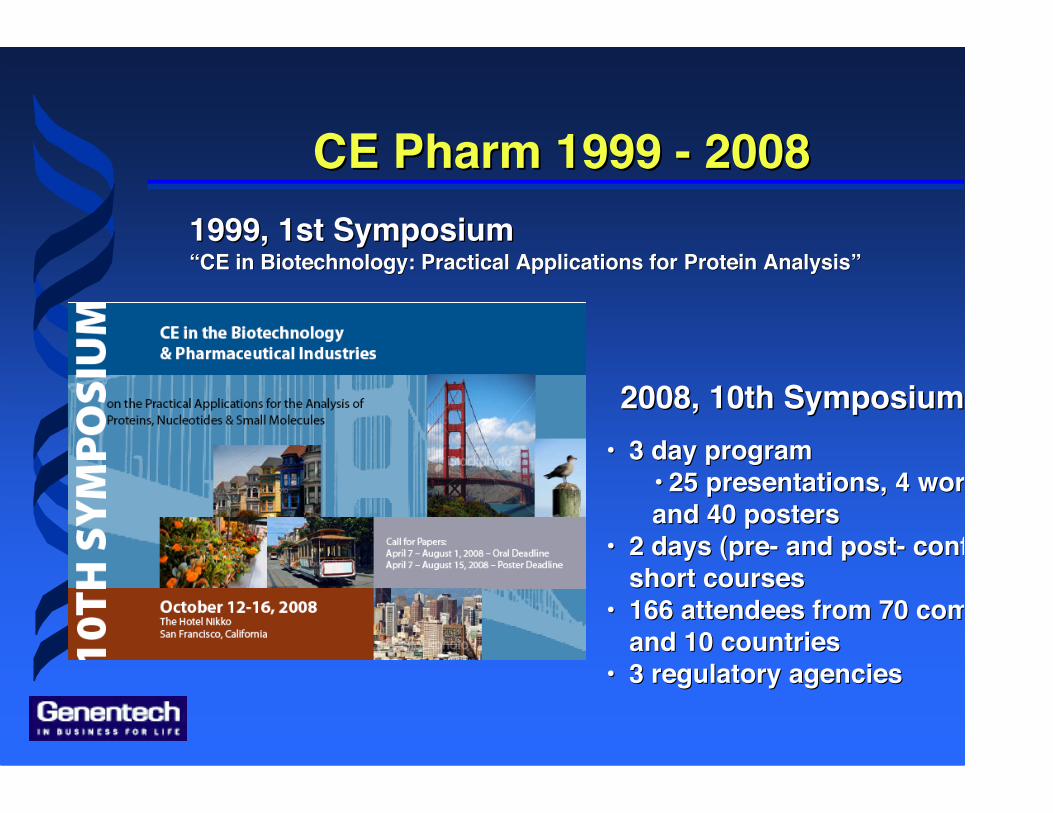
CE CE Pharm Pharm 1999 - 20081999 - 20081999, 1st Symposium1999, 1st Symposium““CE in Biotechnology: Practical Applications forCE in Biotechnology: Practical Applications for Protein AnalysisProtein Analysis””
•• 3 day program3 day program•• 25 presentations,25 presentations, 4 workshops4 workshopsand 40 postersand 40 posters
•• 2 days (pre- and post- conference)2 days (pre- and post- conference)short coursesshort courses
•• 166 attendees166 attendees from 70 companiesfrom 70 companiesand 10 countriesand 10 countries
•• 33 regulatory agenciesregulatory agencies
2008, 10th Symposium2008, 10th Symposium
New Technologies in New Technologies in Biotech/PharmaBiotech/Pharma::
•• Culture/Organizational Structure Culture/Organizational StructureFosters innovationFosters innovationStrong cross functional communicationStrong cross functional communicationUnderstanding of end-user needsUnderstanding of end-user needs
In-houseIn-houseCollaboration with academic centersCollaboration with academic centers
•• Feasibility Feasibility
•• Application Application Business needBusiness needRegulatory acceptanceRegulatory acceptanceDealing with uncertainty vs current landscapeDealing with uncertainty vs current landscape

CE at Genentech: When It All StartedCE at Genentech: When It All Started
•• Late 1980 Late 1980’’ss——early 1990early 1990’’ss
Pioneering work by Tony Chen, Glenn Hunt, Pioneering work by Tony Chen, Glenn Hunt,Kathy Kathy MoorhouseMoorhouse, Glenn , Glenn Teshima Teshima and Matt Fieldand Matt Fieldin collaboration with Barry in collaboration with Barry KargerKarger’’s s groupgroup
Work published showing feasibility with cIEF Work published showing feasibility with cIEFfor complex therapeutics and for complex therapeutics and MAbMAb
Technique used for early troubleshooting forTechnique used for early troubleshooting forMVM PCR based detectionMVM PCR based detection
Old PACE series and Bio-Rad Instruments Old PACE series and Bio-Rad Instruments

CE at Genentech: CE at Genentech: PoC PoC EstablishedEstablished
•• 1996 - 1997 1996 - 1997
Glycan Glycan profiling of a monoclonal antibody:profiling of a monoclonal antibody:•• critical measurement that correlated to protein activitycritical measurement that correlated to protein activity•• CE deemed the best quantitative toolCE deemed the best quantitative tool•• First CE assay in the QC licensed control system (GlobalFirst CE assay in the QC licensed control system (Global
approval, US, EU and Japan)approval, US, EU and Japan)•• Perfect application: relative distribution among speciesPerfect application: relative distribution among species
Introduction of cIEF as an identity test for a Introduction of cIEF as an identity test for a monoclonal antibody at the Drug Product Stagemonoclonal antibody at the Drug Product Stage
CE can be used in routine quality control settingCE can be used in routine quality control setting

CE at Genentech:CE at Genentech: Application ExpansionApplication Expansion
•• 1998 - 2000 1998 - 2000
Significant expansion in CE efforts with focus onSignificant expansion in CE efforts with focus onreplacement of gel-based techniques (IEF andreplacement of gel-based techniques (IEF and
SDS-PAGE)SDS-PAGE)•• Development, validation and global regulatory approval ofDevelopment, validation and global regulatory approval of
a CE-SDS assay for a a CE-SDS assay for a rMAb rMAb and a therapeuticsand a therapeutics•• Replacement of SDS-PAGE for commercial productsReplacement of SDS-PAGE for commercial products•• Recruitment of additional CE expertsRecruitment of additional CE experts•• Collaboration work with Instrumentation CompaniesCollaboration work with Instrumentation Companies
Launch of First International Conference of Launch of First International Conference of ““CE inCE inthe Biotech and Pharmaceutical Industriesthe Biotech and Pharmaceutical Industries”” in in19991999——San FranciscoSan Francisco

CE at Genentech: Years of ImplementationCE at Genentech: Years of Implementation
•• 2001 - 2005 2001 - 2005 Establishment of CE technology platforms thatEstablishment of CE technology platforms that
can be implemented with minimum changescan be implemented with minimum changesacross products in development for clinical releaseacross products in development for clinical release
Significant expansion of CE applications in allSignificant expansion of CE applications in allareas with CMC (process Development, productareas with CMC (process Development, productcharacterization, formulation studies,characterization, formulation studies, routine QCroutine QCtestingstestings))
Global transfer of CE assays (CZE, CE-SDS) toGlobal transfer of CE assays (CZE, CE-SDS) tomultiple GNE sites and EU/Japan collaboratorsmultiple GNE sites and EU/Japan collaborators
Advanced training, troubleshooting courses andAdvanced training, troubleshooting courses andimplementation of Global CE assay monitoringimplementation of Global CE assay monitoring
CE at Genentech: Next Generation ApplicationsCE at Genentech: Next Generation Applications
•• 2006 and beyond 2006 and beyond
Establishment of CE-MS as a robust and practical toolEstablishment of CE-MS as a robust and practical toolto support CE assay and product characterizationto support CE assay and product characterization
Throughput enhancementThroughput enhancement•• Development of automation of sample preparation Development of automation of sample preparation•• Reducing analysis timeReducing analysis time•• Parallel analysisParallel analysis
Expansion of CE applications beyond protein andExpansion of CE applications beyond protein andcarbohydrate analysiscarbohydrate analysis

The Secret to CE at Genentech
The Devil is in the DETAILS!!!!!!The Devil is in the DETAILS!!!!!!

CapillaryCapillary: : Narrow, Fragile , made out of fusedsilica Outer coating: polyimide (~5-10 um)
Cut Carefully! Don’t cut by adding pressure!Ensure ends are even cut End of coating is not frizzled
The Good(Clean Cut)
The Bad(Pressure Cut)
The Ugly(Tapped on labdesk)
CE Applications at GenentechCE Applications at Genentech
•• Carbohydrate analysis Carbohydrate analysis
•• CE - MS CE - MS
SDS-PAGE CE-SDSSDS-PAGE CE-SDSIEFIEF Capillary Capillary isoelectric isoelectric focusingfocusing
•• Replacement of slab gel techniques Replacement of slab gel techniques
•• Adjunct to HPLC techniques Adjunct to HPLC techniques capillary zone electrophoresiscapillary zone electrophoresis•• protein variants, i.e., charge or protein variants, i.e., charge or hydrophobicity hydrophobicity basedbased

Capillary Electrophoresis - SodiumCapillary Electrophoresis - SodiumDodecylsulfate Dodecylsulfate (CE-SDS)(CE-SDS)
capillary filled with entangled capillary filled with entangled hydrophilic polymer solutionhydrophilic polymer solution
replaceable sieving matrix replaceable sieving matrix improved reproducibility improved reproducibility
Polymer SievingPolymer Sieving
protein forms complex with SDS protein forms complex with SDS complexes have same charge to complexes have same charge to
size ratiosize ratio separation solely based on the separation solely based on the
hydrodynamic sizehydrodynamic size proteins migrate in order of proteins migrate in order of
increasing sizeincreasing size
Separation MechanismSeparation Mechanism
DetectorDetector
DetectorDetector

Applications of CE-SDSApplications of CE-SDS•• CE-SDS is a complementary tool to SEC for assessingCE-SDS is a complementary tool to SEC for assessing
size heterogeneitysize heterogeneity
•• For For rhuMAbsrhuMAbs,, the sizethe size variants include:variants include:•• free light / heavy chain fragments free light / heavy chain fragments•• proteolytic proteolytic fragmentsfragments•• non-dissociable higher MW species non-dissociable higher MW species•• glycosylation glycosylation occupancy related speciesoccupancy related species
•• Detection sensitivity can be tailored Detection sensitivity can be tailored•• UV detection (UV detection (Coomasie Coomasie Blue staining sensitivity)Blue staining sensitivity)•• LIF detection (silver staining sensitivity)LIF detection (silver staining sensitivity)

CE-SDS:CE-SDS:Analysis of Analysis of rhuMAb rhuMAb Size HeterogeneitySize Heterogeneity
0.000
0.010
0.020
0.030
0.040
0 3 6 9 12 15
Ab
so
rban
ce a
t 220 n
m (
AU
)
Minutes
14
22
31
Protein size standards (kD)
45
66
97
116
200
Non-reduced
Reduced
Intact antibody
Light Chain
Heavy Chain
S. Ma and W. S. Ma and W. NashabehNashabeh, , ChromatographiaChromatographia, 2001, , 2001, VolVol. 53, S-75.. 53, S-75.

CE-SDS:CE-SDS:Analysis of rhuMAb Analysis of rhuMAb Proteolytic Proteolytic FragmentsFragments
G. Hunt and W. Nashabeh, G. Hunt and W. Nashabeh, Anal Chem. Anal Chem. 1999, 71, 2390-2397.1999, 71, 2390-2397.

CE-SDS:CE-SDS:Analysis of rhuMAb Glycosylation OccupancyAnalysis of rhuMAb Glycosylation Occupancy
0
0.01
0.02
0.03
0.04
0.05
0.06
0.07
0.08
4 5 6 7 8 9 10
AU
at
22
0 n
m
Minutes
0
0.01
0.02
0.03
0.04
0.05
0.06
0 5 10 15
AU
at
220 n
m
Minutes
rhuMabrhuMab
rhuMabrhuMab treated treatedw/PNGasew/PNGase F F
50/5050/50comixcomix
rhuMabrhuMab
rhuMabrhuMab treated treatedw/PNGasew/PNGase F F
50/5050/50comixcomix
2/982/98comixcomix
Non-ReducedNon-Reduced ReducedReduced
S. Ma and W. Nashabeh, S. Ma and W. Nashabeh, ChromatographiaChromatographia, 2001, Vol. 53, S-75., 2001, Vol. 53, S-75.

0
0.005
0.01
0.015
0.02
0.025
0.03
0 2 4 6 8 10 12
Ab
so
rba
nc
e @
22
0 n
m (
AU
)
Minutes
CE-SDS for Process Development:CE-SDS for Process Development:Recovery Process Development for a Recovery Process Development for a rhu rhu F(abF(ab’’))22
Effect of Column Flow RateEffect of Column Flow Rate(Immobilized Enzyme Column)(Immobilized Enzyme Column)
0
10
20
30
40
50
60
70
50 100 200 300 400
Pe
rce
nt
Pe
ak
Are
a
Flow rate [cmh]
Peak Main Peak*
*
*
*
Load
Pool 50 cm/h
Pool 200 cm/h
Pool 400 cm/h
R. R. FahrnerFahrner, S. Ma, M. , S. Ma, M. MulkerrinMulkerrin, N. , N. Bjork Bjork and G. Blank, and G. Blank, ““Scale-up ad Optimization inScale-up ad Optimization inPreparative ChromatographyPreparative Chromatography””, New York, Marcel Dekker, 2003., New York, Marcel Dekker, 2003.

DerivatizationDerivatization
O
C O
O
SE
(CH3)2N N(CH3)2
+
SE = NC O
O
O
O
5-Carboxytetramethylrhodamine,5-Carboxytetramethylrhodamine,succinimidylsuccinimidyl ester ester
•• MW = 528 MW = 528•• compatible with Argon-ion laser compatible with Argon-ion laser•• abs max 546 nm abs max 546 nm•• emission max 579 nm emission max 579 nm
CE-SDS with LIF detectionCE-SDS with LIF detection

CE-SDS / LIF: Silver Staining SensitivityCE-SDS / LIF: Silver Staining Sensitivity
Therapeutic rhuMAb
CE conditions:CE conditions:Fused silica capillaryFused silica capillary50 µm x 24 cm;50 µm x 24 cm;SDS run buffer (SDS run buffer (Bio-RadBio-Rad););20°C; reversed polarity,20°C; reversed polarity,15 kV; Argon-Ion laser,15 kV; Argon-Ion laser,480480 nm excitation / 560nm excitation / 560 nmnmemission.emission.
a. non-reduceda. non-reducedb. reducedb. reduced
G. Hunt and W. Nashabeh, G. Hunt and W. Nashabeh, Anal Chem. Anal Chem. 1999, 71, 2390-2397.1999, 71, 2390-2397.

1:1
20:1
12:110:1
5:1
Corrected Peak AreaPercent for Aggregate
(%)
Normalized CPA forMonomer*
Dye:proteinmolarratio
1.60.9012:1
0.931.010:1
2.80.8020:1
0.320.715:1
0.100.231:1
*Normalized to the value of the D/P ratio of 10:1
Optimization of Dye-to-protein (D:P) Molar Ratio
Degree of labeling determined by LC-ESI/MS
Salas-Solano, O. et al Anal.Chem . 2006, 78, 6583 - 6594.
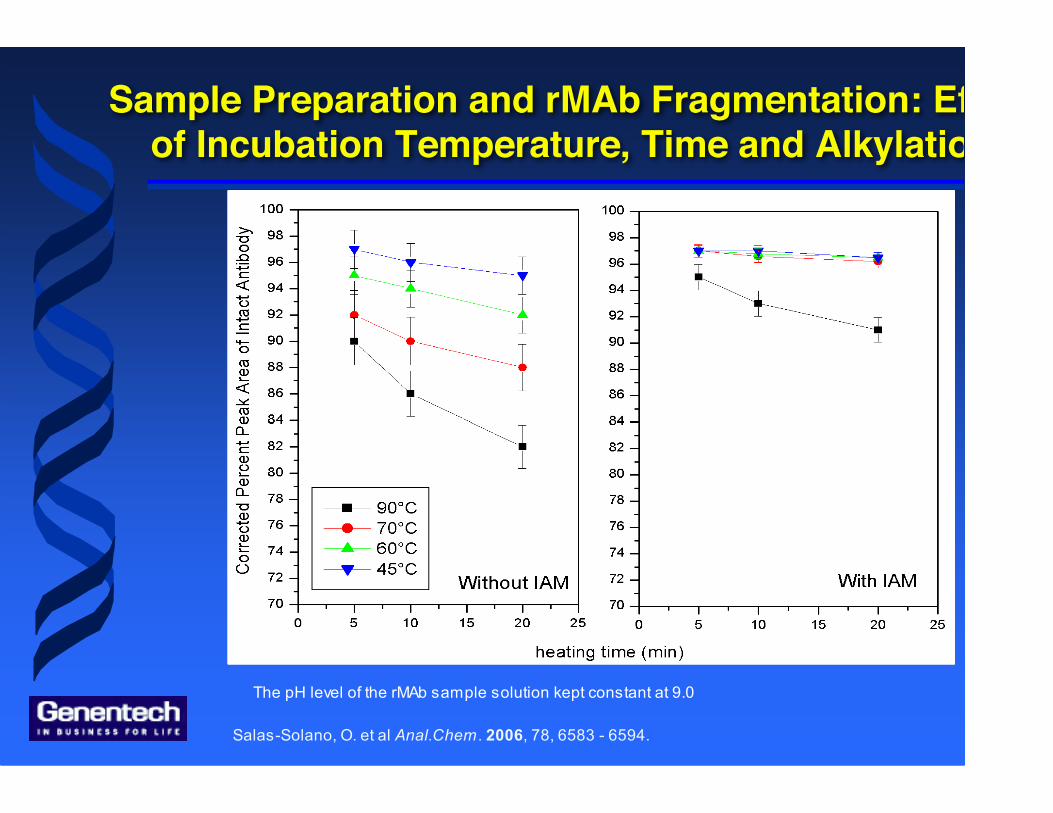
Sample Preparation and rMAb Fragmentation: Effectof Incubation Temperature, Time and Alkylation
The pH level of the rMAb sample solution kept constant at 9.0
Salas-Solano, O. et al Anal.Chem . 2006, 78, 6583 - 6594.
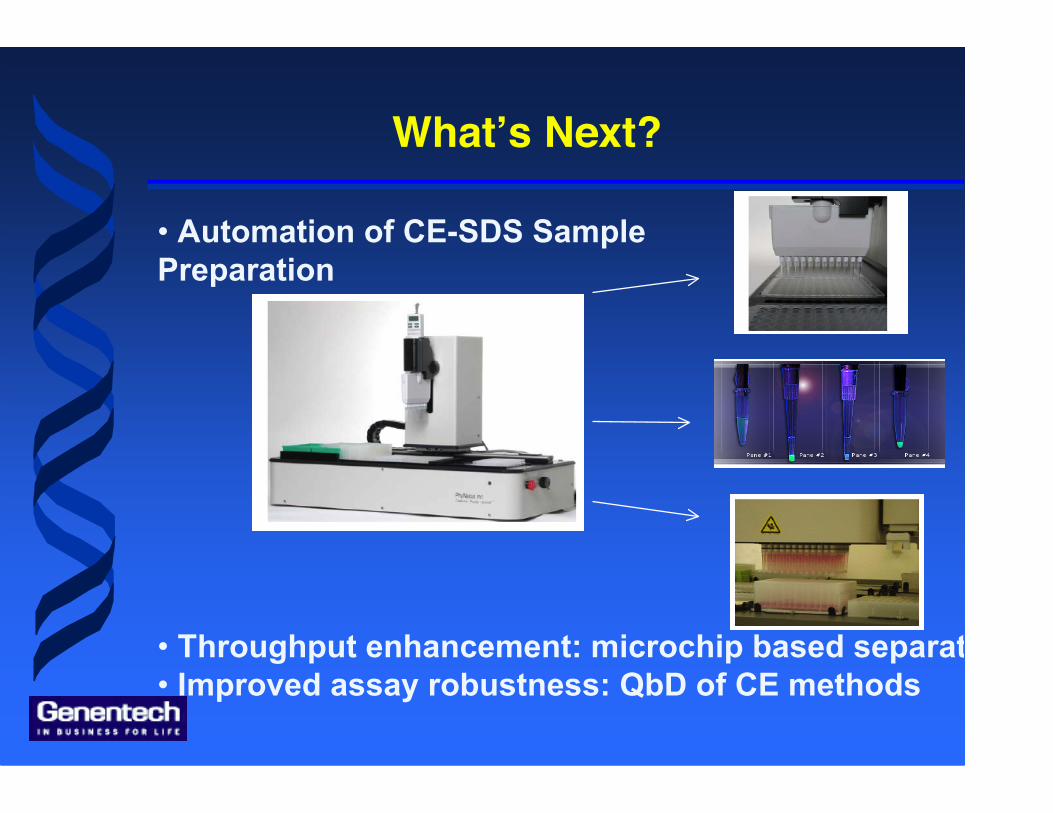
What’s Next?
• Automation of CE-SDS SamplePreparation
• Throughput enhancement: microchip based separation• Improved assay robustness: QbD of CE methods
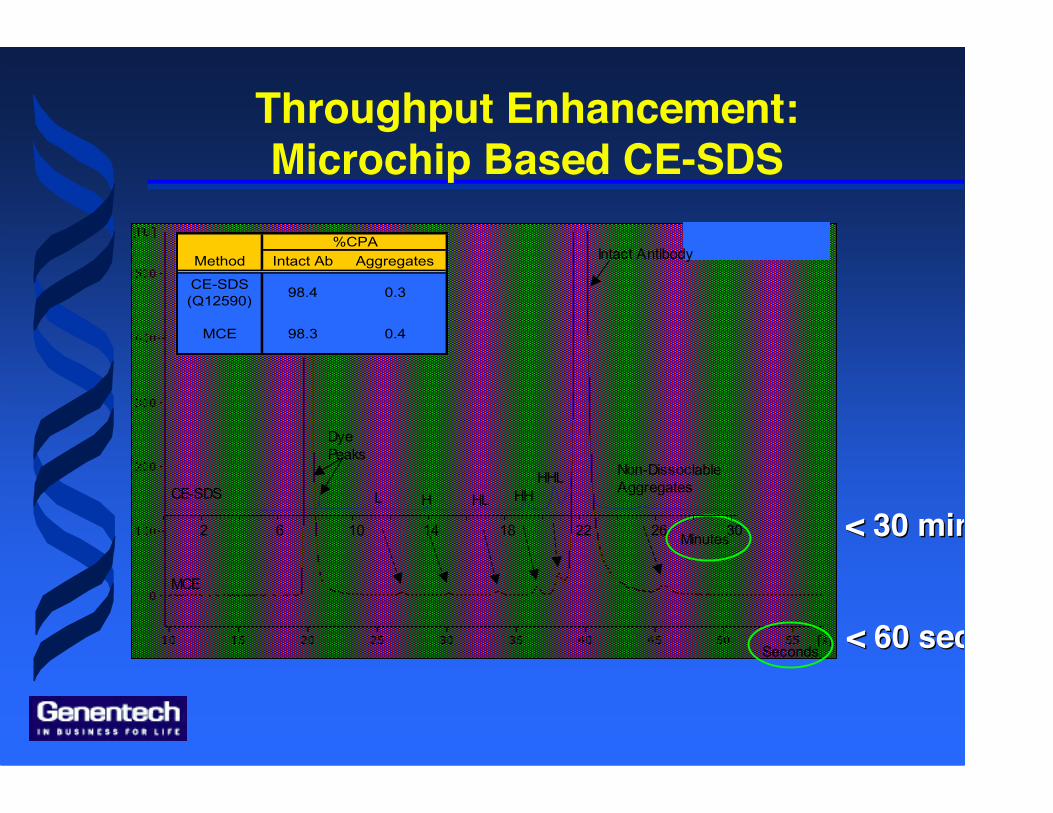
Throughput Enhancement:Microchip Based CE-SDS
Seconds
Intact AntibodyMethod Intact Ab Aggregates
CE-SDS
(Q12590)98.4 0.3
MCE 98.3 0.4
%CPA
MCE
2 6 10 14 18 22 26 30
HHLHHHLHL
DyePeaks
Non-DissociableAggregatesCE-SDS
Minutes
< 60 seconds< 60 seconds
< 30 minutes< 30 minutes

+
− +
+
−
−centerpoint (0)
+
[KCN]
DTP
Time
− +
+
−
−
37°C 60°C
QbD QbD of CE Methods: Define Method Design Space of CE Methods: Define Method Design Space • A new approach using furoyl-quinoline-carboxaldehyde (FQ) dye
was employed to simplify sample preparation
• Traditionally, method development involves “one factor at a time”studies which require several days of experiments
• A half-factorial DOE design was used to study the impact of 4critical factors:
– Dye to protein ratio, [KCN], incubation temperature, and time
Responses:– sensitivity (defined by peak area)– % intact antibody– % aggregation– % incomplete reduction

Capillary Capillary Isoelectric Isoelectric Focusing (cIEF)Focusing (cIEF)
HH++ OHOH--
FocusingFocusing
MobilizationMobilization
Sample loadingSample loading
HH++ OHOH--
DetectorDetector
DetectorDetector
HH++
DetectorDetector
OHOH--
pressurepressure salt salt zwitterionzwitterion

Applications of cIEFApplications of cIEF
•• Determination of pI value Determination of pI value
•• Purity PurityMonitor charge heterogeneityMonitor charge heterogeneity
•• Identity IdentityEach protein has a unique pI and/or Each protein has a unique pI and/or electrophoreticelectrophoretic profile profile

Application of cIEF: Application of cIEF: Determination of Apparent pI Value Determination of Apparent pI Value
15
16
17
18
19
20
21
22
23
7 7.5 8 8.5 9 9.5 10 10.5
y = 40.9 - 2.54x R2= 0.992
Min
ute
s
pI
0
0.02
0.04
0.06
0.08
0.1
0 5 10 15 20 25
Ab
so
rba
nc
e a
t 2
80
nm
(A
U)
Minutes
pI markers
10.1
7.7
5.3
7.2
6.2
rhuMab
Blank
0-Lys
1-Lys
2-Lys
0-Lys: 9.00-Lys: 9.0
2-Lys: 9.22-Lys: 9.21-Lys: 9.11-Lys: 9.1
S. Ma and W. Nashabeh, S. Ma and W. Nashabeh, ChromatographiaChromatographia, 2001, Vol. 53, S-75., 2001, Vol. 53, S-75.
0
0.07
0.14
0.21
0.28
10 12 14 16 18 20 22
Ab
so
rba
nc
e @
28
0 n
m
Minutes
Intact protein
Neuraminidase
CpB + Neu
pI 7.9pI 5.3
Carboxypeptidase-B
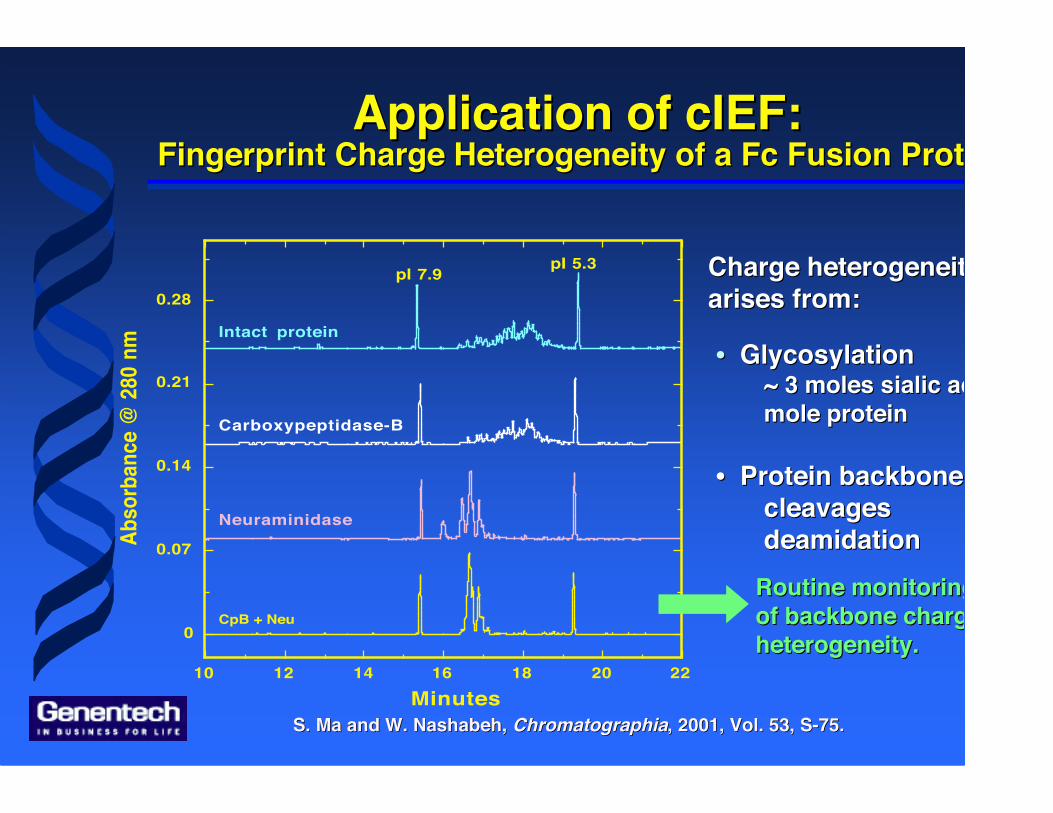
Application of cIEF: Application of cIEF: Fingerprint Charge Heterogeneity of a Fc Fusion ProteinFingerprint Charge Heterogeneity of a Fc Fusion Protein
•• Glycosylation Glycosylation~ 3 moles ~ 3 moles sialic sialic acid peracid permole proteinmole protein
•• Protein backbone Protein backbonecleavagescleavagesdeamidationdeamidation
Charge heterogeneity Charge heterogeneity arises from:arises from:
Routine monitoringRoutine monitoringof backbone chargeof backbone chargeheterogeneity.heterogeneity.
S. Ma and W. Nashabeh, S. Ma and W. Nashabeh, ChromatographiaChromatographia, 2001, Vol. 53, S-75., 2001, Vol. 53, S-75.

Carbohydrate Analysis by CECarbohydrate Analysis by CE
•• Profiling of N-linked oligosaccharides Profiling of N-linked oligosaccharides
•• Quantitative analysis of monosaccharide Quantitative analysis of monosaccharide
•• exposed terminal monosaccharide residues, i.e.,exposed terminal monosaccharide residues, i.e.,galactose galactose and and ß-N-acetylglucosamineß-N-acetylglucosamine

G0
G1, G1’
Man5
G2
G0-F, G2+NANA,G0-GlcNAc, etc.
Typical Glycosylation Observed for RecombinantMonoclonal Antibody Produced in CHO

APTS-Saccharide APTS-Saccharide ConjugateConjugateReductive Reductive AminationAmination
HOAcHOAc / /NaBHNaBH33CNCN
+O
CH2OH
OH
H
OH H
X
HH
OR
OHCH2OH
H
OH H
X
HH
ORCH O
SO3-
NH2
- O3S SO3
-
OH
H
OH H
X
HH
ORH2C SO3
-NH
- O3S SO3-
8 - 8 - aminopyreneaminopyrene - 1,3,6 - - 1,3,6 - trisulfonatetrisulfonate (APTS) (APTS)
R. Evangelista, M. Liu and A. Chen, R. Evangelista, M. Liu and A. Chen, Anal Chem. Anal Chem. 1995, 67, 2239-2245.1995, 67, 2239-2245.
R = sugar moietyR = sugar moietyX = OH or X = OH or NHAcNHAc
CH2OH
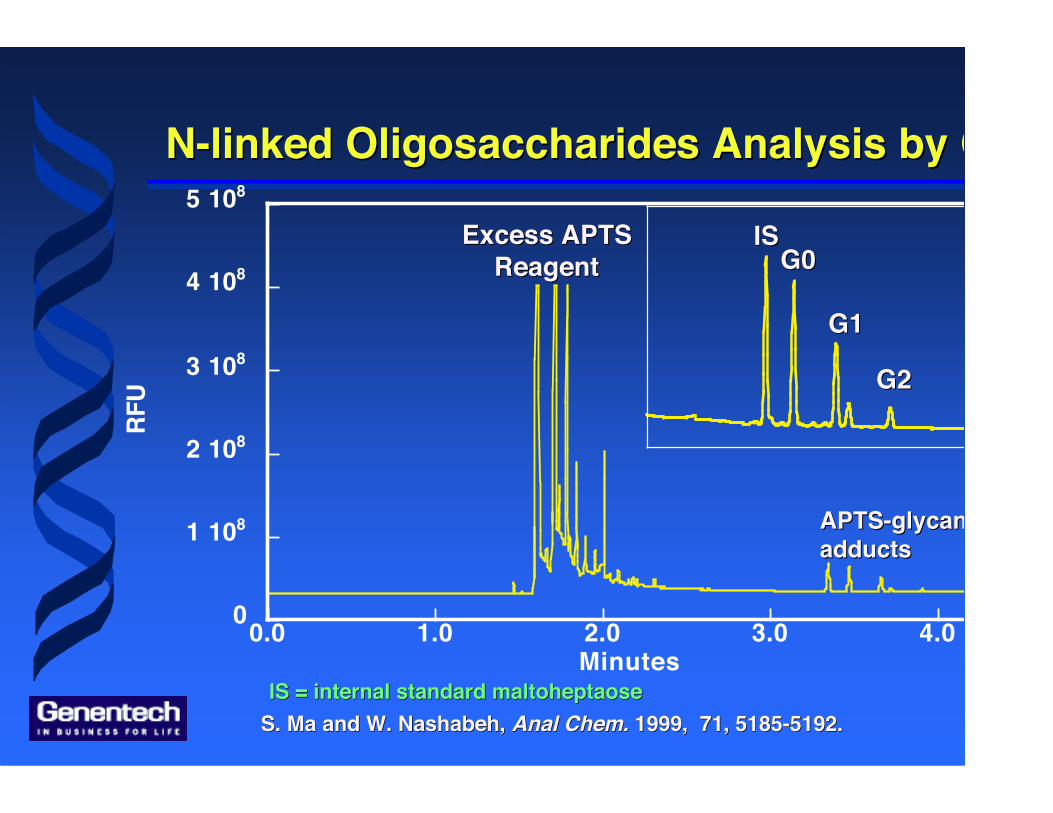
S. Ma and W. Nashabeh, S. Ma and W. Nashabeh, Anal Chem. Anal Chem. 1999, 71, 5185-5192.1999, 71, 5185-5192.
0
1 108
2 108
3 108
4 108
5 108
0.0 1.0 2.0 3.0 4.0
RF
U
Minutes
N-linked Oligosaccharides Analysis by CEN-linked Oligosaccharides Analysis by CE
Excess APTSExcess APTSReagentReagent
ISISG0G0
G1G1
G2G2
APTS-glycanAPTS-glycanadductsadducts
IS = internal standard IS = internal standard maltoheptaosemaltoheptaose

Characterization of the Positional Isomers via Enzymatic Digestion Characterization of the Positional Isomers via Enzymatic Digestion
!-N-Acetylhexosaminidase!-N-Acetylhexosaminidase
(Streptococcus pneumoniae,
Oxford GlycoSciences)
(Streptococcus pneumoniae,
Oxford GlycoSciences)
" 1-2,3 Mannosidase *" 1-2,3 Mannosidase *
(recombinant, New England BioLabs)(recombinant, New England BioLabs)
* S. T. Wong - Madden and D. Landry, Glycobiology (1995), 5, 19-28.* S. T. Wong - Madden and D. Landry, Glycobiology (1995), 5, 19-28.
Gal (" 1, 6)Gal (" 1, 6) Gal (" 1, 3)Gal (" 1, 3)
Cleaves only terminal Man "1-3
and Man "1-2
Cleaves only terminal Man "1-3
and Man "1-2
Asialo-, monogalactosylated biantennary, core-substituted with fucoseAsialo-, monogalactosylated biantennary, core-substituted with fucose
S. Ma and W. Nashabeh, S. Ma and W. Nashabeh, Anal Chem. Anal Chem. 1999, 71, 5185-5192.1999, 71, 5185-5192.

0
5
10
15
20
25
30
2.5 3 3.5 4 4.5
RFU
Minutes
Electropherograms Obtained After Each Enzymatic Digestion
Electropherograms Obtained After Each Enzymatic Digestion
PNGase F
!-N-Acetyl-hexosaminidase
" 1-2,3Mannosidase
or
or
CE conditions: eCAP™ N-CHO capillary 50 µm x 27 cm; carbohydrate gel separation buffer; reversed polarity; 20 kV; 20 µA; 20° C; Argon -ion laser, emission 488 nm, excitation 520 nm.CE conditions: eCAP™ N-CHO capillary 50 µm x 27 cm; carbohydrate gel separation buffer; reversed polarity; 20 kV; 20 µA; 20° C; Argon -ion laser, emission 488 nm, excitation 520 nm.
S. Ma and W. Nashabeh, S. Ma and W. Nashabeh, Anal Chem. Anal Chem. 1999, 71, 5185-5192.1999, 71, 5185-5192.
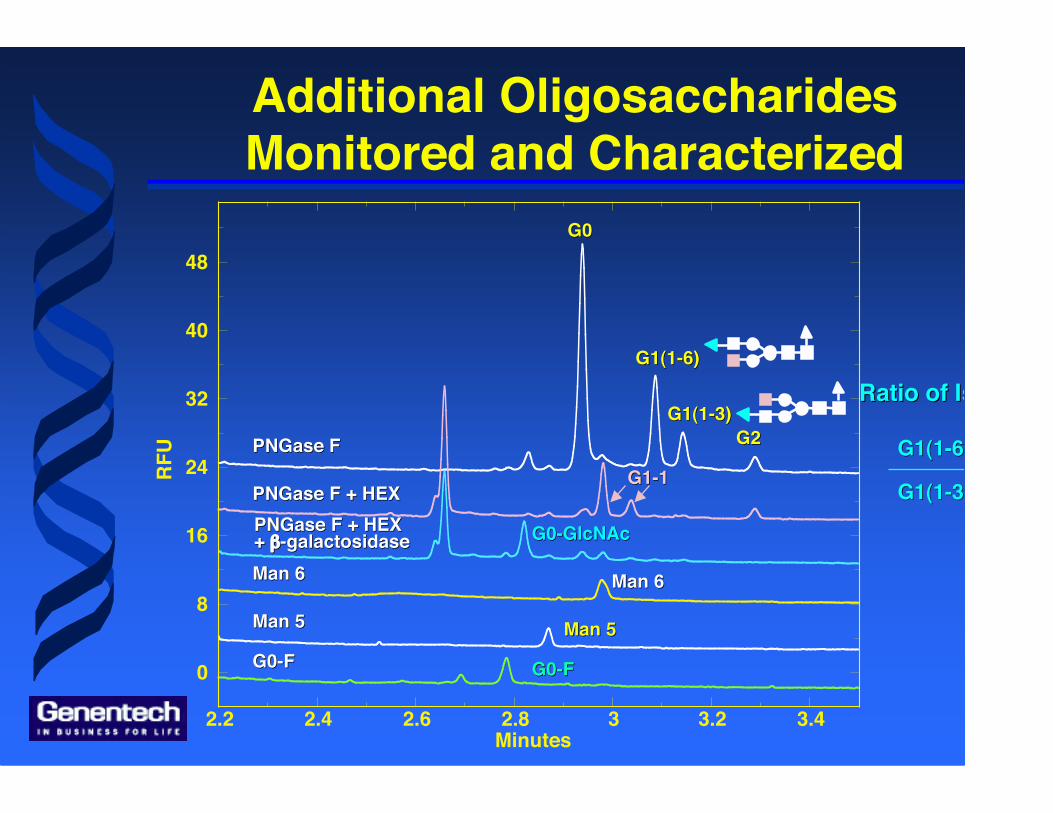
0
8
16
24
32
40
48
2.2 2.4 2.6 2.8 3 3.2 3.4
RFU
Minutes
Additional OligosaccharidesMonitored and Characterized
PNGase PNGase FF
PNGasePNGase F + HEX F + HEXPNGasePNGase F + HEX F + HEX+ + ββ-galactosidase-galactosidaseMan 6Man 6
Man 5Man 5
G0-FG0-F
G0G0
G1(1-6)G1(1-6)
G1(1-3)G1(1-3)G2G2
G1-1G1-1
G0-GlcNAcG0-GlcNAc
Man 6Man 6
Man 5Man 5
G0-FG0-F
G1(1-6)G1(1-6)
G1(1-3)G1(1-3)~ 3.2~ 3.2
Ratio of Ratio of IsoformsIsoforms::
• Automation to support cell culture processdevelopment/characterization
– miniaturization (<50 ug)– high sample capacity (faster turnaround)– automation (decrease injury)
• CE - MS for characterization– Robust, sensitive tools to characterize new and
small peaks– Critical to have comparable CE-UV/LIF and CE-MS
profiles
WhatWhat’’ss Next?Next?

Workflow Comparison
Desalt/ Buffer Exchange
Manual Method Automated Method
Recover oligosaccharides
Protein Purification
55°CWater bath
100 - 300 ug MAb
PNGase F digestion37°CWater bath
95°C Heat blockSpeedvac
APTS Label
Analyze by CE-LIF
HPLC - Protein Acolumn
Recover oligosaccharides
55°CThermocycler
25 - 50 ug MAb
PNGase F digestion37°CThermocycler
95°C ThermocyclerSpeedvac
APTS Label
Analyze by CE-LIF
Protein PurificationOasis - Protein Atips
560 minutes/56 samples560 minutes/56 samples
60 minutes/96 samples60 minutes/96 samples
x 3 fold increasex 3 fold increaseinin assay capacityassay capacity

20.041.70.30.266Automation90.141.620.965Manual
RSDSD%G0-FRSDSD%G0
Automated Automated Glycan Glycan Assay - Faster and BetterAssay - Faster and Better
•• Faster - Assay capacity increased 3 foldFaster - Assay capacity increased 3 fold•• Better - Assay precision improved Better - Assay precision improved 5 fold5 fold
G0-F Man5 Man6
G0
G2
G0-GlcNAc
G1-
Glc
NA
c
G1’
-Glc
NA
c
G1
G1’

CE-LIF-MS Setup: Coaxial Shealth Interface
TOF MS
LIF Detection Cell(20cm from ESI tip)
GroundedESI Sprayer Tip
Sheath Liquid4 µL/min
PVA Coated Capillary(50 µm ID x 100 cm)
CE Inlet
CE Instrument
-30 kV
488 nm Laser
Goal:Goal: Minimize additional resolution lossMinimize additional resolution loss in CE/MSin CE/MSL. L. GennaroGennaro, O. Salas-Solano and S. Ma, , O. Salas-Solano and S. Ma, Anal Anal BiochemBiochem. . 2006, 355, 249-258.2006, 355, 249-258.L. L. Gennaro Gennaro and O. Salas-Solano, and O. Salas-Solano, Anal Anal ChemChem. . 2008, 80, 3838-3845.2008, 80, 3838-3845.
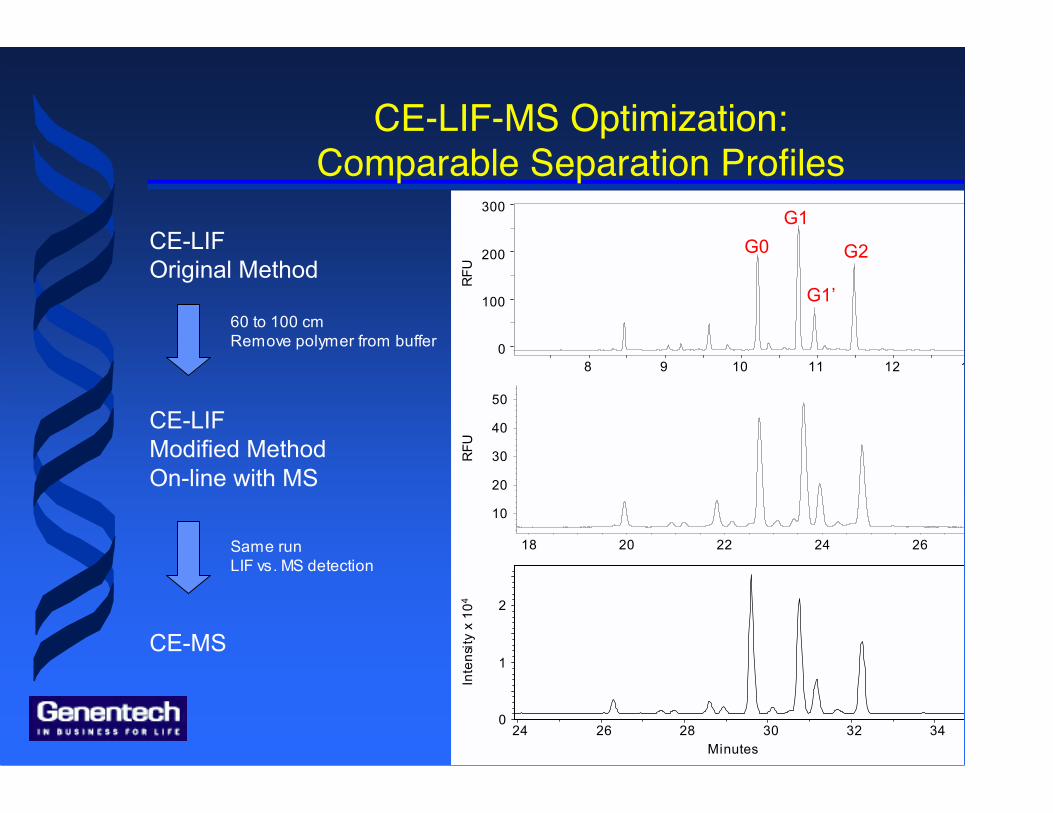
CE-LIF-MS Optimization:Comparable Separation Profiles
CE-LIFOriginal Method
CE-LIFModified MethodOn-line with MS
CE-MS
Same runLIF vs. MS detection
60 to 100 cmRemove polymer from buffer
Minutes
8 9 10 11 12 13
RFU
0
100
200
300
18 20 22 24 26
RFU
10
20
30
40
50
24 26 28 30 32 340
1
2
Inte
nsity
x 1
04
G0G1
G1’
G2

16 18 20 22 24 26 28 30
RF
U
6
8
10
12
14ADC1 A, ADC CHANNEL A (LYNN082007 \GLYCAN_000006.D)
28 29 30 31 32 33 34 35 36 37 38 39 40 41 42
RFU
0
10
20
30
40
On-line CE-LIF
0
1000
2000
3000
Intens.
24 26 28 30 32 34 36 38Minute
CE-LIF only
CE-MS
Separation Profiles - Comparable
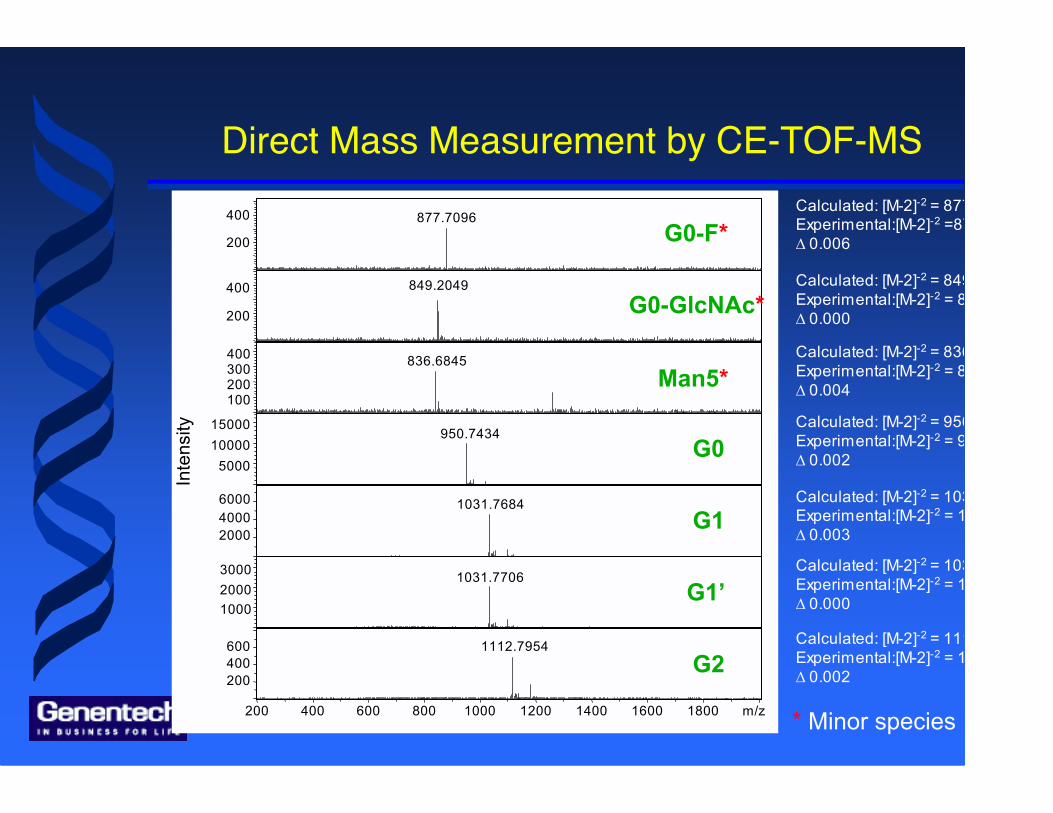
Direct Mass Measurement by CE-TOF-MSCalculated: [M-2]-2 = 877.716Experimental:[M-2]-2 =877.710∆ 0.006
Calculated: [M-2]-2 = 849.205Experimental:[M-2]-2 = 849.205∆ 0.000
Calculated: [M-2]-2 = 950.745Experimental:[M-2]-2 = 950.743∆ 0.002
Calculated: [M-2]-2 = 1031.771Experimental:[M-2]-2 = 1031.771∆ 0.000
Calculated: [M-2]-2 = 1112.797Experimental:[M-2]-2 = 1112.795∆ 0.002
Calculated: [M-2]-2 = 1031.771Experimental:[M-2]-2 = 1031.768∆ 0.003
Calculated: [M-2]-2 = 836.689Experimental:[M-2]-2 = 836.685∆ 0.004
877.7096
849.2049
836.6845
950.7434
1031.7684
1031.7706
1112.7954
200
400
Inte
nsity
200
400
100200300400
50001000015000
200040006000
100020003000
200400600
200 400 600 800 1000 1200 1400 1600 1800 m/z
G0-GlcNAc*
Man5*
G0-F*
G2
G1
G1’
G0
* Minor species (~1%)
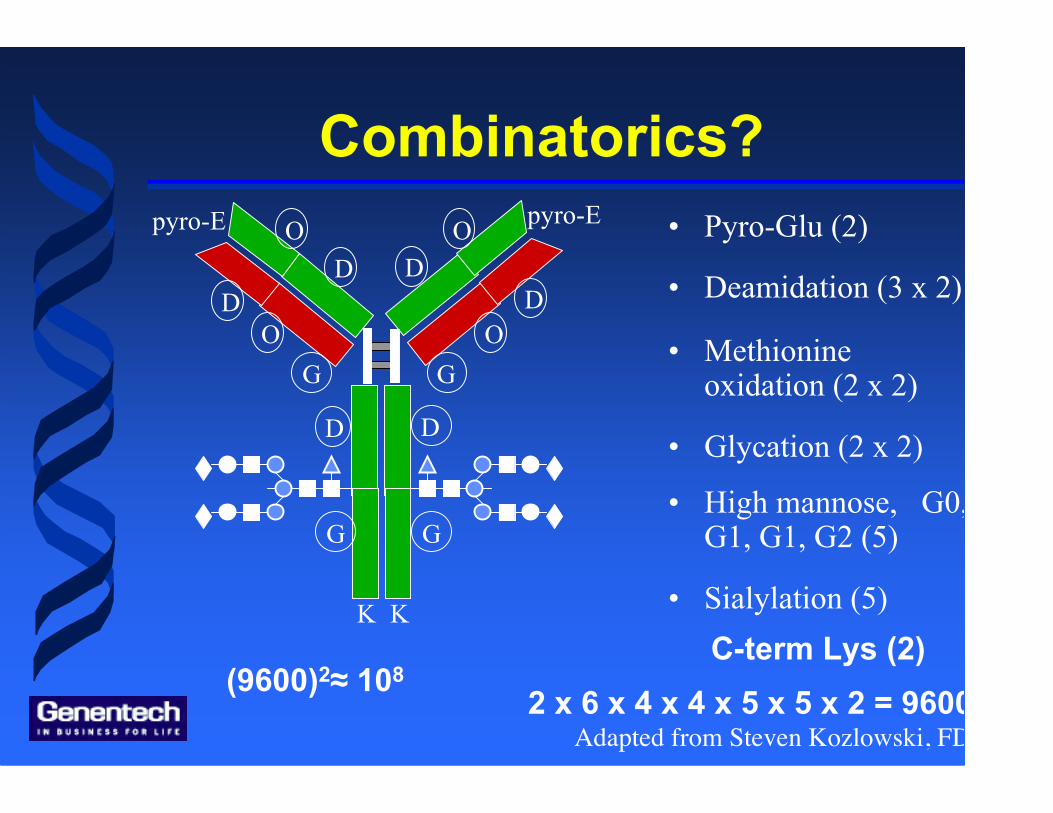
Combinatorics?
Adapted from Steven Kozlowski, FDA2 x 6 x 4 x 4 x 5 x 5 x 2 = 9600
DO
O O
O
• Methionineoxidation (2 x 2)
pyro-E pyro-E • Pyro-Glu (2)D
D
D D
D
• Deamidation (3 x 2)
G
G G
G
• Glycation (2 x 2)
(9600)2≈ 108
K KC-term Lys (2)
• Sialylation (5)
• High mannose, G0,G1, G1, G2 (5)
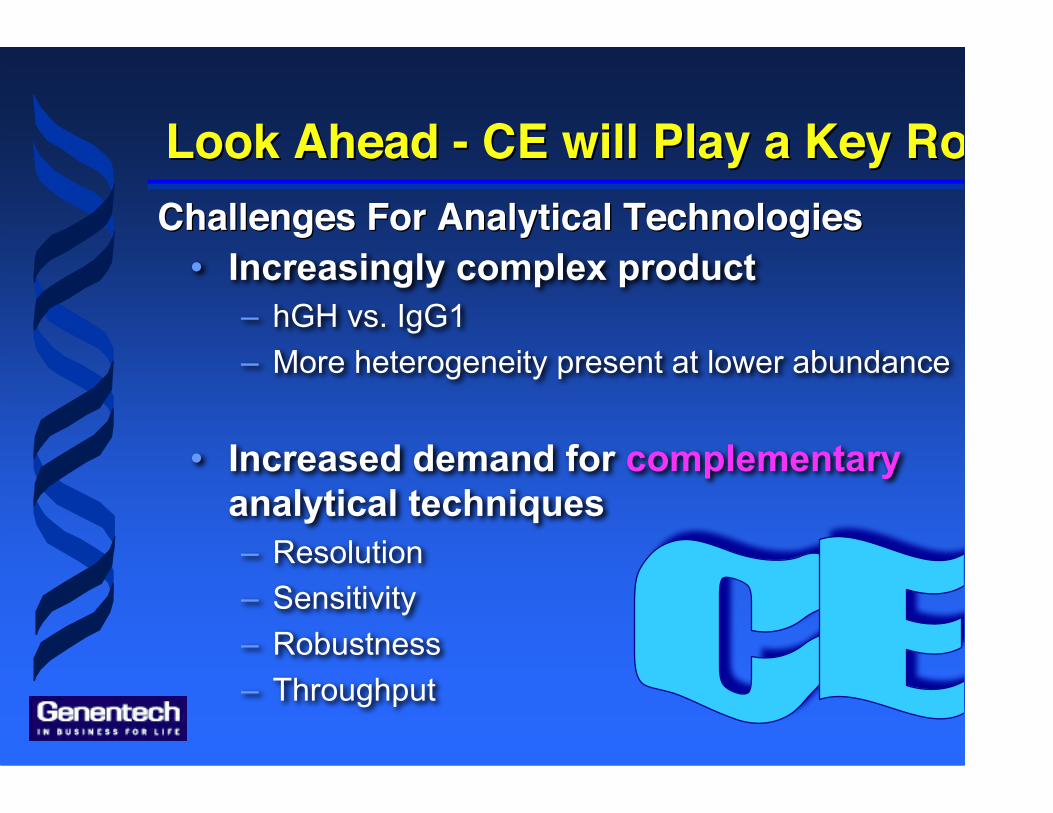
• Increasingly complex product– hGH vs. IgG1– More heterogeneity present at lower abundance
• Increased demand for complementaryanalytical techniques– Resolution– Sensitivity– Robustness– Throughput
Challenges For Analytical TechnologiesChallenges For Analytical Technologies
Look Ahead - CE will Play a Key Role!Look Ahead - CE will Play a Key Role!
CE CE Pharm Pharm 20092009
Oct 9 - 16, Boston Park PlazaOct 9 - 16, Boston Park Plaza

AcknowledgmentsAcknowledgments
Wassim NashabehWassim NashabehTony ChenTony ChenGlenn HuntGlenn HuntKathy Kathy MoorhouseMoorhouseLori Lori SchalkSchalkRod KeckRod KeckAndy JonesAndy JonesEleanor Eleanor Canova Canova DavisDavis
CE Task Force MembersCE Task Force MembersInstrumentation VendorsInstrumentation Vendors
Oscar Salas-SolanoOscar Salas-SolanoWendy LauWendy LauLynn Lynn GennaroGennaroDavid David MichelsMichelsChantal FeltenChantal FeltenSarah DuSarah DuDieter Dieter SchmalzingSchmalzingBelen Belen TadasseTadasseYun Yun TangTang