capillary pressure
DESCRIPTION
capillary pressure modelTRANSCRIPT
I Soci.ty of Petrolam Engineers
SPE 29890
Development of a Mod~led CapillaryPressure J-Punction
Noaman 13-Khatib*, King Saud University
● SPE Member
Copyight 1995, Society of Petroleum Engineers, Inc.
Thw paper was prepared for presentation at the SPE Middle East 011Show held in Bahrain, 11-14 March 1995.
This paper was selected for presentation by an SPE Program Committee following review of information contained in an abstract submtted by the author(s), Contents of the paper,a.?presented, have not been rewewed by the Society of Petrolem Engineers and are subject to correction by the author(s). The material, as presented, does not necessarily refIect anyposition of the %xiety of Petroleum Engineers, Its officers, or members. Papers presanted at SPE meetmgs are subject to pubhcation review by Edtorml Committees of the Soc!etyof Petroleum Engineers. Permission to copy is restricted to an abstract of not more than 3CKIwords, Hlustratlonsmay not be copied. The abstract should contain conspicuousacknowledgmentof where and by whom the paper is presented, Wriie Llbrarlan, SpE, p,o. Box .W3R36 Richard-in. TX 760R3.3Rw+ 1I s A Tab. +m9AK C9CI ST
Capillary pressure curves arerepresented by the equation Pc=a / (&Wb. It is shown that for the LeverettJ–function to produce a singlecnrrelatifm ~~~ ~Q~~Q~~y, t~~ ~fi~------------ ,
ducible water saturation and thesaturation exponent b must be the samet— *L. Xcc-.+ 4’— “*:. . . A - _..l:C id1m La= Ulllcl cub 1u IUUUUU3. la ILLuuulcu
capillary pressure function J* isintroduced that incorporates the tor–tuosity and irreducible water saturationim;te Anf{niti mm The mnAifi Orl fmnrtinn-. a.. “.. —-”-. . u. -“”-..” . “-.--s.is correlated with the normalizedsaturation SD so that atl curves willhave their vertical asymptotes at a singlepoint SD=O. The modified functionrepresents a significant impro- vementover the original one since it is nowsufficient to have the value of thesaturation exponent b be the same fortwo samples to get the same correlation.This was verified by analyzing datafrom the literature and compating thetwo correlations. A modified linearregression by means of weighted least
Refereemes and illustrationat end of paper
squares method is used to fit theexperimental capillary pressure data.Data sets from different sources wereanalyzed. It was found that a goodsingle correlation can be obtained forsamples from the same formation butthe correlations were different fordifferent formations.
INTRODUCTION
The capillary phenomena occursin porous media when two or moreimmiscible fluids are present in the porespace. Due to the interracial energy ofthe interface between the two phases, adifference in the pressure across theinterface results and causes a curvatureof the interface. The capillary forcescauses retention of fluids in the porespace against the gravity forces.Immiscible fluids segregate due togravity if placed in large containerssuch as tanks and pipes of largediameters. In porous rocks, however,the dense fluid (water) can be found athigher elevations above the oil-watercontact. Capillary pressure is defined as
547
k
2 DEVELOPMENT OF A MODIFIED CAPILLARY PRESSURE J-FUNCTION SPE 29890
the difference in pressure between thenonwetting and wetting phases
PC = P~ly – P~ (1)
Since the gravity forces are balanced bythe capillary forces, capillary pressureat a point in the reservoir can beestimated from the height above the oil-water contact and the difference in fluiddensities. For an oil-water system
PC=(~-~)gh (2)
As stated earlier, the difference inpressure causes the interface betweenthe two phases to be curved. Therelation between curvature and cpillarypressure is given by
2ts COS8Pc= ~ (3)
where, R is the average radius ofcurvature. The curvature of the interfacebetween the two fluids and the shape ofthe pore space (or of the grains)determine the saturation of the twophases. The relation between thesaturation (usually of the wetting phase)and capillary pressure is expressed interms of a capillary pressure curve orretention curve. If the porous mediumis homogeneous, i.e. it has the samepore size distribution everywhere, aunique capillary pressure-saturationrelation (PC–& curve) exists for thesystem. Different porous media,however, will have d~ferent capillarypressure curves. The shapes of thecapillary pressure curves are dependenton the pore space geometry and thuscan be used to characterize the porousmedia.
Capillary pressure curves areusually determined in the laboratory inroutine core analysis by the mercuryinjection method. The determination ofcapillary pressure using reservoir fluidsis usually done by the restored-statemethod or using a centrifuge. The
mercury injection method is fast and thecomplete curve for the entire range ofsaturation is obtained in one run. Othermethods are time consuming and acomplete run is needed at eachsaturation. Dynamic measurements ofcapillary pressures during simultaneousflow of the two immiscible phases werealso repotted. Comparison betweenresults from the clifferent methodsrevealed the similarity of the obtainedP&3w curves. Data obtained using a. .c~ pfi of fluids ~~ be e~fi~e~uedfor other fluids using the relation
Pc, ( a Cose ],
— = (G COSO j2Pc~[4)
Capillary pressure curves maybe determined under drainage orimbibition conditions. Under drainageconditions, a nonwetting phase isdisplacing a wetting phase, i.e. mercurydisplacing air or air or gas displacingwater or oil. Under imbibitionconditions a wetting phase is displacinga nonwetting phase as for thedisplacement of oil by water in a waterwet rock. When repeated cycles ofdrainage and imbibition tests areperformed, hysteresis are observed inthe capillary pressure curves. Initially inan oil or gas reservoir underlain b ywater, equilibrium exists underdrainage conditions.
Drainage capillary pressurecurves are characterized by a nirreducible wetting phase saturation anda threshold or displacement pressure.Threshold pressure, pd, is the minimumapplied pressure needed for the wettingphase to start desaturating. It can berelated to the largest pore size accordingto Eq. (3). The irreducible wettingphase saturation corresponds to thefluid volume retained in very smallpores and adsorbed on the surfaces ofthe solid grains and is not displacedunder existing applied pressures. At theirreducible saturation the capillary
548
SPE 29890 NOAMAN
pressure curve approaches a vetticalasymptote.
Capillary forces as reflected bycapillary pressure curves affect therecovery efficiency of oil displaced by—-.—.wacer, gas or differeiit ciieti cais.Capillary pressure functions are thusneeded for performing reservoirsimulation studies of the different oilrecovery processes.
Interpretation of capillarypressure curves can yield usefulinform ations regarding the petro-physical properties of rocks and thefluid rock interaction. Pore sizeA:e-xk,,*; -A=nf,,fe—Dah; l;tv an?iumulu uut)ii, auauLub- y=u-w-a.~ --
relative pmneabilities to the wetting andnon–wetting phases can be derivedfrom capillary pressure curves if certainsimplifying assumptions are made.
Purcell 1 presented relations forestimating absolute and relativepermeabilities from capillary pressurecurves. Burdine et a12showed how thecapillary pressure curves can be used toobtain a pore size distribution function.U.l . . . ~~ Ti pFi e 3 pf~S~n~~~ ~JLullil Ga
procedure for estimating the contact
angle 6 at reservoir conditions fromlaboratory capillary pressure data andsaturation vs. depth data from weiilogs. Thomeefl?s suggested that capi–nary pressure curves can be representedby a hyperbola on a log-log scale. Hecorrelated the permeability to thegeometric parameters of the hyperbola.SwansonGalso correlated air and liquidpermeabilities with the value of (P&)at the point of intersection of a line of45” with the capillary pressure curve.
Because of the heterogeneity ofreservoir rocks, no single capillarypressure curve can be used for theentire reservoir. Attempts were made tocorrelate capillary pressure curves withthe petrophysical properties of thereservoir rocks. Scaling capillary
EL-KHATIB 3
pressure to the different fluids isachieved by dividing the capillarypressure by the product of theinterracial tension and the cosine of thecontact angle (aces 6). Leverett7 wasthe first to introduce a dimensionlesscapillary pressure comehtion function.The Leverett J-function is defined as
This function which is
(5)
sometimestermed the universal J–function did notproduce a single correlation for thedifferent types of formations. Browna,comeiating data for a iWg~ number ifcarbonate cores, concluded that the J–correlation should be used for coresfrom a single formation and thatimprovement is obtained if thecorrelation is restricted to specificlithologic types from the sameformation. Rose and Bruce9 alsopresented correlations for 8 differentformations showing separatedistinguishable curves for the differentformations.
Another comelation of capillarypressure data was presented by Guthrieand Greenbergerl 0. They suggestedI;nmavr.nw.Plsti nfi nf ~~ w~~ &@M%ltiQil--- . . . . “.—.- .-.
& with porosity $ and the logarithm ofpermeability k at a constant value of thecapillary pressure.
%=al$+azlogk+c (6)
Also quadratic terms of $ and logk wereadded to Eq. (6) and a better correlationwas obtained. Wright and Woodyl’applied this correlation to a group ofcapillary pressure curves of differentpermeabilities but with constant poro–sity. Flethcerlz suggested the use of theGuthrie-Greenberger approach t oconstruct an average capillary pressure
curve corresponding to average k and ~
549
4 DEVELOPMENT OF A MODIFIED CAPILLARY PRESSURJZ J-FUNCTION SPE 29890
from a series of capillary pressurecurves of different k and $ from thesame reservoir.
Alger et al 1s suggested a linearcorrelation of the hydrocarbon volume
$(1 -Sw) with the porosity $, per-meability k and capillary pressure Pc(or height h)
$(1-~ =a+b$+clogk+dlogh
.. . .. . (7)
Unlike the Leverett J–function,the other correlations are merelycrossplot for constant values of Pc anddo not attempt to normalize the capillarynressure in terms of a dimensionless=- -–––function. The J–function, however,does not result in a single correlationcurve for clifferent formations. Sincethe J–function scales each capillarypressure curve by multiplying all thepoints of the curve by the same factor[(/(k/$) / (ucos8)], individual capillarypressure curves will retain their verticalasymptotes at their respective values ofirreducible water saturations. Since theirreducible water saturations is usuallynot the same for the differentformations, it is only logical to expectdifferent J–curves for those formations.Logicat reasoning leads us to believethat using a normalized saturation scalemay improve the J–correlation. Thenormalized saturation SDis defined as
SW- S~iSD= 1- S~i
1.m\\z3)
*,–. -— -4. .– , l.. . . .u smg uus aemmon.s, aii capiiiarypressure curves will have the commonvalue of S~O at their irreducible watersaturation and hence will have the samevertical asymptote.
The flow rate of a fluid in acircular tube of constant radius R isgiven by the Hagen-Poiseuille formula
TcR2AP Af R2 APQ=—=8pLe 8pLe (9)
where, A~= nR2 is the cross-sectionalarea of the tube and Le is the actuallength of the tottuous tube.
Fluid flow through porousmedia is given by the empirical Darcylaw.
k Awt APQ= ~L (lo)
where, Atotis the total cross-sectionalarea (pores + matrix) and L is length ofthe system.
@l~ Q in ~S. (9) and(10) gives
Af R2k=r
tot Le
[18T
since
so
(Af/Awt)=$/ [(~/L)] (12)
Substituting Eq. (13) into Eq. ( 11),we get
(13)
SPE 29890 NOAN.AN EL-KHATIB 5
t=(&/L)2 (14)
Equation (14) is the basis formost of models developed to correlatepetmphysicd properties of porousmedia. There are two main approachesof development.
The first approach is that ofKozeny14 and Carmanls which usesthe concept of hydrauiic radius. Thehydraulic radius of a conduit is the ratioof the volume to the wetted surfacearea. For circular tube, the hydraulicradius is half the tube radius.Substituting R=2Rh in Eq. (14)
(15)
Kozeny assumed that Eq. (15) wouldbe valid for any porous medium. Since
R~=~/S (16)
where, S is the specific surface area perunit bulk volume of the rock.
Substituting Eq. (16) into Eq. (15),gives
+3 $3k=—=—
2~ S2 KZ S2(17)
It has been shown by Dullien16that Eq. (15) is not comect for shapesother than circular tubes of constantradius. He showed a deviation of theformula even for circular tubes ofunequal diameters connected in parallelor in series. It can be assumed,however, that any deviation can b eaccounted for by the factor Kzwhich iscalled the Kozeny constant. Atheoretical value of Kz of 5 wasobtained for packings of spheres ofconstant diameter. However, fa- tictiiaiporous media wide variation of KZwasobserved for clifferent formations.
Kozeny equation can also be expressedin terms of surface area per unit grainvolume S or pore volume Sp. The
fmost wide y used form is that in termsof Sg “
The second approach ofmodeling is that introduced by Purcelll.The porous medium is assumed to becomposed of tubes of different sizes Ri_:. L .--L “-- ~...: -- . f--inn f theWwn mwn Si&c UUV* a AL-...”SS o. “...pore volume A&+ Since the tubes areparallel, the permeability of the systemis given by [from Eq. (i 3~
(19)
Using equation (3) to express the poreradius Ri in terms of capillary pressureP.- c:
z A~i$ (UCOSO]2 ~Ri ~k=~
i ci
For a continuous system
(20)
(21)
Purcell used a lithology factor A
which is equivalent to l/T.
Equation (21) represents thetheoretical basis for the Leverett J-correlation. It can be written in thefollowing form
551
DEVELOPMENT OF A MODIFIED CAPILLARY PRESSURE J-FUNCTION SPE 298906
1
[==1 T] ... ... (22)
Equation (22) reveals that the J-function as proposed by Leverett is notunique for all porous media. Theintegral of the reciprocal of the squareof the function over the saturation rangeis dependent on the tortuosity whichwill be clifferent for the clifferentformations. This equation gives a clueto the modification of the J–function.Inclusion of the tortuosity in thedefinition of the function lets theintegral has a value of 2 for allformations .
Equation (22) can also be used
to evaluate the tortuosity t
DEVELOPIKI!IIW OF TEEMODIFIED J-FUNCI’ION
(23)
Since capillary pressure curveshave a vertical asymptote at theirreducible water saturation Swi, theshape of the curve suggests theC. fi -—:-- -—AJ-.I -..1 -.:--iunuwmg empmczu mxamm
a~> Swi
(S//-%)bPC= (24)
m Sw<swi
Substituting Eq. (24) for PCin Eq. (21)to evaluate the absolute permeability,
Since l/PC2 = O for & < &i, theintegration is catied out between &iand 1. Evaluating the integral in Eq.(~) md reqing we get
1 dkl~1_%f2btl)/2
.=—Ocose 4’ 4% +2b + 1
. . . . . . (26)
Dividing Eq. (24) by Eq. (26), weget
. . . . . . (27)
The left hand side of Eq. (27) is theLeverett J-function. So we have
, Jo-%)J=~”~
[1
42~ 42b+1 % - %vi
l-%i
. . . . . . (28)
Equation (28) shows that the J-functionis not a unique function of t h esaturation SW. It depends on the two
parametem h and T. If the normalizedsaturation defined by Eq. (8), SD, isused, Eq. (28) can be reammged in thefollowing form
(1)
r T L7E7JJ =— =
l-SWi(29)
s:
If the left hand side of Eq. (29) isconsidered as a modified capillarypressure comelation J* we can write
J*(SD)=B/SDb (30)
where,
. . . . . . (25)
552
SPE 29890 NOAMAN EL-KHATIB 7
‘*=AG ’31)and
B=(l/~4b +2) (32)
A necessary and sufficientcondition for the J*(SD) to be unique isthat the saturation exponent b to be thesame for clifferent formations. If b isconstant, then the coefficient B will also
——-—..——--J!—-. -’C-be consr.am accommg m %. (3Z). it
cm be seen that the modified correlationJ* represents a considerable imp–rovement over the function J which
requires SM and %in addition to thesaturation exponent b to be the same forall formations.
CONSTRUCTIONS OF TEE~ CORRELATION
To convert a capillary pressurecurve (PCvs. Sw) to the J*(SD) oneneeds the values of k, $, ~, t and (a
COS6) for the curve under consi-deration. Equation (23) can be used to
evaluate z and the irreducible watersaturation may be obvious from thecapillary pressure curve. In most-adll a-r —mm,- -,M,*. x,al,.ae -f DuaplLcuJ yLGasuLs Ubu vka, Vcblu%.z VA A c
at saturations & close to unity(including the threshold pressure) are..””.oumdt to determine. investigation ofEq. (23) shows the sensitivity of theresult(value of%)to data in that region.Actually most of the contribution to thepermeability k from the integral in Eq.(21) is due to the small values of PC(large pores) where (1/Pc) is very large.In addition to this, values of theirreducible water saturation ~ may notbe reached during the capillary pressureexperiments. For these reasons,capillary pressure data points are usedto fit Eq. (24) to obtain values of a, band Swi. A weighted linear leastsquares method is used to obtain thebest fit of the data. This procedure ismm~tl;mnrl;- AMna Ahr (Ah‘u_*. u -yy-u._ (-).
The values of a, b and Swiobtained from the curve fitting are used
with the values of k, $ and acose in
Eq. (26) to estimate the tortuosity t
(tscose)2 + (1 - %JJ2W1T =
a2 [1F [4b + 2)
. . . . . . (33)
From ‘q. (2Tj it can be seen that
=cP~ (34)
where,
~=(l-%)b
m/4b + 2[35)
It is seen that values of a, b andSW obtained from fitting P=SW datacan be used directly to estimate J*(SD)without evaluating the tortuosity t andeven without the knowledge of theporosity and permeability of the rock““-.. . - +L. —-.n.t:.. mc*A. fll.:A@XalLtpk ul LUG pvpGLu Ga us me AAUAU.
used. This is apparently due to the factthat all these information are embeddedin the capiliary pressure curve. This isalso clear from Eq. (26) or (33) wherethe value of C given by
is determined completely from theparameters of the capillary pressurecurve, i.e. a, b and ~.
RESULTS AND DISCUSSION
More than 50 capillary pressurema-?.. mm. a.aly~~~ Ene O*rh MIWP“w. . . . “.. . — . * “. “-”u ““. . -the data were fitted according to Eq.
.553
8 DEVELOPMENT OF A MODIFIED CAPILLARY PRESSURE J-FUNCTION SPE 29890
(24) and the modified as well Leverettcapillary pressure functions werecalculated. To compute the Leverettfunction, the porosity, $, perme~ilityjk, and interracial tension and contact
angle (CSCOS6)are needed. To computethe modified function J*, the values ofthese parameters are not needed. 1hese
. ~..
values are needed, however, if the●M,-G*,- ;e ~m& ~al-llntat+ Tsahlt=[1 )WLbUU_bJ b A. W V- .-.-—.. . ‘“-w \aJ
shows the results for one of thecapillary pressure curves.
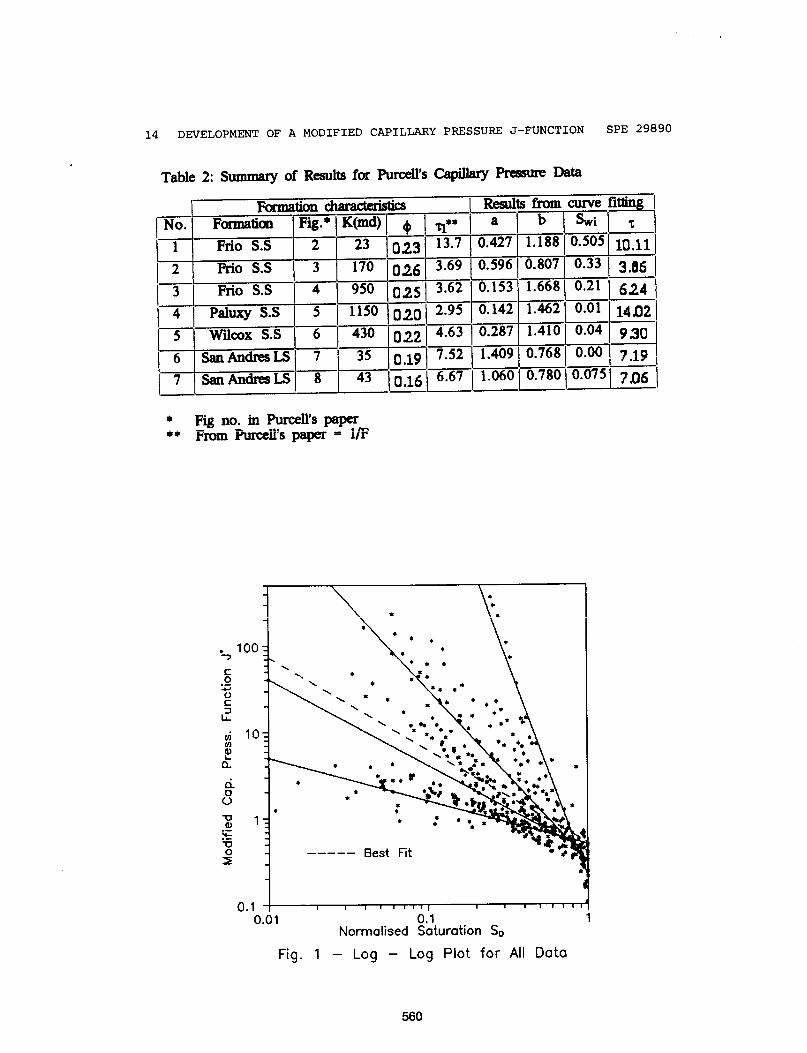
On a log-log graph, themodified function J* plots a straightline with intercept B (at SD=1) andslope - b. When the data for all thecapillary pressure curves from differentformations are plotted without sortingon a single plot, the results are shownin Figure 1. On the same plot, lines forideal cases of different values of b arealso shown. The wide scatter of thedata points indicates that a single(universal) correlation is not possibleand that data should be sorted for thedifferent formations. The average valueof b for the alldatais 1.077.
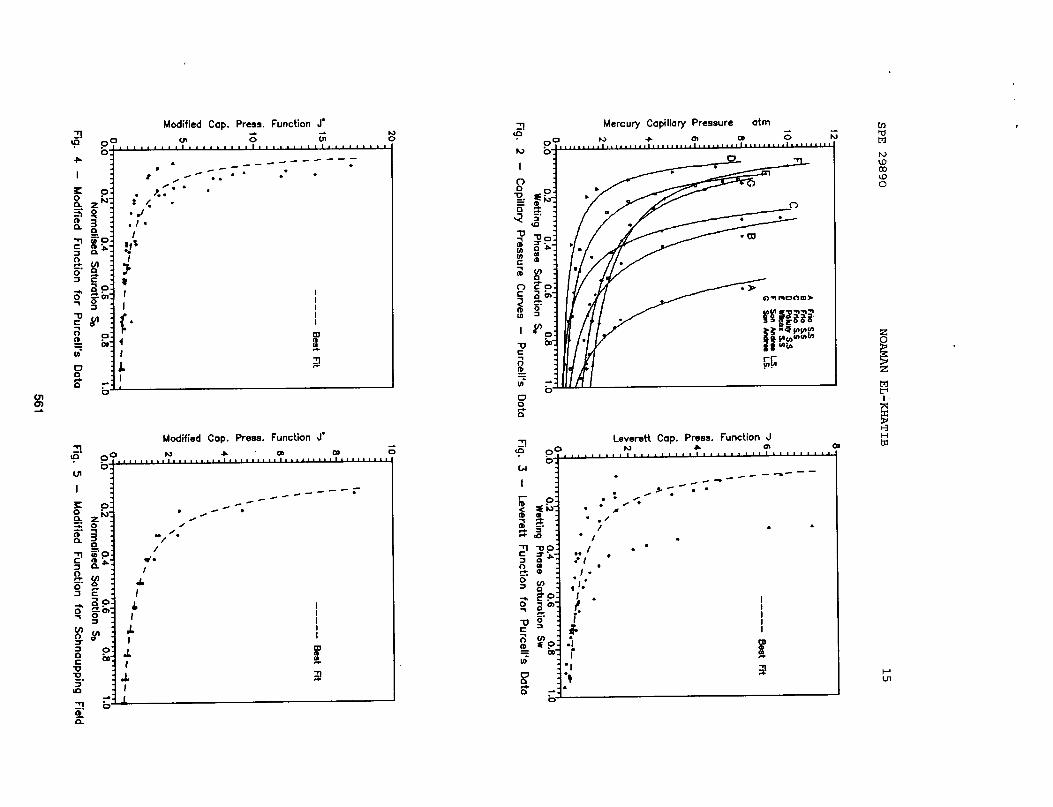
In the next step the data givenby ‘Fhmceiiwere considered. Figiire 2shows the seven capillary pressurecurves from four different formations.A summary of the chamcteristics of theformations and results obtained fromthe analysis are shown in Table (2).Plots of the Leverett capillary pressureJ–function and the modified J* functionare shown in Figures 3 and 4respectively. Comparison of the twofigures shows wide scattering of the J-function as compared to the J* corre–lation. Since the correlation representsfour different formations, it could beimproved if each formation is takenseparately. Such separation, however,was not tried because enough sampleswere not available for each formation(3, 2, 1 and 1). Nevertheless, Figure 4shows a good correlation for thecombined data of the four formations.
Another set of capillary pressurecurves correlated are those ofSchnaupping gas field in West Ger–many 1g. A set of capillary pressurecurves for this carbonate reservoir weregiven for different porosities. Since thepermeabilities were not given, it wasnot possible to calculate the Leverettfunction J, The modified function J*Was ~o~puced by the proceduredeveloped here and the results of fivedifferent curves with porosities rangingbetween 6% and 22% are shown inFigure 5. The figure shows theexcellent correlation of the -
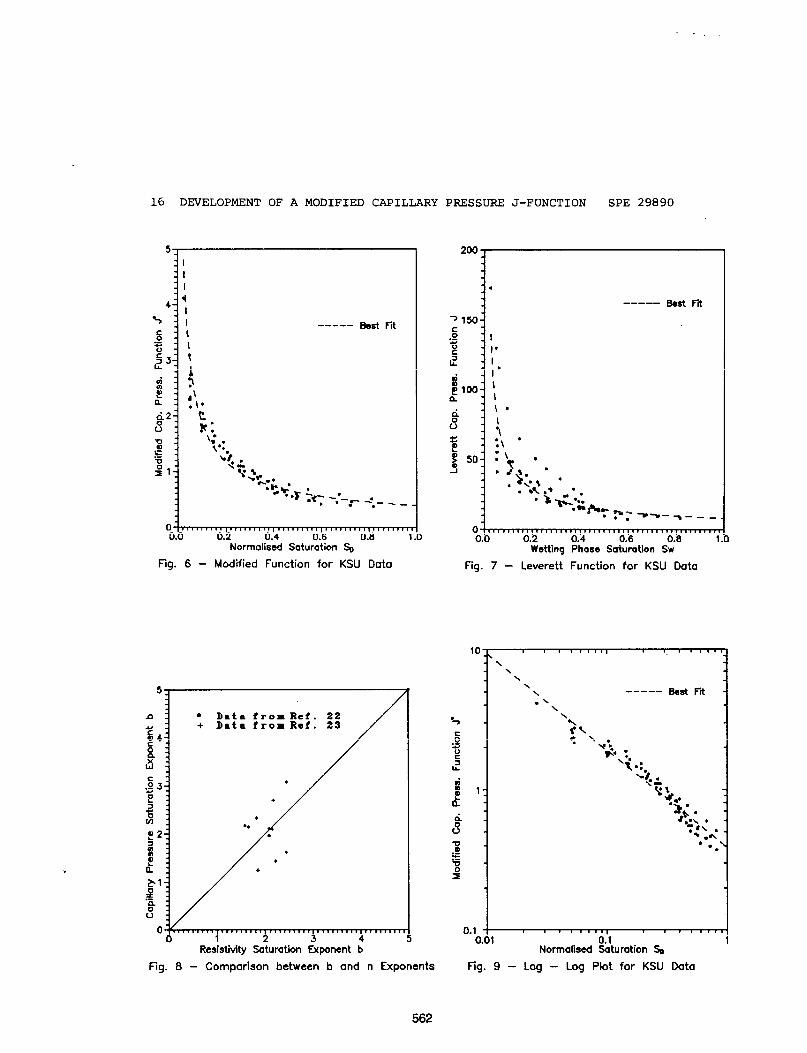
Correlation for eight capillarypressure curves measured at King SaudUniversi~ (KSU) on synthetic snad-stcme coresz” are shown in Figure 6.Although the cores have differentpercentages of quartz indicating diff-erent pore size distributions, thecomelation is seen to be good. Figure 7shows the correlation of the Leverettfunction for the same data. Comparisonof the two figures indicates thesuperiority of the modified function.
Values of the capillary pressureexponent b for the curves considered inthis study ranged between 0.5 and 5with an average value of 1.077. Someinvestigators 1 suggested the equiva–lance of b with the saturation exponentn relating the resistivity index I to theformation water saturation & accor-diag to Archie equation
R:I R=SW=—
0
[37)
This is a consequence of the obser–vation of constant resistivity gradientdRt/dh in the transition zone above theO/W contact for clean formation. Avalue of n=2 is widely accepted in loginterpretation practices. Eleven curvesfor which both capillary pressure andresistivi~ measurements are availa-
554
SPE 29890 NOAMAN EL-KHATIB 9
ble2z~zs gave good agreement on theaverage between b and n with anaverage value of about 2.0. Figure 8shows the correlation of b and n for thedata. These results, however, cannot begeneralized Wyllie and Rose24 sugges-ted an average value of 0.5 for b, Theyalso suggested that the value of n in theArchie equation is not constant for theentire saturation range. This suggestionwas recently verified by the experi–mental work of Soendenaa et a122.Thevalue of the canillary pressure exponentb may also b;-s&&Wion dependent.This behavior may be seen from thelog–log plots of Figure 1 for the entiredata set and Figure 9 for KSU datawhere the data points exhibit a
———..-. ,.-—.---!-- —:.* .L- :-—...-”..curvature mcreasmg wnn UK mb~maxof the water saturation.
The two additional variables, ~and ~ in the definition of the modifiedcapillary pressure function J*(SD) arenot directly measurable from well logs.It is also to be noted that the value ofSwi obtained from fitting the P~SWdata to Eq. (24) is not the same as thatread from the capillaty pressure curvesor determined in the lab. The maximumpressure applied in most tests does notreach that needed to establish theimeducible water saturation. For thepractical application of the developedfunction J*, correlations must be foundfor I and Swi in terms of the other~-hvtsi~nl iwmdiix i P nnmtitv d)y-- uyu} U-U-A y. ..=-. -v., ---- ~... --., ~
and permeability k. It was suggestedthat the tmtuosity z is related to porosityby the relation
where F is the resistivity formationfactor which in turn is a function ofporosity. The irreducible water satu-ration ~ is a function of the specificsurface area S which according toKozeny equation relates the porosity,permeability and tortuosity. This
suggests that~ can also be related to
k and ~. Such relations were suggestedby different investigatorsz4’2s but nogeneral relation is applicable for allformations. If valid relations can bedeveloped for a particular formation,these relations can be used to estimatepermeability from log derived values of
pmositY $ and water saturation&at agiven location in the well. The capillary~ressure at the well is estimatedaccording to Eq. (2). The tottuosity z is
estimated from the ~z relation and atrial and error procedure (iteration) canbe used to estimate SWand k from theJ* function and the Swi relation with
both $ and k.
As it was noted before, if twocapillaty pressure curves have the samesaturation exponent b, they will havethe same function J*. This suggests thepossibility of correlating different zonesin a formation in the different wellsaccording to the value of the saturationexponent b as determined from capillarypressure curves measured on corestaken from the different wells.
CONCLUSIONS
1- The Leverett capillary pressurefunction J(&) requires for a unique
correlation that the tortuosity ~, theirreducible water saturation ~ and thesaturation exponent b be the same forthe different formations.
2– A modified capillary pressurefunction J* (SD) is developed thatincorporates the tortuosity and irr=ducible water saturation in itsdefinition. This function requires onlythe equality of the saturation exponent bin the different formations to obtain aunique correlation. Results showed thesuperiority of the J* comelation to the Jcorrelation.
555
10 DEVELOPMENT OF A MODIFIED CAPILLARY PRESSURE J-FUNCTION SPE
3- To covert capilhwypressure data(Pc vs. %) to the J’(SD) function isindependent of the values of porosity,permeability and interracial tension. Thecombination of these parameters neededto estimate J* are derived from thecapillary pressure curves.
4- If relations can be obtained for——.—&—irreoucibie water saturation Swi ~d
tortuosity t in terms of porosity andpermeability for a given formation, themodified function correlation J* can beused to estimate permeability from logderived values of $ and ~.
5- It may be possible to use thecapillary pressure exponent b incomehuing zones in different wells.
NOMENCLATURE
a = constant, Eq (24), PaA= Cross-sectionat area, m2b = saturation exponent, Eq. (24)B = COILSUIUt,Eq. (32)c = constant, Eq. (35)h = height above O/W contact, mJ(%) = Lev-&eK - cat)illary oressure
J*
kK~T
;
PCAPQRssDSW
SWi
e
PU
function, ~’. (5)” ‘modified capilhuy pressurefunction, Eq. (31)permeability, m2Kozeny constantie@l, 111
tortuous length, mpressure, Pacapillaty pressure, Papressure drop, Paflow rate, m3/secpore entry or tube radiusspecific surface area, m-lnormalized samration, Eq. (8)water or wetting phasesaturation, fraction
irreducible water saturationcontact angle
density, Kg/mJ
interracial tension, Nm
T = tOltUOSity,Eq, (14)
o = porosity, fraction
f = flowg = grainnw = nonwetting
.0 ml—. .t = totalw = water or wetting
REFERENCES
1.
2.
3.
4.
5.
6.
Purcell, W.R., “Capillary
29890
Press–ures - Their Measut%meti UsingMercury and the Calculation ofPermeability Therefrom,” Tkan.$.AIME (1949) 186, 39-48.
Burdine, N.T., Gournay, L.S. ,and Reichettz, P.P., “Pore SizeDistribution of Petroleum Reser–voir Rocks, “ ?hns. AIME ( 1950)189, 195-204.
Holmes, Michael and Tippie,Douglas, B., “Comparison Bet–ween Log and Capillary PressureData to Estimate Reservoirwetting,” paper SPE 68S6,presented at the 52nd Annual FallTech. Conf. and Exhib. of SPE,~ ~~ver, ~OiOrdC , ~g.. >i~,
1977.
Thomeer, J. H.M., “Introductionof a Pore Geometrical FactorDefined by the Capillary PressureCurve, ” H, (March 1960) 73-77.
Thomeer, J. H.M., “Air Permea-bility as a Function of Three Po-Network Parameters,” JPT (April1983) 809-14.
Swanson, B.F., “A Simple Co-rrelation Between Permeabilitiesand Mercury Capillary Pressures, ”JPT(Dec. 1981) 2498-504.
556
211?L
7.
8.
9.
10.
11.
1~.
13.
14.
15.
16.
--- 29690......... -- ....-.=--NUUUAN EI.1-KnAL.LH 11
Leverett, M.C., “Capillary Beha-vior in porous Solids, “ Tm.us.AIME (1941) 142, 152-69.
Brown, Henry W., “CapillaryPressure Investigations,” Trans.AIME (1951) 192, 67-74.
Rose, Walter and Bruce, W.A.,“Evaluation of Capillary Charac-ters in Petroleum ReservoirRocks, ” Trans. AIME (194) 186,127-142.
Amyx, J.W. , Bass, D.M. andWhiting, R.L. , “Petaoleum Reser-voir Eng”neexs”ng, McGraw-Hill,Book Co., Inc., New York City(1960) 158-61.
Wright, H.T., Jr., and Wooddy,L.D., Jr., “Formation Evaluationof the Borregas and SeeligsonField, Brooks and Jim WellsCountry, Texas, ” Symposium onE-— -.:-- ~-.- l.... :-- A11#’Fr Urxnuuun GV?AIUtlLIOIl, mNlrl ,
October, 1955.
Pietcher, .Jeffry L., “A PracticaiCapillary Pressure CorrectionTechnique ,“ .fPT(July 1994) 556.
Alger, R.P., Luffel, D.L., andTruman, R. B., “New UnifiedMethod of Integrating CoreCapillary Pressure Data,” paperSPE 16793 presented at the 62ndAnnual Tech. Conf. and Exhib. ofSPE, Dallas, TX, Sept. 27-30,1987.
Kozeny, J., “Uber Kapillare Lei-tung des Wassers im Boden, ”Stzungsber. Akad. Wiss. Wien(1927) 136, 271-306.
Carmul, P.c. , “Capillary Riseand Capillary Movement ofMoisture in Fine Sands, ” SoilSci., (1941) 52, 1-14.
Dullien, Francis, A.L., “NewNetwork Permeability Model of
17.
18.
19.
20.
21.
22.
23.
557
Porous Media, ” AIChE J (March1975) 21, 2, 299-307.
Maute, R. E., Lyle, W.D. andsprunt, Eve S., “ImprovedMethod Determines Archie Para–meters From Core Data,” JPTIT-- 4nn*\ 4A* 4A-\JiU1. lYYL) Iua-luf.
Day, Peter I., “Discussion ofImproved Data-Analysis Deter–mines Archie parameters FromCore Data, @T(July 1992) 846.
Rieckmaun, Mattin, “Evaluationof Reservoir Rocks of LowPermeability, ” (in German), pre-sented at the 6th World PetroleumCongress, FrankfudMain, WestGermany (1963), published inErdol und Kohle, Erdgas, Petro-chemie, special issue, (June 1963)- Section II, 488496.
A1-Balawi, Yousif, S., “Petro--L._-!--4 1s-- —---—----pny=c~ nueasux-ememson Coii–solidated Sandstone Cores ,“ Un-published B.Sc. Project, KingSaud University, Riyadh (19Y4).
----- .
Tixier, M.P., “Evaluation of Per–meability from Electric-log Resis-tivity Gradient, ” Oil and Gas J(June 16, 1949) 48, NO. 6, 113-122.
Soendenna, E., Bratteli, F.,Kolltveit, K. and Normann, H.P. ,“A Comparison Between CapillaryPressure Data and Saturation~p~~e~t ~ht&ed z -A~~~~~
Conditions and at Reservoir Con-ditions, “paper SPE 19592 pre-sented at the 64th Annual Tech.Conf. and Exhib. of SPE, SanhtOlliO, TX., Oct. 8-11, 1989.
Longeron, D.G., Argaud, M.J.,and Bouvier, L. , “Resistivi~Index and Capillary PressureMeasurements Under ReservoirConditions Using Crude Oil, ”paper SPE 19589 presented at the
12
24.
25.
DEVELOPMENT OF A MODIFIED CAPILLARY PRESSURE J-FUNCTION SPE 29890
64th Annual Tech. Conf. andExbib. of SPE, San AtltOlliO,
TX. , Oct. 8-11, 1989.
Wyljie, M.R.J. and Rose, W. D.,“Some Theoretical ConsiderationsRelated to the Quantitative Eva-luation of the Physical Charac-teristics of Reservoir Rock fromElectrical Log Data,” Trans. AIME(1950) 189, 105-118.
Timur, A., “An Investimtion ofPerme&liiy, Porosi$, andResidual Water Saturation Rela-tionships for Sandstone Reser-voirs, ” The Log Analyst (July-Aug. 1968) 9, No. 4
APPENDIX — Regression A.u–lysisof Cqilhry Pmsue Databy Weighted Limew LeastSqmam Method
It is required to fit the capillarypressure data using the equation
Pc= a (A-1][%- %)b
The method of least squares isbased on finding values of theparameters a,b and ~ that minimizesthe sum of squares of the differencebetween observed and calculatedcapillary pressures. The objectiveunction F to be minimized is given by
F=~[PCOb-PC~]2
[ 1‘~ P~j- a 2j (%-%$’ ,A ~,
... ... (A-L)
Since the terms of Eq. (A-2) arenonlinear, nonlinear regression analysisis needed to find a, b and Swi. Thisrequires iteration and convergence isnot guaranted unless the initial guess of
the parameters is very close to thecoma solution.
The nonlinear optimization pro-blem can be linearized by writingEq. (A-1) in a logarithmic form
log PC=al + bl log(&-~ (A-3)
where,
al =log a and bl=-b
To find al, b 1 and S& we need tominimize the function
F1 = Z[log PC- (al + bl log(~&)]2
. . . . . . (A-4)
The parameter Swi is still causingnonlinearity. This can be handled byassuming successive values of Sti anddetemnmg
. . the values of al and b 1thatminimize F1. The value of Swi thatgives the minimum value of F 1 ischosen.
Although the problem can belinearized by transforming it to thelogarithmic space, many authores17’18stress the need to optimize in theofiginal space. It would be advan-tageous if the differences in Eq. (A-2)can be expressed in terms of those inEq. (A-4). This would combine theaccuracy of the nonlinear regressionwith the simplicity of the linearregression. This is achieved as follows:
A log ,PC= log Pc ~ – log PC~b
[
APc
‘lOgl+~ 1 (A-5)
where ,
Apc = Pc ~ - Pc ~b~. (A-6)
558
SPF, 29890 NOANAN EL-KHATIB 13
Expanding Eq. (A-5) by Taylor’s series
APcAlog PC=log (l) + —
Pc ~~ +
1 {&_)* +z(PcobJ “--
(A-7)
N-eglecting second order terms of(Ape/pcob~.) and higher and sincelog(l)=O, we get
A log Pc = &c/ p~b
or
APc = Pc ~bs. A log PC (A-8)
Substituting Eq. (A-8) into (A-2)
F= XPC]2[log PCj–a1-
b 1 10g(&- !&j)]2 (A-9)
Eq. A-9) may be looked at as aweighted linear least squares methodwhere a weighting facator Pcj2 isallocated for the jth observation.
The foregoing derivation can besimply deduced from the fact that
d (ln y) = dy/y (A-IO)
and SO
dy=yd(lny) (A-n)
The values of al and bl thatminimize F in Eq. (A-9) for a givenvalue of ~ are given by
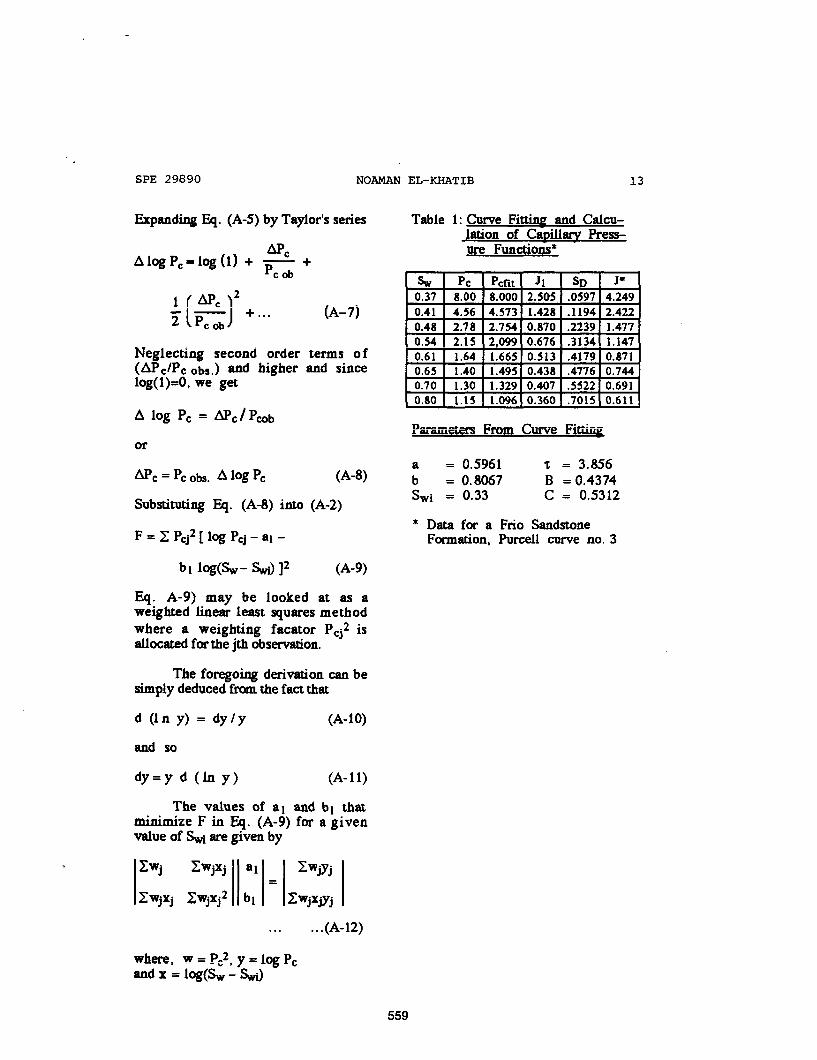
Table 1: Curve Fit.titw and Calcu-lation of Carillary Press-ure Functions*
% Pc pm J1 SD J*0.37 8.00 8.000 2.505 .0597 4.249
0.41 4.56 4.573 1.428 .1194 2.422
0.48 2.78 2.754 0.870 .2239 1.477
0.54 2.15 2,099 0.676 .3134 1.147
0.61 1.64 1.665 0.513 .4179 0.8710.65 1.40 1.495 0.438 .4776 0.7440.70 1.30 1.329 0.407 .5522 0.6910.80 1.15 1.096 0.360 .7015 0.611
I%raae’m Froiilairw F;”*
= 0.5961 ~ = 3.856: = 0.8067 B = 0.4374S~i = 0.33 C = 0.5312
* Data for a Frio SandstoneFormation, Purcell curve no. 3
. . . . ..(A-12)
where, w = PC2,y = IOUP-O-Land X = log(& - ~
559
14 DEVELOPMENT OF A MODIFIED CAPILLARY PRESSUW J-FUNCTION SPE 29890
Table 2: Summary of Results for Purcell’s Ca@ary Preasme Data
I Formation c1~ I Results from curve fitling INo. Formation p@* K(@ $ ~** a b ~i ~. —
1 Frio S.S 2 23 023 13.7 m m 0.50510,11
2 Frio S.S 3 170 o~b 3.69 0.5960.807 0033 3,86—.
-13
5 +y- :: -I&J ~ ‘*;
Frio S.S 4
4 Paluxy S.s
— “mxYllz.i5 930
.L .— :- “ “ -6 sanAndresIS 7
,----,35 0,19 752 [email protected]~pq 7,19i
.—]7\sanMr=M~ 8 I 43 016 6.67[1.060\0.780I0.075\7~6 [l—l .—
~***\’
J1
‘!●.
●● *m_
.-
.-73
––-–– Best Fit ● * _s r
(3.1~0.01 0.1
Normalised Saturation SD
Fig. 1 – Log – Log Plot for All Data
Modified CoD. Press. Function J“
Modified Cap. Prees. Function J*7-. +’ al m G
w
Leverett Cap. Prees. Function J* m
%---~’’’’’’’’’’’’’’’’’’’’’’’’’” ‘A
!,
16 DEVELOPMENT OF A MODIFIED CAPILLARY PRESSURE J-FUNCTION SPE 29890
I
II
4II\1t
;al.\*
----- Best fit
olFol F!.rrl,!r,rl,,rr,o,Jfio,ro,,r,,rro,,,,,.,,.4
0.0 0.2 0.4 0.6 0.8Normolised Saturation ~
17g. 6 – Modified Function for KSU Data
/
● Dnta from Ref. 22+ Data from Ref. 23
/
/
●
●
+●S
●
o~
Resistivity Saturation Exponent b
Fig. 8 - Comparison between b and n Exponents
----- BSet Ft
I
1“I,,
O!. ! . . . . ..!... !! . . . ..l. ! . . . . ..! . . . . ..O,!!,,,,,,, ,,,1ah 0.2 0.4 0.6 O.’a 1.11
Wetting Phose Saturation Sw
Fig. 7 - Leverett Function for KSU Data
Fig. 9 - Log - Lag Plot for KSU Data
562