capillary pressure across a pore throat in the … · capillary pressure across a pore throat in...
TRANSCRIPT
RESEARCH ARTICLE10.1002/2015WR018499
Capillary pressure across a pore throat in the presence ofsurfactantsJunbong Jang 1, Zhonghao Sun1, and J. Carlos Santamarina1
1Earth Science and Engineering, KAUST, Thuwal, Saudi Arabia
Abstract Capillarity controls the distribution and transport of multiphase and immiscible fluids in soilsand fractured rocks; therefore, capillarity affects the migration of nonaqueous contaminants andremediation strategies for both LNAPLs and DNAPLs, constrains gas and oil recovery, and regulates CO2
injection and geological storage. Surfactants alter interfacial tension and modify the invasion of pores byimmiscible fluids. Experiments are conducted to explore the propagation of fluid interfaces along cylindricalcapillary tubes and across pore constrictions in the presence of surfactants. Measured pressure signaturesreflect the interaction between surface tension, contact angle, and the pore geometry. Various instabilitiesoccur as the interface traverses the pore constriction, consequently, measured pressure signatures differfrom theoretical trends predicted from geometry, lower capillary pressures are generated in advancingwetting fronts, and jumps are prone to under-sampling. Contact angle and instabilities are responsible forpronounced differences between pressure signatures recorded during advancing and receding tests.Pressure signatures gathered with surfactant solutions suggest changes in interfacial tension at theconstriction; the transient surface tension is significantly lower than the value measured in quasi-staticconditions. Interface stiffening is observed during receding fronts for solutions near the critical micelleconcentration. Wetting liquids tend to form plugs at pore constrictions after the invasion of a nonwettingfluid; plugs split the nonwetting fluid into isolated globules and add resistance against fluid flow.
1. Introduction
A gas-liquid or a liquid-liquid interface invades a pore when the pressure difference between the two fluidsovercomes the capillary pressure. Capillarity controls the migration and distribution of nonaqueous contam-inants in soils and fractured rocks, and subsequent remediation strategies for both LNAPLs and DNAPLs[Essaid et al., 1993; Glass et al., 2000; Mulligan et al., 2001; Saenton et al., 2002; Reddy and Saichek, 2003; Liet al., 2005; Daniel et al., 2015; Essaid et al., 2015], gas migration, air invasion and desiccation of near-surfacesoils [Gens, 2010; Likos and Lu, 2004; Lu and Likos, 2004; Shin and Santamarina, 2010], gas and oil recovery[Iglauer et al., 2010; Hirasaki et al., 2011; Johannessen and Spildo, 2013], and CO2 injection and geologicalstorage [Pruess and Garcia, 2002; Nordbotten et al., 2005; Kim and Santamarina, 2014].
The capillary pressure Pc [Pa] in a cylindrical pore of radius r [m] depends on the contact angle u andthe interfacial tension Tlg [N/m] between the two fluids as predicted by Young-Laplace’s equationPc 5 2Tlg�cosu�r21, where cosu 5 (Tls2Tgs)/Tgl relates the interfacial tensions that arise between the two flu-ids ‘‘g and l’’ and the solid ‘‘s.’’ Surface tension and contact angle are affected by interfacial conditions,roughness, wettability, gas pressure, impurities, and surfactants [De Gennes, 1985; Sharma and Ross, 1991;Kwok and Neumann, 2000; Miwa et al., 2000; Siebold et al., 2000; Espinoza and Santamarina, 2010]. Further-more, both surface tension and contact angle vary as the system changes from static to dynamic conditions(static interfacial tension [Young, 1804; Good, 1966; Vargaftik et al., 1983], dynamic interfacial tension [Caskeyand Barlage, 1971; Bechtel et al., 2002], and static versus dynamic wettability [Wenzel, 1936; Cassie and Baxter,1944; Rose and Heins, 1962; Hoffman, 1975; De Gennes, 1985]). In noncylindrical tubes, capillary pressure andfluid invasion reflect the irregular cross section of pores as well as their converging-diverging longitudinalgeometry [Ransohoff and Radke, 1988a; Mason and Morrow, 1994; Dong and Chatzis, 1995; Weislogel andLichter, 1998; Bico and Quere, 2002; Song and Kovscek, 2015; Zhao et al., 2016].
Capillary forces, viscous forces, and inertial forces combine to determine capillary rise [Thomson, 1886;Washburn, 1921; Siebold et al., 2000; Xue et al., 2006], displacement patterns in multiphase flow in porous
Key Points:� The emergence of distinct
instabilities� Measured pressure signatures that
differ significantly from thosecomputed based on Laplaciancapillarity and constriction geometry� Transient surfactant conditions as the
interface traverses the pore throat
Correspondence to:J. Jang,[email protected]
Citation:Jang, J., Z. Sun, and J. C. Santamarina(2016), Capillary pressure across a porethroat in the presence of surfactants,Water Resour. Res., 52, 9586–9599,doi:10.1002/2015WR018499.
Received 12 DEC 2015
Accepted 17 NOV 2016
Accepted article online 22 NOV 2016
Published online 25 DEC 2016
VC 2016. American Geophysical Union.
All Rights Reserved.
JANG ET AL. CAPILLARITY PORE THROATS AND SURFACTANT 9586
Water Resources Research
PUBLICATIONS

media [Chatzis and Dullien, 1983; Stokes et al., 1986; Lenormand et al., 1988; Sandnes et al., 2011; Holtzmanet al., 2012; Trojer et al., 2015], and various pore-scale phenomena and instabilities such as:
1. Haines jump. Sudden changes in pressure and associated abrupt changes in fluid distribution [Haines,1930; Morrow, 1970; Gauglitz and Radke, 1989; Maloy et al., 1992; Furuberg et al., 1996; Berg et al.,2013].
2. Snap-off. An advancing nonwetting fluid becomes discontinuous going through the pore throat as wet-ting fluid flowing along corners and crevices reaches the pore throat and pinches the nonwetting fluid[Roof, 1970; Lenormand et al., 1983; Ransohoff et al., 1987; Rossen, 2003; Valvatne and Blunt, 2004; Kovsceket al., 2007].
3. Lamella and foam generation and transport [Falls et al., 1988; Ransohoff and Radke, 1988b; Kovscek andRadke, 1994; Rossen, 2003].
Surfactants hinder the development of capillary pressure and facilitate mixed-phase fluid flow in porousmedia. Surfactants tend to migrate toward gas-liquid ‘‘gl’’ interfaces because of their amphipathic structurewith hydrophobic and hydrophilic ends (Figure 1a). Surface tension decreases with increased surfactantconcentration on the interface until the bulk solution reaches the critical micelle concentration CMC, and itremains constant thereafter as the excess surfactant in the bulk solution forms micelles (Figure 1b) [Defayand Prigogine, 1949; Miller et al., 1994; Holmberg et al., 2003; Rosen, 2004; Israelachvili, 2011]. The surfactantdensity on the interface homogenizes rapidly, driven by the surface tension gradient created by heteroge-neous concentrations, i.e., Marangoni effect [Scriven and Sternling, 1960; Schramm and Wassmuth, 1994;Nikolov et al., 2002; Tadmor, 2009; Still et al., 2012]. In addition to the adsorption onto gas-liquid ‘‘gl’’ interfa-ces, surfactants adsorb onto liquid-solid ‘‘ls’’ and gas-solid ‘‘gs’’ interfaces as well; therefore, the effect of sur-factants on cosu is not limited to the inverse of Tgl [Chen and Mohanty, 2013]. Adsorption at interfaces andmicelle formation affect the efficiency of surfactants in engineered applications that range from the remedi-ation of NPAL contaminated sites to enhanced oil recovery.
Surfactant adsorption and interfacial concentration are time-dependent and may evolve in response tochanges in pore geometry (Figure 1c). The pulmonary surfactant is an example of a bio-engineered systemthat exploits this effect: surfactant concentration and surface tension vary as alveoli expand and contractfacilitating breathing [Clements et al., 1958; Ghadiali and Gaver, 2000; Gerber et al., 2006; Nakahara et al.,2010]. The relevance of this geometry-dependent rate effect in porous media such as sediments remainsunknown.
This paper reports pressure signatures gathered as fluid interfaces traverse a constriction in a cylindricalcapillary tube during advancing and receding tests. The study explores the effect of surfactant concentra-tion, infers transient changes in surfactant concentration at the interface, and identifies pore-scaleinstabilities.
Figure 1. Surfactant interactions at the molecular scale. (a) Preferential adsorption at interfaces. (b) Micelle formation in the bulk solution. (c) Hypothesized transient change in surfactantsurface density as the interface traverses the pore constriction. (d) Interface between two fluids at a noncylindrical pore geometry.
Water Resources Research 10.1002/2015WR018499
JANG ET AL. CAPILLARITY PORE THROATS AND SURFACTANT 9587

2. Experimental Study
2.1. Fluids: Surface TensionFour fluids were used in this study:deionized water, alcohol, aqueoussurfactant solutions prepared with sodi-um dodecyl sulfate SDS (NaC12H25SO4—no salt), and solutions prepared witha commercially available surfactant(from safety data sheet, it consists ofsodium dodecyl sulfate and sodiumlaureth sulfate as the main anionicsurfactants, less than 5% of ethanolas a cosurfactant, 3–7% of amineoxide as a cationic/zwitterionic sur-factant and foam stabilizer, and somesodium chloride). SDS solutions reachthe critical micelle concentration atCMC � 2.4 mg/g, in agreement withsurface tension values in Table 1.The surface tension measured at allconcentrations for the commercialsurfactant solutions was near the
minimum value Tgl 5 25.5 mN/m, thus tested concentrations 0.1–50 mg/g are above the critical micelleconcentration (Table 1).
2.2. Pore-Scale Tests: Experimental ProcedurePore-scale tests were conducted using 75 mm long borosilicate capillary tubes with internal diameterID 5 0.97 mm. A constriction was formed by localized heating and rotation to reach a minimum diameter atthe pore throat (constriction length �3 mm; ID 5 0.26 mm for commercial surfactant, and ID 5 0.33 mm fortests with SDS solutions, Figure 2). The nominal pore throat size ID � 0.3 mm reflects the trade-off betweendetailed visualization and pressure signature amplitude, and it is an upper bound for fluid flow passages insandy sediments and sandstones [Fredrickson et al., 1997; Bloomfield et al., 2001; Bennion and Bachu, 2006;
Table 1. Experimental Study: Fluidsa
Liquid
Concentrationof Surfactant inWater [mg/g]
Tgl [mN/m] Contact Angle-SDS [8]d
CommercialSurfactantb SDSc Advancing Receding
Water n/a 72 72 510.025 72 73 480.05 71 73 35
Aqueoussurfactantsolution
0.1 30 70 71 310.25 27 65 70 280.5 26 57 69 281.0 25 46 53 252.5 25 37 28 255.0 26 37 26 25
10.0 27 37 26 2525.0 28 37 25 2450.0 29.0
Alcohol n/a 24 33 30
aThe critical micelle concentration of sodium dodecyl sulfate SDS isCMC 5 2.4 mg/g at 258C.
bMeasured using a ring tensiometer (platinum-iridium ring with a mean cir-cumference of 59.35 mm; the ratio of the ring major radius to the wire radius is53.2).
cFrom Prosser and Franses [2001] and see also Mysels [1986].dMeasured for water and SDS solutions using images before the necking.
Flow rate of 40 mL/h and a front speed of 15 lm/s.
Figure 2. Experimental configuration used to study capillary effects in a constricted capillary tube (microphotograph shown in the inset).Injection flow rates vary from q 5 20 to 160 lL/h. See flow conditions in Table 2.
Water Resources Research 10.1002/2015WR018499
JANG ET AL. CAPILLARITY PORE THROATS AND SURFACTANT 9588
Minagawa et al., 2008]. In the dimension-less space of governing parameters,conditions tested in this study apply tothose described in Table 2, which arewithin the range of many real fieldsituations from NAPL remediation toresource recovery.
The constricted capillary tube was con-nected to a microcontrol 5 mL syringethrough a stainless steel tube. A pressuretransducer mounted next to the inlet wasused to monitor the liquid pressure. Thegeneral test configuration is sketched inFigure 2.
The syringe pump maintained the preselected flow rate constant during both advancing and receding tests.Imposed flow rates are summarized in Table 2. Propagation velocities and the values of Reynolds numberRe and capillary number Ca for water are included in the table; flow conditions remain in the same Reynoldsand capillary number Re-Ca regime for all tests conducted in this study (see Re and Ca values in Table 2).Tests were conducted with deionized water first, then alcohol, and finally with surfactant solutions run fromthe lowest to the highest concentration. Each test consisted of multiple receding-advancing cycles at incre-mentally higher flow rates.
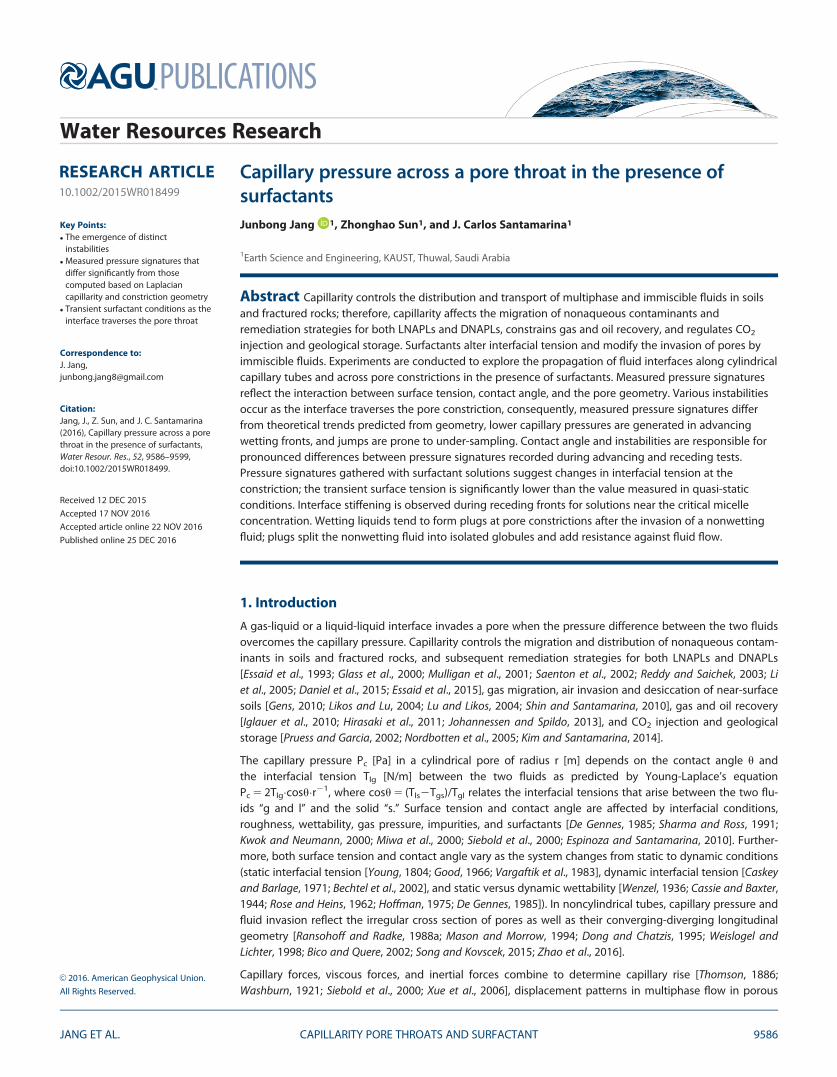
2.3. ResultsPressure-time (P-t) signatures and concurrent images are recorded for all fluids and injection rates as theliquid-gas interface traverses the tube constriction. A signature recorded during a receding test and select-ed snapshots are presented in Figure 3. Notice the change in capillary pressure across the pore throat, the
Table 2. Experimental Study: Flow Rate and Dimensionless Ratios Re andCa Calculated for Watera
FlowRate [lL/h]
Velocity[lm/s]
ReynoldsNumber, Reb
CapillaryNumber, Cac
20 7.5 8 3 1023 0.94 3 1027
40 15 16 3 1023 1.88 3 1027
80 30 32 3 1023 3.76 3 1027
160 60 64 3 1023 7.52 3 1027
aParameters: fluid velocity v [m/s], pore radius r 5 0.485 mm, fluid densi-ty q 5 1000 kg/m3, fluid viscosity l 5 0.9 3 1023 Pa s, liquid-gas surfacetension Tlg 5 0.072 N/m.
bThe Reynolds number Re compares inertial and viscous forcesRe 5 2qvr/l.
cThe capillary number Ca compares viscous and capillary forcesCa 5 lv/Tlg.
Figure 3. Characteristic pressure signature P-t and selected snapshots—case: SDS 25 mg/g solution during receding test at a flow rate of20 lL/h. Notice the formation of a liquid plug at the pore constriction leading to the generation of a second pressure pulse.
Water Resources Research 10.1002/2015WR018499
JANG ET AL. CAPILLARITY PORE THROATS AND SURFACTANT 9589
sudden jump at point-e, the formation of a plug at the pore throat (point-f), and the associated increase incapillary pressure until a new jump takes place at point-h.
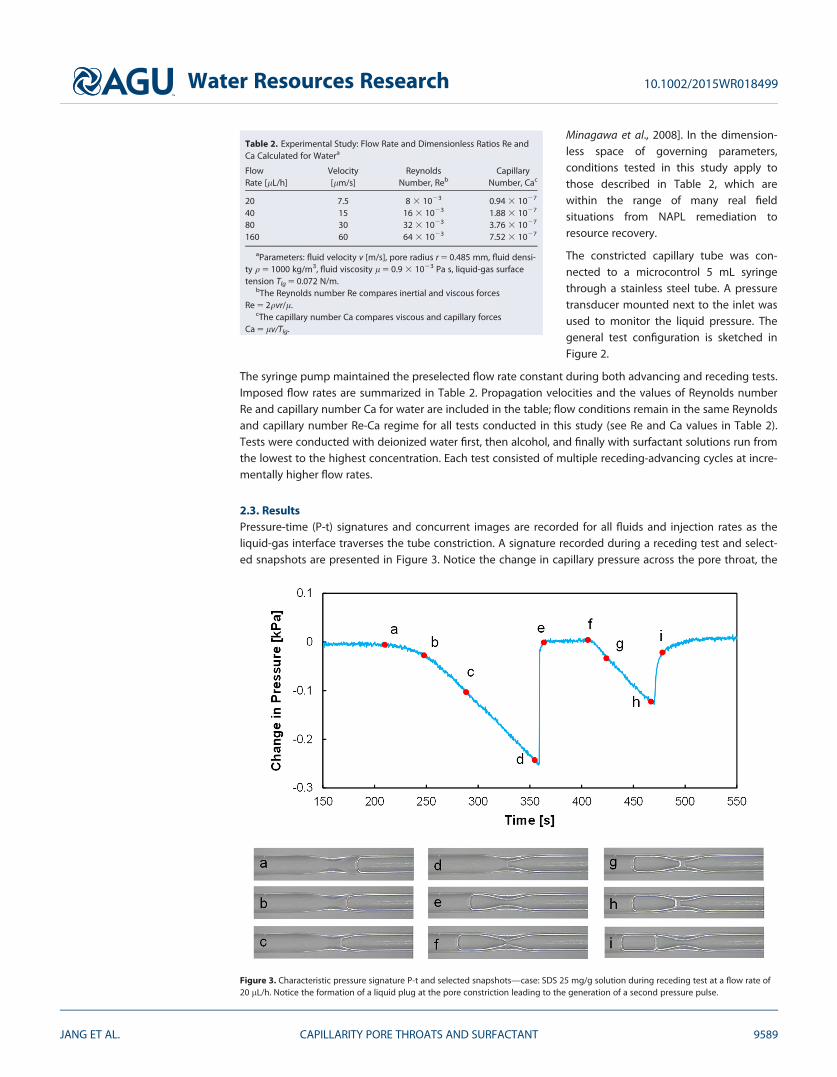
Figure 4 shows other P-t signatures in detail. There are marked differences among signatures. Recedingtests mobilize significantly higher capillary pressure maxima than advancing tests. During advancing tests,the pressure decreases as the interface moves toward the necking, increases thereafter, and the liquid mustbe pushed until it suddenly advances past the throat and the pressure drops at once. During receding tests,the water pressure decreases as the interface is retracted toward the necking, reaches a minimum, and sud-denly recovers to the steady state value (see Figure 3 for details). The pressure signatures for the 10 mg/gconcentration of the commercial surfactant are similar to those for alcohol; both liquids experience repeti-tive snap-offs and the formation of plugs that block air invasion at the necking. These liquid plugs regener-ate very fast, producing oscillatory pressure cycles with a frequency that is proportional to the imposedflow rate, this means that plug formation is faster than the pressure buildup (for the range of flow rates test-ed in this study).
Figure 5 shows signatures measured at all flow rates for deionized water, solutions prepared with the com-mercial surfactant and alcohol. To facilitate the comparison, time is normalized t* by the flow rate to high-light similarities among signatures. This complete set of P-t* signatures shows systematic changes withsurfactant concentration, but no significant effects of flow rate (within the tested range). The peak pressuredecreases as the surfactant concentration increases in all cases. Snap-offs and the formation of repetitiveliquid plugs are observed at all flow rates in alcohol and when the concentration of the commercial surfac-tant exceeds 10 mg/g.
Figure 4. Pressure-time (P-t) signatures recorded as the liquid-gas interface traverses the pore constriction. These pressure-time signatures were obtained with deionized water, com-mercial surfactant solution, and alcohol during advancing A and receding R tests. Signatures are shown for four different flow rates. For reference, a 10 min scale is shown on the figure.
Water Resources Research 10.1002/2015WR018499
JANG ET AL. CAPILLARITY PORE THROATS AND SURFACTANT 9590

Figure 5. Pressure-time signatures for different fluids across the pore constriction. Time is normalized by the flow rate to highlight similari-ties among signatures. Cases: (a) advancing and (b) receding tests. Fluids: deionized water, commercial surfactant solutions, and alcohol.
Water Resources Research 10.1002/2015WR018499
JANG ET AL. CAPILLARITY PORE THROATS AND SURFACTANT 9591

3. Analyses andDiscussion
3.1. Contact Angle inCapillary TubesAll test results reported hereand complementary static-dynamic tests indicate that thecontact angle in advancing uad
and receding tests urec boundthe static contact angle ust, inother words uad> ust> urec.Advancing and receding con-tact angles measured in thecapillary tube away from thenecking are summarized inTable 1; contact angles are sim-ilar uad � urec when the surfac-tant concentration approachesand exceeds the critical micelleconcentration CMC.
3.2. Capillary Pressure inNoncylindrical PoresThe geometry of the pore
affects the generation of capillary pressure [Purcell, 1950; Mason and Morrow, 1991; Urso et al., 1999]. Let usadopt a pore geometry defined by a double cosine function inspired in the experimentally tested tubes(photograph in Figure 2). Constant curvature interfaces along this pore constriction are sketched for variouscontact angles in Figure 6. Notice the concave-to-convex transitions for intermediate contact angles.
The local angle ax between the tube surface at position-x and the flow direction is introduced into the equi-librium equation (refer to Figure 1d) to obtain the modified Laplace equation for the capillary pressure atposition-x
Pc;x52Tglcos u2axð Þ
rx: (1)
This equation predicts that the air-liquid interface changes from concave to convex when the argument(u-ax)> 90. The capillary pressure versus position P-x signatures computed using equation 1 are plotted inFigure 7 for the same geometry analyzed in Figure 6. When fluids are perfectly wetting u 5 0, signaturesremain alike and the capillary pressure scales linearly with surface tension (Figure 7a). In contrast, there aremarked changes in P-x signatures with contact angle, as shown in Figure 7b for the case of an air-water sys-tem (Tgl 5 72 mN/m): the capillary pressure changes from negative-to-positive across the pore throat whenthe contact angle u ! 908. The position of capillary pressure maxima depends on the pore geometry ax
and contact angle u: the maximum capillary pressure develops at the pore throat when u 5 08 only. Noticethat capillary resistance can develop at a pore constriction even when fluids are considered ‘‘wetting.’’
3.3. Theoretical Versus Experimental Signatures: InstabilitiesTrends in measured pressure-time (P-t) signatures exhibit patterns similar to the analytical P-x signatureswhen the contact angle u! 908 during advancing tests and is u! 08 during receding tests (Figures 5 and 7).Such a marked change in contact angle is in agreement with the much larger capillary maxima observed inreceding tests compared to advancing tests (all fluids and flow rates—measured values in Table 1).
In contrast to analytical signals, measured signatures reveal sudden pressure changes that last less than the250 ms sampling interval (Figures 4 and 5—note the transit time across the pore constriction lasts up to 20min). Sudden changes in advancing and receding tests include (Figure 8):
Figure 6. Constant curvature interfaces along a capillary tube with a pore constriction.
Water Resources Research 10.1002/2015WR018499
JANG ET AL. CAPILLARITY PORE THROATS AND SURFACTANT 9592
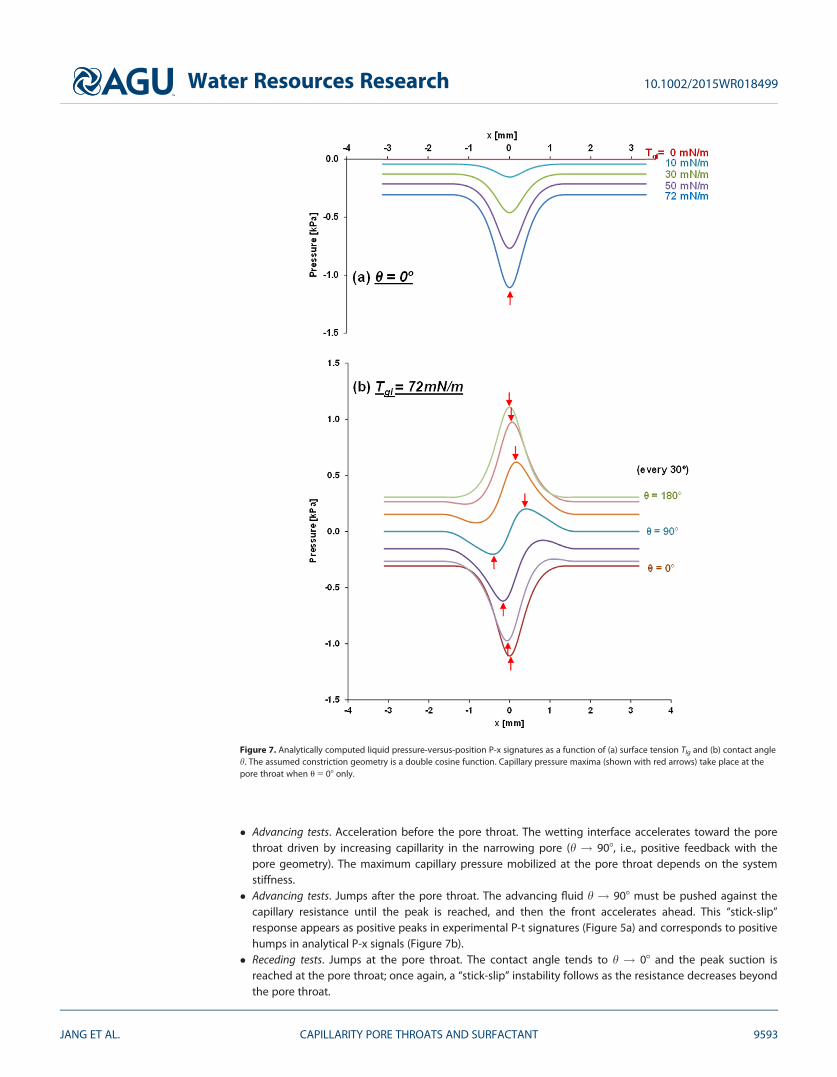
� Advancing tests. Acceleration before the pore throat. The wetting interface accelerates toward the porethroat driven by increasing capillarity in the narrowing pore (h ! 908, i.e., positive feedback with thepore geometry). The maximum capillary pressure mobilized at the pore throat depends on the systemstiffness.
� Advancing tests. Jumps after the pore throat. The advancing fluid h ! 908 must be pushed against thecapillary resistance until the peak is reached, and then the front accelerates ahead. This ‘‘stick-slip’’response appears as positive peaks in experimental P-t signatures (Figure 5a) and corresponds to positivehumps in analytical P-x signals (Figure 7b).
� Receding tests. Jumps at the pore throat. The contact angle tends to h ! 08 and the peak suction isreached at the pore throat; once again, a ‘‘stick-slip’’ instability follows as the resistance decreases beyondthe pore throat.
Figure 7. Analytically computed liquid pressure-versus-position P-x signatures as a function of (a) surface tension Tlg and (b) contact angleh. The assumed constriction geometry is a double cosine function. Capillary pressure maxima (shown with red arrows) take place at thepore throat when u 5 08 only.
Water Resources Research 10.1002/2015WR018499
JANG ET AL. CAPILLARITY PORE THROATS AND SURFACTANT 9593
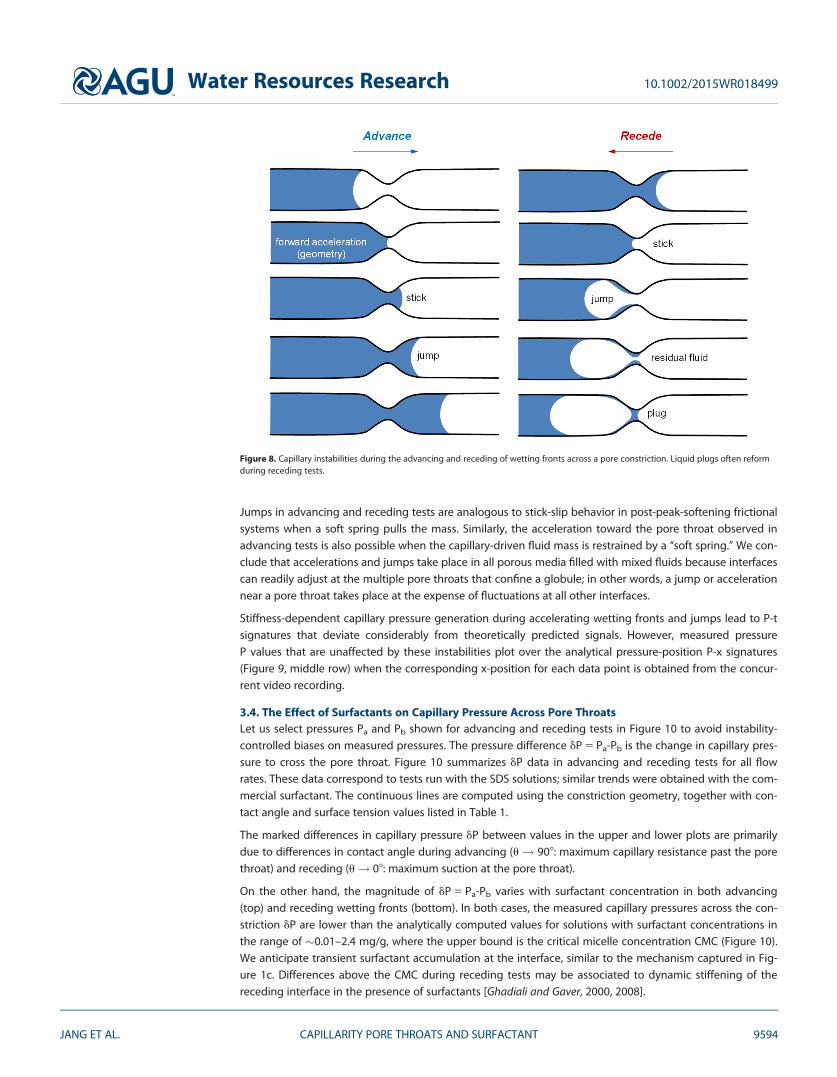
Jumps in advancing and receding tests are analogous to stick-slip behavior in post-peak-softening frictionalsystems when a soft spring pulls the mass. Similarly, the acceleration toward the pore throat observed inadvancing tests is also possible when the capillary-driven fluid mass is restrained by a ‘‘soft spring.’’ We con-clude that accelerations and jumps take place in all porous media filled with mixed fluids because interfacescan readily adjust at the multiple pore throats that confine a globule; in other words, a jump or accelerationnear a pore throat takes place at the expense of fluctuations at all other interfaces.
Stiffness-dependent capillary pressure generation during accelerating wetting fronts and jumps lead to P-tsignatures that deviate considerably from theoretically predicted signals. However, measured pressureP values that are unaffected by these instabilities plot over the analytical pressure-position P-x signatures(Figure 9, middle row) when the corresponding x-position for each data point is obtained from the concur-rent video recording.
3.4. The Effect of Surfactants on Capillary Pressure Across Pore ThroatsLet us select pressures Pa and Pb shown for advancing and receding tests in Figure 10 to avoid instability-controlled biases on measured pressures. The pressure difference dP 5 Pa-Pb is the change in capillary pres-sure to cross the pore throat. Figure 10 summarizes dP data in advancing and receding tests for all flowrates. These data correspond to tests run with the SDS solutions; similar trends were obtained with the com-mercial surfactant. The continuous lines are computed using the constriction geometry, together with con-tact angle and surface tension values listed in Table 1.
The marked differences in capillary pressure dP between values in the upper and lower plots are primarilydue to differences in contact angle during advancing (u! 908: maximum capillary resistance past the porethroat) and receding (u! 08: maximum suction at the pore throat).
On the other hand, the magnitude of dP 5 Pa-Pb varies with surfactant concentration in both advancing(top) and receding wetting fronts (bottom). In both cases, the measured capillary pressures across the con-striction dP are lower than the analytically computed values for solutions with surfactant concentrations inthe range of �0.01–2.4 mg/g, where the upper bound is the critical micelle concentration CMC (Figure 10).We anticipate transient surfactant accumulation at the interface, similar to the mechanism captured in Fig-ure 1c. Differences above the CMC during receding tests may be associated to dynamic stiffening of thereceding interface in the presence of surfactants [Ghadiali and Gaver, 2000, 2008].
Figure 8. Capillary instabilities during the advancing and receding of wetting fronts across a pore constriction. Liquid plugs often reformduring receding tests.
Water Resources Research 10.1002/2015WR018499
JANG ET AL. CAPILLARITY PORE THROATS AND SURFACTANT 9594

Overall, data in Figure 10 hint to delayed molecular responses and dynamic interactions that alter surfactantpacking at the interface, adsorption-desorption, and nonequilibrium critical micelle CMC concentration[Huang et al., 1989; Schulz and Warr, 2002; Zhang and Somasundaran, 2006; Ghumare, 2012].
3.5. Recurrent Plug FormationSnap-offs and subsequent plug formation has been reported as choke-off instabilities [Mohanty et al., 1987],analyzed in relation to film flow [Lowry and Miller, 1995], and relates to film rapture and residual water leftbehind (observed by Hsu and Hilpert [2016]). Our results show that wetting liquids tend to form plugs atpore constrictions during receding tests immediately after the stick-slip jump (Figure 3): surface tensionforces the residual wetting liquid to migrate toward the pore throat where it contracts to form the plug(sketched in Figure 8). Plug formation is preferentially observed in fluids with low surface tension (e.g., solu-tions with surfactant near the CMC, and alcohol, Figures 4 and 5b). Complementary tests—not shownhere—confirm the formation of plugs in water-wet capillaries during the invasion of oil, and the increasedtendency to plug reformation in narrower pore constrictions. Successive pressure spikes in Figures 4 and 5show that these plugs can break and reform multiple times.
Plugs split the nonwetting fluid into isolated globules and add resistance against fluid flow. Consequently,plugs hinder the extraction on nonwetting fluids from the subsurface, for example during remediationefforts or resource recovery.
Figure 9. Predicted versus measured pressure signatures during advancing and receding wetting fronts across a pore constriction. Middlerow: theoretical pressure-position P-x signatures; the x-position of data points shown on these plots is obtained from the concurrent videorecordings. Lower row: measured pressure-time P-t signatures. Note: P-x and P-t signatures are aligned at the stick-slip instability. Left:advancing water (80 lL/h). Right: receding alcohol (80 lL/h).
Water Resources Research 10.1002/2015WR018499
JANG ET AL. CAPILLARITY PORE THROATS AND SURFACTANT 9595

4. Conclusions
Capillarity controls the distribution and transport of immiscible fluids in soils and fractured rocks; thus, itplays a central role in the evolution of subsurface contamination and remediation, resource recovery, andcarbon geological storage.
The measurement of capillary pressure across a pore constriction with concurrent video recording isan information-rich test. The capillary pressure is a function of contact angle, surface tension, and theevolving pore geometry as the fluid interface traverses the pore constriction in advancing and recedingtests.
Four distinct instabilities were observed in these experiments: forward acceleration driven by positive feed-back from the narrowing pore geometry, stick-slip jump during advancing and receding tests, and snap-offsfollowed by plug formation in receding wetting fronts. These pore-scale phenomena alter the measuredpressure-time signatures.
Contact angle and instabilities are responsible for pronounced differences between pressure signaturesrecorded during advancing and receding tests, and underlie hysteretic saturation in porous media.
Menisci at pore throats confine fluid globules within porous media. These interfaces can readily adjust;therefore, instabilities at a pore throat take place at the expense of fluctuations at all other boundinginterfaces.
Figure 10. Measured changes in capillary pressure dPc at the pore constriction during advancing and receding tests with SDS solutions.Selected a-and-b pressures avoid biases discussed in the text. Values of dP for deionized water appear on the Y axis. The continuous linesare computed using the constriction geometry, the contact angle measured for each solution in the capillary tube before the necking, andsurface tension values listed in Table 1.
Water Resources Research 10.1002/2015WR018499
JANG ET AL. CAPILLARITY PORE THROATS AND SURFACTANT 9596

For a given transport direction, the amplitude of pressure signatures scales with interfacial tension. Howev-er, an interface traversing a pore constriction experiences transient nonequilibrium conditions when aque-ous surfactant solutions are involved. The measured capillary pressures cannot be readily anticipated fromstatic-bulk fluid measurements as the transient surface tension can be significantly lower than in static tests.There is some evidence of interface stiffening in high surfactant concentration solutions during recedingfronts.
Plugs form when residual annular wetting films/droplets left behind after a jump contract back toward thepore throat. Plug formation is more common when the surface tension is low and pore throats are narrow.Liquid plugs can break and reform multiple times as flow continues. Plugs split the nonwetting fluid intoisolated globules and add resistance against fluid flow.
Notation
C molarity [mol/L].Ca capillary number.CMC critical micelle concentration [mg/g].na moles of a surfactant on an adsorbent [mol/g].Pc capillary pressure [Pa].dP change in capillary pressure across a pore throat [Pa].q flow rate [lL/h].r pore radius [m].Re Reynolds number.Tgs interfacial tension: gas-solid [N/m].Tgl interfacial tension: gas-liquid [N/m].Tls interfacial tension: liquid-solid [N/m].V velocity [m/s].a angle between tube surface and mean flow direction [8].u contact angle [8].l viscosity [Pa s].q density [kg/m3].
ReferencesBechtel, S. E., K. W. Koelling, W. Nguyen, and G. Tan (2002), A new technique for the measurement of the dynamic evolution of surface ten-
sion, J. Colloid Interface Sci., 245(1), 142–162.Bennion, B., and S. Bachu (2006), The impact of interfacial tension and pore size distribution/capillary pressure character on CO2 relative
permeability at reservoir conditions in CO2-brine systems, in SPE/DOE Symposium on Improved Oil Recovery, Soc. of Pet. Eng., Tulsa, Okla.Berg, S., et al. (2013), Real-time 3D imaging of Haines jumps in porous media flow, Proc. Natl. Acad. Sci. U. S. A., 110(10), 3755–3759.Bico, J., and D. Quere (2002), Rise of liquids and bubbles in angular capillary tubes, J. Colloid Interface Sci., 247(1), 162–166.Bloomfield, J. P., D. C. Gooddy, M. I. Bright, and P. J. Williams (2001), Pore-throat size distributions in Permo-Triassic sandstones from the
United Kingdom and some implications for contaminant hydrogeology, Hydrogeol. J., 9(3), 219–230.Caskey, J. A., and W. B. Barlage (1971), Improved experimental technique for determining dynamic surface tension of water and surfactant
solutions, J. Colloid Interface Sci., 35(1), 46–52.Cassie, A. B. D., and S. Baxter (1944), Wettability of porous surfaces, Trans. Faraday Soc., 40, 546–551.Chatzis, I., and F. A. L. Dullien (1983), Dynamic immiscible displacement mechanisms in pore doublets—Theory versus experiment,
J. Colloid Interface Sci., 91(1), 199–222.Chen, P. L., and K. K. Mohanty (2013), Surfactant-mediated spontaneous imbibition in carbonate rocks at harsh reservoir conditions,
SPE J, 18(1), 124–133.Clements, J. A., E. S. Brown, and R. P. Johnson (1958), Pulmonary surface tension and the mucus lining of the lungs—Some theoretical con-
siderations, J. Appl. Physiol., 12(2), 262–268.Daniel, D. E., L. Alvarez, W. Dershowitz, H. H. Einstein, C. Gable, F. M. Orr, D. Reynolds, J. C. Santamarina, A. M. Shapiro, and K. Singha (2015),
Characterization, Modeling, Monitoring and Remediation of Fractured Rock, Natl. Academies Press, Washington, D. C.De Gennes, P. G. (1985), Wetting: Static and dynamics, Rev. Mod. Phys., 57(3), 827–863.Defay, R., and I. Prigogine (1949), Surface tension of regular solutions, Trans. Faraday Soc., 46, 199–204.Dong, M., and I. Chatzis (1995), The imbibition and flow of a wetting liquid along the corners of a square capillary-tube, J. Colloid Interface
Sci., 172(2), 278–288.Espinoza, D. N., and J. C. Santamarina (2010), Water-CO2-mineral systems: Interfacial tension, contact angle, and diffusion-implications to
CO2 geological storage, Water Resour. Res., 46, W07537, doi:10.1029/2009WR008634.Essaid, H. I., W. N. Herkelrath, and K. M. Hess (1993), Simulation of fluid distributions observed at a crude-oil spill site incorporating hystere-
sis, oil entrapment, and spatial variability of hydraulic-properties, Water Resour. Res., 29(6), 1753–1770.Essaid, H. I., B. A. Bekins, and I. M. Cozzarelli (2015), Organic contaminant transport and fate in the subsurface: Evolution of knowledge and
understanding, Water Resour. Res., 51, 4861–4902, doi:10.1002/2015WR017121.
AcknowledgmentsSupport for this research was providedby the USA Department of Energy andthe KAUST endowment. We aregrateful to detailed observations andsuggestions by the anonymousreviewers. All data sets generated aspart of this study are available fromthe authors.
Water Resources Research 10.1002/2015WR018499
JANG ET AL. CAPILLARITY PORE THROATS AND SURFACTANT 9597

Falls, A. H., G. J. Hirasaki, T. W. Patzek, D. A. Gauglitz, D. D. Miller, and T. Ratulowski (1988), Development of a mechanistic foam simulator:The population balance and generation by snap-off, SPE Reservoir Eng., 3(3), 884–892.
Fredrickson, J. K., et al. (1997), Pore-size constraints on the activity and survival of subsurface bacteria in a late Cretaceous shale-sandstonesequence, northwestern New Mexico, Geomicrobiol. J., 14(3), 183–202.
Furuberg, L., K. J. Maloy, and J. Feder (1996), Intermittent behavior in slow drainage, Phys. Rev. E, 53(1), 966–977.Gauglitz, P. A., and C. J. Radke (1989), Dynamics of Haines jumps for compressible bubbles in constricted capillaries, AIChE J., 35(2), 230–240.Gens, A. (2010), Soil-environment interactions in geotechnical engineering, Geotechnique, 60(1), 3–74.Gerber, F., M. P. Krafft, T. F. Vandamme, M. Goldmann, and P. Fontaine (2006), Fluidization of a dipalmitoyl phosphatidylcholine monolayer
by fluorocarbon gases: Potential use in lung surfactant therapy, Biophys. J., 90(9), 3184–3192.Ghadiali, S. N., and D. P. Gaver (2000), An investigation of pulmonary surfactant physicochemical behavior under airway reopening condi-
tions, J. Appl. Physiol., 88(2), 493–506.Ghadiali, S. N., and D. P. Gaver (2008), Biomechanics of liquid-epithelium interactions in pulmonary airways, Respir. Physiol. Neurobiol.,
163(1–3), 232–243.Ghumare, A. K. (2012), Synthesis, characterization and applications of cationic gemini surfactants, PhD thesis, Inst. of Chem. Technol., Mum-
bai, India.Glass, R. J., S. H. Conrad, and W. Peplinski (2000), Gravity-destabilized nonwetting phase invasion in macroheterogeneous porous media:
Experimental observations of invasion dynamics and scale analysis, Water Resour. Res., 36(11), 3121–3137.Good, R. J. (1966), Estimation of surface energies from contact angles, Nature, 212(5059), 276–277.Haines, W. B. (1930), Studies in the physical properties of soil: V. The hysteresis effect in capillary properties, and the modes of moisture dis-
tribution associated therewith, J. Agric. Sci., 20, 97–116.Hirasaki, G. J., C. A. Miller, and M. Puerto (2011), Recent advances in surfactant EOR, SPE J., 16(4), 889–907.Hoffman, R. L. (1975), Study of advancing interface: 1. Interface shape in liquid-gas systems, J. Colloid Interface Sci., 50(2), 228–241.Holmberg, K., B. Josson, B. Kronberg, and B. Lindman (2003), Surfactants and Polymers in Aqueous Solution, John Wiley, Chichester, U. K.Holtzman, R., M. L. Szulczewski, and R. Juanes (2012), Capillary fracturing in granular media, Phys. Rev. Lett., 108(26), 264504.Hsu, S. Y., and M. Hilpert (2016), Pore-scale visualization of the mobilization of a partially wetting droplet, Adv. Water Resour., 95, 235–245.Huang, Z., Z. L. Yan, and T. R. Gu (1989), Mixed adsorption of cationic and anionic surfactants from aqueous-solution on silica-gel, Colloid
Surf., 36(3), 353–358.Iglauer, S., Y. F. Wu, P. Shuler, Y. C. Tang, and W. A. Goddard (2010), New surfactant classes for enhanced oil recovery and their tertiary oil
recovery potential, J. Pet. Sci. Eng., 71(1–2), 23–29.Israelachvili, J. N. (2011), Intermolecular and Surface Forces, Academic, San Diego, Calif.Johannessen, A. M., and K. Spildo (2013), Enhanced oil recovery (EOR) by combining surfactant with low salinity injection, Energy Fuel,
27(10), 5738–5749.Kim, S., and J. C. Santamarina (2014), Engineered CO2 injection: The use of surfactants for enhanced sweep efficiency, Int. J. Greenhouse
Gas Control, 20, 324–332.Kovscek, A. R., and C. J. Radke (1994), Fundamentals of foam transport in porous media, in Foams: Fundamentals and Applications in the
Petroleum Industry, edited by L. Schramm, pp. 115–163, Am. Chem. Soc., Washington, D. C.Kovscek, A. R., G. Q. Tang and C. J. Radke (2007), Verification of Roof snap off as a foam-generation mechanism in porous media at steady
state, Colloid Surf. A, 302(1–3), 251–260.Kwok, D. Y., and A. W. Neumann (2000), Contact angle interpretation in terms of solid surface tension, Colloid Surf. A, 161(1), 31–48.Lenormand, R., C. Zarcone, and A. Sarr (1983), Mechanisms of the displacement of one fluid by another in a network of capillary ducts,
J. Fluid Mech., 135, 337–353.Lenormand, R., E. Touboul, and C. Zarcone (1988), Numerical-models and experiments on immiscible displacements in porous-media,
J. Fluid Mech., 189, 165–187.Li, W. Q., R. D. Vigil, I. A. Beresnev, P. Iassonov, and R. Ewing (2005), Vibration-induced mobilization of trapped oil ganglia in porous media:
Experimental validation of a capillary-physics mechanism, J. Colloid Interface Sci., 289(1), 193–199.Likos, W. J., and N. Lu (2004), Hysteresis of capillary stress in unsaturated granular soil, J. Eng. Mech., 130(6), 646–655.Lowry, M. I., and C. T. Miller (1995), Pore-scale modeling of nonwetting-phase residual in porous-media, Water Resour. Res., 31(3), 455–473.Lu, N., and W. J. Likos (2004), Unsaturated Soil Mechanics, John Wiley, Hoboken, N. J.Maloy, K. J., A. Hansen, E. L. Hinrichsen, and S. Roux (1992), Experimental measurements of the roughness of brittle cracks, Phys. Rev. Lett.,
68(2), 213–215.Mason, G., and N. R. Morrow (1991), Capillary behavior of a perfectly wetting liquid in irregular triangular tubes, J. Colloid Interface Sci.,
141(1), 262–274.Mason, G., and N. R. Morrow (1994), Effect of contact angle on capillary displacement curvatures in pore throats formed by spheres,
J. Colloid Interface Sci., 168(1), 130–141.Miller, R., P. Joos, and V. B. Fainerman (1994), Dynamic surface and interfacial tensions of surfactant and polymer solutions, Adv. Colloid
Interface, 49, 249–302.Minagawa, H., Y. Nishikawa, I. Ikeda, K. Miyazaki, N. Takahara, Y. Sakamoto, T. Komai, and H. Narita (2008), Characterization of sand sedi-
ment by pore size distribution and permeability using proton nuclear magnetic resonance measurement, J. Geophys. Res., 113, B07210,doi:10.1029/2007JB005403.
Miwa, M., A. Nakajima, A. Fujishima, K. Hashimoto, and T. Watanabe (2000), Effects of the surface roughness on sliding angles of waterdroplets on superhydrophobic surfaces, Langmuir, 16(13), 5754–5760.
Mohanty, K. K., H. T. Davis, and L. E. Scriven (1987), Physics of oil entrapment in water-wet rock, SPE Reservoir Eng., 2(1), 113–128.Morrow, N. R. (1970), Physics and thermodynamics of capillary action in porous media, Ind. Eng. Chem., 62(6), 32–56.Mulligan, C. N., R. N. Yong, and B. F. Gibbs (2001), Surfactant-enhanced remediation of contaminated soil: A review, Eng. Geol., 60(1–4),
371–380.Mysels, K. J. (1986), Surface tension of solutions of pure sodium dodecyl sulfate, Langmuir, 2(4), 423–428.Nakahara, H., S. Lee, M. P. Krafft, and O. Shibata (2010), Fluorocarbon-hybrid pulmonary surfactants for replacement therapy—A Langmuir
mono layer study, Langmuir, 26(23), 18,256–18,265.Nikolov, A. D., D. T. Wasan, A. Chengara, K. Koczo, G. A. Policello, and I. Kolossvary (2002), Superspreading driven by Marangoni flow, Adv.
Colloid Interface, 96(1–3), 325–338.Nordbotten, J. M., M. A. Celia, and S. Bachu (2005), Injection and storage of CO2 in deep saline aquifers: Analytical solution for CO2 plume
evolution during injection, Transp. Porous Media, 58(3), 339–360.
Water Resources Research 10.1002/2015WR018499
JANG ET AL. CAPILLARITY PORE THROATS AND SURFACTANT 9598
Prosser, A. J., and E. I. Franses (2001), Adsorption and surface tension of ionic surfactants at the air-water interface: Review and evaluationof equilibrium models, Colloid Surf. A, 178(1–3), 1–40.
Pruess, K., and J. Garcia (2002), Multiphase flow dynamics during CO2 disposal into saline aquifers, Environ. Geol., 42(2–3), 282–295.Purcell, W. R. (1950), Interpretation of capillary pressure data, Pet. Trans. AIME, 2(8), 369–371.Ransohoff, T. C., P. A. Gauglitz, and C. J. Radke (1987), Snap-off of gas-bubbles in smoothly constricted noncircular capillaries, AIChE J.,
33(5), 753–765.Ransohoff, T. C., and C. J. Radke (1988a), Laminar flow of a wetting liquid along the corners of a predominantly gas-occupied noncircular
pore, J. Colloid Interface Sci., 121(2), 392–401.Ransohoff, T. C., and C. J. Radke (1988b), Mechanisms of foam generation in glass-bead packs, SPE Reservoir Eng., 3(2), 573–585.Reddy, K. R., and R. E. Saichek (2003), Effect of soil type on electrokinetic removal of phenanthrene using surfactants and cosolvents, J. Envi-
ron. Eng., 129(4), 336–346.Roof, J. G. (1970), Snap-off of oil droplets in water-wet pores, Soc. Pet. Eng. J., 10(1), 85–90.Rose, W., and R. W. Heins (1962), Moving interfaces and contact angle rate-dependency, J. Colloid Sci., 17(1), 39–48.Rosen, M. J. (2004), Surfactants and Interfacial Phenomena, John Wiley, Hoboken, N. J.Rossen, W. R. (2003), A critical review of Roof snap-off as a mechanism of steady-state foam generation in homogeneous porous media,
Colloid Surf. A, 225(1–3), 1–24.Saenton, S., T. H. Illangasekare, K. Soga, and T. A. Saba (2002), Effects of source zone heterogeneity on surfactant-enhanced NAPL dissolu-
tion and resulting remediation end-points, J. Contam. Hydrol., 59(1–2), 27–44.Sandnes, B., E. G. Flekkoy, H. A. Knudsen, K. J. Maloy, and H. See (2011), Patterns and flow in frictional fluid dynamics, Nat. Commun., 2, 288.Schramm, L. L., and F. Wassmuth (1994), Foams: Basic principles, in Foams: Fundamentals and Applications in the Petroleum Industry, edited
by L. Schramm, Am. Chem. Soc., Washington, D. C.Schulz, J. C., and G. G. Warr (2002), Adsorbed layer structure of cationic and anionic surfactants on mineral oxide surfaces, Langmuir, 18(8),
3191–3197.Scriven, L. E., and C. V. Sternling (1960), Marangoni effects, Nature, 187(4733), 186–188.Sharma, R., and D. S. Ross (1991), Kinetics of liquid penetration into periodically constricted capillaries, J. Chem. Soc. Faraday Trans., 87(4),
619–624.Shin, H., and J. C. Santamarina (2010), Fluid-driven fractures in uncemented sediments: Underlying particle-level processes, Earth Planet Sci.
Lett., 299(1–2), 180–189.Siebold, A., M. Nardin, J. Schultz, A. Walliser, and M. Oppliger (2000), Effect of dynamic contact angle on capillary rise phenomena, Colloid
Surf. A, 161(1), 81–87.Song, W., and A. R. Kovscek (2015), Functionalization of micromodels with kaolinite for investigation of low salinity oil-recovery processes,
Lab Chip, 15(16), 3314–3325.Still, T., P. J. Yunker, and A. G. Yodh (2012), Surfactant-induced Marangoni eddies alter the coffee-rings of evaporating colloidal drops, Lang-
muir, 28(11), 4984–4988.Stokes, J. P., D. A. Weitz, J. P. Gollub, A. Dougherty, M. O. Robbins, P. M. Chaikin, and H. M. Lindsay (1986), Interfacial stability of immiscible
displacement in a porous-medium, Phys. Rev. Lett., 57(14), 1718–1721.Tadmor, R. (2009), Marangoni flow revisited, J. Colloid Interface Sci., 332(2), 451–454.Thomson, W. (1886), Capillary attraction, Nature, 34, 270–272.Trojer, M., M. L. Szulczewski, and R. Juanes (2015), Stabilizing fluid-fluid displacements in porous media through wettability alteration, Phys.
Rev. Appl., 3(5), 054008.Urso, M. E. D., C. J. Lawrence, and M. J. Adams (1999), Pendular, funicular, and capillary bridges: Results for two dimensions, J. Colloid Inter-
face Sci., 220(1), 42–56.Valvatne, P. H., and M. J. Blunt (2004), Predictive pore-scale modeling of two-phase flow in mixed wet media, Water Resour. Res., 40,
W07406, doi:10.1029/2003WR002627.Vargaftik, N. B., B. N. Volkov, and L. D. Voljak (1983), International tables of the surface tension of water, J. Phys. Chem. Ref. Data, 12(3),
817–820.Washburn, E. W. (1921), The dynamics of capillary flow, Phys. Rev., 17, 273–283.Weislogel, M. M., and S. Lichter (1998), Capillary flow in an interior corner, J. Fluid Mech., 373, 349–378.Wenzel, R. N. (1936), Resistance of solid surfaces to wetting by water, Ind. Eng. Chem., 28(8), 988–994.Xue, H. T., Z. N. Fang, Y. Yang, J. P. Huang, and L. W. Zhou (2006), Contact angle determined by spontaneous dynamic capillary, Chem. Phys.
Lett., 432(1–3), 326–330.Young, T. (1804), An essay on the cohesion of fluids, Philos. Trans. R. Soc. London, 95, 65–87.Zhang, R., and P. Somasundaran (2006), Advances in adsorption of surfactants and their mixtures at solid/solution interfaces, Adv. Colloid
Interface, 123, 213–229.Zhao, B. Z., C. W. MacMinn, and R. Juanes (2016), Wettability control on multiphase flow in patterned microfluidics, Proc. Natl. Acad. Sci. U.
S. A., 113(37), 10,251–10,256.
Water Resources Research 10.1002/2015WR018499
JANG ET AL. CAPILLARITY PORE THROATS AND SURFACTANT 9599