capital budgeting practices: a survey of central and ...efmaefm.org/0efmameetings/efma annual...
TRANSCRIPT

Capital Budgeting Practices: A Survey of Central and Eastern European Firms
Gyorgy Andor
Department of Finance Budapest University of Technology and Economics
Budapest, Hungary Phone: (361) 463-3005
E-mail: [email protected]
Sunil K. Mohanty* Department of Finance
Opus College of Business University of St. Thomas Minneapolis, MN 55403 Phone: (962) 651-4416
E-mail: [email protected]
and
Tamas Toth Department of Finance
Budapest University of Technology and Economics Budapest, Hungary
Phone: (361) 463-2802 E-mail: [email protected]
January 11, 2011
___________________________________________________________________________ *Corresponding author. We would like to thank William G. Christie for useful comments. We thank Jing Zhang for providing excellent research assistance. Second author is grateful to the Budapest University of Technology and Economics (BUTE) for providing research scholar grant for this project. The financial support provided by BUTE and the Opus College of Business at University of St. Thomas is gratefully acknowledged. The contribution made by the individuals who gave freely of their time in responding to phone interviews is also greatly appreciated.

2
Capital Budgeting Practices: A Survey of Central and Eastern European Firms
Abstract
In this paper, we report the survey results from executives of companies in ten countries
in Central and Eastern Europe (CEE) – Bulgaria, Croatia, Czech Republic, Hungary, Latvia,
Lithuania, Poland, Romania, Slovak Republic, and Slovenia – regarding their companies’ capital
budgeting practices. We document interesting insights on how theoretical corporate finance
concepts are applied by practitioners in CEE countries, and the significant variations in capital
budgeting practices among twenty-four countries, four geographic regions, and three income
groups. We also find significant variations between large and small/medium firms, and between
local firms and firms dominated by multinational culture. The findings of our survey indicate
that capital budgeting practices in CEE countries appear to be influenced mostly by firm size and
multinational culture and to a lesser extent by insider ownership.
EFM Classification: 220
Key Words: Capital Budgeting; Cost of Capital, Survey, Central and Eastern Europe

3
Capital Budgeting Practices: A Survey of Central and Eastern European Firms
1. Introduction
Prior research examines capital budgeting practices among business firms in the U.S. and
Canada (Graham and Harvey, 2001), the U.K. (Arnold and Hatzopoulos, 2000), Sweden
(Sandahl and Sjögren, 2003), the U.K., the Netherlands, Germany, and France (e.g., Brounen, De
Jong, and Koedijk, 2004), the Netherlands and China (Hermes, Smid, and Yao, 2007), Australia
(Truong, Partington, and Peat, 2008), and the Asia-Pacific region (Kester et. al., 1999). The
results of the above studies are widely cited today and have had significant impact on the theory
and practice of corporate finance in the U.S., Canada, Western Europe, and the Asia-Pacific
region. However, prior field studies related to the practice of corporate finance primarily focus
on North American and Western European firms, and they provide little information about the
capital budgeting practices in Central and Eastern European (CEE) countries.1 In this paper, we
conduct a comprehensive survey that asks business executives from a wide range of firms (small,
medium, and large) in the CEE region to describe their choices related to capital budgeting
analysis and decisions. In many respect, the goals of our paper are similar to the above studies.2
However, our study differs from previous research in several dimensions. First, we focus
on capital budgeting practices among business firms in CEE countries. Second, the results of our
1 Central and Eastern European (CEE) countries in this article are referred to as the Eastern bloc countries west of 2 One of the well-known surveys on the practice of corporate finance was conducted by Graham and Harvey (2001). The authors received the Jensen Prize for the best corporate finance paper published in the Journal of Financial Economics in 2001. Other seminal survey papers include Lintner (1956) on dividend policy, Pinegar and Wilbricht (1989) on capital structure, Brounen et al. (2004) on corporate finance practice in Europe, and Graham, Harvey, and Rajgopal (2005) on corporate financial reporting.

4
study are likely to be different from that of previous studies because of the diversity of
institutional systems, culture, and languages associated with CEE countries. Third, to the extent
that the Central and Eastern European practices are less market-based than in the Western
countries, they are also less observable. Thus, most of the stylized facts that have influenced
corporate finance theories are possibly rooted in the U.S. and Western European empirical
evidence and they do not apply entirely to the CEE region. Finally, , theories relevant for the
CEE context are less developed, and there is little evidence on the theory and practice of
corporate finance in CEE countries. One of the major goals of this study is to narrow the gap
between theory and practice of corporate finance in the CEE region by measuring the extent to
which theoretical concepts have been adopted by corporate executives. Fifth, the results of our
study will be useful to both practitioners and investors as they will learn more about capital
budgeting practices among business firms in CEE countries. Finally, it is our belief that survey-
based research (e.g., Graham and Harvey, 2001; Graham, Harvey, and Rajgopal, 2005)3
complements empirical research based on historical data. Therefore, we hope that the findings
of our study will not only fill a gap in the corporate finance literature, but will also lead to the
development of new theories and/or modification of existing ones.
Our survey focuses on capital budgeting practices among firms in CEE countries. We
explore each category in depth, asking several questions. We sample a large cross-section of
firms representing a wide variety of firms and industries across ten different countries in the CEE
(e.g., Bulgaria, Croatia, Czech Republic, Hungary, Latvia, Lithuania, Poland, Romania,
Slovakia, and Slovenia). We collected 400 responses by conducting a telephone survey, creating
3 We recognize that empirical studies using archival data have several advantages over field studies. They offer statistical power, as well as cross-sectional and time variations. However, these studies often have weaknesses related to model specification and the inability to incorporate qualitative questions in the empirical model. While clinical studies can provide excellent detail and unique aspects of corporate behavior, they typically use small samples and thus their results are often sample-specific and can’t be generalized. Survey-based studies offer a balance between large sample analyses and clinical studies. The survey approach also allows us to address issues that traditional empirical studies based on archival data sources cannot.
5
one of the largest survey samples in the financial literature.4 We analyse responses conditional
on three key firm characteristics: firm size, management culture, and executive ownership. We
find significant variations between large and small firms within the CEE region. Survey findings
suggest that corporate finance practice is influenced mostly by firm size and multinational
management culture, and to a lesser extent by insider ownership. We also compare our survey
results with similar field studies conducted over the last decade–e.g., Graham and Harvey (2001)
for U.S. and Canada; Arnold and Hatzopoulos (2000) for the U.K.; Sandahl and Sjögren (2003)
for Sweden; Brounen, De Jong, and Koedijk (2004) for the U.K., the Netherlands, Germany,
and France; Hermes, Smid, and Yao (2007) for the Netherlands and China; Truong, Partington,
and Peat (2008) for Australia; and Kester et al. (1999) for the Asia-Pacific region.
While the survey method allows one to ask unique questions, it is not without potential
issues. Surveys measure beliefs or opinions, not necessarily actions. It is possible that some
survey questions are misunderstood by respondents and thus produce noisy measurements of the
variables of interest. In addition, despite making optimal decisions, corporate managers
sometimes do not even understand the reason why they do what they do. Despite these
weaknesses associated with survey approach, we believe that our survey provides unique
information about how capital budgeting decisions are made by firms in CEE countries. We hope
that researchers will use our results to develop new theories or potentially modify existing views.
This paper is organized as follows. In the next section, we describe the economic,
financial, and human developments of CEE countries. In Section 3, we present the sample
4 Following are recent field studies on corporate finance that use large-size samples. Graham, Harvey, and Puri (2010) survey more than 1000 CEOs and CFOs to understand how capital is allocated and decision-making authority is delegated within firms. Graham, Harvey, and Rajgopal (2005) survey 401 U.S. financial executives on corporate financial reporting. Brav, Graham, Harvey, and Michaely (2005) survey 384 financial executives to determine the factors that drive dividend and share repurchase decisions. Graham and Harvey (2001) survey a sample of 392 U.S. and Canadian CFOs about practice of corporate finance, the second largest published survey after the Graham, Harvey, and Rajgopal (2005) study. A survey by Brav and Lehavy (2003) on payout policy in the U.S. includes 384 respondents. Brounen, De Jong, and Koedijk (2004) survey 313 CFOs from the U.K., the Netherlands, Germany, and France about practice of corporate finance. A survey by Moore and Reichert (1983) on the use of financial management techniques includes a sample of 298 large firms from the U.S.

6
collection procedure and sample statistics. Section 4 offers a comprehensive overview of our
survey results on capital budgeting practices in the CEE region. Section 5 presents an
international comparison of capital budgeting practices among U.S., Canada, Western Europe,
Australia, Asia-Pacific, and CEE countries. Finally, we offer concluding remarks in Section 6.
2. Economic, Financial, and Human Developments of CEE Countries
Emerging countries in the CEE that made the transition from communist to capitalist
systems have experienced rapid changes over the last two decades. Since 1999 when these
countries gradually integrated into the European Union (EU), the pace of change continues to
accelerate. During the past decade, financial institutions, capital markets, and business firms in
the CEE countries have undergone dramatic transformations. While finance and economic
research related to CEE countries receives a great deal of attention in the literature, previous
research on capital budgeting practices among CEE countries is scant. To our knowledge, this is
the first field study that focuses on capital budgeting practices of business firms in CEE countries
that are next to the most developed ones in terms of GDP. While we know a lot more about the
theory and practice of corporate financial decision making in developed countries, we hardly
know anything about it for CEE countries.
Our sample firms are drawn from ten CEE countries. Panel A in Table 1 reports selected
measures of the levels of economic, financial, and human development for our sample CEE
countries, and Panel B in Table 1 compares levels of economic, financial, and human
development of CEE countries with that of the world, high-income countries, upper-middle
income countries, China, the USA, and the European Monetary Union (EMU). The high-income
countries comprise a large number of countries in the world, including 25 OECD (Organization
7
for Economic Co-operation and Development) member countries.5 The upper-middle income
group comprises of 46 countries after high-income ones.6
[INSERT TABLE 1 ABOUT HERE]
As can be seen from Panel B in Table 1, based on the gross national income (GNI) per
capita7, CEE countries immediately follow developed ones (e.g., the U.S., Canada, Japan,
Australia, and Western European countries) in terms of GNI. We also observe that the GNI per
capita average (weighed by populations) of the ten sample CEE countries have the following
unique characteristics: (a) it is higher than the world average; (b) it is one and a half times higher
than the upper middle income countries’ average; (c) it is lower than half of the high-income
countries’ average; and (d) it is one-third of the average of European Monetary Union countries.
According to the 2008 World Bank classification, which is based on the GNI per capita of 66
high-income countries in 2008, Slovenia was ranked 47th, Czech Republic 54th, Slovak Republic
62nd, Croatia 65th, and Hungary 66th, while Poland, Lithuania, and Latvia were the top three of
upper-middle incomes. On one hand, these ten high- and middle-income countries make up the
geographic region known as the Eastern European countries; on the other hand, these countries
belong to Europe and the Central Asia region according to the World Bank’s report. The other
unique feature associated with these ten countries is that this group represents the former
5 Australia, Austria, Belgium, Canada, Czech Republic, Denmark, Finland, France, Germany, Greece, Iceland, Ireland, Italy, Japan, Korea Rep., Luxembourg, Netherlands, New Zealand, Norway, Portugal, Spain, Sweden, Switzerland, United Kingdom, United States. 6 Country classification table and data are available from the World Bank. The data for our paper were accessed online as of December 22, 2008. 7 The World Bank uses the gross national income (GNI) PPP as the main criterion for the development of a country. This term was earlier referred to as gross domestic product (GDP) PPP. The World Bank divides the 185 World Bank member countries (186) and all other economies with populations of more than 30,000 (210 total) into four groups based on its 2008 GNI PPP (calculated using the World Bank Atlas method): The groups are: low income, $975 or less; lower-middle income, $976 - $3,855; upper-middle income, $3,856 - $11,905; and high income, $11,906 or more. (The World Bank Group, 2009.) Using a PPP basis is arguably more useful when comparing generalized differences in living standards on the whole between nations because PPP takes into account the relative cost of living and the inflation rates of the countries, rather than using just exchange rates, which can distort the real differences in income.

8
communist countries. They are now new European Union member countries that have made the
transition from communist to capitalist systems and subsequently joined the European Union.8
The data presented in Table 1 (Panel B) reveal that the average foreign direct investment
(FDI) flows, as a percentage of GDP for CEE countries, is higher than that of developed
countries and China. On average, the exports/imports ratio associated with CEE countries is
quite high and is comparable to China and developed countries. However, the market
capitalizations of listed companies are considerably lower compared to that of upper-middle
income countries and China, indicating that equity markets in CEE countries are not yet well
developed.
Finally, the data on the human development index presented in Panel B of Table 1
indicates that the human capital development in CEE countries, in general, is comparable to the
upper-middle income countries. In summary, the unique group of ten small, open economies
represents the countries immediately following the most developed ones of the world, while the
same group provides an almost complete sample of former communist, new European Union
countries.
3. Data and Methodology 3.1. Sample Design
The first and foremost goal of our sampling is to select a sample of firms to maximize
representation and minimize firm-specific differences across ten CEE countries. Our second goal
is to include an adequate number of firms representing small and medium companies because a
large number of these companies (both privately and state owned) have been operating over the
past two decades in the CEE region. Since the focus of our survey is the CEE region, we treat
the group of ten countries as a large country; therefore, we select randomly an appropriate
8 Table 1 (Panel A) reports the year when a member country joined the EU.

9
number of firms in proportion to a country’s GDP purchasing power parity (PPP) data (see Table
1).9
The basis of our company database is the Amadeus data set of Bureau Van Dijk (revised
version in 2008), the same used by Brounen et al. (2004). This dataset covers all firms in Europe.
We select firms from ten CEE countries with at least 25 or more employees. Then, we drop the
firms from the set with missing data that are important for the study. As a result, we lose about
10% of the total firms from the dataset. We sort the data by country and divide each country’s
data into five baskets, based on number of employees:
[INSERT TABLE 2 ABOUT HERE]
According to the EU Directives, firms with number of employees between 25 and 50 are
classified as small firms (1st basket) and firms with number of employees between 51 and 250
are classified as medium firms (2nd basket). The remaining firms with more than 250 employees
are classified as large firms. In order to get more realistic sample we stratify the ‘large’
subpopulation proportionally by the number of employees into three equal groups, and we
assign the same expected response number for each group. . Thus, firms with number of
employees between 251 and 375 belong to the 3rd basket, large firms with number of employees
between 376 to 650 belong to the 4th, and large firms with number of employees over 650 are put
into the 5th basket. According to EU Directives, while the primary criterion for the classification
of a company being ‘small,’ ‘medium,’ or ‘large’ is based on the number of employees the firm
has, the two secondary criteria are total assets and sales revenue. Therefore, we examine
companies’ total assets and sales revenue for all five baskets to identify outliers; we drop the
firms that do not meet all three requirements. Approximately 15% of the total firms are dropped
from the population due to missing data and omission of outliers. Finally, the number of firms
left in each basket is at least ten times larger than the expected response numbers (see Table 2).
9 Among GDP indexes, the PPP-adjusted GDP index seems to represent the region best. PPP GDP reflects the economic differences among CEE countries because a typical country in this region is a middle-income country as shown in Panel B of Table 1.

10
3.2 Delivery and Response
Similar to the survey of Graham and Harvey (2001), we prepare our questionnaire in
English and then have it translated into ten languages. While translating the questionnaire, we
face several challenges. First, while business managers from CEE countries could be familiar
with modern corporate finance literature in their local language, they may not be familiar with
the terminology of modern finance in English. Second, business managers working in CEE
countries may use special words in their local language as an equivalent to a given English term.
Third, there have been large gaps between the newly developed academic terminologies and
everyday slang used by local managers in these countries. To overcome such challenges
associated with the translation of the English questionnaire, we conduct a phone survey in the
respondents’ native languages instead of conducting mail surveys. Oral interviews provide
opportunities to interact with respondents and help in understanding the special meaning and
terminology associated with corporate finance theory and practice.
Interviews are carried out on the phone with the assistance of a multinational polling
company that has a professional call center. Operators are native speakers of the languages and
are trained with regard to corporate finance aspects of the survey by the authors of this study. For
example, prior to phone interviews, each caller had to take part in a special professional course
presented by authors of this paper. In addition, we seek assistance from faculty members of
finance departments at different universities from several CEE countries. Native operators are
allowed to make some changes to the translation after the first few interviews.
After the initial experience with the phone survey, the number of expected responses for
each basket was determined in advance. The call center is then programmed in such a way that
several companies are randomly dialed from each basket until the expected number of responses
is obtained. Our goal is to collect 400 usable responses that represent small, medium, and large
firms from each of the ten CEE countries. We prescribe 10% of the total responses from the first
basket, 15% from the second basket, and 25% from each of the third, fourth, and fifth baskets
11
from each country. Consistent with our goal, we divide the whole population of firms into three
subpopulations by the number of employees: ‘small’ (25-50), ‘medium’ (51-250), and ‘large’
(251+). We decided on the expected response proportions from all the three subpopulations in
advance: 10% for ‘small firms,’ 15% for ‘medium firms,’ and 75% for ‘large firms’ for each
country (25%-25%-25% for each group of the ‘large firms’ subpopulation). Table 2 reports the
population and expected number of responses from each of the five baskets for each country.
The last row in Table 2 shows the number of respondent firms from each of the ten countries.
For example, the largest number of firms represented in our sample is drawn from Poland (143
firms), while the smallest number of firms is drawn from Latvia (9 firms).
Computing the response rate of our phone interview survey is not simple because the
“total number of firms contacted” may not be well defined. If we take into account only those
cases where the operator can reach the ‘target person’ (the CFO or a responsible manager who
makes capital budgeting decisions at the firm), then ‘response rate’ is quite high: about 30-40%
based on the report obtained from the callers. However, our overall response rate is about 10% if
we account for the number of firms contacted by our operators because each call is counted as
being contacted.
While our paper focuses on questions and responses related to capital budgeting practices
in CEE countries, the whole survey includes questions concerning each firm’s goals and the
perception of their importance by stakeholders, influence of foreign management culture,
executive ownership, types of financing, capital structure, and codes of ethics (see the survey
questionnaire at http://www.finance.bme.hu/research/CEE_Survey_EN-HU.pdf). In addition,
the Amadeus dataset of Bureau Van Dijk mentioned above contains statistical data related to
firm size in terms of number of employees, sales revenue, and phone numbers we used for the
telephone survey.
4. Survey Results
12
4.1 Firm Statistics
Figure 1 presents summary information about our sample firms (total of 400 firms),
which are obtained from ten CEE countries. Figure 1A shows the distribution of sample firms by
country. The highest percentage of firms (% of the sample firms) is drawn from Poland with the
largest GDP, and the lowest percentage of firms (% of the sample firms) is drawn from Latvia
with the smallest GDP. Our sample firms represent a wide variety of small and medium firms
(25% of the sample firms have less than or equal to 250 employees) to large firms (75% of the
sample firms have at least 251 employees. see Figure 1B).
We analyse how a firm’s size affects corporate finance practices in CEE countries. We
ask respondents whether foreign culture dominates corporate finance practices in addition to the
local culture. Figure 1C shows the distribution of foreign culture that dominates corporate
financial management decisions. Among all multinational cultures that influence the practice of
corporate finance among CEE countries, the German culture (17% of sample firms) has been the
most dominant and the Dutch culture (less than 1% of all sample firms) and other cultures
outside the EU (less than 1%) have been the least dominant (see Figure 1C). Figure 1D shows
the percent of respondents who say that foreign culture dominates the corporate finance practices
of their firms 59 %of all sample firms), as well as the percent of respondents who do not identify
any foreign culture as dominating the corporate finance practices of their firms (41% of all
sample firms). Figure 1E reports the distribution of executive stock ownership. The survey
responses also reveal that the top three executives own at least 5% of the common stocks of their
firms in approximately 18% of the sample firms (see Figure 1E). We refer to firms with
executive stock ownership greater than 10% as ‘high insider ownership’. Figure 1F indicates that
only 14% of sample firms have high executive stock ownership. These characteristics help us
analyse whether managerial incentives affect capital budgeting practices in CEE countries.
[INSERT FIGURE 1 ABOUT HERE]
4.2 Importance of Goals for Firms

13
Prior studies (e.g., Chew, 1997; La Porta et al., 1998) show that the power of
shareholders varies significantly across countries depending on the development of capital
markets, institutional settings, and legal systems.10 Because of significant differences in capital
markets and institutional settings between Western European and CEE countries (e.g., Rajan and
Zingales, 2003), we include a question on the importance of goals to the firm. We also ask our
respondents how important goals for their firms are on a scale of 1 to 4 (1 being “not important”
and 4 being “very important”). The survey responses reported in Table 3 and the results
summarized in Figure 2 show that long-term survival of the firm is by far the most important
goal for a typical firm in the CEE region: 95% of respondents (381 responses) indicate that the
stability of performance is very important or important for the firm. The second and third most
important goals are liquidity goals (94%) and maximizing growth in sales (89%). The two least
popular goals for firms operating in the CEE region are the maximization of dividends and
maximization of shareholders’ wealth. Results summarized in Figure 2 indicate that 71% of
respondents support the goal of maximization of dividends, while 82% of respondents support
the goal of maximization of market value of equity. These findings differ substantially from
Brounen, De Jong, and Koedijk (2004). Their study finds that the maximization of accounting
profit is the most important goal for Western European firms, followed by sustainable growth
and maximization of market share.
[INSERT TABLE 3 ABOUT HERE]
[INSERT FIGURE 2 ABOUT HERE]
4.3 Importance of Sources of Long-term Funds
10 Comparing the U.S. with Europe, La Porta et al. (1997, 1998) find that the difference between the two legal systems encompassing both continents is significant. Rajan and Zingales (2003) emphasize the continental differences by comparing the financial systems: the institution-heavy relationship-based financial system is more prevalent in Europe, and the market-intensive arms’ length financial system is more prevalent in the United States. Chew (1997) shows how the Anglo-Saxon, marked-based corporate governance system differs significantly from the relation-based system, which is most widespread in Europe.

14
La Porta et al. (1997) find that sources of long-term funds needed to finance investment
projects vary significantly across countries depending on the level of development of a country’s
capital markets, financial institutions, and legal systems. We ask our respondents how important
the sources of long-term funds are in financing new investments on a scale of 1 to 4 (1 meaning
“least important” and 4 meaning “very important”). The survey responses reported in Table 4
show that the most preferred source of funds used to finance a new investment is the retained
earnings (internal source of funds) followed by straight debt. The least important source of funds
used to finance long-term projects is the choice of convertible bonds followed by external
common equity. The results summarized in Figure 3 indicate that 73% of respondents prefer
retained earnings as the primary source of long-term funds to finance new investments. The
second and third most important sources of long-term funds are the sale of assets (restructuring
of assets) and external common equity. The least desirable source of long-term funds is the
convertible bond. Only 13% of respondents indicate that they prefer convertible bonds as the
most preferred source of long-term funds to finance investment projects.
[INSERT TABLE 4 ABOUT HERE]
[INSERT FIGURE 3 ABOUT HERE]
4.4 Capital Budgeting Practices
To study capital budgeting practices in CEE countries, we ask respondents whether they
conduct any formal capital budgeting analysis. Next, we ask whether they use any kind of
discounted cash flow (DCF) techniques such as net present value (NPV), internal rate of return
(IRR), or profitability index. In addition, similar to Graham and Harvey (2001) and Brounen, De
Jong, and Koedijk (2004), we ask respondents whether they use a variety of other capital
budgeting techniques, like simple payback period and accounting-based index (e.g., return on
assets, return on investment capital, etc.), as well as more advanced methods like sensitive
analysis and real option analysis. We also ask respondents to specify the minimum amount over

15
which they make a written investment analysis and approximately how many projects are
evaluated using quantitative analysis over a one-year period. We ask whether firms use a given
value of cost of capital for all projects or if they use a different cost of capital for different
projects. We then ask what kind of method (e.g., WACC, CAPM, etc.) they use to calculate the
discount rate for the company or project. Finally, we ask respondents whether it is possible that a
project is supported or rejected due to variety of reasons such as lack of financial resources,
strategic considerations, ethical issues, or lack of trust in the data and analyses.
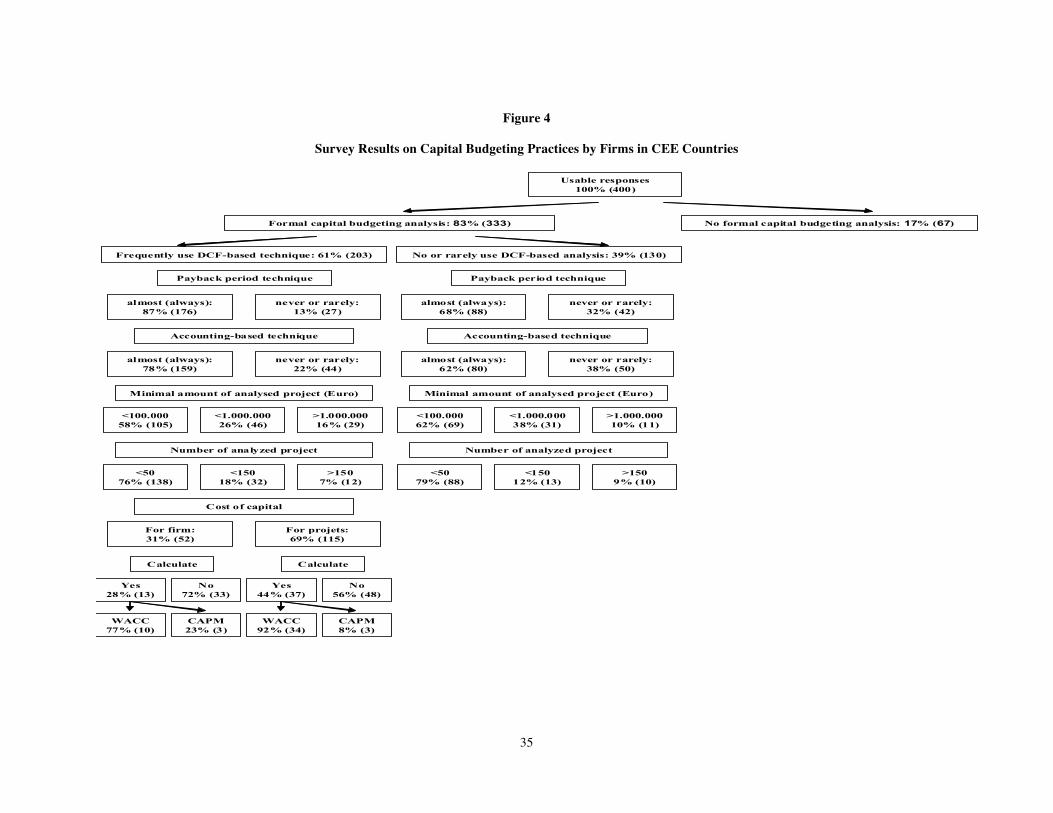
Figure 4 presents an overview of our survey results on capital budgeting practices in CEE
countries based on a total of 400 responses. The summary of the results in Figure 4 indicates that
83% of respondents conduct formal capital budgeting analyses, and only 61% of respondents
who conduct formal capital budgeting analyses frequently use DCF-based capital budgeting
techniques such as NPV and IRR analyses. It is surprising to note that the other 39%
of respondents who make formal capital budgeting analyses do not (or rarely) use DCF-based
analysis. The summary results reported in Figure 4 indicate that among the respondents who use
DCF-based analysis, 87% of them always use a payback period technique, while 78% always use
an accounting-based technique that does not utilize DCF analysis. On the other hand, of the 130
sample firms that do not use DCF-based analysis, 68% say they always use a payback period
technique, while 62% say they always use an accounting-based technique. The relative
popularity of the payback period in Central and Eastern Europe is surprising because financial
textbooks have discussed the shortcomings of the payback criterion for many decades. As is well
known, the payback ignores the time value of money and cash flows beyond the cut-off date. In a
way, it is not unexpected to find that the payback measure is still so dominating in CEE firms
because the payback approach is related to liquidity, which is among the most important goals
for a firm as indicated in this survey.
[INSERT FIGURE 4 ABOUT HERE]

16
The survey results indicate that 58% of respondents conduct formal capital budgeting
analyses also for small projects (project outlay less than one million euro) and only 16% say they
make formal capital budgeting analyses only for large projects (project outlay of at least one
million euro or more). Of the 130 sample firms that do not use DCF-based techniques, 62% of
them make capital budgeting analyses also for small projects (less than one million) and only
10% of them make capital budgeting analyses only for large projects (at least one million euro or
more). Of the 203 sample firms that frequently use DCF-based techniques, 76% say they analyse
fewer than 50 projects per year, while 7% say they analyse at least 150 projects or more per year.
Interestingly, the above results are similar to the sample firms that do not use DCF-based
techniques.
This section investigates the ways in which the cost of capital is derived and applied, as
well. The first question we ask on the cost of capital is whether respondents use only one given
value of cost of capital for all projects for a given firm or whether they use a different value for
each project.
Theoretically speaking, it makes sense because different projects have varying degrees of
risk. Therefore, it is appropriate to use different values of cost of capital for different projects
within the same firm. Summary results presented in Figure 4 indicate that of the 203 sample
firms that frequently use DCF-based techniques, 31% say they use one given value of cost
capital for all projects, while to our surprise, 69% say they use different values for each project.
We then focus on firms that responded positively (167 responses) by asking them how they
calculate the discount rate for the firm or project. We specifically ask whether firms use a
general discount rate instead of calculating directly, use the Weighted Average Cost of Capital
(WACC) or the Capital Asset Pricing Model (CAPM), or use other practices that are not
consistent. Of the firms that use only one discount rate for the firm (52 responses), only 28% say
they calculate the discount rate for the firm. Among the firms that calculate only one discount
rate, 77% say they use the WACC method, while 23% say they use the CAPM method. In

17
contrast, of the firms that use different discount rates for different projects, only 44% say they
calculate the discount rate. Among those that calculate different discount rates for different
projects (115 responses), 92% say they use the WACC method and the rest use the CAPM
method. Thus, the most preferred method to estimate the cost of capital is the WACC method.
One of the explanations for the lack of use of the CAPM method is that most of our sample firms
in CEE countries are private and not publicly traded; therefore, it is not easy to compute either
the equity beta of the firm or the beta of the project.
In the following section, we examine whether the executives’ responses related to the
practice of formal capital budgeting analysis and the use of DCF-based analysis differ across
firm size, management culture, and executive ownership. These results shed light on corporate
finance practices among business firms in CEE countries and may have implications on various
corporate finance theories.
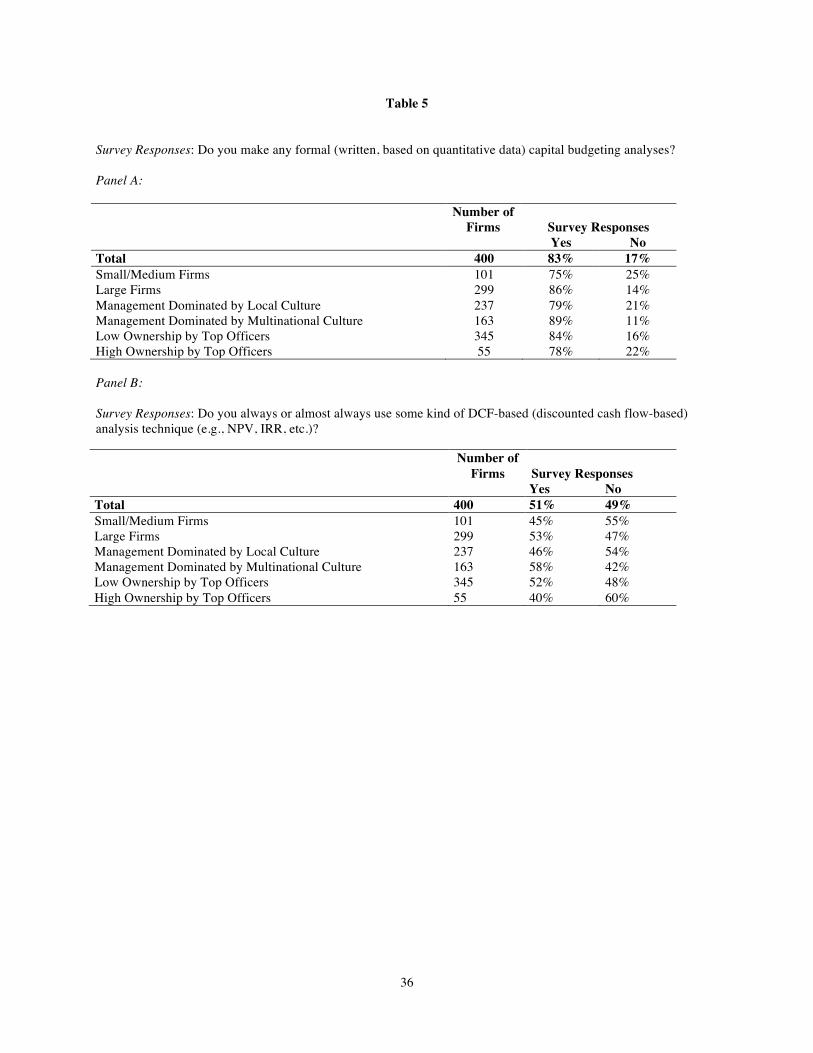
Survey responses indicate that large firms are more likely (86%) to conduct formal
capital budgeting analysis (see Panel A in Table 5) than small-medium firms (75%). Large firms
are also more likely (53%) to use sophisticated capital budgeting techniques, such as NPV and
IRR (see Panel B of Table 5) than small-medium firms (45%). We believe that a large company
is more likely to have the necessary resources to conduct a formal capital budgeting process
using sophisticated capital budgeting techniques than small-medium firms. Both Pike (1996) and
Sangster (1993) find a correlation between size and the use of sophisticated methods in U.K.
firms. The same seems to be the case for U.S. firms (Graham and Harvey, 2001).
The survey responses also show that firms dominated by multinational culture are more
likely to make formal capital budgeting analyses (see Panel A of Table 5) and use DCF-based
methods (see Panel B of Table 5) than small-medium firms, which are likely to be dominated by
local culture. We also believe that companies influenced by multinational culture move towards
a more international arena. Therefore, large and multinational firms endowed with managerial

18
talent and financial resources are more likely to use DCF methods, such as NPV and IRR
techniques, to emphasize value-based management models.
Furthermore, we observe that firms with high executive ownership (see Panel A of Table
5) are less likely to conduct formal capital budgeting analyses or use DCF-based techniques (see
Panel B of Table 5) compared to firms with low executive ownership. As indicated earlier, only
14% of our sample firms have high executive ownership. Thus, it is likely that firms with high
executive ownership tend to be small or medium and are dominated by local culture. Therefore,
those firms often lack necessary skills, training, and resources to conduct formal capital
budgeting analyses or use sophisticated DCF-based techniques.
[INSERT TABLE 5 ABOUT HERE]
Next, we examine whether the use of specific capital budgeting techniques differs across
firm size, management culture, and executive ownership. The use of payback period technique
seems to be popular among CEE firms regardless of their size, management culture, and level of
executive ownership in the firm (see Panel A of Table 6). Survey responses presented in Table 6
(Panel A) indicate that large firms with multinational culture and low executive ownership are
more likely to use payback periods than those firms that are small or medium with high
executive ownership and local culture. Similarly, large firms dominated by multinational culture
with low executive ownership are more likely to use some kind of accounting-based index or rate
than those that are small or medium with high executive ownership and are influenced by local
management culture (see Panel B of Table 6). Survey results reported in Table 6 (Panel C and
Panel D) also indicate that large multinational firms are more likely to use sophisticated capital
budgeting techniques, such as sensitivity analysis and real option analysis, than small or medium
firms that are likely to be influenced by local management culture. Again, this is not surprising
because large multinational firms do have managerial talents and resources to conduct formal
capital budgeting analyses using sophisticated capital budgeting techniques.
[INSERT TABLE 6 ABOUT HERE]

19
Survey results presented in Table 7 (Panel A) show that the responses to the minimum amount of
capital outlay over which firms make written investment analysis, either using DCF-based
methods or not, generally differ across firm size, management culture, and ownership. Similarly,
results presented in Table 7 (Panel B) show that the responses to the minimum amount of capital
outlay over which firms make written investment analysis, without using any kind of DCF
method, also varies across firm size, management culture, and ownership.
[INSERT TABLE 7 ABOUT HERE]
Similarly, the results reported in Table 8 (Panels A and B) indicate that survey responses
to the number of capital budgets being formally evaluated by firms differ significantly across
firm size, management culture, and ownership regardless of whether firms use DCF-based
analysis.
[INSERT TABLE 8 ABOUT HERE]
We continue our analysis by focusing on the firms that formally use DCF-based analyses.
We examine whether the executives’ responses related to the use of the given cost of capital
(discount rate) vary across firm size, management culture, and executive ownership. The survey
responses presented in Table 9 reveal a wide cross-sectional variation. For example, small and
medium firms are more likely to use one discount rate (49%) for the firm than large firms (27%).
On the other hand, survey results reported in column (4) of Table 9 suggest that large firms are
more likely to use different values of cost capital for different projects (73%) than small and
medium firms (51%). It is likely that large firms are more diversified and undertake different
types of projects with varying degrees of risk compared to small-medium firms. Therefore, large
firms are more likely to use a different cost of capital for different projects than small-medium
firms. We also find that firms with low executive ownership tend to be large and are more likely
to use different discount rates for different projects (70%) than small-medium firms with high
ownership (53%).
[INSERT TABLE 9 ABOUT HERE]

20
We further explore whether the use and methods of estimating cost of capital (e.g.,
WACC and CAPM) differ across firm size, management culture, and executive ownership.
The survey results reported in Table 10 (Panel A) indicate that the use and methods of cost
capital estimation vary significantly across firm size, management culture, and executive
ownership. The survey responses indicate that most firms do not calculate directly the cost of
capital for the firm; they tend to use a general discount rate instead. For example, 80% of small-
medium firms and 64% of large firms use a general discount rate instead of estimating the cost of
capital for the firm. The second most popular method used to calculate the cost of capital is
WACC followed by CAPM. The results based on cross-sectional analysis reported in Table 10
(Panel A) indicate that only 9% of large firms and 7% of firms dominated by multinational
culture use CAPM, while none of the small-medium firms in our sample use CAPM. This result
is not surprising because most of the firms in our sample are not publicly traded companies so
equity betas are not available. In contrast, Brounen, De Jong, and Koedijk (2004) find that the
CAPM is the most popular method used for estimating the cost of equity capital in Western
Europe.
We continue our analysis by focusing on the sample firms that formally use a DCF-based
analysis and different discount rates for different projects. We examine whether the executives’
responses related to different discount rates for different projects differ across firm size,
management culture, and executive ownership. The survey responses related to the use of
different costs of capital for different projects (see Panel B of Table 10) do not seem to exhibit
wide cross-sectional variations across firm size, management culture, and executive ownership.
Finally, our survey reveals that a project can be rejected by top management despite
being supported by either a DCF analysis or formal written analysis. There are several reasons
why a project is rejected, including lack of financial resources, strategic considerations, ethical
(moral) reasons, distrust for analysts, unreliable data used by analysts, lack of availability of
appropriate indices, or expected rates of return for CEE countries. Survey results reported in

21
Table 11 (Panel A) show that a project can be rejected despite being supported by the DCF-
based analysis. However, these results don’t significantly differ across firm size, management
culture, and executive ownership. Figure 5 indicates that the most popular reason, why a project
is not approved, is that senior management does not trust those making the capital budgeting
analyses or the data used by the analysts. The second most popular reason for disapproval of a
project despite being supported by data is due to ethical or moral reasons.
Survey results reported in Table 11 (Panel B) show that 58% of respondents who make
investment decisions without using any kind of DCF analysis say that a project can also be
rejected despite being supported by formal written analysis. The results don’t seem to vary
across firm size or culture. Figure 6 displays several reasons why a project may not be approved
by top management. The two most popular reasons for rejecting a project are ethical (moral)
reasons and a lack of trust in the data used by analysts.
5. Capital Budgeting Practices: An International Comparison
Prior studies emphasize the differences among institutional settings when comparing the
capital budgeting practices among firms in the U.S. and Western Europe. These studies claim
that institutional settings can lead to an international variation in practices of corporate finance.
In this section, we examine capital budgeting practices of firms in CEE countries and compare
them with the previous findings of Graham and Harvey (2001) for U.S. and Canadian firms;
Brounen et al. (2004) and Arnold and Hatzopoulos (2000) for U.K. firms; Brounen et al. (2004)
and Hermes et al. (2007) for firms in the Netherlands; Brounen et al. (2004) for firms in
Germany and France; Sandahl and Sjögren (2003) for Swedish firms; Hermes et al. (2007) for
Chinese firms; Truong et al. (2008) for Australian firms; and Kester et al. (1999) for firms in
Asia-Pacific countries (e.g., Hong Kong, Indonesia, Malaysia, Philippines, and Singapore). We
encounter two problems when comparing the previous survey results with ours. First, some of
the previous studies (e.g., Sandahl and Sjögren, 2003; Hermes et al., 2007) survey the ‘use’ of a

22
given capital budgeting technique (e.g., NPV or IRR) on a 0-4 scale (e.g., never, rare,
sometimes, and often), while other studies (e.g., Graham and Harvey, 2001; Brounen et al.,
2004; and this survey) ask ‘how frequently’ firms use a given capital budgeting technique (never,
sometimes, almost always, always). Following Graham and Harvey (2001) and Brounen et al.
(2004), we focus on survey results where the ‘frequently used’ (‘almost always and always’)
question is surveyed. For the purpose of international comparison, we adjust previous survey
results that ask about the use of a particular technique on a 0-4 scale and provide mean values.11
Our goal is to generate a consistent set of results from these studies so that we can draw an
international comparison on the use of capital budgeting methods among various countries,
geographic regions, and income groups. The second problem we encounter is the use of NPV,
IRR, and the DCF method. It is very likely that a firm using a DCF method uses NPV, IRR, or
both. Since one of the goals of our survey is to investigate whether there is any gap between the
capital budgeting theory and its practice, it is logical to examine the use of DCF analysis. For
example, if a study presents the use of NPV and IRR separately, we can’t conclude about the
overall use of DCF analysis (NPV or IRR method). Further, we are interested in learning
whether firms frequently use (‘almost always or always’) any DCF method. Similar to Graham
and Harvey (2001) and Brounen et al. (2004), we ask respondents whether they ‘almost always’
or ‘always’ use any DCF method. While we have consistent survey results for the U.S., the
Netherlands, Germany, France, and the U.K., we had to adjust previous survey results that used
NPV or IRR instead of the use of any DCF method.12 Together with our 400 usable responses,
11 Fortunately, the surveys that provide mean values and frequency of responses for “3” or “4” (‘almost always and always’), we find that the means of the survey results on a 0-4 scale and the frequency of responses for “3” or “ 4” are highly correlated (Corr =0.98). Accordingly, we are able to adjust responses to reflect how frequently (“almost always or always) firms use a particular technique. 12 Fortunately, we find high correlation (0.99) and R-square (.99) between the ‘frequent use of DCF’ and the ‘sum of the mean of NPV and the mean of IRR’ from previous survey results.

23
we gather 1,720 usable survey responses for 24 countries and report survey evidence on capital
budgeting practices.
Table 12 (Panel A) presents comprehensive survey results on capital budgeting
techniques such as DCF, NPV, IRR, accounting-based (AB), and payback (PB) methods that are
used by corporate managers in 10 different CEE countries and compare them with that of 14
other countries including the U.S., Canada, Australia, and Western European and Asia-Pacific
countries. We also present survey evidence comparing capital budgeting practices across four
geographic regions and three income groups (see Table 12, Panel B).
Survey evidence presented in Table 12 (Panel A) indicates that firms in the Netherlands,
Australia, Indonesia , Philippines, U.S., Canada, China, and Malaysia use the DCF method
(NPV, IRR, or both) as their most frequently used capital budgeting technique with response
rates of 100%, 100%, 100%, 98%, 97%, 92%, and 89%, respectively. In contrast, when looking
at firms in the U.K., Germany, and France, we find that although the DCF method is still the
most frequently used tool, the response rates drop to 82%, 60%, and 55%. On the other hand,
Hong Kong, Sweden, and Central and Eastern European countries indicate the use of the DCF
method as their second most popular tool, next to the payback method, with response rates of
80%, 78%, and 51%, respectively. Survey results on the use of NPV method across countries
reveal that the NPV method is more popular among Dutch, Australian, and U.S. and Canadian
firms with response rates of 89%, 89%, and 75% than among firms in China, Germany, and
France with response rates of 49%, 48%, and 35%. Similarly, survey results on the use of the
IRR method across countries show that the use of the IRR technique is widely popular among
firms in China, Philippines, and Australia with response rates of 89%, 87%, and 79%, while it is
the least popular technique among Swedish, German, and French firms with response rates of
23%, 42%, and 44%.
Survey results on the use of the payback (PB) method reported in Table 12 (Panel A)
show that the PB method is most popular among firms in China, Poland, and Hong Kong with

24
response rates of 84%, 81%, and 80%, respectively, and it is the least popular among German,
French, Latvian, and Bulgarian firms (response rates of 50%, 51%, 33%, and 40%). While firms
in CEE countries indicate an accounting-based (AB) method as the most frequently used capital
budgeting technique with response rates ranging from 30% (Bulgaria) to 77% (Slovenia), firms
in the Netherlands, Indonesia, and the U.S. and Canada indicate that the AB method is their most
frequently used capital budgeting technique with response rates 2%, 17%, and 20%.
Survey results reported in Table 12 (Panel B) indicate that capital budgeting practices
vary across geographic regions as well as income groups. The results show that DCF analysis is
more popular among firms in North America and the Asia-Pacific region than among firms in
Western Europe or Central Eastern Europe. The use of the NPV method is more popular among
firms in North America than among firms in Western Europe or the Asia Pacific region. The use
of the IRR and PB methods are most popular among firms in the Asia-Pacific region. Both the
NPV and IRR methods are least popular among firms in Western Europe. While the use of the
PB method is most popular among firms in Asia and the Pacific region, the use of an accounting
based (AB) method is popular among firms in the CEE region.
Survey results comparing the use of capital budgeting techniques across three income
groups are reported in Table 12 (Panel B). While the use of DCF analysis seems to be more
popular among firms in lower-middle income countries, our results are influenced by the most
frequent use of IRR methods used by firms in lower-middle income countries. The use of the
NPV method is most popular among U.S. and Canadian firms, confirming the practice of value-
based management by North American firms. It is surprising to note that the use of the PB
method is most popular among firms in lower-middle income countries, while the use of an
accounting-based capital budgeting method is least popular among firms in the same income
group.
6. Conclusions

25
In this paper we provide survey evidence on capital budgeting practices in ten Central
and Eastern European countries (e.g., Bulgaria, Croatia, Czech Republic, Hungary, Latvia,
Lithuania, Poland, Romania, Slovak Republic, and Slovenia).
We observe a remarkable pattern with respect to corporate governance. For example,
while firms in the U.S. and Canada (e.g., Graham and Harvey, 2001) and in the U.K. and the
Netherlands (Brounen et al., 2004) are focused on maximizing their shareholders’ wealth, CEE
firms emphasize the importance of liquidity and stability of cash flows. Regarding the source of
long-term funds needed to finance new projects in CEE countries, we find that the most
preferred source of funds is retained earnings (internal source of funds) followed by straight
debt. About 17% of our sample firms do not conduct formal written capital budgeting analyses;
and surprisingly, only about 61% of the firms that make formal capital budgeting analyses say
they use any kind of DCF-based capital budgeting technique such as NPV and IRR methods.
With respect to capital budgeting techniques, similar to the findings of Brounen et al. (2004) for
Western European firms, we discover a strong preference for the payback (PB) method among
our CEE sample firms.
Furthermore, our survey evidence indicates that corporate finance practice is influenced
mostly by firm size and multinational management culture, and to a lesser extent by insider
ownership. Large companies and multinational firms are more likely to use DCF analysis, such
as NPV and IRR methods, as well as more sophisticated techniques such as sensitivity and real
option analyses than small-medium firms. The same is true for estimation of the cost of capital
for different projects and the use of CAPM as a method of estimating the cost of equity. Large
firms as well as multinational firms are likely to have the skilled manpower and the knowledge
and procedures needed to make formal capital budgeting analyses using DCF and other
sophisticated techniques.
Finally, we compare capital budgeting practices across 24 countries, four geographic,
regions, and three income groups and find significant variations in these practices across

26
countries, geographic regions, and income groups. There are several reasons why CEE corporate
finance practices differ from the practices in the U.S., Canada, and Western European and Asia-
Pacific countries. First, the differences in practice of corporate finance in CEE countries may be
attributed to diversity of institutional systems and languages, influence of multinational
companies’ culture, and the level of economic, financial, and human capital developments in
these countries. Second, to the extent that Central and Eastern European practices are less
market-based than in the U.S., Canada, and Western European countries, they are less
observable. Third, most of the stylized facts that have informed corporate finance theory are
perhaps rooted in the U.S. or Western European empirical evidence. Thus, corporate finance
theories relevant to Central and Eastern Europe are less developed, and in turn CEE practices of
corporate finance perhaps benefit little from the existing literature. We hope our findings will fill
a gap in the corporate finance literature and lead to the development of new theories or
modifications of existing ones. We also believe that further research is needed to increase our
understanding of the theory and practice of corporate finance in Central and Eastern European
countries.
REFERENCES
Arnold, G., P. Hatzopoulos, 2000. The theory-practice gap in capital budgeting: Evidence from the United Kingdom, Journal of Business Finance and Accounting, 27, 603-26.
Brav, A., J. Graham, C. Harvey, R. Michaely, 2005. Payout policy in the 21st century, Journal of Financial Economics, 77(3), 483-527.
Brav, A., R. Lehavy, 2003. An Empirical Analysis of Analysts' Target Prices: Short-term Informativeness and Long-term Dynamics, Journal of Finance, 58(5), 1933-1968.
Brounen, D., A. De Jong, K. Koedijk, 2004. Corporate finance in Europe: Confronting theory with practice, Financial Management, 33(4), 71-101.
Chew, D., 1997. Studies in International Corporate Finance and Governance Systems: A Comparison of the U.S., Japan, and Europe, Oxford University Press.
Graham, J., C. Harvey, 2001. The theory and practice of corporate finance: Evidence from the field, Journal of Financial Economics, 60(2), 187-243.

27
Graham, J., C. Harvey, M. Puri, 2010. A corporate beauty contest. Working paper. Duke University
Graham, J., C. Harvey, S. Rajgopal, 2005. The economic implications of corporate financial reporting, Journal of Accounting and Economics, 40, 3-73.
Hermes, N., P. Smid, L. Yao, 2007. Capital budgeting practices: A comparative study of the Netherlands and China, International Business Review, 16(5), 630-654.
Kester, G., R.P. Chang, E.S. Echanis, S. Haikal, M. Md.Isa, M.T. Skully, K.C. Tsui, C.J. Wang, 1999. Capital budgeting practices in the Asia-Pacific region: Australia, Hong Kong, Indonesia, Malaysia, Philippines, and Singapore, Financial Practice and Education, 9(1), 25-33.
La Porta, R., F. Lopez-de-Silanes, A. Shleifer, R.W. Vishny, 1997. Legal determinants of external finance, Journal of Finance, 52(3), 1131-50.
La Porta, R., F. Lopez-de-Silanes, A. Shleifer, R.W. Vishny, 1998. Law and finance, Journal of Political Economy, 106(6), 1113-55.
Lintner, J., 1956. Distribution of incomes of corporations among dividends, retained earnings, and taxes, The American Economic Review, 46(2), 97-113.
Moore, J., A. Reichert, 1983. An analysis of the financial management techniques currently employed by large US corporations, Journal of Business Finance and Accounting. 10(4), 623-645.
Pinegar, J.M., L. Wilbricht, 1989. What managers think of capital structure theory: A survey, Financial Management, 18(4), 82-91.
Rajan, R., L. Zingales, 2003. The great reversals: The politics of financial development in the twentieth century, Journal of Financial Economics, 69(1), 5-50.
Pike, R., 1996. A longitudinal survey on capital budgeting practices, Journal of Business Finance and Accounting, 23 (1), 79-92.
Sandahl G., S. Sjögren, 2003. Capital budgeting methods among Sweden’s largest groups of companies:the state of the art and a comparison with earlier studies, International Journal of Production Economics, 84, 51-69.
Sangster, A., 1993. Capital budgeting appraisal techniques: A survey of current usage, Journal of Business Finance and Accounting, 20 (3), 307-332.
Truong G., G. Partington, M. Peat, 2008. Cost of capital estimation and capital budgeting practice in Australia, Australian Journal of Management, 33, 1-6.

28
Table 1
Panel A: Selected Measures of Levels of Economic, Financial, and Human Development for CEE Countries
Country Bulgaria Croatia Czech Republic Hungary Latvia Lithuania Poland Romania Slovak
Republic Slovenia Total / Average6
Year Joining the EU 2007 2008 2004 2004 2004 2004 2004 2007 2004 2004
Population, 2007 (million) 7.6 4.4 10.3 10.1 2.3 3.4 38.1 21.6 5.4 2 105.2
Economic Development
GDP, 2007 (bil. USD)1 40 51 168 138 27 38 420 166 75 45 1,168
GNI, 2007 (bil. USD)1 35 46 149 116 23 34 375 133 63 42 1,016
PPP GDP, 2007 (bil. USD)1 86 69 240 188 40 60 602 246 109 55 1,695
GNI Per Capita, 2007 (bil. USD)1 4,590 10,460 14,450 11,570 9,930 9,920 9,840 6,150 11,730 20,960 10,960
GNI Per Capita PPP, 2007
11,180 15,050 22,020 17,210 16,890 17,180 15,330 10,980 19,340 26,640 17,182
Financial Development
Foreign Direct Investment,2006 (Net Inflows (% of GDP)1, 3
16.5 7.9 4.2 5.4 8.5 6 5.7 9.4 7.6 1.7 6.4
Exports/Imports of Goods and Services, 2006 (% of GDP)1
64/83 48/57 76/73 78/77 44/64 60/70 41/41 34/45 86/90 69/70 60/67
Market Capitalization of Listed Companies, 2006 (% of GDP)1, 4
55.8 67.6 34 37.1 13.4 34.2 44 27 10.1 40.7 34.1
Human Development
Index 2, 5 0.82 0.85 0.89 0.87 0.86 0.86 0.87 0.81 0.86 0.92 0.86

29
Table 1 (Contd.)
Panel B: Selected Measures of Levels of Economic, Financial, and Human Development for Developed Countries and China and their Comparison with CEE Countries
Country World High Income Countries
Upper-Middle Income Countries
China USA EMU7 Total / Average6
Population, 2007 (million)
6,612 1,056 823 1,320 302 319 105.2
Economic Development
GDP, 2007 (billion USD)1 54,347 40,197 6,450 3,280 13,811 12,179 1,168
GNI, 2007 (billion USD)1 52,621 39,682 5,750 3,120 13,886 11,578 1,016
PPP GDP, 2007 (billion USD)1
65,435 38,045 9,969 7,055 13,811 10,283 1,695
GNI Per Capita, 2007 (billions of USD)1
7,960 37,570 6,990 2,360 46,040 36,330 10,960
GNI Per Capita PPP, 2007 9,850 36,100 11,870 5,370 45,850 32,510 17,182
Financial Development
Foreign Direct Investment, 2006 (Net Inflows (% of GDP)1, 3
2.9 2.7 3.5 3 1.4 3.8 6.4
Exports/Imports of Goods and Services, 2006 (% of GDP)1
27/27 26/26 33/30 40/32 16-Nov 40/39 60/67
Market Capitalization of Listed Companies, 2006 (5 of GDP)1, 4
113.9 126.1 74 91.7 147.6 81.2 34.1
Human Development Index2, 5 0.74 0.94 0.86 0.78 0.95 0.94 0.86

30
Table 1 (Contd.) 1. Source: “Data & Research / Key Development Data & Statistics”; World Bank, 2008. (http://web.worldbank.org). 2. Source: Human Development Report 2007/2008”, Human Development Report Office, New York, http://hdr.undp.org/en/. 3. Foreign direct investment, net inflows are investments to acquire a lasting management interest in an enterprise operating in an economy other than that of the investor. They are the sum of inflows of equity capital, reinvestment of earnings, other long-term capital, and short-term capital in the reporting country as shown in the balance of payments. 4. Market capitalization of listed companies (% of GDP) is the share price times the number of shares outstanding. Listed domestic companies are the domestically incorporated companies listed on the country's stock exchanges at the end of 2007. Listed companies do not include investment companies, mutual funds, or other collective investment vehicles. 5. The HDI – human development index – is a summary composite index that measures a country's average achievements in three basic aspects of human development: health, knowledge, and a decent standard of living. Health is measured by life expectancy at birth; knowledge is measured by a combination of the adult literacy rate and the combined primary, secondary, and tertiary gross enrolment ratio; and standard of living by GDP per capita (PPP US$). http://hdrstats.undp.org/indicators/1.html 6. Weighed by population. 7. EMU is the 12 participating member countries of the European Monetary Union (EMU): Austria, Belgium, Finland, France, Germany, Greece, Ireland, Italy, Luxembourg, the Netherlands, Portugal, and Spain.

31
Table 2 Design and Selection of Sample Firms from CEE Countries
Country Bulgaria Croatia Czech Republic Hungary Latvia Lithuania Poland Romania Slovakia Slovenia Total
Number of Firms in the Used Dataset 4,434 3,676 13,467 2,682 2,359 3,533 16,055 18,547 3,242 1,918
1st Population (25-50 Employees) 1,706 1,380 5,174 968 794 1,242 3,720 8,864 888 663
Responses from the 1st Population 2 2 6 4 1 1 14 6 3 1 40
2nd Population (51-250 Employees) 1,720 1,840 6,760 1,252 1,294 1,979 9,034 8,174 1,888 949
Responses from the 2nd Population 3 2 8 7 2 2 21 9 4 2 60
3rd Population (Employees 251 to) 334 (-375) 152 (-336) 511 (-374) 156 (-375) 91 (-370) 104 (-319) 1101 (-320) 503 (-350) 155 (-375) 102
(-335)
4th Population (Employees from – to)
339 (376-650)
152 (337-535)
511 (375-749)
155 (376-650)
91 (371-499)
104 (320-500)
1100 (321-582)
503 (351-595)
156 (376-450)
102 (336-580)
5th Population (Employees from -) 335 (651-) 152 (536-) 511 (750-) 151 (651-) 90 (500-) 104 (501-) 1100 (583-) 503 (596-) 155 (751-) 102 (581-)
Responses from the 3rd, 4th, and 5th Population
38,477 38,081 15-14-14 41,225 37,289 38,050 36-36-36 14-14-14 38,874 37,714 300
Total Responses 20 16 57 46 9 14 143 57 25 13 400

32
Figure 1. Sample Characteristics Based on Survey Responses of 400 Firms

33
Table 3 Survey Responses: How important are the following goals for your firm? Not important – (1), (2), (3), (4) – Very Important
Goals for Firms 1 2 3 4
Don
’t K
now
Did
n’t
Ans
wer
Tota
l
1) Maximize accounting profits 16 41 123 218 1 1 400 2) Maximize dividends 76 98 107 107 8 4 400 3) Maximize market value of equity 26 37 99 229 6 3 400 4) Maximize growth in sales 6 31 86 271 4 2 400 5) Stability of performance (production and operation) 3 12 76 305 3 1 400 6) Maximize growth of assets 22 76 198 96 6 2 400 7) Optimize solvability, liquidity 5 16 81 294 2 2 400
Figure 2
Figure 2. Survey evidence on the importance of different goals for firms. We report the percentof respondents who say a particular goal for firm is either important or very important. The results are based on survey respondents of 400 firms.

34
Table 4
Survey Responses: Which of the following sources of Long-Term Funds are / would be important for financing new investments? Least important – (1), (2), (3), (4) – very important
1 2 3 4
Don
’t K
now
Did
n’t A
nsw
er
Tota
l
1) Retained earnings 43 62 152 138 3 2 400 2) Restructuring assets 59 102 156 68 13 2 400 3) Straight debt 86 108 94 101 7 4 400 4) Convertible bonds 248 73 36 14 12 17 400 5) External common equity 147 96 88 51 10 8 400
Figure 3
Figure 3. Survey evidence on importance of different sources of long-term funds to financing new investments. We report the percentof respondents who say a particular source of long-term funds is either important or very important. The results are based on survey respondents of 400 firms.
35
Figure 4
Survey Results on Capital Budgeting Practices by Firms in CEE Countries
Usable responses
100% (400)
Frequently use DCF-based technique: 61% (203) No or rarely use DCF-based analysis: 39% (130)
Payback period technique
almost (always): 87% (176)
Accounting-based technique
Number of analyzed project
Minimal amount of analysed project (Euro)
Calculate
Financing
62%of lack of financial sources.
72%because they don’t keep the calculated indexes or rates adequate.
90%because they don’t in the used data.
90%because they distrust who made the analysis.
87%of ethical (moral) reasons.
41%of strategic considerations.
MentionYes, because of
62%of lack of financial sources.
72%because they don’t keep the calculated indexes or rates adequate.
90%because they don’t in the used data.
90%because they distrust who made the analysis.
87%of ethical (moral) reasons.
41%of strategic considerations.
MentionYes, because of
No formal capital budgeting analysis: 17% (67)Formal capital budgeting analysis: 83% (333)
never or rarely: 13% (27)
almost (always): 78% (159)
never or rarely: 22% (44)
Payback period technique
almost (always): 68% (88)
Accounting-based technique
never or rarely: 32% (42)
almost (always): 62% (80)
never or rarely: 38% (50)
<5076% (138)
<15018% (32)
>1507% (12)
<100.00058% (105)
<1.000.00026% (46)
>1.000.00016% (29)
Cost of capital
For firm: 31% (52)
For projets: 69% (115)
Yes28% (13)
No72% (33)
WACC77% (10)
CAPM23% (3)
Calculate
Yes44% (37)
No56% (48)
WACC92% (34)
CAPM8% (3)
Opposite decision and analysis result
Yes67% (132)
No 33% (64)
MeanSource
1,662) Restructuring assets
1,185) External common equity
0,524) Convertible bond
1,573) Straight debt
3,031) Retained earnings
MeanSource
1,662) Restructuring assets
1,185) External common equity
0,524) Convertible bond
1,573) Straight debt
3,031) Retained earnings
43%of lack of financial sources.
40%because they don’t keep the calculated indexes or rates adequate.
51%because they don’t in the used data.
49%because they distrust who made the analysis.
51%of ethical (moral) reasons.
20%of strategic considerations.
MentionYes, because of
43%of lack of financial sources.
40%because they don’t keep the calculated indexes or rates adequate.
51%because they don’t in the used data.
49%because they distrust who made the analysis.
51%of ethical (moral) reasons.
20%of strategic considerations.
MentionYes, because of
Opposite decision and analysis result
Yes58% (72)
No 42% (52)
Number of analyzed project
Minimal amount of analysed project (Euro)
<5079% (88)
<15012% (13)
>150 9% (10)
<100.00062% (69)
<1.000.000 38% (31)
>1.000.000 10% (11)
Importance of goals
MeanGoal
1,592) Maximize dividends
2,697) Optimize solvability, liquidity
1,976) Maximize growth of assets
2,725) Stability of performance (production and operation)
2,544) Maximize growth in sales
2,423) Maximize market value of equity
2,391) Maximize accounting profits
MeanGoal
1,592) Maximize dividends
2,697) Optimize solvability, liquidity
1,976) Maximize growth of assets
2,725) Stability of performance (production and operation)
2,544) Maximize growth in sales
2,423) Maximize market value of equity
2,391) Maximize accounting profits
Importance of goals
MeanGoal
1,602) Maximize dividends
2,647) Optimize solvability, liquidity
1,876) Maximize growth of assets
2,725) Stability of performance (production and operation)
2,604) Maximize growth in sales
2,313) Maximize market value of equity
2,221) Maximize accounting profits
MeanGoal
1,602) Maximize dividends
2,647) Optimize solvability, liquidity
1,876) Maximize growth of assets
2,725) Stability of performance (production and operation)
2,604) Maximize growth in sales
2,313) Maximize market value of equity
2,221) Maximize accounting profits
Importance of goals
MeanGoal
1,822) Maximize dividends
2,707) Optimize solvability, liquidity
2,006) Maximize growth of assets
2,745) Stability of performance (production and operation)
2,664) Maximize growth in sales
2,243) Maximize market value of equity
2,551) Maximize accounting profits
MeanGoal
1,822) Maximize dividends
2,707) Optimize solvability, liquidity
2,006) Maximize growth of assets
2,745) Stability of performance (production and operation)
2,664) Maximize growth in sales
2,243) Maximize market value of equity
2,551) Maximize accounting profits
Financing
MeanSource
1,602) Restructuring assets
1,105) External common equity
0,504) Convertible bond
1,543) Straight debt
3,041) Retained earnings
MeanSource
1,602) Restructuring assets
1,105) External common equity
0,504) Convertible bond
1,543) Straight debt
3,041) Retained earnings
Financing
MeanSource
1,442) Restructuring assets
0,945) External common equity
0,484) Convertible bond
1,473) Straight debt
2,681) Retained earnings
MeanSource
1,442) Restructuring assets
0,945) External common equity
0,484) Convertible bond
1,473) Straight debt
2,681) Retained earnings
36
Table 5
Survey Responses: Do you make any formal (written, based on quantitative data) capital budgeting analyses? Panel A:
Number of
Firms Survey Responses Yes No Total 400 83% 17% Small/Medium Firms 101 75% 25% Large Firms 299 86% 14% Management Dominated by Local Culture 237 79% 21% Management Dominated by Multinational Culture 163 89% 11% Low Ownership by Top Officers 345 84% 16% High Ownership by Top Officers 55 78% 22% Panel B: Survey Responses: Do you always or almost always use some kind of DCF-based (discounted cash flow-based) analysis technique (e.g., NPV, IRR, etc.)?
Number of
Firms Survey Responses Yes No Total 400 51% 49% Small/Medium Firms 101 45% 55% Large Firms 299 53% 47% Management Dominated by Local Culture 237 46% 54% Management Dominated by Multinational Culture 163 58% 42% Low Ownership by Top Officers 345 52% 48% High Ownership by Top Officers 55 40% 60%

37
Table 6
Panel A: Survey Responses: Do you always or almost always calculate payback period? (simple, not discounted)? Number of Firms Survey Responses Yes No Total 400 66% 34% Small/Medium Firms 101 58% 42% Large Firms 299 69% 31% Management Dominated by Local Culture 237 60% 40% Management Dominated by Multinational Culture 163 75% 25% Low Ownership by Top Officers 345 68% 32% High Ownership by Top Officers 55 56% 44% Panel B: Survey Responses: Do you always or almost always calculate some kind of accounting-based index or rate? Number of Firms Survey Responses Yes No Total 400 60% 40% Small/Medium Firms 101 50% 50% Large Firms 299 63% 37% Management Dominated by Local Culture 237 55% 45% Management Dominated by Multinational Culture 163 67% 33% Low Ownership by Top Officers 345 61% 39% High Ownership by Top Officers 55 55% 45% Panel C: Survey Responses: Do you (sometimes) make sensitivity analyses?
Number of Firms Survey Responses Yes No Total 400 34% 67% Small/Medium Firms 101 27% 73% Large Firms 299 36% 64% Management Dominated by Local Culture 237 31% 69% Management Dominated by Multinational Culture 163 37% 63% Low Ownership by Top Officers 345 35% 65% High Ownership by Top Officers 55 22% 78% Panel D: Survey Responses: Do you (sometimes) make real option analyses?
Number of Firms Survey Responses Yes No Total 400 18% 82% Small/Medium Firms 101 17% 83% Large Firms 299 18% 82% Management Dominated by Local Culture 237 17% 83% Management Dominated by Multinational Culture 163 20% 80% Low Ownership by Top Officers 345 17% 83% High Ownership by Top Officers 55 22% 78%

38
Table 7
Panel A: From ‘DCF Yes’
Survey Responses: Specify the minimal amount over which you make written investment analyses.
Number of Firms
Survey Responses
<100,000 <1
million >1
million Total 203 105 46 29 58% 26% 16% Small/Medium Firms 45 61% 21% 18% Large Firms 158 58% 27% 15% Management Dominated by Local Culture 108 50% 30% 20% Management Dominated by Multinational Culture 95 68% 20% 12% Low Ownership by Top Officers 181 58% 27% 15% High Ownership by Top Officers 22 61% 17% 22%
Panel B: From ‘DCF No’
Number of Firms
Survey Responses
<1 million <10 million >10 million Total 130 69 31 11 62% 28% 10% Small/Medium Firms 31 75% 25% 0% Large Firms 99 58% 29% 13% Management Dominated by Local Culture 80 60% 26% 13% Management Dominated by Multinational Culture 50 65% 30% 5% Low Ownership by Top Officers 109 60% 28% 12% High Ownership by Top Officers 21 74% 26% 0%

39
Table 8
Survey Responses: Approximately how many projects are evaluated with a quantitative analysis in your company a year? Panel A: From ‘DCF Yes’
Number of Firms Survey Responses <50 <150 >150 Total 203 138 32 12 76% 18% 7% Small/Medium Firms 45 82% 13% 5% Large Firms 158 74% 19% 7% Management Dominated by Local Culture 108 76% 18% 6% Management Dominated by Multinational Culture 95 75% 18% 7% Low Ownership by Top Officers 181 75% 19% 6% High Ownership by Top Officers 22 80% 10% 10% Panel B: From ‘DCF No’
Number of Firms Survey Responses <50 <150 >150 Total 130 88 13 10 79% 12% 9% Small/Medium Firms 101 79% 11% 11% Large Firms 299 80% 12% 8% Management Dominated by Local Culture 237 76% 12% 12% Management Dominated by Multinational Culture 163 84% 11% 5% Low Ownership by Top Officers 345 78% 12% 10% High Ownership by Top Officers 55 83% 11% 6%
Table 9
From ‘DCF Yes’ Survey Responses: Do you use only one given value of cost of capital in the company, or do you use different values for the different projects?
Number of
Firms Survey Responses
Firm Project Total 203 52 115 31% 69% Small/Medium Firms 45 49% 51% Large Firms 158 27% 73% Management Dominated by Local Culture 108 24% 76% Management Dominated by Multinational Culture 95 41% 59% Low Ownership by Top Officers 181 30% 70% High Ownership by Top Officers 22 47% 53%

40
Table 10
Survey Responses: What kind of method do you use to calculate this discount rate for the project (or for all projects of the company)?
(a) We don’t calculate it directly; we use general discount rate(s). (b) We use the Weighted Average Cost of Capital (WACC). (c) We use the Capital Asset Pricing Model (CAPM) to calculate the whole discount rate. (d) Our practice is not consistent. Panel A: From ‘DCF Yes’ and ‘Firm’
Companies Responses (a) (b) (c ) (d) Total 52 46 33 10 3 2 Small/Medium Firms 17 15 80% 20% 0% 0% Large Firms 35 33 64% 21% 9% 6% Management Dominated by Local Culture 22 19 63% 26% 5% 5% Management Dominated by Multinational Culture 30 29 72% 17% 7% 3% Low Ownership by Top Officers 45 43 70% 19% 7% 5% High Ownership by Top Officers 7 5 60% 40% 0% 0%
Panel B: From ‘DCF Yes’ and ‘Project’
Companies Responses (a) (b) (c) (d) Total 115 85 48 34 3 16 Small/Medium Firms 18 16 50% 38% 0% 13% Large Firms 97 85 47% 33% 4% 16% Management Dominate by Local Culture 71 62 48% 31% 3% 18% Management Dominated by Multinational Culture 44 39 46% 38% 3% 13% Low Ownership by Top Officers 107 94 48% 33% 3% 16% High Ownership by Top Officers 8 7 43% 43% 0% 14%

41
Table 11
Panel A: From ‘DCF Yes’ Survey Responses: Does it happen that a project is rejected while supported by DCF analysis? Responses % of the Answers Yes No Total 196 132 64 67% 33% Small/Medium Firms 42 67% 33% Large Firms 154 68% 32% Management Dominated by Local Culture 106 65% 35% Management Dominated by Multinational Culture 90 70% 30% Low Ownership by Top Officers 176 68% 32% High Ownership by Top Officers 20 60% 40%
Figure 5
Figure 5. Survey evidence on the rejection of a capital investment project despite being supported based on DCF analysis. The survey is based on 196 responses.

42
Table 11 (Contd.) Panel B: From ‘DCF No’
Survey Responses: Do you ever reject a project even if it’s supported by formal written analysis? Responses % of the Answers Yes No Total 124 72 52 58% 42% Small/Medium Firms 31 55% 45% Large Firms 93 59% 41% Management Dominated by Local Culture 75 56% 44% Management Dominated by Multinational Culture 49 61% 39% Low Ownership by Top Officers 103 60% 40% High Ownership by Top Officers 21 48% 52%
Figure 6
Figure 6. Survey evidence on the rejection of a capital investment project despite being supported by formal written capital budgeting analysis. The survey is based on 124 responses.

43
Table 12 Panel A: Comparison of Capital Budgeting Practices among U.S., Canada, and Western European, Asia-Pacific, and CEE Countries
Countries GDP (PPP)
2007 (billions of USDs)
Region Development Authors Year of Publication
Usable Responses
DCF %
NPV %
IRR %
PB %
AB %
USA & Canada 14,932 Northern America High income Graham & Harvey 2001 392 97% 75% 76% 57% 20%
United Kingdom I. 2,143 Europe (Western) High income Brounen et al. 2004 68 68% 47% 53% 69% 38%
United Kingdom II. Europe (Western) High income Arnold &
Hatzopoulos 2000 96 82% 62% 68% 46% 41%
The Netherlands I. 634 Europe (Western) High income Brounen et al. 2004 52 78% 70% 56% 65% 35%
The Netherlands II. Europe (Western) High income Hermes et al. 2007 42 100% 89% 74% 79% 2%
Germany 2,830 Europe (Western) High income Brounen et al. 2004 132 60% 48% 42% 50% 32%
France 2,078 Europe (Western) High income Brounen et al. 2004 61 55% 35% 44% 51% 16%
Sweden 336 Europe
(Western) High income Sandahl & Sjögren 2003 129 69% 52% 23% 78% 21%
China 7,097 Asia and Pacific
Lower middle income Hermes et al. 2007 45 92% 49% 89% 84% 9%
Australia I. 734 Asia and Pacific High income Truong et al. 2008 77 92% 86% 64% 59% 19%
Australia II. Asia and Pacific High income Kester et al. 1999 57 100% 79% 79% 51% 27%
Hong Kong 293 Asia and Pacific High income Kester et al. 1999 29 68% 49% 58% 80% 40%
Indonesia 838 Asia and Pacific
Upper middle income Kester et al. 1999 16 100% 83% 77% 48% 17%
Malaysia 359 Asia and Pacific
Upper middle income Kester et al. 1999 35 89% 71% 68% 70% 35%
Philippines 299 Asia and Pacific
Upper middle income Kester et al. 1999 35 98% 66% 87% 71% 39%

44
Singapore 228 Asia and Pacific High income Kester et al. 1999 54 82% 59% 70% 70% 44%
Bulgaria 86 Europe
(Central & Eastern)
Upper middle income Andor et al. 2010 20 35% 40% 30%
Croatia 69 Europe
(Central & Eastern)
High income Andor et al. 2010 16 56% 69% 63%
Czech 240 Europe
(Central & Eastern)
High income Andor et al. 2010 57 37% 53% 40%
Hungary 188 Europe
(Central & Eastern)
High income Andor et al. 2010 46 43% 63% 76%
Latvia 40 Europe
(Central & Eastern)
Upper middle income Andor et al. 2010 9 44% 33% 67%
Lithuania 60 Europe
(Central & Eastern)
Upper middle income Andor et al. 2010 14 43% 57% 50%
Poland 602 Europe
(Central & Eastern)
Upper middle income Andor et al. 2010 143 58% 81% 59%
Romania 246 Europe
(Central & Eastern)
Upper middle income Andor et al. 2010 57 58% 61% 68%
Slovakia 109 Europe
(Central & Eastern)
High income Andor et al. 2010 25 56% 64% 72%
Slovenia 55 Europe
(Central & Eastern)
High income Andor et al. 2010 13 46% 62% 77%
Note: DCF%, NPV%, IRR% , PB%, and AB% are response rates provided by sample firms that use discounted cash flow (DCF), net present value (NPV), internal rate of return (IRR), payback (PB), or accounting-based (AB) method.

45
Table 12 (Contd.)
Panel B: Comparison of Capital Budgeting Practices among Geographic Regions and Income Groups
Geographic Region/Income Group
GDP (PPP) 2007 (bil. of USD) DCF% NPV% IRR% PB% AB%
North America 14,932 97% 75% 76% 57% 20%
Europe 9,716 63% 57% 34%
Europe (Western) 8,021 65% 49% 49% 55% 28%
Europe (Central & Eastern) 1,695 51% 66% 60%
Asia and Pacific 9,848 92% 56% 84% 77% 14%
High income 24,869 85% 64% 64% 57% 25%
Upper middle income 2,530 80% 45% 45% 63% 39%
Lower middle income 7,097 92% 49% 89% 84% 9%
Note: DCF%, NPV%, IRR%, PB%, and AB% are response rates provided by sample firms that use discounted cash flow (DCF), net present value (NPV), internal rate of return (IRR), payback (PB), or accounting-based (AB) method.