capital budgeting practices and performance of …€¦ · capital budgeting is a complex process...
TRANSCRIPT

CAPITAL BUDGETING PRACTICES AND PERFORMANCE OF
MATATU BUSINESS IN KISII COUNTY, KENYA
BY
ZAKKIES MOCHOGE WALTER
D61/77402/2015
A RESEARCH PROJECT SUBMITTED TO THE SCHOOL OF
BUSINESS IN PARTIAL FULFILMENT OF THE REQUIREMENT
FOR THE AWARD OF DEGREE OF MASTERS IN BUSINESS
ADMINISTRATION, UNIVERSITY OF NAIROBI
NOVEMBER 2016

ii
DECLARATION
This research project is my original work and has not been presented for the award of a
degree in any other university.
Signature ……………………… Date.……………………….
Zakkies Mochoge Walter
D61/77402/2015
Declaration by Supervisor
Signature ……………………… Date…………………………….
DR LUTHER OTIENO

iii
DEDICATION
This research project is dedicated to all my family members. Let this serve as a
demonstration of hard work and patience from all of us during my academic journey.

iv
ACKNOWLEDGEMENT
I sincerely acknowledge the support and guidance accorded to me by my supervisor Dr.
Luther Otieno during the preparation of this project. I am also grateful for the financial
support from my family members.

v
TABLE OF CONTENTS
DECLARATION.............................................................................................................. ii
DEDICATION.................................................................................................................iii
ACKNOWLEDGEMENT .............................................................................................. iv
LIST OF TABLES ........................................................................................................viii
ABSTRACT ..................................................................................................................... ix
ABBREVIATIONS AND ACRONYMS ........................................................................ x
CHAPTER ONE: INTRODUCTION ............................................................................ 1
1.1 Background of the Study .......................................................................................... 1
1.1.1 Capital Budgeting Practices............................................................................... 2
1.1.2 Performance Measures ...................................................................................... 3
1.1.3 Matatu Industry in Kenya .................................................................................. 4
1.1.4 Matatu Sector in Kisii County ........................................................................... 6
1.2 Research Problem ..................................................................................................... 7
1.3 Research Objective ................................................................................................... 9
1.4 Value of the Study .................................................................................................. 10
CHAPTER TWO: LITERATURE REVIEW ............................................................. 11
2.1 Introduction ............................................................................................................ 11
2.2 Theoretical Review ................................................................................................ 11
2.2.1 Real Options Theory ........................................................................................ 11
2.2.2 Arbitrage Pricing Theory ................................................................................. 12
2.2.3 Portfolio Theory .............................................................................................. 13
2.3 Capital Budgeting Practices and Performance ....................................................... 14
2.4 Capital Budgeting Techniques ............................................................................... 16
2.5 The Cost of Capital ................................................................................................ 16
2.6 Critique of the Existing Literature ......................................................................... 18
2.7 Summary of the Chapter ........................................................................................ 18

vi
2.8 Conceptual Framework .......................................................................................... 19
CHAPTER THREE: RESEARCH METHODOLOGY ............................................ 21
3.1 Introduction ............................................................................................................ 21
3.2 Research Design ..................................................................................................... 21
3.3 Target Population ................................................................................................... 21
3.4 Sample Design........................................................................................................ 22
3.5 Data Collection ....................................................................................................... 22
3.6 Data Analysis ......................................................................................................... 24
CHAPTER FOUR: RESULTS AND DISCUSSIONS ............................................... 25
4.1 Introduction ............................................................................................................ 25
4.2 Response Rate ........................................................................................................ 25
4.3 Data Validity .......................................................................................................... 27
4.4 Descriptive Analysis .............................................................................................. 28
4 .4.1 Sources of Capital ........................................................................................... 28
4.4.2 Capital Budgeting Techniques......................................................................... 28
4.5 Correlation Analysis ............................................................................................... 28
4.6 Regression Analysis ............................................................................................... 29
4.7 Capital Budgeting Techniques ............................................................................... 30
CHAPTER FIVE: SUMMARY, CONCLUSSIONS AND RECOMMENDATIONS
.......................................................................................................................................... 32
5.1 Introduction ............................................................................................................ 32
5.2 Conclusions ............................................................................................................ 32
5.3 Recommendations .................................................................................................. 33
5.4 Limitations of Study ............................................................................................... 34
5.5 Suggestion for Further Study ................................................................................. 34
REFERENCES ............................................................................................................... 35
APPENDICES ................................................................................................................ 38

vii
Appendix I: Cover Letter ............................................................................................. 38
Appendix ii: Letter of Authority ...................................................................................... 39
Appendix iii: List of Registered Saccos In Kisii County ................................................. 40
Appendix IV: Research Questionnaire ......................................................................... 41
Appendix V: Originality Report ................................................................................... 45

viii
LIST OF TABLES
Table 1: Sample Distribution ........................................................................................... 22
Table 2: Response Rate .................................................................................................... 25
Table 3: The Respondent’s Gender ................................................................................. 26
Table 4: Categorization of Respondents by Seating Capacity ......................................... 26
Table 5: Occupation of Respondents other than Matatu Business .................................. 26
Table 6: The Respondents Education Level .................................................................... 27
Table 7: Summary of Sources of Financing .................................................................... 28
Table 8 Application of Capital Budgeting Techniques .................................................... 28
Table 9 : Correlation Analysis between Operations Costs and Returns. ......................... 29
Table 10: ANOVA Summary .......................................................................................... 29
Table 11: Regression Analysis Summary ........................................................................ 29
Table 12: Regression Model Summary............................................................................ 30

ix
ABSTRACT
The study meant to determine how returns in Matatu industry are influenced by capital
budgeting practices. Capital budgeting techniques, cost of capital, and operation costs were
independently examined to determine the extent to which they influence performance of
Matatu business in Kisii County. This study is important to the investors in the Matatu
business as it seeks to inform them of the importance of capital budgeting techniques, its
contribution to existing knowledge on capital budgeting techniques and how it will assist the
regulators and other government agencies in policy formulation. The research employed a
survey design where primary data was collected through the use of questionnaire, and
stratified random sampling method was used to select respondents from the population. The
study found out that most operators do not apply capital budgeting techniques in evaluating
their investments and those that apply use payback period. Most of the operators interviewed
practice intuitive management. According to the study, most operators favored a combination
of equity and debt capital. The major reason for use of debt was the easy to access it at a
lower cost compared to other sources. The study recommends that Saccos should have plans
to pool finances together through savings and issue loans to their member at a cheaper rate.
The Saccos management should also hire at least one financial expert to advice members on
financial matters. Capital budgeting is a complex process and from the study most operators
do not understand it. Some of the major areas that operators require advice is on the risk
identification and analysis and how to incorporate it in the forecasting of cash flows. Another
area is on the application of capital budgeting techniques in evaluating their projects.

x
ABBREVIATIONS AND ACRONYMS
ANOVA - Analysis of Variance
APT - Arbitrage Pricing Theory
ATR - Asset Turnover Ratio
BOD - Board of Directors
CAL - Capital Allocation Line
CAPM - Capital Asset Pricing Model
DCF - Discounted Cash flows
IRR - Internal Rate of Return
KRA - Kenya Revenue Authority
MOA - Matatu Owners Association
NPV - Net Present Value
NTSA - National Transport and Safety Authority
OPM - Operating Profit Margin
PI - Profitability Index
PMPT - Post-Modern Portfolio Theory
PSV - Passenger Service Vehicle
ROA - Return on Assets
ROE - Return on Equity

1
CHAPTER ONE: INTRODUCTION
1.1 Background of the Study
Decision makers are faced with puzzling task of making choices on the various issues
facing the firm. Capital budgeting involves processes and techniques that enable
managers to arrive at a decision. Capital budgeting decisions are key to the stability and
growth of firms and individual businesses (Ryan& Ryan, 2002). Firms invest in both long
term and short term ventures. Fixed assets are among the long-term investments that firms
engage in since their period span beyond one year, and therefore a detailed plan is
required on how the expected cash flows will be spent (Hirschey, 2003). Capital
budgeting therefore involves a systematic process through which a firm’s capital assets
are planned and controlled (Cherry, 1970). Capital budgeting is critical to any firm
operating in a competitive environment because it enables such firms to utilize their
wealth optimally by investing in projects that maximize shareholders’ wealth (Hermes,
2007). Capital budgeting decisions are very complex in that if hurriedly made without
incorporating the right procedures and techniques, they can lead to bankruptcy and
insolvency.
Studies indicate that Payback Period is the most used capital budgeting technique. The
shortcoming of this technique is non-recognition of the time value of money (Graham &
Harvey, 2001; Ryan & Ryan, 2002). Modern capital budgeting techniques such as NPV,
IRR, and DCF do incorporate the time value of money and risk in evaluating investments.
The Real options theory by Myers values real properties as opposed to financial options.
It aims at eliminating imperfections of traditional NPV method in investment decisions.
Myers pioneered the idea of real option after realizing that real property projects could
not be valued using option pricing theory.

2
Matatu business in Kenya falls under the public transport industry. It involves buying of
assets which require investing huge initial capital outlay and estimating future cash flows.
Such projects are highly risk and irreversible (Hermes, 2007).
1.1.1 Capital Budgeting Practices
During the investment process, firms come up with various proposals on how they wish
to invest their funds. Capital budgeting is the process through which the various proposals
are discriminated based on a given criteria for the purpose of choosing the best among
them for investment (Shim and Siegel, 1994). In performing this process, managers can
act intuitively or apply some criteria through the use of capital budgeting techniques.
These techniques are classified into Traditional and modern techniques. Traditional
techniques include Payback period and Accounting Rate of Return (ARR). Modern
techniques include Internal Rate of Return (IRR), Modified internal rate of return
(MIRR), Discounter cash flows (DCF) and Net Present Value (NPV).
Investments in capital assets are propositions with future returns that exceed one year.
Long-term assets include Plant, buildings, machines, and people. Future benefits from an
investment are hard to ascertain because of the uncertainty in macro-economic
environment. Because of this, investment decisions become risky and therefore can only
be estimated by taking into account risk and associated probabilities (Pandey 2001).
Payback period is the time taken for a given project to recoup its investment given a set of
cash inflows. The technique considers cash flows before the period and ignores the time
value of money. This technique offers little analysis of the project but is critical in capital
budgeting since it gives an indication on the earliest time a project is likely to recoup its
investment (Ryan & Ryan 2002).
NPV technique calculates present value of a project’s cash flows. It matches the project’s
cash inflows to its cash outflows. For a project to be considered viable, the net present

3
value must be greater than zero (Graham & Harvey, 2001). Negative values indicate that
the project is not profitable. When two investments are mutually exclusive, usually the
one with a higher NPV is considered. IRR is the expected rate on return that an investor
receives from his investment. Using trial and error method, it is possible to arrive at rate
where the NPV is zero and the rate used becomes the IRR. Firms invest borrowed funds
in their projects and by so doing, they must compensate the owners for using their funds.
This compensation is the company's cost of capital, and projects’ required rate of return
must be equal or more than this rate for the project to be considered viable (Seitz, 2005).
Investment and financing decisions is a process that begins with selecting the projects that
a firm intends to invest in, calculating the amount of capital to be invested in the project
and how it should be financed (Drury 2004). Public transport industry involves
purchasing of vehicles that do require a huge sum of initial outlay and the investments are
long-term in nature. This therefore necessitates the use of capital budgeting techniques to
evaluate such investments.
1.1.2 Performance Measures
Performance is undertaking of planned tasks in order to achieve some set goals. Targets
are determined and some actions must be performed to produce results commensurate to
predetermined targets (O’Reganet et al 2008). In order to achieve set goals, resources are
deployed progressively to achieve set goals (Ittner & Larcker, 2003). There are several
ways through which financial performance can be measured. Such metrics include the
Return on capital employed (ROCE) and Return on assets (ROA).
ROA measures how best the company is utilizing its assets in terms of profits. It gives an
indication as to how efficient managers are utilizing resources to generate returns
(Brigham E.F., 1986). Capital is relatively mobile and Managers therefore must employ it

4
productively to generate a maximum returns. ROA can be used to as a metric for
evaluating the efficiency of a firm utilizing assets in terms of operational income. ROA
also measures management’s effectiveness in deploying capital. Some firms are efficient
but poor in utilizing capital. Return on assets, is calculated as net of income plus firm
interest expense minus the estimated value of any unpaid operator labor over the average
assets utilized. Return on assets is probably the single best overall measure of operating
performance.
Return on equity (ROE) provides information on how best the company is utilizing its
debt. ROE is determined dividing net income less estimated value of any unpaid labor
and management fee by the average total equity (Olum, 1976). For a company to be able
to service its debt, ROE should be higher than ROA for firms that use debt. If ROE is less
than ROA, the implication is that debt does not earn enough to pay its cost. ROE is not a
risk adjusted and therefore changes in risk of alternative investments should be
considered for comparison purpose. ROE is measured relative to ROA and is mostly
influenced by changes in ROA.
Operating profit margin is a measure of profit per unit output. It is calculated by dividing
the dollar amount of return on assets by gross firm revenues (Reibstein 2010). Firms that
have very high operating profit margin percentages are cost leaders. Asset turnover rate is
a good indicator of how efficient a firm is employing its assets in revenue generating
activities (M. Hudson and J. Lean, 2001). Firm managers must control and monitor them
closely in order to improve performance (Harvey Arbeláez, 2004).
1.1.3 Matatu Industry in Kenya
The word Matatu is normally to describe a range of vehicles that are used for public
transport in Kenya. The most common vehicles that are used as Matatus include 7-seater

5
cars, 14-seater Nissan and Toyota shark models, 25-seater mini-bus, 51 seater mini-buses,
and buses (Aduwo, 1990). Matatus have evolved over the years in terms of numbers,
operating environment and the type of vehicles in use. This evolution dates back to 1960s
when the number of Matatus operating in Kenya were merely below 400.most of them
operated as taxis within the major towns. Initially Matatu mode of public transport was
not recognized until 1973 when the President of Kenya then, Mzee Jomo Kenyatta
declared it as a legal mode of public transport. This was as a result of petitions and
lobbying by Matatu operators to be recognized and legalized as a mode of public
transport. The recognition was however granted under the condition that Matatus had to
be issued with special transport licenses and comply with the PSV, insurance and traffic
regulations (Aduwo, 1994). The country has a good road network that interconnects the
various parts of the country and to the region. Currently the country utilizes several
means of public transport. The common ones include Buses, 11 seater Matatu, 14 seater
Matatu, minibuses,taxis, Tuk Tuks, motorcycles and bicycle commonly referred to as
BodaBodas ( PSV licensing board records ,2013)
Public service vehicles (PSVs) commonly known as “Matatu”, are the most preferred
mode of public transport in Kenya. It is estimated that Matatu control about 80% of the
entire public transport system with an annual turnover of Kshs73 billion. Matatu business
contributes about Kshs 4 billion insurance industry through premiums every year and
Kshs 1 billion as taxes annually to the treasury. The Matatu SACCOs have played a
significant role in the management and growth of Matatu sector and are now respected
brand in the sector. Saccos have played a role in improving the image of public transport,
which was dominated by rogue drivers and touts without regard for traffic rules (Republic
of Kenya economic survey, 2011). Matatu sector has contributed immensely to economic
development of Kenya. It generates income to the owners, and creates employment

6
opportunities directly and indirectly. It also contributes to sustainability of other sectors
like insurance, associated businesses and taxes to the Central and Local governments.
With over 22,052 licensed PSV operators in Kenya by December 2013, the sector is able
to provide up to 80,000 and 56,000 jobs directly and indirectly respectively. Most Matatu
businesses are individually owned and managed. However, due to introduction of new
regulations by NTSA, each Matatu operating in Kenyan roads must be a member of a
Sacco that is duly registered by NTSA. (NTSA regulations, 2013).
1.1.4 Matatu Sector in Kisii County
Kisii County is one of the counties with the highest number of Matatu investors in Kenya
MOA (2013). It employs about 200,000 people directly and indirectly. Those that depend
on this industry for their survival include drivers, conductors, mechanics, and spare parts
dealers. According to NTSA survey (2015), there are about 12000 Matatu operators in
Kisii County who operate as individuals and companies. The individual operators are
registered under the 19 Saccos operating within the county as per the NTSA regulations
(2013).
Mwangi (2014) carried a study on how budgetary planning tools affect the financial
performance of registered public service vehicles companies in Kisii county and his
findings were that the Most public service vehicle companies have no idea of these tools
and those that have an idea of the tools do not use them effectively. The only emphasis
was on record keeping and current asset management. This is explained by the fact that
most public service vehicles transact using cash.
Despite the high growth experienced in the county, a number of operators have shut
operations due high costs and uncertainty in revenues which were unprecedented. Both
individual operators and companies have been victims. Companies like Obuya express,

7
Gusii Deluxe, linear Coach, and Keroka Executive all wound up operations. This study
will investigate how capital budgeting practices contributes to the performance of Matatu
sector in Kisii County.
1.2 Research Problem
Fixed assets are among the long-term investments that firms engage in since their life
spans beyond one year, and therefore a detailed plan is required on how the expected cash
flows will be spent (Hirschey, 2003). Capital budgeting therefore involves a systematic
process through which a firm’s capital assets are planned and controlled (Cherry, 1970).
Capital budgeting is critical to any firm operating in a competitive environment because it
enables such firms to utilize their resources optimally by investing in projects that
maximize shareholders’ wealth (Hermes, 2007).
Capital budgeting techniques Impact greatly on the performance of organizations and
individual businesses alike. There is however a problem with many operators and
managers in Matatu sector being unable to apply the techniques in the evaluation of
investments. For a project to be considered viable, the net present value must be greater
than zero (Graham & Harvey, 2001). The performance firms can be greatly affected on
the way managers evaluate projects before they are selected and implemented. Applying
capital budgeting techniques effectively will guarantee to a certain degree of financial
performance because risk and uncertainties are taken care of. This study is justified
because it will equip financial managers and operators of Matatu and public transport
businesses with knowledge and skills on capital budgeting techniques and its importance
to the organizations financial performance.
Studies in Kenya have indicated that public transport and particularly Matatu sector is
inefficient. 14 seater Matatus are examples of inefficient Matatu vehicles in Kenya

8
because their operational costs are extremely high relative to their returns (All Africa
news, 2012). This is greatly attributed to lack of economies of scale as compared to high
capacity buses which require a higher initial outlay to start. The cost of capital also
influence greatly on profitability of Matatu sector (Mwangi, Otuya, Kamau, 2015).
Capital budgeting practices Impact greatly on the performance of organizations and
individual businesses alike. There is however a problem with many operators and
managers in Matatu sector being unable to apply the capital budgeting techniques during
the appraisal of investments. For a project to be considered viable, the net present value
must be greater than zero (Graham & Harvey, 2001). Failure by managers to effectively
apply capital budgeting techniques will affect the performance of firms in terms of
profitability. This study aims to equip financial managers of the Matatu businesses with
knowledge and skills on how capital budgeting practices enhance performance.
Matatu business involve purchase of new vehicles, replacement of old vehicles, and
refurbishing the old used vehicles. These are choices that require careful evaluation in
order to come up with the best option (Stewart C.M., 1977). The real option theory
provides a framework that can be used to evaluate real properties as opposed to financial
options which are valued by Black-Scholes option pricing formula.
Statistics published by the Small Business Administration (SBA) suggest that out of the
ten new startups, only seven of them survive for at least two years. Those that survive for
at least five years amount to 51 percent. The common narrative is that 50 percent of
startups collapse in the first years of operation and 95 percent fail within five years. The
challenge here is number of those which perform that live to be inherited by a future
generation past the 5th year. The Matatu sector is one such business that is domiciled in
the transport industry. Public transport in other parts of the world is a success story, the
same performance has not been replicated in Kenya (Oira A.S., 2015). There are various

9
contributing factors that contradict such in this industry that has been christened as
chaotic sector (Klein, & Sorra, 1996).
In Kisii county most investors in this sector are individuals and first timers who try their
lack oblivious of the challenges in the industry (Mwangi, 2014). Matatu business is a high
risk venture and many investors have failed due to lack of knowledge in capital budgeting
and financial management (Mwangi, 2014). The recent failure of major bus companies
such as Linear Coach, Keroka executive, Gusii Deluxe, Obuya Express, and several
others is a clear indication of something wrong in the Sector. The existence of poor
financial management in the Kenyan public service vehicle businesses is something that
cannot be disputed (Wangai 1992). However no empirical evidence has been advanced to
prove it.
Onguso (2012) carried out a study on Matatu business returns are affected by financial
management in Nakuru County found out that cost of capital and cost of operations
greatly influence returns. Oira (2015) carried sought to find out the challenges that are
facing public transport investors in Nairobi and his conclusions were that regulations,
cartels, access to capital, and profitability of the industry affected investments in the
industry.
Most of these studies have touched on the regulatory framework, challenges, costs and
access to cheap credit. None has tried to investigate whether operators in Matatu sector
carry investment appraisals and how it affects their performance. The question is: Do
capital budgeting practices affect performance of Matatu business in Kisii County?
1.3 Research Objective
To determine the effect of Capital Budgeting techniques on the performance of Matatu
business in Kisii County

10
1.4 Value of the Study
The study is valuable to Matatu industry managers since it provides an insight into the
various approaches towards capital budgeting practices and its influence on the financial
performance, uncertainties, and risk.
The study contributes to the pool knowledge by informing researchers on capital
budgeting practices and how they affect the financial performance of Matatu operators in
Kenya. Researchers can also use the study as their basis for further research.
The study is important to academicians who may wish to carry out further research in
capital budgeting practices as this will contribute to the existing body of knowledge.

11
CHAPTER TWO: LITERATURE REVIEW
2.1 Introduction
This area intends to examine the existing literature that address the issues related to public
transport industry and in particular the Matatu Business Sector. The review will assist the
researcher to identify gaps to be addressed by the study. The review shall present the
studies by different researchers on capital budgeting practices in public transport industry
and Matatu sector and incorporate their views in this study. This chapter shall review
existing theories on which the study is anchored and then conclude by presenting a
conceptual framework.
The theoretical framework shows how the research fits into existing knowledge and how
best it contributes to the research being undertaken and field of study. (Maxwell, 2005)
2.2 Theoretical Review
The study was anchored on three major theories; Real Options Theory, Arbitrage Pricing
Theory, and Portfolio Theory. The theories explains best the capital budgeting practices
in Matatu business. Most studies show that both theories are relevant for evaluating
privately held firms that do not issue publicly traded securities. Therefore this study focus
on investigating whether the Real options, Arbitrage pricing, and portfolio theories
explains the capital budgeting practices in Matatu business.
2.2.1 Real Options Theory
Real options theory was introduced by Stewart C. Myers in 1977 to value real properties.
The Black-Scholes formula was critical in addressing problems around financial option
pricing. Pointing at the limitations of traditional NPV method in investment appraisal,
Myers fronted the idea of real option pricing and valuation upon realizing that the option

12
pricing theory by Black Scholes could not be used to carry out investment decisions on
real properties. Real option, similar to the finance option, is a selectable right of real
property investment under uncertain condition. The real options theory incorporates
uncertainty as one of its key concepts. Uncertainty occurs where a manager is unable to
predict the probabilities of an event occurring at a given time in future. Cash flows
stemming from real properties are difficult to forecast and managers must have flexibility
in assessing this uncertainty as it evolves (Gilbert 2004). When using real options
approach, uncertainty is in the key consideration and investments are analyzed using
existing DCF based techniques. Real options approach could prove to be beneficial in
considering shut downs and other forms of disposals and divesture. Such actions are
classical forms of investment options (Dixit and Pindyck1995).
Public Transport business revenues are highly uncertain and requires forecasting with
some probability incorporated in it. Without proper forecasting of such cash flows,
operators are likely to lose money due to operational costs outweighing revenues,
(Mwangi M.C. 2015).
2.2.2 Arbitrage Pricing Theory
The theory was advanced principally by Stephen Ross in 1976. The view of investors,
Returns of capital assets are stochastic in nature. APT is a single -period model and the
static nature of assets return is consistent with a factor structure. Ross argues that if
equilibrium prices offer no arbitrage opportunities over static portfolios of the assets, then
the expected returns of financial assets can be modelled as a linear function of various
macro-economic factors.

13
Empirical argument by Ross’ is that the theory is anchored on prevention of arbitrage
process. Ross’ proved that there must be a linear relationship between expected returns
and the factors loadings.
The APT is a substitute for the Capital Asset Pricing Model (CAPM) by William Sharpe.
Both of them affirm a linear relationship between assets’ expected returns and their Betas.
Beta is the measure of market risk that is undiversified.
Empirical tests on APT involves a procedure to identification of fundamental features of
the factor structure. A collection of portfolios that are mean-variance efficient relative to
the mean-variance frontier spanned by the existing assets is not a good test of the APT.
As a result the test of the APT is not an adequate prove that a set of factor portfolios
satisfies the linear relation between the expected return and its covariance with the factors
portfolios.
Matatu industry involves purchasing of assets which are intended to generate a series of
cash flows in future. The cash flows are highly uncertain given the challenges in the
Matatu sector. APT will be useful in determining the equilibrium prices for such assets
against the returns they are likely to generate.
2.2.3 Portfolio Theory
Harry Markowitz in 1959 laid the ground for Modern Portfolio Theory (MPT). He
significantly contributed to the establishment of a framework through which investors can
decide on the risk they are willing absorb and returns they expect as a result. Rational
investors will always determine their minimum earnings and set their expected returns
above it for them to achieve their investment goals (Pandey, 2001).
The major assumption underlying this theory is that most investors try to avoid risk as
much as possible (Pandey, 2001). This means that investors will not put their entire

14
wealth in one asset or security but try and hold well-diversified portfolio. For an investor
to maximize his returns and minimize risk, a rational investor must hold a diversified
portfolio as per the modern portfolio theory (Stefan, 2007). The theory has evolved over
time to form post-modern portfolio theory (PMPT) which has addressed the imperfections
of relying upon variance as proxy for investor’s risk.
The capital asset pricing model (CAPM) by William Sharpe specifies the relationship
between risk and required rates of return on asset in well-diversified portfolios. The
CAPM being a single-factor model, specifies risk as a one factor function, the security’s
beta coefficient (Brigham and Daves, 2004). There are several challenges that emanate
from the assumptions of CAPM. One of the challenges one factor cannot be used to
establish the equilibrium between risk and return, which is beta (Brigham, 2002). CAPM
is useful in establishing the costs of securities and weighted average cost of capital.
CAPM is also useful in valuation of securities and capital budgeting (Copeland, Shastri,
& Weston, 2005). The arbitrage pricing theory holds that a linear function model of
several market indices can be established where beta coefficients represent the sensitivity
of each factor, which is a contradiction to CAL and CAPM (Brigham & Ehrhardt, 2008).
2.3 Capital Budgeting Practices and Performance
Capital budgeting involve selecting the most viable project from among the several
proposals using a given criteria. Such proposed projects can include plant, building,
research and development and other long-term venture that are sustainable (Steven M.,
2003). Before a project is commissioned, its lifetime cash flows are assessed to determine
whether the returns it will generate are sufficient enough to cover the costs. Fixed assets
are among the long-term investments that firms engage in since their life spans beyond
one year, therefore a detailed plan is required on how the expected cash flows will be
spent (Hirschey, 2003). Capital budgeting therefore involves a systematic process through

15
which a firm’s capital assets are planned and controlled (Cherry, 1970). Capital budgeting
is critical to any firm operating in a competitive environment because it enable such firms
to utilize their wealth optimally by investing in projects that maximize shareholders’
wealth (Hermes, 2007).
The major concept underlying capital budgeting is wealth maximization. The
shareholders wealth must be invested in projects that will maximize the value of the firm
(Hermes, 2007). The financial metric in the capital budgeting is the cash flows rather than
the accounting profit. This is because the accounting profit and its accruals and realization
concepts measure the result of the accounting process (Dobbins and Pike, 1980).
Following the official recognition in 1973, the Matatu sector in Kenya has undergone
tremendous growth. It competes with the public bus transport companies not only within
towns, but also in medium and long-distance passenger transport in Kenya. The short-
distance passenger traffic throughout Kenya is dominated by the Matatu operator services
(Ogonda 1992).
There is a deficiency on empirical studies that address financial management aspects of
Matatu sector in Kenya. Most research in Kenya with regard to Matatu sector have
addressed the regulatory framework, working conditions, legal status and origin (Aduwo
1990; Kapila et al., 1982; Muchira et al., 1994). Chumba (2015) carried out a study on
the factors affecting performance of family owned Matatu businesses in Nairobi and
found out that management style, access to cheap credit and cost of operations have
significant influence on the profitability and survival of such enterprises.
Despite these studies there still remains several unanswered queries one of them is
whether the sector employs capital budgeting Practices and procedures in evaluating their
investments.

16
2.4 Capital Budgeting Techniques
Capital budgeting involve selecting the most viable project from among the several
proposals using capital budgeting techniques. Some of the techniques make use of
incremental cash flows while others do not (Seitz, 2005). The Net present value (NPV)
technique calculates the present value of both the cash inflows and outflows and the
difference between the two is the NPV of the project (Kurt & Daniel, 2003). A positive
NPV means that the project is able to return its required rate of return and therefore
accepted as viable. If the amount is negative, it cannot provide adequate returns and
would be rejected. Internal rate of return (IRR) is the discounting rate for obtaining a zero
NPV for a project. A positive NPV implies that the actual return is higher while negative
NPV indicates that the actual return is lower (Berk, Johnathan, 2015). By constantly
changing the discount rate it is possible to arrive at a discount where the NPV is zero.
NPV generally rewards large profits because it is easier for them to generate large NPVs
without having a high IRR. The PI adjusts for this by a simple change. When calculating
NPV, the present value of the outflows is subtracted from the present value of the inflows
giving the NPV (Kurt & Daniel, 2003). The profitability index is obtained by dividing the
present value of the outflows into the present values of inflows. The project is acceptable
when the calculated figure is greater than one. Payback Period is the time required for a
project to recover its initial outlay (Williams J.R. et al, 2012).
2.5 The Cost of Capital
Cost of capital is a vital component in capital budgeting process. Each project that is
proposed by the company has an estimated required rate of return. For a project to be
considered for investment, the expected rate of return must exceed the cost of capital
(Dybvig and Wang, 2002; and Gunasekaran, 2010). When designing employee
compensation plans and bonuses, the cost of capital is vital because it’s a cost that must

17
be recovered from the returns generated (Ehrhardt, 1994). The importance of cost of
capital finance is that it offers a benchmark through which investments are evaluated and
top managers appraised. When making decisions on the source of capital to employ on a
project, the cost of capital useful. Projects with a higher required rate of return must be
funded with a relatively cheaper source of finance at any given time (Ehrdardt, 1994). A
firm may have a number of securities that have claims on their assets. These claims could
have different required rates of return. When an average of the various required rates of
return are taken, it forms the cost of capital for the investors of that firm (Pandey, 2001).
Determination of the various required rate of returns for the various securities is pure a
function of the market. The market forces of demand and supply will set the equilibrium
prices for each security. The equilibrium prices are subsequently used to determine the
required rate of return as per this formula (Glen, 2008)
Io=CF1/1+k +CF2/ (1+k) 2 +----+CFn / (1+k)
n
In this formula I0 represents the amount of capital by investors in period 0 and CF
represent what the investor’s expected return, and k being the cost of capital.
Firms raise debt in a variety of ways. Borrowing can be done through financial
institutions or public. Public deposits and debentures are the common forms of such
borrowing for a given time and interest rate. The interest rate charged on borrowed funds
is used to calculate the cost of debt (Pandey, 2001). At a given time firms will employ
selected sources to finance projects. The average cost of capital for these sources forms
the average cost of capital for the firm at this point in time (Frank, Murray; Shen and Tao,
2012).

18
2.6 Critique of the Existing Literature
Most of the research work in Kenya concerning on public transport and Matatu sector
have concentrated on the regulations, working conditions for both workers and
employees, among other challenges in the sector. Little literature exist on financial
management and how it affects the general performance of this sector. Chitere and Kibua
(2004), carried out a study on how regulatory framework affects Matatu sector. Their
findings were that greatly contribute to the poor performance in public transport.
The major problem in Matatu business is cost. The cost of operations and cost of capital
brought about by rising interest rates and the fluctuating cost of fuel and spare parts that
are beyond the operator’s control (Aduwo, 1990). Despite the many researchers
underlining the challenges affecting the sector, no precise undertaking pointing out to
these challenges in a view to reducing these costs and carrying out proper financial
budgeting practices to make the sector more profitable has been done (Aduwo, 1994).
The study aimed at investigate these challenges in-depth for Kisii County and perhaps
some of the learning can be replicated elsewhere or open for more research in other
settings.
2.7 Summary of the Chapter
Most of the research work in Kenya concerning on public transport and Matatu sector
have concentrated on the regulations, working conditions for both workers and
employees, among other challenges in the sector. Little literature exist on financial
management and how it affects the general performance of this sector. Chitere and Kibua
(2004), carried out a study on how regulatory framework affects Matatu sector. Their
findings were that greatly contribute to the poor performance in public transport.
Fixed assets are among the long-term investments that firms engage in since their life
spans beyond one year, therefore a detailed plan is required on how the expected cash

19
Capital Budgeting
Practices
Cost of operations
Cost of capital
Capital Budgeting
Techniques
flows will be spent (Hirschey, 2003). Capital budgeting therefore involves a systematic
process through which a firm’s capital assets are planned and controlled (Cherry, 1970).
Capital budgeting is critical to any firm operating in a competitive environment because it
enable such firms to utilize their wealth optimally by investing in projects that maximize
shareholders’ wealth (Hermes, 2007).
Although some of these aspects have been in use in larger firms, the small firms including
Matatu businesses are faced with the same problems. It is because of this that small firms
have to apply some of them, if not all of them, in order to succeed .The available
literature suggests that capital budgeting and capital structure in small business
enterprises is deficient but no attempts have been made to document the existing trend
other than just the conclusion without proper basis that small business enterprises do not
practice financial planning (chai, 2014).
2.8 Conceptual Framework
Independent Variables Dependent Variable
The conceptual frame indicates how capital budgeting practices work influence the
returns of the Matatu business in Kisii County. Capital budgeting practices include; cost
of capita, cost of operations, and capital budgeting techniques. The financial Performance
Performance of Matatu
Business

20
of Matatu business is affected by many factors but this study will focus on capital
budgeting practices as illustrated in the figure above.

21
CHAPTER THREE: RESEARCH METHODOLOGY
3.1 Introduction
This chapter explains the tools and methods used by the researcher to collect valid and
reliable data devoid of biases. The chapter addresses research design, sampling design
and data analysis.
3.2 Research Design
This is an overall plan on how the researcher intend to conduct a study to solve a
particular research problem (Churchill & Iacobucci, 2009; Bryman, 2008). The researcher
used a cross section survey design to conduct the study. A cross sections study enables
the researcher to capture data about a variable at a point in time (Rubin & Babbie, 2009).
The study aimed to find out the effect of capital budgeting practices on the performance
of Matatu business in Kisii County thus targeted current investors in Matatu business. In
Kisii County most operators are individuals who are spread evenly across the county. The
researcher settled on a survey design to carry out the interviews. The researcher preferred
cross sectional survey because the study intends to capture the data about the performance
of current Matatu businesses.
3.3 Target Population
The study population constituted all registered Matatu Saccos operating in Kisii County.
The Saccos are made up of individual operators who are duly registered by particular
Matatu Saccos. Kisii County has good road network that interconnects the whole county.
Matatu businesses are fairly spread across the county and therefore samples picked at
random can represent the views of the entire population without bias. There are 19
registered Saccos in Kisii County with about 600 registered active operators in Kisii
County NTSA (2015).

22
3.4 Sample Design
The study adopted a stratified random sampling. Since the population comprised all
registered Matatu Saccos in Kisii County, and all individuals investors belong to these
Saccos, a sample of 10% of individual members from each Sacco was taken to represent
the population. The researcher used a confidence level of 95% and picked at least 10% of
the population as his sample. The sample size estimate is good enough for the study
findings to be generalized (Mugenda & Mugenda, 2003).
Table 1: Sample Distribution
SACCO NAME No of Members
Sample
Drawn
COMFORT SAFARIS SACCO 32 3
FARASI TRAVELLERS SACCO LTD 35 3
FIVE STAR SERVICES SACCO 46 5
GUCHA TRAVELLERS SACCO LTD 22 2
KIENYA TRAVELLERS SACCO LTD 21 2
KIMISAHLINE TRAVELLERS SACCO LTD 30 3
KINYAMO TRANSPORTERS SACCO LTD 35 4
KINYANA TRAVELLERS SACCO 28 3
KOKE SACCO LTD 25 3
MANGA NISSAN TEAM SACCO LTD 28 3
MASABA LINE SERVICES SACCO LTD 31 3
NURU TRAVELLERS SACCO LTD 23 3
NYAMACHE TRANSPORT OPERATORS SACCO
LTD 25 3
NYAMBUNWA MATATU SACCO LTD 20 2
NYANGENA MZALENDO SAFARIS SACCO LTD 23 3
SMART HIGHWAYS SACCO LTD 25 3
TRANSLINE SACCO LTD 55 5
WASAFIR TRAVELLERS SACCO LTD 32 3
ZIONLINE SERVICES SACCO LTD 33 4
TOTAL 569 60
3.5 Data Collection
The researcher used quantitative data in this study. Collection of data was done by use of
structured questionnaire, after which the data was coded and edited. Tables were used to
summarize the data for presentation in graphs and charts (Mugenda & Mugenda, 2003).

23
Data from the questionnaires was coded and each variable analyzed by the help of SPSS
software V 17.
Regression analysis was used to test the strength and relationship between variables in the
model. The model was tested at 95% confidence level and 5% significance. Returns in
Matatu business was regressed against three variables namely cost of capital, cost of
operation, and capital budgeting Technique applied. The equation will be as follows:
Y = β0+ β1X1+ β2X2+ β2X3 + ε,
Where;
Y= Returns
β0= constant (coefficient of intercept)
X1= Cost of capital
X2=Cost of Operation
X3= Capital budgeting Technique
ε = error term
β1…β3= regression coefficients of Three variables.
In order to measure the predicting power of the model, ANOVA was used. The model
predicted the influence of the three independent variables on the returns of Matatu
business. The test of significance was done using the coefficient of determination R
square. The R square measures percentage change in the dependent variable that is
explained by changes in the independent variables.
Coded data was presented in tables, and descriptive measures were used to reorganize and
summarize the tabulated data. The reports generated were quantitative in nature and were
presented using charts, graphs and tables (Kothari, 2006).
The validity of the research instruments were pre-tested through a pilot study in Kisii
County, Kenya. The pilot study helped in the clarification of ambiguous areas.

24
Through the use of structured questionnaire the reliability of research instruments was
tested. The study also used experts in the field and the research supervisors to test the
consistency and accuracy of the research instrument.
3.6 Data Analysis
This involved the preparation of data collected into useful, clear and understandable
information. Data analysis and processing involved coding, editing and tabulating. The
data collected from the field was analyzed and processed into meaningful and relevant
information guided by the objective of the study. The response from the questionnaire
was accorded percentages to facilitate analysis. The (SPSS) version 17 was used to
analyze the primary data. Qualitative data analysis was done by comparing findings with
already known facts and conclusions were made depending on how the findings fitted to
the research questions. Data was then presented in headings and raw data then
transformed into information (Kothari, 2006). To better the understanding of the findings,
the information was presented into percentages and tables with an analysis as discussed in
chapter four.
A Regression analysis was used to test how capital budgeting Practices influence
performance. The study employed the following model.
Return = α + β1 COC+ β2 COP+β3CBT+ € l
Where
COC = Effect in shilling of Cost of Capital
COC = Effect in shilling of Operational costs
COC = Effect in shilling of Capital Budgeting Techniques
25
CHAPTER FOUR: RESULTS AND DISCUSSIONS
4.1 Introduction
The purpose of this chapter is to analyze research findings, interpret and explain findings
and finally present the findings. The purpose of the study was to find out the how capital
budgeting practices affect the returns of Matatu business in Kisii County. The respondents
were the owners of Matatu business in Kisii County.
A three section questionnaire was used for the purpose of collecting data form the
respondents. The first section captured respondent’s demographic data, while the second
and third sections captured operations costs, capital budgeting techniques and returns.
The research findings were analyzed with the help of SPSS program and the results
presented using tables and graphs. Descriptive measures and inferential statistic tools
were used to interpret the findings. For descriptive interpretation, the mode and median
were used while correlation and regression analyses were utilized for inferential
interpretations.
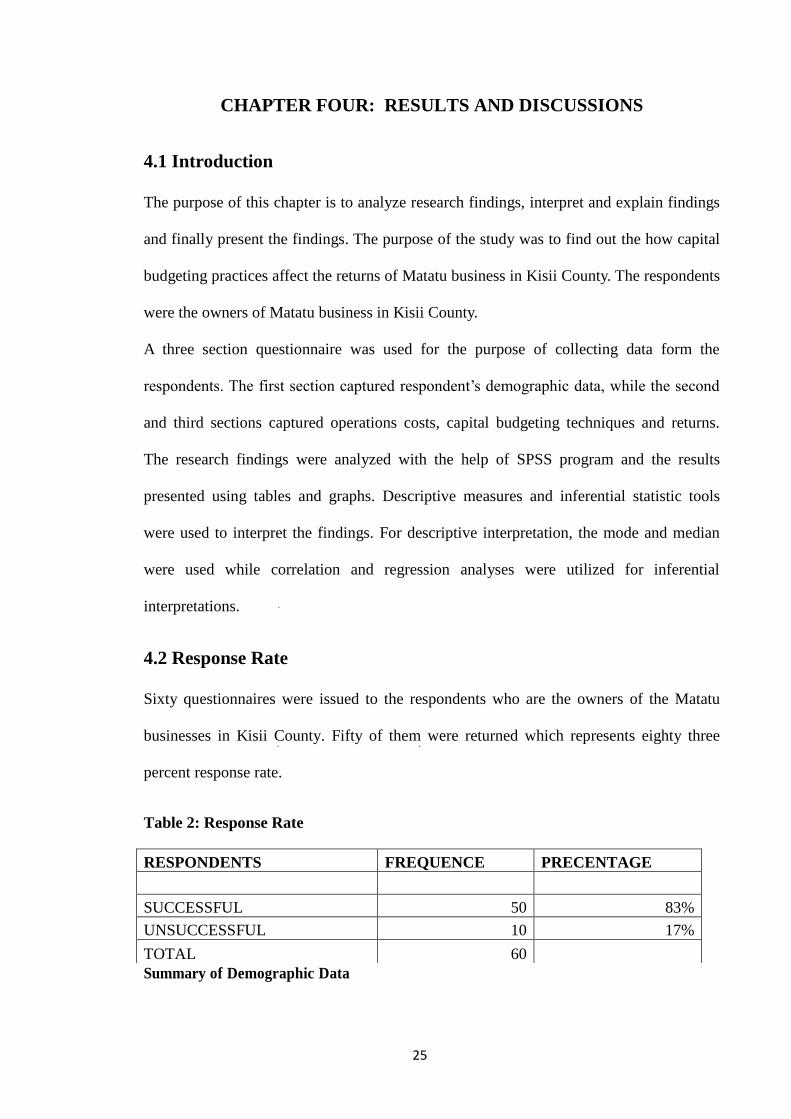
4.2 Response Rate
Sixty questionnaires were issued to the respondents who are the owners of the Matatu
businesses in Kisii County. Fifty of them were returned which represents eighty three
percent response rate.
Table 2: Response Rate
Summary of Demographic Data
RESPONDENTS FREQUENCE PRECENTAGE
SUCCESSFUL 50 83%
UNSUCCESSFUL 10 17%
TOTAL 60

26
The researcher first classified the respondents into male or female. The male respondents
formed the majority 90% and the female were 10%.
Table 3: The Respondent’s Gender
Gender Frequency Percentage
Male 45 90%
Female 5 10%
Source: Research data (2016)
The respondents were divided into those that operate 14 seaters and those that operate 11
seaters for the purpose of analysis, this categorization was considered necessary.
Table 4: Categorization of Respondents by Seating Capacity
Category Frequency Percentage
14 Seater 43 86%
11 Seater 7 14% Source: Research data (2016)
Research findings in table 4 show that majority of the operators run 14 seater vehicles at
86% and the 11 seater are 14%.
Table 5: Occupation of Respondents other than Matatu Business
Occupation Frequency Percentage
Accountants 1 2%
Administrators 1 2%
Businessmen 19 38%
Farmers 10 20%
Formal Employment 5 10%
Lecturers 1 2%
Nurses 2 4%
Teachers 11 22%
Source: Research data (2016)

27
The researcher also categorized the respondents on other engagements that they have
other than Matatu business. Majority were businessmen at 38%, followed by teachers at
22% and farmers at 20%.
Table 6: The Respondents Education Level
Primary Secondary Certificate Diploma Degree Masters
Frequency 5 10 18 7 8 2
Percentage 10% 20% 36% 14% 16% 4%
Source: Research Data (2016)
The respondents with certificates formed the majority at (36%). Those with secondary
were (20%), graduate level was at 16%, Diploma at 14%, and primary formed 10%.
Those with Masters were least presented with only 4%. The level of education was
important in this study because those with higher education are expected to have some
degree for financial literacy.
4.3 Data Validity
Data validity is used to describe how best an instrument measures what it ought to
measure. Content validity pertains to the extent to which the instrument fully assess the
construct of interest (Allen & Yen, 1979). There were various ways used to establish the
validity of the data collected, and they included interviewer corroboration, as well as peer
debriefing, and conformability to ensure that the overall goal of the process which was to
provide findings that were authentic, and original is met.

28
4.4 Descriptive Analysis
4 .4.1 Sources of Capital
Table 7: Summary of Sources of Financing
Source of Finance Frequency Percentage
Equity 3 6%
Debt 17 34%
Equity and Debt 30 60%
Source: Research data (2016).
Table 7 illustrates some of the source of capital that Matatu operators employ. A
combination of equity and debt had the highest rating at 60%, while debt and equity
separately received had 34% and 6% respectively
4.4.2 Capital Budgeting Techniques
Table 8 Application of Capital Budgeting Techniques
Q13&14 FREQ PERCENT CUMM
Not Applying 22 44% 44%
PB 18 36% 80%
NPV 7 14% 94%
OTHERS 3 6% 100%
TOTAL 50
Source: Research data (2016)
From the study , many operators do not apply the techniques given their level of knowledge
and education. Most of the operators apply intuitive management skills to run businesses in
this sector. Sometimes it works for them and sometimes it doesn’t. This is explained by the
significant number of operators who have their businesses abandoned before in two years
and below.
4.5 Correlation Analysis
Correlation analysis was carried out between the various costs that were investigated and
returns. The results in Table 9 show that fuel and returns have a strong negative correlation.

29
This implies that when an increase in cost of fuel will reduce the returns with similar
magnitude. Othe costs which were negatively correlated with returns were Payments to
government agencies and maintenace costs.
Table 9 : Correlation Analysis between Operations Costs and Returns.
Cost Item N
Correlation
Coefficient. Sig.
Fuel cost increases 48 -0.786 0.028
Oil, tires and other parts
cost 46 0.215 0.13
Insurance cost 50 0.13 0.275
Bank interests 46 -0.293 0.048
Labor cost 49 0.314 0.034
Maintenance cost 48 -0.164 0.265
Payment to government
agencies 50 -0.13 0.174
Source: Research data (2016)
4.6 Regression Analysis
Table 10: ANOVA Summary
ANOVA
Df SS MS F
Significance
F
Regression 3 1.78428E+12 5.94758E+11 13.49008795 1.90931E-06
Residual 46 2.02807E+12 44088554546
Total 49 3.81235E+12
Table 11: Regression Analysis Summary
Model Intercept
Standard
Error T Sig.
Constant 312249.1146 307224.8813 1.016353602 1.092
Cost of capital 4.782786155 1.348384875 3.547048209 0.019
Cost of Operations -0.669635613 0.606611754
-
1.103894886 0.207
Capital Budgeting Tech -13857.42502 32809.04295
-
0.422366024 0.0783
Source: Research data (2016)

30
A regression analysis was done and the results presented in Table 11. Independent
variable were cost of capital, operational costs and capital budgeting techniques. The
Returns were used as dependent variable representing performance of Matatu business.
The aim was to determine the influence of the three variables on the returns. The results
show that capital budgeting techniques do not influence the returns of Matatu business.
This is be attributed to the fact that most operators do not apply capital budgeting
techniques in appraising their investments, and those that use them do not apply them
appropriately.
Table 12: Regression Model Summary
Model R R Square Adjusted R Square Standard Error
0.684 0.468 0.433 209972.35
Source: Research data (2016)
Table 12 shows a summary of the regression model used by the researcher, from the
results R Square = 0.468. The interpretation of the results above is that 47% of the
changes in Matatu are explained by the model. 53% is attributed to other variables that
were not in the model.
4.7 Capital Budgeting Techniques
Capital budgeting techniques do not affect the returns Matatu business in Kisii County as
per the results in table 11. The p-value is at 0.6 which is way above 0.05 significance
level at 95% confidence level. This means that the probability that capital budgeting
practices affect Matatu business in Kisii County is 60%. Most of the operators do not
apply the techniques while those that apply them do it inappropriately. Proper application
of capital budgeting techniques enables the firm to predict with some level of accuracy
the cash flows by incorporating risk and probability.

31
The study results from Table 8 show that nearly half of the operators interviewed are
unaware of the existence of capital budgeting techniques in evaluating their projects given
their level of knowledge and education. 36% of those that are aware apply Payback
period, while 14% use NPV Method to evaluate their investments. The study found that
capital budgeting practices do not affect the returns of Matatu business in Kisii County.
Onguso (2012) carried out a study on how Matatu business returns are influenced by
financial management practices in Nakuru County. He found out that cost of capital and
cost of operations greatly influence returns. Oira (2015) carried out a study on the
challenges affecting investments in public transport in Nairobi and his conclusions were
that regulations, cartels, access to capital, and profitability of the industry affected
investments in the industry. Mwangi (2014) did a research on effects of budgetary
planning tools and performance of registered public service vehicle companies in Kisii
County Kenya. He found out that most companies have no idea on the existence of such
tools and those that have an idea do not practice them, and that there is no significant
performance differences between those that apply them and those that do not.

32
CHAPTER FIVE: SUMMARY, CONCLUSSIONS AND
RECOMMENDATIONS
5.1 Introduction
In this chapter, recommendations and conclusions are drawn by the researcher based on the
analysis results from data analysis in chapter Four. From the conclusions made, the
researcher will suggest the areas that require further research so as to add and improve the
body of knowledge in the field of study.
The researcher aimed to find out the influence of capital budgeting practices on performance
of Matatu business in kisii county.
Results showed that Capital Budgeting Techniques do not affect the returns Matatu
business in kisii County. The results in table 11 show a probability of 60% of proof that
capital budgeting practices affecting the returns of matatu business in kisii county at 95%
confidence level. For the results to be accepted as significant, the p-value figure should be
below 0.05.
5.2 Conclusions
The study sought to find out how capital budgeting practices influence the performance of
Matatu business in kisii county.
Capital budgeting decisions did not affect the performance of Matatu business in Kisii
County. It emerged that most operators were unaware of this concept and those that were
aware did not apply them correctly. This can be attributed to the level of education as
depicted in Table 4 where majority of the operators were secondary and Certificate
holders. Matatu business is a high risk venture and therefore requires one to evaluate it
using the modern techniques in capital budgeting. From the results it is clear that Payback
period is the most used techniques which does not take into account time value of money
and the risks involved. This means that forecasting of cash flows was inaccurate since it
33
was not based on any mathematical model. The forecast did not take into account the risk
and uncertainties that characterize this sector. Other factors such as the agency costs and
operational costs do influence the performance of Matatu businesses in Kisii County.
5.3 Recommendations
After a thorough analysis that led to our conclusions, the study recommends the following
with regard to capital budgeting practices by the operators in Kisii County. First, the
Saccos should assist their members to access cheap credit from financial institutions
through signing mutual agreements with financial institutions. The Saccos should also
encourage their members to increase their savings in their respective Saccos or join other
Saccos other than Matatu to enable them access loans at a cheaper rate.
The Saccos management should hire at least one financial expert to advice members on
financial matters or conduct regular seminars on financial management matters. Capital
budgeting is a complex process and from the study most operators do not understand it.
Some of the major areas that operators require advice is on the risk identification and
analysis and how to incorporate it in the forecasting of cash flows. Another area is on the
application of capital budgeting techniques in evaluating their projects.
The returns in Matatu sector is mostly influenced by cost of operation, cost of capital
among others. Such costs like police payments are significant and therefore affect the
returns but need to be done away with. Saccos should ensure that their members fully
comply with the set out regulations to avoid such costs. The Matatu Sacco management
should ensure that the Matatu staff is well remunerated to reduce collusions that can lead
to loss of revenues by the investors.

34
5.4 Limitations of Study
The Population was not easily accessed due to various reasons some including their
mobility from one place to another. Most Matatu operators do not own offices as their
vehicles are run by drivers and Sacco staff.
The Respondent were mostly reluctant to give away information about their returns and
source of capital because they considered it sensitive. They were suspicious of the intent
and usage of such information by the researcher. Most of the respondents were afraid of
such information being used by tax and regulatory authorities against them.
Reliability of data obtained might be inaccurate due to the possibilities of respondents in
the study misunderstanding some of the questions and terminologies used in the
questionnaires by the researcher. The most affected area could be that on the capital
budgeting techniques.
5.5 Suggestion for Further Study
Matatu business is a dynamic and complex sector and therefore no single study can
adequately address all the issues in the sector. This study was on individual operators
some of whom do not have the capacity to hire experts to run their business especially on
financial matters. The researcher suggest that a study be done on the capital budgeting
practices on the major bus companies in the public transport. Such study will be
informative to the operators, policy makers, and researchers because it will shift focus
from individual operators to established companies.

35
REFERENCES
Akalu, M. (2003). The Practice of Investment Appraisal (July 2003, 01).
Allen, M.J., & Yen, W. M. (1979). Introduction to Measurement Theory.
Long Grove, IL: Waveland Press.
Asingo, P.O. (2004). The institutional and organizational structure of public road
Transport in Kenya. Ipar Discussion Paper No 50.
Aduwo, G. (1992). Urban Transport System: A case of the Matatu Mode of Transport in
the city of Nairobi, Kenya. In: African Urban Quarterly, Vol7 (1) and (2)
Aduwo, G.O. (1994). Urban Transport System. A case of the matatu mode of
transport in Nairobi. Thesis University of Nairobi.
Aduwo, I.G. (1990). The institutional and organizational structure of public road
transport in Kenya. Thesis University of Nairobi.
Brigham, F. (1982). Financial Management, Theory and Practice .3rd Ed. New York:
The Dyer Press.
Brigham, E.F. (1986). Fundamentals of financial management (4th Ed.). New York,
NY: CBS College Publishing.
Birt, W., & Winternitz. (2004). “Asset specificity, Firm heterogeneity, and Financial
Leverage”, Strategic Management Journal, 14, 87-130
Chai, J.T. (2009). The Impact of Capital Budgeting Techniques on the Financial
Performance of Courier Companies in Kenya. MBA Research Project university
of Nairobi.
Cherry, J. (1970). “Finance: The Joy of Leverage” Harvard Business Review, 77: 19-22
Chumba, J. (2015). Factors Affecting Performance of Family Owned Matatu Business in
Nairobi. EMBA Research Project, Management University of Africa, Kenya.
Dixit, Avinash K., & Pindyck, Robert, S. (1995). "The new option view of investment,"
Working papers 3794-95., Massachusetts Institute of Technology (MIT),
Sloan School of Mgt.

36
Dobkins, & Pike. (1980). “Determinants of Capital Structure: evidence from an emerging
Economy”, International Journal of Commerce and Management, 17, 25-43
Grahams, J. R., & C., Harvey. (2002). How Do CFOs Make Capital Budgeting and
Capital Structure Decisions? Journal of Applied Corporate Finance, 6, 189-258.
Harry, M. (1952). A decision-theoretic approach on deciding when a sophisticated
forecasting technique is needed. Management Science (October): B66-B69.
Harvey, A. (2004), Capital Budgeting Decisions: A Survey of Latin America Practices,
Latin American Financial Markets: Developments in Financial Innovations
(International Finance Review, Volume 5), pp.45-61
Haynes, W., & Soloman, M.B. (1963). A ‘Misplaced Emphasis in capital Budgeting’
Quarterly Review of economies and Business (February 1963).
Kadondi, E.A. (2002). A Survey of Capital Budgeting Techniques used by Companies
Listed at the NSE. Unpublished MBA Project, University of Nairobi, School of
Business.
Khayesi, M. (1997). Matatu workers in Nairobi, Thika and Ruiru towns, Kenya Research
Report, Institute for Development Studies, Nairobi.
Kothari, C.R. (2006). Research Methodology; Methods and Techniques; India: New
Age International Publishers.
Kothari, S. & Shanken, J. (1997). Book-to-Market, Dividend yield and Expected
market Returns; Journal of financial economics, 44 169-204.
Luenberger, J. V. (1958). Management planning of capital allocations to business
activities. N.A.A. Bulletin (September): 5-15.
Maranga, J. (1989). Causes of Failure of Small Businesses. Unpublished MBA Research
University Of Nairobi, Kenya.
McWatters, C.S., Morse, D.C. & Zimmerman, J.L. (2001). Management accounting:
Analysis and interpretation (2nd Ed.). New York, NY: McGraw-Hill.
Mugenda, O.M. & Mugenda, A.G. (2003). Research Methods. Quantitative and
Qualitative Approaches, Nairobi, Acts Press
Murkowitz, H. (1959). Portfolio Selection-Efficient Diversification of Investment; New
York.Wiley.

37
Mwangi, M.C. (2014). Effects of Budgetary planning Tools on the Financial Performance
of Registered Public Service vehicle Companies in Kisii County. MBA Research
Project, Kisii University.
Mwangi, J., Otuya R., Kamau D., (2014), Effects of Financial Management Practices on
Profitability of Matatu Industry in Kenya. Journal of Economics and Finance, 5
(5), 90-100
Oira, S. A. (2015). Challenges affecting Investments in Public Transport (Matatu)
Industry in Nairobi. Strategic Journal of Business and Change management,
2(64), 521-558
Olum C.D. (1976). Capital Investment Appraisal, Technique and Publicity Finances
Investment Project in the Private Sector. Unpublished MBA Project, University
Of Nairobi, School of Business.
Ogonda, R. (1992). Post-Independence Trend in Development of Transport and
Communications. MBA Research Project, University of Nairobi.
Onguso, J. (2012). Influence of Financial management practices on Returns of Matatu
Business in Nakuru County. MBA Research Project, Kabarak University.
Oyaro, G. M. (2009). A Survey of Capital Budgeting Practices for Insurance Companies
in Kenya. Unpublished MBA Project, University of Nairobi, School of Business.
Pandey, I.M. (2001). Financial Management, 8th
Edition; Vikas Publishing House, New
Delhi.
Petty, J. William, David F. Scott, Jr. (May 1984), "Capital Budgeting Practices in Large
American firms: A Retrospective Analysis and Synthesis," The Financial Review, 19
Ross, Stephen A., (1976). "Options and Efficiency," The Quarterly Journal of Economics,
MIT Press, vol. 90(1), pp. 75-89, February
Ryan, & Ryan. (2002). Capital Structure in Developing Countries, Journal of Finance,
56, 87-130.
Wangai, J. W. (1992). The Relationship between Practicing Accountants and His Small
Business Client. Unpublished MBA Research Project, University of Nairobi,
Kenya.

38
APPENDICES
Appendix I: Cover Letter
I am a Student at the University of Nairobi carrying out a research on Capital Budgeting
practices and performance of Matatu business in Kisii County.
You have been randomly selected to participate in this study. This study is for academic
purposes only and the information provided is confidential since No individual responses
will be revealed. Your participation by promptly completing the enclosed questionnaire
e and returning it directly to me would be greatly appreciated.
Mochge Walter Zakkies

39
Appendix ii: Letter of Authority

40
Appendix iii: List of Registered Saccos In Kisii County
1 COMFORT SAFARIS SACCO
2 FARASI TRAVELLERS SACCO LTD
3 FIVE STAR SERVICES SACCO
4 GUCHA TRAVELLERS SACCO LTD
5 KIENYA TRAVELLERS SACCO LTD
6 KIMISAHLINE TRAVELLERS SACCO LTD
7 KINYAMO TRANSPORTERS SACCO LTD
8 KINYANA TRAVELLERS SACCO
9 KOKE SACCO LTD
10 MANGA NISSAN TEAM SACCO LTD
11 MASABA LINE SERVICES SACCO LTD
12 NURU TRAVELLERS SACCO LTD
13 NYAMACHE TRANSPORT OPERATORS SACCO LTD
14 NYAMBUNWA MATATU SACCO LTD
15 NYANGENA MZALENDO SAFARIS SACCO LTD
16 SMART HIGHWAYS SACCO LTD
17 TRANSLINE SACCO LTD
18 WASAFIR TRAVELLERS SACCO LTD
19 ZIONLINE SERVICES SACCO LTD

41
Appendix IV: Research Questionnaire
MATATU OWNER’S QUESTIONNAIRE
I am a student at the University of Nairobi carrying out a research on Capital Budgeting
practices and performance of Matatu business in Kisii County.
You have been randomly selected to participate in this study. This study is for academic
purposes only and the information provided is confidential since No individual responses
will be revealed. Your participation by promptly completing the enclosed questionnaire
and returning it directly to me would be greatly appreciated.
Kindly do not write your Name on the questionnaire
Please Mark (√) in the boxes as appropriate unless otherwise indicated.
A. BACKGROUND INFORMATION
1. Name of Sacco you operate in…………………………………
2. Sex Male Female
3. Level of Education:
(a) Basic Education
Primary [ ] Secondary [ ]
(b) Higher Education
Certificate [ ] Diploma [ ] First Degree [ ] Master Degree [ ]
Others (Specify)……………………………………………………….. 4. what else do you do beside matatu business…………………………. 5. Number of matatus operated.…………………………………………. 6. Number of Years in Operation
Less 1Year [ ]
1-2 Years [ ]
3-5 Years [ ]

42
Over 5 Years [ ]
7. Type of insurance..........................? Third party Commprehensive SECTION B: COST OF OPERATIONS What is your expenditure on insurance per year?
8. what amount do you spend on fuel per day?
Below 3000
3000 - 6000
6000 - 9000
9000 - 12000
Over 12,000
9. What amount do pay for insurance policy per year?
Below 30,000
30,000 – 50,000
50,000 – 75,000
Above 90,000
10. What amount do you spend on servicing the matatu per month?
Below 5,000
5,000 – 10,000
10,000 – 15,000 Above 15,000
Below Kshs s5,000
5,000 10,000
10,000 15,000
15,000 20,000
20,000 And above

43
11.Salary of the Driver per month?
Below 20,000 [ ]
20,00 – 30,000 [ ]
Above 30,000 [ ]
How much do pay for local authorities and other government agencies per year?
SECTION C: COST OF CAPITAL
12. What was the source of Finacing for your matatu?
Debt [ ]
Equity [ ]
Debt and Equity [ ]
If through Debt, kindly indicate the interest rate caharged?
Less than 15% [ ]
15% - 20% [ ]
20% - 25% [ ]
25% - 30% [ ]
Above 30% [ ]
SECTION C: CAPITAL BUDGETING TECHNIQUES
13. Did you employ capital budgeting techniques to evaluate your capital expenditure?
Yes [ ] No [ ]
14. If yes, indicate which of the following capital budgeting techniques you employed?
Payback Period (PB) [ ]
Net Present Value (NPV) [ ]
Below
Kshs 5,000
5,000-
10,000
10,000-
15,000
15,000-
20,000
20,000
And above

44
15. What is the least amount recorded per day by the business?
16. What is the least amount recorded per day by the business?
17. What was the initial amount that you invested in the business?
Less 500,000
500,000 – 1000,000
1000,000 – 1500,000
1500,000 – 2000,000
2000,000 – 2500,000
Above 2500,000
Thank you very much for time and cooperation
Below
Kshs. 2,000
2,000 -
5,000
5,000 -
8,000
8,000 -
10,000
10,000
And above
Below
Kshs. 2,000
2,000 -
5,000
5,000 -
8,000
8,000 -
10,000
10,000
And above

45
Appendix V: Originality Report