capital city ports – coping with growth btre introduction godfrey lubulwa maritime and rail...
TRANSCRIPT

Capital city ports – coping with growthBTRE introduction
Godfrey Lubulwa
Maritime and Rail Statistics, BTRE
BTRE Transport Colloquium13 - 14 June 2007

Outline
1. BTRE projections of growth in capital city ports to 20252. Implications of growth
– Vessel visits– Wharf-side performance indicators– Landside of port terminal indicators
3. Conclusions

BTRE long term projected growth in containerised sea freight (exports & imports)
Source: BTRE Working Paper 65
5.3
14.9
4.0
8.0
12.0
16.0
2005-06 2024-25
Financial years
TE
Us,
Mill
ions
All ports

BTRE long term projected growth in containerised sea freight (exports & imports)
Source: BTRE Working Paper 65
2005-06 2024-25 Growth rate pa TEUs, millions TEUs, millions Per cent CAPITAL CITY PORTS
5.6
Brisbane 0.8 3.0 7.4 Sydney 0.7 1.8 5.0 Melbourne 1.9 4.9 4.9 Adelaide 0.2 0.5 5.3 Fremantle 0.2 0.7 5.5
NON-CAPITAL CITY PORTS
0.3 0.7 5.0

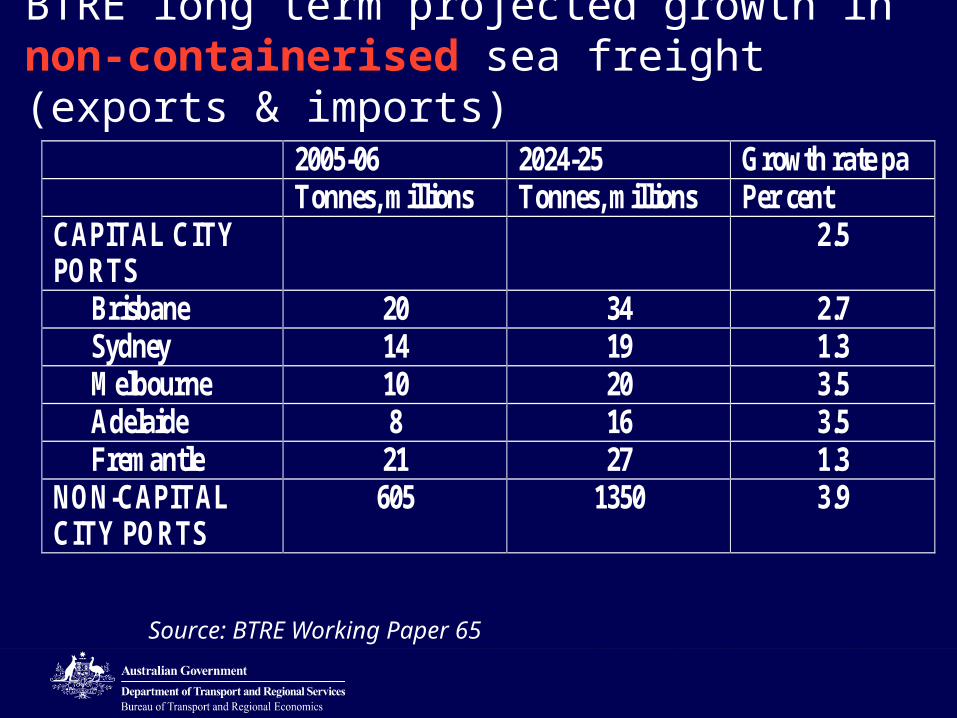
BTRE long term projected growth in non-containerised sea freight (exports & imports)
Source: BTRE Working Paper 65
679
1,364
0
1,000
2,000
2005-06 2024-25
Financial years
Tonn
es, M
illio
ns
All ports
BTRE long term projected growth in non-containerised sea freight (exports & imports)
Source: BTRE Working Paper 65
2005-06 2024-25 Growth rate pa Tonnes, millions Tonnes, millions Per cent CAPITAL CITY PORTS
2.5
Brisbane 20 34 2.7 Sydney 14 19 1.3 Melbourne 10 20 3.5 Adelaide 8 16 3.5 Fremantle 21 27 1.3
NON-CAPITAL CITY PORTS
605 1350 3.9

BTRE long term projected growth in total sea passenger visits (international + domestic)
Source: BTRE Working Paper 65
All ports
0.4
0.8
0.00
0.50
1.00
2005-06 2024-25
Financial years
Pas
seng
er v
isits
, M
illio
ns

Some implications of growth
– Vessel visits– Wharf-side performance indicators– Landside of port terminal indicators

(1) Growth in ship visits and vessel size: containerised sea freight
Source: BTRE Working Paper 65
Ship visits TEUs per ship Number
p.a., 2005-06
Growth rate (%) p.a. to
2024–25
Number, 2005-06
Growth rate (%) p.a. to
2024–25 CAPITAL CITY PORTS
4.6 1.0
Brisbane 914 6.4 840 1.0 Sydney 1081 3.9 1316 1.0 Melbourne 1125 3.9 1759 1.0 Adelaide 242 4.2 746 1.0 Fremantle 482 4.4 1011 1.0
NON-CAPITAL CITY PORTS
1608 4.6 337 0.7

(2a) Wharf-side performance indicators (Waterline) are flattening out
Source: Waterline, various issues
Five major capital city port terminals
10
15
20
25
30
35
40
45
50
Quarter
Ship rate
Vesselworking rate
Crane rate

Source: Sydney Ports Corporation, Logistics Review 2005-06
(3b) Most truck movements occur during the peak day-time period
048
121620
Port Botany container terminal, 2006
Time of day – 24 hour period

Source: Sydney Ports Corporation, Logistics Review 2005-06
(3c) Land side of port terminal: Very few trucks pick up/ drop off containers during the weekend
20
16 17 18
8
2
20
0
4
8
12
16
20
Pe
r c
en
t
Day of the week

(3a) The landside of port terminal: The business/opening hours mismatch
.
Ship Dock Container yard
Gate Road/Rail
Government Mon-Fri Day time
CustomerDay-time
Container depot
WarehouseMon-Fri Day time
Emptycontainer
park
24 hours/ 7 days at major ports The landside of port terminal
Intermodal hub
Mon-Fri Day time
Business practices
Pick-up
Drop off
Exporter/ ImporterMon-Fri Day time

Conclusions
1. Strong growth is projected in capital city ports to 2025– Containerised sea freight– Non-containerised sea freight– Sea passenger visits
2. Implications of growth– Vessel visits are projected to increase at 4.6% pa;
• Vessels on average are projected to be about 1% larger;– Wharf-side performance indicators are flattening out;– Activities and practices on the landside of port terminal may
provide opportunities for future/further reform.