capital link shipping weekly markets reportvaluation through their positioning in the investment...
TRANSCRIPT

Monday, April 2, 2012 (Week 14)
IN THE NEWS→ Capital Link’s 6th Annual Invest in Shipping Forum is a Great Success, Sets New Record in Attendance → Latest Company News→ Select Dividend Paying Shipping Stocks
CAPITAL MARKETS DATA→ Currencies, Commodities & Indices→ Shipping Equities - Weekly Review→ Weekly Trading Statistics, by Knight Capital→ Shipping Bonds - Weekly Review, by Knight Capital
SHIPPING MARKETS→ Dry Bulk Market - Weekly Highlights, by Intermodal Shipbrokers → Weekly Tanker Market Opinion, by Poten & Partners→ The Week In Review, by Golden Destiny → Tanker Market - Weekly Highlights, by Charles R. Weber Company → Weekly Freight Rate & Asset Trends, by Intermodal Shipbrokers→ Container Market - Weekly Highlights, by Braemar Seascope→ S&P Secondhand, Newbuilding & Demolition Markets, by Golden Destiny
TERMS OF USE & DISCLAIMER
CONTENT CONTRIBUTORS
Capital Link Shipping Weekly Markets Report
New York - 230 Park Avenue, Suite 1536, New York, NY, 10169 Tel.: +1 212 661 7566 Fax: +1 212 661 7526London - Longcroft House,2-8 Victoria Avenue, London, EC2M 4NS, U.K Tel. +44(0) 203 206 1320 Fax. +44(0) 203 206 1321Athens - 40, Agiou Konstantinou Str, Suite A 5, 151-24 Athens, Greece Tel. +30 210 6109 800 Fax +30 210 6109 801
Capital Link - New York - London - Athenswww.capitallink.comwww.capitallinkforum.com
www.CapitalLinkShipping.comA web based resource that provides information on the major shipping and stock market
Investor Relations & Financial Advisory
indices, as well as on all shipping stocks. It also features an earnings and conference call calendar, industry reports from major industry participants and interviews with CEOs, analysts and other market participants.
www.CapitalLinkWebinars.comSector Forums & Webinars: Regularly, we organize panel discussions among CEOs, analysts, bankers and shipping industry participants on the developments in the various shipping sectors (containers, dry bulk, tankers) and on other topics of interest (such as Raising Equity in Shipping Today, Scrapping, etc).
Capital Link Investor Shipping ForumsIn New York, Athens and London bringing together investors, bankers, financial advisors, listed companies CEOs, analysts, and shipping industry participants.
www.MaritimeIndices.comCapital Link Maritime Indices: Capital Link developed and maintains a series of stock market maritime indices which track the performance of U.S. listed shipping stocks (CL maritime Index, CL Dry Bulk Index, CL Tanker Index, CL Container Index, CL LNG/LPG Index, CL Mixed Fleet Index, CL Shipping MLP Index – Bloomberg page: CPLI. The Indices are also distributed through the Reuters Newswires and are available on Factset.
Capital Link Shipping Weekly Markets ReportWeekly distribution to an extensive audience in the US & European shipping, financial and investment communities with updates on the shipping markets, the stock market and listed company news.
Operating more like a boutique investment bank rather than a traditional Investor Relations firm, our objective is to assist our clients enhance long term shareholder value and achieve proper valuation through their positioning in the investment community. We assist them to determine their objectives, establish the proper investor outreach strategies, generate a recurring information flow, identify the proper investor and analyst target groups and gather investor and analyst feedback and related market intelligence information while keeping track of their peer group. Also, to enhance their profile in the financial and trade media.
Capital Link is a New York-based Advisory, Investor Relations and Financial Communications firm. Capitalizing on our in-depth knowledge of the shipping industry and capital markets, Capital Link has made a strategic commitment to the shipping industry becoming the largest provider of Investor Relations and Financial Communications services to international shipping companies listed on the US and European Exchanges. Capital Link's headquarters are in New York with a presence in London and Athens.
In our effort to enhance the information flow to the investment community and contribute to improving investor knowledge of shipping, Capital Link has undertaken a series of initiatives beyond the traditional scope of its investor relations activity, such as:
...Linking Shipping and Investors Across the GlobeCapital Link Shipping

CAPITAL LINK’S 6TH ANNUAL INVEST IN SHIPPING FORUM IS A GREAT SUCCESS, SETS NEW RECORD IN ATTENDANCE
PRESS RELEASE
CONFERENCE MATERIALS AND EXECUTIVE VIDEO INTERVIEWS AVAILABLE AT www.CapitalLinkShipping.com.
NEW YORK, NY, MARCH 26, 2012—Capital Link’s 6th Annual Invest in International Shipping Forum took place on Monday, March 19, 2012, in New York City with great success and with an attendance of 927, setting a new record.
18 Shipping Companies, analysts, financiers, and market Eeperts participated in various panels and presentations.
The forum provided a comprehensive review and outlook on the various markets—the container, dry bulk, and tanker sectors in addition to offshore drilling—made more relevant by the timely release of companies’ annual performance results. The event also examined critical issues affecting the shipping industry, such as bank financing, access to the capital markets, alternative financing, restructuring, bankruptcy, ship recycling, and investment opportunities in shipping.
CONFERENCE MATERIAL
There is an archive of all presentations and panel discussions, including slides and audio files.Please click on the following link or copy and paste it into your browser: www.CapitalLinkShipping.com.
EXECUTIVE VIDEO INTERVIEWS
The 6th Annual Invest in International Shipping Conference took place at the Metropolitan Club in New York City.
Tradewinds TV interviewed several of the participating executives at the Capital Link Shipping Forum. In addition, Barry Parker also conducted several interviews for Capital Link Shipping.
An archive of all these executive interviews can be found by clicking on the following link or copying and pasting it into your browser: www.CapitalLinkShipping.com.
PARTICIPATING SHIPPING COMPANIES
• Danaos Corporation (NYSE: DAC) • DryShips Inc. (NASDAQ: DRYS) • Euroseas Ltd. (NASDAQ: ESEA) • Excel Maritime Carriers Ltd (NYSE: EXM) • General Maritime Corporation (OTC.BB: GMRRQ.OB) • Maersk Broker K/S • Navios Maritime Acquisition (NYSE: NNA) • Navios Maritime Holdings Inc. (NYSE: NM) • Ocean Rig (NASDAQ: ORIG) • Odfjell Drilling (Oslo: ODF.OL) • Prospector Offshore Drilling S.A. (Oslo: PROS.OL) • Safe Bulkers, Inc. (NYSE: SB) • Scorpio Tankers Inc. (NYSE: STNG) • Seadrill / North Atlantic Drilling (NYSE: SDRL) • Seanergy Maritime Holdings Corp. (NASDAQ: SHIP)

• Star Bulk Carriers Corp. (NASDAQ: SBLK) • Synergy Marine • Tsakos Energy Navigation Ltd (NYSE: TNP)
PARTICIPATING ANALYSTS
• Clarkson Capital Markets • Knight Capital Americas • Jefferies & Co. • Morgan Stanley • RS Platou Markets • Wells Fargo Securities, LLC
PARTICIPATING BANKS, AUDITING AND LAW FIRMS & OTHER ORGANIZATIONS
• ABN AMRO • AMA Capital Partners • Bank of America Merrill Lynch • Bracewell & Giuliani LLP • Clarkson Capital Markets • DVB Group • Ernst & Young • Fried, Frank, Harris, Shriver & Jacobson LLP • Gibson, Dunn & Crutcher LLP
• Global Marketing System (GMS) • Jefferies & Co. • Knight Capital Group • Morgan, Lewis & Bockius LLP • Morgan Stanley • Nordea Bank Norge ASA • PwC • RS Platou Markets • Seward & Kissel LLP • Watson, Farley & Williams LLP • Wells Fargo Securities, LLC
SPONSORS, SUPPORTING ORGANIZATIONS & MEDIA PARTNERS
In Cooperation With: NYSE, NASDAQ OMX
Global Lead Sponsors: ABN AMRO, Tsakos Energy Navigation Ltd
Global Gold Sponsors: Knight Capital Group, DVB Bank
Global Silver Sponsors: Clarksons, Ernst & Young, PwC, International Registries, Inc.
Global Corporate Sponsors: AMA Capital Partners, Bank of America Merrill Lynch, Fried, Frank, Harris, Shriver & Jacobson LLP, Global Marketing System (GMS), Jefferies & Co., Morgan Stanley, RS Platou Markets, Watson, Farley & Williams LLP, Wells Fargo Securities, LLC
Event Sponsors & Presenters: Bracewell & Giuliani, Danaos Corporation, DryShips Inc., Euroseas Ltd., Excel Maritime Carriers Ltd, Gibson, Dunn & Crutcher LLP, Morgan, Lewis & Bockius, Navios Maritime Holdings Inc., Navios Maritime Acquisition, Nordea Bank Norge ASA, Ocean Rig, Safe Bulkers, Inc., Seanergy Maritime Holdings, Star Bulk Carriers Corp.
“Alternative Sources of Ship Finance Panel” from left ot right: Erik Helberg (RS Platou Markets), Peter Sorkin (Knight Capital Group), Hamish Norton (Jefferies & Co.), and Sofia Kalomenidis (Ernst & Young).
Nick Kounis (ABN AMRO) delivers the current state of the global economy and world trade.
Anil Sharma (Global Marketing Systems) presents on “Ship Recycling - Headline ‘Risk’ or Opportunity?”

COMPANY PRESENTATIONS
Evangelos Chatzis, CFO, Danaos Corporation
Aristides J. Pittas, CEO, Euroseas Ltd
Pavlos Kanellopoulos, CFO, Excel Maritime Carriers Ltd
Loukas Barmparis, President & Director, Safe Bulkers Inc.
Dale Ploughman, CEO, Seanergy Maritime Holdings Corp.
Spyros Capralos, CEO, Star Bulk Carriers Corp.
George Saroglou, COO, Tsakos Energy Navigation, Ltd
SECTOR PANEL DISCUSSIONS
“Container Sector Panel” from left to right: Kevin Kennedy (The Synergy Group), Claes Devantier (Maersk Broker), Aristides J. Pittas (Euroseas Ltd), John Coustas (Danaos Corporation), and Michael Webber (Wells Fargo Securities, LLC).
“Dry Bulk Sector Panel” from left to right: Spyros Capralos (Star Bulk Carriers Corp.), Dale Ploughman (Seanergy Maritime Holdings Corp.), Loukas Barmparis (Safe Bulkers Inc.), Ismini Panayotides (Excel Maritime Carriers Ltd), and Ben Nolan (Knight Capital Group).
“Tanker Sector Panel” from left to right: Robert Bugbee (Scorpio Tankers), Ted Petrone (Navios Maritime Acquisition), George Saroglou (Tsakos Energy Navigation), and Douglas J. Mavrinac (Jefferies & Co.).
“Offshore Panel” from left to right: Tor Olav Trøim, (Seadrill / North Atlantic Drilling Ltd), Bill Rose (Prospector Offshore Drilling), Simen Lieungh (Odfjell Drilling), George Economou (Ocean Rig), and Anders Bergland (RS Platou Markets).

Supporting Organizations & Media Partners: Barron’s, IMASMA, Lloyd’s List, The Maritime Executive, NAMEPA, New York Maritime, Inc. (NYMAR), Ship2Shore, TradeWinds, WISTA USA, Worldoils
ABOUT THE ORGANIZER – CAPITAL LINK, INC.
Capital Link is a New York-based Investor Relations and Financial Communications firm. Capitalizing on its in-depth knowledge of the shipping industry and capital markets, Capital Link has made a strategic commitment to the industry, becoming the largest provider of Investor Relations and Financial Communications services to international shipping companies listed on the US and European Exchanges. Capital Link’s
PANEL DISCUSSIONS & PRESENTATIONS
A networking cocktail reception took place after the forum.
headquarters are in New York with a presence in London and Athens. Capital Link is a member of the Baltic Exchange.
Magnus Fyhr (Clarkson Capital Markets) delivers a presentation on “Investment Opportunities in Shipping Today.”
Members of the “Analyst Panel” Investor Attitudes in Shipping & Shipping Markets Outlook” from left to right: Douglas Mayvrinac (Jefferies & Co.), Michael S. Pak (Clarkson Capital Markets), and Daniel Rodgers (Watson, Farley & Williams LLP.
“Chapter 11: Safe Haven or Bermuda Triangle?” from left to right: Steve Strom (Jefferies & Co.), John Asmead (Seward & Kissel LLP), and Robert G. Burns (Bracewell & Giuliani LLP.
“Shipping & Bank Financing” from left to right: Ronny Bjørnådal (Nordea Bank), Evan Cohen (DVB Group), Gust Biesbroeck (ABN AMRO), and Emil Yiannopoulos (PwC Greece).
Capital Link, Inc.230 Park Avenue, Suite 1536New York, NY 10169T: (212) 661-7566 | F: (212) 661-7526www.capitallinkshipping.com | forums.capitallink.com

Monday, April 2, 2012 (Week 14)Capital Link Shipping Weekly Markets Report
Page 7
IN THE NEWS
Monday, March 26, 2012
Scorpio Tankers Inc. Announces Agreement to Construct One Newbuilding
Scorpio Tankers Inc. (NYSE: STNG) announced that it has signed a contract with Hyundai Mipo Dockyard Co., Ltd. of South Korea (“HMD”) to construct a 52,000 DWT MR product tanker for $36.0 million, which is the Company’s eighth 52,000 DWT MR product tanker newbuilding with HMD. The eighth newbuilding is scheduled to be delivered to the Company in May 2013.
Tuesday, March 27, 2012
Hercules Offshore Prices Private Placement of Senior Secured Notes and Senior Notes
Hercules Offshore, Inc. (Nasdaq: HERO) announced that it has priced a private placement of $300,000,000 aggregate principal amount of senior secured notes due 2017 (the “secured notes”), which will bear an interest rate of 7.125% per annum. The Company also announced that it has priced a private placement of $200,000,000 aggregate principal amount of senior notes due 2019 (the “unsecured notes” and, together with the secured notes, the “notes”), which will bear an interest rate of 10.25% per annum. The notes are being sold at par. Hercules Offshore expects to use the net proceeds from the notes offering to repay all of the indebtedness outstanding under our existing secured term loan. As a result of the repayment of our term loan, our outstanding 10.5% Senior Secured Notes will become unsecured. The Company expects to use the remaining net proceeds for general corporate purposes, including to fund a portion of the purchase price for the previously announced acquisition of the drilling rig Ocean Columbia as well as the costs associated with the repair, upgrade and mobilization of the Ocean Columbia.
Wednesday, March 28, 2012
Euroseas Ltd. Announces New Acquisition for Its Joint Venture Euromar LLC
Euroseas Ltd., (NASDAQ: ESEA) announced that its joint venture, Euromar LLC (“Euromar”), signed a memorandum of agreement to purchase the M/V Cap Norte, a gearless containership of 41,850 dwt and 3,091 teu built in 2007 in Poland. M/V Cap Norte comes with a 3-year time charter at about $17,500 per day to a first class charterer. M/V Cap Norte, to be renamed EM Kea, is expected to be delivered not later than June 16, 2012.
Thursday, March 29, 2012
Diana Shipping Inc. Signs Shipbuilding Contracts for the Purchase of Two Ice Class Panamax Dry Bulk Carriers
Diana Shipping Inc. (NYSE:DSX) announced that it has signed, through separate wholly-owned subsidiaries, two shipbuilding contracts with China Shipbuilding Trading Company, Limited and Jiangnan Shipyard (Group) Co., Ltd, for the construction of two Ice Class Panamax dry bulk carriers of approximately 76,000 dwt
each for a contract price of US$29 million per vessel. The Company expects to take delivery of the vessels during the fourth quarter of 2013. Excluding the two vessels described above and the previously announced Newcastlemax new-building dry bulk carrier that is expected to be delivered during the second quarter of 2012, Diana Shipping Inc.’s fleet currently consists of 26 dry bulk carriers (16 Panamax, 1 Post-Panamax, 8 Capesize and 1 Newcastlemax) with a weighted average age of 6 years.
Friday, March 30, 2012
Vantage Drilling Announces Proposed Offering by Its Subsidiary Offshore Group Investment Limited of Additional 11 1/2% Senior Secured First Lien Notes Due 2015
Vantage Drilling Company (AMEX: VTG) announced that its wholly-owned subsidiary Offshore Group Investment Limited (the “Issuer”) intends to offer, subject to market and other conditions, $775.0 million in aggregate principal amount of 11 1/2% Senior Secured First Lien Notes due 2015 (the “Notes”). The Notes will be offered as additional notes under an existing indenture pursuant to which the Issuer previously issued $1.0 billion aggregate principal amount of 11 1/2% Senior Secured First Lien Notes due 2015 in July 2010 and an additional $225.0 million aggregate principal amount of 11 1/2% Senior Secured First Lien Notes due 2015 in June 2011. The Notes will be guaranteed by Vantage and each of the Issuer’s existing and future subsidiaries and by certain of Vantage’s other subsidiaries and will be senior secured obligations of the Issuer and the guarantors.
Navios Maritime Holdings Inc. Announces Delivery of One Newbuild Kamsarmax Vessel
Navios Maritime Holdings Inc. (“Navios Holdings”) (NYSE: NM ) announced that the Navios Centaurus, a new building Kamsarmax vessel of 81,472 dwt, was delivered today from a South Korean shipyard to Navios Holdings’ owned fleet. The vessel is chartered-out for 2 years at a net rate of $12,825 per day. It is anticipated that the Navios Centaurus will generate annual EBITDA of $3.0 million and aggregate EBITDA of $6.0 million over the life of the charter contract.
Diana Shipping Inc. Announces the Acquisition of a Panamax Dry Bulk Carrier
Diana Shipping Inc. (NYSE:DSX) announced that it has signed, through a separate wholly-owned subsidiary, a Memorandum of Agreement to purchase from an unaffiliated third party the m/v “Mining Star”, a 2005 built Panamax dry bulk carrier of 76,225 dwt, for a price of US$20.65 million. The vessel, to be renamed “Melia”, is expected to be delivered to the Company by the sellers in mid-April 2012. Excluding the aforementioned vessel our fleet currently consists of 26 dry bulk carriers (16 Panamax vessels, 8 Capesize vessels, 1 Post-Panamax vessel and 1 Newcastlemax vessel), as well as 1 new building Newcastlemax vessel expected to be delivered to the Company during the second quarter of 2012 and 2 new building Ice Class Panamax vessels expected to be delivered to the Company during the fourth quarter of 2013. As of today, the combined carrying capacity of our current fleet, excluding the
Latest Company News

Monday, April 2, 2012 (Week 14)Capital Link Shipping Weekly Markets Report
Page 8
IN THE NEWS
four vessels not yet delivered, is 2.9 million dwt with a weighted average age of 6 years. A table describing the current Diana Shipping Inc. fleet can be found on the Company’s website, www.dianashippinginc.com. Information contained on the Company’s website does not constitute a part of this press release.
Monday, April 02, 2012
Ocean Rig UDW Inc. Announces Acceptance by Petrobras of the Ocean Rig Mykonos
Ocean Rig UDW Inc. (NASDAQ: ORIG) announced that on March 22, 2012, the Ocean Rig Mykonos completed the general testing of equipment as required by Petroleo Brazilieiro S.A., and has commenced revenue-generating drilling operations in Brazil.
Navios Maritime Holdings Inc. Announces Acquisition of One Handysize Vessel and Favorable Financing of Acquired and Existing Vessels
Navios Maritime Holdings Inc. (NYSE: NM) announced that it has acquired the Navios Serenity, a 2011-built Handysize vessel of 34,718 DWT, for $26.0 million. The vessel was previously part of Navios Holdings’ long-term chartered-in fleet. The improvement to cash flow, as a result of the replacement of the charter-in cost, is estimated at approximately $2.4 million on an annualized basis. The acquisition of Navios Serenity is financed by a new credit facility of up to $42.0 million with a syndicate of commercial banks. The new facility will also refinance the existing debt of Navios Astra due for repayment in 2013, thus eliminating refinancing risk for 2013. The new facility has a term of 8 years and is divided in two tranches having amortization profile of 18 and 14 years and margin of 2.85% and 3.6% respectively.
The leading specialist in international transport finance
www.dvbbank.com
Frankfurt/Main · Hamburg · London · Cardiff · Rotterdam · BergenOslo · Piraeus · Zurich · Singapore · Tokyo · New York · Curaçao
0611_DVB-Anz_half-page_quer.indd 1 07.06.11 13:25

Monday, April 2, 2012 (Week 14)Capital Link Shipping Weekly Markets Report
Page 9
IN THE NEWS
Select Dividend Paying Shipping Stocks
Get your message across to
36,000 weekly recipients around the globeJoin a select group of shipping & financial industry’s advertisers by promoting your brand with
Capital Link’s Shipping Weekly Markets Report.
For additional advertising information and a media kit, please contact/email:
Nicolas Bornozis at +1 212 661-7566, [email protected]
Company Name Ticker Quarterly Dividend
Annualized Dividend
Last Closing Price (MAR-30, 2012)
Annualized Dividend Yield
Containers Costamare Inc CMRE $0.27 * $1.08 $13.77 7.84% Dry Bulk Globus Maritime Limited GLBS $0.16 $0.64 $5.08 12.60% Navios Maritime Holdings Inc NM $0.06 $0.24 $4.20 5.71% Navios Maritime Partners NMM $0.44 $1.76 $16.67 10.56% Safe Bulkers Inc SB $0.15 $0.60 $6.68 8.98% Star Bulk Carriers Corp SBLK $0.015 $0.06 $0.90 6.67% Tankers Capital Product Partners Lp CPLP $0.2325 $0.93 $8.11 11.47% Navios Maritime Acquisition Corp NNA $0.05 $0.20 $3.26 6.13% Tsakos Energy Navigation Ltd TNP $0.15 $0.60 $8.68 6.91% Mixed Fleet Euroseas Ltd ESEA $0.05 $0.20 $2.28 8.77%
London Listed Companies (Great British Pence) Ticker
2011 Total Dividend
Last Closing Price (MAR-30, 2012)
Annualized Dividend Yield
Goldenport Holdings GPRT 6.00 81.75 7.34%
*Board approved an eight percent (8%) dividend increase, beginning with the third quarter 2011 dividend, raising the quarterly dividend from $0.25 to $0.27 per common share.


Monday, April 2, 2012 (Week 14)Capital Link Shipping Weekly Markets Report
Page 11
CAPITAL MARKETS DATA
Currencies, Commodities & IndicesWeek ending Friday, March 30, 2012
KEY CURRENCY RATES
Rate Current Price Price Last Week % Change YTD %Chg 52 Week High 52 Wk Low 3-Month LIBOR 0.4682 0.4732 -1.07% -19.63% 0.5393 0.2844 10-Yr US Treas. Yield 2.2124 2.2317 -0.86% 13.61% 3.3190 2.3833 USD/EUR 0.7494 0.7537 -0.57% -2.19% 0.7920 0.6694 USD/GBP 0.6250 0.6301 -0.81% -2.18% 0.6563 0.5972 USD/JPY 82.0800 82.6300 -0.67% 7.07% 85.5300 75.3800 USD/CNY 6.2962 6.3001 -0.06% 0.00% 6.5480 6.2870
PRECIOUS METALS
Current Price Price Last Week % Change YTD %Chg 52 Week High 52 Wk Low Gold 1,663.65 1,651.25 0.75% 3.89% 1,921.15 1,428.15 Silver 32.42 31.72 2.20% 10.30% 49.79 26.07 Platinum 1,646.25 1,623.75 1.39% 15.61% 1,916.75 1,344.25 Copper 382.65 380.80 0.49% 8.45% 452.60 305.00 Palladium 653.40 658.75 -0.81% -1.52% 773.60 583.25
KEY AGRICULTURAL & CONSUMER COMMODITIES
Current Price Price Last Week % Change YTD %Chg 52 Week High 52 Wk Low Corn 644.00 646.50 -0.39% -2.20% 793.00 584.50 Soybeans 1,403.00 1,365.75 2.73% 14.30% 1,468.50 1,115.50 Wheat 660.75 654.25 0.99% 0.57% 975.00 597.50 Cocoa 2,219.00 2,307.00 -3.81% 4.92% 3,367.00 2,005.00 Coffee 182.45 178.75 2.07% -19.70% 311.55 174.45
Cotton 93.52 89.63 4.34% -2.38% 125.37 84.23 Sugar #11 24.71 25.63 -3.59% 0.82% 27.03 21.00
KEY FUTURES
Commodities Current Price Price Last Week % Change YTD %Chg 52 Week High 52 Wk Low Gas Oil 1,012.00 1,026.25 -1.39% 6.89% 1,045.75 810.75 WTI Crude 103.06 106.80 -3.50% 0.10% 113.40 76.53 Natural Gas 2.12 2.27 -6.70% -29.23% 4.98 2.07
Heating Oil 316.84 320.77 -1.23% 4.29% 331.27 258.00
Gasoline RBOB 338.99 338.64 0.10% 23.33% 341.18 247.07

Monday, April 2, 2012 (Week 14)Capital Link Shipping Weekly Markets Report
Page 12
CAPITAL MARKETS DATA
Currencies, Commodities & IndicesMAJOR INDICES
Index Symbol Close Last Week % Change YTD % Change 4-Jan-12
Dow Jones INDU 13,212.04 13,080.73 1.00% 6.57% 12,720.48
Dow Jones Transp. TRAN 5,253.16 5,217.82 0.68% 3.70% 5,280.75
NASDAQ CCMP 3,091.57 3,067.92 0.77% 16.72% 2,786.70
NASDAQ Transp. CTRN 2,424.47 2,403.42 0.88% 10.80% 2,297.32
S&P 500 SPX 1,408.47 1,397.11 0.81% 10.29% 1,315.38
Russell 2000 Index RTY 830.30 830.03 0.03% 10.37% 784.62
Amex Oil Index XOI 1,267.37 1,283.12 -1.23% 0.52% 1,273.79
FTSE 100 Index UKX 5,768.45 5,854.89 -1.48% 1.20% 5,728.55
CAPITAL LINK MARITIME INDICES
Index Symbol 30-March-12 23-March-12 % Change 4-Jan-12 YTD % Change
Capital Link Maritime Index CLMI 2,196.69 2,185.23 0.52% 2,185.20 0.53% Tanker Index CLTI 2,196.56 2,150.13 2.16% 1,888.57 16.31% Drybulk Index CLDBI 717.67 708.33 1.32% 661.81 8.44% Container Index CLCI 1,216.36 1,222.87 -0.53% 1,112.58 9.33% LNG/LPG Index CLLG 3,775.44 3,774.34 0.03% 3,810.14 -0.91% Mixed Fleet Index CLMFI 1,401.64 1,376.82 1.80% 1,030.58 36.00% MLP Index CLMLP 3,126.23 3,137.23 -0.35% 2,755.12 13.47%
BALTIC INDICES
Index Symbol 30-March-12 23-March-12 % Change 4-Jan-12 YTD % Change Baltic Dry Index BDIY 934 908 2.86% 1,624 -42.49% Baltic Capesize Index BCIY 1,412 1,369 3.14% 2,955 -52.22% Baltic Panamax Index BPIY 1,051 1,036 1.45% 1,619 -35.08%
Baltic Supramax Index BSI 1,030 1,035 -0.48% 1,158 -11.05% Baltic Handysize Index BHSI 565 551 86.93% 570 80.70%
Baltic Dirty Tanker Index BDTI 818 809 1.11% 783 4.47% Baltic Clean Tanker Index BCTI 642 650 -1.23% 762 -15.75%
Monday, April 2, 2012 (Week 14)Capital Link Shipping Weekly Markets Report
Page 13
CAPITAL MARKETS DATA
Shipping Equities: The Week in Review
MARITIME INDEX DAILY COMPARISON CHARTS (52 WEEK)*
CAPITAL LINK TANKER INDEX DAILY COMPARISON CHARTS
CAPITAL LINK DRY BULK INDEX DAILY COMPARISON CHARTS
*SOURCE: BLOOMBERG
0.700.750.800.850.900.951.001.051.101.15
Capital Link Maritime Index S&P 500 Russell 2000
0.350.500.650.800.951.101.251.401.55
Capital Link Drybulk Index Baltic Dry Index
0.500.700.901.101.301.501.701.90
Capital Link Tanker Index Baltic Clean Tanker Index Baltic Dirty Tanker Index
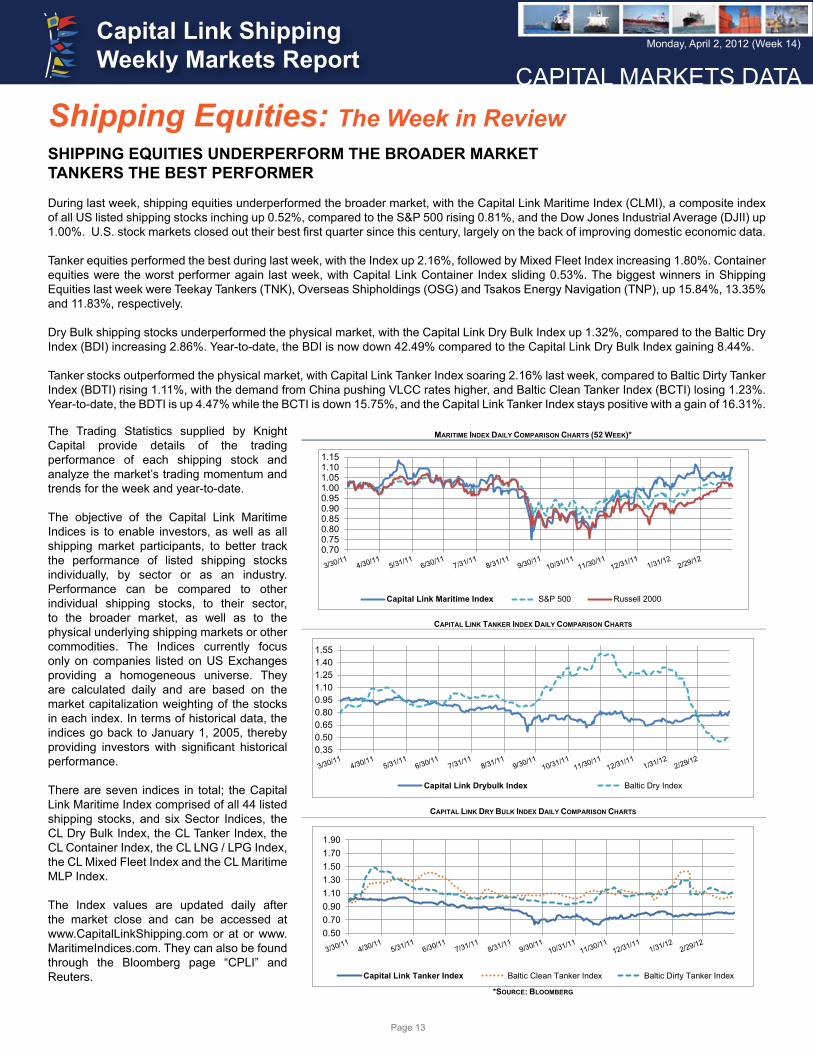
SHIPPING EQUITIES UNDERPERFORM THE BROADER MARKETTANKERS THE BEST PERFORMER
During last week, shipping equities underperformed the broader market, with the Capital Link Maritime Index (CLMI), a composite index of all US listed shipping stocks inching up 0.52%, compared to the S&P 500 rising 0.81%, and the Dow Jones Industrial Average (DJII) up 1.00%. U.S. stock markets closed out their best first quarter since this century, largely on the back of improving domestic economic data.
Tanker equities performed the best during last week, with the Index up 2.16%, followed by Mixed Fleet Index increasing 1.80%. Container equities were the worst performer again last week, with Capital Link Container Index sliding 0.53%. The biggest winners in Shipping Equities last week were Teekay Tankers (TNK), Overseas Shipholdings (OSG) and Tsakos Energy Navigation (TNP), up 15.84%, 13.35% and 11.83%, respectively.
Dry Bulk shipping stocks underperformed the physical market, with the Capital Link Dry Bulk Index up 1.32%, compared to the Baltic Dry Index (BDI) increasing 2.86%. Year-to-date, the BDI is now down 42.49% compared to the Capital Link Dry Bulk Index gaining 8.44%.
Tanker stocks outperformed the physical market, with Capital Link Tanker Index soaring 2.16% last week, compared to Baltic Dirty Tanker Index (BDTI) rising 1.11%, with the demand from China pushing VLCC rates higher, and Baltic Clean Tanker Index (BCTI) losing 1.23%. Year-to-date, the BDTI is up 4.47% while the BCTI is down 15.75%, and the Capital Link Tanker Index stays positive with a gain of 16.31%.
The Trading Statistics supplied by Knight Capital provide details of the trading performance of each shipping stock and analyze the market’s trading momentum and trends for the week and year-to-date.
The objective of the Capital Link Maritime Indices is to enable investors, as well as all shipping market participants, to better track the performance of listed shipping stocks individually, by sector or as an industry. Performance can be compared to other individual shipping stocks, to their sector, to the broader market, as well as to the physical underlying shipping markets or other commodities. The Indices currently focus only on companies listed on US Exchanges providing a homogeneous universe. They are calculated daily and are based on the market capitalization weighting of the stocks in each index. In terms of historical data, the indices go back to January 1, 2005, thereby providing investors with significant historical performance.
There are seven indices in total; the Capital Link Maritime Index comprised of all 44 listed shipping stocks, and six Sector Indices, the CL Dry Bulk Index, the CL Tanker Index, the CL Container Index, the CL LNG / LPG Index, the CL Mixed Fleet Index and the CL Maritime MLP Index.
The Index values are updated daily after the market close and can be accessed at www.CapitalLinkShipping.com or at or www.MaritimeIndices.com. They can also be found through the Bloomberg page “CPLI” and Reuters.

FROM DEEP SEA TO DEEP KNOWLEDGE
In a volatile world market, a bank with global presence and staying power is rare. ABN AMRO has been fi nancing this sector since 1720. Many clients
have been with us for decades because our support goes beyond dollars. A stable team of sector specialists with the experience to advise you on
funding diversifi cation and strategic capital management, we offer a complete product range and the industry know-how to develop creative solutions.
Add fast decision-making, fl awless execution, and integrated risk and portfolio management, and you can see why companies tend to stay with us for
the long haul. For more on how our Transportation team could support your business, visit abnamro.com/ect
ABN ECT_Adv_1-1_Transport 210x280_WT.indd 1 07-02-12 11:41

Monday, April 2, 2012 (Week 14)Capital Link Shipping Weekly Markets Report
Page 15
CAPITAL MARKETS DATA
Weekly Trading Statistics
Custom Statistics Prepared Weekly for Capital Link Shipping
BROAD MARKET Percent Change of Major Indexes for the Week Ending Friday, March 30, 2012 Name Symbol Close Net Gain Percent Gain Dow Jones Industrial Average Index INDU 13212.04 131.31 1.00% Nasdaq-100 Index NDX 2755.27 26.72 0.98% Nasdasq Transportation Index TRANX 2424.47 21.05 0.88% S&P 500 Index SPX 1408.47 11.36 0.81% Russell 1000 Index RUI 778.91 5.98 0.77% Nasdaq Composite Index COMPX 3091.57 23.65 0.77% Russell 3000 Index RUA 834.08 5.94 0.72% Dow Jones Transportation Index TRAN 5253.16 35.34 0.68% Phlx Semiconductor Sector Index SOX 438.62 2.94 0.67% Russell 2000 Index RUT 830.39 0.36 0.04%
Index Data: INDU (Dow Jones Industrial Average Index. The INDU closed today at 13,212.04 for a weekly gain of 131.31 pts (+1.0038%). The high of the week was 13,298.96 while the low was 12,993.84 (close = 71.51% of high/low range). The INDU closed 0.90% from its 52 week high (13,331.77) and 27.50% from its 52 week low (10,362.26).
INDU Important Moving Averages
50 Day: 12,941.46 100 Day: 12,505.06 200 Day: 12,092.72
SHIPPING INDUSTRY DATA (50 Companies) Moving Averages
48.84% closed > 10D Moving Average. 72.09% closed > 50D Moving Average. 76.74% closed > 100D Moving Average. 69.77% closed > 200D Moving Average.
Top Upside Momentum (Issues with the greatest 100 day upside momentum*)
Top Downside Momentum (Issues with the greatest 100 day downward momentum*)
Symbol Close Weekly % Change
50-Day % Change
NEWL 1.77 41.60% 185.48% FREE 1.08 -16.28% 151.16% GSL 3.46 2.06% 81.15% FRO 7.1 -7.19% 57.43% GASS 6.14 4.07% 47.60% EGLE 1.8 2.27% 66.67% TNP 7.8 4.98% 48.01% SFL 15.05 -3.90% 50.50% TK 33.13 1.56% 29.57% DRYS 3.38 -7.14% 51.57%
*Momentum: (100D % change) + 1.5*(50D % change) + 2.0*(10D % change) for each stock then sort group in descending order and report the top 10.
Symbol Close Weekly % Change
50-Day % Change
TRMD 0.64 0.00% -8.57% ESEA 2.28 -2.56% -17.99% GNK 6.34 -1.86% -12.07% SBLK 0.9 -4.26% -3.23% DHT 0.96 -6.80% 26.32% BALT 4.16 4.52% -3.48% CMRE 13.77 -2.27% -6.33% VLCCF 14.38 0.28% 0.14% OSG 12.65 13.35% -4.53% EXM 2.00 4.71% 27.39%
*Momentum: (100D % change) + 1.5*(50D % change) + 2.0*(10D % change) for each stock - sort names that have a negative value in ascending order - report the top 10.

Monday, April 2, 2012 (Week 14)Capital Link Shipping Weekly Markets Report
Page 16
CAPITAL MARKETS DATA
Weekly Trading StatisticsTop Consecutive Higher Closes Top Consecutive Lower Closes
Symbol Close Up Streak NAT 15.88 6 SSW 17.34 4 FRO 7.7 4 NMM 16.67 3 ANW 6.93 3 DAC 3.94 3 EXM 2 2 DRYS 3.48 2 SB 6.68 2 VLCCF 14.38 2
Symbol Close Down Streak SFL 15.31 -2 SHIP 3.32 -2 STNG 7.08 -2 TEU 8.64 -4 TGP 39.08 -4
Top Largest Weekly Trading Gains Top Largest Weekly Trading Losses
Symbol Close One Week Ago
Friday Close
Net Change
% Change
TNK 5.24 6.07 0.83 15.84% OSG 11.16 12.65 1.49 13.35% TNP 7.78 8.7 0.92 11.83% DAC 3.56 3.94 0.38 10.67% FRO 7.14 7.7 0.56 7.84% EGLE 1.8 1.94 0.14 7.78% TOPS 2.17 2.33 0.16 7.37% NAT 14.79 15.88 1.09 7.37% TK 33.1 34.75 1.65 4.98% EXM 1.91 2 0.09 4.71%
Symbol Close One Week Ago
Friday Close
Net Change % Change
NEWL 1.77 1.4 -0.37 -20.90% DHT 1.03 0.96 -0.07 -6.80% SHIP 3.55 3.32 -0.23 -6.48% SBLK 0.94 0.9 -0.04 -4.26% NNA 3.4 3.26 -0.14 -4.12% GASS 6.14 5.9 -0.24 -3.91% TEU 8.9 8.64 -0.26 -2.92% FREE 1.08 1.05 -0.03 -2.78% ESEA 2.34 2.28 -0.06 -2.56% PRGN 0.84 0.82 -0.02 -2.38%
Top Largest Monthly Trading Gains (A month has been standardized to 20 trading days)
Top Largest Monthly Trading*Losses (A month has been standardized to 20 trading days)
Symbol Prior Close
Friday Close
Net Change % Change
NEWL 0.85 1.4 0.55 64.71% OSG 8.59 12.65 4.06 47.26% GSL 2.4 3.5 1.10 45.83% FRO 5.44 7.7 2.26 41.54% TNK 4.41 6.07 1.66 37.64% TNP 6.46 8.7 2.24 34.67% EGLE 1.5 1.94 0.44 29.33% TK 28.93 34.75 5.82 20.12% GASS 5.02 5.9 0.88 17.53% SFL 13.05 15.31 2.26 17.32%
Symbol Prior Close
Friday Close Net Change %
Change FREE 1.25 1.05 -0.20 -16.00% SSW 19.48 17.34 -2.14 -10.99% ESEA 2.55 2.28 -0.27 -10.59% GLNG 42.46 38.05 -4.41 -10.39% NNA 3.61 3.26 -0.35 -9.70% SB 7.32 6.68 -0.64 -8.74% DHT 1.05 0.96 -0.09 -8.57% GLBS 5.43 5.08 -0.35 -6.45% DAC 4.21 3.94 -0.27 -6.41% DCIX 6.45 6.04 -0.41 -6.36%
Stocks Nearest to 52-Week Highs Stocks Nearest To 52-Week Lows Symbol 52W High % Away TGP 40.44 -3.36% TOO 30.14 -3.98% TK 36.29 -4.24% GMLP 39.05 -4.94% ALEX 54.01 -10.26% SSW 20.24 -14.31% NMM 19.48 -14.45% TNP 10.22 -14.89% NNA 3.93 -16.98% GASS 7.20 -18.06%
Symbol 52W Low % Away SBLK 0.85 5.85% ESEA 2.11 7.92% VLCCF 13.04 10.24% BALT 3.46 20.26% TRMD 0.52 23.08% CMRE 10.51 31.07% SB 5.06 31.92% NNA 2.42 34.69% DSX 6.59 35.81% TOO 21.24 36.23%
Monday, April 2, 2012 (Week 14)Capital Link Shipping Weekly Markets Report
Page 17
CAPITAL MARKETS DATA
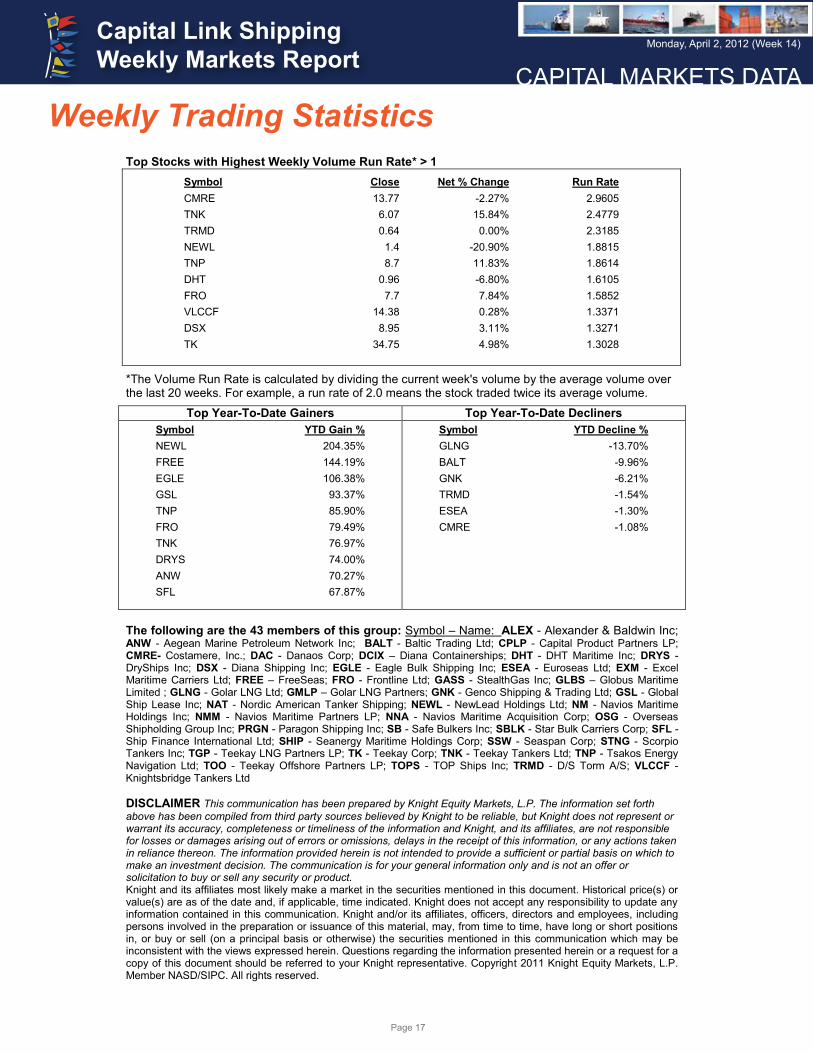
Weekly Trading StatisticsTop Stocks with Highest Weekly Volume Run Rate* > 1
Symbol Close Net % Change Run Rate CMRE 13.77 -2.27% 2.9605 TNK 6.07 15.84% 2.4779 TRMD 0.64 0.00% 2.3185 NEWL 1.4 -20.90% 1.8815 TNP 8.7 11.83% 1.8614 DHT 0.96 -6.80% 1.6105 FRO 7.7 7.84% 1.5852 VLCCF 14.38 0.28% 1.3371 DSX 8.95 3.11% 1.3271 TK 34.75 4.98% 1.3028
*The Volume Run Rate is calculated by dividing the current week's volume by the average volume over the last 20 weeks. For example, a run rate of 2.0 means the stock traded twice its average volume.
Top Year-To-Date Gainers Top Year-To-Date Decliners Symbol YTD Gain % NEWL 204.35% FREE 144.19% EGLE 106.38% GSL 93.37% TNP 85.90% FRO 79.49% TNK 76.97% DRYS 74.00% ANW 70.27% SFL 67.87%
Symbol YTD Decline % GLNG -13.70% BALT -9.96% GNK -6.21% TRMD -1.54% ESEA -1.30% CMRE -1.08%
The following are the 43 members of this group: Symbol – Name: ALEX - Alexander & Baldwin Inc; ANW - Aegean Marine Petroleum Network Inc; BALT - Baltic Trading Ltd; CPLP - Capital Product Partners LP; CMRE- Costamere, Inc.; DAC - Danaos Corp; DCIX – Diana Containerships; DHT - DHT Maritime Inc; DRYS - DryShips Inc; DSX - Diana Shipping Inc; EGLE - Eagle Bulk Shipping Inc; ESEA - Euroseas Ltd; EXM - Excel Maritime Carriers Ltd; FREE – FreeSeas; FRO - Frontline Ltd; GASS - StealthGas Inc; GLBS – Globus Maritime Limited ; GLNG - Golar LNG Ltd; GMLP – Golar LNG Partners; GNK - Genco Shipping & Trading Ltd; GSL - Global Ship Lease Inc; NAT - Nordic American Tanker Shipping; NEWL - NewLead Holdings Ltd; NM - Navios Maritime Holdings Inc; NMM - Navios Maritime Partners LP; NNA - Navios Maritime Acquisition Corp; OSG - Overseas Shipholding Group Inc; PRGN - Paragon Shipping Inc; SB - Safe Bulkers Inc; SBLK - Star Bulk Carriers Corp; SFL - Ship Finance International Ltd; SHIP - Seanergy Maritime Holdings Corp; SSW - Seaspan Corp; STNG - Scorpio Tankers Inc; TGP - Teekay LNG Partners LP; TK - Teekay Corp; TNK - Teekay Tankers Ltd; TNP - Tsakos Energy Navigation Ltd; TOO - Teekay Offshore Partners LP; TOPS - TOP Ships Inc; TRMD - D/S Torm A/S; VLCCF - Knightsbridge Tankers Ltd DISCLAIMER This communication has been prepared by Knight Equity Markets, L.P. The information set forth above has been compiled from third party sources believed by Knight to be reliable, but Knight does not represent or warrant its accuracy, completeness or timeliness of the information and Knight, and its affiliates, are not responsible for losses or damages arising out of errors or omissions, delays in the receipt of this information, or any actions taken in reliance thereon. The information provided herein is not intended to provide a sufficient or partial basis on which to make an investment decision. The communication is for your general information only and is not an offer or solicitation to buy or sell any security or product. Knight and its affiliates most likely make a market in the securities mentioned in this document. Historical price(s) or value(s) are as of the date and, if applicable, time indicated. Knight does not accept any responsibility to update any information contained in this communication. Knight and/or its affiliates, officers, directors and employees, including persons involved in the preparation or issuance of this material, may, from time to time, have long or short positions in, or buy or sell (on a principal basis or otherwise) the securities mentioned in this communication which may be inconsistent with the views expressed herein. Questions regarding the information presented herein or a request for a copy of this document should be referred to your Knight representative. Copyright 2011 Knight Equity Markets, L.P. Member NASD/SIPC. All rights reserved.

Monday, April 2, 2012 (Week 14)Capital Link Shipping Weekly Markets Report
Page 18
CAPITAL MARKETS DATA
Shipping Bonds Contributed by
Shipping Relative Value Analysis
Amount Issue Next CallIssuer Coupon Issue Maturity Out Rating Price YTW STW Date Price
Shipping
12.500% Sr Sec Nts 07/15/17 $200 B2 / BB- 112.75 6.67% 634 bps 07/15/13 106.25
10.250% Sr Sec Nts 05/01/15 $258 B1 / B+ 105.00 7.59% 726 bps 05/03/12 105.13
7.500% Sr Un Nts 05/15/14 $400 NR/ CCC- 29.13 83.63% 8329 bps 05/15/12 103.7512.000% Sr Un Nts 02/10/15 $125 NR/ NR 25.07 268.32% 26799 bps nc nc
CMA CGM (CMACG)8.500% Sr Un Nts 04/15/17 $396 Caa2 / CCC /*- 62.50 20.90% 1987 bps 04/15/14 104.258.875% Sr Un Nts 04/15/19 $286 Caa2 / CCC /*- 62.13 18.80% 1915 bps 04/15/15 104.44
General Maritime (GMR)12.000% Sr Un Nts 11/15/17 $300 WR / CCC- 2.50 379.09% 37806 bps 11/15/13 106.00
8.040% Sr Sec Nts 02/01/19 $96 B2 / BB- /*- 86.50 10.89% 1114 bps nc nc
7.375% Sr Un Nts 02/01/19 $250 B3 / B 102.88 6.66% 563 bps 02/01/15 103.69DryShips (DRYS)
5.000% Conv Nts 12/01/14 $700 NR/ NR 84.20 12.13% 1180 bps nc ncExcel Maritime (EXM)
1.875% Conv Nts 10/15/27 $150 NR/ NR 47.46 34.77% 3443 bps 10/22/14 100.00Horizon Lines (HRZ)
11.000% Sr Sec Nts 10/15/16 $225 NR/ NR 101.50 9.43% 909 bps 10/15/12 101.506.000% Conv Nts 04/15/17 $179 NR/ NR 58.20 19.38% 1834 bps nc nc
10.875% Sr Sec Nts 01/15/17 $250 B3 / B- 105.50 9.11% 808 bps 01/15/13 108.16
8.625% Sr Sec Nts 11/01/17 $505 B2 / B 90.50 10.94% 991 bps 11/01/13 104.31Navios Maritime (NM)
8.875% Sr Sec Nts 11/01/17 $400 Ba3 / BB- 102.50 8.05% 756 bps 11/01/13 104.448.125% Sr Un Nts 02/15/19 $350 B3 / B+ 86.00 11.09% 889 bps 02/15/15 104.069.250% Sr Un Nts 04/15/19 $9 B3 / B+ 85.00 12.52% 1032 bps 04/15/14 106.94
8.750% Sr Un Nts 12/01/13 $64 Caa1 / B- 95.06 12.11% 1178 bps nc nc8.125% Sr Un Nts 03/30/18 $300 Caa1 / B- 64.00 18.26% 1722 bps nc nc7.500% Sr Un Nts 02/15/24 $146 Caa1 / B- 65.25 13.43% 1123 bps nc nc
Royal Caribbean (RCL)7.000% Sr Un Nts 06/15/13 $550 Ba1 / BB 104.50 3.13% 279 bps nc nc6.875% Sr Un Nts 12/01/13 $350 Ba1 / BB 106.50 2.83% 249 bps nc nc5.625% Sr Un Nts 01/27/14 $1,000 Ba1 / BB 101.25 4.88% 470 bps nc nc
11.875% Sr Un Nts 07/15/15 $300 Ba1 / BB 121.76 4.64% 414 bps nc nc7.250% Sr Un Nts 06/15/16 $350 Ba1 / BB 109.50 4.72% 369 bps nc nc7.250% Sr Un Nts 03/15/18 $150 Ba1 / BB 107.75 5.69% 466 bps nc nc7.500% Sr Un Nts 10/15/27 $300 Ba1 / BB 101.50 7.34% 401 bps nc nc
Ship Finance (SFL)8.500% Sr Un Nts 12/15/13 $296 B3 / B+ 100.13 6.71% 658 bps 05/03/12 100.006.310% Sr Un Nts 04/07/14 $500 NR/ NR NA NA NA 10/07/13 100.503.750% Sr Un Nts 02/10/16 $125 NR/ NR 83.38 9.17% 794 bps nc nc
Stena AB (STENA)7.000% Sr Un Nts 12/01/16 $129 Ba3 / BB+ 99.75 7.06% 603 bps 05/03/12 101.176.125% Sr Un Nts 02/01/17 $300 Ba3 / BB+ 97.40 6.76% 611 bps nc nc5.875% Sr Un Nts 02/01/19 $102 Ba3 / BB+ 88.46 8.11% 751 bps nc nc7.875% Sr Un Nts 03/15/20 $200 Ba3 / BB+ 96.61 8.47% 722 bps nc nc
Teekay Corp (TK)8.500% Sr Un Nts 01/15/20 $450 B2 / BB- 102.50 8.06% 586 bps nc nc
Trailer Bridge (TRBR)9.250% Sr Sec Nts 11/15/11 $83 WR / NR 75.00 12.33%
11.750% Sr Sec Nts 06/15/15 $164 B3 / B 101.50 10.73% 1040 bps 12/15/12 105.88
7.840% Sr Sec Nts 01/15/21 $217 Caa1 / B /*- NA NA NA nc nc
Supply Vessels
6.375% Sr Un Nts 03/15/22 $300 B1 / BB- 100.50 6.29% 409 bps 03/15/17 103.19
6.125% Sr Un Nts 12/01/14 $300 Ba3 / BB- 101.13 4.48% 442 bps 04/30/12 101.028.000% Sr Un Nts 09/01/17 $250 Ba3 / BB- 107.75 5.00% 467 bps 09/01/13 104.001.625% Conv Nts 11/15/26 $250 NR/ BB- 108.32 (3.36%) -369 bps 11/15/13 100.00
Seacor Holdings (CKH)5.875% Sr Un Nts 10/01/12 $171 Ba1 / BB+ 101.00 3.79% 362 bps nc nc7.375% Sr Un Nts 10/01/19 $234 Ba1 / BB+ 110.62 5.62% 342 bps nc nc
Source: Knight, Company Fillings, Bloomberg
Hornbeck Offshore Services (HOS)
Gulfmark Offshore (GMRK)
Windsor Petroleum (WINPET)
American Commercial (ACLI)
As of 04/02/12
Navios Maritime Acquisition (NNA)
Marquette Transportation (MARTRA)
Overseas Shipholding (OSG)
United Maritime (UNMTGR)
Great Lakes Dredge & Dock (GLDD)
Golden State Petro (GOLDEN)
Berlian Laju Tanker (BLTAIJ)
American Petroleum Tankers (AMPETR)
The current year to date high yield deal volume is $92.400 billion in 183 deals, compared to last year’s $88.942 billion in 207 deals. Of the 183 deals year to date, 136 of them were by U.S. Issuers and 170 of them were dollar denominated. The month to date high yield deal volume is $28.993 billion in 63 deals, compared to last year’s $31.009 billion in 72 deals for the same period. The default rate by number of issuers is 0.61% for March, versus 0.62% in February. The shadow default rate is 1.53%. On the high yield calendar there are $7.24 billion and €300 million deals being marketed. Data from EPFR Global reported an inflow to HY funds of $176 million for the week.
Horizon Lines, Inc has entered into restructuring agreements with holders. Under these agreements, the company’s remaining convertible senior secured notes will be converted into 90% of the company’s stock, or warrants for non-U.S. citizens.
Monday, April 2, 2012 (Week 14)Capital Link Shipping Weekly Markets Report
Page 19
CAPITAL MARKETS DATA
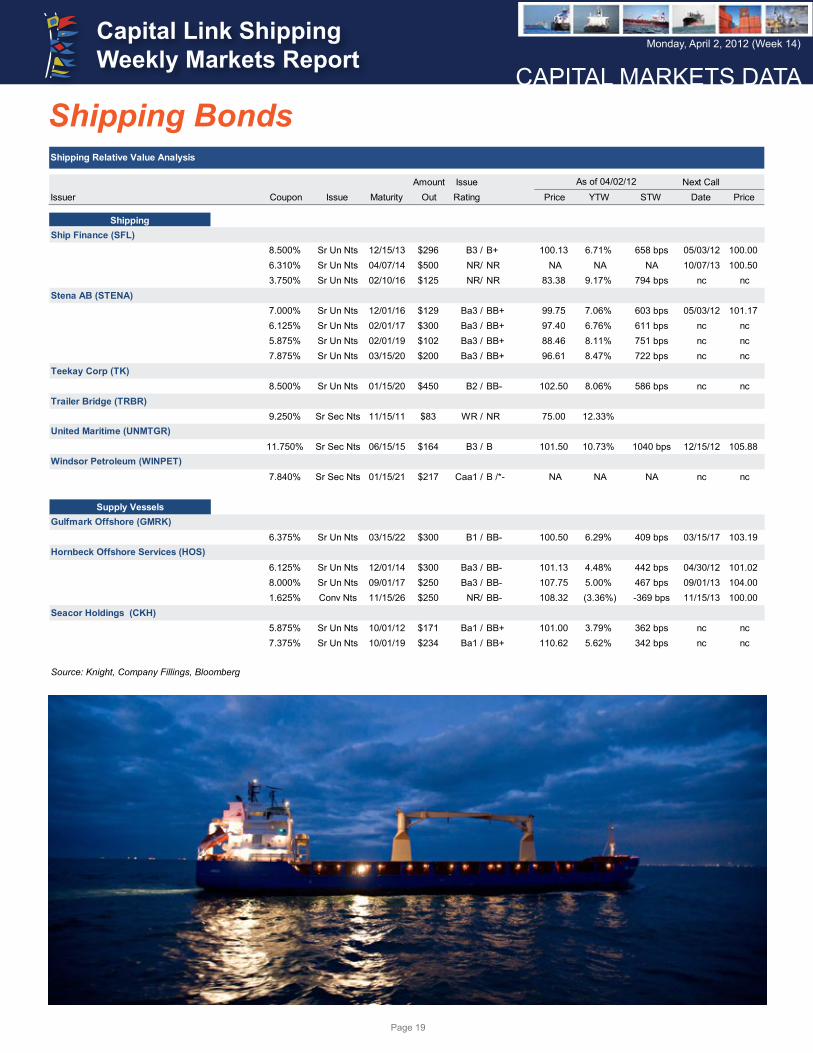
Shipping BondsShipping Relative Value Analysis
Amount Issue Next CallIssuer Coupon Issue Maturity Out Rating Price YTW STW Date Price
Shipping
12.500% Sr Sec Nts 07/15/17 $200 B2 / BB- 112.75 6.67% 634 bps 07/15/13 106.25
10.250% Sr Sec Nts 05/01/15 $258 B1 / B+ 105.00 7.59% 726 bps 05/03/12 105.13
7.500% Sr Un Nts 05/15/14 $400 NR/ CCC- 29.13 83.63% 8329 bps 05/15/12 103.7512.000% Sr Un Nts 02/10/15 $125 NR/ NR 25.07 268.32% 26799 bps nc nc
CMA CGM (CMACG)8.500% Sr Un Nts 04/15/17 $396 Caa2 / CCC /*- 62.50 20.90% 1987 bps 04/15/14 104.258.875% Sr Un Nts 04/15/19 $286 Caa2 / CCC /*- 62.13 18.80% 1915 bps 04/15/15 104.44
General Maritime (GMR)12.000% Sr Un Nts 11/15/17 $300 WR / CCC- 2.50 379.09% 37806 bps 11/15/13 106.00
8.040% Sr Sec Nts 02/01/19 $96 B2 / BB- /*- 86.50 10.89% 1114 bps nc nc
7.375% Sr Un Nts 02/01/19 $250 B3 / B 102.88 6.66% 563 bps 02/01/15 103.69DryShips (DRYS)
5.000% Conv Nts 12/01/14 $700 NR/ NR 84.20 12.13% 1180 bps nc ncExcel Maritime (EXM)
1.875% Conv Nts 10/15/27 $150 NR/ NR 47.46 34.77% 3443 bps 10/22/14 100.00Horizon Lines (HRZ)
11.000% Sr Sec Nts 10/15/16 $225 NR/ NR 101.50 9.43% 909 bps 10/15/12 101.506.000% Conv Nts 04/15/17 $179 NR/ NR 58.20 19.38% 1834 bps nc nc
10.875% Sr Sec Nts 01/15/17 $250 B3 / B- 105.50 9.11% 808 bps 01/15/13 108.16
8.625% Sr Sec Nts 11/01/17 $505 B2 / B 90.50 10.94% 991 bps 11/01/13 104.31Navios Maritime (NM)
8.875% Sr Sec Nts 11/01/17 $400 Ba3 / BB- 102.50 8.05% 756 bps 11/01/13 104.448.125% Sr Un Nts 02/15/19 $350 B3 / B+ 86.00 11.09% 889 bps 02/15/15 104.069.250% Sr Un Nts 04/15/19 $9 B3 / B+ 85.00 12.52% 1032 bps 04/15/14 106.94
8.750% Sr Un Nts 12/01/13 $64 Caa1 / B- 95.06 12.11% 1178 bps nc nc8.125% Sr Un Nts 03/30/18 $300 Caa1 / B- 64.00 18.26% 1722 bps nc nc7.500% Sr Un Nts 02/15/24 $146 Caa1 / B- 65.25 13.43% 1123 bps nc nc
Royal Caribbean (RCL)7.000% Sr Un Nts 06/15/13 $550 Ba1 / BB 104.50 3.13% 279 bps nc nc6.875% Sr Un Nts 12/01/13 $350 Ba1 / BB 106.50 2.83% 249 bps nc nc5.625% Sr Un Nts 01/27/14 $1,000 Ba1 / BB 101.25 4.88% 470 bps nc nc
11.875% Sr Un Nts 07/15/15 $300 Ba1 / BB 121.76 4.64% 414 bps nc nc7.250% Sr Un Nts 06/15/16 $350 Ba1 / BB 109.50 4.72% 369 bps nc nc7.250% Sr Un Nts 03/15/18 $150 Ba1 / BB 107.75 5.69% 466 bps nc nc7.500% Sr Un Nts 10/15/27 $300 Ba1 / BB 101.50 7.34% 401 bps nc nc
Ship Finance (SFL)8.500% Sr Un Nts 12/15/13 $296 B3 / B+ 100.13 6.71% 658 bps 05/03/12 100.006.310% Sr Un Nts 04/07/14 $500 NR/ NR NA NA NA 10/07/13 100.503.750% Sr Un Nts 02/10/16 $125 NR/ NR 83.38 9.17% 794 bps nc nc
Stena AB (STENA)7.000% Sr Un Nts 12/01/16 $129 Ba3 / BB+ 99.75 7.06% 603 bps 05/03/12 101.176.125% Sr Un Nts 02/01/17 $300 Ba3 / BB+ 97.40 6.76% 611 bps nc nc5.875% Sr Un Nts 02/01/19 $102 Ba3 / BB+ 88.46 8.11% 751 bps nc nc7.875% Sr Un Nts 03/15/20 $200 Ba3 / BB+ 96.61 8.47% 722 bps nc nc
Teekay Corp (TK)8.500% Sr Un Nts 01/15/20 $450 B2 / BB- 102.50 8.06% 586 bps nc nc
Trailer Bridge (TRBR)9.250% Sr Sec Nts 11/15/11 $83 WR / NR 75.00 12.33%
11.750% Sr Sec Nts 06/15/15 $164 B3 / B 101.50 10.73% 1040 bps 12/15/12 105.88
7.840% Sr Sec Nts 01/15/21 $217 Caa1 / B /*- NA NA NA nc nc
Supply Vessels
6.375% Sr Un Nts 03/15/22 $300 B1 / BB- 100.50 6.29% 409 bps 03/15/17 103.19
6.125% Sr Un Nts 12/01/14 $300 Ba3 / BB- 101.13 4.48% 442 bps 04/30/12 101.028.000% Sr Un Nts 09/01/17 $250 Ba3 / BB- 107.75 5.00% 467 bps 09/01/13 104.001.625% Conv Nts 11/15/26 $250 NR/ BB- 108.32 (3.36%) -369 bps 11/15/13 100.00
Seacor Holdings (CKH)5.875% Sr Un Nts 10/01/12 $171 Ba1 / BB+ 101.00 3.79% 362 bps nc nc7.375% Sr Un Nts 10/01/19 $234 Ba1 / BB+ 110.62 5.62% 342 bps nc nc
Source: Knight, Company Fillings, Bloomberg
Hornbeck Offshore Services (HOS)
Gulfmark Offshore (GMRK)
Windsor Petroleum (WINPET)
American Commercial (ACLI)
As of 04/02/12
Navios Maritime Acquisition (NNA)
Marquette Transportation (MARTRA)
Overseas Shipholding (OSG)
United Maritime (UNMTGR)
Great Lakes Dredge & Dock (GLDD)
Golden State Petro (GOLDEN)
Berlian Laju Tanker (BLTAIJ)
American Petroleum Tankers (AMPETR)
Shipping Relative Value Analysis
Amount Issue Next CallIssuer Coupon Issue Maturity Out Rating Price YTW STW Date Price
Shipping
12.500% Sr Sec Nts 07/15/17 $200 B2 / BB- 112.75 6.67% 634 bps 07/15/13 106.25
10.250% Sr Sec Nts 05/01/15 $258 B1 / B+ 105.00 7.59% 726 bps 05/03/12 105.13
7.500% Sr Un Nts 05/15/14 $400 NR/ CCC- 29.13 83.63% 8329 bps 05/15/12 103.7512.000% Sr Un Nts 02/10/15 $125 NR/ NR 25.07 268.32% 26799 bps nc nc
CMA CGM (CMACG)8.500% Sr Un Nts 04/15/17 $396 Caa2 / CCC /*- 62.50 20.90% 1987 bps 04/15/14 104.258.875% Sr Un Nts 04/15/19 $286 Caa2 / CCC /*- 62.13 18.80% 1915 bps 04/15/15 104.44
General Maritime (GMR)12.000% Sr Un Nts 11/15/17 $300 WR / CCC- 2.50 379.09% 37806 bps 11/15/13 106.00
8.040% Sr Sec Nts 02/01/19 $96 B2 / BB- /*- 86.50 10.89% 1114 bps nc nc
7.375% Sr Un Nts 02/01/19 $250 B3 / B 102.88 6.66% 563 bps 02/01/15 103.69DryShips (DRYS)
5.000% Conv Nts 12/01/14 $700 NR/ NR 84.20 12.13% 1180 bps nc ncExcel Maritime (EXM)
1.875% Conv Nts 10/15/27 $150 NR/ NR 47.46 34.77% 3443 bps 10/22/14 100.00Horizon Lines (HRZ)
11.000% Sr Sec Nts 10/15/16 $225 NR/ NR 101.50 9.43% 909 bps 10/15/12 101.506.000% Conv Nts 04/15/17 $179 NR/ NR 58.20 19.38% 1834 bps nc nc
10.875% Sr Sec Nts 01/15/17 $250 B3 / B- 105.50 9.11% 808 bps 01/15/13 108.16
8.625% Sr Sec Nts 11/01/17 $505 B2 / B 90.50 10.94% 991 bps 11/01/13 104.31Navios Maritime (NM)
8.875% Sr Sec Nts 11/01/17 $400 Ba3 / BB- 102.50 8.05% 756 bps 11/01/13 104.448.125% Sr Un Nts 02/15/19 $350 B3 / B+ 86.00 11.09% 889 bps 02/15/15 104.069.250% Sr Un Nts 04/15/19 $9 B3 / B+ 85.00 12.52% 1032 bps 04/15/14 106.94
8.750% Sr Un Nts 12/01/13 $64 Caa1 / B- 95.06 12.11% 1178 bps nc nc8.125% Sr Un Nts 03/30/18 $300 Caa1 / B- 64.00 18.26% 1722 bps nc nc7.500% Sr Un Nts 02/15/24 $146 Caa1 / B- 65.25 13.43% 1123 bps nc nc
Royal Caribbean (RCL)7.000% Sr Un Nts 06/15/13 $550 Ba1 / BB 104.50 3.13% 279 bps nc nc6.875% Sr Un Nts 12/01/13 $350 Ba1 / BB 106.50 2.83% 249 bps nc nc5.625% Sr Un Nts 01/27/14 $1,000 Ba1 / BB 101.25 4.88% 470 bps nc nc
11.875% Sr Un Nts 07/15/15 $300 Ba1 / BB 121.76 4.64% 414 bps nc nc7.250% Sr Un Nts 06/15/16 $350 Ba1 / BB 109.50 4.72% 369 bps nc nc7.250% Sr Un Nts 03/15/18 $150 Ba1 / BB 107.75 5.69% 466 bps nc nc7.500% Sr Un Nts 10/15/27 $300 Ba1 / BB 101.50 7.34% 401 bps nc nc
Ship Finance (SFL)8.500% Sr Un Nts 12/15/13 $296 B3 / B+ 100.13 6.71% 658 bps 05/03/12 100.006.310% Sr Un Nts 04/07/14 $500 NR/ NR NA NA NA 10/07/13 100.503.750% Sr Un Nts 02/10/16 $125 NR/ NR 83.38 9.17% 794 bps nc nc
Stena AB (STENA)7.000% Sr Un Nts 12/01/16 $129 Ba3 / BB+ 99.75 7.06% 603 bps 05/03/12 101.176.125% Sr Un Nts 02/01/17 $300 Ba3 / BB+ 97.40 6.76% 611 bps nc nc5.875% Sr Un Nts 02/01/19 $102 Ba3 / BB+ 88.46 8.11% 751 bps nc nc7.875% Sr Un Nts 03/15/20 $200 Ba3 / BB+ 96.61 8.47% 722 bps nc nc
Teekay Corp (TK)8.500% Sr Un Nts 01/15/20 $450 B2 / BB- 102.50 8.06% 586 bps nc nc
Trailer Bridge (TRBR)9.250% Sr Sec Nts 11/15/11 $83 WR / NR 75.00 12.33%
11.750% Sr Sec Nts 06/15/15 $164 B3 / B 101.50 10.73% 1040 bps 12/15/12 105.88
7.840% Sr Sec Nts 01/15/21 $217 Caa1 / B /*- NA NA NA nc nc
Supply Vessels
6.375% Sr Un Nts 03/15/22 $300 B1 / BB- 100.50 6.29% 409 bps 03/15/17 103.19
6.125% Sr Un Nts 12/01/14 $300 Ba3 / BB- 101.13 4.48% 442 bps 04/30/12 101.028.000% Sr Un Nts 09/01/17 $250 Ba3 / BB- 107.75 5.00% 467 bps 09/01/13 104.001.625% Conv Nts 11/15/26 $250 NR/ BB- 108.32 (3.36%) -369 bps 11/15/13 100.00
Seacor Holdings (CKH)5.875% Sr Un Nts 10/01/12 $171 Ba1 / BB+ 101.00 3.79% 362 bps nc nc7.375% Sr Un Nts 10/01/19 $234 Ba1 / BB+ 110.62 5.62% 342 bps nc nc
Source: Knight, Company Fillings, Bloomberg
Hornbeck Offshore Services (HOS)
Gulfmark Offshore (GMRK)
Windsor Petroleum (WINPET)
American Commercial (ACLI)
As of 04/02/12
Navios Maritime Acquisition (NNA)
Marquette Transportation (MARTRA)
Overseas Shipholding (OSG)
United Maritime (UNMTGR)
Great Lakes Dredge & Dock (GLDD)
Golden State Petro (GOLDEN)
Berlian Laju Tanker (BLTAIJ)
American Petroleum Tankers (AMPETR)

© September 2010 Knight Capital Group, Inc. All rights reserved.Knight Equity Markets, L.P. and Knight Capital Markets LLC are o�-exchange liquidity providers and members of FINRA and SIPC. To learn about Knight Capital Group, Inc. (NYSE Euronext: KCG) go to knight.com.
Knight Corporate Access is an unbiased service for issuers to
connect with institutional investors. Through a combination of
strategic investor introductions, thought leadership initiatives
and market insight, Knight can help strengthen and diversify a
company’s investor base.
Knight is the leading source of o�-exchange liquidity in U.S.
equities and has a greater share volume than any U.S. exchange.
For additional information,please contact:
Sandy Reddin
phone 212-455-9255email [email protected]
Monday, April 2, 2012 (Week 14)Capital Link Shipping Weekly Markets Report
Page 21
SHIPPING MARKETS
Dry Bulk Market - Weekly HighlightsContributed by
IntermodalIntermodal Shipbrokers Co.17th km Ethniki Odos Athens-Lamia & 3 Agrambelis Street,145 64 N. Kifisia,Athens - Greece
Phone: +30 210 6293300Website: www.intermodal.gr
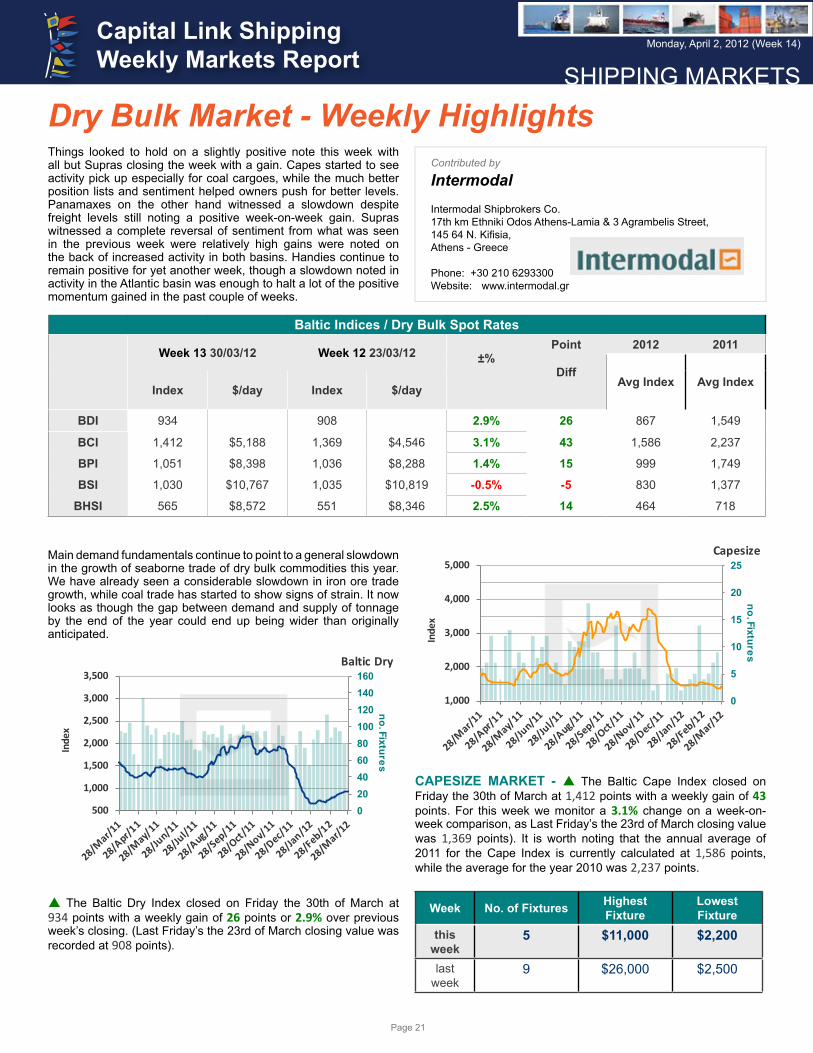
Things looked to hold on a slightly positive note this week with all but Supras closing the week with a gain. Capes started to see activity pick up especially for coal cargoes, while the much better position lists and sentiment helped owners push for better levels. Panamaxes on the other hand witnessed a slowdown despite freight levels still noting a positive week-on-week gain. Supras witnessed a complete reversal of sentiment from what was seen in the previous week were relatively high gains were noted on the back of increased activity in both basins. Handies continue to remain positive for yet another week, though a slowdown noted in activity in the Atlantic basin was enough to halt a lot of the positive momentum gained in the past couple of weeks.
Baltic Indices / Dry Bulk Spot Rates
Week 13 30/03/12 Week 12 23/03/12 ±%
Point
Diff
2012 2011
Avg Index Avg IndexIndex $/day Index $/day
BDI 934 908 2.9% 26 867 1,549
BCI 1,412 $5,188 1,369 $4,546 3.1% 43 1,586 2,237
BPI 1,051 $8,398 1,036 $8,288 1.4% 15 999 1,749
BSI 1,030 $10,767 1,035 $10,819 -0.5% -5 830 1,377
BHSI 565 $8,572 551 $8,346 2.5% 14 464 718
Main demand fundamentals continue to point to a general slowdown in the growth of seaborne trade of dry bulk commodities this year. We have already seen a considerable slowdown in iron ore trade growth, while coal trade has started to show signs of strain. It now looks as though the gap between demand and supply of tonnage by the end of the year could end up being wider than originally anticipated.
020406080100120140160
500
1,000
1,500
2,000
2,500
3,000
3,500
no. Fixtures
Inde
x
Baltic Dry
p The Baltic Dry Index closed on Friday the 30th of March at 934 points with a weekly gain of 26 points or 2.9% over previous week’s closing. (Last Friday’s the 23rd of March closing value was recorded at 908 points).
0
5
10
15
20
25
1,000
2,000
3,000
4,000
5,000
no. Fixtures
Inde
x
Capesize
CAPESIZE MARKET - p The Baltic Cape Index closed on Friday the 30th of March at 1,412 points with a weekly gain of 43 points. For this week we monitor a 3.1% change on a week-on-week comparison, as Last Friday’s the 23rd of March closing value was 1,369 points). It is worth noting that the annual average of 2011 for the Cape Index is currently calculated at 1,586 points, while the average for the year 2010 was 2,237 points.
Week No. of Fixtures Highest Fixture
Lowest Fixture
this week
5 $11,000 $2,200
last week
9 $26,000 $2,500

Monday, April 2, 2012 (Week 14)Capital Link Shipping Weekly Markets Report
Page 22
SHIPPING MARKETS
Dry Bulk Market - Weekly HighlightsWeek Period Charter Trip Charter
this week $11,000 $5,150last week $0 $11,278
For Week 13 we have recorded a total of 5 timecharter fixtures in the Capesize sector, 1 for period charter averaging $11,000 per day, while 4 trip charters were reported this week with a daily average of $5,150 per day.
This week’s fixture that received the lowest daily hire was the M/V ‘’E.R. BORNEO’’, 178000 dwt, built 2010, dely Amsterdam spot , redely Skaw-Cape Passero, $2200, Swiss Marine, for a transatlantic round -300$ reduced from last week, and the fixture with the highest daily hire was the M/V ‘’SUCCESSOR’’, 174000 dwt, built 2007, dely China 10/20 Apr , redely worldwide, $11000, Classic Maritime, for a 8/12 months trading -15000$ reduced from last week.
The BCI is showing a 3.1% rise on a weekly comparison, a -7.8% decrease on a 1 month basis, a -58.5% decrease on a 3 month basis, a -57.7% decrease on a 6 month basis and a -21.2% decrease on a 12 month basis.
0102030405060708090100
500
1,500
2,500
3,500
no. Fixtures
Inde
x
Panamax
PANAMAX MARKET - p The Baltic Panamax Index closed on Friday the 30th of March with a gain at 1,051 points having gained 15 points on a weekly comparison. It is worth noting that last Friday’s the 23rd of March saw the Panamax index close at 1,036 points. The week-on-week change for the Panamax index is calculated to be 1.4%, while the yearly average for the Baltic Panamax Index for this running year is calculated at 999 points while the average for 2010 was 1,749 points.
Week No. of Fixtures Highest Fixture
Lowest Fixture
this week
44 $17,500 $6,000
last week
36 $20,500 $6,500
Week Period Charter Trip Charterthis week $10,050 $10,471last week $9,880 $11,792
For Week 13 we have recorded a total of 44 timecharter fixtures in the Panamax sector, 3 for period charter averaging $10,050 per day, while 41 trip charters were reported this week with a daily average of $10,471 per day.
The daily earnings differential for the Panamaxes, that we calculate from all this week’s reported fixtures, i.e. the difference between the lowest and highest reported fixture for this week was reduced, and this week’s fixture that received the lowest daily hire was the M/V ‘’THEMIS P’’, 70165 dwt, built 1994, dely Chiwan 30/31Mar, redely India, $6000, PCL, for a trip via Indonesia -500$ reduced from last week, and the fixture with the highest daily hire was the M/V ‘’TORM PACIFIC’’, 77171 dwt, built 2009, dely Jorf Lasfar 31 Mar/4 Apr , redely Singapore-Japan, $17500, Cargill, for a trip via EC South America -3000$ reduced from last week.
The BPI is showing a 1.4% rise on a weekly comparison, a 26.3% rise on a 1 month basis, a -37.3% decrease on a 3 month basis, a -36.0% decrease on a 6 month basis and a -45.4% decrease on a 12 month basis.
05101520253035404550
500
1,000
1,500
2,000
2,500
no Fixtures
Inde
x
Supramax
SUPRAMAX & HANDYMAX MARKET - q The Baltic Supramax Index closed on Friday the 30th of March at 1,030 points down with a weekly loss of -5 points or -0.5% . The Baltic Supramax index on a weekly comparison is with a downward trend as last Friday’s the 23rd of March closing value was 1,035 points. The annual average of the BSI is recorded at 830 points while the average for 2010 was 1,377 points.
Week No. of Fixtures Highest Fixture
Lowest Fixture
this week
26 $19,000 $11,000
last week
28 $22,750 $5,500

Monday, April 2, 2012 (Week 14)Capital Link Shipping Weekly Markets Report
Page 23
SHIPPING MARKETS
Dry Bulk Market - Weekly HighlightsWeek Period Charter Trip Charter
this week $11,750 $13,874last week $12,288 $15,100
For Week 13 we have recorded a total of 26 timecharter fixtures in the Supramax & Handymax sector, 3 for period charter averaging $11,750 per day, while 23 trip charters were reported this week with a daily average of $13,874 per day.
The minimum vs maximum daily rate differential as analyzed from our fixtures database was overall reduced and from the reported fixtures we see that this week’s fixture that received the lowest daily hire was the M/V ‘’AMAMI K’’, 58613 dwt, built 2012, dely Karachi 6/10 April , redely China intention iron ore, $11000, KEC, for a trip 5500$ improved from last week, and the fixture with the highest daily hire was the M/V ‘’TOXOTIS’’, 56713 dwt, built 2010, dely dop Surabaya spot , redely India approx, $19000, Ultrabulk, for a trip via Indonesia -3750$ reduced from last week.
The BSI is showing a -0.5% decrease on a weekly comparison, a 44.7% rise on a 1 month basis, a -12.9% decrease on a 3 month basis, a -30.4% decrease on a 6 month basis and a -31.8% decrease on a 12 month basis.
024681012141618
250
500
750
1,000
no. Fixtures
Inde
x
Handysize
HANDYSIZE MARKET - p The Baltic Handysize Index closed on Friday the 30th of March with an upward trend at 565 points with a weekly gain of 14 points and a percentage change of 2.5%. It is noted that last Friday’s the 23rd of March closing value was 551 points and the average for 2011 is calculated at 464 points while the average for 2010 was 718 points.
Week No. of Fixtures Highest Fixture
Lowest Fixture
this week
6 $20,100 $9,000
last week
6 $12,700 $5,500
Week Period Charter Trip Charterthis week $0 $12,392last week $9,800 $10,220
For Week 13 we have recorded a total of 6 timecharter fixtures in the Handysize sector, 0 for period charter averaging $0 per day, while 8 trip charters were reported this week with a daily average of $12,392 per day.
The minimum vs maximum daily rate differential as analyzed from our fixtures database was overall improved and this week’s fixture that received the lowest daily hire was the M/V ‘’LAST TYCOON’’, 34500 dwt, built 2011, dely CJK 30 Mar/5 Apr, redely SEAsia, $9000, Asan Merchant Marine, for a trip via SKorea -800$ reduced from last week and the fixture with the highest daily hire was the M/V ‘’MARINA R’’, 37785 dwt, built 2010, dely Recalada 3/6 Apr , redely WC South America, $20100, Clipper, for a trip 7400$ improved from last week.
The BHI is showing a 2.5% change on a weekly comparison, a 36.1% rise on a 1 month basis, a -2.2% decrease on a 3 month basis, a -17.8% decrease on a 6 month basis and a -28.1% decrease on a 12 month basis.
All Baltic Dry Indices, 1 day, 1week , 1 month, 3 months, 6 months and 12 months % changes based on last Friday’s closing figures.
INDEX 1 DAY 1 WEEK 1 MONTH 3 MONTHS 6 MONTHS 1 YEAR
BDI 0.4% 2.9% 24.5% -47.7% -51.4% -38.6%
BCI 1.9% 3.1% -7.8% -58.5% -57.7% -21.2%
BPI 0.7% 1.4% 26.3% -37.3% -36.0% -45.4%
BSI -1.2% -0.5% 44.7% -12.9% -30.4% -31.8%
BHI -0.2% 2.5% 36.1% -2.2% -17.8% -28.1%
Monday, April 2, 2012 (Week 14)Capital Link Shipping Weekly Markets Report
Page 24
SHIPPING MARKETS
The Week In ReviewContributed by
Golden Destiny S.A. Golden Destiny S.A.57 Akti Miaouli, Piraeus, 18536,Greece
Phone: +30 210 4295000Website: www.goldendestiny.gr
Week Ending: 30th March 2012(Given in good faith but without guarantee)
This Week’s News: A snapshot on the economic and shipping environment
ECONOMIC ENVIRONMENT
The rising fuel price, one of the major threats of the worldwide economy, pushed US, UK and France, some of the world’s biggest oil buyers, to consider a release of strategic oil stocks in a bid to calm oil market. France’s energy minister, Eric Besson, confirmed that his country is in talks with US, UK and Japan to release billion of barrels of oil in the market. He also said that the countries are waiting conclusions from the International Energy Agency, which coordinates emergency stock releases in case of severe oil supply.
Saudi Oil Minister Ali al-Naimi blasted “irrationally” high oil prices by stating in the Financial Times that Saudi Arabia would like to see a lower price and Riyadh would do all it could do to bring prices down. He also said that supply is not the problem and there is no rational reason why oil prices remain at these high levels. Oil is trading near $124/barrel in part due to concerns about Iran’s exports amid tightening sanctions. The influential Saudi oil minister identified $100 per barrel as an ideal price for producers and consumers earlier this year. The bottom line is that Saudi Arabia would like to see a lower fair and reasonable price that does not hurt the global economic recovery.
The International Energy Agency said that if crude prices do not fall, oil consumer nations will pay a record $2 trillion this year. The IEA’s chief economist Fatih Birol, said in Reuters, that US crude oil imports would cost 3.4% of GDP, up from 3.1% in 2011 at a record of $426 billion this year, up from $380 in 2011. Furthermore, European Union, at the current price levels, would have to pay $500 billion in 2012, up from $470 billion last year; while China’s imported oil bill would reach $250 billion this year, up by $50 billion from 2011. “If China’s economy slows down as a result of high oil prices then it will have an impact not only on China but also the rest of the world” said Birol, noting that the world’s second biggest oil consumer had helped to pull the world out of the 2008 recession.
In the eurozone, market confidence is still fragile, even policy making decisions to avoid the contagion of the sovereign debt crisis. The organization for Economic Cooperation and Development said that the eurozone’s public debt crisis is not over despite calmer financial markets with a warning that the bloc’s banks remain weak, debt levels are still rising and fiscal targets are far from assured. The ECB has provided eurozone banks with more than €1tn loans, in a period of three years, as a means to strengthen the euro zone’s financial system. However, ECB figures showed that the flow of bank credit to the real economy contracted in February, although at a slower rate than at the end of last year. Loans to the private sector fell by €11bn compared with the previous month, while the annual growth rate fell from 1.1 per cent in January to 0.7 per cent, the lowest since June 2010, when the eurozone was recovering from the recession that followed the collapse of Lehman Brothers investment bank.
The Paris-based Organization for Economic Cooperation and Development points a robust growth in the United States and Canada for the first half of 2012, but much weaker activity in Europe, where the outlook remains fragile. In an interim forecast, the OECD projected U.S. gross domestic product to grow at an annualized rate of 2.9% in the current quarter and 2.8% in the second. The euro-zone’s three largest economies, Germany, France and Italy, are set to shrink by 0.4% on average in the first quarter, followed by growth of 0.9% in the second. Japan is predicted to expand by an annualized 3.4% in the first quarter and 1.4% in the second.
In the U.S. economy, the rapid rise in gross domestic income at an annualized rate of 4.4% in the fourth quarter of 2011, with lower estimates for the growth in gross domestic product at 3%, suggests that the world’s largest economy may be healthier than previously thought. The strength of the gross domestic income may be explained by a gap between the recent strength of the labor market and a rise in consumer spending of 2.1%. As per data from U.S. Labor Department, U.S. jobless claims fell by 5,000 last week to a total of 359,000, as per data from. However, Chairman Ben Bernanke said that the U.S. job market remains weak despite three months of strong hiring. The number of people working and the total hours worked are still significantly below pre-crisis peaks. Recent job gains have lifted hopes for the economy and consumer spending. Employers added an average of 245,000 jobs per month from December through February with unemployment rate falling to 8.3%, roughly a percentage point down since summer.
In China, GDP growth for the full year is likely to reach 8.5 percent, above the government’s target of 7.5 percent, despite a “combination of shrinking short-term demand and falling long-term potential productivity”, said Yu Bin, director-general of the Department of Macroeconomic Research Center of the State Council. Major threat on the Chinese economy is the slack of export growth with China exports showing a decline of 0.5% over the year in January, the first fall in more than two years. The export figures in the past two months were far less than the previous year and they set a pessimistic tone for the whole year, Mr Zhong Shan, China’s Deputy Commerce Minister, said. China posted its largest trade deficit in almost ten years in February. Furthermore, Chinese manufacturing activity declined in March, falling to 48.1 points from 49.6 points in February, according to the HSBC Purchasing Manager’s Index (PMI). This suggests that China’s manufacturing sector is in recession, mainly due to weaker demand for Chinese goods in the eurozone.
SHIPPING MARKET
Overall confidence levels in the shipping industry increased slightly

Monday, April 2, 2012 (Week 14)Capital Link Shipping Weekly Markets Report
Page 25
SHIPPING MARKETS
The Week In Reviewin the three months ended February 2012, to reach their highest level since May 2011, according to the latest Shipping Confidence Survey from international accountant and shipping adviser Moore Stephens. This is the third successive quarter in which there has been a small uptick in confidence. Rates are expected to increase over the coming year in the three main tonnage sectors covered by the survey. But the number of respondents expecting to make a major new investment over the next twelve months fell to its lowest figure for three years. In February 2012, the average confidence level expressed by respondents in the markets in which they operate was 5.5 on a scale of 1 (low) to 10 (high). This is marginally up on the figure of 5.4 recorded in the previous survey in November 2011. In February 2011, the average confidence level was at 5.8 and 5.9 in February 2010. The survey was launched in May 2008 with a confidence rating of 6.8.
In the dry market, the capesize pressure remains with panamax and supramax vessels experiencing better returns and the BDI standing one step behind of breaking the 1,000 points mark. Strong South American grain demand and an increase in coal exports from U.S. and Europe provide a firm support in the panamax market with earnings almost 40% more than capesize vessels.
In the iron ore market, comforting sign is the fall of Chinese iron ore inventories for a second consecutive week to 98,4 million tons, 1mt (1%) less than a weak ago. Brazil’s Vale is optimistic about the outlook of iron ore in China, like its Australian rivals BHP and Rio Tinto, believing in a moderate growth that is still significant for iron ore demand given the large steel production capacity of China. Vale forecasts that steel output in China will grow 5% this year after expanding more than 10% a year ago. One more positive sign is that Chinese February iron ore imports improved, after a weak January, totalled 65.0mt, up 10% m-o-m and 33% y-o-y. In addition, China’s daily crude steel output rose 1.1% in the second ten days of March from previous period. According to the China Iron & Steel Association, daily crude steel output stood at 1,919 million tons during March 11-20, up from 1,898 million tons in the previous ten years. Hu Zhengwu, an analyst with industry consultancy Custeel.com expects China’s daily crude steel output to reach 1.95 million tons in March, compared with a daily steel production of 1.917 million tons a year earlier.
In the coal market, heavy rains in Eastern Australia led to a temporary operating suspension at several coal mines resulting in slower Australian coal fixture volumes that may have an impact on the vessel earnings of smaller vessel sizes, panamax and supramax.
The index closed today at 934 points, down by 2.4% from last week’s closing and down by 39% from a similar week closing in 2011 when it was 1,520 points. The highest rate increase has been in the capesize segment, BCI up 3.1% w-o-w, BPI up 1.4% w-o-w, BSI down 0.4% w-o-w, BHSI up 2.5% w-o-w.
Capesize average time charter earnings are up by 14% w-o-w, panamax up 1.3% w-o-w, supramax down by 0.4% w-o-w and handysize down by 2.7%. Capesizes are currently earning $5,188/day, $3,384/day less than handysizes, showing an increase of $642/day from a week ago, while panamaxes are earning $8,398/day, an increase of $110/day. At similar week in 2011, capesizes were
earning $10,554/day, while panamaxes were earning $15,463/day. Supramaxes are trading at $10,767/day, down by $52/day from last week’s closing, 108% higher than capesize and 28% than panamax earnings. At similar week in 2011, supramaxes were getting $15,795/day, up by 46% from the current levels and 50% higher levels than capesizes. Handysize vessels are trading at $ 8,572day; a decline by $226/day from last week, when at similar week in 2011 handysize units were earning $11,774/day.
In the wet market, the freight market remains volatile with crude spot rates being under pressure from decline of fixture activity of Middle East, West Africa and Mediterranean. However, Dahlman Rose is predicting a firmer performance of the market during spring from political Iran turmoil, the world’s third largest crude exporter. The risk of losing more Iranian crude output is “threatening logistical patterns and disrupting supply” this spring, Dahlman’s Rose Analyst Omar Nokta said. That will keep spot shipping rates higher than they would otherwise be in a time when industry fundamentals are generally weak, he said. Nokta raised his forecast of shipping rates for very large crude oil tankers to $25,000 per day during 2012 and to $30,000 per day during 2013. That’s up from his previous estimate of $17,000 per day in 2012 and $24,000 per day in 2013.
The supply of super tankers competing to load cargoes of Persian Gulf crude fell to a nine- month low, according to Marex Spectron Group with daily returns on the industry’s benchmark Saudi Arabia-Japan route jumping to a 13 month high, according to Baltic Exchange. The risk of Iranian oil output coming off line supports higher freight rates disrupting supply with demand. However, the crude tanker freight market remains in downward momentum with investors seem to have more faith in the U.S. product demand.
Scorpio Tankers president Robert Bugbee said in the Capital Link Shipping Forum said that the product tanker market offers a much better investment opportunity than crude tankers. Although the product tanker market has experienced tremendous supply growth, Mr. Bugbee believes that the market is about to rise as more western refineries are shutting down and more cargoes will be shipped over longer distances, leading in an increase of ton mile demand. Scorpio Tankers has confirmed an order for one MR 52,000 dwt product tanker with delivery in 2013, increasing the tally of its orderbook to eight product tankers for delivery between July 2012 and May 2013. The order is estimated to bring the global orderbook in the range of 10,000-60,000 dwt to 171 vessels, 13% of the global fleet.
In the gas market, the LNG vessel segment has emerged as the most profitable investment business from soaring LNG spot rates, since last year, with LNG being shipped all over the world as a cheaper source of energy. Before three years, the LNG was out of the spotlight with around 30% of the LNG capacity being idle. The surprising and unexpected rise in US LNG production, from the discovery of significant shale of gas reserves had a negative impact on the prosperity of the segment with Asian demand not being able to offer a remedy. The nuclear catastrophe of Japan spurred high LNG imports that reversed the sentiment, with shipowners experiencing significant gains and targeting in their expansion of their fleet through the placement for the construction of LNG units in South Korean yards.

Monday, April 2, 2012 (Week 14)Capital Link Shipping Weekly Markets Report
Page 26
SHIPPING MARKETS
The Week In ReviewIn the container market, the Shanghai Container Freight Index is on rise for a fifth consecutive week by closing on Friday March 23rd at 1230 points, 7 points more than previous week and up by 30% from February 17th, when it was at 949 points. Asia-USWC and Asia-USEC showed for a second week higher rates, but with a softer rise of 1% and 2% respectively compared with last week’s outstanding increase of 14% on the Asia-USWC route and 8% on the Asia-USEC.
Asia-Europe and Asia-Mediterranean are sliding for a third week by posting soft declines with their rates being still above $1,000/TEU. On a weekly basis, Asia-Europe and Asia-Mediterranean routes have fallen by 1% and standing at $1371/TEU and $1376/TEU respectively. The general rate increases applied by liner operators keep a stronger sentiment on the two major routes, where post panamax units of more than 10,000 TEU are deployed. Rates on the Asia-Europe route are 90% higher than February 10th, when they were at $721/TEU, while rates on Asia-Mediterranean are up by 81% from $758/TEU. CMA CGM, one of the major players on Asia-Europe trade, is optimistic about the rate increases and expects to see further rate increases for this year peak’s season. CMA CGM is focusing on rate restoration rather than capacity increases and has actually cut back some capacity to Northern Europe and Mediterranean. Transpacific rates, Asia-USWC and Asia-USEC, along with Asia-East West Africa outperformed among other routes.Rates on the Asia-USWC route rose to $2021/FEU and $3204/FEU in Asia-USEC, up by $268/FEU and $290/FEU respectively from March 9th, when rates were $1753/FEU and $2914/FEU respectively.
A distressful status for the boxship environment that emerged this week is the halt of European container shipments to Asia by major container liners for about two months, following consecutive vessel cancellations after Chinese New Year, with European exporters facing serious issues. Maersk Line, the world’s largest container line, along with French rival CMA CGM, confirmed that they had frozen cargo bookings on eastbound services. A senior executive from one international logistics company said: “I can confirm that some carriers have put a halt to eastbound bookings due to a backlog of cargo as a result of skipped sailings and capacity withdrawal. Maersk is in the forefront. The situation is made worse by carriers preferring to get their stacks of empty containers to load them up with high revenue freight, following rate increases. Current freight rates from Asia to Europe are about US$1,500/TEU, but rates from Europe to Asia are much lower, reflecting the lower value of the cargo, mainly scrap material, exported to Asia.” Maersk in an email to customers stated that the booking stop is temporary and they are working to clear it as soon as possible so that they can resume booking acceptance as usual. David Skov, regional head of Maersk Line, said that the line would take a series of measures, including redeploying ships and making additional port calls, to clear the cargo backlog by the end of next month.
In the shipbuilding industry, Hyundai Heavy Industries is expected to catch up with the other three bigshipbuilders, Samsung Heavy Industries and Daewoo Shipbuilding & Marine Engineering, in new
order from April. Analyst Jun Jae-Chun, Daishin Securities said on March 28, “Hyundai’s profit in the beginning of 2012 is rather lower than Samsung and Daewoo, with fewer ordering.” However, in April, Hyundai would be able to recover its lagging new order. Daishin’s Jun said, “At least overall $1.5bn of orders for LNG carrier and boxship are expected, along with satisfactory price earning ratio, in comparing with Samsung and Daewoo.”
In Chinese shipbuilding industry, Singapore-listed Yangzijiang Shipbuilding is moving further into ship ownership as a way of securing new orders.It said that it will contribute in the finance of newbuildings by owning the ships through specially set-up Singapore companies. It has incorporated Yangzijiang Shipping as a holding company for these single-ship vehicles. The yard said it wanted to take advantage of its “strong financial position by providing shipping companies with a total financing solution to bridge the current ship financing gap. However, it mentioned that this strategy is only applied exclusively to higher quality and long-standing customers.
In the shipping finance, there has been a rise in shipping lending during the final quarter of last year amid a decline in funds provided by traditional European lenders. According to data from Dealogic, there were 67 new shipping loan deals at a combined value of $14,4 bn, compared with 53 deals worth $12,4bn in the third quarter, with a majority of money being for offshore and port projects. Fitch ratings said that banks have been pulling back from ship financing due to downturn within the industry, exacerbated by the increased capital and funding pressures in the banking sector. Opportunities for banks remain in stronger perfoming shipping segments such as liquefied natural gas transportation and offshore. Harry Theochari, head of transport at London law firm Norton Rose, confirmed that most lending from Europe right now is for restructuring and rescheduling, with no major new money on the table.
The management of Deutsche’ s bank shipping finance division announced that it increased its loan commitments to 1.6% billion in 2011 from 1.2 billion in the previous year. Ralf Bedranowsky and Simon Booth, Global Co-Heads of Deutsche Shipping, pointed out that loan commitments had expanded significantly in 2011, particularly in the growth market of Asia. This region accounted for 18.7% of all loan commitments in 2011, compared to just 7.6% in the previous year. “We are very satisfied with the way the business developed in 2011, particularly in light of the continuing uncertainty in the three major shipping markets,” said Bedranowsky. “Deutsche Shipping has once again succeeded in achieving a good result in challenging markets,” said Booth.
In terms of ship financing deals, China Shipping Development Company (CSDC) has entered into a loan agreement with its controlling shareholder China Shipping and affiliate CS Finance Company. Hong listed CSDC will borrow RMB 2bn ($317m) to mitigate the pressure on capital availability and allow the company to seize business opportunities. The loan has a term of three years commencing from 26 March 2012 and ending on 26 March 2015 at 5.02% per annum.

Monday, April 2, 2012 (Week 14)Capital Link Shipping Weekly Markets Report
Page 27
SHIPPING MARKETS
Tanker Market - Weekly HighlightsContributed by
Charles R. Weber Company, Inc.Charles R. Weber Company, Inc.Greenwich Office Park One,Greenwich CT 06831
Phone: 203 629-2300Website: www.crweber.com
Western MR spot market adapting to changes
As we have previously discussed, the fundamentals of the MR market have changed over the past year. Refinery closures on the US Atlantic Coast, in the Caribbean and in Europe have coincided with rising levels of US Gulf Coast area product exports. For MR spot market participants, these changes have also meant adapting to new benchmarks.
Cont-TA
The handful of trans-Atlantic routes emanating from the Continent are often grouped together as they trade in close correlation to each other and follow the Rotterdam-New York benchmark (TC2). The collective front haul status of these routes has not yet been fully affected by the rising volume of cargoes coming from the USG. Cont-TA activity posted a growth rate of 15% during 2011 from a year earlier; the USG-TA growth rate was significantly higher at 56%.
Whilst the gap in activity between the Cont-TA and USG-TA has certainly narrowed on this basis, it is still premature to consider the former a backhaul route. Indeed, despite the recent growth of US exports, Cont-States activity continues to exceed that of USG-Europe – by some 41% YTD.
CBS-USAC
Several ex-Caribbean routes bound for the US (including the USAC and the USG) trade in close correlation to each other and follow the Aruba-New York benchmark (TC3). Unlike the Cont-TA market, the front haul status of these collective routes has come to an seemingly apparent end following the recent closure of two key Caribbean-area refineries which formerly contributed a significant share of the US Northeast’s product supply.
Caribbean-area spot market MR liftings have declined by some 34% YTD year-on-year, and by some 54% during March compared to the same month a year ago. The Caribbean area—containing a number of product storage terminals with expanding capacity—may ultimately remain relevant however. Going forward, there is a likelihood that activity will actually rise as product could be supplied to these storage terminals from larger product tankers likely to emanate from the east. For now though, notable pickup in LR1 and LR2 deliveries to Caribbean storage facilities has yet to appear imminent.
The EIA has estimated that if Sunoco fails to find a buyer for its 340,000 b/d Philadelphia refinery and shuts the plant as planned in July, a 160,000 b/d shortfall in gasoline supply in PADD I (Northeast US) will ensue. This implies that an additional 14-15 MR cargoes bound for the USAC would be required as the North East infrastructure is limited and has yet to see any major revamping projects to more effectively distribute product via pipeline (minor upgrades to the Colonial Pipeline notwithstanding).
WEEK 13 – 30 MARCH 2012 Western MR spot market adapting to changes
Spot Rates WS TCE WS TCE
VLCC WEEK 12 WEEK 13
AG>USG 280 kMT 36.0 $1,000 40.0 $7,400
AG>SPORE 260 kMT 60.0 $31,400 70.0 $45,800
AG>JPN 260 kMT 60.0 $33,900 70.0 $49,400
WAFR>USG 260 kMT 65.0 $35,700 70.0 $45,600
WAFR>CHINA 260 kMT 60.0 $28,800 67.5 $39,500
SUEZMAX
WAFR>USAC 130 kMT 85.0 $23,600 75.0 $16,400
B.SEA>MED 135 kMT 97.5 $36,600 85.0 $24,500
CBS>USG 135 kMT 92.5 $26,800 82.5 $19,300
AFRAMAX
N.SEA>UKC 80 kMT 90.0 $12,000 90.0 $12,000
CBS>USG 70 kMT 105.0 $9,400 100.0 $7,200
TRK>MED 80 kMT 102.5 $18,200 95.0 $13,500
PANAMAX
CBS>USAC 50 kMT 145.0 $17,800 135.0 $14,500
CONT>TA 55 kMT 120.0 $11,300 120.0 $11,200
CPP
CONT>TA 37 kMT 140.0 $7,200 137.5 $6,600
CBS>USAC 38 kMT 155.0 $12,300 165.0 $14,500
USG>TA 38 kMT 117.5 115.0
SPOR>JPN 30 kMT 122.5 $(200) 122.5 $(200)
AG>JPN 75 kMT 84.0 $6,700 84.0 $6,600
AG>JPN 55 kMT 100.0 $4,900 102.5 $5,700
Time Charter Rates $/day (theoretical) 1 Year 3 Years
VLCC $20,250 $25,250
Suezmax $16,000 $19,000
Aframax $13,250 $16,250
Panamax $13,500 $14,750
MR $14,000 $14,750
THE TANKER MARKETS
VLCC Activity in the Middle East VLCC market was up markedly this week with a fixture count nearly triple that observed last week. Although a rebound in activity had been anticipated, the pace at which this materialized was stronger than many market participants had expected and was sufficient enough to bring the supply/demand ration into closer correlation. On this basis,
THE TANKER MARKETS
VLCC
Activity in the Middle East VLCC market was up markedly this week with a fixture count nearly triple that observed last week.
Monday, April 2, 2012 (Week 14)Capital Link Shipping Weekly Markets Report
Page 28
SHIPPING MARKETS
Tanker Market - Weekly HighlightsAlthough a rebound in activity had been anticipated, the pace at which this materialized was stronger than many market participants had expected and was sufficient enough to bring the supply/demand ration into closer correlation. On this basis, owners were considerably more bullish by midweek and, supported by improved fundamentals, succeeded at capturing strong rate gains; benchmark AG-FEAST rates rose from the low ws60s a week ago to ws70 at present. The tighter Middle East market increased competition for ballast units in the Atlantic basin, prompting equally strong gains for ex-WAFR cargoes. The combination of stronger Middle East and Atlantic basin rates has seen average VLCC earnings rise to ~$41,600/day presently – exceeding highs reached earlier this month.
In the Middle East market, some 41 fresh fixtures were reported this week. Rates to the far east averaged ws62.25, a gain of .75 point, w/w, as softer rates were reported early in the week. The present assessment stands at ws70. TCEs averaged ~$35,700/day – a gain of $1,200/day, w/w, whilst the present assessment yields a TCE of ~$47,300/day. Rates to the west averaged ws38.75 – a 1.65 points w/w gain. Corresponding TCEs averaged ~$4,800/day, representing a w/w gain of ~$2,800/day. Triangulated Westbound trade earnings averaged ~$40,300/day.
To-date, some 86 April Middle East cargoes have been covered, leaving a further 43-48 as potentially remaining. Against this, some 45 units are projected to be available through the end of the month – excluding an unknown number of “hidden” positions (largely pool units). Accordingly, the market is likely balanced. Going forward, rate progression is uncertain; this week’s gains in activity are partially attributable to a rush by Chinese charterers to cover requirements ahead of their half-week holiday during the first half of the upcoming week. Accordingly, there could be a slowdown in fresh activity, allowing the market to stabilize around present levels whilst, with owners increasingly bullish, steady activity would likely see further rate gains.
In the Atlantic basin, eastbound activity from the CBS/USG area was stronger as charterers reached out through the end of April to secure suitable tonnage. Rates on the CBS-FEAST route were largely steady at the $5.0m level and should hold around present levels through to mid-May when more units come free from AG-USG business. The firming Middle East market made the ballast towards West Africa less attractive and the majority cargoes fixed from there were on units positioned elsewhere in the Atlantic basin. This development saw rates firm – to ws70 for eastbound fixtures. The limited list of “natural” position should see upward pressure remain during the week ahead.
Suezmax
The Atlantic Suezmax market saw activity remain steady at last week’s level whilst rates were under further downward pressure due to rising regional tonnage availability. The WAFR-USAC benchmark shed 10 points to conclude at ws75. Given present fundamentals, rates should stabilize during the week around in the mid ws70s.
Aframax
The Caribbean Aframax market saw rates reach their apparent bottom this week with the CBS-USG benchmark route stabilizing at ws100 – 5 points below last week’s close. With European market still offering a premium to the Caribbean, further losses could be mitigated by units ballasting from the area or threatening to do so. Accordingly, and notwithstanding a pre-holiday rush next week, rates should hold around present levels.
Panamax
The Caribbean Panamax market commenced with steady activity – mostly for prompt tonnage. This allowed the CBS-USAC benchmark route to hold at ws145. By midweek, however, the number of excess units and more competitive Aframax alternative saw rates soften. By the close of the week, the market shed 10 points to conclude at ws135. With more units coming free during the upcoming week and seeking cargoes ahead of the holiday weekend, further rate losses could be realized.
CPP
The Caribbean MR market was volatile this week with fixtures concluded at rates ranging from ws155 to ws190 (for a cross-Caribbean voyage). Although the general trend was positive – and the benchmark CBS-USAC route gained 10 points to conclude at ws165 – some fixtures failed towards the end of the week which is likely to see rates retreat during the week ahead.
The ex-USG market remained active this week but with sufficient available tonnage to meet demand the market saw modest losses. The USG-TA benchmark eased 2.5 points to ws115. Petrobras was very active early this week and rates rising to as high as ws190 for Brazil discharge. However, given the soft Cont-USAC market, owners are more interested in alternative ex-USG voyages and gains are likely to ease during the week ahead.
The European market was more subdued this week with rates easing 2.5 points to ws137.5. Downward pressure remains and ws135 should be achievable at the start to the week ahead.

Monday, April 2, 2012 (Week 14)Capital Link Shipping Weekly Markets Report
Page 29
SHIPPING MARKETS
Weekly Tanker Market OpinionContributed by
Poten & Partners, Inc.805 Third AvenueNew York, NY 10022
Phone: (212) 230-2000Website: www.poten.com
Poten Tanker Market Opinions are published by the Commodity Consulting & Analytics department at Poten & Partners. For feedback on this opinion or to receive this via email every week please send an email to [email protected]. For information on the services and research products offered by our Marine Projects & Consulting department or to contact our tanker brokers please visit our website at www.poten.com.
NEW YORK LONDON PERTH ATHENS HOUSTON SINGAPORE GUANGZHOU Email: [email protected]
Helping Colonials
Over the years, oil refineries along the US Northeast Coast have hit their share of economic potholes. Many of these plants were built around processing mainly light, low sulfur crude oils predominantly from West Africa. Until a few years ago, this limited menu of oil flavors still provided financial returns sufficient to warrant operating the refineries. Lately, however, escalating prices of Atlantic Basin light, low sulfur oils – along with a myriad of other factors – have squelched the profitability of these facilities. Refiners have sidelined some 510 kBD of capacity along the US Northeast Coast between 2010 and 2011 due to unsustainable economics. Another 330 kBD of Pennsylvanian capacity is targeted to join the sidelines this summer. If this closure occurs, the region’s refined product manufacturing capability could be trimmed by roughly 700 kBD. Even with their presently lackluster demand for oil products, markets in the Northeast would likely notice the shuttering of refining capacity totaling 840 kBD.
To help fill any product void left by these sidelined plants, the Colonial Pipeline intends to up its delivery rate into the Philadelphia, New Jersey and New York markets. These markets could see phased increases of refined product deliveries from the Colonial system totaling 125 kBD by 2014. Any potential shortfall of East Coast refined products after increased domestic transfers might be imported if price arbs warranted the movement. While ripples from the currently shuttered capacity are still moving through Mid-Atlantic and Northeast oil markets, so far added product imports seem unnecessary. In fact, the following chart suggests that refined product imports were lower in 2011 than 2010.
March 30, 2012 www.poten.com
NEW YORK LONDON PERTH ATHENS HOUSTON SINGAPORE GUANGZHOU Email: [email protected]
Notwithstanding the absence of recent greater clean product import volumes into the US East Coast, time charter equivalent earnings for the standard size clean product tanker traveling from the UK Continent to the US Atlantic Coast have advanced from their third quarter 2011 levels.
Even though Sunoco’s self-imposed deadline is only a few months away, the final fate of their 175 kBD Marcus Hook and 330 kBD Philadelphia refineries has not been made public. If these refineries are indeed permanently closed, refined products will still be needed to satisfy Sunoco’s extensive and thirsty network of gasoline stations. As oil logistics in the US Northeast continue to be hazy, some owners of MR clean tankers may be wondering if or when the window will open for added volumes of imports. Directionally, plans to increase flows through the Colonial Pipeline stand to crimp – but probably would not shut – any opening of the import window. Any tightening of supply in these markets might create price arbs sufficient to entice additional imports of clean product imports.
Poten Tanker Market Opinions are published by the Commodity Consulting & Analytics department at Poten & Partners. For feedback on this opinion or to receive this via email every week please send an email to [email protected]. For information on the services and research products offered
by our Marine Projects & Consulting department or to contact our tanker brokers please visit our website at www.poten.com.
Helping Colonials
Over the years, oil refineries along the US Northeast Coast have hit their share of economic potholes. Many of these plants were built around processing mainly light, low sulfur crude oils predominantly from West Africa. Until a few years ago, this limited menu of oil flavors still provided financial returns sufficient to warrant operating the refineries. Lately, however, escalating prices of Atlantic Basin light, low sulfur oils – along with a myriad of other factors – have squelched the profitability of these facilities. Refiners have sidelined some 510 kBD of capacity along the US Northeast Coast between 2010 and 2011 due to unsustainable economics. Another 330 kBD of Pennsylvanian capacity is targeted to join the sidelines this summer. If this closure occurs, the region’s refined product manufacturing capability could be trimmed by roughly 700 kBD. Even with their presently lackluster demand for oil products, markets in the Northeast would likely notice the shuttering of refining capacity totaling 840 kBD.
To help fill any product void left by these sidelined plants, the Colonial Pipeline intends to up its delivery rate into the Philadelphia, New Jersey and New York markets. These markets could see phased increases of refined product deliveries from the Colonial system totaling 125 kBD by 2014. Any potential shortfall of East Coast refined products after increased domestic transfers might be imported if price arbs warranted the movement. While ripples from the currently shuttered capacity are still moving through Mid-Atlantic and Northeast oil markets, so far added product imports seem unnecessary. In fact, the following chart suggests that refined product imports were lower in 2011 than 2010.
Notwithstanding the absence of recent greater clean product import volumes into the US East Coast, time charter equivalent earnings for the standard size clean product tanker traveling from the UK Continent to the US Atlantic Coast have advanced from their third quarter 2011 levels.
Even though Sunoco’s self-imposed deadline is only a few months away, the final fate of their 175 kBD Marcus Hook and 330 kBD Philadelphia refineries has not been made public. If these refineries are indeed permanently closed, refined products will still be needed to satisfy Sunoco’s extensive and thirsty network of gasoline stations. As oil logistics in the US Northeast continue to be hazy, some owners of MR clean tankers may be wondering if or when the window will open for added volumes of imports. Directionally, plans to increase flows through the Colonial Pipeline stand to crimp – but probably would not shut – any opening of the import window. Any tightening of supply in these markets might create price arbs sufficient to entice additional imports of clean product imports.

Monday, April 2, 2012 (Week 14)Capital Link Shipping Weekly Markets Report
Page 30
SHIPPING MARKETS
Weekly Freight Rate & Asset TrendsContributed by
IntermodalIntermodal Shipbrokers Co.17th km Ethniki Odos Athens-Lamia & 3 Agrambelis Street,145 64 N. Kifisia,Athens - Greece
Phone: +30 210 6293300Website: www.intermodal.gr
FREIGHT RATES
ASSET VALUESWEEK13 - 2012
www.intermodal.gr Intermodal Shipbrokers - Capital Link - Dry Bulk Market Report “Week 13” – 30 Mar 2012 7
Secondhand Indicative Market Values ($ Million) - Tankers Vessel 5yrs old Mar-12 Feb-12 ±% 2012 2011 2010
VLCC 300KT DH 63.0 64.5 -2.3% 64.0 77.6 87.2
Suezmax 150KT DH 44.5 45.9 -3.0% 46.6 54.4 62.6
Aframax 105KT DH 32.0 34.1 -6.2% 34.5 39.1 44.7
Panamax 70KT DH 27.6 29.0 -4.8% 29.6 35.2 38.8
MR 45KT DH 25.4 25.4 0.0% 25.9 28.4 26.5
Secondhand Indicative Market Values ($ Million) - Bulk Carriers Vessel 5yrs old Mar-12 Feb-12 ±% 2012 2011 2010
Capesize 170k 36.0 36.8 -2.0% 37.1 43.5 57.4
Panamax 73K 24.4 25.6 -4.8% 26.0 31.3 39.0
Supramax 52k 21.7 22.4 -3.0% 23.0 25.6 30.2
Handysize 29K 19.2 20.8 -7.5% 21.2 23.5 26.2
New Building Indicative Market Prices (million$) Vessel
Week 13
Week 12 ±% 2012 2011 2010
Bul
kers
Capesize 170k 46.5 46.5 0.0% 47 53 58 Panamax 75k 27.0 27.0 0.0% 27 33 35 Supramax 57k 25.5 25.5 0.0% 25 30 31 Handysize 30k 21.8 21.8 0.0% 22 25 27
Tank
ers
VLCC 300k 96.5 96.5 0.0% 96 102 104 Suezmax 150k 58.5 58.5 0.0% 58 64 66 Aframax 110k 50.5 50.5 0.0% 51 54 55 LR1 70k 42.0 42.0 0.0% 42 45 46 MR 47k 33.0 33.0 0.0% 33 36 36
Gas
LPG M3 80k 71.0 71.0 0.0% 70 73 72 LPG M3 52k 62.0 62.0 0.0% 62 64 65 LPG M3 23k 45.0 45.0 0.0% 45 46 46
WEEK13 - 2012
www.intermodal.gr Intermodal Shipbrokers - Capital Link - Dry Bulk Market Report “Week 13” – 30 Mar 2012 6
Dry Bulker Time Charter Rates $/day
Week 13
Week 12 ±% Diff 2012 2011
Cap
esiz
e 170K 6mnt TC 12,500 12,500 0% 0 14,344 18,474
170K 1yr TC 14,750 14,750 0% 0 16,469 17,138
170K 3yr TC 16,250 17,500 -7% -1,250 17,296 17,599
Pana
max
70K 6mnt TC 13,250 13,375 -1% -125 12,546 17,238
70K 1yr TC 11,250 11,750 -4% -500 11,287 14,863
70K 3yr TC 12,250 12,250 0% 0 11,979 14,500
Supr
amax
52K 6mnt TC 13,000 13,000 0% 0 11,296 15,587
52K 1yr TC 12,000 12,000 0% 0 11,065 14,308
52K 3yr TC 12,500 12,500 0% 0 12,162 14,046
Han
dym
ax
45k 6mnt TC 11,250 11,250 0% 0 9,354 13,416
45k 1yr TC 11,000 10,500 5% 500 9,142 12,450
45k 3yr TC 10,500 10,500 0% 0 10,219 12,403
Han
dysi
ze
30K 6mnt TC 9,000 9,000 0% 0 8,065 11,712
30K 1yr TC 9,250 9,250 0% 0 8,412 11,787
30K 3yr TC 10,000 10,000 0% 0 10,277 12,044
WEEK13 - 2012
www.intermodal.gr Intermodal Shipbrokers - Capital Link - Dry Bulk Market Report “Week 13” – 30 Mar 2012 5
Tanker Spot Rates
Vessel Routes Week 13 Week 12
±% 2012 2011
WS points $/day WS
points $/day $/day $/day
VLC
C 265k AG-JAPAN 70 54,593 58 34,696 21% 31,921 18,217
280k AG-USG 40 10,964 39 8,533 4% 3,974 2,504
260k WAF-USG 65 45,719 65 45,719 0% 43,835 25,714
Suez
max
130k MED-MED 80 24,001 90 33,147 -11% 32,320 25,125
130k WAF-USAC 75 14,144 83 19,673 -9% 20,334 13,373
130k AG-CHINA 80 19,666 85 23,894 -6% 23,577 14,815
Afr
amax
80k AG-EAST 100 11,987 100 12,304 0% 14,135 12,726
80k MED-MED 90 12,230 100 17,543 -10% 15,445 13,577
80k UKC-UKC 90 14,841 90 14,983 0% 19,339 18,604
70k CARIBS-USG 100 7,658 118 14,986 -15% 15,687 8,240
Cle
an
75k AG-JAPAN 85 1,679 85 1,832 0% 3,008 10,467
55k AG-JAPAN 105 3,573 100 1,966 5% 2,549 7,768
37K UKC-USAC 135 7,115 140 8,172 -4% 12,607 11,022
30K MED-MED 143 14,574 145 15,307 -2% 19,028 18,458
Dirt
y
55K UKC-USG 120 12,226 123 13,246 -2% 13,607 11,266
55K MED-USG 120 10,416 123 11,339 -2% 11,173 9,676
50k CARIBS-USAC 145 17,015 145 16,885 0% 13,312 10,700
Tanker Time Charter Rates $/day
Week 13
Week 12 ±% Diff 2012 2011
VLCC 300k 1yr TC 21,500 21,500 0.0% 0 20,404 25,197
300k 3yr TC 29,000 26,500 9.4% 2500 26,181 31,681
Suezmax 150k 1yr TC 17,000 18,000 -5.6% -1000 16,404 19,837
150k 3yr TC 19,500 19,500 0.0% 0 19,892 23,830
Aframax 105k 1yr TC 14,250 14,250 0.0% 0 13,981 15,707
105k 3yr TC 16,500 16,500 0.0% 0 16,200 18,335
Panamax 70k 1yr TC 13,500 13,500 0.0% 0 13,250 14,995
70k 3yr TC 14,750 14,750 0.0% 0 14,450 16,263
MR 45k 1yr TC 14,750 14,750 0.0% 0 14,423 13,918
45k 3yr TC 15,250 15,250 0.0% 0 14,873 14,738
Handysize 36k 1yr TC 13,000 13,000 0.0% 0 12,462 12,471
36k 3yr TC 13,500 13,500 0.0% 0 13,200 13,412

Monday, April 2, 2012 (Week 14)Capital Link Shipping Weekly Markets Report
Page 31
SHIPPING MARKETS
Container Market - Weekly Highlights
Braemar Seascope Containers - London - Singapore - Shanghai S&P email: [email protected] Chartering email: [email protected] London: Phil Woodington, Graham Booth, Ben Jeans, Ranulf Swallow, Peyton Broer and Bill Price
Singapore: James Buck, Roy Edkins, Ming Xiang Ling and Tanja Friese Shanghai: Axel Huang Research: Jonathan Roach
www.braemarseascope.com Every effort as been made to ensure the information contained within this report is accurate, Braemar Seascope cannot accept responsibility for error, omission or consequence therefrom
Braemar Seascope Containers The Monday Morning Container Briefing 26th March 2012
After last week's welcomed turn-around in our BOXi, this week the index remains unchanged, with the supply of tonnage continuing to outstrip demand across the board to the extent that rates are generally hovering around OPEX. Indeed, although it is too early to suggest that recent improvements in certain sizes were a false dawn, it does appear that we have some way to go before sufficient available tonnage is absorbed to significantly improve owners' negotiating position. One major Far Eastern liner company has continued to be active in securing 5000teu tonnage for 12 month periods but between this size and the 1700teu segment enquiry remains limited, with a particular build up of spot/prompt tonnage between 2500 and 3500teu. Now that we are in the middle of the traditional active season, it will be inter-esting to see for how long owners of this size decide to refrain from laying up their vessels, especially the older, thirstier candidates with low reefer capacity.
For 1700teu and below, activity has remained on a par with recent weeks, with a slow but gradual depletion of the upcoming open posi-tions of this busy redelivery window, again mainly through extensions but also with a small amount of fresh enquiry, meaning rates are hold-ing still at around, or marginally above last done in most cases. Otherwise the themes from recent months continue; a dearth of fresh enquiry and high positioning costs meaning the majority of fixtures concluded are extensions in direct continuation, with a number of the-se fixed for flexible periods. As in recent weeks, charterers have gener-ally continued to push for longer periods against owners' reluctance to commit and risk missing out on possible, and much needed, charter hire improvements later in the year; hopefully a valid concern given the manner in which recent freight rate increases have held firm.
Chartering
Representative Fixtures
20
40
60
80
100
120The BOX Index (BOXi)
54.06
Name Dwt Teu 14T Blt Spd Cons GR Charterer Dely Date Period US$/daySanta Pelagia 67,150 5,040 3,320 05 26 218 GL Evergreen NE Asia Apr-12 12 mos 8,250Rio Thelon 34,500 2,500 1,860 04 22 87 G CMA CGM Med Mar-12 6-12 mos 7,250Buxlink 33,900 2,478 1,914 02 22.5 84 G Maersk SE Asia Mar-12 10-12 mos 6,700Seaboxer III 23,300 1,740 1,287 10 20 65 G Maersk Med Mar-12 4-8 mos 6,250Hansa Bergen 20,700 1,550 1,029 98 20 49 GL Mitsui OSK USG Mar-12 6 mos 6,200Michigan Trader 18,480 1,296 957 08 19 45 GL Zim Med Apr-12 4-6 mos 6,600Italian Express 14,237 1,084 730 12 19 39 GL STX NE Asia Apr-12 2-4 mos 5,600Merkur Bridge 12,583 1,012 646 93 17 27 G Mistui OSK PGI Mar-12 1-3 mos 5,000Pauline 11,500 957 604 06 18 37 G CMA CGM Med Apr-12 1-6 mos 4,950Ice Moon 8,021 698 410 08 17 28 GL Yang Ming NE Asia Apr-12 1 mos 4,200
Vessel (Teu/Hmg) Index +/-510/285 teu (GL) 15.5 k 3.61 ► 0.00700/440 teu (GL) 17.5 k 4.00 ► 0.00750/415 teu (G) 16 k 4.39 ► 0.001,000/650 teu (G) 17.5 k 4.50 ► 0.001,100/715 teu (G) 19 k 5.89 ► 0.001,350/925 teu (G) 20 k 4.12 ► 0.001,600/1,150 teu (GL) 18 k 5.10 ► 0.001,700/1,125 teu (G) 19.5 k 4.69 ► 0.001,740/1,300 teu (G) 20.5 k 4.92 ► 0.002,000/1,600 teu (G) 21 k 1.94 ► 0.002,500/1,900 teu (G) 22 k 3.50 ► 0.002,800/2,000 teu (GL) 22 k 3.24 ► 0.003,500/2,500 teu (GL) 23 k 2.39 ► 0.004,250/2,800 teu (GL) 24 k 1.77 ► 0.00Index Total 54.06 ► 0.00
---
4
6
8
OXI(OX) 54.55
N Dw 4 G D D U$/Santa Philippa 6 6 H K ,5CSAV La Ligua 46 4 OO N 6 8,35()JPO Vulpecula 4 4 OO N 8,7Lorraine 4 6 9 H 6 7,EM Astoria 6 6 9 4 6 6 I 6 6,75Northern Harmony 9 94 9 44 6 7,Warnow Whale 96 9 96 4 b 6,5FPMC Container 8 6 G N 6 5,5MOL Acclaim 4 6 OK 4 5,Delia 4 6 N 4 4,975
V(/H) I +/-5/85(G)5.5k 6 0.00700/440 teu (GL) 17.5 k 4.00 0.00750/415 teu (G) 16 k 4.39 0.001,000/650 teu (G) 17.5 k 4.75 0.251,100/715 teu (G) 19 k 6.11 0.221,350/925 teu (G) 20 k 4.29 0.161,600/1,150 teu (GL) 18 k 5.10 0.001,700/1,125 teu (G) 19.5 k 4.73 0.041,740/1,300 teu (G) 20.5 k 4.92 0.002,000/1,600 teu (G) 21 k 1.94 0.002,500/1,900 teu (G) 22 k 3.41 0.102,800/2,000 teu (GL) 22 k 3.15 0.093,500/2,500 teu (GL) 23 k 2.39 0.004,250/2,800 teu (GL) 24 k 1.77 0.00Index Total 54.55 0.48
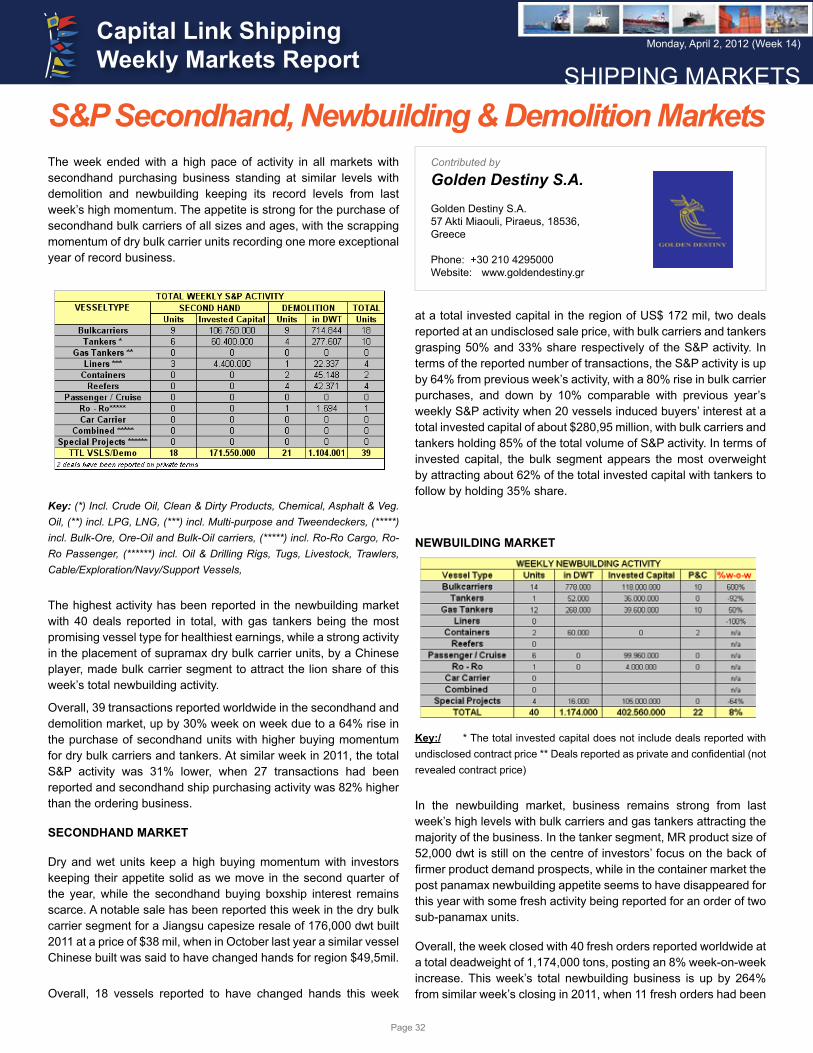
Monday, April 2, 2012 (Week 14)Capital Link Shipping Weekly Markets Report
Page 32
SHIPPING MARKETS
Key: (*) Incl. Crude Oil, Clean & Dirty Products, Chemical, Asphalt & Veg. Oil, (**) incl. LPG, LNG, (***) incl. Multi-purpose and Tweendeckers, (*****) incl. Bulk-Ore, Ore-Oil and Bulk-Oil carriers, (*****) incl. Ro-Ro Cargo, Ro-Ro Passenger, (******) incl. Oil & Drilling Rigs, Tugs, Livestock, Trawlers, Cable/Exploration/Navy/Support Vessels,
The highest activity has been reported in the newbuilding market with 40 deals reported in total, with gas tankers being the most promising vessel type for healthiest earnings, while a strong activity in the placement of supramax dry bulk carrier units, by a Chinese player, made bulk carrier segment to attract the lion share of this week’s total newbuilding activity.
Overall, 39 transactions reported worldwide in the secondhand and demolition market, up by 30% week on week due to a 64% rise in the purchase of secondhand units with higher buying momentum for dry bulk carriers and tankers. At similar week in 2011, the total S&P activity was 31% lower, when 27 transactions had been reported and secondhand ship purchasing activity was 82% higher than the ordering business.
SECONDHAND MARKET
Dry and wet units keep a high buying momentum with investors keeping their appetite solid as we move in the second quarter of the year, while the secondhand buying boxship interest remains scarce. A notable sale has been reported this week in the dry bulk carrier segment for a Jiangsu capesize resale of 176,000 dwt built 2011 at a price of $38 mil, when in October last year a similar vessel Chinese built was said to have changed hands for region $49,5mil.
Overall, 18 vessels reported to have changed hands this week
The week ended with a high pace of activity in all markets with secondhand purchasing business standing at similar levels with demolition and newbuilding keeping its record levels from last week’s high momentum. The appetite is strong for the purchase of secondhand bulk carriers of all sizes and ages, with the scrapping momentum of dry bulk carrier units recording one more exceptional year of record business.
at a total invested capital in the region of US$ 172 mil, two deals reported at an undisclosed sale price, with bulk carriers and tankers grasping 50% and 33% share respectively of the S&P activity. In terms of the reported number of transactions, the S&P activity is up by 64% from previous week’s activity, with a 80% rise in bulk carrier purchases, and down by 10% comparable with previous year’s weekly S&P activity when 20 vessels induced buyers’ interest at a total invested capital of about $280,95 million, with bulk carriers and tankers holding 85% of the total volume of S&P activity. In terms of invested capital, the bulk segment appears the most overweight by attracting about 62% of the total invested capital with tankers to follow by holding 35% share.
NEWBUILDING MARKET
Key:/ * The total invested capital does not include deals reported with undisclosed contract price ** Deals reported as private and confidential (not revealed contract price)
In the newbuilding market, business remains strong from last week’s high levels with bulk carriers and gas tankers attracting the majority of the business. In the tanker segment, MR product size of 52,000 dwt is still on the centre of investors’ focus on the back of firmer product demand prospects, while in the container market the post panamax newbuilding appetite seems to have disappeared for this year with some fresh activity being reported for an order of two sub-panamax units.
Overall, the week closed with 40 fresh orders reported worldwide at a total deadweight of 1,174,000 tons, posting an 8% week-on-week increase. This week’s total newbuilding business is up by 264% from similar week’s closing in 2011, when 11 fresh orders had been
Contributed by
Golden Destiny S.A. Golden Destiny S.A.57 Akti Miaouli, Piraeus, 18536,Greece
Phone: +30 210 4295000Website: www.goldendestiny.gr
S&P Secondhand, Newbuilding & Demolition Markets
Monday, April 2, 2012 (Week 14)Capital Link Shipping Weekly Markets Report
Page 33
SHIPPING MARKETS
reported with only one newbuilding contract in the bulk carrier segment, one in the tanker and four in the container. In terms of invested capital, the total amount of money invested is estimated at region $402,5 mil with 55% of the total number of orders being reported at an undisclosed contract price. Notable ordering business has been in the bulk carrier segment, the construction of ten supramax units of 51,000dwt by an undisclosed Chinese contractor in domestic yard, Taizhou Kouan Shipbuilding.
In the bulk carrier segment, the supramax size is on the spotlight on the back of firmer vessel returns amid the distressed capesize freight market status. In the panamax segment, Greek player Diana Shipping announced that it has signed, through separate wholly-owned subsidiaries, two shipbuilding contracts with China Shipbuilding Trading Company, Limited and Jiangnan Shipyard (Group) Co., Ltd, for the construction of two Ice Class Panamax dry bulk carriers of approximately 76,000 dwt each for a contract price of US$29 million per vessel. The Company expects to take delivery of the vessels during the fourth quarter of 2013.
In the tanker segment, Italian player Scorpio Tankers has confirmed an order for one MR 52,000 dwt product tanker with delivery in 2013, increasing the tally of its orderbook to eight product tankers for delivery between July 2012 and May 2013, at a contract price of region US $36 mil.
In the gas tanker segment, Exmar is pleased to announce the order of up to 8 LPG-vessels of 38,000 cum capacity at Hyundai Mipo for delivery from the First Quarter of 2014 onwards. These vessels will be dedicated to strengthen EXMAR’s already substantial commercial portfolio in the mid-size segment and designed to stay ahead of the upcoming amendments in environmental legislation. In addition, Greek player Brave Maritime has placed 4 LPG units in STX Busan of South for delivery 2014-2015 with a capacity of 6,500 cum and 5,000 cu.m. In the LNG segment, executives at Greece’s Tsakos Energy Navigation confirmed that it would order its first diesel electric powered LNG vessel of 162,000 cbm, for delivery in late 2014-2015, with an option for a second. It is understood that it have signed a letter of intent with Hyundai Heavy Industries with expected final confirmation next week.
In the container segment, Long Greek Lomar has signed an order with the Guangzhou Wenchong Shipyard in South China, for two sub-panamax units, 2,190 TEU, with an option for four more, scheduled for delivery starting from early 2014. The vessels have been designed by leading Chinese design institute SDARI (Shanghai Merchant Ship Design and Research Institute) and meet the highest standards for fuel efficiency and environmental compliance. The investment restates Lomar’s dedication to container shipping with renewals and additions to the fleet which benefit from the latest fuel-efficient designs, and follows the company’s order earlier this year for up to six new bulk carriers from China’s COSCO Group. “We are re-investing in our fleet with these new vessels,” said Achim Boehme, CEO of Lomar.
“Wenchong has a very strong reputation for delivering excellent quality container vessels and being among the best shipyards in the ‘feeder’ size sector. We look forward to taking delivery of these newbuildings which will enhance our existing portfolio and allow us to stay competitive, continuing to offer a comprehensive service across the whole of Lomar with a modern, fuel-efficient fleet.”
In the offshore segment, undisclosed US contractor has placed an order for four platform supply vessels in Cosco Guangdong of China at a price region of $26,25 mil each, with an option six more, for delivery in 2014.
DEMOLITION MARKET
In the demolition market, the scrapping business keeps its high record pace every week with an average number of disposals more than 15 vessels. Bulk carriers are the most popular scrap candidates as the dry freight market still tries to find its supply-demand balance with the BDI fluctuating below 1,000 points. During the first quarter of the year, there has been 84% increase in the number of bulk carriers disposals from January-March 2011, 97 bulk carriers reported to have been sent in the scrap yards, 112 units, with intense scrapping momentum in small and large sized vessels. India leads the market with Bangladesh price levels being not impressive and China securing more tonnage than Chittagong scrap buyers at levels below $450/ldt. Scrap prices remain below $500/ldt for dry/general cargo and near $500/ldt for tanker units with no signs for a prompt firmer upturn.
The week ended with 21 vessels reported to have been headed to the scrap yards of total deadweight 1,104,001 tons. In terms of the reported number of transactions, the demolition activity is up by 11% from previous week, with the bulk carrier segment holding 43% of the total reported number of disposals. In terms of total deadweight sent for scrap there has been a fall of 8.6% on a weekly basis due to non reported demolition activity for large sized tanker units. In the bulk carrier segment, one VLOC and one capesize went for disposal, while in the tanker segment two aframax units.
In terms of scrap price, the highest scrap rate has been achieved this week in the tanker segment by India for a small unit of 10,236 dwt with 3,488 ldt built 1994 M/V “SUN QUEEN 1” at $820ldt, including 426tons solid stainless steel. India is on the frontline by winning 11 of the 21 total demolition transactions. At a similar week in 2011, demolition activity was 66% down, in terms of the reported number of transactions, 7 vessels had been reported for scrap of total deadweight 261,497 tons with bulk carriers and tankers grasping 72% of the total number of vessels sent for disposal. Scrap prices were floating at same levels with a higher momentum than today. Bangladesh and India had been offering $485/ldt for dry and $500-$510/ldt for wet cargo.
S&P Secondhand, Newbuilding & Demolition Markets

Monday, April 2, 2012 (Week 14)Capital Link Shipping Weekly Markets Report
Page 34
SHIPPING MARKETS
GREEK PRESENCE
In the newbuilding market, there was one more week with strong Greek investment plans as in the previous week for placement of newbuilding contracts in the main vessel segments, bulk carriers, gas tankers and containers. In the bulk carrier segment, Diana Shipping has placed an order of two 76,000 dwt units in China Shipbuilding Trading Company Limited and Jiangnan Shipbuilding for a price region of $29 mil each for delivery in 2013. In the LPG segment, Brave Maritime has placed an order for four units at STX Busan of South Korea for delivery 2014-2015 with a capacity of 6,500 cum and 5,000 cu.m. In the LNG segment, executives at Greece’s Tsakos Energy Navigation confirmed that it would order its first diesel electric powered LNG vessel of 162,000 cbm, for delivery in late 2014-2015, with an option for a second. In the container segment, Long Greek Lomar has signed an order with the Guangzhou Wenchong Shipyard in South China, for two sub-panamax units, 2,190 TEU, with an option for four more, scheduled for delivery starting from early 2014. Their total amount of money invested for the placement of newbuilding units is estimated to be in the region of more than $97,6mil, 4 deals reported at an undisclosed contract price, while in the secondhand market have invested about $34,2 mil, for the purchase of one dry bulk panamax unit built 2000, one dry bulk supramax unit built 1989 and one aframax tanker unit built 1999.
NEWBUILDING MARKET – ORDERS
BULK CARRIERS –76,000 DWT 2 units ordered by Diana Shipping (GR) at China Shipbuilding Trading Company Limited & Jiangnan Shipbuilding (PRC) Price usd $ 29 mil each. Dely 4q/2013 (ice class 1C specification) 58,000 DWT 2 units ordered by Asia Pacific 20 (SKR) at Samjin Shipyard (PRC) Price undisclosed. Dely 3-6/2014(Asia Pacific 20 is a new ship investment company which will raise $60.2mil from financial institutions and private equity investors. Korea’s Ministry of Land Transport and Maritime Affairs (MLTM) authorized formation of Asia Pacific 20 which is a private ship fund. The vessels will be bareboat chartered with purchase option over 13 years and a sublet on a b/b
charter basis to Daelim Corporation of South Korea. 51,000 DWT 10 units ordered by Chinese contractor (PRC) at Taizhou Kouan Shipbuilding (PRC) Price undisclosed. Dely 2013-2014
TANKERS –52,000 DWT (Chemical / Product) 1 unit ordered by Scorpio Tankers (ITL) at Hyundai Mipo (SKR) Price USD $36 mil. Dely 5/2013
GAS TANKERS – ABT 30,000 DWT LPG/ 8 units ordered by Exmar (BLG) at Hyundai Heavy Industries (SKR) Price undisclosed. Dely from 1q/2014 onwards (38,000 cu.m) ABT 8,500 DWT LPG/ 2 units ordered by Brave Maritime (GR) at STX Busan (SKR) Price undisclosed. Dely 2015 (6,500 cu.m) ABT 5,500 DWT LPG/ 2 units ordered by Brave Maritime (GR) at STX Busan (SKR) Price around usd $ 20 mil. Dely 1q 2014 (5,000 cu.m. Option for two more)
CONTAINERS – ABT 30,000 DWT 2 units ordered by Lomar Shipping (London Greeks) at Guangzhou Wenchong (PRC) Price undisclosed. Dely during 2014 (2,190 teu. Option four more units. New Shanghai Merchant Ship Design & research Institute design, which provides a 14-tonne homogenous load of 1,570teu)
PASSENGER / CRUISE – Cruise 6 units ordered by Viking River Cruises (SWISS) at Neptun Reparaturwerft (GER) Price usd $ 16.66mil each. Dely within 2013 (from May to December).(Passenger capacity: 264)
RO/RO – RoPax 1 unit ordered by Estonian Government (EST) at Reval Shipbuilding OU (EST) Contract value euro 2.99mil. Dely 3/2014(100% financed by European Regional Development Fund. Ice class steel. 74 pax.27.4t cargo. Service to Prangli island)
SPECIAL PROJECTS – 4,000 DWT Platform Supply 4 units ordered by undisclosed US contractor (US) at COSCO Guangdong (PRC) Price USD $26.25mil each. Dely 3/2014-5/2014-7/2014-9/2014 (UT 771CDL design. Option six more)
Key: GR: Greece, PRC: China, ITL: Italy, BLG: Belgium, GER: Germany, SKR: South Korea, Dely: Delivery
S&P Secondhand, Newbuilding & Demolition Markets
Monday, April 2, 2012 (Week 14)Capital Link Shipping Weekly Markets Report
Page 35
Terms of Use & Disclaimer
Content Contributors
This Newsletter is published by Capital Link Media, a division of Capital Link, a New York based Investor Relations and Financial Communications Firm with strategic focus in shipping. Capital Link may work for several shipping companies listed in this Newsletter. This Newsletter may include facts, views, opinions and recommendations of individuals and organizations deemed to be of interest. Neither Capital Link and its affiliates nor the information providers or companies presented guarantee the accuracy, completeness or timeliness of, or otherwise endorse these views, opinions or recommendations, nor do they give investment, financial, legal, accounting, tax advice or any advice of any kind whatsoever, or advocate the purchase or sale of any security or investment. Any user of this Newsletter cannot and should not rely in any way partially or totally upon the information provided herein as the basis for any investment, financial, legal, tax or accounting decision. Any errors or omissions in the write up, translation,
Capital Link Shipping Weekly Markets ReportPublished by Capital Link Media, a division of Capital Link, Inc.
230 Park Avenue - Suite 1536New York, N.Y. 10169 - USA
Phone +1-212-661-7566Fax +1-212-661-7526
E-mail: [email protected] - www.CapitalLinkShipping.com
presentation, transposition or transmission of this information shall not and cannot be made the basis for any claim whatsoever against any officer or employee of Capital Link and its affiliates or any of its content providers. The user of this Newsletter agrees not to imitate, copy, or alter the template and method of presentation and its contents, reproduce, retransmit, disseminate, sell, distribute, publish, broadcast, circulate or commercially exploit the information in any manner without the express consent of Capital Link and its affiliates and content providers; nor to use the information in any illegal manner or for any unlawful purpose. The Newsletter, or parts of it, is not intended for dissemination of information or utilization in jurisdictions where it is inappropriate to access and use the information herein. When in such jurisdictions, it is the responsibility of the users to satisfy themselves that it is permissible for them to access and receive this information and comply with the local regulations.