capital markets day 2014 leadership with differentiation aloke lohia, group ceo january 10, 2014
TRANSCRIPT
Capital Markets Day 2014
Leadership with DifferentiationAloke Lohia, Group CEOJanuary 10, 2014
2
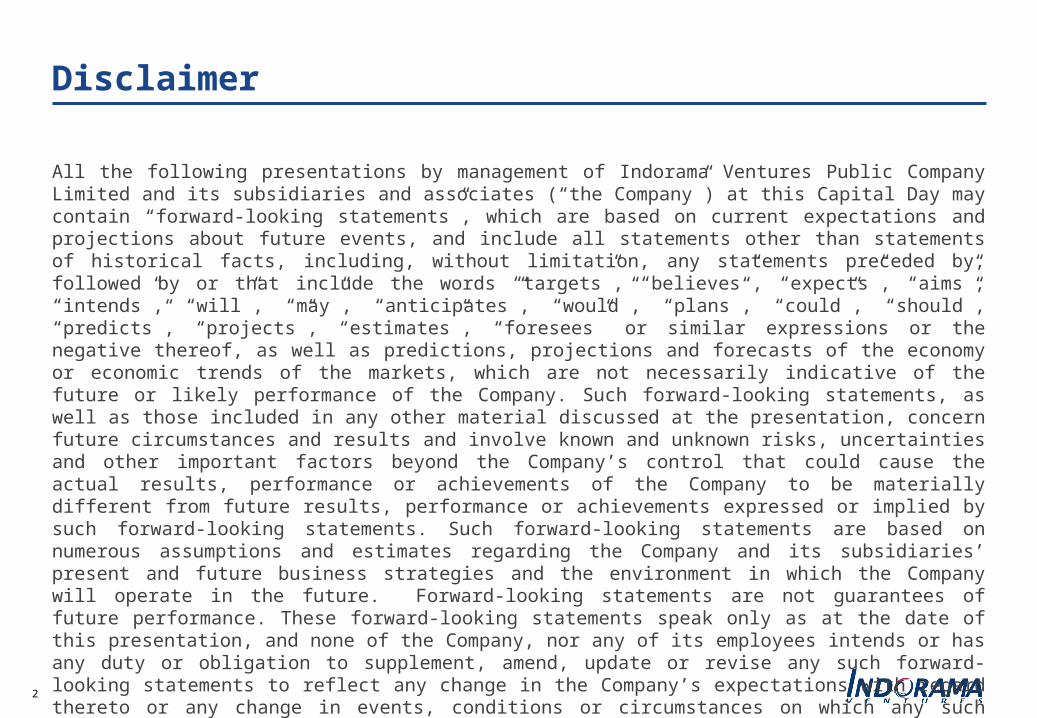
Disclaimer
All the following presentations by management of Indorama Ventures Public Company Limited and its subsidiaries and associates (“the Company”) at this Capital Day may contain “forward-looking statements”, which are based on current expectations and projections about future events, and include all statements other than statements of historical facts, including, without limitation, any statements preceded by, followed by or that include the words “targets”, “believes”, “expects”, “aims”, “intends”, “will”, “may”, “anticipates”, “would”, “plans”, “could”, “should”, “predicts”, “projects”, “estimates”, “foresees” or similar expressions or the negative thereof, as well as predictions, projections and forecasts of the economy or economic trends of the markets, which are not necessarily indicative of the future or likely performance of the Company. Such forward-looking statements, as well as those included in any other material discussed at the presentation, concern future circumstances and results and involve known and unknown risks, uncertainties and other important factors beyond the Company’s control that could cause the actual results, performance or achievements of the Company to be materially different from future results, performance or achievements expressed or implied by such forward-looking statements. Such forward-looking statements are based on numerous assumptions and estimates regarding the Company and its subsidiaries’ present and future business strategies and the environment in which the Company will operate in the future. Forward-looking statements are not guarantees of future performance. These forward-looking statements speak only as at the date of this presentation, and none of the Company, nor any of its employees intends or has any duty or obligation to supplement, amend, update or revise any such forward-looking statements to reflect any change in the Company’s expectations with regard thereto or any change in events, conditions or circumstances on which any such statements are based or whether in the light of new information, future events or otherwise. Given the aforementioned risks, uncertainties and assumptions, you should not place undue reliance on these forward-looking statements as a prediction of actual results or otherwise.
3
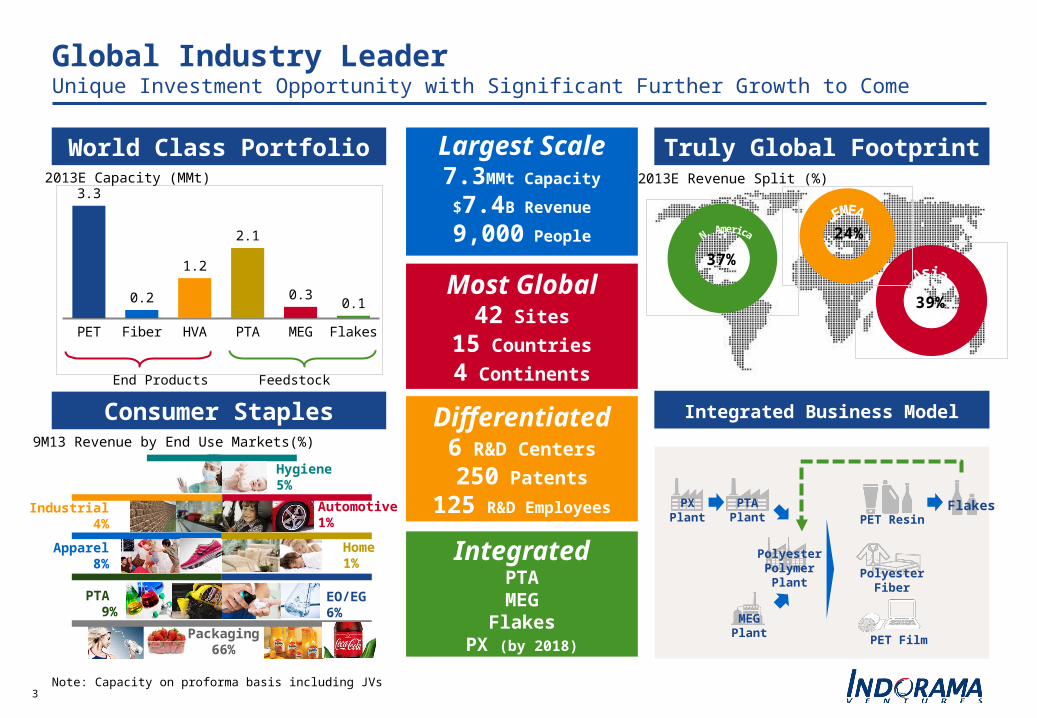
PET Fiber HVA PTA MEG Flakes
3.3
0.2
1.2
2.1
0.30.1
Global Industry Leader Unique Investment Opportunity with Significant Further Growth to Come
World Class Portfolio Truly Global Footprint
Consumer Staples Integrated Business Model
Note: Capacity on proforma basis including JVs
Largest Scale7.3MMt Capacity
$7.4B Revenue
9,000 People
Most Global42 Sites
15 Countries
4 Continents
Differentiated6 R&D Centers
250 Patents
125 R&D Employees
IntegratedPTAMEG
FlakesPX (by 2018)
End Products Feedstock
39%
24%
PXPlant
PTAPlant
MEGPlant
PolyesterPolymer
Plant Polyester Fiber
PET Resin
PET Film
Flakes
37%
2013E Revenue Split (%)
9M13 Revenue by End Use Markets(%)
2013E Capacity (MMt)
Hygiene5%
Automotive1%
Industrial4%
Packaging66%
Home1%
Apparel8%
PTA 9%
EO/EG6%

4
Dominant Presence Across The Value Chain Leading Businesses Aligned to Attractive Markets
Position Segment Region Share Main Players
PET Resin & Polymers
North America 31% Alpek, M&G
Europe 29% La Seda, Neo Group
China Pearl River Delta 42% CRC, Pan Asia
PET Resin
Thailand 38% Shinkong, Thai PET Resin
Indonesia 44% IRS, Petnesia
West Africa 75% Hosaf
Specialty Polyester FibersNorth America 16% Nan Ya, Alpek
Europe 29% Greenfibre, Elana
Commodity & Specialty Polyester Fibers
Thailand 32% TPC, Kangwal
Indonesia 22% Asia Pacific, Tifico
Bi-component PP Fibers World 28% Jiangnan, Far Eastern
Monocomponent PP Fibers North America, Europe 31% IFG, Meraklon
Recycled PET (RPET) Europe 6% Freudenberg, STF
Recycled Fiber (RFiber) Europe 16% Greenfibre, Sion
Merchant PEO North America 30% Shell, BASF
#1
#1
#1
#1
#1
#1
#1
#1
#1
Source: Industry Data, IVL Analysis
5
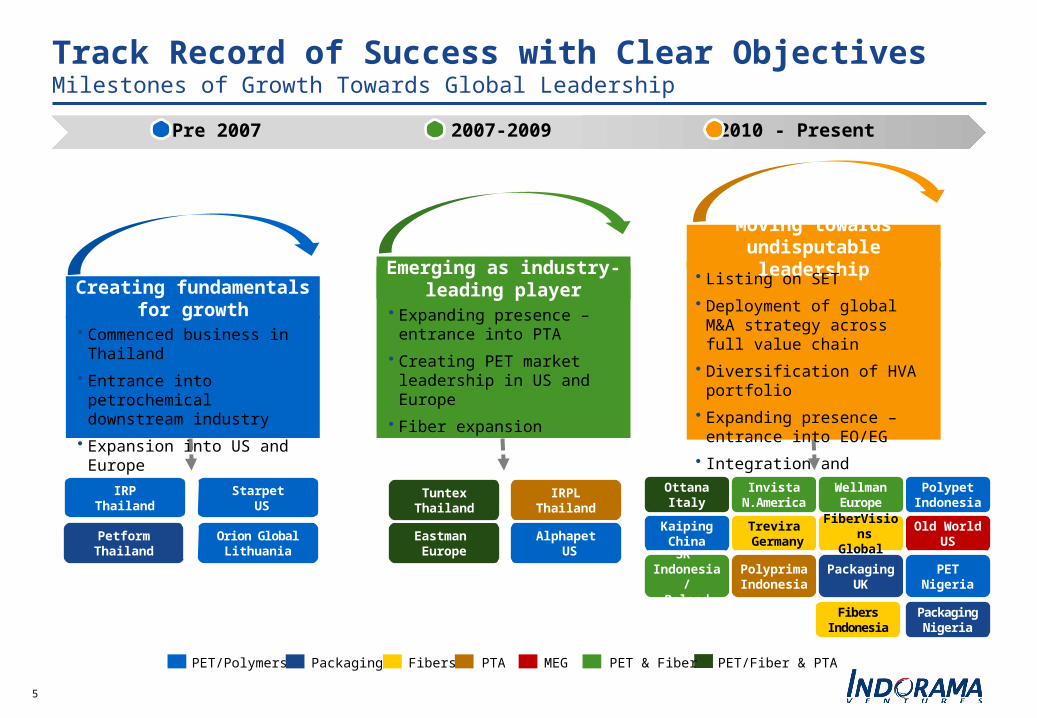
• Commenced business in Thailand
• Entrance into petrochemical downstream industry
• Expansion into US and Europe
Creating fundamentals for growth
Moving towards undisputable leadership
• Listing on SET
• Deployment of global M&A strategy across full value chain
• Diversification of HVA portfolio
• Expanding presence – entrance into EO/EG
• Integration and consolidation
Emerging as industry-leading player
• Expanding presence – entrance into PTA
• Creating PET market leadership in US and Europe
• Fiber expansion
Pre 2007 2007-2009 2010 - Present
Track Record of Success with Clear ObjectivesMilestones of Growth Towards Global Leadership
Fibers PET/Fiber & PTAPET/Polymers PTAPackaging PET & FiberMEG
Eastman Europe
TuntexThailand
IRPLThailand
Alphapet US
Orion GlobalLithuania
IRPThailand
PetformThailand
Starpet US
OttanaItaly
SK Indonesia/
Poland
Trevira Germany
InvistaN.America
KaipingChina
PolyprimaIndonesia
Old WorldUS
PolypetIndonesia
WellmanEurope
PackagingUK
FiberVisionsGlobal
PackagingNigeria
PETNigeria
FibersIndonesia
6
Key Drivers of Future EvolutionPrincipal Levers Creating Shareholders Value
7
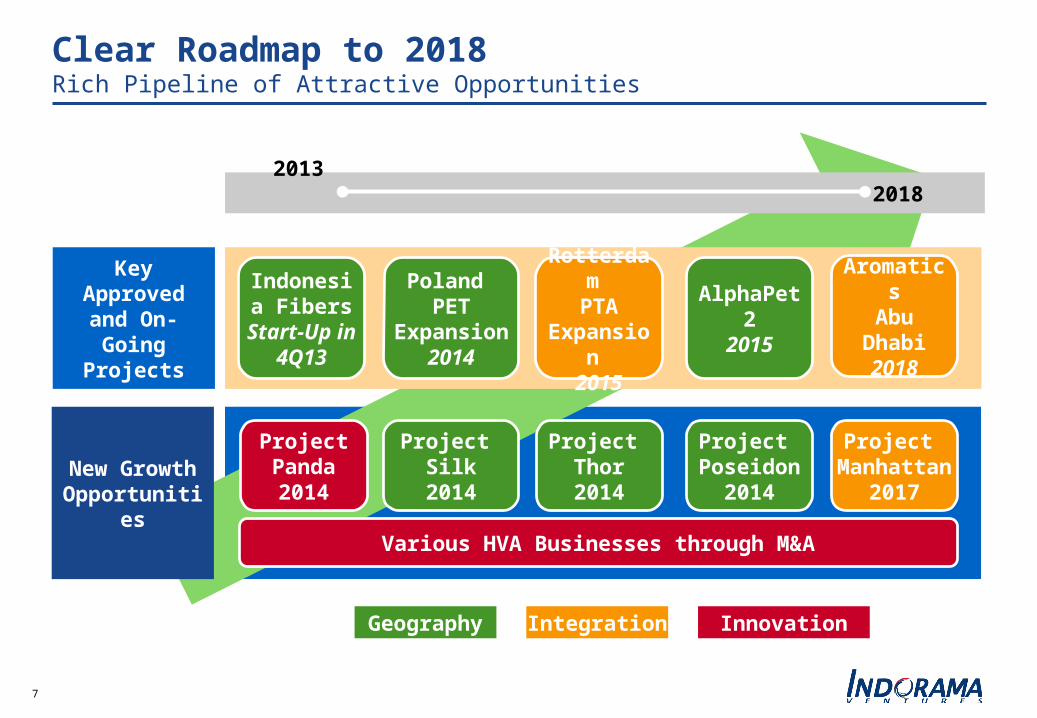
Clear Roadmap to 2018Rich Pipeline of Attractive Opportunities
Rotterdam PTA
Expansion 2015
ProjectPanda2014
Indonesia Fibers
Start-Up in 4Q13
Poland PET
Expansion 2014
Project Silk2014
Project Poseidon
2014
AromaticsAbu Dhabi
2018
Key Approved and On-Going
Projects
New Growth Opportunities
2013 2018
Geography Integration Innovation
AlphaPet 22015
Project Thor2014
Project Manhattan
2017
Various HVA Businesses through M&A
8
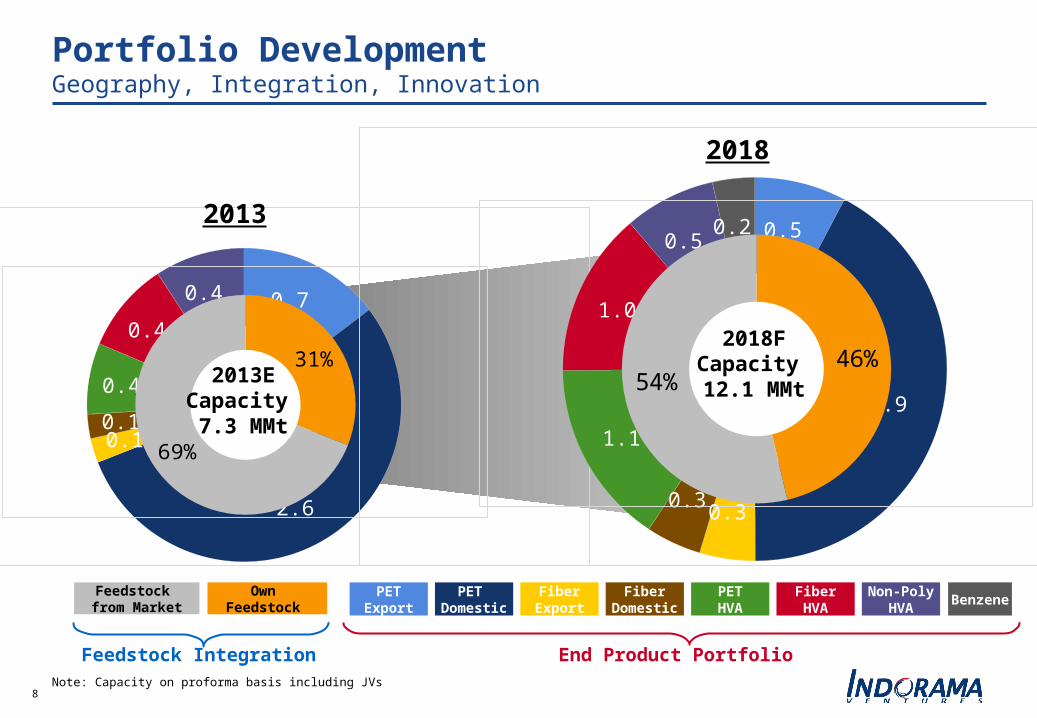
0.7
2.6
0.1 0.1
0.4
0.4
0.4
31%
69%
0.5
2.9
0.3 0.3
1.1
1.0
0.5 0.2
Portfolio DevelopmentGeography, Integration, Innovation
Feedstock from Market
Own Feedstock
PETExport
PET Domestic
FiberExport
FiberDomestic
PETHVA
FiberHVA
Non-PolyHVA
2013ECapacity 7.3 MMt
2013
46%54%
2018FCapacity 12.1 MMt
2018
Feedstock Integration End Product Portfolio Note: Capacity on proforma basis including JVs
Benzene
9
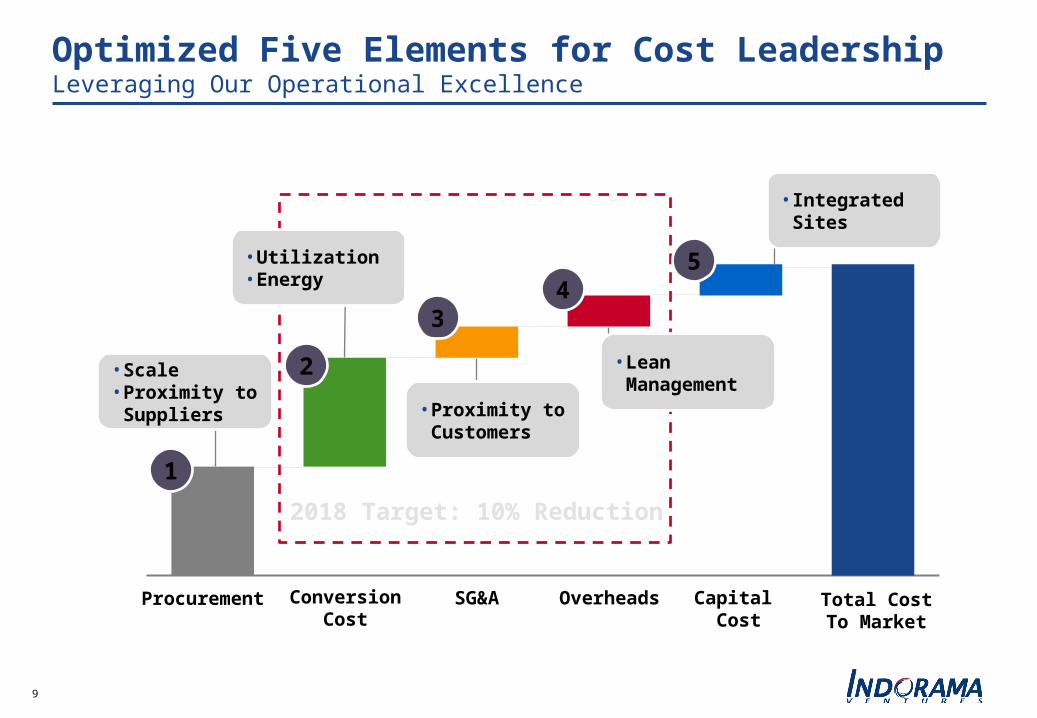
Optimized Five Elements for Cost LeadershipLeveraging Our Operational Excellence
Raw Material Cost
Manufactuing Cost
SG&A Overheads Capital Cost TotalTotal CostTo Market
Procurement ConversionCost
SG&A Overheads Capital Cost
1
2
34
5
• Scale • Proximity to
Suppliers
• Utilization• Energy
• Integrated Sites
• Proximity to Customers
• Lean Management
2018 Target: 10% Reduction
10
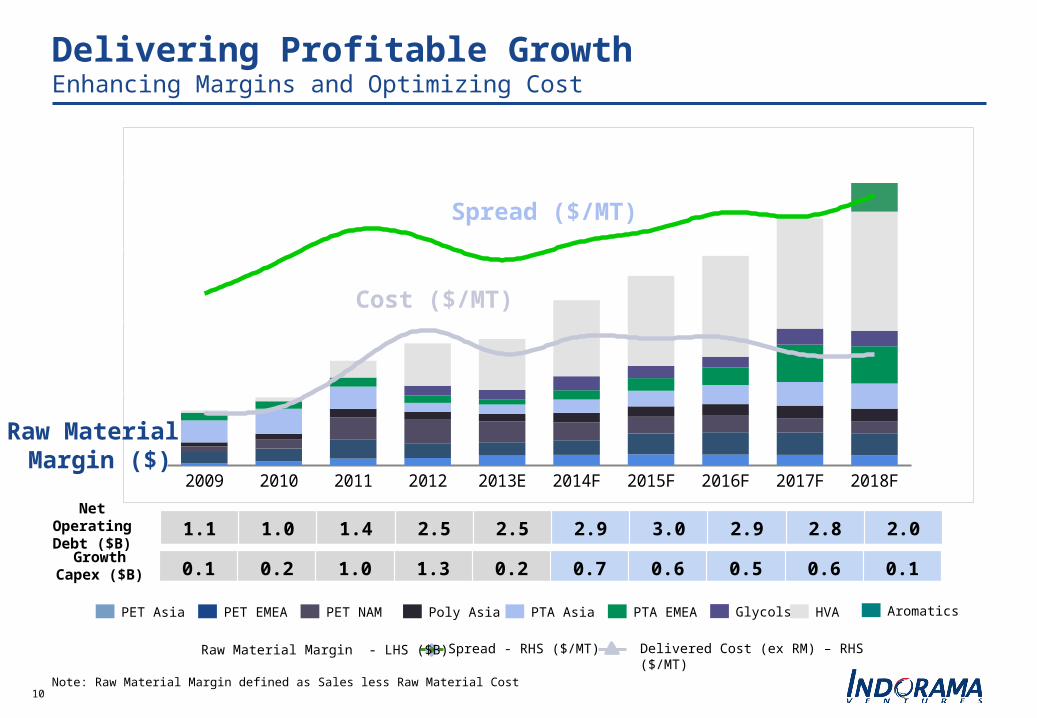
Delivering Profitable GrowthEnhancing Margins and Optimizing Cost
Note: Raw Material Margin defined as Sales less Raw Material Cost
Net Operating Debt ($B) 1.1 1.0 1.4 2.5 2.5 2.9 3.0 2.9 2.8 2.0
2009 2010 2011 2012 2013E 2014F 2015F 2016F 2017F 2018F0.0
500.0
1,000.0
1,500.0
2,000.0
2,500.0
3,000.0
3,500.0
4,000.0
4,500.0
100
150
200
250
300
350
400
PET Asia PET EMEA PET NAM HVAPoly Asia PTA EMEAPTA Asia
Spread - RHS ($/MT) Delivered Cost (ex RM) – RHS ($/MT)Raw Material Margin - LHS ($B)
Growth Capex ($B)
Aromatics
Spread ($/MT)
Cost ($/MT)
Raw Material Margin ($)
0.1 0.2 1.0 1.3 0.2 0.7 0.6 0.5 0.6 0.1
Glycols
11
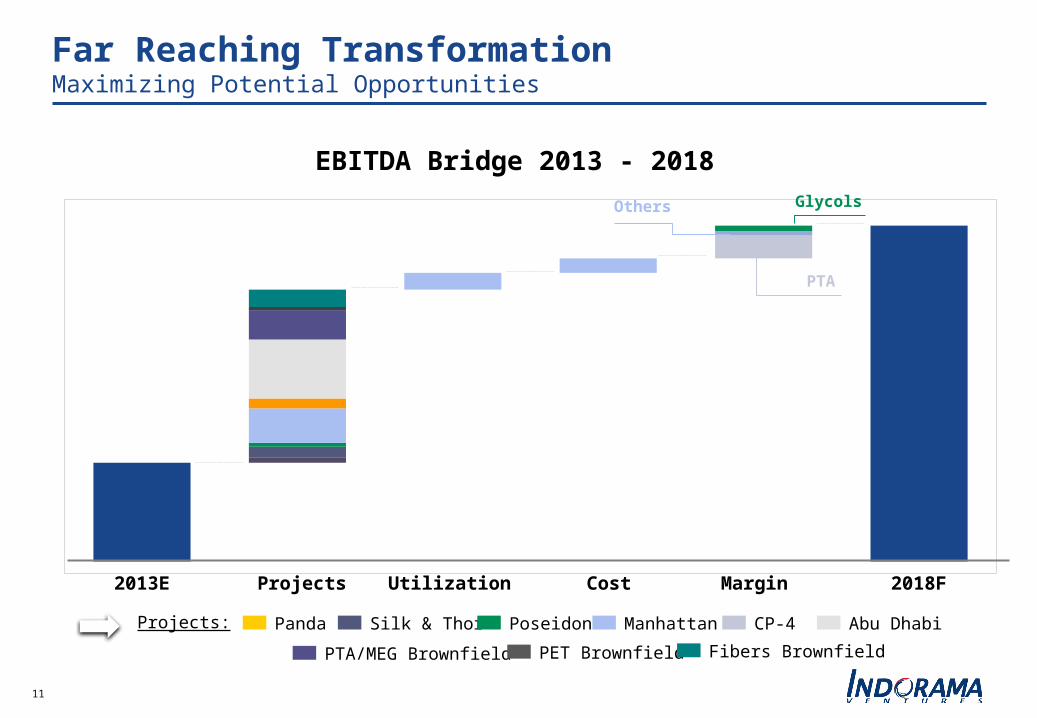
Far Reaching TransformationMaximizing Potential Opportunities
2018F2013E Utilization Cost MarginProjects
EBITDA Bridge 2013 - 2018
Panda Silk & Thor Poseidon
PTA/MEG Brownfield
Manhattan Abu DhabiCP-4Projects:
PET Brownfield Fibers Brownfield
PTA
Others Glycols
12
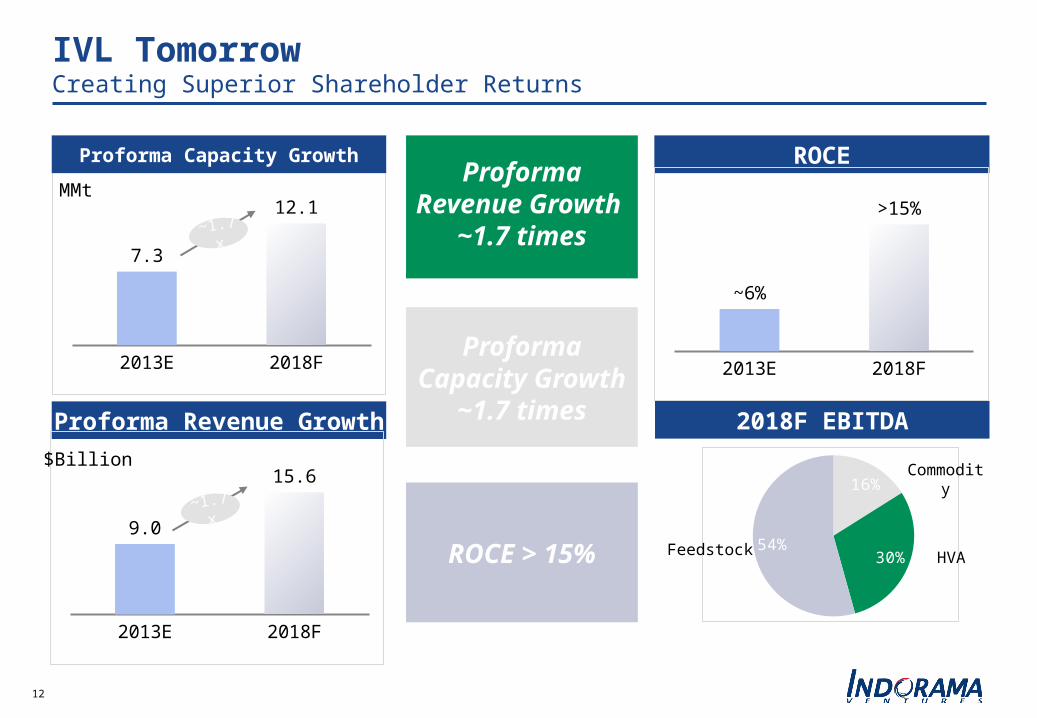
2013E 2018F
7.3
12.1
IVL TomorrowCreating Superior Shareholder Returns
Proforma Capacity Growth ROCE
Proforma Revenue Growth
16%
30%54%
MMt
2013E 2018F
9.0
15.6$Billion
2013E 2018F
~6%
>15%
2018F EBITDA
HVAFeedstock
Commodity
~1.7x
~1.7x
Proforma Revenue Growth
~1.7 times
Proforma Capacity Growth
~1.7 times
ROCE > 15%
13
Key Drivers of Our Growth Are Compelling
Recycling Innovation Integration
Operational Excellence
Leading Through Differentiation