capital positions of japanese banks - world...
TRANSCRIPT

Policy, Research, and External Affairs
WORKING PAPERS
Debt and International Finance
International Economics DepartmentThe World BankJanuary 1991
WPS 572
Capital Positionsof Japanese Banks
Edward J. KaneHaluk Unal
andAsli Derr,irguc-Kunt
Japanese banks are highly capitalized in terms of market value.Here is a method for testing hypotheses about determinants oftwo types of hidden capital in Japanese financial markets.
The Policy, Research, and External Affair-, Complex distributes PRE Working Papers to disseniinate the findings of work in progress andto encourage the exchange of ideas among Bank staff and al others interested in development issues. These papers carry the names ofthe author, reflect only their views, and should be used and cited accordingly. The findings, interpretations. and conclusions are theauthors' own. They should not be attnbuted to the World Bank, its Board of Directors, its management, or any of its member countries.
Pub
lic D
iscl
osur
e A
utho
rized
Pub
lic D
iscl
osur
e A
utho
rized
Pub
lic D
iscl
osur
e A
utho
rized
Pub
lic D
iscl
osur
e A
utho
rized

Policy, Reow reh, and External AH lrs
Debt and International Finance
WPS 572
This paper - a product of the Debt and Intemational Finance Division, Intemational EconomicsDepartment - is part of a larger effort in PRE to study alternative sources of extemal finance. Copies areavailable free from the World Bank, 1818 H Street NW, Washington DC 20433. Please contact SheilahKing-Watson, room S8-025, extension 33730 (35 pages).
Japanese banks are promising sources of capital class size/charter partition of the Japanesefor developing countries wishing to finance a banking system. For each type of hidden capitalbalance of payments gap. Kane, Unal, and and each class of bank, the model developsDemirguc-Kunt show that Japanese banks are estimates of the stock market, interest rate,highly capitalized in terms of market value; foreign exchange, and real estate sensitivities ofmuch of their capital is "hidden capital," the returns to bank stockholders.divergence between accounting and stock marketestimates. Only the stock market sensitivities prove
significant, at 5 percent. Time-series regressionsKane and associates developed a method for show that the large Japanese banks have devel-
testing hypotheses about two types of hidden oped stock market betas over two and that thecapital: the misvaluation of on-balance-sheet value of the bank's beta has come to increaseitems (post-acquisition gains and losses that, with measures of its size and accounting lever-although they remain unbooked, are bookable age.upon the sale of the item under Gencral Ac-cepted Accounting Principles (GAAP)) and Future research will investigate the sensitiv-intangible values that GAAP currently desig- ity of these results to different ways of poolingnates to be unbookable off-balance-sheet items. data from individual banks and to more sophisti-
cated methods for estimating various parameters.They construct a model that explains They also plan to extend the analysis by imbed-
changes in both types of capital functions of ding it in a model of how variations in bank-holding-period retums eamed in Japan on stocks, customer contracting arrangements in Japanbonds, yen, and real estate. They apply the affect the retums bank stockholders can cam.model to annual data for 1975-89 and a four-
The PRE Working Paper Series disseminates the findings of work under way in the Bank's Policy, Research, and ExtemalAffairsComplex. Ancbjective oftheserics is to getthesefindings outquickly, vcan if presentations arc less than fully polished.The findings, interpretations, and conclusions in these papers do not necessarily represent official Bank policy.
Produced by the PRE Dissemination Center

CAPITAL POSITIONS OF JAPANESE BANKSt
Edward J. Kane*
Haluk Unal**
Asli Demirguc-Kunt***
* The Ohio State University and the NBER.** University of Maryland*** World Bank, Washington, D.C.t The authors wish to thank Daniel Kobb for research assistance and to
acknowledge helpful comments from Thomas Cargill, Ray Y. Chou, andRichard Pettway and from audiences at Southern Methodist University andTexas A&M University.
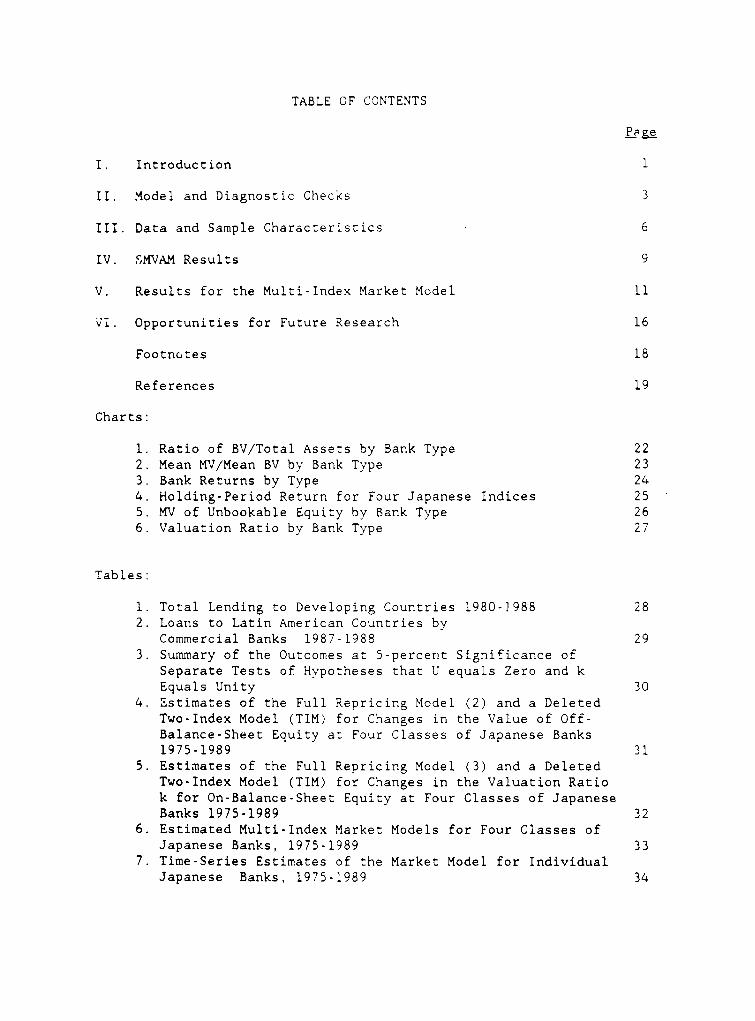
TABLE OF CONTENTS
Pa
I. Introduction 1
II. Model and Diagnostic Checks 3
III. Data and Sample Characteristics 6
IV. .'MVAM Results 9
V. Results for the Multi-Index Market Model 11
v!. Opportunities for Future Research 16
Footnotes 18
References 19
Charts:
1. Ratio of BV/Total Assets by Bank Type 222. Mean MV/Mean BV by Bank Type 233. Bank Returns by Type 244. Holding-Period Return for Four Japanese Indices 255. MV of Unbookable Equity by Bank Type 266. Valuation Ratio by Bank Type 27
Tables:
1. Total Lending to Developing Countries 1980-]988 282. Loans to Latin American Countries by
Commercial Banks 1987-1988 293. Summary of the Outcomes at 5-percent Significance of
Separate Tests of Hypotheses that U equals Zero and kEquals Unity 30
4. Estimates of the Full Repricing Model (2) and a DeletedTwo-Index Model (TIM) for Changes in the Value of Off-Balance-Sheet Equity at Four Classes of Japanese Banks1975- 1989 31
5. Estimates of the Full Repricing Model (3) and a DeletedTwo-Index Model (TIM) for Changes in the Valuation Ratiok for On-Balance-Sheet Equity at Four Classes of JapaneseBanks 1975-1989 32
6. Estimated Multi-Index Market Models for Four Classes ofJapanese Banks, 1975-1989 33
7. Time-Series Estimates of the Market Model for IndividualJapanese Banks, 1975-1989 34

CAPITAL POSITIONS OF JAPANESE BANKS
I. Introduction
In recent years, Japanese banks have become major players in world finance.
Many apparently knowledgeable observers attrioute this development to the
maintenance of inappropriately low capital requirements by Japanese authorities
(Corrigan, 1987: Pettway, Kaneko, and Young, 1990). However, Japanese banks are
not undercapitalized. Their stocks show market capitalizations that average
several times the vilue of the banks' accounting net worths (Kane, 1987; Baer
and Mote, 1989).
Since becoming major world financial institutions, Japanese banks have also
become more important lenders to developing countries. Table 1 documents the
magnitude of Japanese bank lending to developing countries. Japanese banks have
consistently expanded their developing country lending and increased their
individual country exposure in Latin America (Table 2). Berteen 1987 and 1988,
although other miajor countries decreased loans to the regionr's top four debtor
countries (Argentina, Brazil, Mexico and Venezuela), Japanese banks added to
their positions in these countries' debt.
For developing countries wishing to finance a balance-of-payment gap,
Japanese banks are promising sources. This paper studies the capital positions
of Japanese banks to understand be..er the growth in market capicalization that
underlies these banks' ability to vithstand the risks of developing-countrv2
lending.

2
Divergences between accounting and stock-market estimates may be described
as "hidden capital." Kane and Unal (1990) develop a method for testing
hypotheses about determinants of two tvpes of hidden capital: the misvaluation
of on-balance-sheet items (post-acquisition gains and losses that, although they
remain unbooked, are bookable upon the sale of the item under Generally Accepted
Accounting Principles, GAAP) and intangible values which GAAP currently
designates to be unbookable off-balance-sheet items.
This paper shows that Japanese banks are highly capitalized on X r,arket-
value basis and tests hypotheses about the determinants of hidden capital at
Japanese bank.. We first develop estimates of a valuation ration, k, by which
to adjust the book value of a firm's net worth and of the net market value of
unbookable equity elements, U. These parameters are estimated by regressing
cross-sectionally the market value of the institution's market capitalization
on the book value of its accounting net worth. This regression equation forms
the heart of what Kane and Unal (19'10) call the Statistical Market Value
Accounting Model, SMVAM.

A second block of the model endogenizes changes in k and U as functions
of ex post holding period returns on stocks, bonds, yen, and Japanese real
estate. This formulation permits us not only to test hypotheses about the
determinants of both forms of hidden capital, but to use the model to
explain variation in the me.rket, interest, foreign-exchange, and real-estate
sensitivities of an institution's stock.
The analysis extracts market, interest-rate, foreign-exchange, and
real-estate sensitivities from a time series of cross-section regressions
that use accounting and rate-of-return information to explain the market
value of stockholder equity claims. The f'rst block of the model is
estimated for each of the 15 years 1975-1989 for four categories of Japanese
banks. The four-class partition of the banking system represents a
conventional Japanese classification that uses the names city banks, long-
term credit banks, trust banks, and regional banks. This classification
closely approximates a size-based partition, with city banks having the
largest average asset size and regional banks the smallest average asset
size throughout the period we study.
II. Model and Diagaostic Checks
The SMVAM is estimated separately at each date for members of each
class of institution:
MV - Ut + ktBV + e. (1)

4
MV and BV denote the market and book value of firm equity. U is interpreted
as the market value of unbookable equity, while k is the valuation ratio
that serves to adjust the value of bookable items to market. These
coefficients measure the de facto deceptiveness of the Japanese accounting
system. Unless both U - 0 and k - 1, the accounting or book value of a
bank's capital represents a biased estimate of the market value of
stockholder equity. If the estimated intercept is significantly positive
(negative), unbookable assets and liabilities serve as a net hidden source
of (drain on) institutional capital.
Equation (1) assumes that a single mark-up or mark-down ratio, k
applies to all accounting values reported by the institution. In effect, a
single valuation ratio k is assumed to apply to every component of each
institution's book equity. We test this restriction by estimating different
coefficients for aggregate assets and aggregate liabilities i each class
of bank. However, except for regional banks, the hypothesis of a common k
proves impossible to reject. Even for regional banks, significant
differences between asset and liability valuation ratios emerge only after
1985.
A second diagnostic check is to test for nonlinear terms in SMVAM. In
particular, we investigate the effect of introducing a squared or quadratic
term in BV. The coefficient of the squared term proves insignificant at 5
percent for city banks in all years. However, although we choose not to
pursue the issue here, the evidence suggests that a nonlinear specification
may be appropriate in some years and especially for smaller institutions,

5
Long-term credit and trust banks show significant and positive coefficients
for BV2 in years 1982-84 and 1988. For regional banks, the BV2 coefficient
proves significantly negative in 1977 and 1981-83, but becomes positive and
significant 'i. iater years, 1985-88.
The parameters of the linear SMVAM are U and k. When returns on
competitive assets change over time, these parameters should respond. Using
an annual observation period, we approximate this response by a linear
model of market returns, interest rates, dollar investments in yen, and
returns on Japanese real estpte:
u Ut - u + O Rmt + rRt + #fR t + ' RL (2)
-k ~k k kt ok'tL't Vt 3kt - kt.l - 00 + 0m RMt + 0rRt + OkfFt + pkRLt + w t'(3)
Rmt Rt, RFt' and RLt represent holding-period returns on a stock-market
index, a bond index, dollar investments in yen, and Japanese real estate,
respectively. We include RFt and R½t to test the often-heard conjecture that
Japanese bank stock has benefited greatly from appreciation in the yen and
in Japanese real estate. The vt and wt are stochastic error terms The slope
coefficients measure the market, interest-rate, foreign-exchange, and real-
estate sensitivity of SMVAM's parameters.
Equations (2) and (3) are offered as flexible functional forms that
parameterize in an interpretable and parsimonious way revaluations that

6
asset markets make continually. Results to be developed in later sections of
this paper indicate that movements in Ut and k are explained predominantly
by the first influence (stock returns), with the other vaLiables having no
significant effects. The Japanese stock-market index proves significant for
every class of bank. This is consistent with a further finding that Japanese
banks have come to own over 40 percent of the universe of Japanese corporate
stocks. This makes investment in these banks' stock shares in large part a
leveraged investment in the Japanese stock market as a whole.
To furnish a complementary perspective, we also estimate a traditional
multi-ind.-: market model. Using this model, stock-market betas for large
Japanese banks are shown to surge sharply upward after 1983.
III. Data and Sam'le Characteristics
The data set includes market and book values for the capital and total
assets of every Japanese bank in existence during the 1975-1989 sample
period. For regional ban!s, the sample size varies over the sample period,
but 13 city banks, 3 long-term credit banks and 6 trust banks exist
throughout. (A seventh trust bank exists, but its stock does not trade.)
The number of regional banks sampled expands from 44 to 91.
Data are obtained from Nihon Keizai Shimlun America, Inc. Market values
are determined in accordance with Japanese corporate reporting practices as
of March 31st and calculated as the product of share price and number of
shares outstanding. The book value of equity capital totals accounting

7
entries for stock subscription, legal reserves and ea.rned surplus at the
same dates.
Chart 1 reports ratios of the book value of stockholder equity to t,tal
assets. Although these ratios are mvch lower than those reported by
comparable U.S. banks, these banks cannot reasonably be characterized as
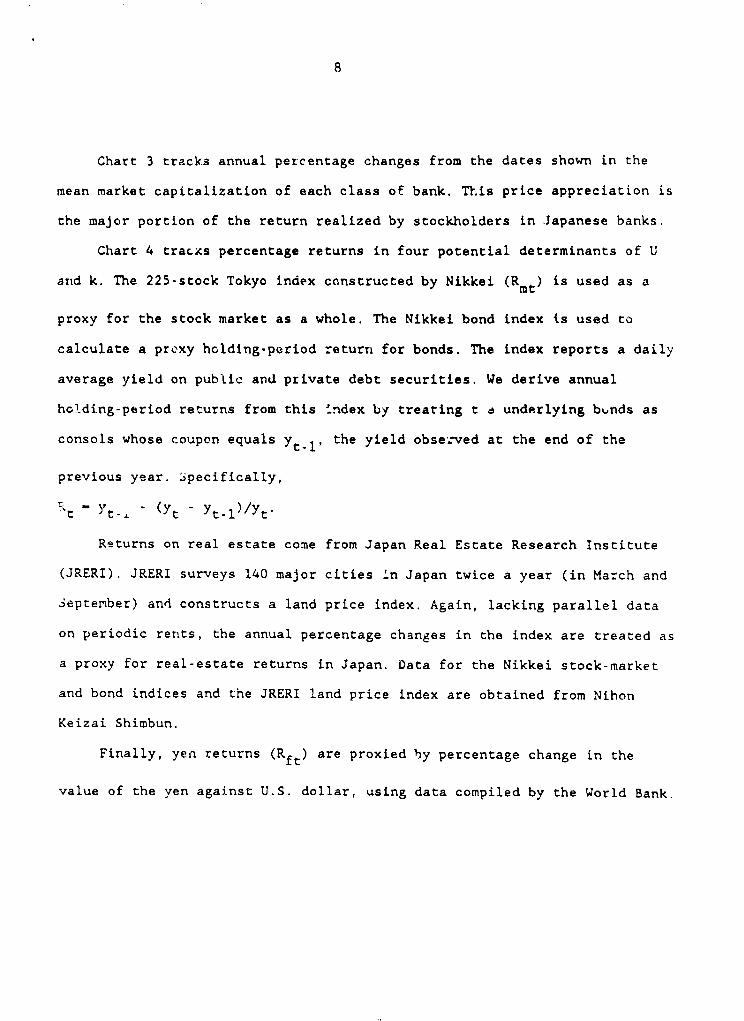
lacking in capital. Chart 2 clarifies that over the sample period a high and
rising ratio of mean market value to book value obtained for city bank-,
long-term credit banks, trust banks and regional banks.
These charts indicate that hidden capital expands greatly during the
late 1980s. The MV/BV ratio first exceeds 2 for city banks and long-term
credit banks in 1982 and for trust banks in 1984. Tte ratio continues to
increase until 1987, when it peaks for the first three classes, at 8.9,
10.6, and 11.8, respectively. From these respective peaks, MV/BV declines to
5.8, 7.5 and 4.9 by 1989.
Compared to the other three classes, regional banks show a lower and
less-volatile MV/BV ratio. The ratio does not exceed two until 1986, peaks
at 3.28 two years later, and declines to 2.96 in 1989.
The indices needed to estimate equations (2) and (3) have to be
approximated. Although data on dividend yields are lacking, Japanese
dividend rates are reputed to be low and relatively stable. This makes it
reasonable to approximate the holding-period return on a stock by its annual
rate of price appreciation.
8
Chart 3 tracks annual percentage changes from the dates shown in the
mean market capitalization of each class of bank. TEhis price appreciation is
the major portion of the return realized by stockholders in Japanese banks.
Chart 4 tracxs percentage returns in four potential determinants of U
and k. The 225-stock Tokyo index constructed by Nikkei (Rmt) is used as a
proxy for the stock market as a whole. The Nikkei bond index is used to
calculate a proxy holding-period return for bonds. The index reports a daily
average yield on public and private debt securities. We derive annual
holding-period returns from this Index by treating t e underlying bunds as
consols whose coupon equals Ytl1 the yield obse.-ved at the end of the
previous year. specifically,
t yt-. (Yt -Yt1)/Yt
Returns on real estate come from Japan Real Estate Research Institute
(JRERI). JRERI surveys 140 major cities in Japan twice a year (in March and
September) and constructs a land price index. Again, lacking parallel data
on periodic rernts, the annual percentage changes in the index are treated as
a proxy for real-estate returns in Japan. Data for the Nikkei stock-market
and bond indices and the JRERI land price index are obtained from Nihon
Keizai Shimbun.
Finally, yeci returns (Rft) are proxied by percentage change in the
value of the yen against U.S. dollar, using data compiled by the World Bank.

9
IV. SMVAM Results
SMVAM's accounting equation has two parameters. Charts 5 and 6 display
the pattern of annual cross-sectional estimates at each of the four bank
classes. With only three banks in the long-term credit bank class, separate
regressions for this class have only one degree of freedom and large
standard errors. Nevertheless, covariance or dummy-variable analysis shows
that these institutions differ so significantly from the other three classes
that it is inappropriate to pool them with any other class.
To test the U - 0 and k - 1 hypothesis of "fully informative accounting
values" for each class separately, we focus on the time series of
coefficient deviations from the hypothesized values. Table 3 reports test
results.The combined U-0 and k-l condition which would make recorded equity
an unbiased estimate of rarket value is rejected for city banks in all years
and is accepted for long-term credit banks only in 1980. Accounting
representations of trust banks prove de:eptive in all but two years: 1980
and 1981. In contrast, accounting data for regional banks appear reliable
through 1984. But after that date, the regional. banks' k proves
significantly greater than unity.
For city banks, the deviations of U and k retain a single sign
throughout. U is negative and significant, indicating net unbookable items
as a drain on equity. As a percentage of mean MV, this drain begins at 6
percent in 1975, peaks in 1984 at 40 percent, and decreases to 23 percent in
1989. The valuation ratio for bookable items proves significantly in excess
of one and reaches very high levels in the late 1980s.

10
A high valuation ratio constitutes evidence of on-balance-sheet "hidden
capital." Securities and real estate that are carried on bank books at
historical cost become increasingly undervalued when market values trend
upward. Throughout the late 1980s, unbooked but bookable capital gains
appear substantial. If a market-value accounting system were used, increases
(and decreases) in market values would La booked as earnings as they accrue
and reflected in the book value of equity. However, if used as a basis for
calculating taxable income, market-value tax accounting would simultaneously
create an immediate tax liability on accrued gains. Under the system of
cash-flow tax accounting that is in place, Japanese banks effect tax savings
by not immediately realizing (i.e., encashing) their capital gains.
For large banks, off-balance-sheet equity proves large and negative in
many instances, especially in the later years of our sample. The pattern of
secular fall and 1988-89 recovery mirrors the rise and fall of the MV/BV
ratios reported in Chart 2. This is consistent with the hypothesis that
observed negative off-balance-sheet positions can be conceived
predominantly as reserves for deferred taxes on unrealized gains in stock
and real-estate holdings. U must also capture the capitalized value of the
implicit net subsidy or tax associated with restrictions or advantages
conferred on banks by the Japanese Ministry of Finance (MOF). We hold that
movements in tax reserves dominate U because it is unlikely that the net
advantageousness of MOF restrictions could change as rapidly from year to
year as our estimates of U do.

i1
We turn now to the revaluation equations (2) and (3), which are
estimated in Tables 4 and 5. For every bank class, results are qualitativel.'
the same. Off-balance-sheet equity decreases as stock returns increase
(significantly so for city and long-term credit banks). It also decreases
with bond and foreign-exchange returns and rises with land returns, but not
significantly. The valuation ratio k for on-balance-sheet items shows in
each case an opposite pattern, and again only the stock return ever achieves
significance. However, because error terms are apt to be correlated within
and across bank classes, ordinary-least-squares estimates of standard errors
are biased upward. More-efficient estimation methods might well render real-
estate, foreign-exchange, or bond returns significant in at least some
cases.
During the first quarter of 1990, while the Nikkei 225 index declined
by roughly 25 percent, the market capitalization of individual city banks
declined by as much as 33 percent. To the extent these banks represent a
leveraged investment in the stock market as a whole, a massive stock-market
decline could rapidly undermine the strength of large Japanese banks'
capital positions.
V. Results for the Multi-Index Market Model
Tables 4 and 5 assign Rm and the other index variables opposite effects
on U and k. The hypothesis that U may be interpreted principally as a
reserve for deferred taxes implies that these variables' effects through k
shuuld strongly outweigh their effects through U.

12
Fitting a multi-index market model (MIMM) provides a straightforward
way to check this. The version of MIMM that we fit expands the basic market
model by adding bond returns, real-estate returns, and returns on dollar
investments in yen. We include returns on yen and real-estate even though
they prove insignificant in Tables 4 and 5 because we want to allow for the
possibility that effects operating through U and k might cumulate to
significance. The MIMM stochastic return-generating process specifies that
the return Rp on portfolio p is:
RPt - %+ Omp Rmt +rp Rt + Ofp Rft +Lp RLt +zt. (4)
In (4), MP' rp' 6fp, and OLp measure the portfolio's systematic market,
interest-rate, foreign-exchange and real-estate risk.
We construct Rpt as an equal-weighted portfolio of returns for every
bank in each class. For each class, Table 6 reports pooled time-series,
cross-section estimates of equation (4).
For each class, the net sensitivity of bank stock price appreciation to
market returns turns out to be positive and significant. For the largest
three size classes, stock-market betas all exceed two. Because Charts 3, 5,
and 6 suggest a mid-1980s shift in return-generating processes for banks, we
experiment with relaxing the assumption of stationarity by fitting the model
separately to 1975-83 and 1984-89 under the restriction fp and Lp equal

13
3zero. In these runs, betas prove negative for the three largest size
classes in the early years and positive and large during the 1984-19894
period only.
The striking feature of the various runs is the sky-high level of
market risk toward which the average member of the first three bank size
classes evolved. These betas range from 2 to 3, which is two to three cimes
the magnitude of the estimates both for regional Japanese banks and of
parallel estimates for large U.S. banks obtained by Unal and Kane (1988)
with quarterly 1975.1985 data. These high betas confirm the hypothesis that,
when a leveraged institution has a large diversified position in the stock
market, its market capitalization moves by a multiple of the price movements
observed for the market as a whole.
In the Japanese stock-market decline of the first quarter of 1990, the
prices of the high-beta bank stocks fell more rapidly than the overall
Japanese market index. This has important implications for policymakers. The

14
capital position of banks that invest heavily in corporate stock is more
volatile than the stock market itself. The market capitalization of high-
beta bank stocks can decline suddenly and markedly. In a world where
governments insure de facto all of the debts of large domestic banks, this
volatility implies that, to protect Japanese taxpayers, risk-based market-
value capital requirements should be designed to increase with the size of
each bank's market beta.
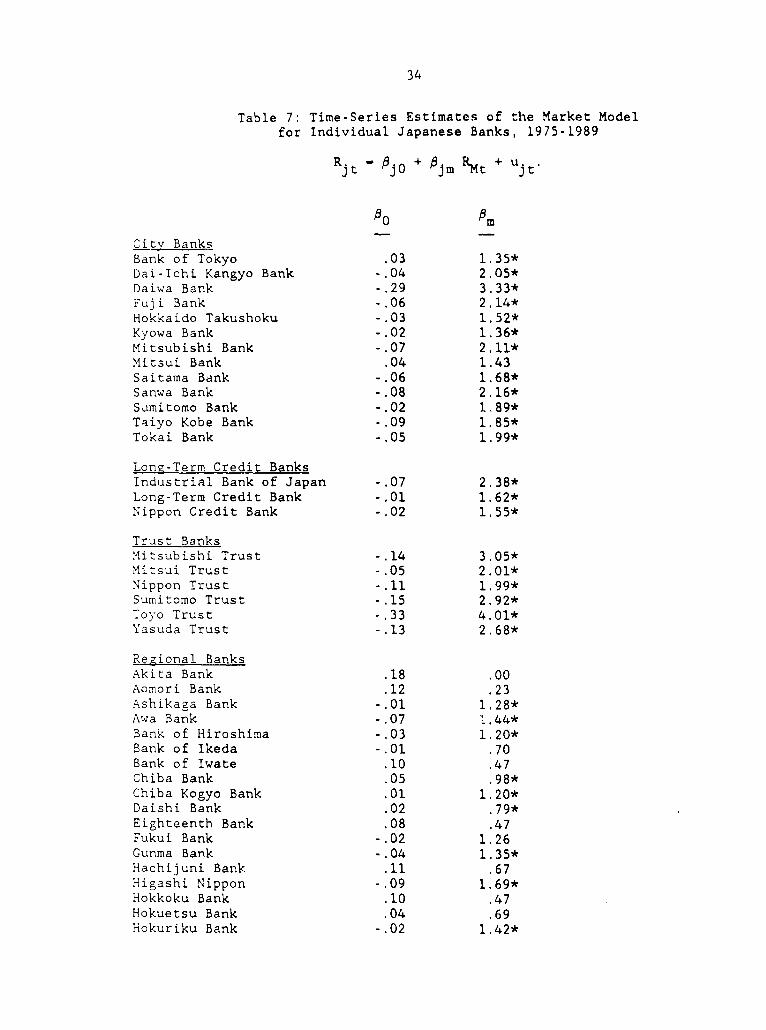
Individual-Bank Runs. To investigate within-class variation in market betas,
Table 7 reports the results of estimating the one-index version of equation
(4) for the individual banks in each class for which we have data for all 15
years. Although we do not report results for the four-index model, R, RL,
and Rf prove significant in time-series runs for only few of these banks.
The market betas found for most members of each of the three largest
size classes prove to be of the same order of magnitude as in the pooled
run. The 24 regional banks that show significant market betas appear to
follow portfolio strategies that are more similar to those followed by
larger institutions than to those pursued by fellow members of their charter
class.
When we allow for a possible structural shift in individual market
betas after 1983, high market betas develop only during the later subsample.
A visual inspection of the data reveals that high betas are typically driven
by 1985, 1987 and 1988 observations. In these years, the market
capitalizations of institutions show extraordinary increases relative to the

15
market. These beta estimates are much higher than those reported by Pettway,
Tapley and Yamada (1988). Pettway, Tapley and Yamada cover different sample
years (1982-1983 and 1984-1986) and use daily data. Neglecting data from
1987-89 would tend to lower our beta estimates substantially. To some
degree, these authors' lower betas may also reflect downward bias due to
employing daily data on stocks that fail to trade daily.
Tracking Variation in Market Betas at Individual Banks. Pettway, Sicherman,
and Yamada (1990) contrast an observed tendency for market betas of Japanese
corporations to increase with size against the stylized tendency for market
betas to decline with size for U.S. firms (Reinganum, 1981; Chang and
Prinegar, 1989). These authors attribute this differential behavior to
presumed differences in management objectives at U.S. and Japanese
corporations. While U.S. corporations' internal diversification is believed
to increase with size, in Japan agency costs associated lender influence on
decisions by corporate managers are held to rise with size. Agency costs in
Japanese banking relationships are studied by Hoshi, Kashyap, and
Scharfstein (1989).
The following ad hoc regression equation supports the hypothesis that
Japanese banks with high market betas are larger and more highly leveraged
than other banks:
jm- -.81 - 32.1 (BV./TA.) + 0.22 (ln TA R _ 22. (5)jm (- .43) (1.98) (2.06)

16
In (5), t-values are reported in parenthesis, jm is bank j's market
- - ~~~~~thbetas from Table 7, while BV. and TA; denote the j bank's average book-
value and total assets over 1975-1989.
When the market model and the ad hoc equation (5) are fitted separatelv
to 1975-83 and 1984-89, the magnitude and significance of the slope
coefficients may be traced entirely to the 1984-89 period. Before 1984,
leverage does not significantly affect a Japanese bank's market beta. As
with U.S. banks, betas significantly decline with size. Hence: this
divergence between U.S. and Japanese bank behavior is of recent origin.
VI.Opportunities for Future Research
Although the ordinary-least-squares estimates reported in this paper
seem reliable enough to support qualitative inferences, more sophisticated
econometric procedures may be able to establish a role for bond, land, or
foreign-exchange returns. In future research, we plan to use seemingly
unreated regression, crossed regression, nonlinear formulations,
simultaneous-equation models, and heteroskedasticity adjustments. We also
plan to use covariance analysis to disaggregate regional banks into high-
beta and low-beta groups and to test whether SMVAM equations for banks with
similar betas can be pooled across charter types.
We further plan to analyze contracting arrangements inherent in
Japanese financial institutions and markets. The goal of this investigation
is to help us to sort out how contracting arrangements between and among

17
banks and related and unrelated corporations affect the size and
distribution of agency costs in Japan.

18
FOOTNOTES
1. This figure is lower after the recent decline of the Japanese stock market.
2. More recently there has been an overall decrease in commercial bank exposure
to developing countries. Nevertheless, Japanese ban k exposures still remain one
of the highest among creditor countries.
3. Support for the timing of this sample partition may also be found in
regulatory events. Pettway, Tarpley, and Yamada (1988) associate a post-1983
expansion of bank risk-taking with a reduction in administrative guidance, while
Cargill and Royama (1988) note an acceleration in money-market development.
4. Experiments not reported here allow each of Rfp and RLP to be the second index
and confirm the usefulness of going on to allow for structural shifts in (2) and
(3) as well.

19
REFERENCES
Baer, Herbert, and Larry Mote, 1989. "Preparation for Globalization: The
U.S. domestic Market," Handout at Conference on financial Globalization
sponsored by Federal Reserve Bank of Chicago and Mid-America Instirute
(November 2-3).
Cargill, Thomas F., 1989. Central Bank Independence and Regulatory
Responsibilities: The Bank of Japan and the Federal Reserve, Monograph
1989-2 in Monograph Series in Finance and Economics, Stern School of
Business, New York University.
and Shoichi Royama, 1988. The Transition of Finance in
Ja2an and the United States: A ComRa7ative Perspective. Stanford: Hoover
Press.
Chang, Eric C., and J. Michael Pinegar, 1989. "Seasonal Fluctuations in
Industrial Production and Stock Market Seasonals," JFOA, 24 (March) pp.
59-74.
Corrigan, E. Gerald, 1987. "Statement", Harings, U.S. Congress, Senate
Budget Committee, Washingtcn, D.C. (May 6).
Goldfeld, S.M. and R.E. Quandt, 1976, "Techniques for Estimating Switching
Regressions" in Goldfeld and Quandt (eds.), Studies in Nonlinear
Estimation, Cambridge, MA: Ballinger Publishing Co.
Hoshi, Takeo, Anil Kashyap, and David Sharfstein, 1989. "Bank Monitoring and
Investment: Evidence from the Changing Structure of Japanese Corporate
Relationships," National Bureau of Economic Research Conference on
Information, Capital Markets, and Investment, Cambridge, Mass. (June),

20
Kane, Edward J., 1987. "Competitive Financial Reregu.ation: An International
Perspective" in R. Portes and A. Swaboda (eds.), Threats to
International Financial Stability, Cambridge: Cambridge University
press, 1987, pp. 11-145.
Kane, Edward J. and Haluk Unal, 1990, "Modeling Structural and Temporal
Variation in the Market's Valuation of Banking Firms." Journal of
Finance, (March 1990) forthcoming.
McDonald, Jack, 1989, "The Mochiai effect: Japanese Corporate Cross-
Holdings," The Journal of Portfolio Management, Fall 1989, pp. 90-94.
Pettway, Richard, Takashi Kaneko, and Michael T. Young, 1990. "Wealth
Effects of Capital Structure Changes by Japanese Banks," paper prepared
for the Second Annual Pacific-Basin Finance Conference, Bangkok,
Thailand.
Pettway, Richard H., Neil W. Sicherman, and Takeshi Yamada, 1989. "The
Market for Corporate Control, the Level of Agency Costs, and Corporate
Collectivism in Japanese Mergers," in EltoA1, Edwin J., and Martin J.
Gruber (ed.), Japanese Capital Markets: Analysis and Characteristics of
Eguitv. Debt. and Financial Futures Markets, Cambridge, Mass.:
Ballinger. 1990.
Pettway, Richard H., T. Craig Tapley, and Takeshi Yamada, 1988. "The Impacts
of Financial Deregulation Upon Trading Efficiency and the Levels of Risk
and Return of Japanese Banks." Financial Review. 23 (August), pp. 243-
268.

21
Reinganum, Marc R , 1981. "Misspecification of Capital Asset Pricing:
Empirical Anomalies Based on Earnings' Yields and Market Values,"
Journal of Financial Economics, 9 (March), pp. 19-46.
Unal, Haluk and Edward J. Kane, "Two Approaches to Assessing the Interest
Rate Sensitivity of Deposit Institution Equity Returns," Research in
Finance, ed. Andrew Chen, JAI Press, Vol. 7, 1988, pp. 113-137.

22
Z-4~~~~~~~~~
I~~~~~~~I
A =H~~~~~~~~~~~- X
N~~~~~~~~~~ -T- E-I o N M
2' co ,^ t C1 N _ C
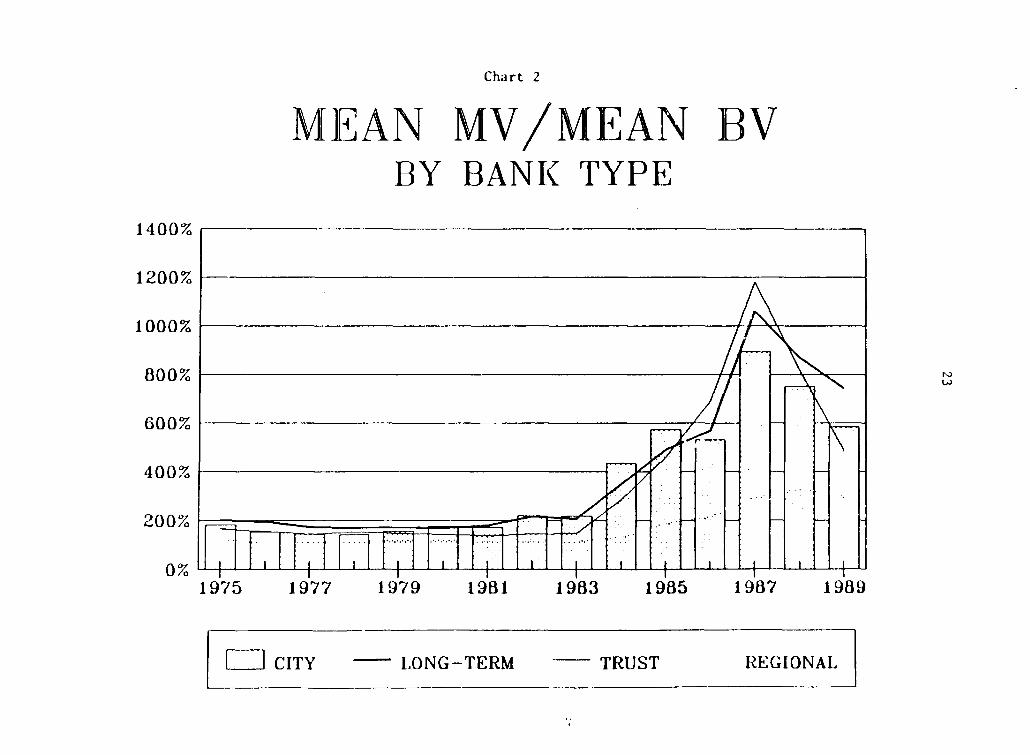
Chart 2
MEAN MV/MEAN BVBY BANK TYPE
14007%
1000%
800%
600%
400%
200%
0% 1975 1977 1979 1981 19B3 1985 1987 1989
Lii CITY - LONG-TERM TRUST REGIONAL
Chart 3
B"ANK RETURNSBY rTypE
140%
120%
100%
80%
60%
40%
20%
0%
-20%.
-40% I I I I I7503 7703 7903 8103 8303 8503 8703
60% I CIT - LOGTR - TRS EGOA

Cha.irt 4
l olding-ler iojd Ret ii'xi for
F:our Japanese Indiices
60%
40%
20%
0% U
-20%
-40% I -7503 7703 7903 8103 8303 8503 8703
ELi STOCK MARKET BONDS - (1401
LAND PRICES EXChIANGE RATE

Chlart S
MV OF UNBOOlKABLE EQUITY (U)BY BANK TYPE
Thousands
1 L_ A
-1.\ -- ___;
-2
-3
1974 1976 1978 1980 1982 1984 1986 1988
|ED CITY - LONG-TERM CREDIT TRUST - REGIONAL|

Clhart 6
VALUATION RATIO (K)BY BANK TYPE
2-5
20
1 5
1 0
5
1974 1976 1978 1980 1982 1984 1986 1988
CITY LONG-TERM CREDIT TRUST REGIONAL

28
TABLE 1: IUEAL LUNDIN T DEVELOPING 03lifRS - 1980-1988(In miLLUL of US$)
1980 1981 1982 1983 1984 1985 1986 1987 1988
UuitLd StatesTotal 9,947 9,445 12,049 14,533 16,732 10,912 8,069 5,623 5,346tmnercial Bank 3,855 3,857 5,997 8,359 10,832 5,585 3,602 2,515 1,361
JapanTotal 5,098 5,041 6,323 6,672 8,488 9,613 12,494 12,519 13,329Ccuu(mmcial Bank 1,089 558 986 1,394 2,235 2,980 2,998 3,821 4,877
GerqmTtalr 5,L30 4,606 .,817 2,789 2,266 3,035 2,943 4,358 5,490Comr6cia1 Bank 716 1,031 270 162 277 447 247 1,217 1,298
FrmTotal 7,040 6,171 7,188 4,326 4,136 4,L36 5,041 4,92D 5,172Caiwarciaal Bak 2,663 2,555 2,828 1,086 1,107 1,312 1,220 718 1,069
SwitzerlandTotal 1,320 824 1,249 931 1,107 937 548 755 1,125Camercial Blak 717 275 278 330 796 252 142 450 484
ItalyTotal 1,392 1,483 941 1,598 1,161 702 1,074 1,029 1,115Ca.z:rcial Bank 107 45 60 14 129 41 56 328 66
S,.urce: The Wrld Bak

29
TABLE 2. LOA M A110 MMICAN (L RIES BY CMERI.AL BMCS197 - 198
(in milli of US$)
U.S. U.K FJRAKH GNY .APAS
87 8s 87 as 87 88 87 88 87 88
AJENrll 8,812 7,879 4,290 4,108 2,136 2.299 4,476 4,716 4,982 5,611
1AZIL 21,275 19,N1 9,859 7,85 8,918 8,519 8,574 7,705 9,132 9,723
Pma) 2,722 17,887 8,M8 8,291 5,535 4,559 4,145 3,725 11,058 11,372
VENWJELA 8,320 8,ODI 2,703 2,625 2,806 2,779 2,254 2,318 3,791 3,826
3IKZ: Finx-idA flows to deveoping cxutri: lhe Wbrld Bank

30
Table 3: Summary Outcomes at 5-percent Significance of SeparateTests of the Hypotheses that U Equals Zero and k Equals Unity
Long Term RegionalCity Banks Credit Banks Trust Banks Banks
Year U k U k U k U k
1975 0 >1 0 >1 0 >1 0 >1
1976 0 >1 + >1 0 >1 0 1
1977 0 >1 + >1 0 1 0 1
1978 - >1 0 >1 0 >1 0 1
1979 - >1 + 1 0 >1 0 1
1980 - >1 0 1 0 1 0 1
1981 - >1 0 >1 0 1 0 1
1982 - >1 >1 0 >1 0 1
1983 - >1 0 >1 0 1 0 1
1984 - >1 - >1 0 >1 0 1
1985 - >1 - >1 0 >1 0 >1
1986 - >1 - >1 - >1 0 >1
1987 - >1 - >1 - >1 0 >1
1988 - >1 - >1 - >1 0 >1
1989 - >1 - >1 0 >1 0 >1

31
Table 4: Estimates of the Full Repricing Model (2) anda Deleted Two-Index Model (TIM) for Changes in theValue of Off-Balance-Sheet Equity at Four Classes
of Japanese Banks, 1975-1989
ExchangeStock Bonds Land Rate
uO pu pu pu puf R2 ADJ R20 ~~m rLf
City Banks
Model (2): 172 -2024* -397 1873 -581 .50 .28(241) (774) (664) (2880) (874)
TIM: 237 -1679* -376 .44 .34(129) (587) (489)
Long-Term Credit Banks
Model (2): 533 -5217* -2171 6457 -2390 .45 .21(734) (2355) (2021) (8762) (2659)
TIM: 735 -3817* -1982 .35 .23(407) (1842) (1535)
Trust Banks
Model (2): 40 -363 -489 1358 -273 .36 .08(132) (426) (366) (1586) (481)
TIM: 100 -194 -523 .27 .13(72) (327) (272)
Regional Banks
Model (2): .97 -35 -23 98 -23 .32 .02(8.9) (28) (24) (106) (32)
TIM: 5.0 -21 -24 .19 .04(4.9) (22) (18)
Notes:1. The holding-period return on bonds is approximated by the following formula:
Rt - Bond Yieldt1 Bond Yieldt - Bond Yield t 1
t Bond Yieldt
2. Standard errors are stated in brackets and asterisks denote coefficients whose valuediffers significantly from zero at 5 percent.
3. Each intercept represents a trend term measured in billions of yen.

32
Table 5: Estimates of the Full Repricing Model (3) and A DeletedTwo-Index Model (TIM) for Changes in the Valuation Ratio k
for On-Balance-Sheet Equity at Four Classes of Japanese Banks,1975-1989
ExchangeStock Bonds Land Rate
k k k k k R2 ADJ R20 ~~m ~ r kLRADf
City BanksModel (3): -.77 12* 2.4 -17 4.7 .41 .15
(1.78) (5) (4.9) [21] (6.4)TIM: -1.4 9.4* 2.5 .31 .18
(.9) (4.4) (3.7)
Long-Term Credit Banks
Model (3): -2.4 23* 10 -30 10 .49 .26(3.1) (10) (8) (37) (11)
TIM: -3.3 17* 9.7 .38 .27(1.7) (7) (6)
Trust Banks
Model (3): -1.0 12 8 -29 7 .48 .25(2.1) (7) (6) (26) (7)
TIM: -2.1 7 9 .33 .21(1.2) (5) (4)
Rezional Banks
Model (3): -.2 2.2 .8 -1.8 .59 .37 .10(.3) (1.2) (1.0) (4.5) (1.3)
TIM: -.2 1.9 .8 .34 .23(.19) (.8) (.7)
Notes:1. The holding-period return on bonds is approximated by the following formula:
Rt = Bond Yield t 1 - tBond Yieldt - Bond Yield t-1]
Bond Yield t
2. Standard errors are stated in parenthesis and asterisks denote coefficients whose valuediffers significantly from zero at 5 percent.

33
Table 6: Estimated Multi-Index Market Modelsfor Four Classes of Japanese Banks, 1975-1989
ExchangeIntercept Stock Bonds Land Rate
0 fr LR2
Citv Banks
-.09 2.3* .30 -.66 .70 .42(.31) (1.0) (.87) (3.7) (1.1)
Long-Term Credit Banks
-.17 2.3* .76 .02 .58 .70(.18) (.6) (.51) (2.2) (.67)
Trust Banks
-.2 3.4* 1.3 -3.4 1.2 .71(.2) (.9) (.7) (3.3) (1.0)
Regional Banks
.04 .99* .09 -1.1 .06 .54(.12) (.38) (.33) (1.4) (.43)
Notes:1. The holding-period return on bonds is approximated by the following formula:
R - Bond Yieldt 1 [Bond Yield - Bond Yield t-1]
Bond Yield t
2. Standard errors are stated in parenthesis and asterisks denote coefficients whose valuediffers significantly from zero at 5 percent.
3. Except for regional banks, the two-index model has the highest adjusted R2 of all possible2combinations. For regional banks, the third equation listed has the highest adjusted R
34
Table 7: Time-Series Estimates of the Market Modelfor Individual Japanese Banks, 1975-1989
Rjt %jo+ ' jm 'Mt + Ujt.
p0
Citv BanksBank of Tokyo .03 1.35*Dai-Ichi Kangyo Bank -. 04 2.05*Daiwa Bank -.29 3.33*Fuji Bank -.06 2.14*Hokkaido Takushoku -.03 1.52*Kyowa Bank -.02 1.36*Mitsubishi Bank -.07 2.11*Mitsui Bank .04 1.43Saitama Bank -.06 1.68*Sanwa Bank -.08 2.16*Sumitomo Bank -.02 1.89*Taiyo Kobe Bank -.09 1.85*Tokai Bank -.05 1.99*
Lon2-Term Credit BanksIndustrial Bank of Japan -.07 2.38*Long-Term Credit Bank -.01 1.62*Nippon Credit Bank -.02 1.55*
Trust BanksMlitsubishi Trust -.14 3.05*Mitsui Trust -.05 2.01*Nippon Trust -.11 1.99*Sumitomo Trust -.15 2.92*Tovo Trust -.33 4.01*Yasuda Trust -.13 2.68*
Regional BanksAkita Bank .18 .00Aomori Bank .12 .23Ashikaga Bank -.01 1.28*Awa Bank -.07 1.44*Bank of Hiroshima -.03 1.20*Bank of Ikeda -.01 .70Bank of Iwate .10 .47Chiba Bank .05 .98*Chiba Kogyo Bank .01 1.20*Daishi Bank .02 .79*Eighteenth Bank .08 .47Fukui Bank -.02 1.26Gunma Bank -.04 1.35*Hachijuni Bank .11 .67Higashi Nippon -.09 1.69*Hokkoku Bank .10 .47Hokuetsu Bank .04 .69Hokuriku Bank -.02 1.42*

35
Table 7 (continued)
Regional BanksHyakugo Bank -.07 1.66*Hyakujushi Bank .03 .79*Iyo Bank .03 74*Joyo Bank .11 .64Juroku Bank -.02 1.13*Kagoshima Bank .13 .22Kanto Bank -.14 1.68*Keiyo Bank -.06 1.77*Kiyo Bank .02 .96*Musashino Bank -.07 1.33*Niigata Sogo .04 .78Nishi-Nippon Bank .03 .94*Ogaki Kyoritsu Bank .06 .69Oita Bank .11 .14Shikoku Bank .02 .82Shinwa Bank .08 .43Shizuoka Bank .06 1.15*Sugura Bank .02 .86Taiyheiyo Bank -.11 2.32*The 77 Bank -.00 1.15*Toho Bank .14 .30Tokyo Sowa -.54 5.29*Tokyo Tomin Bank .07 .88Yamagata Bank .06 .68Yamanashi Bank -.08 1.88*
* Indicates market betas that differ significantly from zero at fivepercent.

PRE Working Paper Series
ContactIA6 Athor Dfor pager
WPS554 Korea's Labor Markots Under Dipak Mazumdar December 1990 M. SchreierStructur3l Adjustment 36432
WPS555 The Macroeconomics of Price Reform Simon Commander December 1990 0. del Cidin Socialist Countries: A Dynamic Fabrizio Coricelli 39050Framework
WPS556 Taxing Choices in Deficit Reduction John Baffes December 1990 A. BhallaAnwar Shah 37699
WPS557 The New Fiscal Federalism in Brazil Anwar Shah December 1990 A. Bhalla37699
WPS558 Alternative Instruments for Kenneth M. Kletzer December 1990 J. CarrollSmoothing the Consumption of David M. Newbery 33715Primary Commodity Exporters Brian D. Wright
WPS559 Fiscal Policy and Private Investment Ajay Chhibber December 1990 D. Bilkissin Developing Countries: Recent Mansoor Dailami 33768Evidence on Key Selected Issues
WPS560 The Persistence of Job Security in Milan Vodopivec December 1990 CECSEReforming Socialist Economies 37188
WPS561 The Labor Market and the Transition Milan Vodopivec December 1990 CECSEof Socialist Economies 37188
WPS562 Anticipated Real Exchange-Rate Luis Serven December 1990 S. JonnakutyChanges and the Dynamics of 39076Investment
WPS563 Empirical Investment Equations in Martin Rama December 1990 E. KhineDeveloping Countries 39361
WPS564 Costs and Benefits of Agricultural Avishay Braverman December 1990 C. SpoonerPrice Stabilization in Brazil Ravi Kanbur 30464
Antonio Salazar P. BrandaoJeffrey HammerMauro de Rezende LopesAlexandra Tan
WPS565 Issues in Socialist Economy Stanley Fischer December 1990 CECSEReform Alan Gelb 37188
WPS566 Measuring Outward Orientation in Lant Pritchett January 1991 K. CabanaDeveloping Countries: Can It Be Done? 37947
WPS567 Macroeconomic Management and the Antulio N. Bomfim January 1991 A. BhallaDivision of Powers in Brazil: Anwar Shah 37699Perspectives for the Nineties

PRE Workina Paoer Series
ContactGlLe Author DLA for papel
WPS568 Higher Wages for Relief Work Can Martin Ravallion January 1991 C. SpoonerMake Many of the Poor Worse Off: Gaurav Datt 30464Recent Evidence from Maharashtra's Shubham Chaudhuri'Employment Guarantee Scheme'
WPS569 Domestic Purchase Requirements for Wendy E. Takacs January 1991 S. FallonImport License Aliocations in Mali 37947
WPS570 Debt Concentration and Secondary Raquel Fernandez January 1991 S. King-WatsonMarket Prices Sule Ozler 31047
WPS571 Credit's Effect on Productivity in Gershon Feder January 1991 C. SpoonerChinese Agr,culture: A Lawrence J. Lau 30464Microeconomic Model of Justin Y. LinDisequilibrium Xiaopeng Luo
WPS572 Capital Positions of Japanese Edward J. Kane January 1991 S. King-WatsonBanks Haluk Unal 33730
Asli Demirguc-Kunt