capital project and infrastructure spending -...
TRANSCRIPT

www.pwc.com/cpi-outlook2025
Capital project and infrastructure spending Outlook to 2025
Research by
2 | Capital project and infrastructure spending: Outlook to 2025
Infrastructure spending has begun to rebound from the global financial crisis and is expected to grow significantly over the coming decade.
That is the main finding of Capital project and infrastructure spending: Outlook to 2025, an in-depth analysis of 49 countries that account for 90% of global economic output by PwC and Oxford Economics.
Our definition of infrastructure is wide-ranging, encompassing a number of broad sectoral groupings and economic activities. We cover the sectors traditionally classified as infrastructure such as transportation and utilities, but also analyze enabling capital projects in sectors such as extraction, manufacturing, and social infrastructure.
In developing this analysis, Oxford Economics used data sets to provide consistent, reliable, and repeatable measures of projected capital project and infrastructure spending globally as well as by country. Historical spending data is drawn from government and multinational organization statistical sources.
Projections are based on proprietary economic models developed by Oxford Economics at the country and sector levels. For more information on the methodological basis for these projections, please see page 6 of Capital project and infrastructure spending: Outlook to 2025 research findings.
Worldwide, infrastructure spending is projected to grow from $4 trillion per year in 2012 to more than $9 trillion per year by 2025. Overall, close to $78 trillion is expected to be spent globally between 2014 and 2025.
But the recovery could be uneven, with infrastructure spending in Western Europe not reaching pre-crisis levels until at least 2018. Meanwhile, emerging markets, unburdened by austerity or ailing banks, will likely see accelerated growth in infrastructure spending, especially China and other countries in Asia.
And megacities in both emerging and developed markets—reflecting shifting economic and demographic trends—are expected to create enormous need for new infrastructure. These paradigm shifts could leave a lasting, fundamental imprint on infrastructure development for decades to come.
Among our conclusions:
• The Asia-Pacific market, driven by China’s growth, will represent nearly 60% of global infrastructure spending by 2025. In contrast, Western Europe’s share will shrink to less than 10% from twice as much just a few years ago.
A robust market for capital projects and infrastructure spending
PricewaterhouseCoopers LLP | 3
• To realize the expected surge in infrastructure spending, emerging markets will need to provide the proper mix of economic, social and environmental factors, sometimes referred to as the enabling environment. Some also will have to create a more conducive business environment for investors and engineering and construction firms by overcoming such obstacles as unpredictable regulations, bureaucratic delays, and struggles to secure land rights.
• Growing urbanization in emerging markets such as China, Indonesia, and Nigeria should boost spending for such vital infrastructure sectors as water, power, and transportation.
• Increasing prosperity in emerging markets will impel infrastructure financing toward consumer sectors, including transportation and manufacturing sectors that provide and distribute raw materials for consumer goods and manufactured products.
• Demographic changes will vary by region and country, affecting both the amount and type of infrastructure spending. Aging populations in Western Europe and Japan, for instance, will require additional healthcare facilities, while countries in Sub-Saharan Africa, the Middle East, and many parts of Asia-Pacific will need more schools for their youth.
This report provides the first consistent data analyzing projected capital project and infrastructure spending across the globe. For investors, public officials, and companies planning capital investments, it highlights the sectors and countries expected to benefit from this investment resurgence. And it provides insight on the factors driving the expected investment growth.
With a clear understanding of the landscape, you are better equipped to identify the most promising opportunities, manage the challenges, and secure the best returns.
Richard Abadie Global leader Capital projects & infrastructure Tel: +44(0) 20 7213 3225

4 | Capital project and infrastructure spending: Outlook to 2025
Spending ticks up
PricewaterhouseCoopers LLP | 5
Spiral of change speeds upAs the economy produces and distributes goods around the world, moves data and currency in a flash from Cleveland to Chongqing, and transports millions of travelers cross-town, cross-country, and cross-continent, the foundation of all this activity is the physical and digital infrastructure enabling it.
The outlook for such infrastructure development—and the economic growth it will foster—is encouraging. Our global analysis shows that spending for capital projects and infrastructure has begun rebounding from the financial crisis of the past few years.
In fact, spending is expected to accelerate significantly over the next decade, with fast-growing emerging economies far outpacing developed nations. Our report shows where infrastructure spending is shifting, and what is driving that change, both domestically and globally.
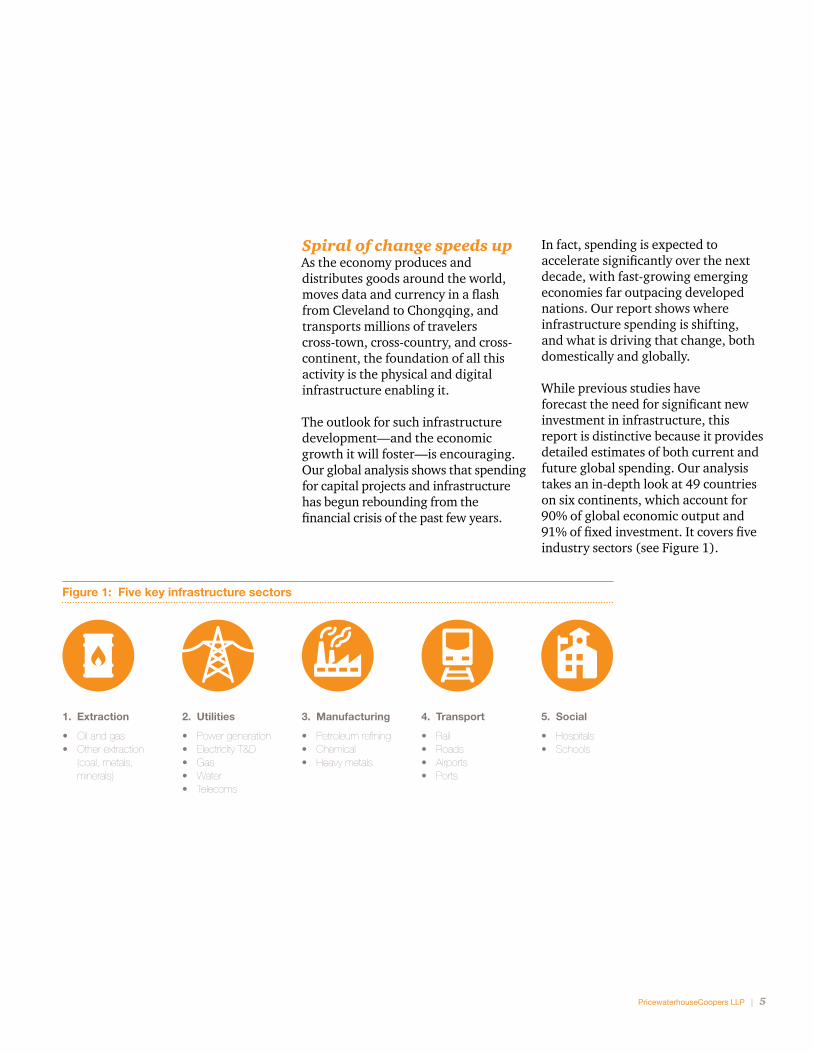
While previous studies have forecast the need for significant new investment in infrastructure, this report is distinctive because it provides detailed estimates of both current and future global spending. Our analysis takes an in-depth look at 49 countries on six continents, which account for 90% of global economic output and 91% of fixed investment. It covers five industry sectors (see Figure 1).
Figure 1: Five key infrastructure sectors
1. Extraction
• Oil and gas• Other extraction
(coal, metals, minerals)
2. Utilities
• Power generation• Electricity T&D• Gas• Water• Telecoms
3. Manufacturing
• Petroleum refining• Chemical• Heavy metals
4. Transport
• Rail• Roads• Airports• Ports
5. Social
• Hospitals• Schools
6 | Capital project and infrastructure spending: Outlook to 2025
The spending forecast over the next decade reflects the impact of several megatrends that PwC has identified as underlying markers of widespread global change: demographic shifts, an evolution in global economic power, and growing urbanization (See Interplay of far-reaching trends shapes infrastructure on pages 14–19). These paradigm shifts worldwide will have a lasting, fundamental impact on infrastructure development for decades to come as urbanization and both economic and demographic shifts create substantial need for additional infrastructure worldwide.
“You can’t continue to think that the world is the same as it was five years ago. It is incredibly different now. It’s even changed from how it was five weeks ago or five months ago. The spiral of change is speeding up.”Juan Bejar, CEO of Fomento de Construcciones y Contratas (FCC)
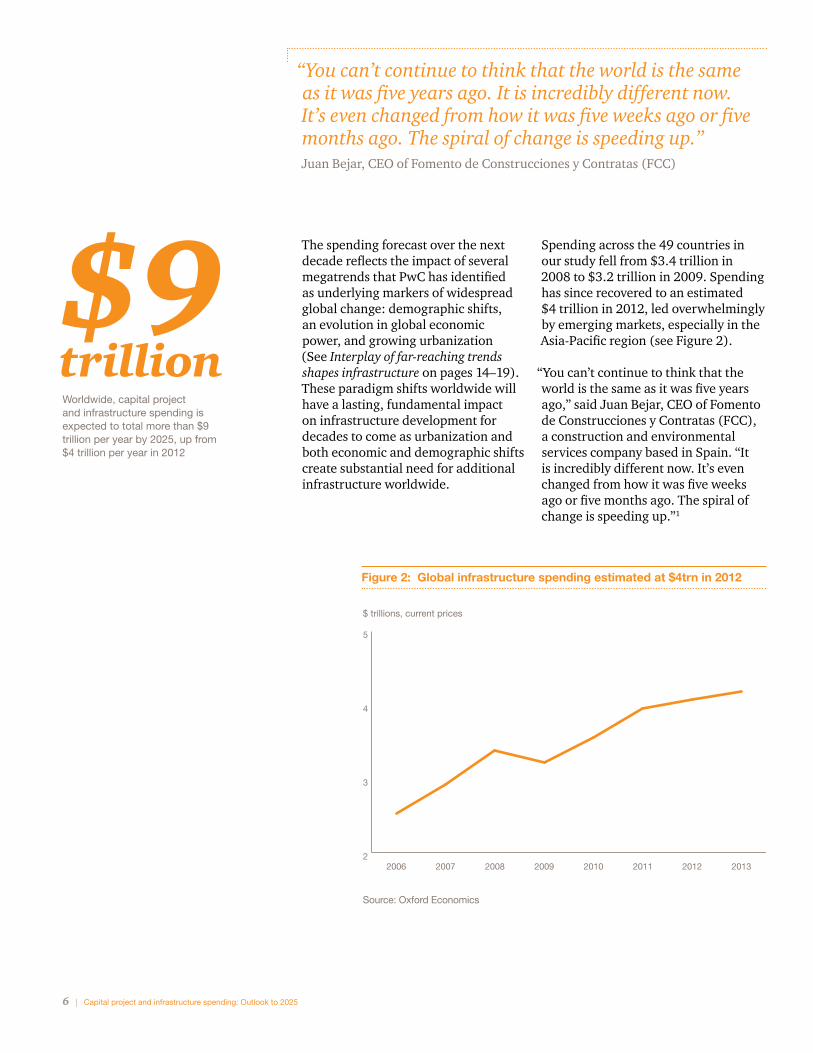
$9trillionWorldwide, capital project and infrastructure spending is expected to total more than $9 trillion per year by 2025, up from $4 trillion per year in 2012
Spending across the 49 countries in our study fell from $3.4 trillion in 2008 to $3.2 trillion in 2009. Spending has since recovered to an estimated $4 trillion in 2012, led overwhelmingly by emerging markets, especially in the Asia-Pacific region (see Figure 2).
“You can’t continue to think that the world is the same as it was five years ago,” said Juan Bejar, CEO of Fomento de Construcciones y Contratas (FCC), a construction and environmental services company based in Spain. “It is incredibly different now. It’s even changed from how it was five weeks ago or five months ago. The spiral of change is speeding up.”1
$ trillions, current prices
2
3
4
5
20132012201120102009200820072006
Figure 2: Global infrastructure spending estimated at $4trn in 2012
Source: Oxford Economics
PricewaterhouseCoopers LLP | 7
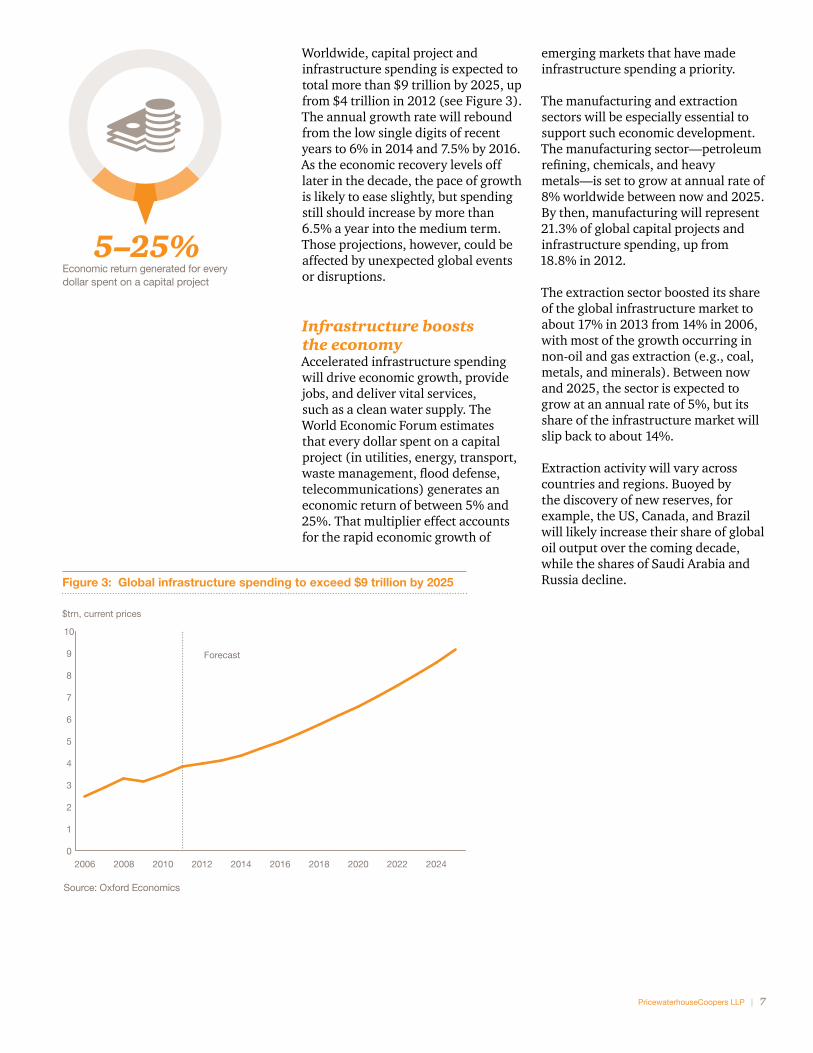
Worldwide, capital project and infrastructure spending is expected to total more than $9 trillion by 2025, up from $4 trillion in 2012 (see Figure 3). The annual growth rate will rebound from the low single digits of recent years to 6% in 2014 and 7.5% by 2016. As the economic recovery levels off later in the decade, the pace of growth is likely to ease slightly, but spending still should increase by more than 6.5% a year into the medium term. Those projections, however, could be affected by unexpected global events or disruptions.
Infrastructure boosts the economyAccelerated infrastructure spending will drive economic growth, provide jobs, and deliver vital services, such as a clean water supply. The World Economic Forum estimates that every dollar spent on a capital project (in utilities, energy, transport, waste management, flood defense, telecommunications) generates an economic return of between 5% and 25%. That multiplier effect accounts for the rapid economic growth of
$trn, current prices
0
1
2
3
4
5
6
7
8
9
10
2024202220202018201620142012201020082006
Forecast
Source: Oxford Economics
Global infrastructure spendingFigure 3: Global infrastructure spending to exceed $9 trillion by 2025
Source: Oxford Economics
Economic return generated for every dollar spent on a capital project
5–25% 5–25%
emerging markets that have made infrastructure spending a priority.
The manufacturing and extraction sectors will be especially essential to support such economic development. The manufacturing sector—petroleum refining, chemicals, and heavy metals—is set to grow at annual rate of 8% worldwide between now and 2025. By then, manufacturing will represent 21.3% of global capital projects and infrastructure spending, up from 18.8% in 2012.
The extraction sector boosted its share of the global infrastructure market to about 17% in 2013 from 14% in 2006, with most of the growth occurring in non-oil and gas extraction (e.g., coal, metals, and minerals). Between now and 2025, the sector is expected to grow at an annual rate of 5%, but its share of the infrastructure market will slip back to about 14%.
Extraction activity will vary across countries and regions. Buoyed by the discovery of new reserves, for example, the US, Canada, and Brazil will likely increase their share of global oil output over the coming decade, while the shares of Saudi Arabia and Russia decline.
8 | Capital project and infrastructure spending: Outlook to 2025
room for future government spending on infrastructure. However, emerging economies’ governments typically have higher borrowing costs than advanced economies because of poorer credit histories and less certainty about future stability.
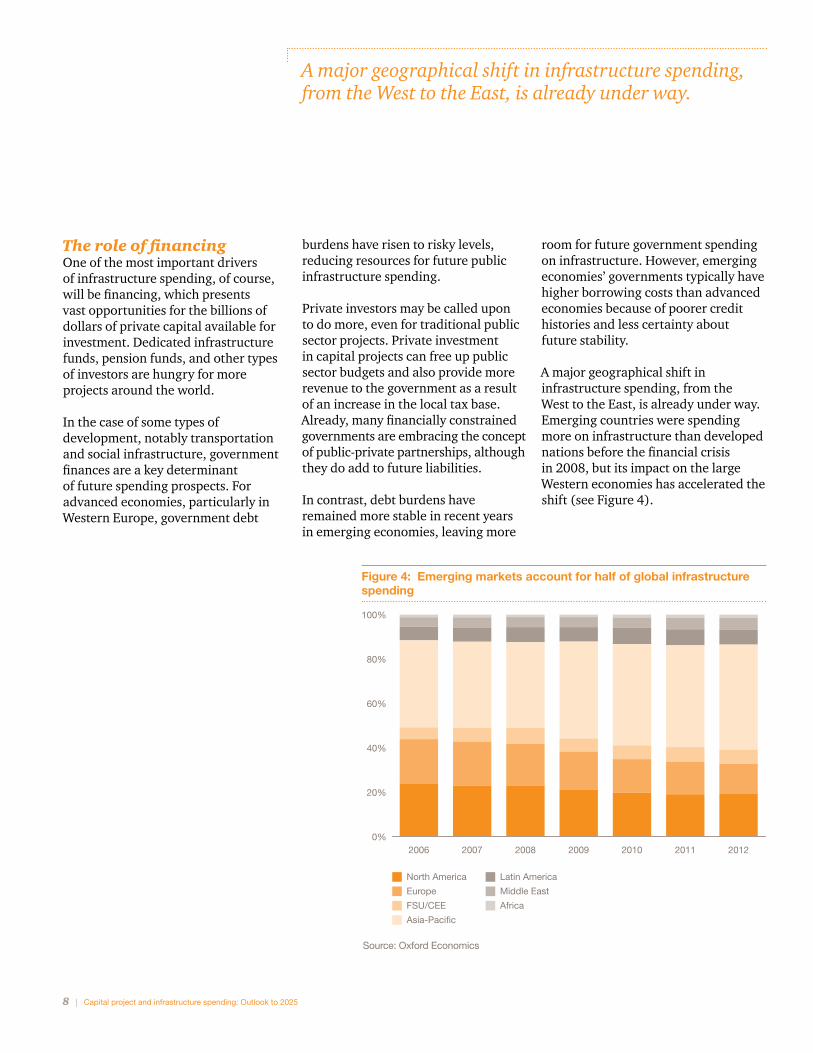
A major geographical shift in infrastructure spending, from the West to the East, is already under way. Emerging countries were spending more on infrastructure than developed nations before the financial crisis in 2008, but its impact on the large Western economies has accelerated the shift (see Figure 4).
burdens have risen to risky levels, reducing resources for future public infrastructure spending.
Private investors may be called upon to do more, even for traditional public sector projects. Private investment in capital projects can free up public sector budgets and also provide more revenue to the government as a result of an increase in the local tax base. Already, many financially constrained governments are embracing the concept of public-private partnerships, although they do add to future liabilities.
In contrast, debt burdens have remained more stable in recent years in emerging economies, leaving more
The role of financingOne of the most important drivers of infrastructure spending, of course, will be financing, which presents vast opportunities for the billions of dollars of private capital available for investment. Dedicated infrastructure funds, pension funds, and other types of investors are hungry for more projects around the world.
In the case of some types of development, notably transportation and social infrastructure, government finances are a key determinant of future spending prospects. For advanced economies, particularly in Western Europe, government debt
0%
20%
40%
60%
80%
100%
2012201120102009200820072006
North America
Europe
FSU/CEE
Asia-Pacific
Latin America
Middle East
Africa
Proportion of infrastructure spend by region
Source: Oxford Economics
Figure 4: Emerging markets account for half of global infrastructure spending
Source: Oxford Economics
A major geographical shift in infrastructure spending, from the West to the East, is already under way.
PricewaterhouseCoopers LLP | 9
Emerging markets dominate
10 | Capital project and infrastructure spending: Outlook to 2025
Rapid growth in emerging markets Developing economies, most notably China and other parts of Asia, account for nearly half of all infrastructure spending. In contrast, Western Europe, which isn’t expected to reach pre-financial crisis levels until 2020, accounts for only 12% of global spending now, down from about 20% in 2006, and is projected to generate less than 10% by 2025.
Developed economies, while continuing to grow, will see their infrastructure spending shrink from nearly half of the global total today to about one-third by 2025.
“In China, India, Brazil, or Bolivia, the developing nation’s rural people are moving to urban centers looking for a better life.”Juan Pablo Calvo, CEO of Nuevatal PCS de Bolivia (VIVA)
Cars per 1,000 persons
GDP per capita, $000, 2010
0 20 40 60 80 100 120
0
100
200
300
400
500
600
700
800
900
Car ownership and GDP per capita
Source: Oxford Economics
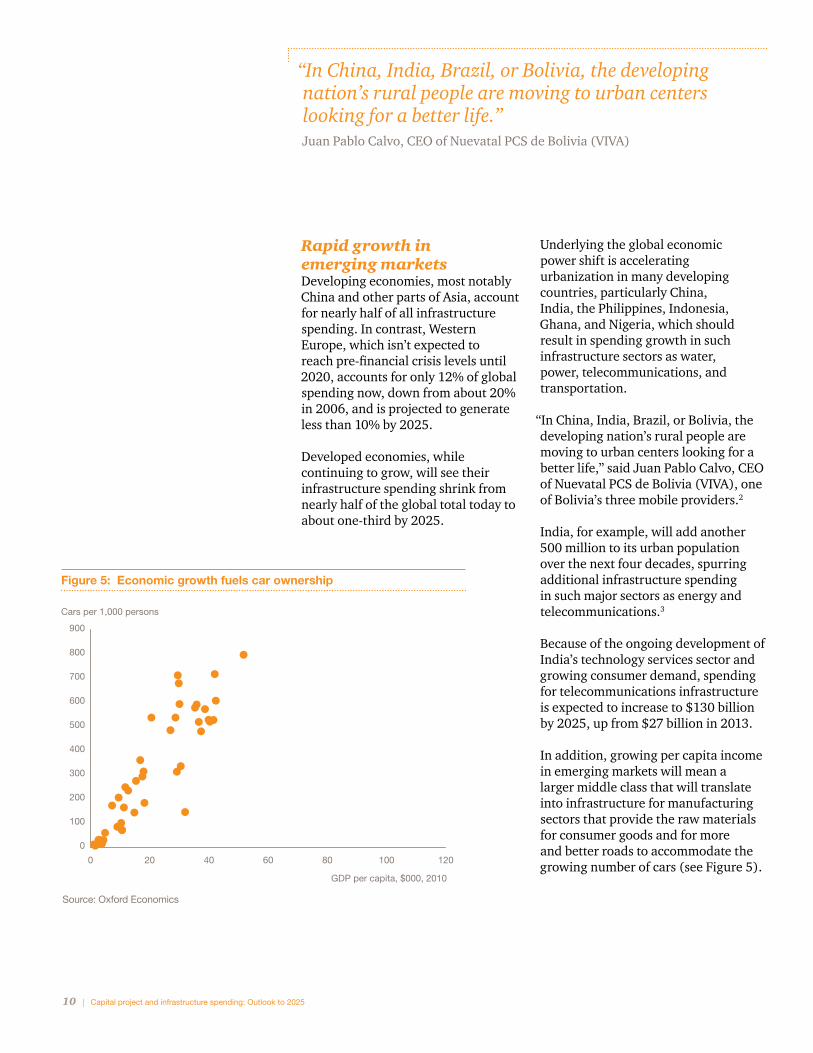
Figure 5: Economic growth fuels car ownership
Source: Oxford Economics
Underlying the global economic power shift is accelerating urbanization in many developing countries, particularly China, India, the Philippines, Indonesia, Ghana, and Nigeria, which should result in spending growth in such infrastructure sectors as water, power, telecommunications, and transportation.
“In China, India, Brazil, or Bolivia, the developing nation’s rural people are moving to urban centers looking for a better life,” said Juan Pablo Calvo, CEO of Nuevatal PCS de Bolivia (VIVA), one of Bolivia’s three mobile providers.2
India, for example, will add another 500 million to its urban population over the next four decades, spurring additional infrastructure spending in such major sectors as energy and telecommunications.3
Because of the ongoing development of India’s technology services sector and growing consumer demand, spending for telecommunications infrastructure is expected to increase to $130 billion by 2025, up from $27 billion in 2013.
In addition, growing per capita income in emerging markets will mean a larger middle class that will translate into infrastructure for manufacturing sectors that provide the raw materials for consumer goods and for more and better roads to accommodate the growing number of cars (see Figure 5).
PricewaterhouseCoopers LLP | 11
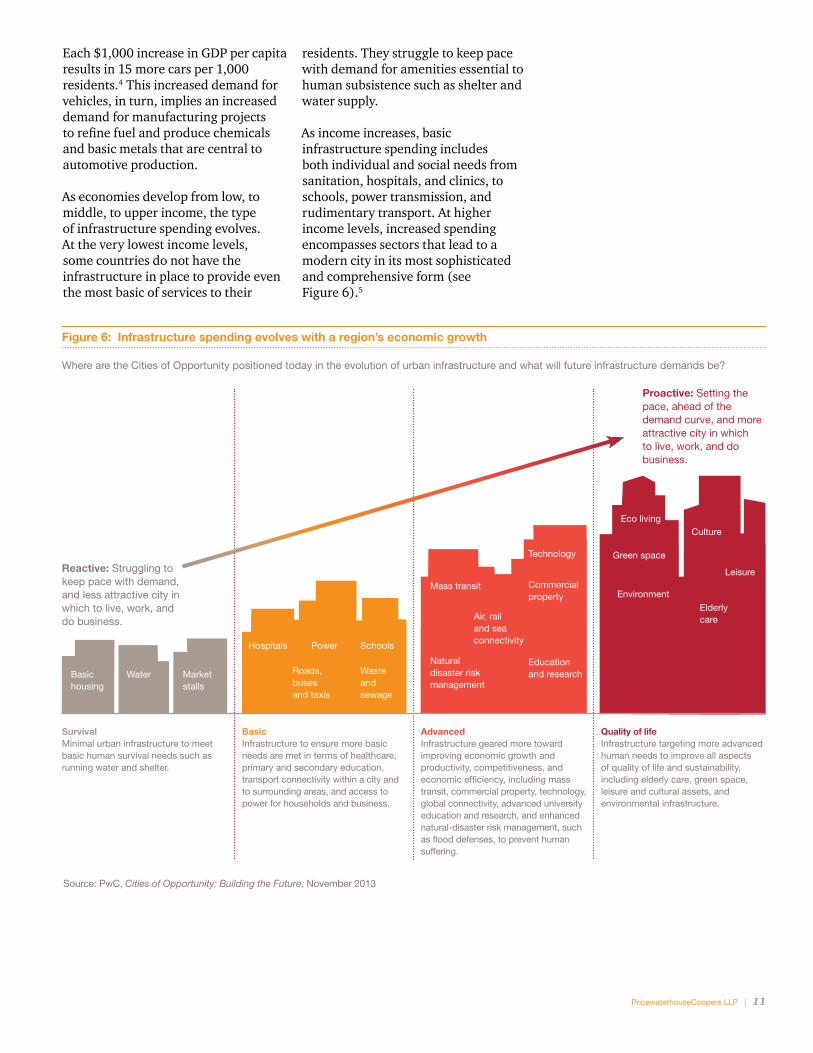
residents. They struggle to keep pace with demand for amenities essential to human subsistence such as shelter and water supply.
As income increases, basic infrastructure spending includes both individual and social needs from sanitation, hospitals, and clinics, to schools, power transmission, and rudimentary transport. At higher income levels, increased spending encompasses sectors that lead to a modern city in its most sophisticated and comprehensive form (see Figure 6).5
Each $1,000 increase in GDP per capita results in 15 more cars per 1,000 residents.4 This increased demand for vehicles, in turn, implies an increased demand for manufacturing projects to refine fuel and produce chemicals and basic metals that are central to automotive production.
As economies develop from low, to middle, to upper income, the type of infrastructure spending evolves. At the very lowest income levels, some countries do not have the infrastructure in place to provide even the most basic of services to their
Basic housing
Water Market stalls
Waste and sewage
Hospitals
Roads, buses and taxis
SchoolsPower
Natural disaster risk management
Mass transit
Air, rail and sea connectivity
Commercial property
Technology
Education and research
Eco living
Green space
Environment
Culture
Leisure
SurvivalMinimal urban infrastructure to meet basic human survival needs such as running water and shelter.
BasicInfrastructure to ensure more basic needs are met in terms of healthcare, primary and secondary education, transport connectivity within a city and to surrounding areas, and access to power for households and business.
AdvancedInfrastructure geared more toward improving economic growth and productivity, competitiveness, and economic efficiency, including mass transit, commercial property, technology, global connectivity, advanced university education and research, and enhanced natural-disaster risk management, such as flood defenses, to prevent human suffering.
Quality of lifeInfrastructure targeting more advanced human needs to improve all aspects of quality of life and sustainability, including elderly care, green space, leisure and cultural assets, and environmental infrastructure.
Reactive: Struggling to keep pace with demand, and less attractive city in which to live, work, and do business.
Proactive: Setting the pace, ahead of the demand curve, and more attractive city in which to live, work, and do business.
Elderly care
Source: PwC, Cities of Opportunity: Building the Future, November 2013
Figure 6: Infrastructure spending evolves with a region’s economic growth
Where are the Cities of Opportunity positioned today in the evolution of urban infrastructure and what will future infrastructure demands be?
12 | Capital project and infrastructure spending: Outlook to 2025
The natural outcome of that planning process leads to the final stage of economic growth in which a region is globally recognized for its superior quality of life. Culture, leisure, green space, a deep respect for the environment, and ecologically viable living, as well as a strong system of elderly care, all converge to define urban quality of life in the 21st century. Infrastructure is thus a catalyst, not just of urban society but of urban development.7
Long-term planning, however, must take into account the need to expand capacity in the future. Says Richard Abadie, PwC’s global leader for Capital Projects & Infrastructure, “If you don’t invest when your economy is growing, you may find yourself very quickly at a point where your runways and roads and ports and rail lines are choked. It’s essential to set aside some of the wealth you are creating in the good times to sustain and continue contributing to economic growth over the long term, especially given the long lead times and the substantial costs of infrastructure development.”
Abadie says when economies consume resources, rather than invest, during an economic boom, the problems that result from inadequate infrastructure become inevitable over the long term: congestion, pollution, lack of access, power outages, and ultimately the slowing of economic growth.
As wealth increases, a country is able to spend more on infrastructure. Not every country makes infrastructure spending a priority. However, those that do have benefited from the multiplier effect of infrastructure spending, which serves to further increase economic growth.
In a blog post for the World Economic Forum, Mthuli Ncube, chief economist and vice president of the African Development Bank, says,
“Infrastructure accelerates annual growth convergence rates by as much as 13% while increasing per capita annual growth rate by almost 1%.”6
According to Ncube, an additional 1% of GDP invested in transport and communications on a sustained basis increases the GDP per capita growth rate by 0.6%. “Productivity growth—and therefore competitiveness—is higher in countries with an adequate supply of infrastructure services,” he says.
The advanced stage of infrastructure development encompasses advanced education and research; technology; mass transit, air, rail, and sea connectivity; commercial property such as offices and business parks; and natural-disaster infrastructure such as flood defenses. Urban organization is highly developed, forward-looking, and clearly committed to a planning process that ensures continuing economic development and sustainable growth.
“If you don’t invest when your economy is growing, you may find yourself very quickly at a point where your runways and roads and ports and rail lines are choked.”Richard Abadie, PwC’s global leader for Capital Projects & Infrastructure
PricewaterhouseCoopers LLP | 13
Increased demand for social infrastructure Demographic shifts will vary by region and country over the next decade, and will affect not only the amount of infrastructure spending, but also the types of development. Aging populations, particularly in Western Europe and Japan, will necessitate more healthcare facilities, while countries in Sub-Saharan Africa, the Middle East, and many parts of Asia-Pacific, will require more schools for their youth.
Says Peter Raymond, PwC’s US leader for Capital Projects & Infrastructure,
“The concept of aging populations and maturing economies that our research teased out fundamentally changes the nature of infrastructure spending over time. What traditionally comes to mind for infrastructure is roads, rail, ports, airports, pipelines—the hard core assets that move product to market and reduce distance between regions. As economies mature and demographics shift, we are now anticipating increasing investments in social assets.”
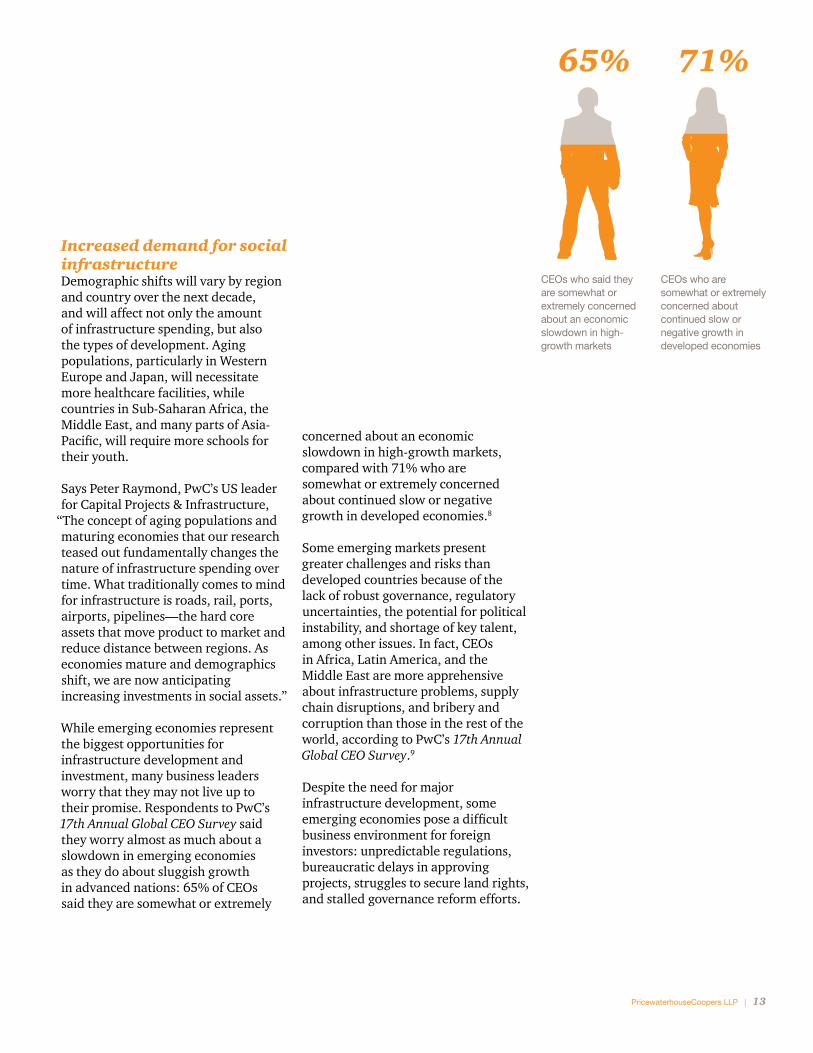
While emerging economies represent the biggest opportunities for infrastructure development and investment, many business leaders worry that they may not live up to their promise. Respondents to PwC’s 17th Annual Global CEO Survey said they worry almost as much about a slowdown in emerging economies as they do about sluggish growth in advanced nations: 65% of CEOs said they are somewhat or extremely
CEOs who said they are somewhat or extremely concerned about an economic slowdown in high-growth markets
CEOs who are somewhat or extremely concerned about continued slow or negative growth in developed economies
concerned about an economic slowdown in high-growth markets, compared with 71% who are somewhat or extremely concerned about continued slow or negative growth in developed economies.8
Some emerging markets present greater challenges and risks than developed countries because of the lack of robust governance, regulatory uncertainties, the potential for political instability, and shortage of key talent, among other issues. In fact, CEOs in Africa, Latin America, and the Middle East are more apprehensive about infrastructure problems, supply chain disruptions, and bribery and corruption than those in the rest of the world, according to PwC’s 17th Annual Global CEO Survey.9
Despite the need for major infrastructure development, some emerging economies pose a difficult business environment for foreign investors: unpredictable regulations, bureaucratic delays in approving projects, struggles to secure land rights, and stalled governance reform efforts.
65% 71% 37%28% 33%17% 37% 25%24%
87%84% 14%87% 13% 13% 11% 8%
65% 71% 37%28% 33%17% 37% 25%24%
87%84% 14%87% 13% 13% 11% 8%
65% 71%
14 | Capital project and infrastructure spending: Outlook to 2025
Interplay of far-reaching trends shapes infrastructure
Long-term trends in demographics, technology, natural resources, urbanization, and shifting economic power have signaled significant—sometimes unsettling—change for several years now.
What’s different at the present moment however, is the interplay of these megatrends. The modernization of the electrical grid, for example, would not have been possible without the convergence of technology on infrastructure to create a more efficient, reliable energy supply for customers—the smart grid.
The concept of the smart grid has revolutionized city planning as entire cities now benefit from technology-enabled infrastructure. Digital sensors transmit data gathered and analyzed to track—and even predict—consumer behavior. Meanwhile, scarce natural resources drive innovation in transport infrastructure toward clean, renewable energy sources. And materials such as carbon fiber increase efficiency and resilience in buildings.
PricewaterhouseCoopers LLP | 15
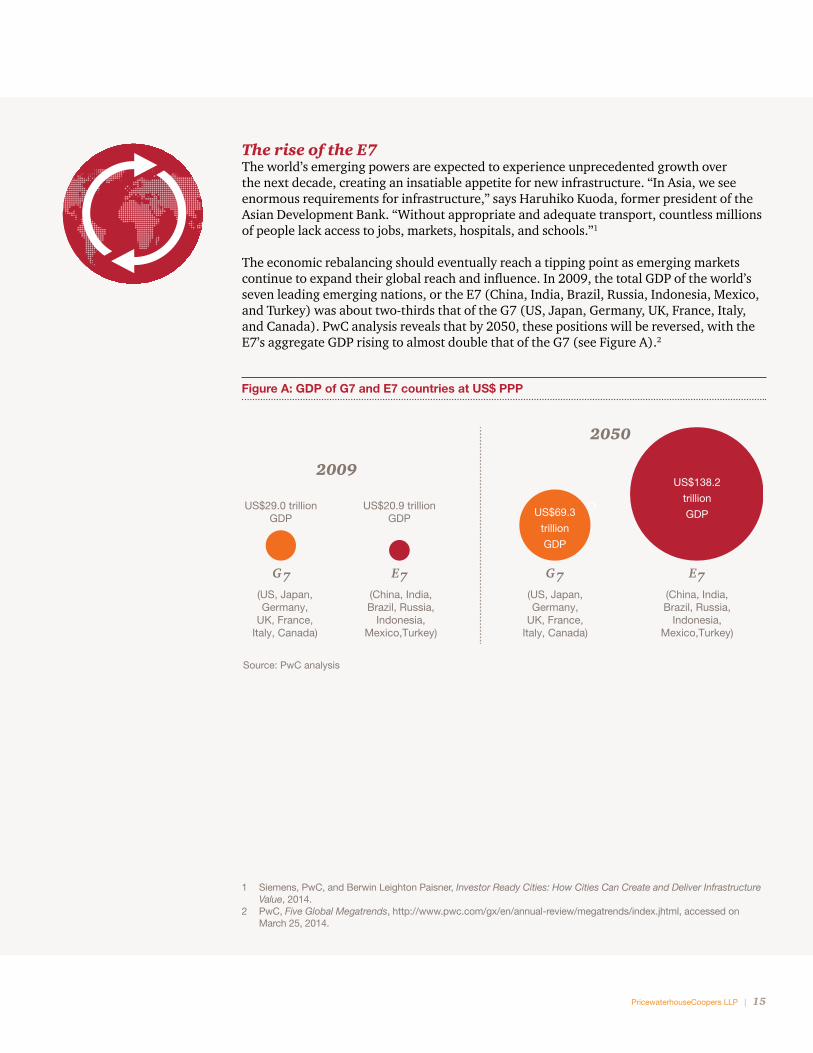
The rise of the E7The world’s emerging powers are expected to experience unprecedented growth over the next decade, creating an insatiable appetite for new infrastructure. “In Asia, we see enormous requirements for infrastructure,” says Haruhiko Kuoda, former president of the Asian Development Bank. “Without appropriate and adequate transport, countless millions of people lack access to jobs, markets, hospitals, and schools.”1
The economic rebalancing should eventually reach a tipping point as emerging markets continue to expand their global reach and influence. In 2009, the total GDP of the world’s seven leading emerging nations, or the E7 (China, India, Brazil, Russia, Indonesia, Mexico, and Turkey) was about two-thirds that of the G7 (US, Japan, Germany, UK, France, Italy, and Canada). PwC analysis reveals that by 2050, these positions will be reversed, with the E7’s aggregate GDP rising to almost double that of the G7 (see Figure A).2
Figure A: GDP of G7 and E7 countries at US$ PPP
Source: PwC analysis
2009
2050
US$29.0 trillionGDP
US$20.9 trillionGDP
G7(US, Japan,Germany,
UK, France,Italy, Canada)
E7(China, India,Brazil, Russia,
Indonesia,Mexico,Turkey)
GDPUS$69.3
trillion
GDP
(US, Japan,Germany,
UK, France,Italy, Canada)
G7
US$138.2
trillion
GDP
E7(China, India,Brazil, Russia,
Indonesia,Mexico,Turkey)
Source: PwC Analysis.
1 Siemens, PwC, and Berwin Leighton Paisner, Investor Ready Cities: How Cities Can Create and Deliver Infrastructure Value, 2014.
2 PwC, Five Global Megatrends, http://www.pwc.com/gx/en/annual-review/megatrends/index.jhtml, accessed on March 25, 2014.
16 | Capital project and infrastructure spending: Outlook to 2025
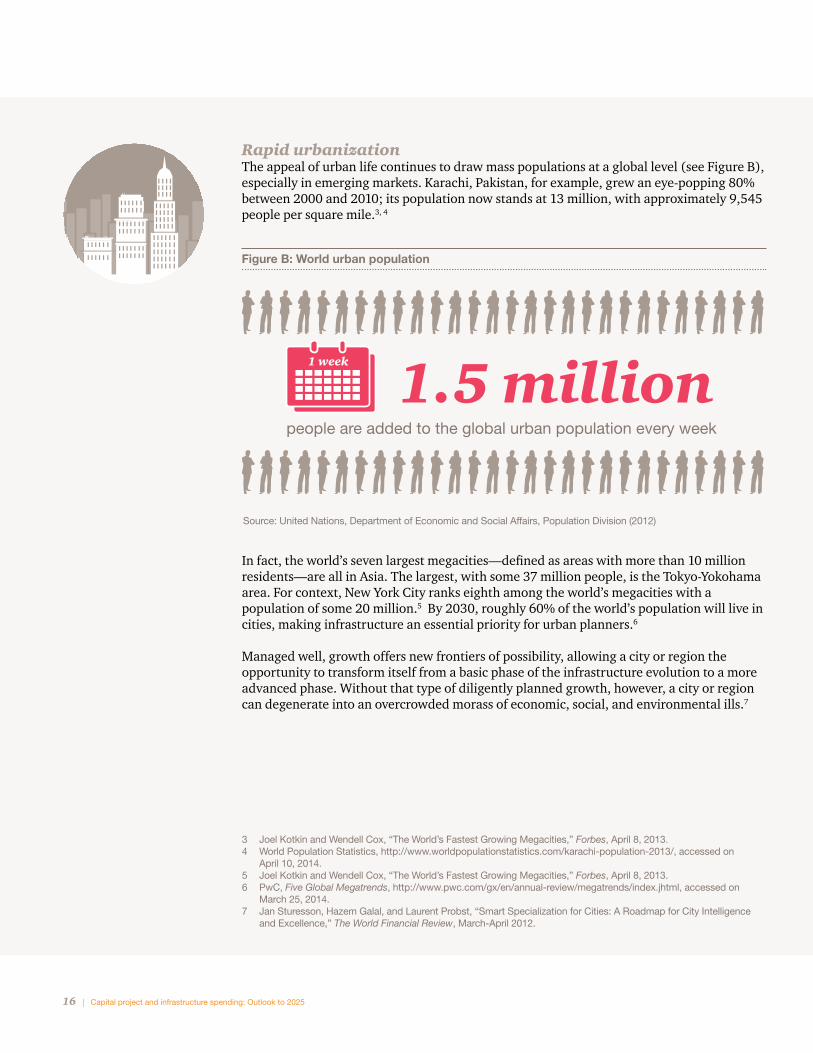
Figure B: World urban population
Source: United Nations, Department of Economic and Social Affairs, Population Division (2012)
1 week
1.5 millionpeople are added to the global urban population every week
Rapid urbanizationThe appeal of urban life continues to draw mass populations at a global level (see Figure B), especially in emerging markets. Karachi, Pakistan, for example, grew an eye-popping 80% between 2000 and 2010; its population now stands at 13 million, with approximately 9,545 people per square mile.3, 4
3 Joel Kotkin and Wendell Cox, “The World’s Fastest Growing Megacities,” Forbes, April 8, 2013. 4 World Population Statistics, http://www.worldpopulationstatistics.com/karachi-population-2013/, accessed on
April 10, 2014. 5 Joel Kotkin and Wendell Cox, “The World’s Fastest Growing Megacities,” Forbes, April 8, 2013. 6 PwC, Five Global Megatrends, http://www.pwc.com/gx/en/annual-review/megatrends/index.jhtml, accessed on
March 25, 2014. 7 Jan Sturesson, Hazem Galal, and Laurent Probst, “Smart Specialization for Cities: A Roadmap for City Intelligence
and Excellence,” The World Financial Review, March-April 2012.
In fact, the world’s seven largest megacities—defined as areas with more than 10 million residents—are all in Asia. The largest, with some 37 million people, is the Tokyo-Yokohama area. For context, New York City ranks eighth among the world’s megacities with a population of some 20 million.5 By 2030, roughly 60% of the world’s population will live in cities, making infrastructure an essential priority for urban planners.6
Managed well, growth offers new frontiers of possibility, allowing a city or region the opportunity to transform itself from a basic phase of the infrastructure evolution to a more advanced phase. Without that type of diligently planned growth, however, a city or region can degenerate into an overcrowded morass of economic, social, and environmental ills.7
PricewaterhouseCoopers LLP | 17
In others, growing populations will need to be fed, housed, educated, and employed to sustain growth and cohesion. Governments are under increasing pressure to plan judiciously for these long-term demographic trends.
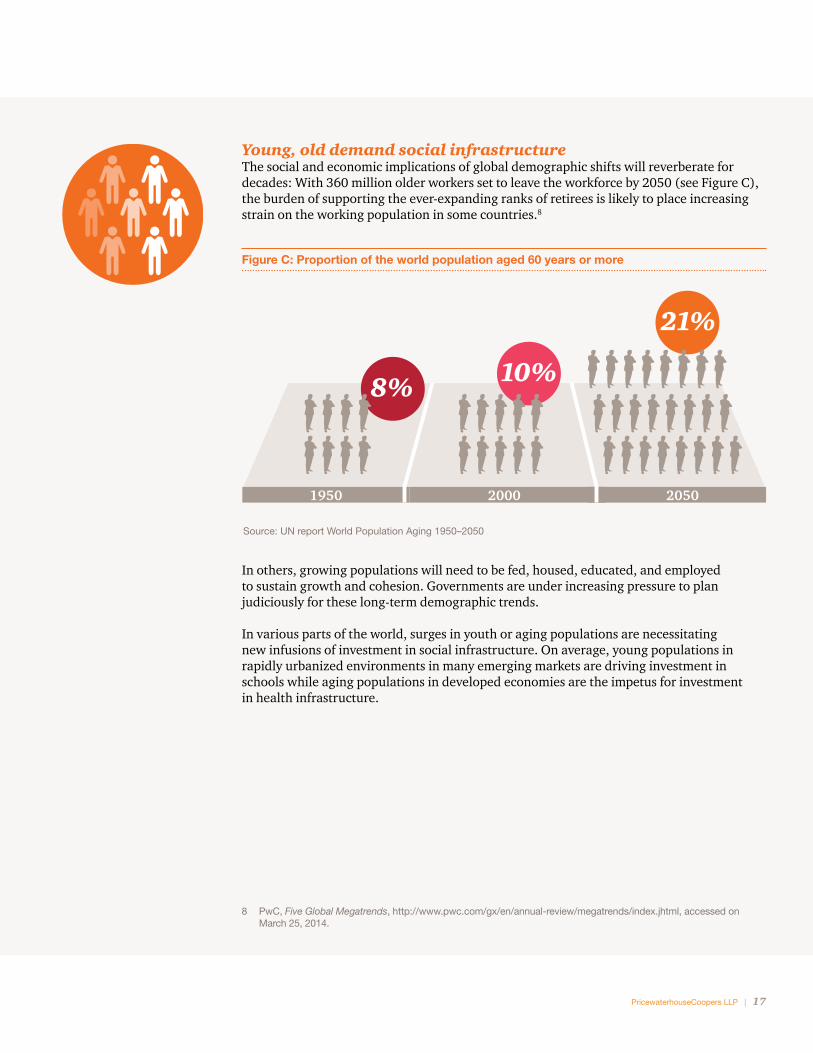
In various parts of the world, surges in youth or aging populations are necessitating new infusions of investment in social infrastructure. On average, young populations in rapidly urbanized environments in many emerging markets are driving investment in schools while aging populations in developed economies are the impetus for investment in health infrastructure.
Figure C: Proportion of the world population aged 60 years or more
Source: UN report World Population Aging 1950–2050
20502000
Source: UN report World Population Ageing 1950–2050.
8%
1950
10%
21%
Young, old demand social infrastructure The social and economic implications of global demographic shifts will reverberate for decades: With 360 million older workers set to leave the workforce by 2050 (see Figure C), the burden of supporting the ever-expanding ranks of retirees is likely to place increasing strain on the working population in some countries.8
8 PwC, Five Global Megatrends, http://www.pwc.com/gx/en/annual-review/megatrends/index.jhtml, accessed on March 25, 2014.
18 | Capital project and infrastructure spending: Outlook to 2025
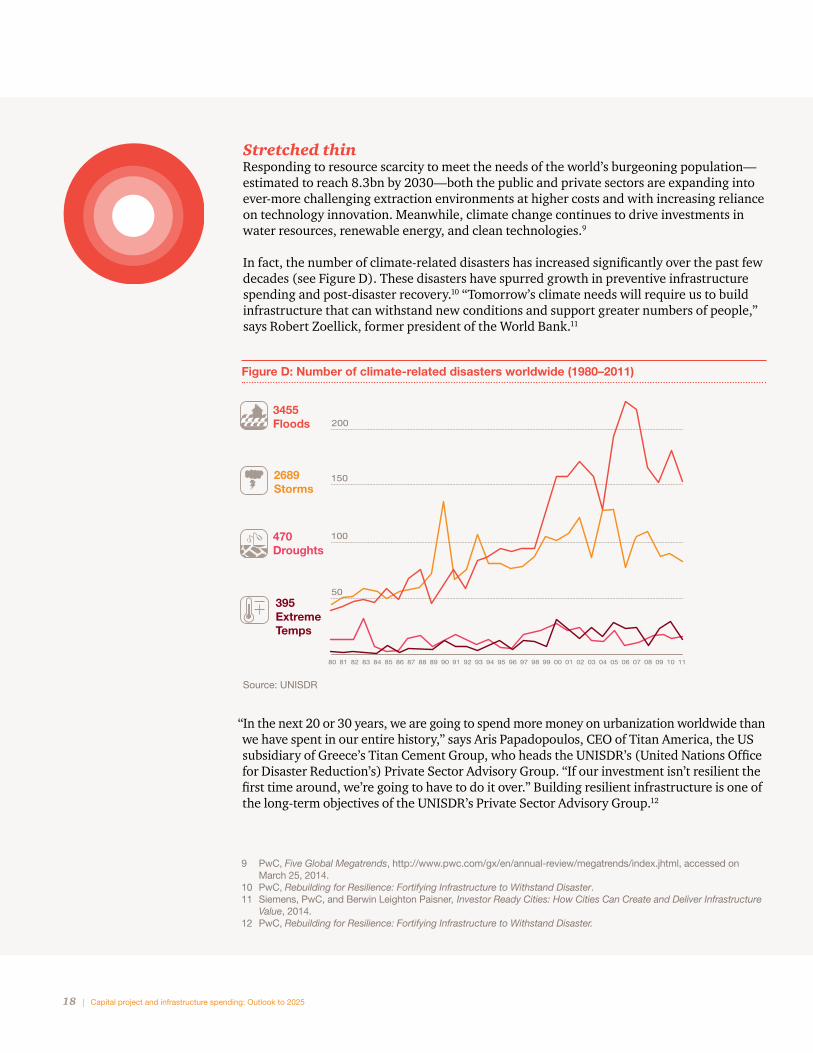
Stretched thinResponding to resource scarcity to meet the needs of the world’s burgeoning population—estimated to reach 8.3bn by 2030—both the public and private sectors are expanding into ever-more challenging extraction environments at higher costs and with increasing reliance on technology innovation. Meanwhile, climate change continues to drive investments in water resources, renewable energy, and clean technologies.9
In fact, the number of climate-related disasters has increased significantly over the past few decades (see Figure D). These disasters have spurred growth in preventive infrastructure spending and post-disaster recovery.10 “Tomorrow’s climate needs will require us to build infrastructure that can withstand new conditions and support greater numbers of people,” says Robert Zoellick, former president of the World Bank.11
9 PwC, Five Global Megatrends, http://www.pwc.com/gx/en/annual-review/megatrends/index.jhtml, accessed on March 25, 2014.
10 PwC, Rebuilding for Resilience: Fortifying Infrastructure to Withstand Disaster. 11 Siemens, PwC, and Berwin Leighton Paisner, Investor Ready Cities: How Cities Can Create and Deliver Infrastructure
Value, 2014.12 PwC, Rebuilding for Resilience: Fortifying Infrastructure to Withstand Disaster.
Figure D: Number of climate-related disasters worldwide (1980–2011)
Source: UNISDR
Figure 7: Number of climate-related disasters worldwide (1960-2011)
2689Storms
3455Floods
470Droughts
395ExtremeTemps
Source: UNISDR
80
200
81 82 83 84 85 86 87 88 89 90 91 92 93 94 95 96 97 98 99 00 01 02 03 04 05 06 07 08 09 10 11
150
100
50
“In the next 20 or 30 years, we are going to spend more money on urbanization worldwide than we have spent in our entire history,” says Aris Papadopoulos, CEO of Titan America, the US subsidiary of Greece’s Titan Cement Group, who heads the UNISDR’s (United Nations Office for Disaster Reduction’s) Private Sector Advisory Group. “If our investment isn’t resilient the first time around, we’re going to have to do it over.” Building resilient infrastructure is one of the long-term objectives of the UNISDR’s Private Sector Advisory Group.12
PricewaterhouseCoopers LLP | 19
Innovation is already driving new efficiencies in infrastructure project delivery. For instance, technology can link a sensing device with project management software and integrate that software with enterprise systems. As a result, companies have access to more information sooner about how their projects are performing, the risk profile of each project, and measures needed to improve performance.
Meanwhile, smart, resilient infrastructure is more than a possibility: From renewable energy and fracking to mobile payment systems and connected cities, technology is driving changes in the requirements and construction of new, more resilient infrastructure, as described by Takehiko Nakao, president of the Asian Development Bank. He says. “We need to build smarter infrastructure that is both less polluting and more resilient.”14
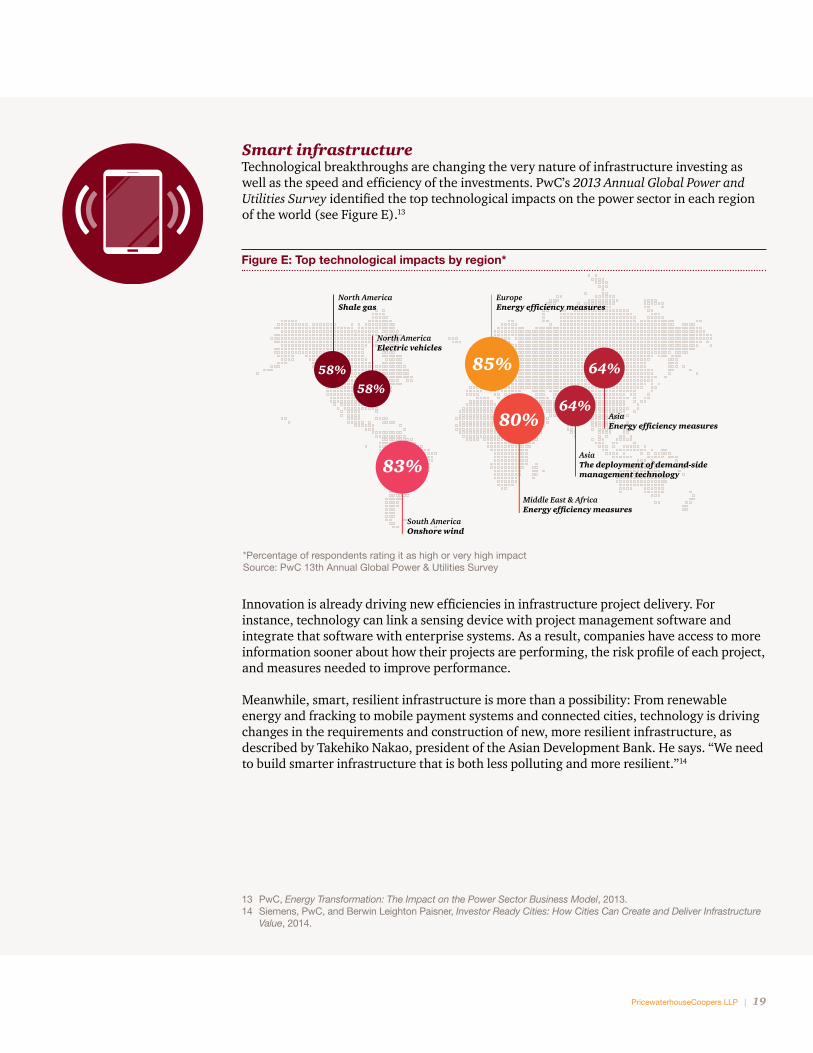
Smart infrastructureTechnological breakthroughs are changing the very nature of infrastructure investing as well as the speed and efficiency of the investments. PwC’s 2013 Annual Global Power and Utilities Survey identified the top technological impacts on the power sector in each region of the world (see Figure E).13
13 PwC, Energy Transformation: The Impact on the Power Sector Business Model, 2013. 14 Siemens, PwC, and Berwin Leighton Paisner, Investor Ready Cities: How Cities Can Create and Deliver Infrastructure
Value, 2014.
Figure E: Top technological impacts by region*
*Percentage of respondents rating it as high or very high impactSource: PwC 13th Annual Global Power & Utilities Survey
85%58%
64%
64%58%
83%
80%
North AmericaShale gas
North AmericaElectric vehicles
South AmericaOnshore wind
EuropeEnergy efficiency measures
AsiaEnergy efficiency measures
AsiaThe deployment of demand-sidemanagement technology
Middle East & AfricaEnergy efficiency measures
* % of respondents rating it as high or very high impactSource: 13th PwC Annual Global Power & Utilities Survey
20 | Capital project and infrastructure spending: Outlook to 2025
The road ahead
PricewaterhouseCoopers LLP | 21
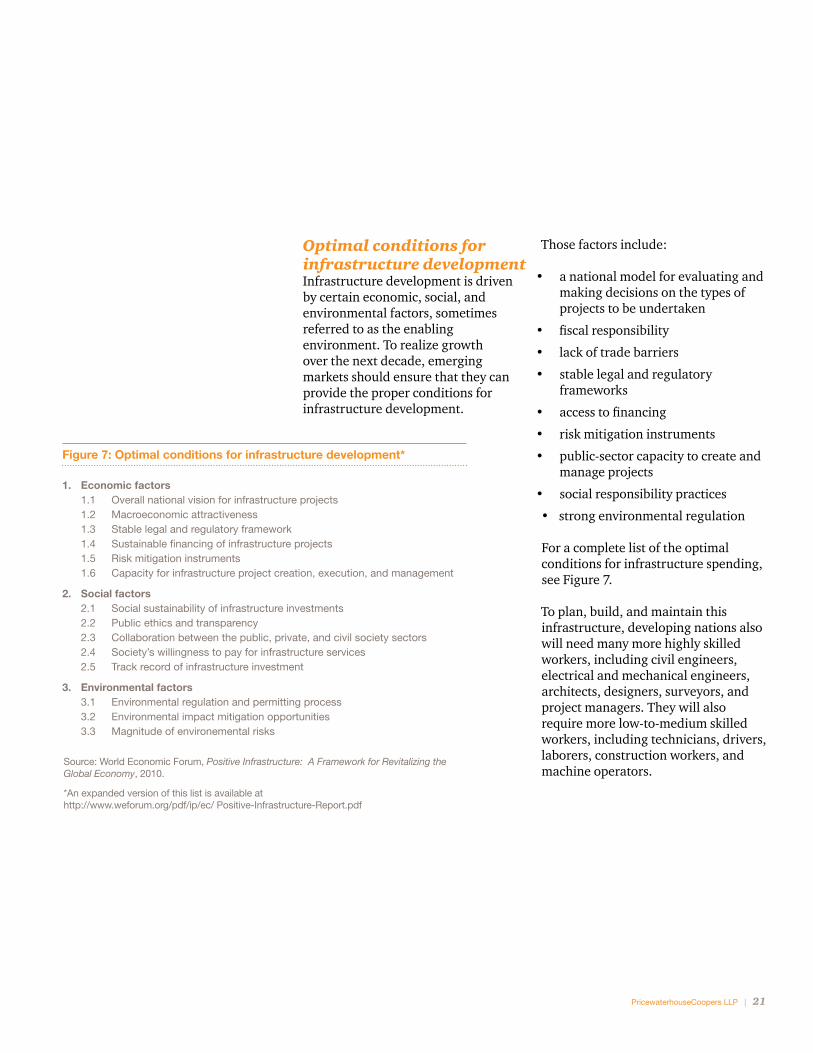
Those factors include:
• a national model for evaluating and making decisions on the types of projects to be undertaken
• fiscal responsibility
• lack of trade barriers
• stable legal and regulatory frameworks
• access to financing
• risk mitigation instruments
• public-sector capacity to create and manage projects
• social responsibility practices
• strong environmental regulation
For a complete list of the optimal conditions for infrastructure spending, see Figure 7.
To plan, build, and maintain this infrastructure, developing nations also will need many more highly skilled workers, including civil engineers, electrical and mechanical engineers, architects, designers, surveyors, and project managers. They will also require more low-to-medium skilled workers, including technicians, drivers, laborers, construction workers, and machine operators.
Optimal conditions for infrastructure developmentInfrastructure development is driven by certain economic, social, and environmental factors, sometimes referred to as the enabling environment. To realize growth over the next decade, emerging markets should ensure that they can provide the proper conditions for infrastructure development.
Figure 7: Optimal conditions for infrastructure development*
Source: World Economic Forum, Positive Infrastructure: A Framework for Revitalizing the Global Economy, 2010.
*An expanded version of this list is available at http://www.weforum.org/pdf/ip/ec/ Positive-Infrastructure-Report.pdf
1. Economic factors 1.1 Overall national vision for infrastructure projects 1.2 Macroeconomic attractiveness 1.3 Stable legal and regulatory framework 1.4 Sustainable financing of infrastructure projects 1.5 Risk mitigation instruments 1.6 Capacity for infrastructure project creation, execution, and management
2. Social factors 2.1 Social sustainability of infrastructure investments 2.2 Public ethics and transparency 2.3 Collaboration between the public, private, and civil society sectors 2.4 Society’s willingness to pay for infrastructure services 2.5 Track record of infrastructure investment
3. Environmental factors 3.1 Environmental regulation and permitting process 3.2 Environmental impact mitigation opportunities 3.3 Magnitude of environemental risks
22 | Capital project and infrastructure spending: Outlook to 2025
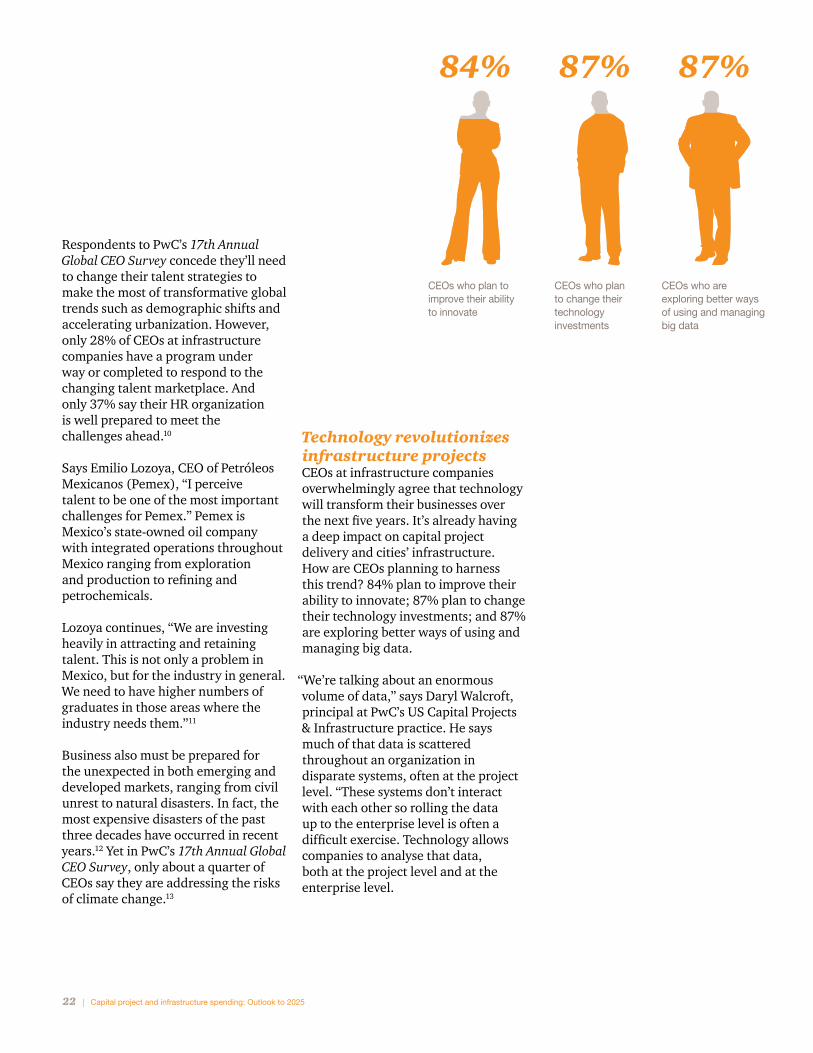
Technology revolutionizes infrastructure projects CEOs at infrastructure companies overwhelmingly agree that technology will transform their businesses over the next five years. It’s already having a deep impact on capital project delivery and cities’ infrastructure. How are CEOs planning to harness this trend? 84% plan to improve their ability to innovate; 87% plan to change their technology investments; and 87% are exploring better ways of using and managing big data.
“We’re talking about an enormous volume of data,” says Daryl Walcroft, principal at PwC’s US Capital Projects & Infrastructure practice. He says much of that data is scattered throughout an organization in disparate systems, often at the project level. “These systems don’t interact with each other so rolling the data up to the enterprise level is often a difficult exercise. Technology allows companies to analyse that data, both at the project level and at the enterprise level.
Respondents to PwC’s 17th Annual Global CEO Survey concede they’ll need to change their talent strategies to make the most of transformative global trends such as demographic shifts and accelerating urbanization. However, only 28% of CEOs at infrastructure companies have a program under way or completed to respond to the changing talent marketplace. And only 37% say their HR organization is well prepared to meet the challenges ahead.10
Says Emilio Lozoya, CEO of Petróleos Mexicanos (Pemex), “I perceive talent to be one of the most important challenges for Pemex.” Pemex is Mexico’s state-owned oil company with integrated operations throughout Mexico ranging from exploration and production to refining and petrochemicals.
Lozoya continues, “We are investing heavily in attracting and retaining talent. This is not only a problem in Mexico, but for the industry in general. We need to have higher numbers of graduates in those areas where the industry needs them.”11
Business also must be prepared for the unexpected in both emerging and developed markets, ranging from civil unrest to natural disasters. In fact, the most expensive disasters of the past three decades have occurred in recent years.12 Yet in PwC’s 17th Annual Global CEO Survey, only about a quarter of CEOs say they are addressing the risks of climate change.13
CEOs who plan to improve their ability to innovate
65% 71% 37%28% 33%17% 37% 25%24%
87%84% 14%87% 13% 13% 11% 8%
65% 71% 37%28% 33%17% 37% 25%24%
87%84% 14%87% 13% 13% 11% 8%
65% 71% 37%28% 33%17% 37% 25%24%
87%84% 14%87% 13% 13% 11% 8%
CEOs who are exploring better ways of using and managing big data
CEOs who plan to change their technology investments
84% 87%87%
PricewaterhouseCoopers LLP | 23
“The ultimate goal would be for the CEO to have access to live, real-time information for all the organization’s capital projects,” says Walcroft. “You can only do that if project data flows seamlessly. For example, from a pipeline-construction project in Uzbekistan to a storage facility in Texas to the CEO’s office in New York. All the data systems and processes need to be in place to run that kind of model. And they all need to be able to interact with each other.
“That kind of seamless, quality reporting about every project enables a CEO to make more timely and informed business decisions,” says Walcroft. “An enterprise view of the overall capital project portfolio will help to determine where to adjust the delivery strategy or where to approve additional resources.”
Looking ahead to growthAs the global economy regains strength and emerging nations continue their rapid development, there’s little doubt that the next decade will be favorable for capital project and infrastructure spending.
The bounty of projects is likely to be distributed unevenly. Some regions, particularly emerging Asia, are projected to enjoy a bigger boom in infrastructure development than more advanced economies. But all regions should experience some degree of growth in at least some infrastructure sectors.
Unexpected events and disruptions, such as 2014’s tumultuous developments in Ukraine, could alter our spending outlook somewhat
“The ultimate goal would be for the CEO to have access to live, real-time information for all the organization’s capital projects. You can only do that if project data flows seamlessly. For example, from a pipeline-construction project in Uzbekistan to a storage facility in Texas to the CEO’s office in New York.”Daryl Walcroft, Principal, PwC’s US Capital Projects and Infrastructure practice
for certain countries. But the basic underlying trends—and the interplay of those trends—are here to stay.
The economic shift of power from West to East, combined with rapid urbanization in developing countries and changing global demographics will have far-reaching implications for infrastructure spending in the decades ahead. Those who adapt to these seismic shifts reshaping the infrastructure landscape will be best positioned to realize the opportunities ahead.
1. PwC, 17th Annual Global CEO Survey: Fit for the Future, January 2014. 2. Ibid. 3. UN Population Division of the Department of Economic and Social Affairs, World Urbanization Prospects, 2012. 4. PwC, Capital project and infrastructure spending: Outlook to 2025 research findings, June 2014. 5. PwC, Cities of Opportunity: Building the future, November 2013.6. Mthuli Ncube, “Breaking Africa’s Infrastructure Bottleneck,” World Economic Forum Blog, May 2013. 7. PwC, Cities of Opportunity: Building the future, November 2013.8. PwC, 17th Annual Global CEO Survey: Fit for the Future, January 2014. 9. Ibid. 10. Ibid. 11. Ibid. 12. PwC, Rebuilding for Resilience: Fortifying Infrastructure to Withstand Disaster, 2013. 13. PwC, 17th Annual Global CEO Survey: Fit for the Future, January 2014.
Endnotes
www.pwc.com/cpi-outlook2025
To have a deeper conversation about this subject, please contact:
Richard Abadie Global leader Capital projects & infrastructure Tel: +44(0) 20 7213 3225 Neil Broadhead EMEA Capital projects & infrastructure Tel: +44 (0) 20 7804 4423 Mark Rathbone Asia-Pacific Capital projects & infrastructure Tel: +65 6236 4190 Peter Raymond North and South America Capital projects & infrastructure Tel: +1 703 918 1580
© 2014 PricewaterhouseCoopers LLP, a Delaware limited liability partnership. All rights reserved. PwC refers to the United States member firm, and may sometimes refer to the PwC network. Each member firm is a separate legal entity. Please see www.pwc.com/structure for further details. This content is for general information purposes only, and should not be used as a substitute for consultation with professional advisors. AT-14-0202
Methodology note: In developing this analysis, Oxford Economics used data sets to provide consistent, reliable, and repeatable measures of projected capital project and infrastructure spending globally as well as by country. Historical spending data is drawn from government and multinational organization statistical sources. Projections are based on proprietary economic models developed by Oxford Economics at the country and sector levels. For more information on the methodological basis for these projections, please see page 6 of Capital project and infrastructure spending: Outlook to 2025 research findings.