capital structure and corporate performance in late
TRANSCRIPT

Capital Structure and Corporate Performance in Late Imperial Russia
Amanda Gregg1 and Steven Nafziger2
Version: June 2017
Abstract
This paper investigates the financing of corporations in the early stages of industrialization. We analyze a new balance sheet database featuring all Imperial Russian corporations in 1914 and find that Russian corporations exhibited considerable financial flexibility. We emphasize financing differences between two types of Russian corporations: share partnerships and A-corporations. Share partnerships issued proportionally greater dividends, were less likely to issue bonds, and had larger accounts payable. Our assessment is largely positive: financial strategies varied with age, size, and sector in a manner consistent with modern corporate finance theories, and scaled profits do not demonstrate differential market power across corporation types. Together, our findings suggest that reducing the costs of incorporation would have benefited the Imperial Russian economy.
1 Middlebury College (Corresponding Author), Department of Economics, Warner Hall 305F, 303 College Street, Middlebury, VT 05753, USA. [email protected]. 2 Williams College, Department of Economics, 24 Hopkins Hall Drive, Williamstown, MA 01267, USA. [email protected]

1. Introduction
The role of corporations in developing economies remains poorly understood. The corporate
form often guarantees limited liability to investors and eases access to equity and debt markets,
thereby enabling business owners to invest in advanced technologies or expand operations. The
corporate form also has disadvantages: in most settings, incorporation requires costly and public
reporting of accounts, and limited liability may create principal-agent problems between owners
and managers. Moreover, administrative costs and special interests may also sharply limit the
supply of corporate charters, fostering monopoly rents. In environments of imperfect information
and relatively thin capital markets, these disadvantages limit the role played by corporations and
may impact the structure and pace of economic development. Whether the advantages or
disadvantages are more salient depends on the context. Chandler (1977), Rosenberg and Birdzell
(1986), and others emphasize the corporate form’s importance for British and American
economic success in the late 19th and early 20th centuries, although Guinnane et al. (2007) has
recently contested this assertion. This literature has focused almost exclusively on cases of long-
run success in Western economies and Japan. We know very little about what constituted a
corporation, how corporations functioned relative to other business forms, or how specific
organizational choices affected financial and real outcomes in less developed economies,
especially in the past.
Thus, we turn to a large, less-developed economy – the Russian Empire – at the beginning of the
twentieth century. By 1900, the Empire saw early signs of modern industrial and economic
growth, although performance still lagged well behind Western European countries.3 Traditional
industrial establishments utilizing outmoded methods of production persisted alongside a small
number of large, modern firms increasingly structured as corporations. Russian corporations’
organizational and financial characteristics can reveal whether this legal form’s particular
features mattered for the pace and structure of industrial growth in this low-income economy.
We introduce a newly collected dataset of charter and balance sheet information for all Russian
corporations active in 1914. Given the uniqueness of such data from a relatively backward
historical economy, a central goal of our paper is to evaluate their validity. We thus document
the relevant accounting and legal background of the data and by examine whether the observed
financial decisions of Imperial Russian corporations align with relevant modern theoretical and
empirical literatures, as applied to our specific historical context. This consistency check is
particularly important given the prior literature’s reliance on financial information from well-
studied, developed economies. Our evaluation of the data not only allows us to benchmark
financial behavior and firm performance in the Imperial Russian corporate sector, but it also
grants us broader insights into the underpinnings of early industrial development in other
contexts.
In contrast with most of Western Europe and the United States, the Russian Empire did not allow
general incorporation prior to World War I. Instead, firms incorporated by submitting a special
3 Between just 1890 and 1910, Russian pig iron output more than quadrupled from 930,000 to 4,030,000 tons and sugar output more than doubled from 405,000 to 1,030,000 tons (Kahan 1989, p. 60). Yet, Russian per capita income in 1912 was still less than a third of Germany's in 1905, and the economy remained overwhelmingly agrarian (Allen 2003, Chp. 1; and Gregory 1974, 658).

charter for approval by the Tsar or Minister of Finance.4 Russian firms chose from a limited
menu of organizational forms, which included two main types of corporations: tovarishchestva
na paiakh (“partnerships on shares,” here translated as “share partnerships”) and aktsionerniie
obshchestva (“share companies,” here translated as “A-corporations”).5 The Russian commercial
code did not distinguish these two variants from each other, but differences emerged in practice
because each corporate charter could include idiosyncratic features that framed that firm's capital
structure and governance. While previous work (e.g. Owen, 1991) has documented the
consequent heterogeneity in corporate charters, the impact of corporation type or specific charter
statutes on how corporations financed themselves, returned earnings to investors, or made other
decisions that impacted performance has yet to be explored.
We examine these differences empirically using a newly collected database of Imperial Russian
balance sheets. The Russian commercial code required chartered corporations to issue yearly
performance reports, which the government as well as private entities collected and published.
We draw on one such publication, which provides balance sheet data for the universe of formally
incorporated Russian firms in the accounting year of 1913-14.6 We link these new data to a
4 The 1836 law dictated that “proposed charters underwent review by the appropriate ministries and the Committee of Ministers (from 1905 onward, the Council of Ministers) before being submitted to the tsar or Minister of Finance for his signature,” a procedure that “remained in force to the end of the tsarist period” (Owen 1991, pp. 18-9). This resembled the special chartering processes in American states such as Massachusetts during the antebellum period (Hilt 2014). In Russia, small credit-issuing firms like pawnshops, warehouses, and small banks could incorporate by registration after 1872 (Owen 1992a, p. 50). As we note below, by 1914, roughly 4500 charters had been issued, with approximately 2000 corporations active in 1914. 5 By 1900, firms in other European countries had a richer set of organizational options. For example, the European form known as the “partnership with tradable shares” consisted of one or more partners, who had unlimited liability, and share owners, who had limited liability (See Guinnane et al. 2007). The Russian share partnership (tovarishchestvo na paiakh) was distinct from these, since it was covered under the section of the commercial code that describes corporations, and since no members had unlimited liability. 6 Accounting years vary slightly across the corporations in the sample. We refer to the data from this source as representing 1913-14 or 1914, which should be considered approximate. While the onset of World War I (August, 1914 for Russia) fell at the end of our data window, national income data suggest that the macroeconomy did not
database that documents aspects of the charters of all corporations in the Russian Empire (Owen
1992b). To our knowledge, these data represent one of the most comprehensive sources of
corporation-level information for any historical economy.7
We establish several new findings about corporations in the Russian Empire. We confirm that
the chartering process resulted in significant de facto differences in corporate characteristics in
the late Imperial period, both between and within these two main categories, despite the law's
assertion that these forms were entirely equivalent.8 A-corporations were much more likely to
finance their operations by issuing bonds and increasing share capital. Share partnerships were
more likely to finance operations with direct credit and tended to issue larger dividends.
However, this likely reflects differences in underlying characteristics like size or age between the
type corporation types.
We conclude that despite Imperial corporate law’s obvious limitations, Russian corporations
possessed considerable flexibility regarding their selection of organizational structures and
financial strategies and exercised these choices in ways that echo modern theories of corporate
governance and finance. Furthermore, we find that characteristics of corporations like type, age,
or size tend not to be associated with the level of profits, which suggests that, conditional on
suffer significant decline before 1915 (Markevich and Harrison, 2011). We discuss the representativeness of 1913-14 in more depth below. 7 A small number of historical studies combine information from corporate charters with equity price data to examine the impact of corporate governance factors on market indicators of firm performance (e.g. Campbell and Turner 2011; Hilt 2008). Others focus exclusively on documenting variation in corporate charters (e.g. Freeman et al. 2012; Guinnane, et al. 2014). While their samples are small in comparison to ours, Arnold and McCartney (2011), Braggion and Moore (2011), and Deloof and Van Overfelt (2008) are among the few studies that consider balance sheet, corporate governance, and performance data together. 8 Corporations’ names used a variety of French and Russian terms for “corporation.” Owen concludes that, “whatever name a given company happened to bear, all enterprises distinguished by their imperial charter and guarantee of limited liability to investors operated for the next century under a single system of corporate law” (1991, pp. 12-3).

incorporation, Russian firms operated in a relatively competitive environment. Although more
research is required to establish causality, the corporate sector’s flexibility and competiveness
suggest that a more liberal incorporation law that permitted the creation of similarly-behaved,
capital-intensive corporations could have quickened the pace of Russian industrial development.
The paper proceeds as follows. The next section details the Russian Empire’s corporate and
financial environment at the beginning of the twentieth century. Drawing on key features of the
historical setting, and on insights from the modern corporate finance literature, we outline
several predictions relating corporate characteristics to capital structure, dividend policies, and
firm performance. Section 3 describes the new balance sheet data and the process by which we
link these data to the RUSCORP database. Section 4 summarizes important features of the
resulting dataset, focusing on differences in capital structure across corporation types. We then
present results from simple econometric analyses of debt ratios, share capital, dividends, and
profits to evaluate whether Russian corporate financial decisions in 1913-14 reflect hypothetical
relationships consistent with the historical context and modern theory. These empirical exercises
constitute the first step in a larger research project on the corporate financing of early Russian
industrialization, which the conclusion outlines briefly.

2. Background
2.1 The Concession System of Incorporation and Russia’s Two Corporation Types
The Russian Empire’s Civil Code formed the basis of the country's business regulation, and
developments in Russian business law mirrored simultaneous Western European innovations.
Two laws established a menu of organizational forms in Russia at the beginning of the
nineteenth century. First, in 1805, Tsar Alexander I formally codified the possibility of limited
liability for corporations.9 Second, an 1807 law set down the three options for enterprise form
that existed until the 1917 Revolution: the full partnership, the limited partnership, and the
corporation.10 Two features distinguished corporations from these other forms. First,
corporations were not required to have any agents or investors with unlimited liability. Second,
while partnerships could be formed at any time by writing private contracts, corporations could
only be formed with special permission from the Ministry of Finance (and often the Tsar’s
personal approval).11 An 1836 law established specific procedures for the incorporation process
and delineated other requirements for corporations.12
The commercial laws regulating Russian corporations remained essentially unchanged up to the
First World War. A 1901 reform that aimed to strengthen the rights of shareholders and remove
bankers from corporate boards of directors was enacted. Other attempts to reform corporate law 9 The law stated, “In the event of failure of a corporation, no investor may lose more than the capital he has invested in the enterprise.” (Polnoe, hereafter PSZ, II-21.900; authors’ translations). 10 PSZ, I-22.418: “The form of the merchant associations in the law will be twofold: I. Simple Partnership [“full partnership”] 2. Limited partnership. Moreover, there will be the partnership on shares (corporation), which consists of many persons coming together as one definite sum, which provides a certain amount of share capital.” 11 PSZ, I-22.418, Ot. 1, St. 1: “But since the purpose of the corporation occupies such an important role in the state economy, such a company is only founded with Our approval.” 12 PSZ, II-9763: “Imperial Law on Corporations.”

failed.13 By the twentieth century, Imperial laws regulating businesses showed their age: Russia
failed to introduce either general incorporation or a private (non-corporate) business form that
offered complete limited liability (e.g. the private limited liability company (PLLC), as defined
by Guinnane et al. 2007).
Our reading of a number of corporate charters suggests that the process of charter application
and approval generated considerable variation in corporate structures and governance. Although
the Ministry of Finance provided some standardizing guidelines, the bargaining and
idiosyncrasies of the approval process, perhaps involving bribery, meant that the details and
overall coverage of the charters differed between otherwise similar firms. Furthermore, when
corporations wished to change elements of their charters, such voting rights or capitalization
levels, they returned to the Ministry to obtain formal revisions. Initial chartering and re-
chartering were certainly costly processes, which limited the appeal of incorporation for most
Russian firms (Gregg 2015a).
The Russian commercial code asserted that all corporations were legally equivalent. However,
corporations could vary in practice because of the variation permitted by the chartering system.
Over time, corporations used the concession system’s flexibility to separate themselves into two
types of corporations. When submitting their initial charters, the vast majority of corporations
defined themselves as either A-corporations or share partnerships. The concession system treated
corporations with either label identically, since they were legally equivalent. On rare occasions,
13Owen (1991) describes many failed attempts to reform Russian corporation law. The 1901 reform (PSZ, 3-20.874) attempted to improve shareholder rights by, for example requiring that the dates of shareholder meetings be published well in advance (Article 1). Gregg (2015b) finds that A-corporations, the target of the 1901 reform, issued smaller share capital after the reform, evidence both that the reform had real effects on corporations' structure and that A-corporations may have avoided the law’s true intent by tightening the firms' circle of shareholders.

firms switched between the two corporation types, though this required reincorporating with a
new charter (Owen 1991 p. 153). As corporation type is an endogenous choice, our results do not
have a causal interpretation, but they provide suggestive evidence on ex post differences between
share partnerships and A-corporations, especially after conditioning on other observables.
These labels likely allowed corporations to signal the nature of their enterprise and, roughly, the
content of their charters to investors. The historical literature suggests that new enterprises
seeking outside financing from wider circles of investors tended to denote themselves A-
corporations, while existing partnerships that incorporated to add a small number of new
investors called themselves share partnerships.16 Rozenberg’s (1912, p. 42) pamphlet on Russia’s
absence of limited liability partnerships complained that the share partnerships were “not a legal,
but merely a practical form:” though the law did not recognize two corporation types, investors
recognized relevant differences. Thus, these two types indicate firms’ underlying governance
characteristics, which may have implications for firm financial strategies. We expect to observe
considerable variation across these two corporation types in our data.
2.2 Financing Imperial Russian Corporations: Capital Structure, Payout Decisions, and
Performance
We focus on two dimensions of Russian corporate financial strategies: capital structure and
payout policies. With firm performance, these elements of the corporate finance system help us
understand the economic implications of corporate governance in the Imperial context. Our
16 See Owen (1991, pp. 12-13 and 153). Shepelev (1973, p.22) argues that, though legal corporations, share partnerships’ investor circles more closely resembled those of ordinary partnerships (togorvye doma) than full-fledged corporations.

starting point is the legal and financial setting of early 20th century Russia. By relating specific
elements of this context to insights drawn from historical and modern corporate finance
literatures, we develop a number of hypotheses regarding the likely factors underlying the
observed variation in capital structure, payout decisions, and performance across firms.
As we detail below, late Imperial Russia possessed a growing banking sector and securities
markets, supported by significant state involvement in the financing of industrial development.
This suggests that Russian corporations had various external financing options by 1913.
However, as measured by standard aggregate indicators, Imperial Russia had relatively
underdeveloped financial markets and institutions. Russia had very low bank deposits-to-GDP
and stock market capitalization-to-GDP ratios in 1913 (Rajan and Zingales 2003).17 These data
and the historical literature suggest that Russian companies likely relied relatively more on
financing through retained earnings and borrowing within networks of interconnected domestic
firms (often in the form of trade credit), than on comparatively scarce bank credit or still-
emerging securities markets.18 Given Russia’s status as a late-industrializing country, its vast
territory, and the large scale capital investments required by modernizing corporations,
differential access to external sources of finance likely explains some of the relative profitability
and economic performance of individual firms.19
17 The Russian savings + commercial deposits to GDP ratio was 0.21 (sample mean = 0.38), and the stock market capitalization to GDP ratio was 0.18 (sample mean = 0.57). Russia's deposit ratio did exceed Japan’s, Spain’s, and the UK's, although this likely reflected the role of government deposits in the banking system. Russia's stock market development ratio was on par with that of Argentina, Italy, and Norway, although an order of magnitude below that of France (0.78) and the UK (1.09). 18 See Crisp (1976). 19 Given the possible causal relationship between financial development and growth (e.g. Levine 2008), this implies that economic growth was circumscribed by the limited and costly supply of financing available to most Russian firms.
2.2.1 Capital Structure20
We first consider the amounts and characteristics of outstanding debt, equity, and other forms of
financing Imperial Russian firms possessed as key diagnostic features of the corporate sector.
The difficulty of documenting retained earnings or specific sources of credit under evolving
accounting standards and limited reporting requirements leads us to focus on broad categories of
tradable equity claims, bonded debt, and total credit obtained from formal and informal sources.
We develop several hypotheses regarding the variation in these observed capital structures
arising from our Russian historical setting.
Russian corporations self-identified as one of two main types to signal the structure and
tradability of the firm’s equity. Corporate charters for both share partnerships and A-corporations
outlined the founding level of capitalization, number and par value of shares, rules for
transferring equity, and related corporate governance characteristics. Subsequent charter
revisions, which held the same legal status as the original founding documents, could change the
capitalization levels of the firm by allowing for the issuance of new shares, with or without the
same status as the old ones.21 As we noted above and confirm empirically below, the two
Russian corporation types were associated with shares of different sizes that were likely more
tightly (share partnerships) or widely (A-corporations) held, with implications for the liquidity
and, therefore, the cost of new equity issuances. We thus expect A-corporations to be more likely
to issue equity to finance expansion, all things equal.
20 Our interpretation of corporate capital structures in the historical Russian context draws on a large literature in modern and historical corporate finance, particularly Baskin and Miranti (1997), Berk and DeMarzo (2014), Glen and Pinto (1994), Myers (2001), and Rajan and Zingales (1995). 21 The charters and charter revisions could and did divide shares into different classes, with different voting rights and claims on assets. Our data only allow us to consider total share capital.
At the same time, differences in corporate ownership structures likely were associated with
variation in internal agency relations and information asymmetries inside and outside the firm.
Standard agency views of corporate finance assume that managerial decisions are often not fully
observable to owners. This may lead managers to shape the direction of cash flows to their own
benefit by issuing equity over bonds if doing so increases their effective authority relative to
individual shareholders.22 In the Russian context, more widely held A-corporations would have
more likely been subject to such agency concerns, thus reinforcing the relative importance of
equity financing for those corporations.
Trading in Imperial Russian corporate equities took place either over-the-counter or on
exchanges in St. Petersburg, Moscow, Kiev, Warsaw, Riga, Khar'kov, and Odessa.23 The total
market capitalization of firms whose shares were traded on domestic exchanges grew steadily
between 1861 and 1914, particularly in St. Petersburg, and the largest firms increasingly issued
shares on foreign exchanges. However, many shares likely traded “on the street,” especially
those of more tightly held corporations.24 As a consequence, though Russian equity markets
appeared to be well-integrated domestically and abroad by the last decades of the Tsarist era
(Crisp, 1976; Borodkin and Konovalova, 2010), transaction costs and information asymmetries
22 See Jensen and Meckling’s (1976) influential work. 23 Roughly 400 corporate shares were traded by the end of 1913 in six main exchanges in the Empire (the list above minus Kiev – see Borodkin and Konovalova 2010, Tables 2 and 5). Our data do not allow us to distinguish preferred and common stock, though different types of equity existed. Borodkin and Konovalova (2010) and Papp (2001) document the development of stock and bond markets in Imperial Russia. 24 By 1914, share capital of listed firms comprised roughly 20 percent of the 21-billion-ruble total capitalization of the Russian exchanges, while government and guaranteed securities were the majority of the rest (Gatrell 1986, Table 6.4). The resulting total market capitalization was comparable to national income at that time. Ol' estimates that foreign entities owned 43% of the stock in Russian companies and credit institutions in 1914, although McKay argues that this is probably an overstatement (Ol' 1983, p. 256; McKay, 1970, p. 31). We focus on total share capital because we cannot distinguish foreign from domestic equity ownership.

between firms and potential investors likely raised the cost of financing through equity,
particularly for newer, less established firms located outside of St. Petersburg.25
Similar concerns could be raised about the Imperial Russian corporate bond market. Despite
formal reporting requirements, limited outsider knowledge of underlying enterprise fundamentals
likely raised the cost of financing through the issuance of (new) equity and bonded debt. While
Russian corporate bankruptcy and commercial law prioritized debt claims, high transactions and
collective action costs of utilizing the judicial system likely reduced bondholder rights in practice
(Antonov, 2015). As a result, while many corporate charters explicitly allowed firms to issue
bonds, as we show below, corporate securitized debt constituted a small share of Imperial
securities markets compared to government debt, state-backed railroad bonds, obligations issued
by state credit institutions, and the mortgage-like securities that financed serf emancipation
(Borodkin and Konovalova, 2010).
Given these agency and information considerations, direct lines of credit from banks and other
sources may have been particularly prominent components of corporate capital structures in
Imperial Russia.26 While various state banks and smaller credit institutions existed throughout
the long 19th century, the first Russian joint-stock commercial bank was established in 1864.
However, commercial banks only began to extend significant financing for industrial enterprises
towards the end of the Imperial era.27 Unlike in the “life-cycle” relationships of German
25 Newer firms likely also engaged in riskier projects, which may have reduced their attractiveness to equity investors if debt claims were primary. 26 In developing economies, thin equity markets may make it more difficult to sell new shares (Glen and Pinto, 1994), although this likely also applied to corporate bonds in the Russian context. 27 Between 1875 and 1914, the assets of the commercial credit system (which included the State Bank, joint stock banks, mutual credit societies, and municipal banks) increased from 900 to 7200 million rubles (roughly 17.5 to 35% of national income), with most of the growth coming after 1900 (Crisp, 1976, Table 5.4; and Gregory, 1982).

universal banks with firms (Calomiris, 1995), little of this took the form of long-term credit.
Rather, Russian banks provided industrial firms with payment and discounting services, along
with short-run credit accounts.28 Intriguingly, these accounts could also facilitate the placement
of corporate securities, as the banks extended credit to firms, held bonds and equities on their
books as payment/collateral, and issued corresponding “shares” in associated accounts to the
public (Crisp, 1976, pp. 144-146). By acting as intermediaries in this way (akin to mutual funds),
the Russian banking system helped overcome some information asymmetries associated with
securities markets at that time.
Joint stock commercial banks’ relationships with industrial firms varied geographically and by
industry in Imperial Russia. The historical literature emphasizes that St. Petersburg banks took
active roles in shaping industrial firms and made large direct equity investments, while Moscow
banks lent primarily in the short run and performed more limited oversight roles (for example,
rarely serving on corporate boards).29 These differences reflect intertwined cultural factors (for
instance, St. Petersburg’s closer links to the West), differences in corporate governance (A-
corporations vs. share partnerships), and the composition of local industrial activity. Demand for
credit likely varied substantially by industry, since industry characteristics like scale or volatility
implied different short and long-term investment requirements. We test for such differences by
Over much of the post-reform period, agricultural mortgage credit was a central activity of much of the banking system. By 1914, land mortgage bonds comprised roughly a quarter of the value of all Russian securities (Crisp 1976, p. 133). 28 These accounts, typically referred to as onkoli, seem to be a major component of the “accounts payable” we examine. Crisp (1967 and 1976, Chp. 5) documents the connections between banking and Russian industrialization. Salomatina (2004) describes state reforms and the development of Russian commercial banking in the late Imperial period. 29 Crisp (1976, p. 142) concludes that St. Petersburg banks were more like “mixed Continental type” banks, similar to the German universal banks lauded by Calomiris (1995), while Moscow banks “tended to be of the ‘English’ type.

evaluating the relative use of shorter-term bank credit lines versus long-term bonded debt in our
corporate balance sheet data.
Commercial banks were not the only sources of credit for Imperial Russian corporations.
Into the 20th century, the State Bank provided direct loans and discounting services for industrial
firms through its provincial branches and related entities (Crisp, 1967). Moreover, from the mid-
1890s, state banking institutions increased deposits in joint-stock banks, thus supporting direct
credit provision and the underwriting of corporate securities.30 Other credit-providing entities
like municipal banks, mutual credit societies, other savings institutions, and private banking
houses likely played a limited role in financing corporations. Industrial trade credit was much
more important: corporations maintained accounts payable and receivable with retailers and
input suppliers. As noted by Fisman and Love (2003), firms in developing countries can
substitute for expensive sources of external finance with more informal, short-run trade credit,
particularly when demand for large fixed capital investment is limited. While we cannot
definitively identify trade credit in our dataset, we expect it to vary by industry and other firm
characteristics in parallel to our measure of short-term credit.31
We mention briefly two other possible determinants of firm capital structures. First, Imperial
Russia had a corporate income tax. In 1885, the government placed a flat three percent tax on
corporate profits and also taxed the “probable profits” of non-corporate firms. After the tax rate
increased to five percent in 1893, in 1898 the tax was converted to a progressive tax on “net”
30 The expansion of private commercial banking was fueled, in part, by credit provided by the State Bank, rising from 287 million to over 4.5 billion rubles between 1895 and 1913 (Kahan, 1989, pp. 56-60). 31 In a strict financial accounting sense, trade credit is not necessarily considered a source of investment financing. However, the argument of Fisman and Love (2003) does seem particularly applicable in the Russian context.

(chistyi) profits as a proportion of share capital, and the government initiated efforts to tax the
stock of share capital, excess profits above certain levels, and corporate directors' personal
income (Bowman 1993, pp. 260-1; Kotsonis, 2014). In standard views of corporate finance, the
deductibility of interest payments from taxable corporate income generates incentives to finance
growth through more debt until the benefit of greater leverage is offset by the additional default
risk (Miller and Modigliani, 1961). However, this “static tradeoff” between debt and equity may
be muted in environments with limited enforcement of accounting standards, or where credit
markets are imperfect in some way (Berk and DeMarzo, 2013, Chps. 14-15). Both of these
constraints were operational in late-Imperial Russia (despite a tax regime that allowed interest
deductions; see Kotsonis, 2014), which likely muted the overall tax benefits of debt. However,
the progressiveness of the tax system and the extra assessment on firm capital after 1898 suggest
that larger and more (observably) profitable corporations may have some extra incentives to
finance with debt over equity, ceteris paribus.
Finally, Russian corporations operating in 1913 occupied very different places in their “life-
cycles.” While there were considerable numbers of older, more mature firms (often founded
from pre-existing firms and selecting the share partnership type), the wave of corporate
chartering after 1907 meant that the sector contained many young, brand new firms, often of the
A-corporation type (Owen, 1991 and 1992b). This distribution of corporate ages allows us to
examine life-cycle models of capital structure, including “pecking order” theories of firm
finance. As firms age and grow, the rate of new projects, managerial concerns, information
asymmetries, and earnings volatility suggest a sequence of capital structure strategies: retained

profits, debt issuance, and then equity financing.34 We operationalize a simplified version of the
pecking order framework by considering the relationship between the age of Imperial
corporations and capital structure outcomes.
2.2.2 Payout Policies
We also consider Imperial Russian corporate revenue payout policies as a second lens into
Russian firm financial decisions prior to World War I. We focus on the issuance and size of
dividend payments, largely because of data availability. The extent of stock buybacks and other,
less public forms of payment to corporate stock owners is unknown and has been, to our
knowledge, completely unexplored in the early twentieth century Russian context.56 However,
explaining dividend policy sheds light not only on agency and other issues within corporations,
but also clarifies the interrelationship between firms and the Imperial Russian financial system.
The stocks issued by Russian railroads and other enterprises directly supported by state funds
often included a guaranteed dividend of five or more percent. These securities thus closely
resembled bonds. In practice, other corporations often seemed to implicitly guarantee the
issuance of annual dividends by writing language into the charter describing mechanisms for
issuing them and/or physically attaching dividend coupons to stock certificates (Papp, 2001,
Appendix 1). However, we have found no evidence of explicit dividend rates in charters or
34 The canonical article is Myers (1984). As Glen and Pinto (1994) note, developing countries such as Imperial Russia possess financial systems with missing “rungs” in such pecking orders, which may impact firms’ capital structures at different stages of growth relative to ideal benchmarks. Baskin and Miranti (1997) frame the history of corporate finance in light of a pecking order framework. 56 Papp’s (2001) comprehensive account of the Petersburg exchange does not mention such practices, nor have we found mention of buybacks in contemporary accounts.
regulated by law, and as we document below, there was considerable variation in dividends
across corporations in 1914.57
On their face, dividends are payouts to owners for their investment in firm equity.58 One
implication is that tightly controlled firms such as share partnerships, where owners likely played
more active managerial roles, may have exhibited higher dividends as a share of profits. But in
understanding variation across corporations, in Imperial Russia and elsewhere, it is also helpful
to consider other implications of external (to the firm) and internal information asymmetries. On
the one hand, managers of firms looking to expand may issue dividends as a signal of current or
future profitability to potential shareholders. Lowering dividends or imposing some fluctuations
in their issuance may generate a negative signal to potential outside investors.59 In a developing
country such as early 20th century Russia, with considerable stock market instability (Borodkin
and Konovalova, 2010; Papp, 2001), issuing a high dividend may have constituted a particularly
valuable signal for newer firms, firms in more volatile industries, or those farther from the main
financial centers.60 We can explore these hypotheses with our new dataset.
Dividend policy in the Russian context might have also reflected information asymmetries,
particularly agency concerns, between managers and owners. If managers are compensated with
57 This variation was evident earlier (1880s and 1890s) as well, particularly across industries, which we explore below in our data (Solov’ev, 1984). 58 Thus, lower prior profits make it harder to pay high dividends (Lintner, 1956). As we are only able to employ a cross-section in this paper, we cannot directly evaluate this possibility. Allen and Michaely (2003) provide a comprehensive survey of payout policies. 59 This is true only if investors can use the information conveyed by dividends to estimate appropriate measures of rates of return, which may be difficult in environments with poor accounting standards. Arnold and McCartney (2011) apply this discussion to 18th century British canal companies. In contrast, Campbell and Turner (2011) find evidence consistent with a signaling interpretation of dividends in late 19th century Britain. 60 However, other theories of dividend payouts suggest that cash flow volatility may lead to lower dividends (Chay and Suh, 2009). As we cannot measure cash flows in our data, particularly over time, we cannot distinguish among these alternatives.
a share of firm profits as an incentive to carry out projects successfully, low dividends – as a
residual – could reflect the high costs of monitoring managers.61 Alternatively, owners that do
not trust managers may prefer to pay out dividends rather than leave funds under management
control. We know too little about managerial compensation and within-firm governance in late-
Imperial Russian corporations to distinguish these models directly, but examining differences
across the two corporation types can let the data speak.
Another implication concerns corporations’ ages. Older firms tend to have access to fewer or
lower-return projects, which implies less need to incentivize managers, potentially leading to
greater dividends. Indeed, in many contexts, older and more established firms do tend to pay
higher dividends (La Porta et al., 2000, p. 340). As noted above, the firms in our dataset varied
widely by age, suggesting very different points in their life-cycles, with very different streams of
projects. Thus, we can shed light on agency issues within Imperial corporations by relating age
to dividend policies.
Finally, if corporate profits are taxed at a higher rate than individual capital gains, corporations
have an incentive to plow profits back into the firm and reduce payouts to owners (Allen and
Michaely, 2003). Thus, low dividends might indicate high levels of corporate taxation. Although
we do not have firm-specific information on tax rates in our Russian context, we do scale our
dividend measure by profits (to control for underlying tax progressivity), while explicitly testing
for the differential impact of firm size on payouts.
61 See, for example, La Porta et al. (2000).

2.2.3 Corporate Performance
The third attribute of Imperial corporations we explore is firm performance, as measured by
profitability, or the return on equity. Very little is known about the distribution of firm
performance in pre-Soviet Russia, with the significant exception of the recent work by Gregg
(2015a and 2015b), who focuses on variation in productivity at the establishment level.
Meanwhile, prominent studies such as Cheremukhin et al. (2017) contend that Imperial Russia
was characterized by substantial industrial concentration and associated monopoly profits across
industries. However, their study and the long literature on the roots of Russian industrialization
only consider aggregate or sectoral data. Although our dataset only covers the corporate sector,
rich cross-sectional variation allows us to document factors underlying firm performance,
including elements of corporate form and financial strategy.
Since the dataset does not lend itself to structural estimation of profits, we examine a set of
plausible, observable factors that might have impacted the reported rate of return. Given the tax
system, lax enforcement of accounting standards, and the need to impress external sources of
finance, Russian firms may not have reported completely truthfully. To the extent that these
factors differed across firms, we can partially control for associated characteristics like corporate
size and age.65 Furthermore, Russian industrial development was still in its early stages by 1914
but was characterized by modernizing and swiftly expanding corporations in several sectors:
textiles, transportation, oil and other extractive activities, and others. As such, we consider the
industrial sector in our analysis of firm-level rates of return.
65 We discuss these and other financial reporting issues below.

In contrast to the frictionless worlds of Modigliani and Miller (1958 and 1961), subsequent
literature has shown how financial or product market imperfections, distortionary taxation, and
dysfunctional aspects of commercial and corporate law can generate a correspondence between
firm valuations (or profits) and either capital structures or dividend policies.66 Imperial Russia
likely possessed several departures from perfect markets, as we discussed above. In such a
setting, the selection of Russian firms into one of two corporation types, if it mattered for their
financial choices, might have affected their subsequent performance. We thus explore whether
financial and governance features of corporations were associated with profitability, without
proposing a specific causal channel.
We also test a corollary hypothesis: if the corporate sector was relatively competitive, and if
firms – conditional on getting a charter – were able to choose their form of corporate structure
with relative freedom, then we would expect the decision between share partnership or A-
corporation to have little relationship with profitability, all else equal. Otherwise, with free
entry, firms would always choose the more profitable type. Similarly, any correlation between
size and profits might indicate the presence of market power for larger firms.
2.3 Summary: From History and Theory to Empirical Hypotheses
Sections 2.1 and 2.2 outlined the environment underlying Imperial Russian corporate capital
structure, dividend payout policies, and firm performance. Our discussion has boundaries: the
historical and modern literatures in these areas are vast, and our new cross-sectional dataset
66 Ratha at el. (2003) is good summary of such departures from the classical “irrelevance” results of Modigliani and Miller, particularly as evident in developing countries.

cannot evaluate all hypotheses. Our empirical work documents variation across firms and tests a
cluster of hypotheses that arise in the Russian context.
Corporate characteristics, capital structure, payout decisions, and firm performance are closely
related in developing economies such as late Imperial Russia. Based on the historical and
theoretical factors outlined above, we expect older, larger, and less tightly held firms (i.e. A-
corporations) to more likely issue additional equity and have relatively easier access to
securitized debt markets over directly intermediated lending. Moreover, we can evaluate whether
the separation of ownership and control and life-cycle factors had implications for payout
policies by examining the relationship between corporation type, age, or size and dividends. As
the literature suggests divergent hypotheses regarding firm characteristics and payout policies,
we view our efforts in this area as more desciptive. Finally, we assess whether observable
corporation characteristics were associated with higher returns, i.e. scaled profits. If the corporate
sector was relatively competitive, we should detect few differences in profits across corporations
by, for example, size or type.
3. Data: RUSCORP and the 1914 Corporate Balance Sheets
Only a few other historical studies have considered substantial datasets of corporate balance
sheet information.67 These works generally consider more developed economies with stronger
institutional structures and tend to rely on relatively small samples. Thus, our Russian data
represent a unique opportunity to investigate corporate financial strategies within a broad sample
67 Examples include Campbell and Turner (2011), Deloof and Van Overfelt (2008), and Hilt (2014).

of corporations from a less developed economy without general incorporation and, likely, with
relatively weak administration of existing commercial and bankruptcy law.
The scaffolding of our dataset is based on the RUSCORP database (Owen 1992b), which
provides basic information gleaned from the charters of all corporations founded in the Russian
Empire from 1700 to 1914. Because the information comes from charters, RUSCORP's main
files provide information about the corporation only at the moment of its birth. This database
also includes several cross-sectional “snapshots” of information on corporations surviving and
doing business in the Russian Empire in certain years: 1847, 1869, 1874, 1892, 1905, and 1914.
A key contribution of our paper is to build on the 1914 RUSCORP cross-section by adding
information on corporate capital structures and dividend issuance. These data come from 1913-
14 balance sheet information published by the Russian Ministry of Trade and Industry in the
Collection of Information on Active Share Companies and Share Partnerships in the Empire
(henceforth, Sbornik).68 While the 1914 cross-section in RUSCORP includes some data from
Sbornik, such as initial capitalization and par share values, it contains neither the entire array of
balance sheet variables nor information on dividend payouts. We add this information.
68 As Sbornik was published in 1914, we are confident that the bulk of the balance sheet data refer to the period prior to Russia’s entry into World War I in August of 1914. Furthermore, as Markevich and Harrison (2011) and Dower and Markevich (forthcoming) note, the Russian economy remained relatively unaffected by the war or wartime mobilization into late 1914.

3.1 Summary Statistics on Corporate Charters from RUSCORP
Between 1700 and 1914, the Imperial Russian government granted charters to approximately
4,500 corporations. The number of corporations in the Russian Empire grew rapidly from 1890
to the end of 1914. Between 1890 and 1900, the Ministry of Finance issued 1,260 corporate
charters, more than what had been issued in the entire history of the Russian Empire up to 1891.
Between 1900 and 1910, the Ministry approved another 1,386 and another 953 between 1910
and 1914 (Table A1).
Table 1 documents incorporations by the particular organizational form denoted in their charters.
“A-corporations” and “share partnerships” were overwhelmingly the most common, and we
focus on those two categories in this paper.69 Though A-corporations and share partnerships
could be found throughout the Russian Empire, A-corporations were more likely to be
headquartered in St. Petersburg, and share partnerships were more likely to be headquartered in
Moscow.70
[Insert Table 1 about here]
The sectoral distribution of corporations changed over time (Table 2). By the twentieth century,
the most common sector for incorporation was manufacturing, followed by transportation,
mining, wholesale (retail), and finance. Far fewer corporations specialized in services,
69 In this paper, we define an “A-corporation” as a firm that uses the term “aktsiia” for “share.” 70 According to RUSCORP (Owen 1992b), of the 1,449 A-corporations founded between 1900 and 1914, 543 were headquartered in St. Petersburg and 166 in Moscow. 124 of the 576 share partnerships chartered between 1900 and 1914 were headquartered in St. Petersburg and 232 in Moscow. Share partnerships founded in Moscow frequently emerged out of Old Believer entrepreneurial and merchant networks (Owen 1983, p. 70).
construction, retail, public administration, or other industries, and no corporations over the entire
period were classified as primarily agricultural.
[Insert Table 2 about here]
How does late-Tsarist incorporation compare to other countries? According to Leslie Hannah's
(2013) recent study, the level of incorporation in Russia in 1910 was the lowest in Europe at 10
per million people. In comparison, the levels in Norway, the UK, Netherlands, Switzerland, and
Sweden were over 1000 per million, and Germany (403) and France (306) possessed high levels
of incorporation even though alternative organizational forms were common (Guinnane et al.
2007). Russia’s low level of income may have limited the demand for incorporation, but the
charter system also likely created relatively high costs for firms interested in adopting a new
organizational form.
3.2 An Overview of the 1914 Balance Sheet Data
From the information the RUSCORP dataset provides on corporations at the time of their
founding,71 we extract the total nominal initial share capital, the total number of shares issued,
and the par value of each share issued at founding.72 These shares were generally issued as
common stock, although other classes did exist and had different claims on the firm's capital and
71 Owen (1992a, 19-25 and 25-7) explains how RUSCORP’s compilers defined corporations and collected information from the charters of newly incorporated firms, not on charter renewals or revisions. 72 RUSCORP documents whether charters specified conditions for issuing bonds (Table A2). A-corporations’ charters were more likely to explicitly permit issuing debt securities. Most charters did not mention bonds at all.

profits.73 Total capitalization and share price are standardized so that they are all stated in a
common (albeit nominal) ruble.74 Panel A of Table 4 summarizes these variables for the
corporations chartered in the period 1901-1914.75 According to these data, the mean par value of
shares was relatively high at the time of chartering (roughly five times per capita income - see
Gregory 1982), but the variation in initial firm capitalization and share size was significant.
Incorporation was not reserved exclusively for the largest firms.
Imperial Russia’s commercial law required companies to make regular reports of their financial
status at shareholder meetings.76 At minimum, companies reported the status of the company's
share capital, capital reserves, revenue and expenditures, managerial compensation, and profits.77
The Ministry of Finance occasionally published such balance sheet information in compilations
like the Sbornik volume we use to extend RUSCORP.
73 Shares could be issued in the name of a specific shareholder or simply “to the bearer” (Owen, 1992a and 1992b). 74 Several kinds of ruble currency were used throughout Russian history. The RUSCORP database employs a common “credit ruble” for corporations founded between 1853 and 1914 (Owen, 1992a, pp. 62-67). Even after Russia adopted the gold standard in 1897, fixing the value of credit rubles relative to gold rubles, the former remained the standard unit of account through 1914. 75 Except for share price, values reported in Table 3 are in thousands of rubles. Numbers of observations differ slightly across rows due to missing data. 76 See Svod (Vol. X, Part I, Article 2185), citing the 1836 corporation law that established the details of the concession system and corporate regulation: “The board of directors of each company gives timely reports of accounts to the general shareholder meeting, the timing of which is determined in set down in private charters.” Usually, such reports were made annually or semi-annually (Shershenevitch 1908, p. 456). For companies whose shares traded on the stock exchanges, additional public releases of information were required. Linda Bowman notes that “publicly owned companies were already required to publish their balance sheets and accounts of their operations,” even before the institution of the corporate income tax in 1885 (1993, p. 260). 77 Svod (Vol. X, Part I, Article 2186): “The accounts are signed by all members of the Board of Directors and should contain: 1) the condition of the company’s capital, 2) total income and expenditure for the period over which the report is submitted, 3) a detailed account of managerial compensation, 4) net profit, 5) total capital reserves, if they exist, 6) a special report on artistic and other enterprises, if the company has any.” These disclosure requirements resembled those of the 1867 French law, which required joint stock companies to submit balance sheets with accounts of inventory and profits or losses every other year (Foreman-Peck 1995, p. 18; Guinnane et al. 2007, p. 692).

Published Russian balance sheets were divided into aktiv (active) and passiv (passive)
components. If the company's accounts were balanced, the totals for the active and passive
columns were equal. The active column included the value of property (real estate), goods
(inventory), materials, and debits; while the passive column usually included share capital
(number of shares x par value), reserves, amortization, other capital, profits or losses (retained
earnings), and accounts payable (“credits”).78 Sbornik lists the passive components and at least
some of the active components of each corporation’s balance sheet, as well as the company's
total balance and dividend payouts as a percentage of current share capital.
Table 3 depicts a typical balance sheet in the form such a report would normally take in
publications of the Ministry of Finance or in commercial newspapers. This example is from the
heroic directory compiled by Dmitriev-Mamonov (1905), who assembled statistics from various
official sources on the financing, governance, and performance of corporations in operation in
1904. This particular company, the Teplovyye Brothers Partnership, achieved balance: both the
active and passive columns equal 392,400 rubles. In general, the active and passive columns
resemble assets and liabilities on modern balance sheets.
[Insert Table 3 about here]
78 See Russia, Ministerstvo (1906, pp. 168-267). Amortization is payment on capital due within the balance sheet’s accounting period. The term used in Sbornik is kapital pogasheniia, (“capital payments”). The Ministry of Finance Yearbooks call this amortizatsiia, literally “amortization.” Contemporary Russian encyclopedias and dictionaries reconcile these terms (e.g. Brokgauz and Efron, 1890-1907). The entry for amortizatsiia lists pogasheniie dolgov as a synonym. Other terms that sometimes appeared on Russian balance sheets included dobavochnii kapital (paid-in capital) and reservnii kapital (surplus or reserve capital). Here, “other capital” could include surplus capital above what is listed as “reserves.” Finally, “profit or loss” is retained earnings, not annual income, when listed on such a balance sheet. We use the term “profit or loss” in the paper, since that is a direct translation of the Russian term in the Sbornik. Table A3 provides translations of all terms.
Panels A and B of Table 4 present summary statistics for variables appearing in RUSCORP and
Sbornik.79 Although we only employ one cross-section of balance sheet data in this paper,
matching these data to RUSCORP allows us to observe share capital at two points in time: the
chartering date and in 1913-14. The median corporation had 600,000 rubles of share capital at
founding and 800,000 when observed in Sbornik. Median share capital could be higher in
Sbornik both because corporations grew in the time between founding and observation in 1913-
14, and because the Sbornik only observed surviving corporations, which may have been
larger.80 While the Sbornik data are observed at the end of a period of growth (but before the
effects of the war could be felt), we have found no evidence to suggest that capital structure,
dividend issues, or performance were biased one way or another by the point along the business
cycle that we observe these corporations.
[Insert Table 4 about here]
On average, the largest component reported in the Sbornik data was the value of property,
followed by share capital. The bottom portion of Panel B documents the (non-zero) balance sheet
components scaled by that total balance. The average corporation's credit – i.e. direct loans –
comprised about one quarter of its total balance. For those corporations that issued bonds,
bonded debt was much smaller than credit on average, comprising only about thirteen percent of
the total balance. The mean dividend per share was almost one percent of the par share price.
The final two rows show bonded debt and direct credit as a proportion of corporations' total
liabilities, where total liabilities is the total of the passive columns (share capital, capital
79 This table includes only non-zero values. Table A5 summarizes the same variables, including zero values. 80 These share capital values are in nominal rubles, but inflation was very low in this period, particularly with the adoption of the gold standard in 1897.
reserves, capital payments, profits, credit, and bonded debt): credit comprised a larger proportion
of total liabilities than bonds on average.
It appears that certain categories from the Sbornik balance sheet data are missing or defined
differently than what we see in the Teplovyye example. For example, the Sbornik does not report
the company's cash separately, and the value of property may or may not include all forms of
movable and immovable property. The result is that many corporations do not display a balance
in their accounts. We show the mean residuals in total balances when we add the available active
and passive components in Table 5. The average difference between the sum of the passive
account and total balance, as a percentage of total balance, is about 18 percent, and there are
relatively few perfect matches. The average difference using the active component, for which we
only know value of property, is much higher, roughly fifty percent, though there are more perfect
matches. Thus, although we are confident that Sbornik provides useful data on important
components of corporations' balance sheets in 1913, some information is missing.
[Insert Table 5 about here]
4. Balance Sheet Entries, Capital Structures, and Growth in Capital by Corporation Type
To better understand the implications of organizational form for firm financial strategies, we
focus on differences between A-corporations and share partnerships. Table 6 presents summary
statistics for the balance sheet items scaled by corporations' total share capital in 1913-14, as
well as t-tests comparing the means of A-corporations and share partnerships.81 We find striking
differences in the capital structures of these two types of corporations. A-corporations tended to
have greater total share capital, both in 1913-14 and when they were founded, and bonded debt
as a proportion of share capital.82 Share partnerships had proportionally higher reserves, capital
payments, total balance, accounts payable, and dividends. A-corporations had a larger absolute
value of property (Table A3), but the scaled value of property was similar for both types.
[Insert Table 6 about here]
A-corporations and share partnerships apparently financed themselves in quite different ways.
Did these differences simply reflect underlying variation in firm characteristics? Descriptive
regressions show how the use of different balance sheet items varied according to corporation
type (A-corporation vs. share partnership) and other firm characteristics, such as age, industry,
and province of founding.83 The resulting coefficient estimates allow us to evaluate the validity
of our data by checking whether Russian corporations made capital structure decisions consistent
with the hypothesized relationships noted in Section 2.2.
Table 7 presents results from Tobit, probit, and OLS regressions that document corporations' use
of bonded debt and “credit” (accounts payable) and growth in capital.84 We first explore a
corporations' decision to issue any bonds, since only a small number of corporations did so. In 81 Table A4 provide summary statistics and t-tests for differences in means of un-scaled versions of these variables. 82 As we suggested above, a share partnership usually began as a close circle of partner-investors, so it is no surprise that these firms tended to be smaller on average (Owen 1991, p. 152). 83 A corporation's type, chosen at founding, is not exogenous. Controlling for other firm characteristics likely related to financial strategy reduces some of the possible bias, but the estimates should be treated as suggestive rather than causal. 84 Table A6 presents results for models similar to those in Tables 7, 8, and 10 but with fuller sets of interaction terms. Such interactions are largely insignificant and do not change the main findings.

Column 1, we find that A-corporations and older corporations were more likely to issue bonds.
This is consistent with charter evidence from RUSCORP: roughly 11.9 percent of A-
corporations established between 1900 and 1914 were founded with the statute right to issue
bonds, versus only 3.1 percent of share partnerships (Table A2). Bond issuance does not seem to
have varied by industry in Column 1.85
Columns 2 and 3 present Tobit regression results for log accounts payable (credit) as a
proportion of share capital.86 Share partnerships and older corporations had significantly more
credit, and credit varied significantly across industries (Column 3). Corporations in the
construction and wholesale sectors, in particular, exhibited larger accounts payable (i.e. relied
more on this sort of short-term financing) relative to share capital in 1913-14. Finally, Columns 4
and 5 consider bonds plus “credit” as a proportion of total share capital. The results are similar to
those for accounts payable, since that form of financing made up a much larger proportion of
total balances. Share partnerships, older corporations, and corporations in the construction and
wholesale industries relied relatively more on external credit. These findings are consistent with
the simple hypotheses put forth in Section 2.2: firms’ increasing access to financing with age
may reflect a “pecking order,” and the more closely-held share partnerships were less likely to
seek outside financing in the form of equity or bonds.
[Insert Table 7 about here]
85 We examined but do not report regressions in which the dependent variable is the total bond amount or log bonded debt. Corporations' use of bonded debt as a proportion of share capital is larger for A-corporations and older corporations in a Tobit regression left censored at zero, since a corporation cannot have negative bond debt. 86 We employ Tobit regressions that are left-censored, since log credit over share capital must be at least zero.

The final column of Table 7 considers the growth in corporate share capital since the time of
founding. A-corporations, which may have had a lower cost of equity finance due to the wider
distribution and liquidity of their (smaller) shares, added capital more quickly than share
partnerships, though the difference is not statistically significant. Older corporations, which had
more time to grow, unsurprisingly, also added more capital. Column 6 also reveals variation
across industries: controlling for age and corporation type, financial corporations added
significantly less capital.
These results indicate that the organizational forms chosen by firms at the time of incorporation
were associated with real differences in firms' subsequent financial strategies: A-corporations
issued greater amounts of bonded debt, while share partnerships were more likely to finance
operations with credit.
5. Evaluating Performance: Dividends and Return on Equity
Were Russian corporations’ financial strategies related to performance? Here, we examine
corporations’ dividends and returns on equity. We first consider possible differences in dividend
issuance policies between two types of Russian corporations. Existing accounts suggest that
share partnerships usually consisted of small circles of investors in which the company’s
founders served as managers (Owen 1993; Hillman and Aven 2011). Given lower information
asymmetries, we would expect share partnerships to have had smaller costs of monitoring
managers and thus higher dividends.87
87 Share partnerships were exempt from certain regulations such as the provisions of a corporate reform enacted in 1901. Finance Minister Sergei Witte thought that “abuse of power by managers” was “virtually impossible” in share
As we saw in Table 6, share partnerships did issue greater dividends as a percentage of share
capital. Table 8 presents tests for differences in the mean dividend-to-profit ratios between these
types of firms. Share partnerships issued significantly more dividends per unit of profit than A-
corporations did, which is consistent with our hypothesis and indicates that share partnerships
and A-corporations pursued different payout strategies.88
[Insert Table 8 about here]
Did the differences in dividend issuance shown in Tables 6 and 8 simply reflect underlying
characteristics of these two types of firms? We expect corporations to pay dividends in times of
positive profits, so in the analysis that follows, we scale corporations' stated dividend amounts by
their retained earnings in 1913-14.89 The Tobit regressions in Table 9 consider factors that
possibly influenced the dividend-to-profit ratio, such as the age of the firm, the type of
corporation, firm size (indicated by total share capital in 1914), the solvency of the firm, and
whether the firm existed prior to incorporating. The results in Column 1 show that A-
corporations had smaller dividend-to-profit ratios than share partnerships. However, when we
control for the size and age of the firm in Column 2, the coefficient on the A-corporation dummy
loses statistical significance and sharply shrinks. Thus, despite apparent differences in other
aspects of financial strategies, otherwise similar share partnerships and A-corporations displayed
similar dividend payout policies.
partnerships (Owen (1991, p. 152). Witte may have been wrong: share partnership founders may have extracted rents by using concentrated ownership to secure higher dividend payments. 88 Dividend/profit ratios approximate traditional dividend/earnings ratios, which would use earnings from an income statement in the denominator. 89 The Sbornik’s profit entry appears to be gross, rather than net (of the dividend payments).
[Insert Table 9 about here]
Our results suggest that Russian corporations utilized dividend payout policies in response to
different underlying governance incentives and profit fundamentals, much as the modern
corporate finance literature suggests. Column 2 shows a key result: older firms had higher
dividend-to-profit ratios. Older firms may have had fewer new or high-potential investment
projects into which they could plow retained earnings. We also find that firms with greater total
share capital in 1914 paid larger dividends as a proportion of profits. Since we already control
for age and firm type, this result may indicate efforts to avoid the corporate income tax,
assuming that such a tax was only levied on post-dividend retained earnings. While unlikely in
the Russian context, this possibility deserves further study. Higher dividends among larger firms
may also reflect the relative importance of maintaining high payout levels to prop up equity
prices and support stock liquidity.
The results are essentially the same when we introduce industry controls in Column 3, as
dividend payout policies differed little across sectors.90 Column 4 introduces two more variables
that may have been relevant for dividend decisions: whether the firm was a new enterprise at the
time of incorporation and whether the firm was solvent.91 We find that firms that were new
enterprises when incorporated tended to have smaller dividend-to-earnings ratios than firms that
already existed. Perhaps new enterprises were still making essential investments to establish their
90 In Column 3, only the wholesale industry dummy variable has a statistically significant coefficient (the magnitude is .54, and the p-value is .007). 91 Approximately 30 percent of the corporations in Table 9 were new by RUSCORP’s definition when they incorporated.
operations and, hence, plowed a greater percentage of profits back into the firm. It could also
reflect the survival and subsequent incorporation of relatively more successful firms. Solvent
firms had much higher dividend-to-profit ratios than firms that were in receivership, all else
equal.92 Because solvency status impacted both the numerator and denominator of our dependent
variable, this finding probably reflects very small or zero dividends among firms in receivership.
Column 5 introduces province of headquarters fixed effects, which barely changes the results,
while Column 6 presents an OLS regression over the same variables, with little impact on the
findings.
Table 10 presents regressions that consider return on equity (measured as profit or loss divided
by total share capital in 1913-14) and the issuance of new equity (measured as the share capital
growth from founding until 1913-14). Column 1 shows no statistically significant return on
equity difference between A-corporations and share partnerships. In a competitive economy, if
one corporation type consistently outperformed the other, the worse-performing type should have
exited. Russian corporations appear at least somewhat competitive: neither type had higher
returns on equity, all else equal. Types were chosen to best match firms’ characteristics.
Older corporations, however, had higher profits as a proportion of share capital (Columns 2 and
3). Here age may proxy for survival: longer-surviving firms would be positively selected on
performance. Column 4 adds a control for the company’s log total credit plus bonds divided by
share capital, a measure of the company’s allocation of financing in credit rather than equity. If
firms performed better when they chose a certain financial strategy, controlling for observable
characteristics like firm type and industry, then all firms should choose that strategy. Such a 92 Firms in receivership could either be in administration receivership or liquidation. See Owen (1992a, p. 13).

difference would be evidence of market imperfections. We find no such difference: the effect of
the firm’s financial choice on return on equity in Column 4 is statistically zero.
Column 5, which presents results from a probit specification, considers simply whether
corporations had positive returns on equity. The difference between A-corporations and share
partnerships is not statistically significant; however, the interaction between type and age is
positive and significant. Among older corporations, A-corporations were more likely to have a
positive return on equity in 1913-14. The interaction may reflect positive selection (in terms of
competitiveness) among surviving early adopters of the A-corporation form. As in Column 4, the
company’s proportion of credit and bonds over capital does not affect the probability that the
company has a positive return on equity in Column 6.
[Insert Table 10 about here]
6. Conclusion
This paper presents a new database documenting the financial status of every corporation in the
Russian Empire in 1914. These data constitute unusually rich micro-evidence on the financing of
economic activity in a late industrializing economy. We summarize the components of corporate
balance sheets and document differences between A-corporations and share partnerships in terms
of capital structure and payout policies to explore how the variation in corporate characteristics
mattered in practice, despite the legal equivalence of Russian corporations. A-corporations had
smaller accounts payable (a form of short-term credit) and less total credit but more bonded debt

and greater increases in share capital from the time of founding, reflecting their greater reliance
on securities markets. Share partnerships issued greater dividends, perhaps because the small
circles of investors in those enterprises were better able to monitor the firms' managers.
However, our measure of performance did not differ between the two types of corporations once
we condition upon other firm characteristics.
We interpret these and our other findings as broadly consistent with modern theories of capital
structure, such as versions of a financial pecking order, and of payout policies, particularly as
exhibited in developing economies. Although we do not have an explicit benchmark to reference
at this stage in our research, two implications that we draw from the current study are that
Imperial Russian corporations likely offered more flexibility, and the corporate sector operated
somewhat more competitively, than the literature has generally assumed.
Our larger project will extend this cross-section to a balance sheet panel covering 1898 to 1914,
while matching all corporations to their founding charters, charter revisions, productivity
measures, and asset prices.93 The broader project’s goal is to understand the dynamics of firm
governance, finance, and growth in Russia. We hope to document how successful Russian firms
financed operations and expansion despite relatively underdeveloped credit and capital markets
and under absolutist legal and administrative institutions. We will examine how financial
strategies were linked with the legal structure of each corporation and the relationship between
balance sheet characteristics and changes in productivity of associated manufacturing
enterprises. Documenting the role played by the corporate form in the early stages of Russian
93 Gregg (2015a)’s database of Imperial Russian manufacturing establishments obtained from the 1894, 1900, and 1908 manufacturing censuses allows us to link corporate form, finance, and real economic outcomes.
industrialization will have implications for understanding the experiences of other developing
economies.
References
Allen, Franklin, and Roni Michaely. “Payout policy.” Handbook of the Economics of Finance 1 (2003): 337-429. Allen, Robert C. From Farm to Factory: A Reinterpretation of the Soviet Industrial Revolution. Princeton, NJ: Princeton University Press, 2003. Arnold, A. J., and S. McCartney, “'Veritable Gold Mines Before the Arrival of Railway Competition': But Did Dividends Signal Rates of Return in the English Canal Industry,” Economic History Review 64.1 (2011): 214-236. Baskin, Jonathan Barron, and Paul J. Miranti, Jr. A History of Corporate Finance. Cambridge: Cambridge University Press, 1997. Berk, Jonathan, and Peter DeMarzo. Corporate Finance. 3rd ed. Boston: Pearson, 2014. Borodkin, L. I., and A. V. Konovalova. Rossiiskii fondovyi rynok v nachale XX veka. St. Petersburg, Russia: Aletiia, 2010. Bowman, Linda. “Russia's First Income Taxes: The Effects of Modernized Taxes on Commerce and Industry, 1885-1914.” Slavic Review 52.2 (1993): 256-82. Braggion, Fabio, and Lyndon Moore. “Dividend Policies in an Unregulated Market: The London Stock Exchange, 1895-1905.” The Review of Financial Studies 24.9 (2011): 2935-73. Brokgauz and Efron. Entsiklopedicheskii slovar (1890-1907). Available: http://ru.wikisource.org/wiki/Энциклопедический_словарь_Брокгауза_и_Ефрона Calomiris, Charles W. “The Costs of Rejecting Universal Banking: American Finance in the German Mirror, 1870-1914,” in Coordination and Information: Historical Perspectives on the Organization of Enterprise. Naomi R. Lamoreaux and Daniel M.G. Raff, ed. U. of Chicago Press, 1995. 257-322. Campbell, Gareth, and John D. Turner. “Substitutes for Legal Protection: Corporate Governance and Dividends in Victorian Britain.” Economic History Review 64, no. 2 (2011): 571-597. Chandler, Alfred. The Visible Hand: The Managerial Revolution in American Business. Cambridge, MA: Belknap Press, 1977.
Chay, J. B., and Jungwon Suh. “Payout Policy and Cash-Flow Uncertainty.” Journal of Financial Economics 93 (2009): 88-107. Cheremukhin, Anton, Mikhail Golosov, Sergei Guriev, and Aleh Tsyvinski. “The Industrialization and Economic Development of Russia Through the Lens of a Neoclassical Growth Model.” The Review of Economic Studies 84.2 (2017): 613-649. Crisp, Olga. “Russia, 1860-1914,” in Banking in the Early Stages of Industrialization: A Study in Comparative Economic History. Rondo Cameron, ed. New York: Oxford University Press, 1967. 183-238. —–. Studies in the Russian Economy Before 1914. London: The Macmillan Press LTD, 1976. Deloof, Marc, and Wouter Van Overfelt. “Were Modern Capital Structure Theories Valid in Belgium Before World War I?” Journal of Business Finance & Accounting 35, no. 3-4 (2008): 491-515. Dower, Paul, and Andrei Markevich. “Labor Misallocation and Mass Mobilization: Russian Agriculture During the Great War.” The Review of Economics and Statistics (forthcoming) Dmitriev-Mamonov, V. A., ed. Ukazatel' deistvuiushchikh v Imperii aktsionernikh predpriatii i torgovykh domov. 2 ed. 2 vols. St. Petersburg, Russia, 1905. Fisman, Raymond and Inessa Love. “Trade Credit, Intermediary Development, and Industry Growth.” Journal of Finance 58.1 (2003): 353-74. Freeman, Mark, Robin Pearson, and James Taylor. Shareholder Democracies? Corporate Governance in Britain and Ireland Before 1850. Chicago: University of Chicago Press, 2012. Foreman-Peck, James. “Accounting in the Industrialization of Western Europe,” in European Financial Reporting: A History. Ed. Peter Walton. London: Academic Press, 1995. 11-28. Gatrell, Peter. The Tsarist Economy 1850-1917. London: B. T. Batsford, 1986. Glen, Jack, and Brian Pinto. “Debt or Equity? How Firms in Developing Countries Choose.” IFC Discussion Paper #22. Washington, DC: World Bank, 1994. Gregg, Amanda G. “Factory Productivity and the Concession System of Incorporation in Late Imperial Russia.” Unpublished Manuscript (2015a). —–. “Shareholder Rights and Share Capital: The Effect of the 1901 Russian Corporation Reform, 1890-1905.” Unpublished Manuscript (2015b). Gregory, Paul. R. Russian National Income, 1885-1913. Cambridge: Cambridge University Press, 1982.
—–. “Some Empirical Comments on the Theory of Relative Backwardness: the Russian Case.” Economic Development and Cultural Change 22.4 (1974): 654-665. Guinnane, Timothy, Ron Harris, and Naomi R. Lamoreaux. “Contractual Freedom and the Evolution of Corporate Control in Britain, 1862 to 1929.” NBER Working Paper No. 20481. September 2014. —–, —–, —–, and Jean-Laurent Rosenthal. “Putting the Corporation in its Place.” Enterprise and Society 8, No. 3 (2007): 687-729. Hannah, Leslie. “A Global Census of Corporations in 1910,” CIRJE Discussion Paper 878, February 2013. Hillman, Henning, and Brandy L. Aven. “Fragmented Networks and Entrepreneurship in Late Imperial Russia.” American Journal of Sociology 117, no. 2 (2011): 484-538. Hilt, Eric. “Corporate Governance and the Development of Manufacturing Enterprises in Nineteenth-Century Massachusetts.” NBER Working Paper No. 20096, May 2014. —–. “When Did Ownership Separate from Control? Corporate Governance in the Early Nineteenth Century.” The Journal of Economic History 68.3 (2008): 645-685. Jensen, Michael, and W. Meckling. “Theory of the Firm: Managerial Behavior, Agency Costs, and Ownership Structure.” Journal of Financial Economics 3 (1976): 305-60. Kahan, Arcadius. Russian Economic History: The Nineteenth Century. Chicago: University of Chicago Press, 1989. Kotsonis, Yanni. States of Obligation: Taxes and Citizenship in the Russian Empire and Early Soviet Republic. Toronto: University of Toronto Press, 2014. La Porta, R., F. Lopez-de Silanes, A. Shleifer, and R. Vishny. “Agency Problems and Dividend Policies around the World.” Journal of Finance 55 (2000): 1-33. Levine, Ross. “Finance and Growth: Theory and Evidence,” in Handbook of Economic Growth. Philippe Aghion and Steven Durlauf, eds. Amsterdam: Elsevier, 2008. Lintner, John. “Distribution of Incomes of Corporations Among Dividends, Retained Earnings, and Taxes.” The American Economic Review 46.2 (1956): 97-113. Markevich, Andrei, and Mark Harrison. “Great War, Civil War, and Recovery: Russia’s National Income, 1913 to 1928.” The Journal of Economic History 71.3 (2011): 672-703. McKay, John P. Pioneers for Profit: Foreign Entrepreneurship and Russian Industrialization: 1885-1913. Chicago: University of Chicago Press, 1970.

Miller, Merton, and Franco Modigliani. “Dividend Policy, Growth, and the Valuation of Shares,” Journal of Business 34 (1961): 411-433. Modigliani, Franco, and Merton Miller. “The Cost of Capital, Corporation Finance and the Theory of Investment.” American Economic Review 48.3 (1958): 261-297. Myers, Stewart C. “Capital Structure.” The Journal of Economic Perspectives 15, no. 2 (2001): 81-102. —–. “The Capital Structure Puzzle.” Journal of Finance 39 (1984): 575-592. Ol', Pavel V. Foreign Capital in Russia. 1922. Translated by Geoffrey Jones and Grigori Gerenstain. New York: Garland Publishing, 1983. Owen, Thomas C. The Corporation under Russian Law. Cambridge: Cambridge University Press, 1991. —–. “Entrepreneurship and the Structure of Enterprise in Russia, 1800-1880.” In Entrepreneurship in Russia and the Soviet Union. Edited by Gregory Guroff and Fred V. Carstensen. Princeton: Princeton University Press, 1983. —–. Codebook for RUSCORP: A Database of Corporations in the Russian Empire, 1700-1914. Third Release. Baton Rouge, LA, 1992 [Producer]. Ann Arbor: Inter-university Consortium for Political and Social Research, 1992a [Distributor]. —–. RUSCORP: A Database of Corporations in the Russian Empire, 1700-1914. Third Release. Baton Rouge, LA, 1992 [Producer]. Ann Arbor: Inter-university Consortium for Political and Social Research, 1992b [Distributor]. Papp, Robert Gordon. “The Development of a Domestic Stock Market in St. Petersburg in Late Imperial Russia.” Unpublished Ph.D. Dissertation, Columbia University, 2001. Polnoe Sobraniie Zakonov Rossiiskoi Imperii [Complete Collection of Laws of the Russian Empire.] Available: http://runivers.ru/lib/detail.php?ID=60656. Rajan, Raghuram, and Luigi Zingales, “The Great Reversals: The Politics of Financial Development in the Twentieth Century,” Journal of Financial Economics 69 (2003): 5-50. —–, and —–. “What Do We Know About Capital Structure? Some Evidence from International Data.'” Journal of Finance 50 (1995): 1421-60. Ratha, Dilip, Sanket Mohapatra, and Philip Suttle. “Corporate Financial Structures and Performance in Developing Countries,” in Global Development Finance. Washington, DC: The World Bank, 2003.
Rosenberg, Nathan, and L. E. Birdzell Jr. How the West Grew Rich: The Economic Transformation of the Industrial World. New York: Basic Books, 1986. Rozenberg, V.V. Tovarishchestvo s orgranichennoiu otvetstvennost’iu: o neobkhodimosti vvedeniia etoi formy v Rossii. St. Petersburg: Ministry of Finance Publishing, 1912. Russia. Ministerstvo Finansov. Ezhegodnik ministerstva finansov, vypusk 1905 goda. St. Petersburg, Russia, 1906 Russia. Ministerstvo Torgovli i Promyshlennosti. Otdel torgovli. Sbornik svedenii o deistvuiuschikh v Rossii aktsionernikh obschestvakh i tovarischestvakh na paiakh. 2nd ed. St. Petersburg, Russia, 1914 Shepelev, Leonid E. Aktsionernye kompanii v Rossii. Leningrad: Nauka, 1973. Shershenevitch, G.F. Kurs torgovogo prava 4th ed. St. Petersburg: Br. Bashmakoviie, 1908. Salomatina, Sofya A. Kommercheskie banki v Rossii: dinamika i struktura operatsii 1864-1917 gg. Moscow: ROSSPEN, 2004. Solov’ev, A. M. “Pribyli krupnoi promyshlennoi burzhuazii v aktsionernykh obshchestvakh Rossii v kontse XIX-nachale XX veka.” Istoriia SSSR No. 3 (1984): 34-49. Strebulaev, Ilya A. “Do Tests of Capital Structure Theory Mean What They Say?” The Journal of Finance 62.4 (2007): 1747-1787. Svod zakonov rossiiskoi imperii. Editor: I.D. Mordukhai-Boltovskii. St. Petersburg: Deiatel', 1912. [Available: http://civil.consultant.ru/code/].
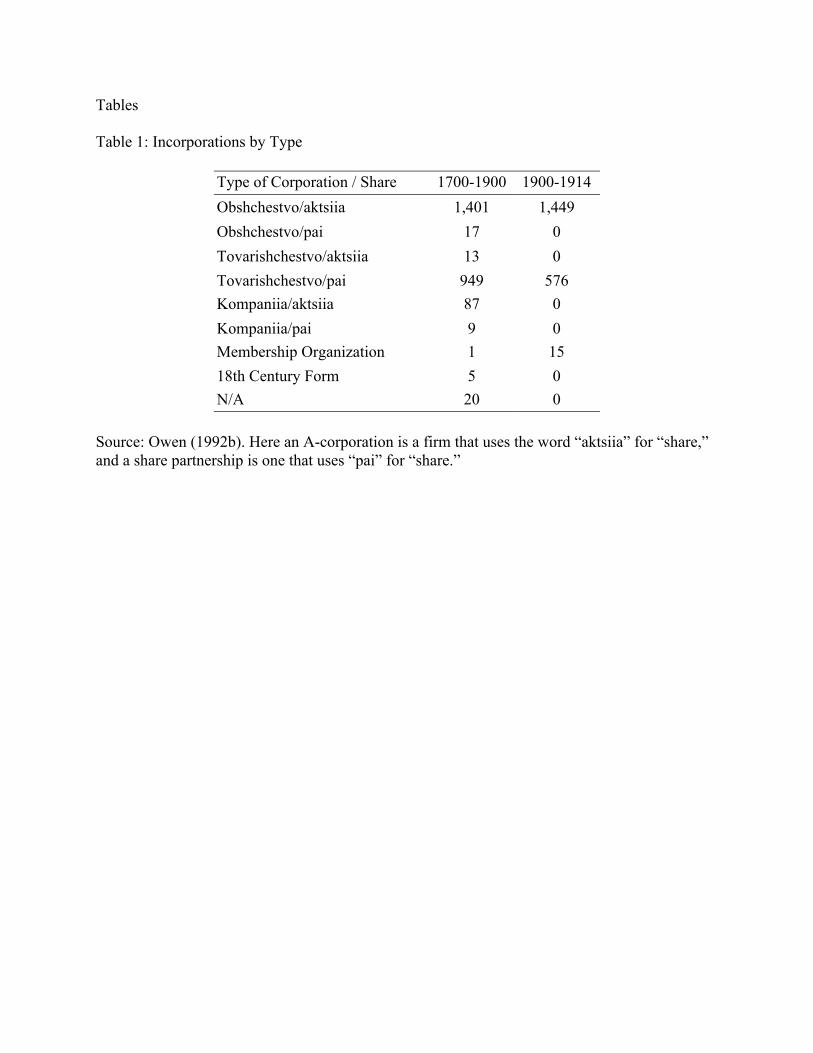
Tables Table 1: Incorporations by Type
Type of Corporation / Share 1700-1900 1900-1914 Obshchestvo/aktsiia 1,401 1,449 Obshchestvo/pai 17 0 Tovarishchestvo/aktsiia 13 0 Tovarishchestvo/pai 949 576 Kompaniia/aktsiia 87 0 Kompaniia/pai 9 0 Membership Organization 1 15 18th Century Form 5 0 N/A 20 0
Source: Owen (1992b). Here an A-corporation is a firm that uses the word “aktsiia” for “share,” and a share partnership is one that uses “pai” for “share.”

Table 2: Incorporations by Industry and Time Period
1700-1900 1900-1914 Industry Number Prop. Number Prop. Agriculture 35 .0140 21 .0095 Construction 32 .0128 56 .0253 Finance 214 .0855 138 .0623 Manufacturing 1,687 .6743 1,310 .5912 Mining 111 .0444 165 .0745 Retail 2 .0008 8 .0036 Services 38 .0152 71 .0320 Transportation 296 .1183 252 .1137 Wholesale 84 .0336 183 .0826 Not Classified 3 .0012 0 0
Source: Owen (1992b). Industry classifications are based on two-digit SIC codes Table 3: Balance Sheet of the Teplovye Brothers Steam Factory Hardware and Other Metal Products Partnership of Tula
Active Passive Cash, bills of exchange, paper, 71.1 Share Capital 300 cash on delivery Checking account, paper from reserve capital
15.7 Capital Reserves and Payments
67.0
Goods, materials, inventory 84.4 Creditors (accounts payable) 11.6 Real estate (immovable property) 93.7 Profit 13.6 Movable property 45.5 Debits 82.0
Total Balance 392.4 392.4 Source: Dmitriev-Mamonov, ed. (1905, vol. 1, p. 50).

Table 4: Summary Statistics for Corporate Financial Data (Non-Zero Values) Panel A: Initial Corporate Capitalizations, 1900 – 1914
Variable N Mean Std. Dev Median Min Max Share Capital 2,204 1,400.26 3,680.45 500 1 90,000 Number of Shares 2,150 5,946.33 15,219.10 2,000 30 300,000 Par Share Price 2,159 584.50 1,066.58 250 40 15,000
Panel B: Information on Corporations Included in Sbornik
Variable N Mean Std. Dev Median Min Max At Founding (from RUSCORP)
Share Capital 1,889 1,169.83 1,778.70 600 10 25,000 Number of Shares 1,885 4,329.28 11,541.46 1200 4 250,000 Par Share Price 1,887 1,095.84 1,910.98 500 27 25,000
In 1914 (from Sbornik) Share Capital 1,856 1,766.25 3,157.50 800 10 50,000 Capital Reserves 1,226 300.53 1,028.84 52.5 1 18,000 Amortization 1,237 925.88 2,278.38 249 1 32,452 Other Capital 809 499.89 3,714.01 36 1 87,709 Bonded Debt 122 1,540 2,240.68 729.5 8 16,339 Value of Property 1,397 2,381.55 4,736.62 900 1 62,134 Profit or Loss 1,407 275.61 729.53 80 -750 13,373 Credit 1,407 1,301.90 2,978.60 454 1 66,500 Total Balance 1,428 5,449.62 10,212.10 2,373.50 14 178,236 Dividend % 891 8.62 5.55 7.2 .07 56
Sbornik Variables, Scaled Share Capital / Total Balance 1,401 .47 .61 .41 .022 21.43 Capital Reserves / Total Balance 1,204 .034 .038 .020 .000037 .27 Bonded Debt / Total Balance 121 .13 .13 .11 .00081 .88 Credit / Total Balance 1,381 .25 .20 .20 .00011 2.88 Div. Amt. per Share / Share Price 889 .0087 .0085 .007 .00007 .16 Bonded Debt / Total Liabilities 122 .13 .097 .12 .0013 .49 Credit / Total Liabilities 1,406 .27 .21 .23 .00020 1.02 Source: Owen (1992a) and Sbornik. Share capital and par share price are standardized according to Owen's (1992a) method. All unscaled items except share price are reported in thousands of rubles. Div. Amt. per Share / Share Price is the dividend as a percentage of total capital times total capital dividend by the company's number of shares in 1914 divided by the company's (Owen standardized) share price in 1914. Summary statistics including zero values are reported in the Appendix. Total liabilities denotes the total of the passive columns: share capital, capital reserves, other capital, capital payments, profits, creditors, and bonded debt.
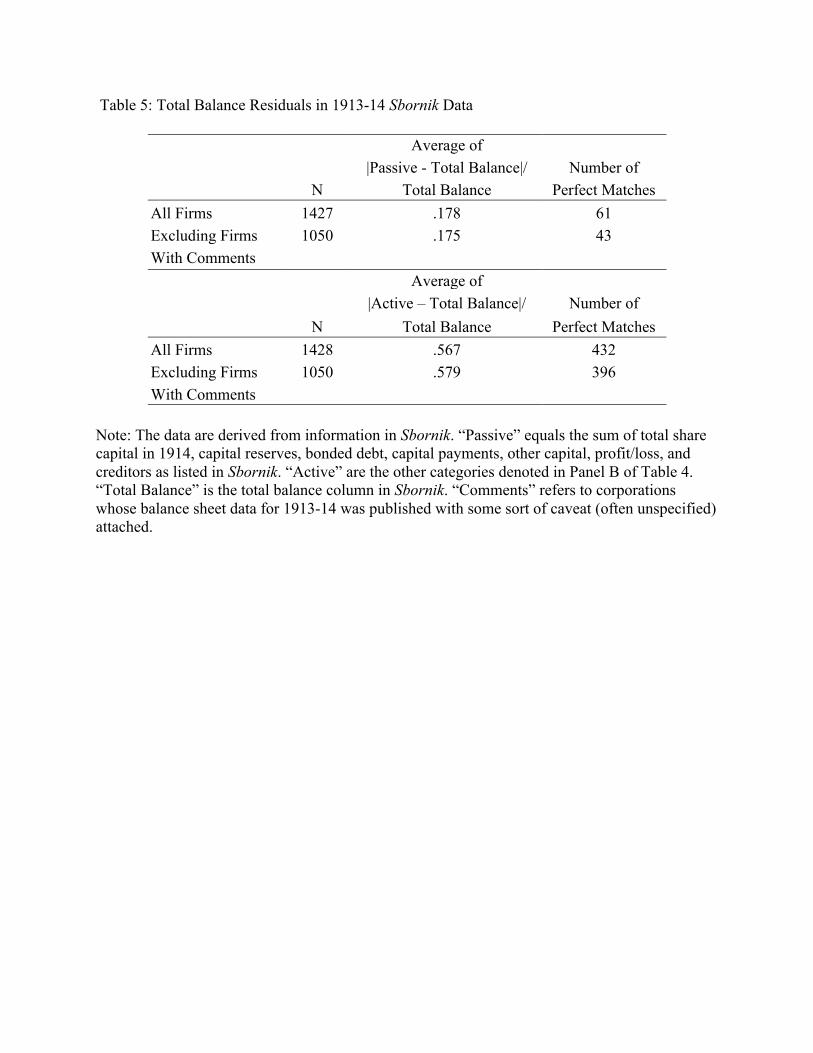
Table 5: Total Balance Residuals in 1913-14 Sbornik Data
Average of |Passive - Total Balance|/ Number of N Total Balance Perfect Matches All Firms 1427 .178 61 Excluding Firms 1050 .175 43 With Comments Average of |Active – Total Balance|/ Number of N Total Balance Perfect Matches All Firms 1428 .567 432 Excluding Firms 1050 .579 396 With Comments
Note: The data are derived from information in Sbornik. “Passive” equals the sum of total share capital in 1914, capital reserves, bonded debt, capital payments, other capital, profit/loss, and creditors as listed in Sbornik. “Active” are the other categories denoted in Panel B of Table 4. “Total Balance” is the total balance column in Sbornik. “Comments” refers to corporations whose balance sheet data for 1913-14 was published with some sort of caveat (often unspecified) attached.

Table 6: Balance Sheet Summary Statistics by Type of Corporation (Scaled) Date of No. of Mean for Share Mean for Variable Observation Obs. Partnerships A-Corporations Difference
Dividend (as % of 1914 1,487 5.764 4.73 1.02 *** Share Capital)
(.25) (.20) (.315)
Share Capital Founding 1,877 935.52 1353.55 -418.03*** (41.60) (64.52) (82.61)
Share Capital 1914 1,888 1575.06 1859.59 -284.53* (88.21) (108.05) (145.68)
Reserves / 1914 1,856 .097 .050 .070*** Share Capital (.0051) (.0038) (.0031)
Capital Payments / 1914 1,856 .34 .23 .12*** Share Capital (.019) (.014) (.023)
Other Capital / 1914 1,856 .049 .13 -.085 Share Capital (.0043) (.048) (.055)
Bonded Debt / 1914 1,856 .018 .028 -.010* Share Capital (.0040) (.0036) (.0054)
Value of Property / 1914 1,856 .92 .90 .019 Share Capital (.034) (.034) (.049) Total Balance / 1914 1,856 2.64 1.92 .71*** Share Capital (.093) (.079) (.061)
Profit or Loss / 1914 1,856 .095 .082 .0130* Share Capital (.0051) (.0045) (.0068)
Credit / 1914 1,855 .79 .46 .33*** Share Capital (.045) (.035) (.056) *** p<.001, ** p<.01, * p<.05. These figures refer only to corporations that appear in the Sbornik (founding share capital is from Owen 1992b). The un-scaled summary statistics are reported in Table A3. Results are from a two-sample t test assuming equal variances. Standard errors are in parentheses. Tests for “Difference” (= mean (not aktsiia) - mean (aktsiia)) are one-sided. For the sake of this table, a “Corporation” is a firm that uses the world “aktsiia” to denote “share,” a “Share Partnership” is a firm that uses the word “pai” for “share,” and 1914 refers to the 1913-14 accounting year.

Table 7: What Factors Were Associated With the Use of Bonded Debt, Short-Term Credit, and Equity Financing? Dependent Variable: Pr(Bonds > 0) log (Credit / Cap) log((Cred. +
Bonds)/Cap.) Delta
Cap/Cap Specification: Probit Tobit Tobit Tobit Tobit OLS [1] [2] [3] [4] [5] [6]
Firm is A-Corporation .59*** -.30*** -.23** -.26*** -.19* -0.15 (.16) (.076) (.080) (.072) (.076) (0.16) Log Age .70*** .11** .14*** .12** .16*** 0.61*** (.086) (.038) (.040) (.037) (.039) (0.083) Construction -.52 .84* .74 0.31 (.42) (.040) (.39) (0.21) Manufacturing -.085 .14 .18 0.21 (.21) (.20) (.20) (0.15) Transportation -.32 -.26 -.26 0.59 (.29) (.26) (.25) (0.36) Wholesale -.42 .69** .72** 0.040 (.39) (.24) (.23) (0.17) Finance -.48 .17 .23 -0.51*** (.35) (.28) (.27) (0.19) Services .19 .19 -0.46** (.35) (.35) (0.20) Province = Moscow .057 .25** .20* .25** .20* -0.12 (.48) (.084) (.083) (.080) (.079) (0.13) Constant -6.45*** -.87*** -1.13*** -.87*** -1.17*** -0.72*** (.40) (.13) (.23) (.13) (.23) (0.25) N 1,549 1,378 1,378 1,380 1.380 1,877 R2 .2305 .0278 .0461 .0277 .0456 0.058 Province Dummies Yes No No No No No *** p<.001, ** p<.01, * p<.05. Tobits are left-censored at zero. Robust standard errors are in parentheses. The dependent variable denominators (Share capital) in Columns 2-5 use 1914 values. The numerator values for “Credit” and “Bonds” are defined in the text. Province (guberniia) is the location of the company's headquarters. Columns 1, 3, and 5 omit the service, agriculture, public administration, and mining industries due to insufficient observations. In Column 6, “Delta” cap/cap refers to the change in share capital from founding to 1914, relative to founding capitalization.
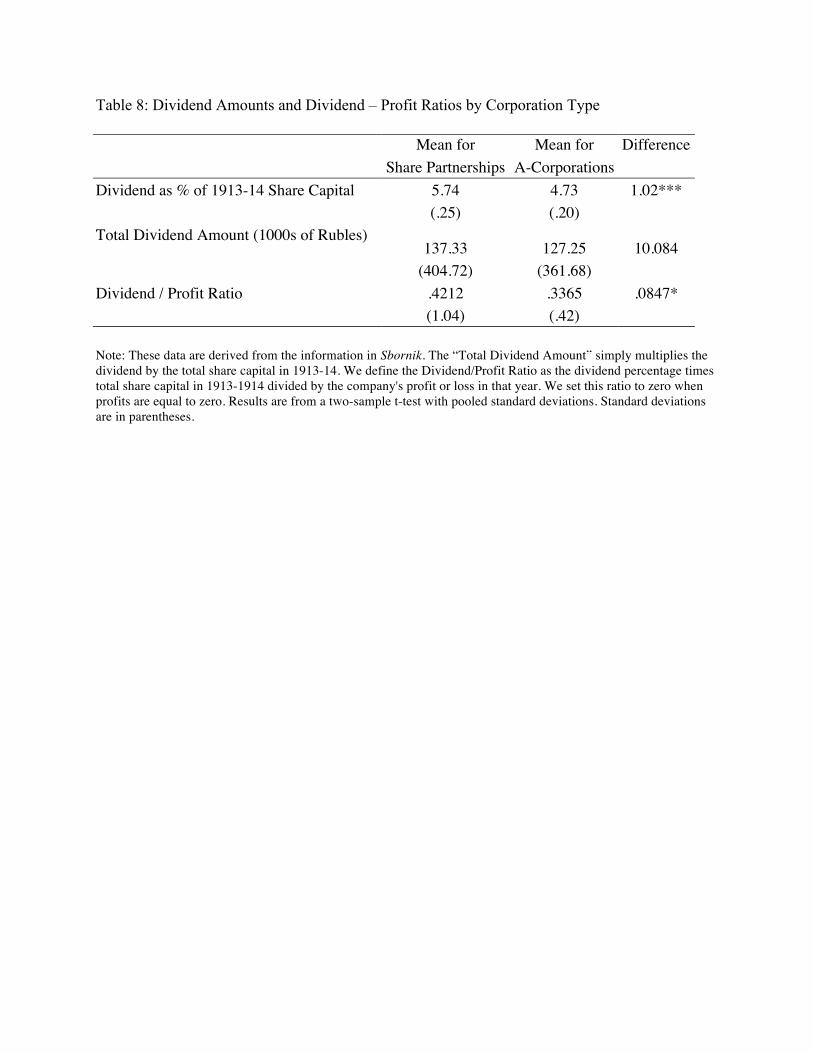
Table 8: Dividend Amounts and Dividend – Profit Ratios by Corporation Type Mean for Mean for Difference Share Partnerships A-Corporations Dividend as % of 1913-14 Share Capital 5.74 4.73 1.02*** (.25) (.20) Total Dividend Amount (1000s of Rubles)
137.33 127.25 10.084 (404.72) (361.68) Dividend / Profit Ratio .4212 .3365 .0847* (1.04) (.42) Note: These data are derived from the information in Sbornik. The “Total Dividend Amount” simply multiplies the dividend by the total share capital in 1913-14. We define the Dividend/Profit Ratio as the dividend percentage times total share capital in 1913-1914 divided by the company's profit or loss in that year. We set this ratio to zero when profits are equal to zero. Results are from a two-sample t-test with pooled standard deviations. Standard deviations are in parentheses.

Table 9: What Factors Were Related to Corporate Dividend / Profit Ratios in 1913-14? Dependent Variable: Dividend / Profit Specification: Tobit Tobit Tobit Tobit Tobit OLS [1] [2] [3] [4] [5] [6] Firm is A-Corporation -.20* -.066 -.022 .033 .032 -.0034 (.092) (.072) (.067) (.057) (.076) (.050) Log Share Capital in 1914 .16** .16** .16** .16*** .086*** (.059) (.059) (.058) (.028) (.018) Log Age .33*** .32*** .34*** .34*** .10*** (.070) (.068) (.073) (.032) (.019) New Enterprise -.35** -.33*** -.13** (.10) (.073) (.047) Firm is Solvent 1.88** 1.85** .41* (.68) (.51) (.20) Constant .13** -1.77*** -2.30*** -4.08** -3.56** -.75 (.092) (.63) (.88) (1.38) (1.23) (.81) N 1,507 1,486 1,486 1,486 1,486 1,486 R2 .0030 .0658 .0710 .0833 .1073 .1141 Industry dummies No No Yes Yes Yes Yes Provincial dummies No No No No Yes Yes *** p<.001, ** p<.01, * p<.05. Tobits are left-censored at zero. Robust (except in columns 5 and 6) standard errors are in parentheses. The dependent variable is defined in the text and as in Table 9. As in previous tables, the omitted industry categories are agriculture, public administration, and nonclassified.

Table 10: What Factors Influenced the Return on Equity (ROE)? Dependent Variable: ROE Pr(ROE > 0) Specification: OLS OLS OLS OLS Probit Probit [1] [2] [3] [4] [5] [6] Firm is A-Corporation -.013 -.013 -.092 -0.011 -0.25 -0.0032 (.0068) (.012) (.016) (0.024) (0.16) (0.26) Log Age .035*** .038*** 0.037*** 0.46*** 0.29*** (.0040) (.0048) (0.0065) (0.049) (0.074) A-Corp. * Log Age .0086 .0064 0.0081 0.16** 0.082 (.0059) (.0063) (0.010) (0.066) (0.099) Log (Total Credit + 0.0019 -0.071* Bonds) / Capital (0.0040) (0.037) Mining -.0035 -.0150 -0.023 0.069 -4.511*** (.022) (.047) (0.055) (0.47) (0.33) Construction -.0064 -.0049 -0.0041 -0.089 -4.30*** (.022) (.052) (0.059) (0.52) (0.51) Manufacturing .025 .014 0.011 0.45 -3.92*** (.020) (.045) (0.053) (0.45) (0.27) Transportation .028 .012 0.0073 0.53 -3.95*** (.022) (.046) (0.054) (0.47) (0.31) Wholesale .021 .0050 -0.0063 0.67 -3.68*** (.023) (.046) (0.055) (0.47) (0.30) Finance .013 -.0036 -0.017 0.28 -4.36*** (.025) (.048) (0.056) (0.49) (0.35) Retail .083 .067 0.083 1.04 (.073) (.083) (0.10) (0.82) Services -.0040 -.015 -0.0068 0.022 -4.38*** (.027) (.052) (0.059) (0.54) (0.45) Constant .095 -.0146 .10 0.10 3.17*** 7.73*** (.0051) (.021) (.15) (0.15) (0.52) (0.34) N 1,856 1,846 1,846 1,846 1,807 1,254 R2 .0020 .0987 .1329 0.133 .1800 .0896 Province Dummies No No Yes Yes Yes Yes *** p<.001, ** p<.01, * p<.05. ROE, return on equity, is profit or loss divided by total share capital in 1914. Robust standard errors are in parentheses for columns 1, 2, 4, and 6. Standard errors in parentheses in columns 3 and 4. The omitted industry categories are agriculture, public administration, and non-classified. See the text for additional information.

Appendix Table A1: Number of Incorporations (New Charters) in the Russian Empire, 1890-1914
Year # of Incorporations up to New and Including Year Incorporations
1890 1237 -- 1900 2503 1266 1910 3589 1386 1913 4542 953
Source: Owen (1992b) Table A2: Bond Restrictions in Charters by Corporation Type 1700-1900 1900-1914 A-corporation N 1,500 1,449 No Bond Issue Mentioned 1,134 1,279 Bond Issue Permitted; No Amount Specified 294 134 Bond Issue Permitted; Amount Specified 68 39 Share partnership N 975 576 No Bond Issue Mentioned 912 558 Bond Issue Permitted; No Amount Specified 58 17 Bond Issue Permitted; Amount Specified 4 1 Source: Owen (1992b). Some corporations whose charters did not mention bond issuance had positive bond amounts in the 1914 Sbornik data, though on average such corporations had smaller bond amounts. The average bonded debt for a firm for which the charter did not mention bond issuance is 71.10 (thousands of rubles) with a standard deviation of 643.31, while the overall average is 281.18 with a standard deviation of 1076.09.
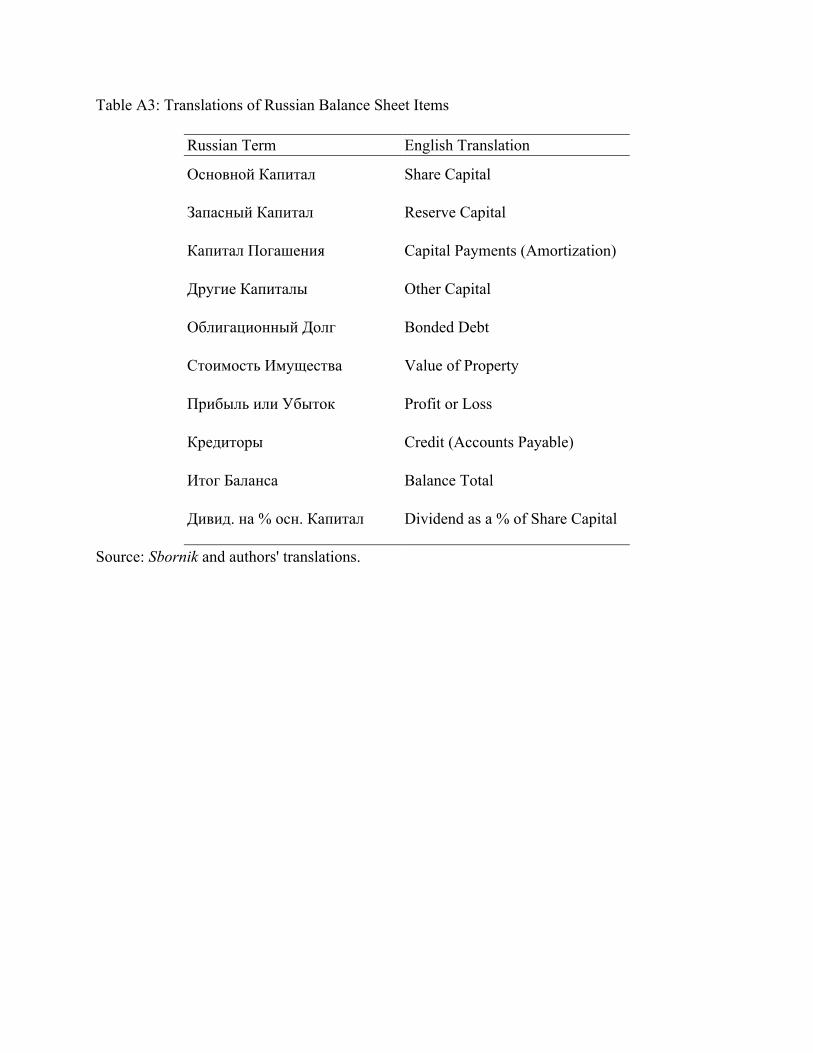
Table A3: Translations of Russian Balance Sheet Items
Russian Term English Translation
Основной Капитал Share Capital
Запасный Капитал Reserve Capital
Капитал Погашения Capital Payments (Amortization)
Другие Капиталы Other Capital
Облигационный Долг Bonded Debt
Стоимость Имущества Value of Property
Прибыль или Убыток Profit or Loss
Кредиторы Credit (Accounts Payable)
Итог Баланса Balance Total
Дивид. на % осн. Капитал Dividend as a % of Share Capital
Source: Sbornik and authors' translations.

Table A4: Balance Sheet Summary Statistics by Type of Corporation (Un-Scaled) Variable Date of Mean for Mean for Difference Observation A-Corporations Share Partnerships Dividend (in terms 1914 5.76 4.73 1.03 *** of % of Share Capital) (.25) (.20) (.315) Share Capital Founding 935.52 1353.55 -418.03*** (41.60) (64.52) (82.61) Share Capital 1914 1562.42 1864.18 -301.76* (87.05) (107.65) (146.06) Change in Capital Founding - 1914 -.23 -.05 .0295* (.02) (.006) (.0166) Reserve 1914 241.11 161.14 79.98* (32.96) (23.19) (39.12) Capital Payments 1914 731.92 513.84 218.08** (77.23) (49.84) (88.12) Other Capital 1914 138.829 269.50 -130.67 (27.20) (95.47) (113.69) Bonded Debt 1914 57.05 130.69 -73.64* (24.27) (22.52) (33.40) Value of Property 1914 1629.42 1858.33 -228.91 (129.72) (138.17) (195.75) Total Balance 1914 4549.57 3803.18 725.28* (342.04) (266.41) (426.98) Profit or Loss 1914 215.65 197.66 17.99 (25.15) (17.69) (29.84) Credit 1914 1206.73 795.93 410.81*** (87.58) (82.77) (122.27) *** p<.001, ** p<.01, * p<.05. These figures refer only to corporations that appear in the Sbornik (founding share capital is from Owen 1992b). Results are from a two-sample t test assuming equal variances. Standard errors are in parentheses. Tests for “Difference” (= mean (not aktsiia) - mean (aktsiia)) are one-sided. For the sake of this table, a “Corporation” is a firm that uses the world “aktsiia” to denote “share,” a “Share Partnership” is a firm that uses the word “pai” for “share,” and 1914 refers to the 1913-14 accounting year.

Table A5: Summary Statistics for Corporate Financial Data (Including Zero Values) Panel A: Initial Corporate Capitalizations, 1900 – 1914
Variable N Mean Std. Dev Median Min Max Share Capital 2,204 1,400.26 3,680.45 500 1 90,000 Number of Shares 2,150 5,946.33 15,219.10 2,000 30 300,000 Par Share Price 2,159 584.50 1,066.58 250 40 15,000
Panel B: Information on Corporations Included in Sbornik
Variable N Mean Std. Dev Median Min Max At Founding (from RUSCORP)
Share Capital 1,889 1,169.83 1,778.70 600 10 25,000 Number of Shares 1,886 4,237.03 11,538.81 1188 0 250,000 Par Share Price 1,889 1,094.68 1910.30 500 0 25,000
In 1914 (from Sbornik) Share Capital 1,888 1,736.32 3,138.91 800 0 50,000 Capital Reserves 1,889 195.05 841.06 8 0 18,000 Amortization 1,889 606.31 1,895.32 44 0 23,452 Other Capital 1,889 214.09 2,442.24 0 0 87,709 Bonded Debt 1,889 99.46 720.34 0 0 16,339 Value of Property 1,889 1761.26 4,205 495 0 62,134 Profit or Loss 1,889 205.29 640.93 33 -750 13,373 Credit 1,888 970.22 2,632.97 205.5 0 66,500 Total Balance 1,889 4,110.72 9,175.70 1385 0 178,236 Dividend % 1,487 5.16 6.02 5 0 56
Sbornik Variables, Scaled Share Capital / Total Balance 1,427 .46 .61 .40 0 21.43 Capital Reserves / Total Balance 1,428 .029 .038 .015 0 .27 Bonded Debt / Total Balance 1,428 .011 .053 0 0 .88 Credit / Total Balance 1,428 .24 .21 .19 0 2.88 Div. Amt. per Share / Share Price 1,478 .0052 .0079 .004 0 .16 Bonded Debt / Total Liabilities 1,881 .0087 .041 0 0 .49 Credit / Total Liabilities 1,881 .20 .22 .15 0 1.02 Source: Owen (1992b) and Sbornik. Share capital and par share price are standardized according to Owen's (1992a) method. Share capital is reported in thousands of rubles. Div. Amt. per Share / Share Price is the dividend as a percentage of total capital times total capital dividend by the company's number of shares in 1914 divided by the company's (Owen standardized) share price in 1914. Summary statistics for non-zero values only are reported in Table 4. Total liabilities denotes the total of the passive columns: share capital, capital reserves, other capital, capital payments, profits, creditors, and bonded debt.
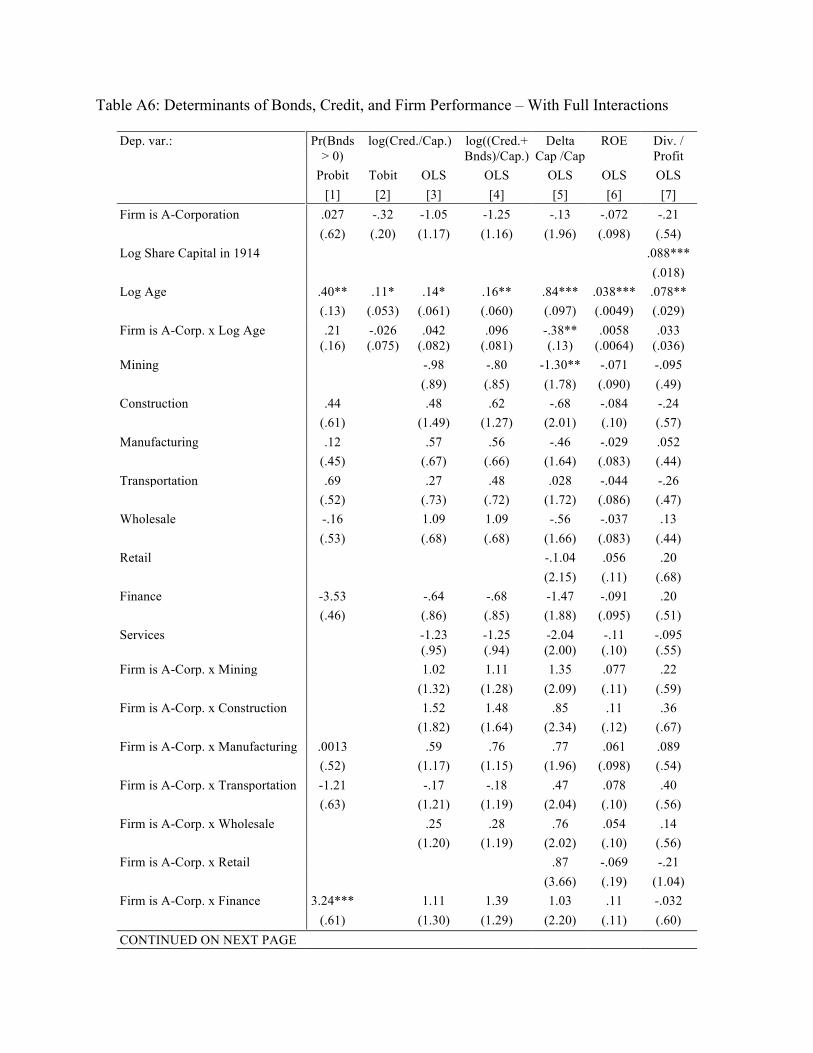
Table A6: Determinants of Bonds, Credit, and Firm Performance – With Full Interactions
Dep. var.: Pr(Bnds > 0)
log(Cred./Cap.) log((Cred.+ Bnds)/Cap.)
Delta Cap /Cap
ROE Div. / Profit
Probit Tobit OLS OLS OLS OLS OLS [1] [2] [3] [4] [5] [6] [7] Firm is A-Corporation .027 -.32 -1.05 -1.25 -.13 -.072 -.21 (.62) (.20) (1.17) (1.16) (1.96) (.098) (.54) Log Share Capital in 1914 .088*** (.018) Log Age .40** .11* .14* .16** .84*** .038*** .078** (.13) (.053) (.061) (.060) (.097) (.0049) (.029) Firm is A-Corp. x Log Age
.21 (.16)
-.026 (.075)
.042 (.082)
.096 (.081)
-.38** (.13)
.0058 (.0064)
.033 (.036)
Mining -.98 -.80 -1.30** -.071 -.095 (.89) (.85) (1.78) (.090) (.49) Construction .44 .48 .62 -.68 -.084 -.24 (.61) (1.49) (1.27) (2.01) (.10) (.57) Manufacturing .12 .57 .56 -.46 -.029 .052 (.45) (.67) (.66) (1.64) (.083) (.44) Transportation .69 .27 .48 .028 -.044 -.26 (.52) (.73) (.72) (1.72) (.086) (.47) Wholesale -.16 1.09 1.09 -.56 -.037 .13 (.53) (.68) (.68) (1.66) (.083) (.44) Retail -.1.04 .056 .20 (2.15) (.11) (.68) Finance -3.53 -.64 -.68 -1.47 -.091 .20 (.46) (.86) (.85) (1.88) (.095) (.51) Services
-1.23 (.95)
-1.25 (.94)
-2.04 (2.00)
-.11 (.10)
-.095 (.55)
Firm is A-Corp. x Mining 1.02 1.11 1.35 .077 .22 (1.32) (1.28) (2.09) (.11) (.59) Firm is A-Corp. x Construction 1.52 1.48 .85 .11 .36 (1.82) (1.64) (2.34) (.12) (.67) Firm is A-Corp. x Manufacturing .0013 .59 .76 .77 .061 .089 (.52) (1.17) (1.15) (1.96) (.098) (.54) Firm is A-Corp. x Transportation -1.21 -.17 -.18 .47 .078 .40 (.63) (1.21) (1.19) (2.04) (.10) (.56) Firm is A-Corp. x Wholesale .25 .28 .76 .054 .14 (1.20) (1.19) (2.02) (.10) (.56) Firm is A-Corp. x Retail .87 -.069 -.21 (3.66) (.19) (1.04) Firm is A-Corp. x Finance 3.24*** 1.11 1.39 1.03 .11 -.032 (.61) (1.30) (1.29) (2.20) (.11) (.60) CONTINUED ON NEXT PAGE
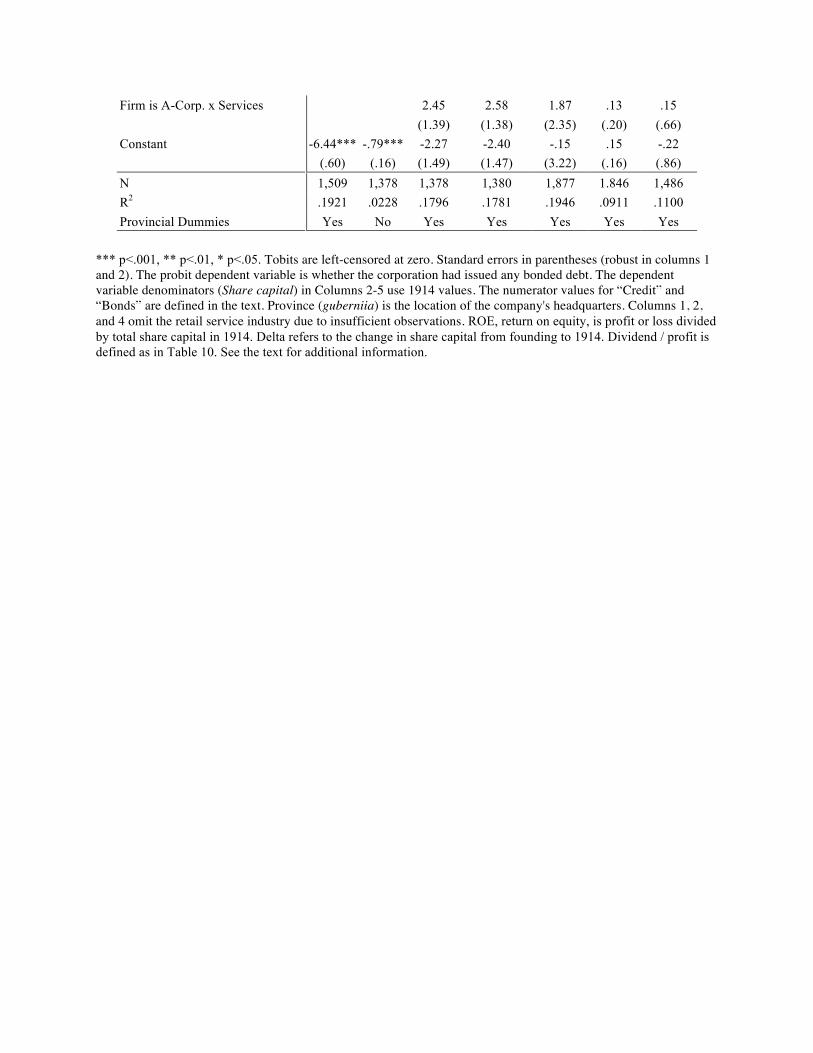
Firm is A-Corp. x Services 2.45 2.58 1.87 .13 .15 (1.39) (1.38) (2.35) (.20) (.66) Constant -6.44*** -.79*** -2.27 -2.40 -.15 .15 -.22 (.60) (.16) (1.49) (1.47) (3.22) (.16) (.86) N 1,509 1,378 1,378 1,380 1,877 1.846 1,486 R2 .1921 .0228 .1796 .1781 .1946 .0911 .1100 Provincial Dummies Yes No Yes Yes Yes Yes Yes
*** p<.001, ** p<.01, * p<.05. Tobits are left-censored at zero. Standard errors in parentheses (robust in columns 1 and 2). The probit dependent variable is whether the corporation had issued any bonded debt. The dependent variable denominators (Share capital) in Columns 2-5 use 1914 values. The numerator values for “Credit” and “Bonds” are defined in the text. Province (guberniia) is the location of the company's headquarters. Columns 1, 2, and 4 omit the retail service industry due to insufficient observations. ROE, return on equity, is profit or loss divided by total share capital in 1914. Delta refers to the change in share capital from founding to 1914. Dividend / profit is defined as in Table 10. See the text for additional information.